
2022-10-28
Informational purposes only. The content in this report, including allocations, analysis, and commentary, is provided solely for informational and educational purposes. It does not constitute financial advice, investment advice, trading advice, or any other type of advice. Past performance does not guarantee future results. Always conduct your own research and consult a qualified financial professional before making investment decisions.
GLD defensive overlay excluded: price is below its 8W SMA. Cause selector will use cash alternative.
Macro risk engine requires the 50% Defensive overlay for this run; payload selected by cause: Inflation Scarcity.
Weekly Allocation
| Ticker | Category | Weight | Role |
|---|---|---|---|
| XLE | Traditional Energy | 60% | Overlay |
| ITA | Defense & Aerospace | 10% | Top-2 (10%) |
| MOO | Agriculture & Livestock | 5% | Tier-2 (5%) |
| COPX | Industrial Metals | 5% | Tier-2 (5%) |
| PAVE | Utilities & Infrastructure | 5% | Tier-2 (5%) |
| URNM | Nuclear Energy | 5% | Tier-2 (5%) |
| GLD | Precious Metals | 5% | Tier-2 (5%) |
| XLK | Technology | 5% | Tier-2 (5%) |
Trade Instructions — Monday Open
Sell the tranche from 2022-09-30 (completing its 4-week hold). Buy the new tranche. Instructions show net portfolio changes — same-asset positions cancel, weight changes show the delta.
| Action | Ticker | Instruction |
|---|---|---|
| SELL | SGOV | Sell entire SGOV position (5.00% of portfolio) |
| SELL | GLD | Sell 33% of GLD position (reduce 11.25% → 7.50%) |
| SELL | XLU | Sell entire XLU position (3.75% of portfolio) |
| SELL | URA | Sell 67% of URA position (reduce 3.75% → 1.25%) |
| SELL | WEAT | Sell 33% of WEAT position (reduce 3.75% → 2.50%) |
| SELL | CIBR | Sell 33% of CIBR position (reduce 3.75% → 2.50%) |
| BUY | XLE | Buy XLE — 71.43% of freed cash (adds 12.50% to portfolio) |
| BUY | ITA | Buy ITA — 7.14% of freed cash (adds 1.25% to portfolio) |
| BUY | URNM | Buy URNM — 7.14% of freed cash (adds 1.25% to portfolio) |
| BUY | MOO | Buy MOO — 7.14% of freed cash (adds 1.25% to portfolio) |
| BUY | XLK | Buy XLK — 7.14% of freed cash (adds 1.25% to portfolio) |
Current Portfolio After Trade
Combined holdings across all 4 active tranches. Each tranche is 25% of the portfolio.
| Ticker | % of Portfolio | Weight Bar |
|---|---|---|
| XLE | 60.00% | |
| GLD | 7.50% | |
| ITA | 6.25% | |
| PAVE | 5.00% | |
| COPX | 3.75% | |
| URNM | 3.75% | |
| WEAT | 2.50% | |
| CIBR | 2.50% | |
| PICK | 2.50% | |
| MOO | 2.50% | |
| URA | 1.25% | |
| INDA | 1.25% | |
| XLK | 1.25% |
Macro Regime — Late-Cycle Reflation
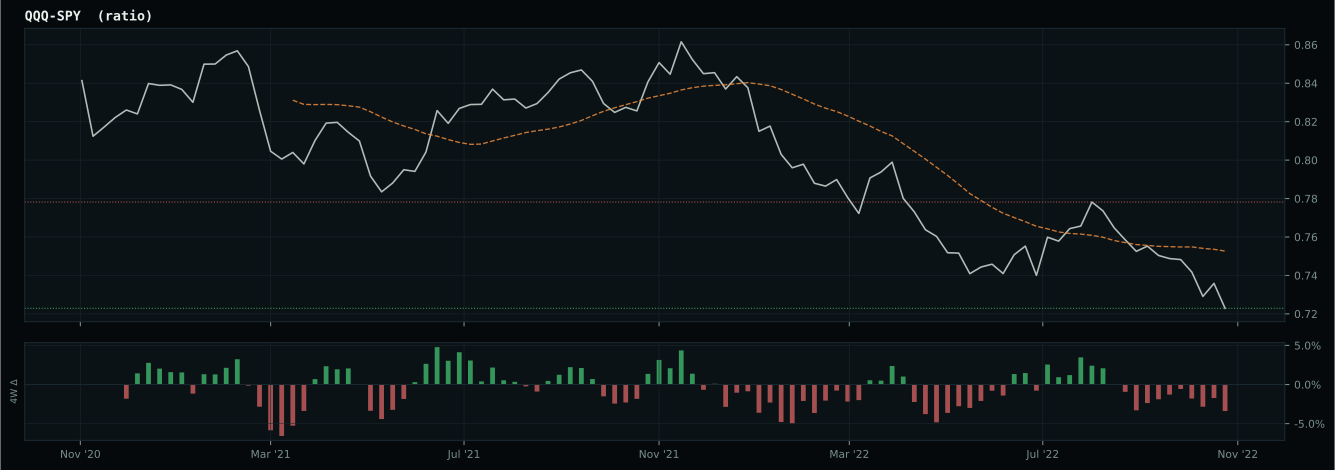
growth data is not confirming the weak market-implied risk appetite signal
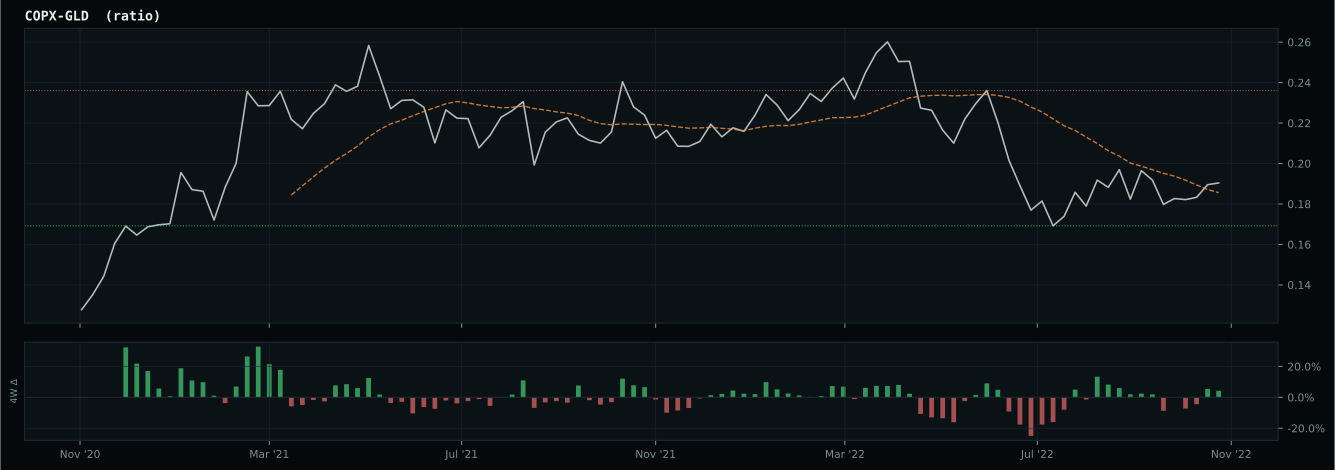
Defensive overlay cause is inflation/scarcity: energy, commodity breadth, or oil-versus-gold confirmation is stronger than the broad equity tape, so the sleeve owns the inflation pressure. XLE has been confirmed above its 8W SMA and is eligible.
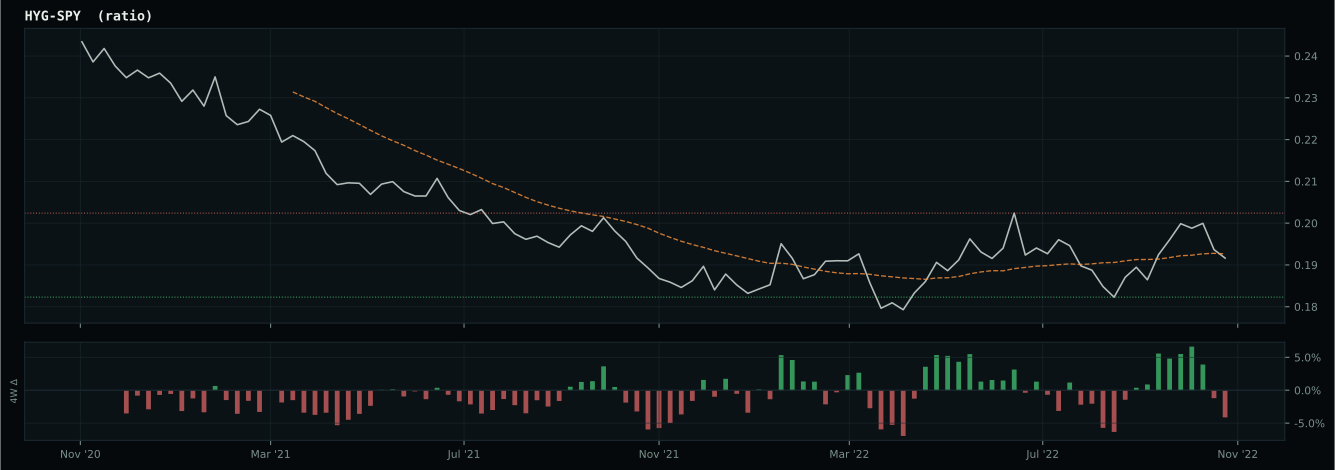
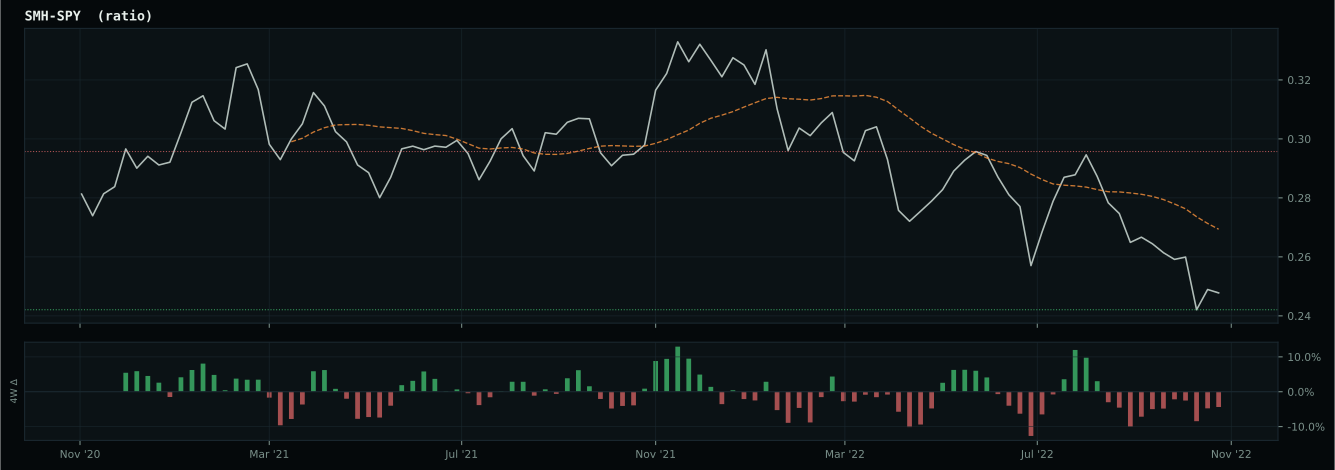
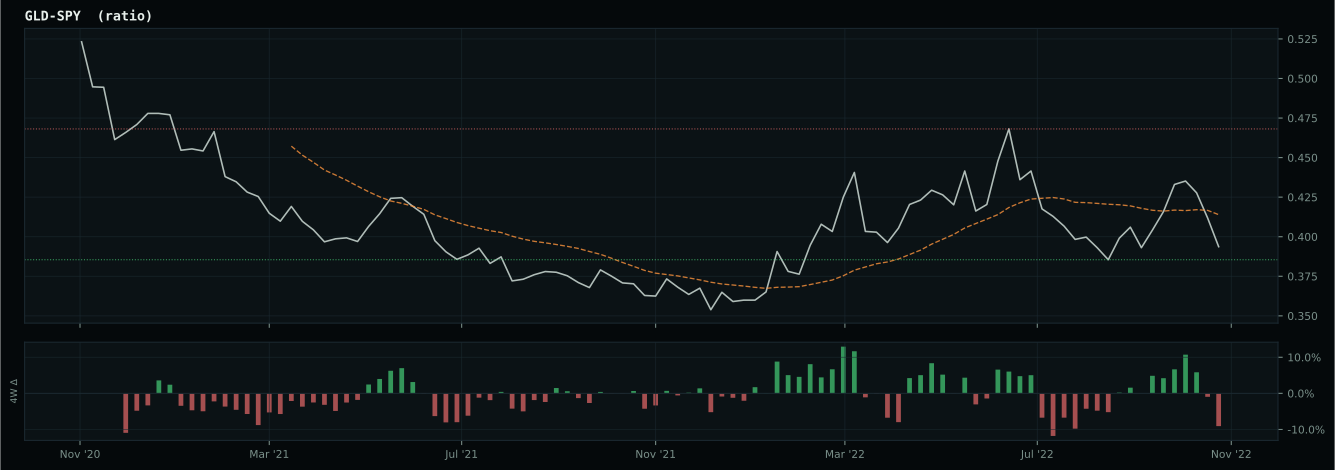
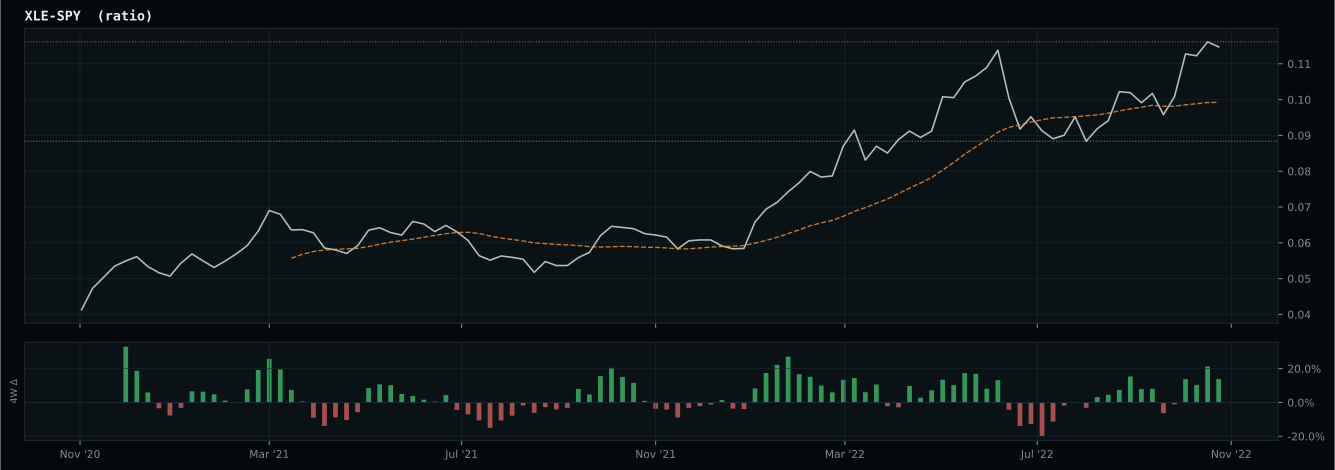
Macro Evidence Charts
Market-implied signals behind the macro regime scores. Each ratio compares two assets; the direction and slope of the ratio is what the macro engine reads.
Crypto Regime — NoCrypto
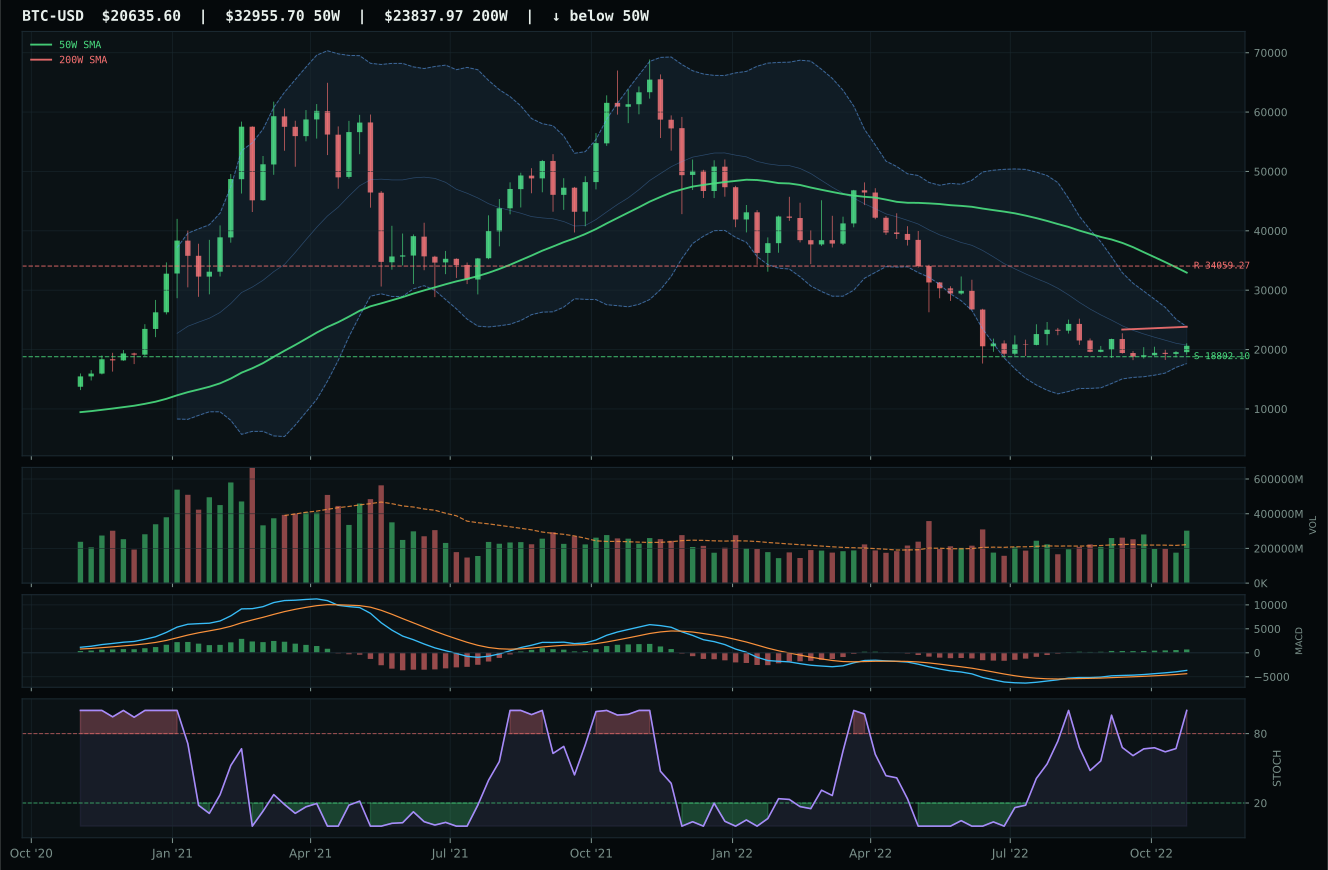
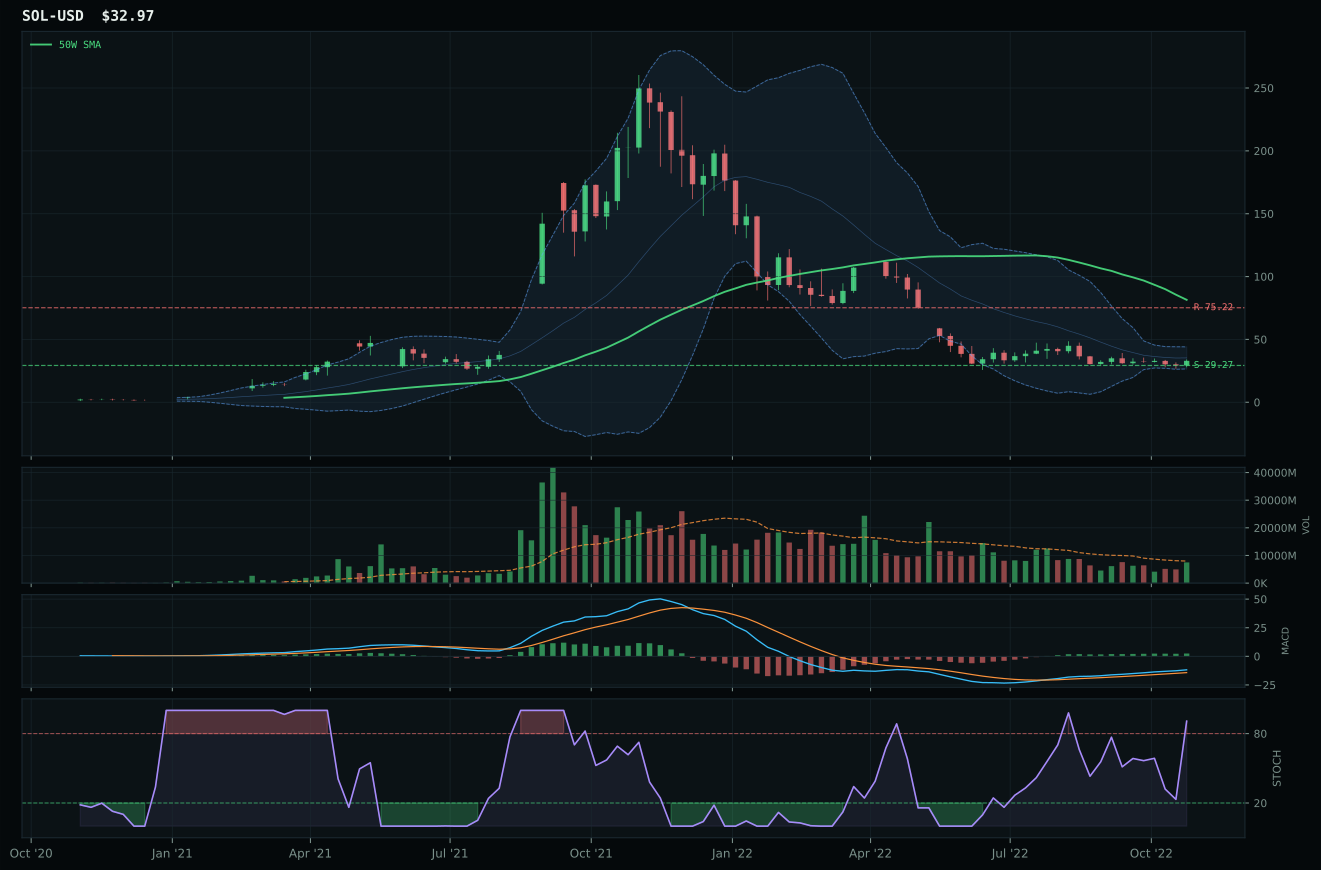
ValueBTC armed; waiting for 50W reclaim, decisive close above post-touch range resistance by 3%, close above 200W
TrendBTC not confirmed
one or more available conditions failed
Category Rankings
| Rank | Category | Winner | Score | Alloc | 4W Ret | Peers (4W) |
|---|---|---|---|---|---|---|
| 1 | Traditional Energy | XLE | 84.5 | 20% | +1.41% | FCG -0.8% · XOP +1.2% |
| 2 | Defense & Aerospace | ITA | 61.8 | 20% | +3.49% | XAR +3.5% · ROKT +3.7% |
| 3 | Agriculture & Livestock | MOO | 58.0 | 10% | +4.00% | VEGI +4.4% · WEAT -10.6% |
| 4 | Industrial Metals | COPX | 55.5 | 10% | +19.76% | PICK +17.5% · REMX +3.6% |
| 5 | Utilities & Infrastructure | PAVE | 45.6 | 10% | +6.93% | IGF +7.7% · XLU +4.8% |
| 6 | Nuclear Energy | URNM | 44.0 | 10% | -4.05% | URA +1.3% · NLR +4.1% |
| 7 | Precious Metals | GLD | 41.8 | 10% | +7.08% | SLV +12.6% · GDX +16.3% |
| 8 | Technology | XLK | 34.1 | 10% | +2.96% | CIBR -2.1% · IGV -0.5% |
| 9 | AI | SMH | 10.5 | 0% | +14.27% | AIQ +5.4% · BOTZ +8.1% |
| 10 | Emerging Markets | INDA | 5.0 | 0% | +3.02% | ILF -0.5% · IEMG +10.4% |
Traditional Energy — XLE
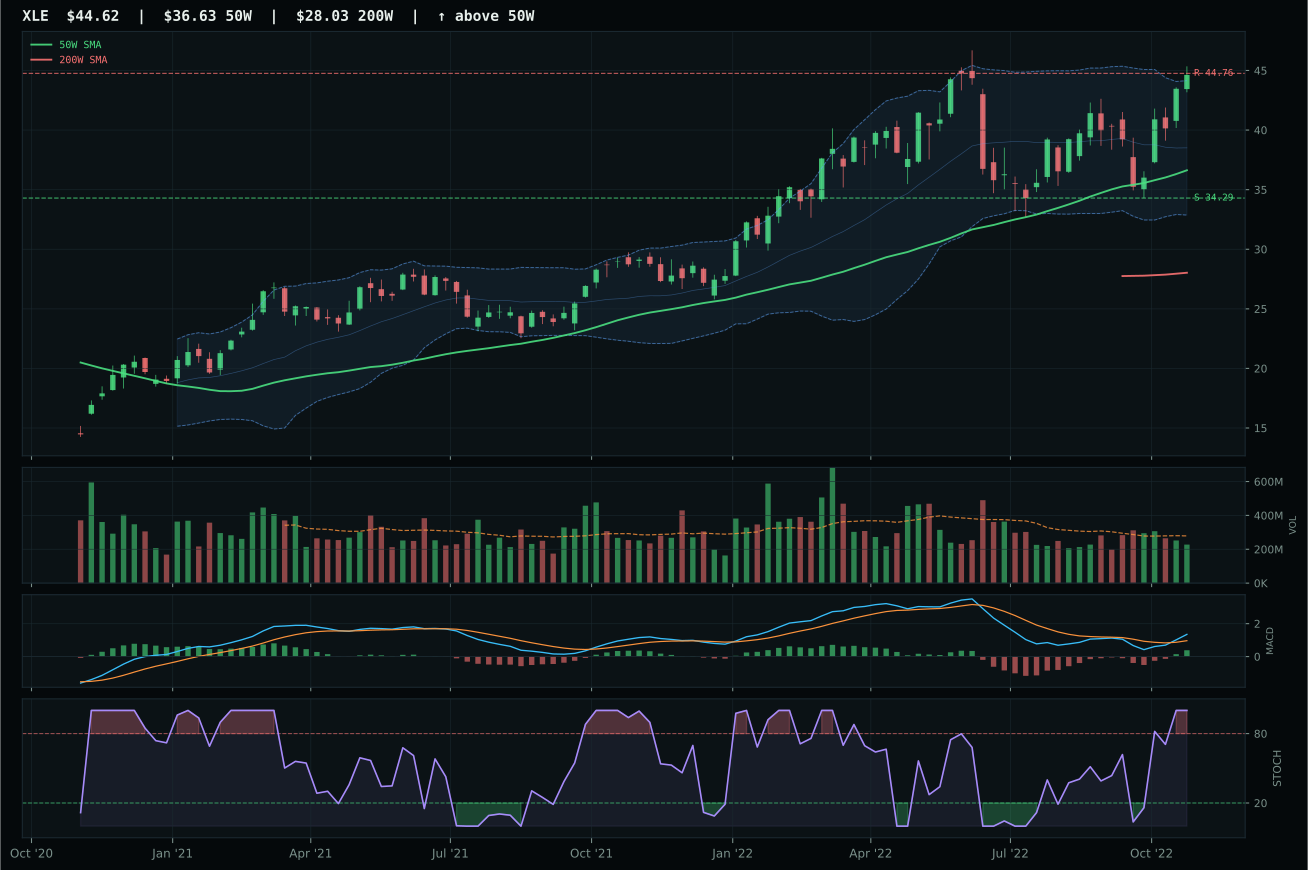
XLE has a vertical extension profile with 19.4% 13-week relative strength versus SPY.
A failed hold above support would weaken the setup.
Actionable but governed by invalidation levels.
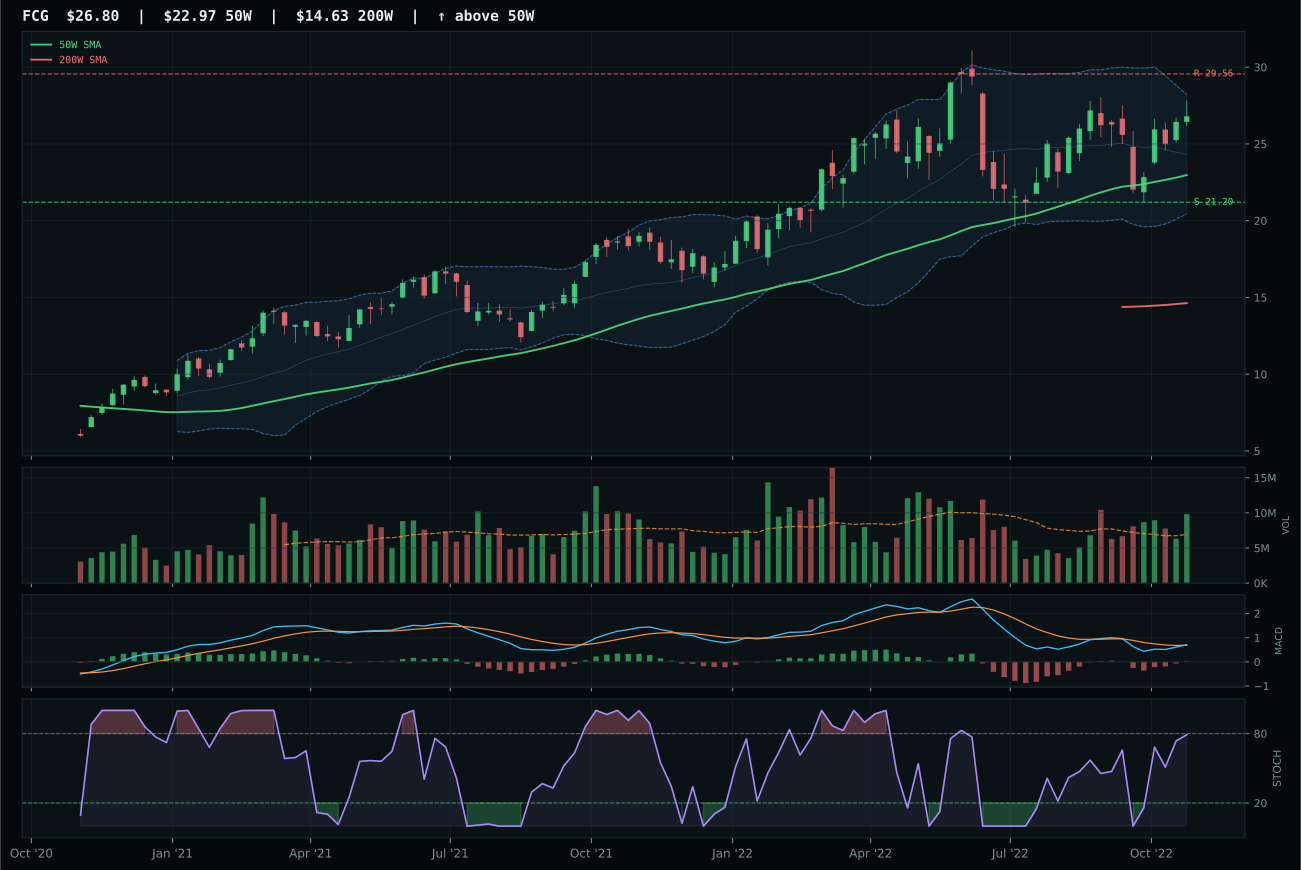
FCG has a vertical extension profile with 12.7% 13-week relative strength versus SPY.
A failed hold above support would weaken the setup.
Actionable but governed by invalidation levels.
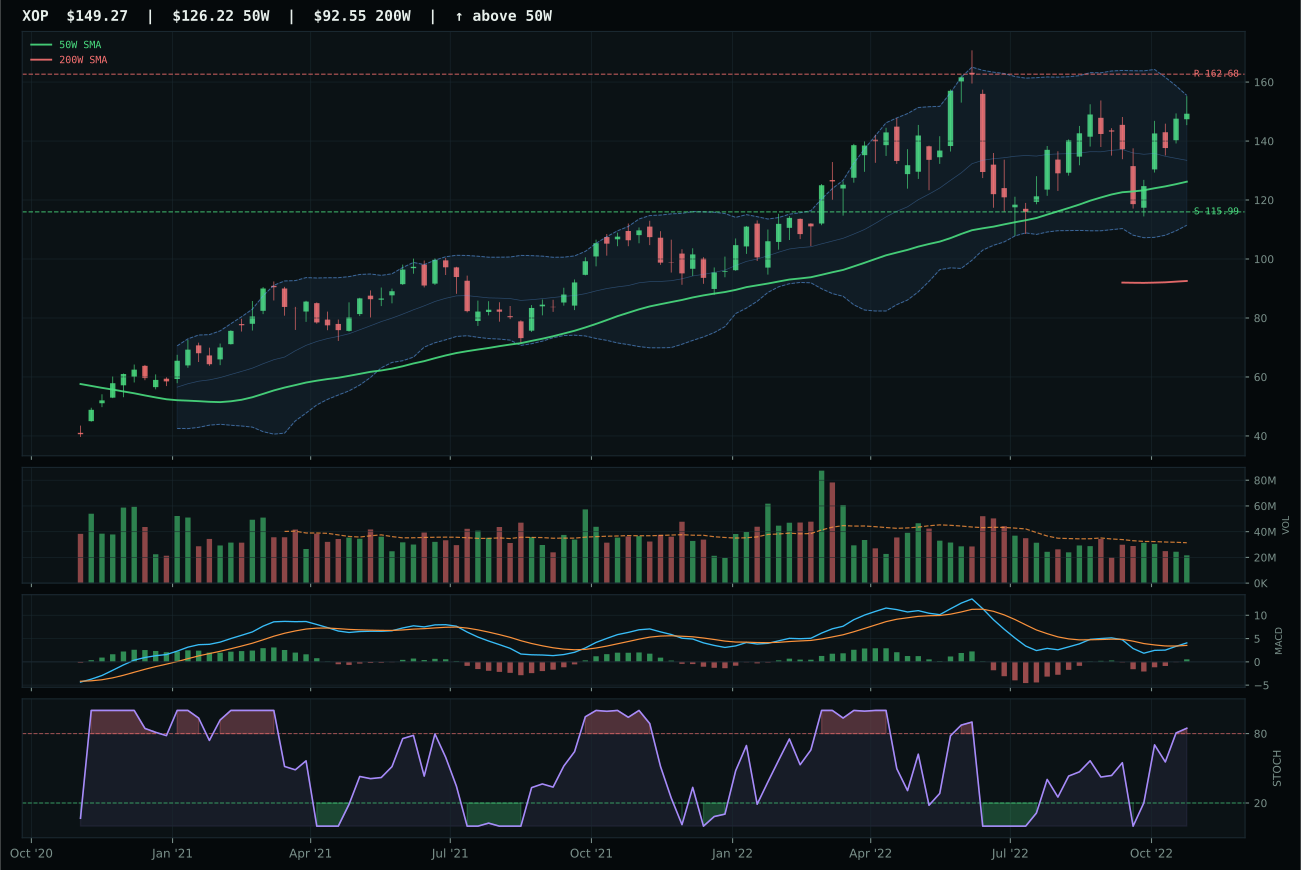
XOP has a vertical extension profile with 14.5% 13-week relative strength versus SPY.
A failed hold above support would weaken the setup.
Actionable but governed by invalidation levels.
XLE earned the top-2 slot with 84.5 category score because it posted perfect trend (100.0) and momentum confirmation (100.0) despite posting the worst timing score (37.0) in the category—a paradox that reveals exactly how late-cycle reflation is rewarding extended leaders. Price is 21.8% above the 50W, near 52W highs, with stochastic RSI at 1.00 overbought and MACD bullish and improving. FCG shows superior technical evidence (89.7 vs 75.1) and better structure cleanliness (all three energy ETFs show identical trend at 100.0), but XLE's 19.4% RS versus SPY versus FCG's 12.7% reflects the market's preference for integrated cash-flow defense over pure natural-gas beta in a regime where energy scarcity is active (+14) and inflation pressure is active (+10). Volume-price confirmation is 73.6 for XLE, meaning the 21.8% extension is being accumulated, not distributed—institutional conviction that the move continues despite technical extension. The 10% allocation slot to XLE is the portfolio's largest bet, not because timing is pretty (it isn't), but because trend, momentum, relative strength, and macro align without contradiction.
Traditional Energy commanded 60% as the top-ranked category because category macro fit (88.0) and energy scarcity (+16) active descriptor are creating a regime where commodity cash-flow plays are explicitly favored over growth. Late-Cycle Reflation helps this exposure (+12), inflation pressure is active (+10), real asset sponsorship is active (+7)—only liquidity stress (-7) poses friction, and it's being overwhelmed by the other three tailwinds. XLE's 13W return of 13.8% and RS versus SPY of 19.4% reflect institutional rotation into sectors that benefit from supply constraint and pricing power; this isn't mean reversion, it's regime change. The 37.0 timing score (worst in category) is not a contradiction; it's proof that the move is accepted and late buyers are still accumulating because the macro case is that strong. Allocation here is conviction based on macro regime alignment, not technical purity. For this to compress, either energy scarcity would need to ease sharply or the broad market bear would need to inflict enough damage to force de-risking; neither is in the forecast.
Defense & Aerospace — ITA
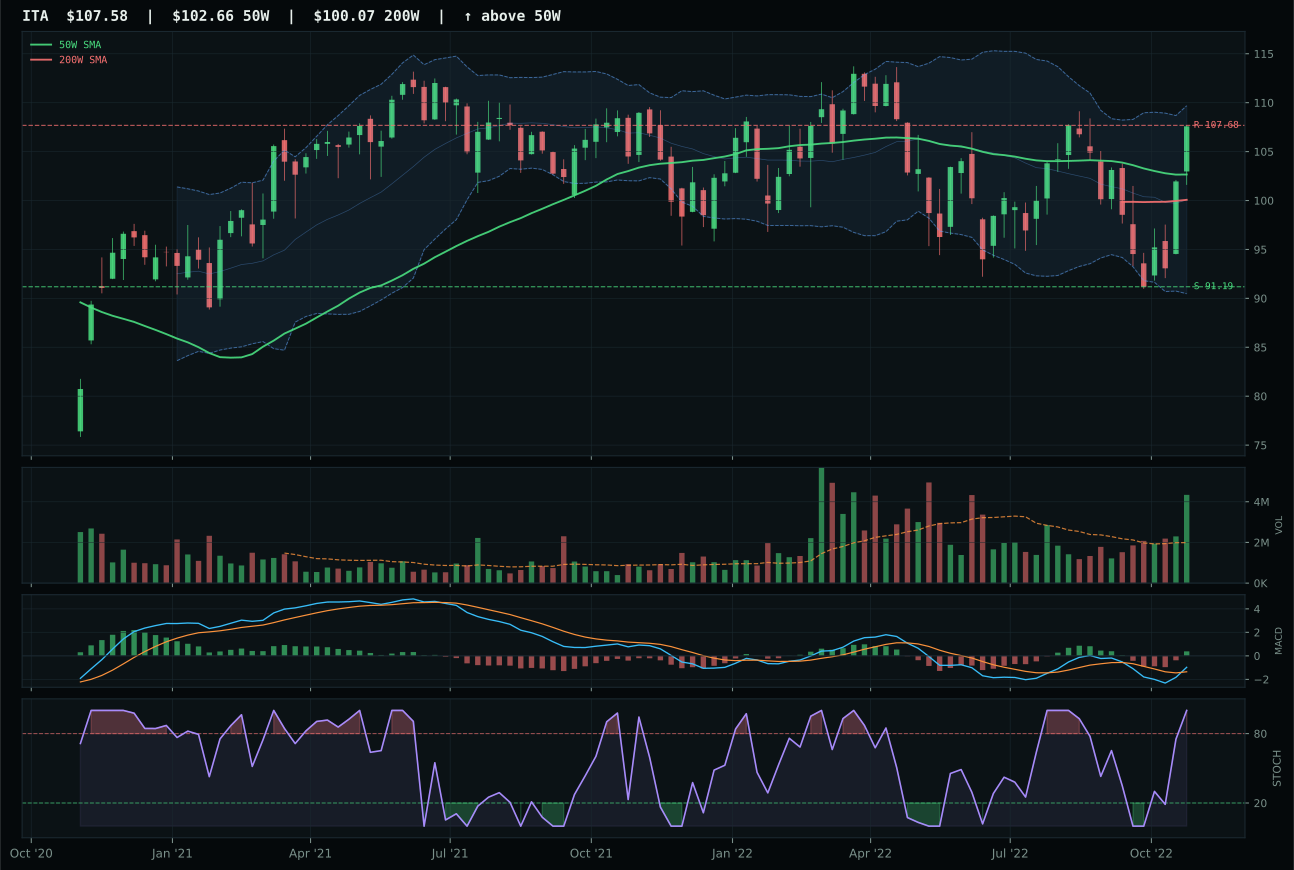
ITA has a neutral structure profile with 9.2% 13-week relative strength versus SPY.
A failed hold above support would weaken the setup.
Actionable but governed by invalidation levels.
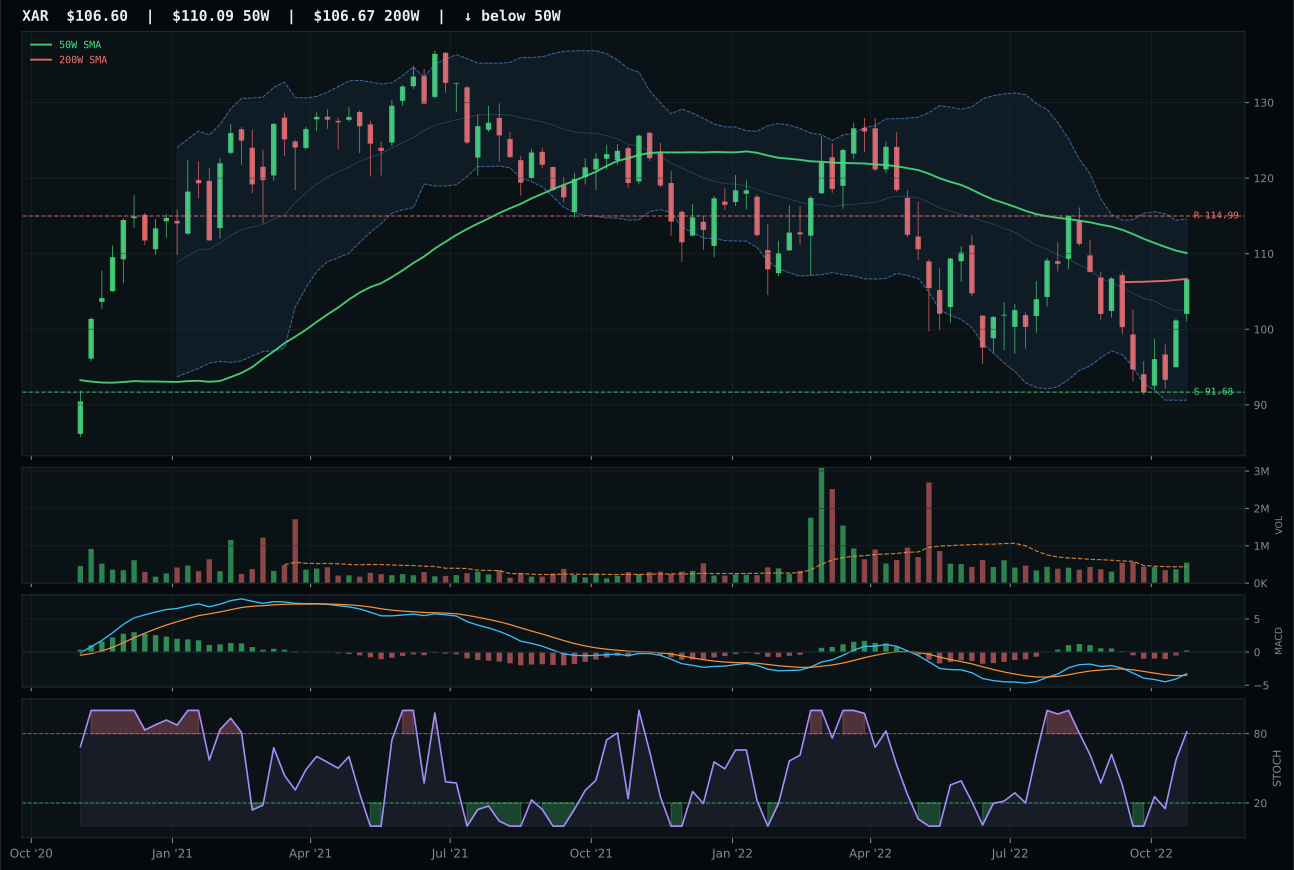
XAR has a neutral structure profile with 3.3% 13-week relative strength versus SPY.
A failed hold above support would weaken the setup.
Actionable but governed by invalidation levels.
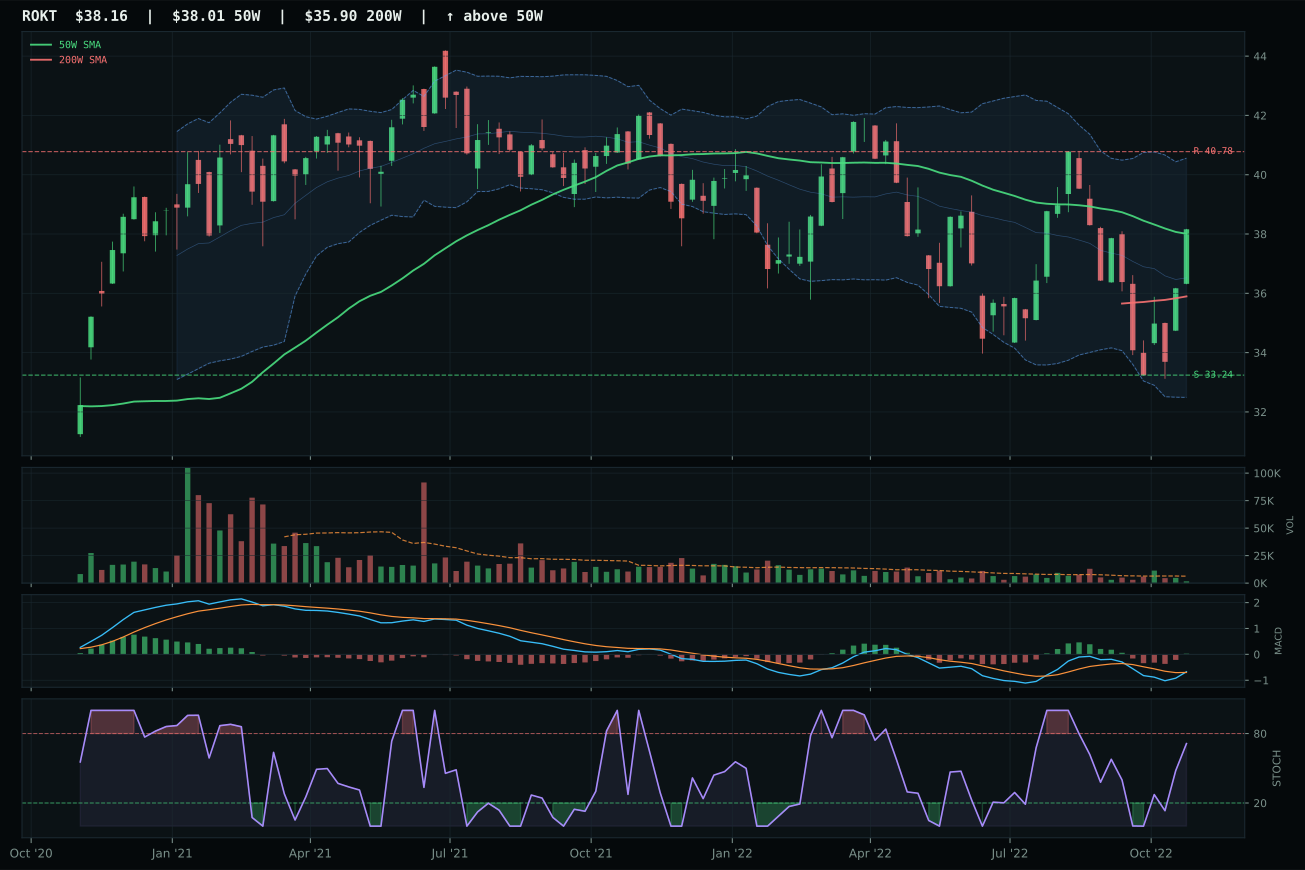
ROKT has a compression near 50W profile with 4.0% 13-week relative strength versus SPY.
A failed hold above support would weaken the setup.
Tracked, but not top-2 eligible because: .
ITA earned the top-2 slot with a 61.8 category score by posting perfect trend (100.0) and momentum confirmation (100.0) scores—price above both moving averages, 50W slope at 0% not deteriorating, and 13W return of 3.6% with RS versus SPY at +9.2%. Volume is accumulation-level confirmation at 2.18x the 20W average, which in late-cycle reflation with defensive rotation active (+8) and broad market bear active (+6) signals institutional cash rotating into durability, not retail momentum chasing. The setup sits at Fib 0.236, upper retracement zone, with overbought stochastic RSI at 1.00 and MACD bullish and improving—textbook institutional bid where resistance at 107.68 is only 0.1% above price. XAR trailed by 25.6 points because it showed weaker relative strength (3.3% vs 9.2%), thinner volume (above-average vs accumulation), and cleaner but less powerful structure (69.9 vs 74.5).
Defense & Aerospace commanded 20% as a top-2 slot because it is the only category where macro regime, active descriptors, and technical evidence are aligned without contradiction. Late-Cycle Reflation helps this exposure (+6), defensive rotation is active (+8), broad market bear is active (+6)—three major tailwinds. ITA's 100.0 trend score means there is no timing debate; the move is already accepted and institutional buyers are accumulating on volume. The 50.1 risk-reward score is the only soft spot (upside to resistance is nearly zero, downside to support is 18%), but that's not a flaw in late-cycle deflation trades; it's the cost of being right early and then following the rotation. Allocation here is conviction: the category macro fit is 70.0/100, the representative is dominant, and the volume-price confirmation at 95.2 means this isn't a false breakout.
Agriculture & Livestock — MOO
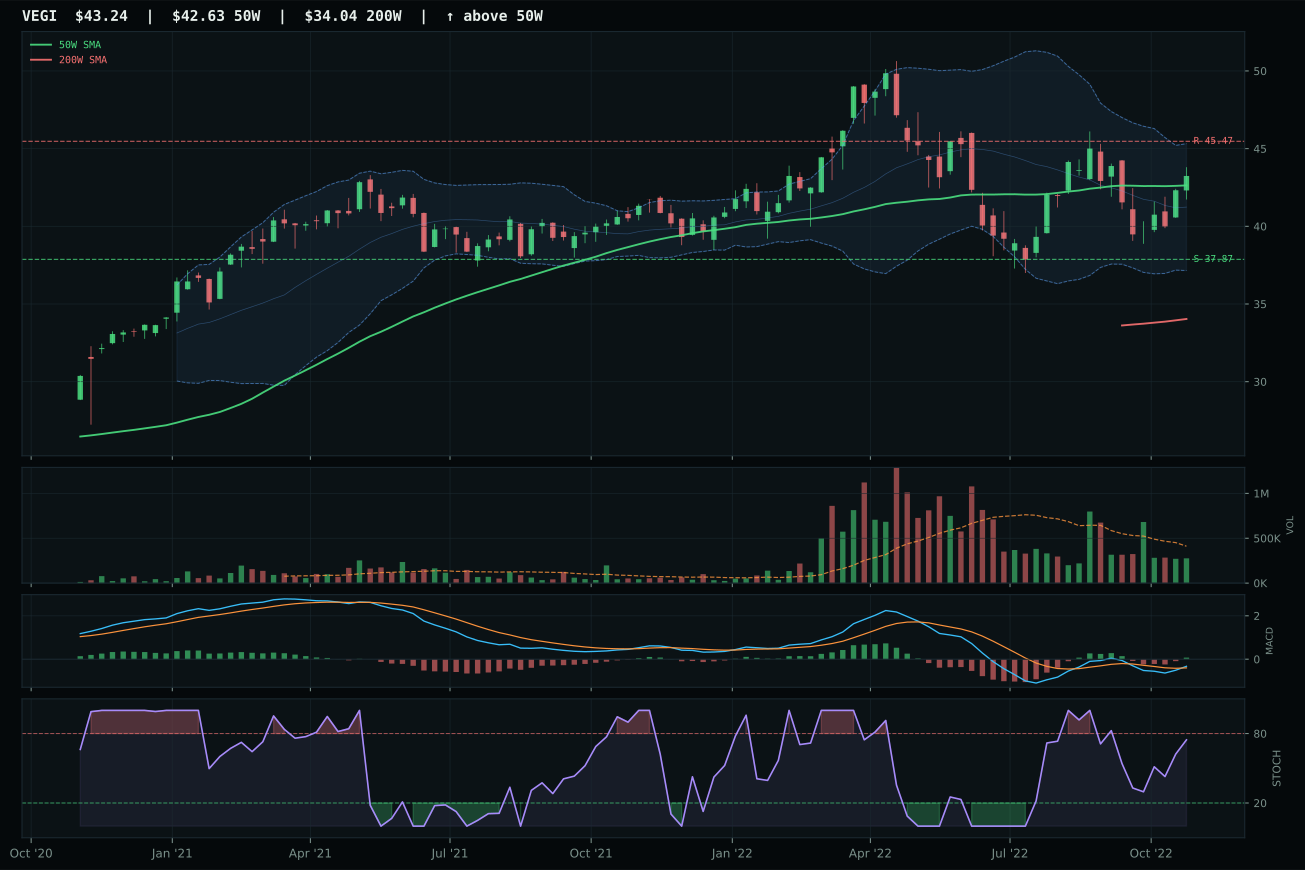
VEGI has a compression near 50W profile with 8.5% 13-week relative strength versus SPY.
A failed hold above support would weaken the setup.
Actionable but governed by invalidation levels.
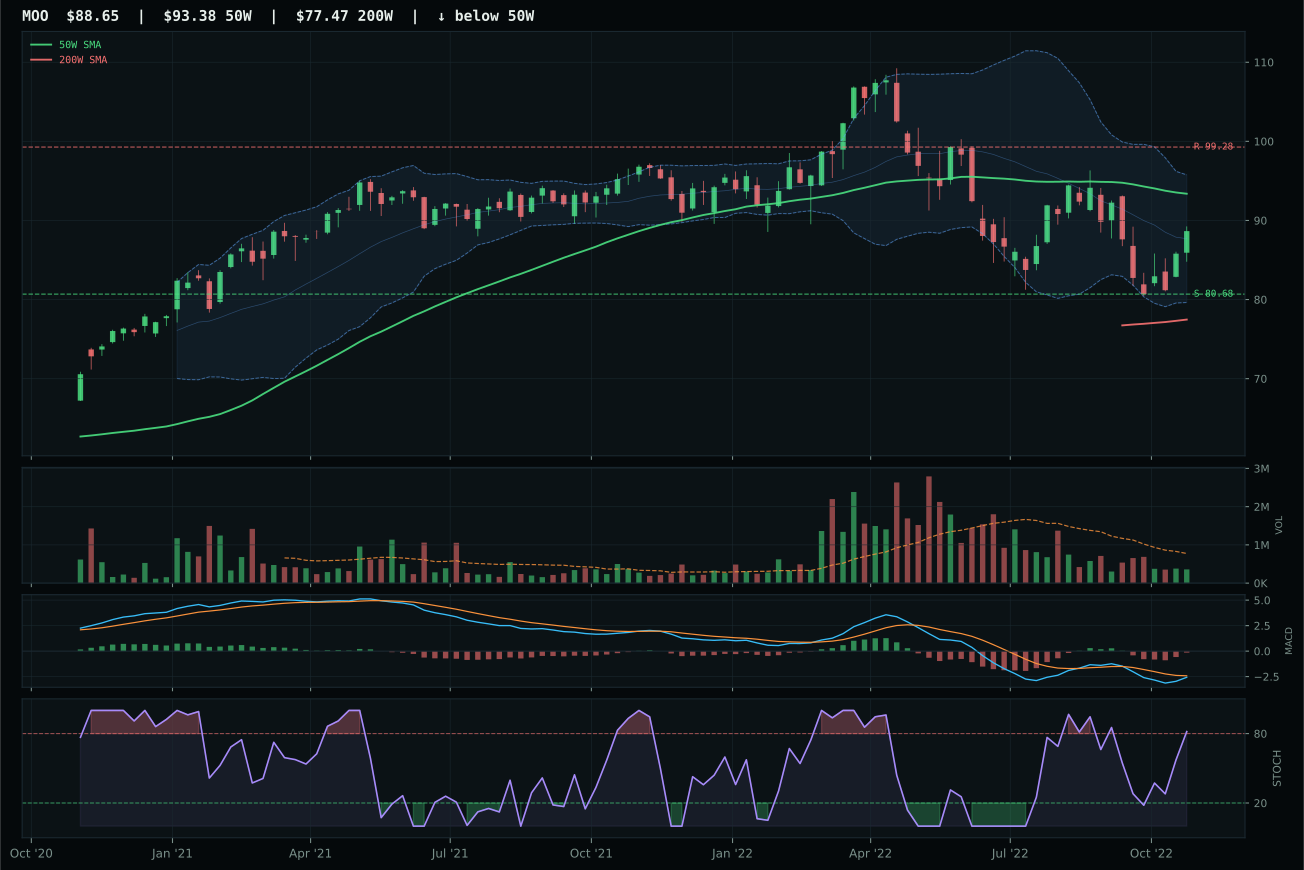
MOO has a neutral structure profile with 2.0% 13-week relative strength versus SPY.
A failed hold above support would weaken the setup.
Actionable but governed by invalidation levels.
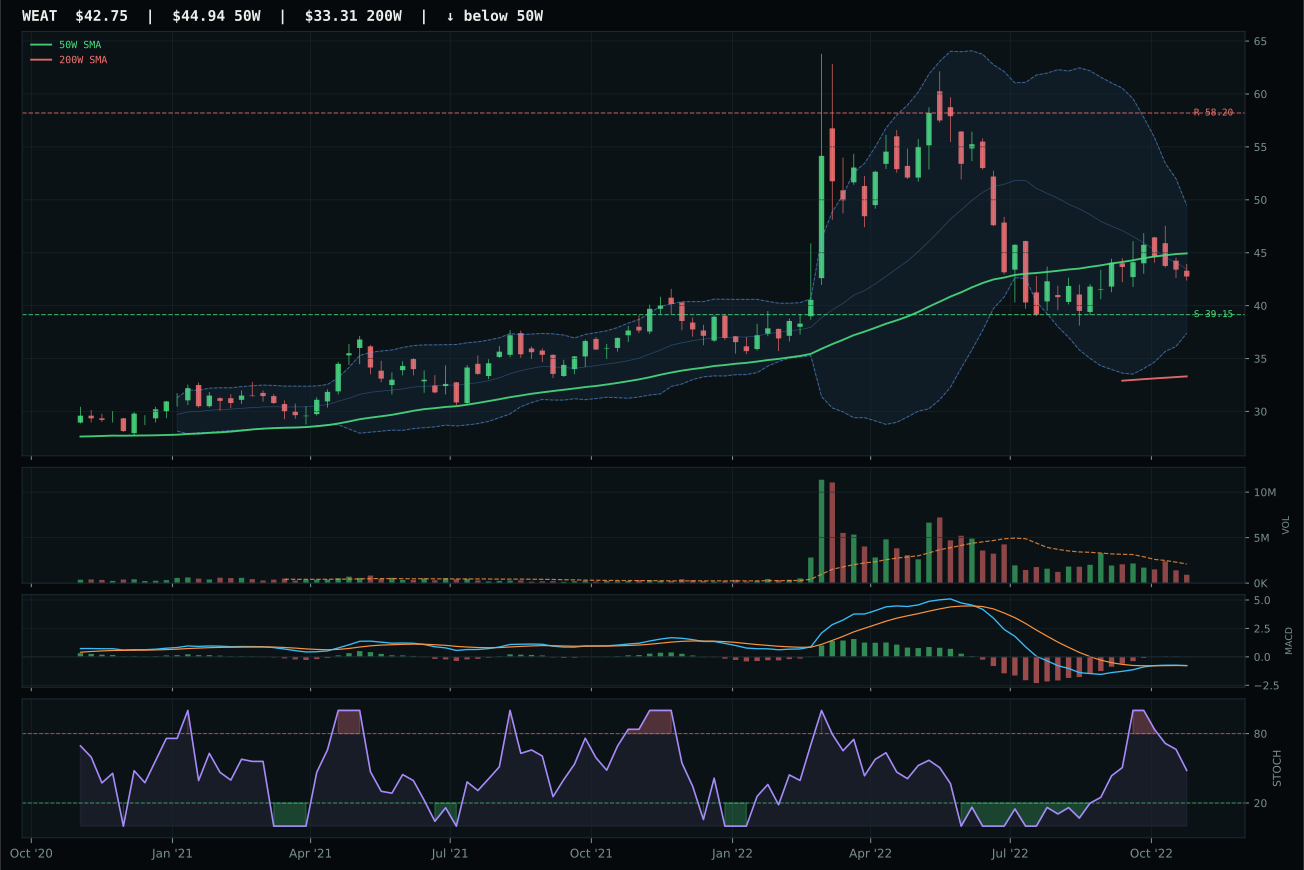
WEAT has a neutral structure profile with 6.6% 13-week relative strength versus SPY.
A failed hold above support would weaken the setup.
Actionable but governed by invalidation levels.
MOO won the category despite a much weaker composite score (57 vs VEGI's 95) because its risk-reward (72.5 vs 59.2) and timing (82.0 vs 100.0) setup aligned with the macro regime in a way VEGI's compression near the 50W did not. MOO is pullback into deep retracement value at -5.1% from the 50W with MACD bearish but improving and stochastic RSI overbought at 0.82—a setup that rewards waiting for support to hold rather than chasing a move already extended from compression. VEGI posted superior momentum (96 vs 58), better RS versus SPY (8.5% vs 2.0%), and a bullish-and-improving MACD, but all of that strength came with the ETF at only +1.4% distance from the 50W, meaning the structure is so tight there's no room for accumulation without extension. Inflation pressure is active (+7) and real asset sponsorship is active (+5), which MOO's agricultural commodity exposure captures better than VEGI's global producer breadth at current valuation.
Agriculture earned 5% allocation because the category macro fit (72.0) is strong—Late-Cycle Reflation helps (+8), inflation pressure active (+10), real asset sponsorship active (+8)—but MOO's technical evidence (28.0) is too weak to justify more. The reasoned ETF order puts VEGI at the top (78.9), WEAT second (64.8), and MOO third (39.9), signaling that global producer breadth and wheat-specific scarcity would be better bets on pure technicals. The allocator chose MOO because its setup (pullback into value, thin volume) aligns with the current macro where inflation is baked in but forward guidance is uncertain; VEGI at compression near 50W is a better trade if the regime sustains, but MOO's pullback offers defined entry with less timing risk. This is a 5% exploratory slot, not a conviction position; if VEGI breaks cleanly above compression on volume, the allocation would shift immediately.
Industrial Metals — COPX
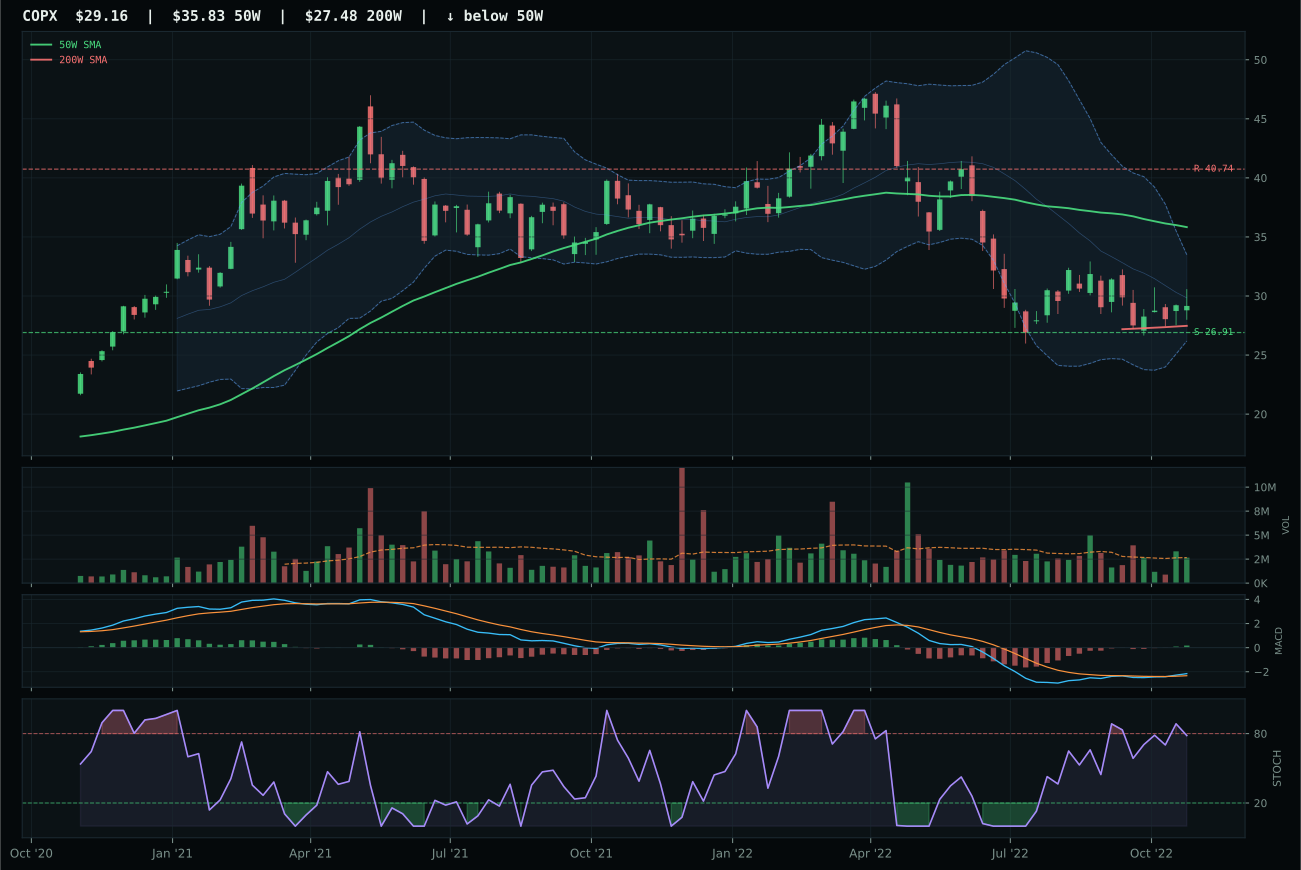
COPX has a neutral structure profile with 1.2% 13-week relative strength versus SPY.
A failed hold above support would weaken the setup.
Actionable but governed by invalidation levels.
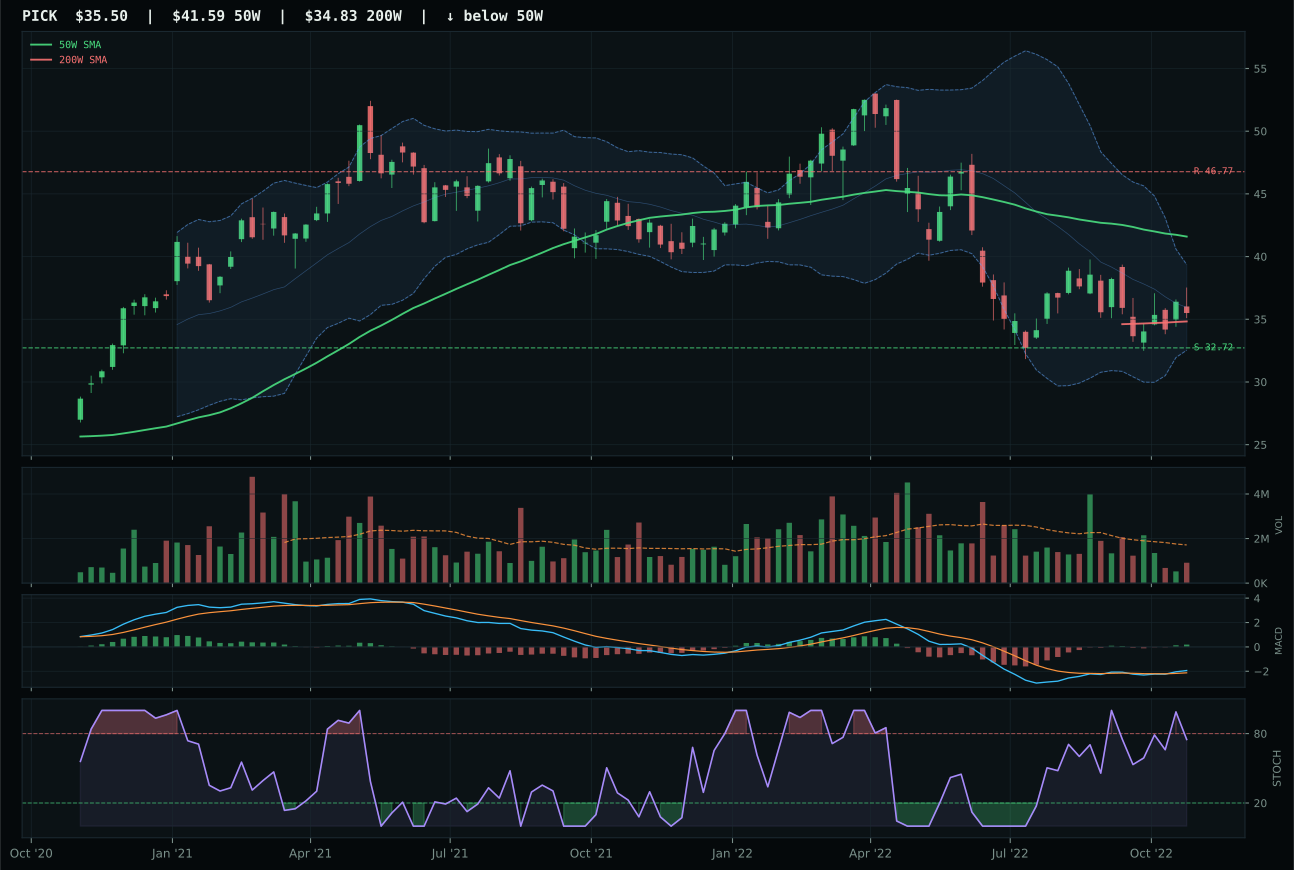
PICK has a neutral structure profile with 1.4% 13-week relative strength versus SPY.
A failed hold above support would weaken the setup.
Actionable but governed by invalidation levels.
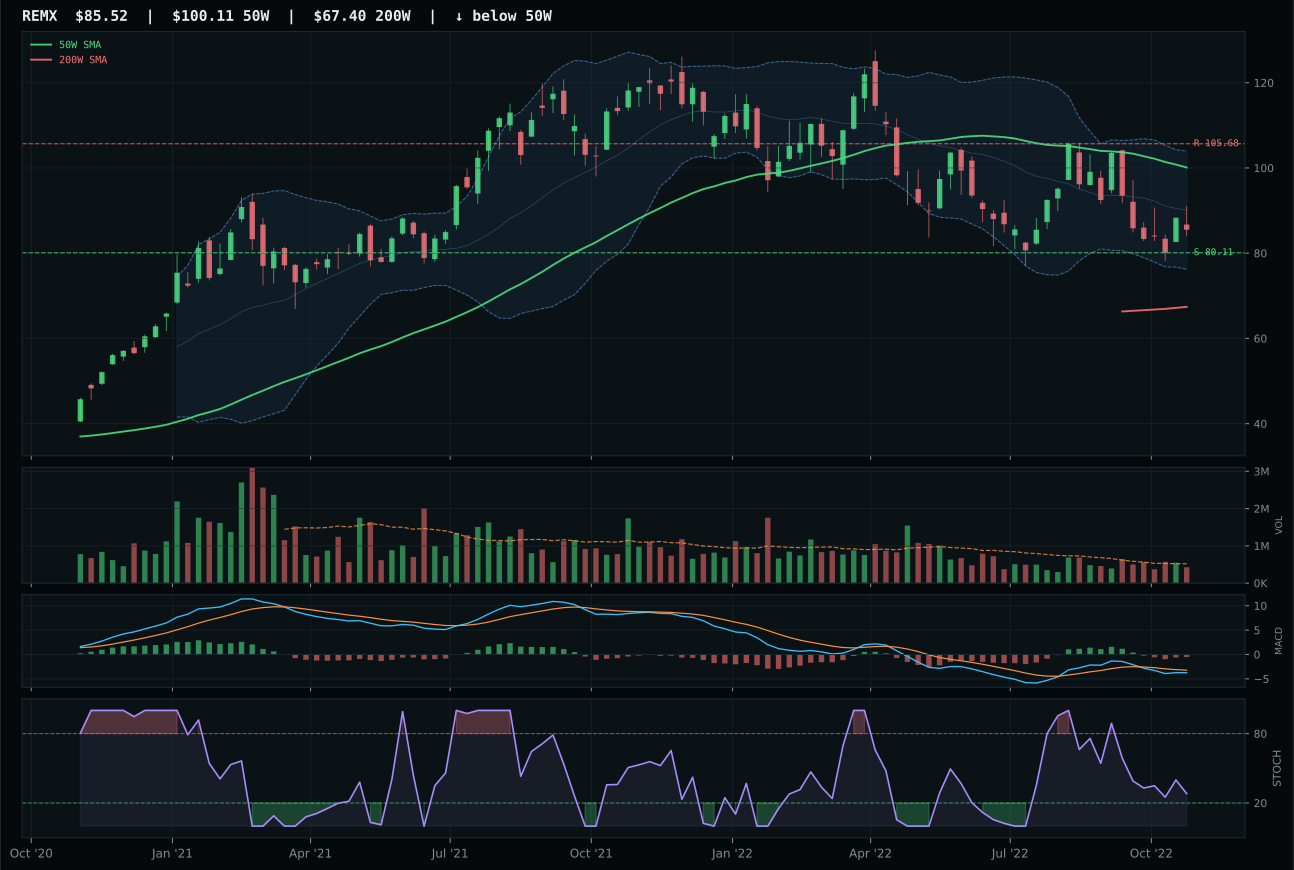
REMX has a neutral structure profile with -2.0% 13-week relative strength versus SPY.
A failed hold above support would weaken the setup.
Actionable but governed by invalidation levels.
COPX won over PICK by the narrowest margin (1.9 points) because structure cleanliness (66.5 vs 66.0) and volume confirmation (neutral vs thin participation) gave it the edge in a close technical race. Copper's setup is pulled back to deep repair near 52W low at 30.55, with MACD bullish and improving and stochastic RSI falling/neutral at 0.78—meaning the chart is showing potential reversal energy but without yet confirming it on volume. PICK shows nearly identical trend (67 vs 67), identical momentum confirmation (64 vs 66), and better risk-reward (90.0 vs 75.0), but its thin volume participation in a pullback setup means accumulation is weaker than COPX's neutral volume. Both are trading the same thesis—metals scarcity is active (+12 for COPX, +6 for PICK)—but COPX's neutral volume suggests broader institutional interest, whereas PICK's thin volume suggests specialist accumulation. The 28.4% upside to resistance in COPX versus PICK's wider range tells you copper positioning is tighter, which rewards disciplined entry over aggressive chasing.
Industrial Metals earned 5% because the macro case is solid (metals scarcity +14, real asset sponsorship +6, Late-Cycle Reflation +10) but technical evidence is moderate (66.9), creating a condition where the allocation is held for structural scarcity conviction rather than momentum. COPX's technical evidence at 66.9 and macro fit at 49.0 combine to 55.5 category score—respectable but not top-tier, which is why it earns a slot below Defense and Energy. Liquidity stress (-7) and dollar pressure (-6) are working against metals, creating a regime conflict: the commodity story is bullish, but the financial conditions story is bearish. The allocator holds 5% to express scarcity conviction while respecting that positioning is not yet confirmed on volume; if COPX breaks above 40.74 on accumulation volume, the position expands immediately. This is a structural bet held in a tactical window, not a timing bet.
Utilities & Infrastructure — PAVE
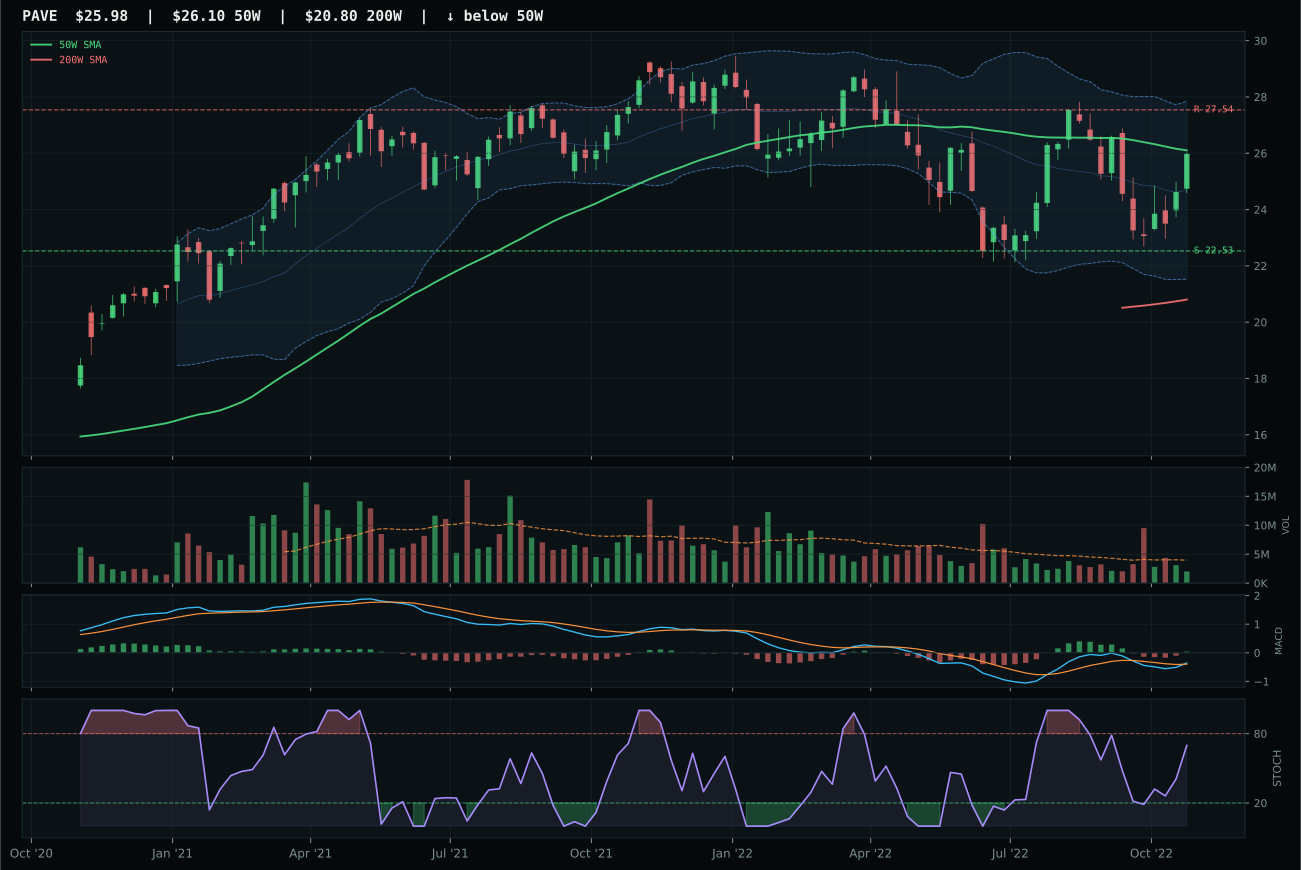
PAVE has a compression near 50W profile with 4.4% 13-week relative strength versus SPY.
A failed hold above support would weaken the setup.
Actionable but governed by invalidation levels.
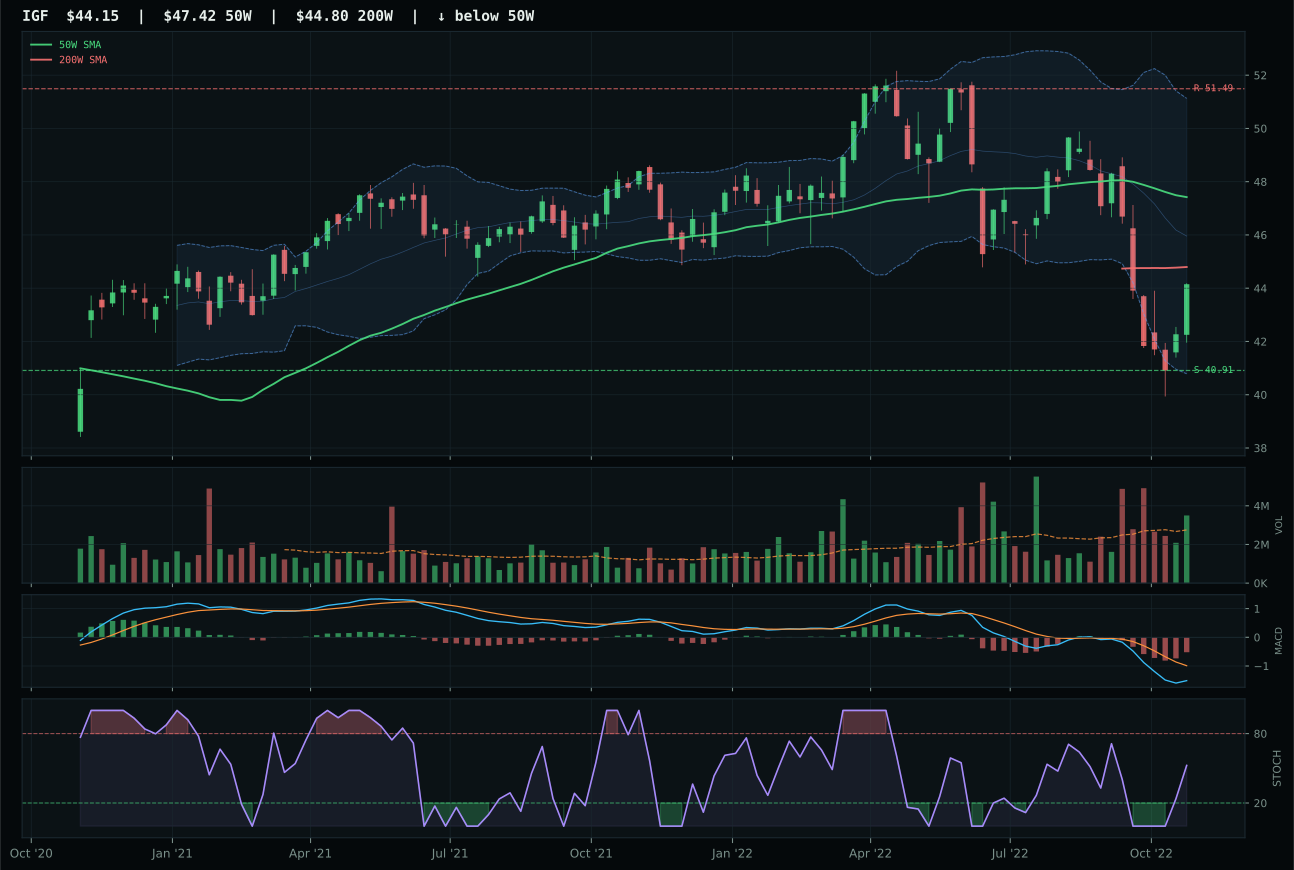
IGF has a neutral structure profile with -3.2% 13-week relative strength versus SPY.
A failed hold above support would weaken the setup.
Actionable but governed by invalidation levels.
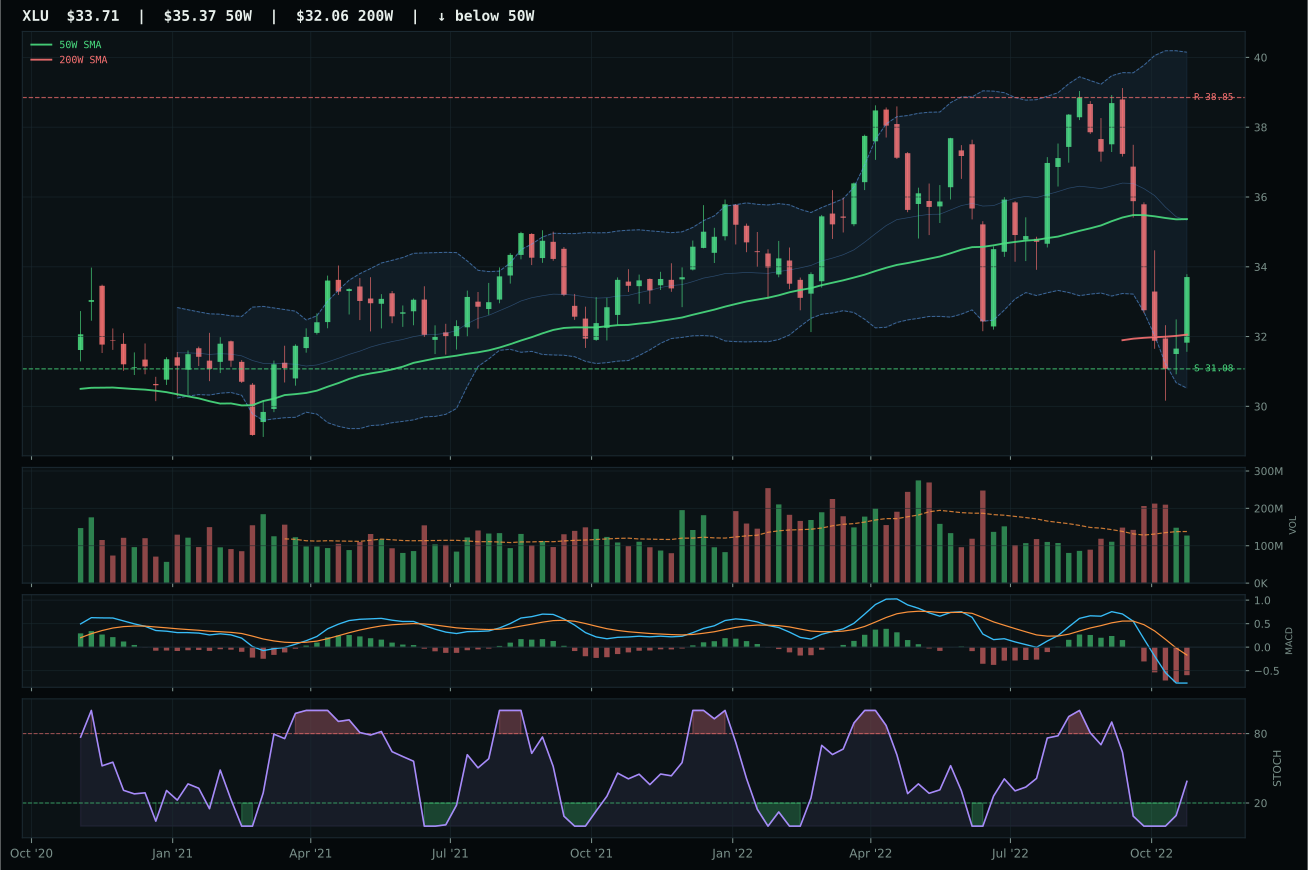
XLU has a neutral structure profile with -3.3% 13-week relative strength versus SPY.
A failed hold above support would weaken the setup.
Actionable but governed by invalidation levels.
PAVE won the category with a decisive 23.3-point margin over IGF because timing (100.0 vs 83.0), momentum confirmation (97.6 vs 53.0), and category-relative strength (7.6% vs 0.0%) created a dominant setup despite IGF posting wider institutional volume (above-average participation). PAVE is compression near the 50W at -0.5% distance—the tightest setup in the entire portfolio—with MACD bullish and improving, stochastic RSI rising mid-zone at 0.70, and 4W return of 12.7% reflecting accumulation into the compressed setup. IGF sits deeper at -8.8% 13W return with bearish-but-improving MACD, which in late-cycle reflects distribution from the recent high rather than accumulation into support. Both show modest RS versus SPY (4.4% and -3.2%), but PAVE's category-relative strength of 7.6% tells you infrastructure rotation is favoring domestic capex plays over global income. The setup difference is decisive: PAVE at compression near 50W offers risk clarity with upside to 27.54; IGF at neutral structure with deteriorating trend offers no confirmation signal.
Utilities & Infrastructure earned 5% because the macro case is moderate (defensive rotation +12, broad market bear +4, but inflation pressure -6, liquidity stress -3) and technical evidence varies by ETF. PAVE's 82.7 technical evidence is excellent, but IGF at 62.9 and XLU at lower levels weigh down the 3/2/1 basket to 62.2, which descends to 45.6 after macro testing. Liquidity stress (-6) and the absence of energy-scarcity or real-asset tailwinds that help other defensive rotations create a condition where utilities are defensive but not conviction. PAVE's compression timing (100.0) and 4W momentum (97.6) make it the better of three choices, but it's not yet a large allocation bet. This slot expands if defensive rotation accelerates on new market weakness, or compresses if the Fed pauses and risk appetite returns; for now it's a measured tactical hold in the lower tier of portfolio priority.
Nuclear Energy — URNM
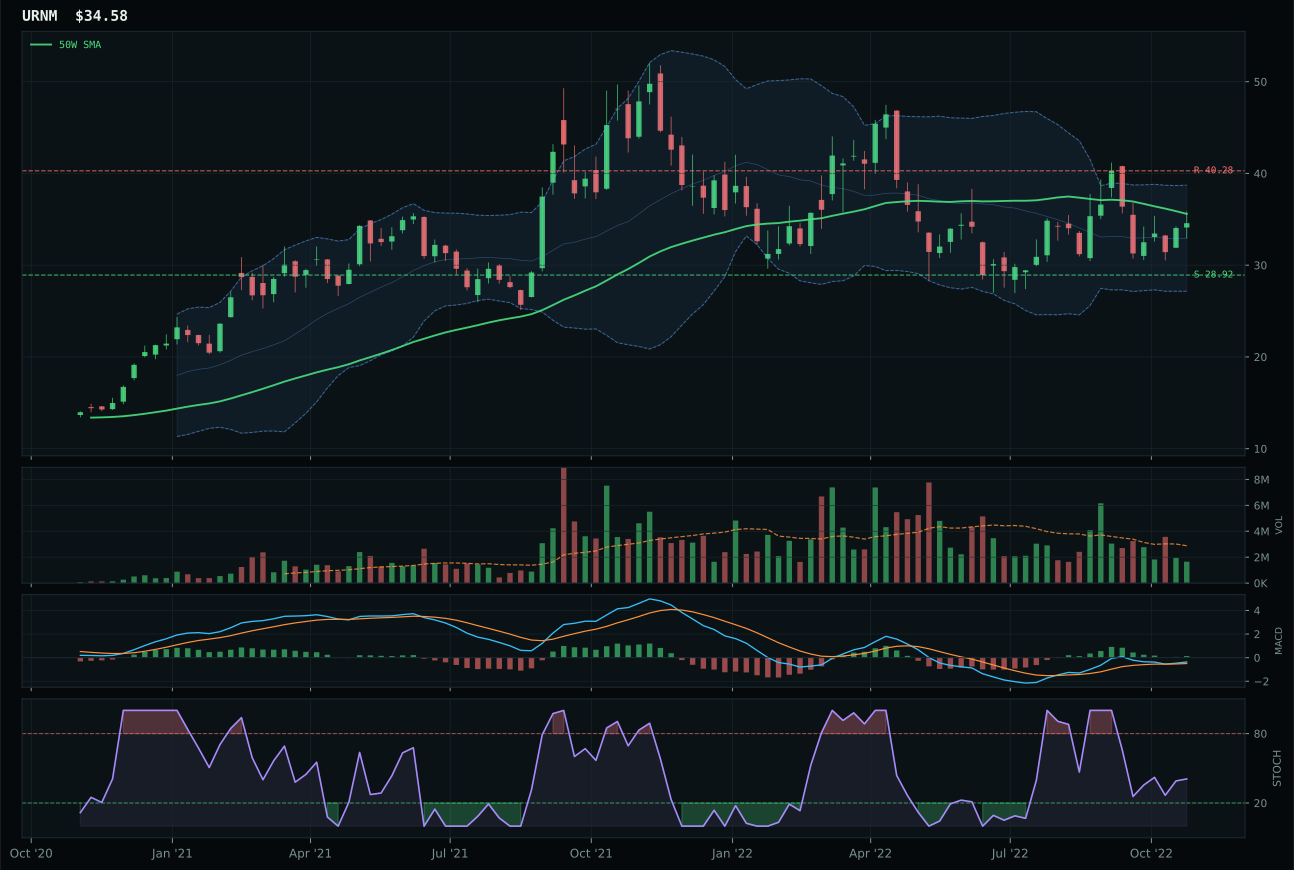
URNM has a compression near 50W profile with 4.8% 13-week relative strength versus SPY.
A failed hold above support would weaken the setup.
Actionable but governed by invalidation levels.
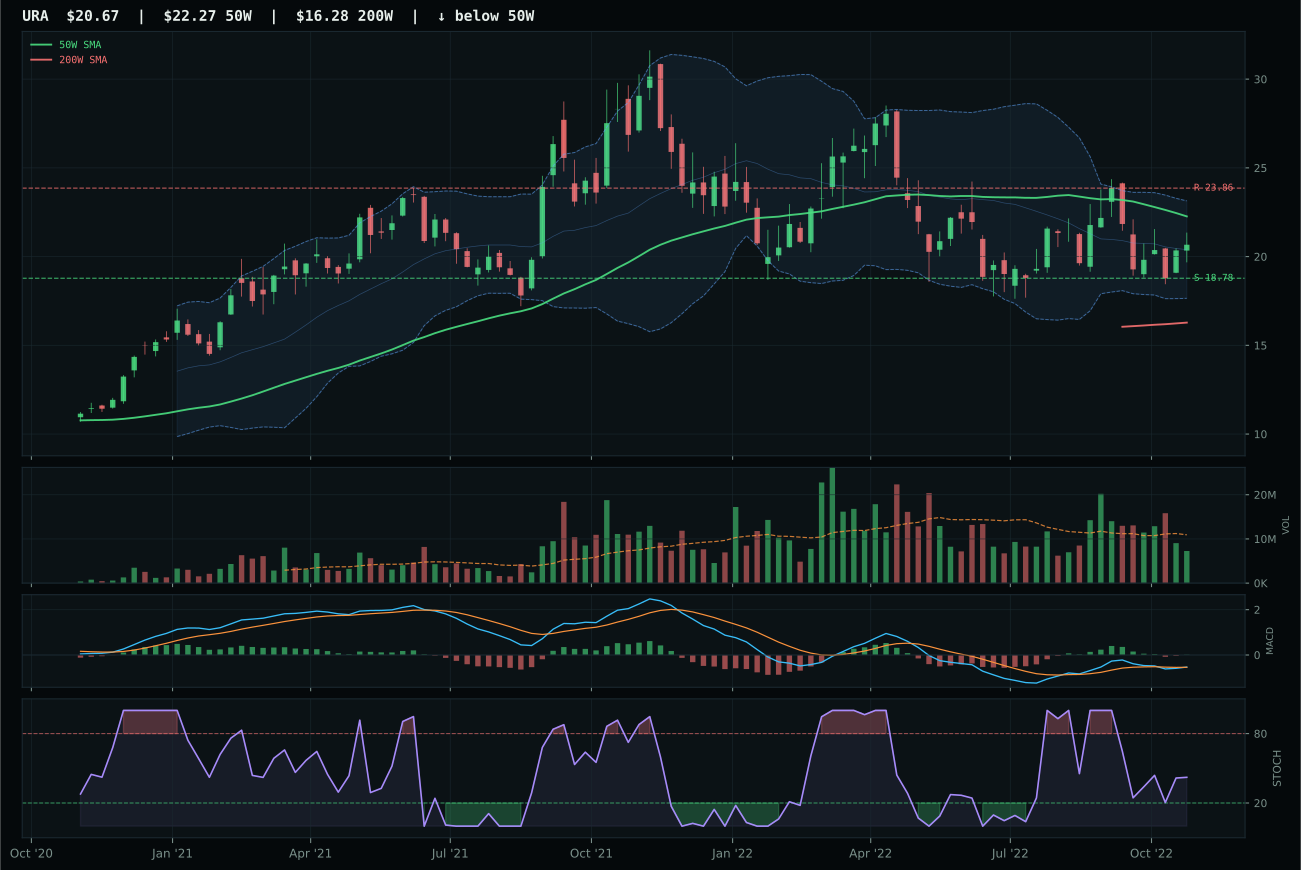
URA has a neutral structure profile with 1.4% 13-week relative strength versus SPY.
A failed hold above support would weaken the setup.
Actionable but governed by invalidation levels.
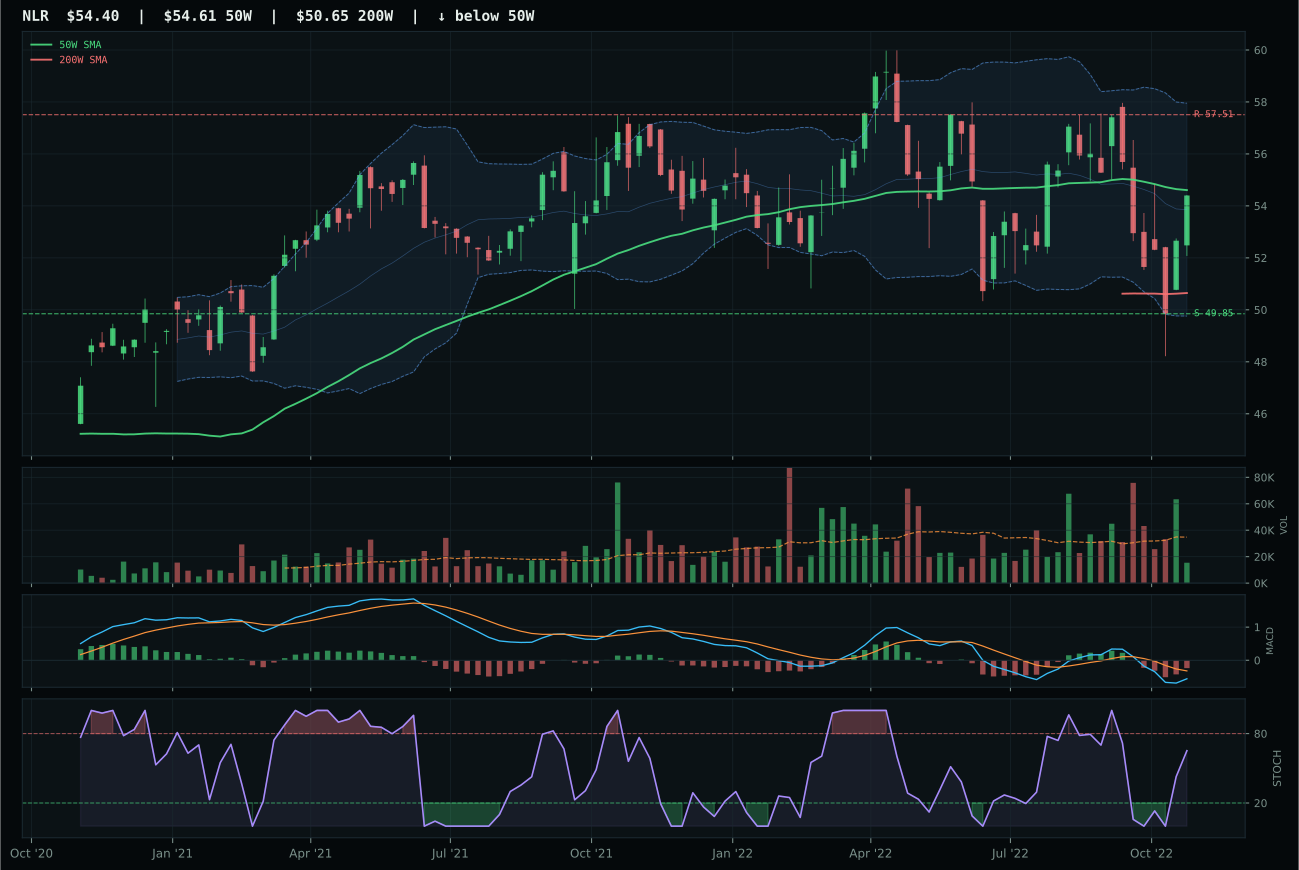
NLR has a compression near 50W profile with 3.4% 13-week relative strength versus SPY.
A failed hold above support would weaken the setup.
Tracked, but not top-2 eligible because: .
URNM won the category with a decisive 16.6-point margin over URA because timing (95.0 vs 70.0) and structure (64.5 vs neutral) decisively favored uranium's miner-specific compression setup over uranium's ETF-level pullback. URNM is compressed near the 50W at -2.8% distance with MACD bullish but flattening and stochastic RSI falling/neutral at 0.41—a setup where the 50W becomes a natural magnet for expansion if buyers defend it. URA sits deeper in pullback with neutral structure and weaker MACD confirmation (bullish but flattening same as URNM), but its -4.2% 13W return and -2.1% category-relative weakness signal that the uranium sector's energy-scarcity tailwinds are not translating to upside momentum yet. Both show modest category-relative strength (URNM 1.4%, URA -2.1%), but URNM's compression timing (100.0) gives it the edge for forward expansion potential. Energy scarcity is active (+9) and real asset sponsorship is active (+7), but the category macro fit (65.0) is only moderate because liquidity stress (-7) and inflation pressure (+3) create conflicting signals.
Nuclear Energy earned 5% because the macro case (energy scarcity +9, real asset sponsorship +7) is genuine, but technical evidence is weak (49.6 for URNM) and category macro fit is only moderate (65.0). URNM's 44.0 category score reflects a setup that is interesting but not yet confirmed: compression near the 50W is a setup condition, not a signal. The allocator holds 5% to express structural energy-scarcity conviction while respecting that uranium miners have not yet shown volume accumulation into the setup. Volume is thin across all three ETFs, which means the position is exploratory rather than institutional conviction. If URNM breaks above 40.28 on expanding volume while MACD continues to improve, the position expands to match Defense's or Energy's conviction weighting; for now it earns the exploratory 5% slot because macro tailwinds justify the hold despite weak technicals.
Precious Metals — GLD
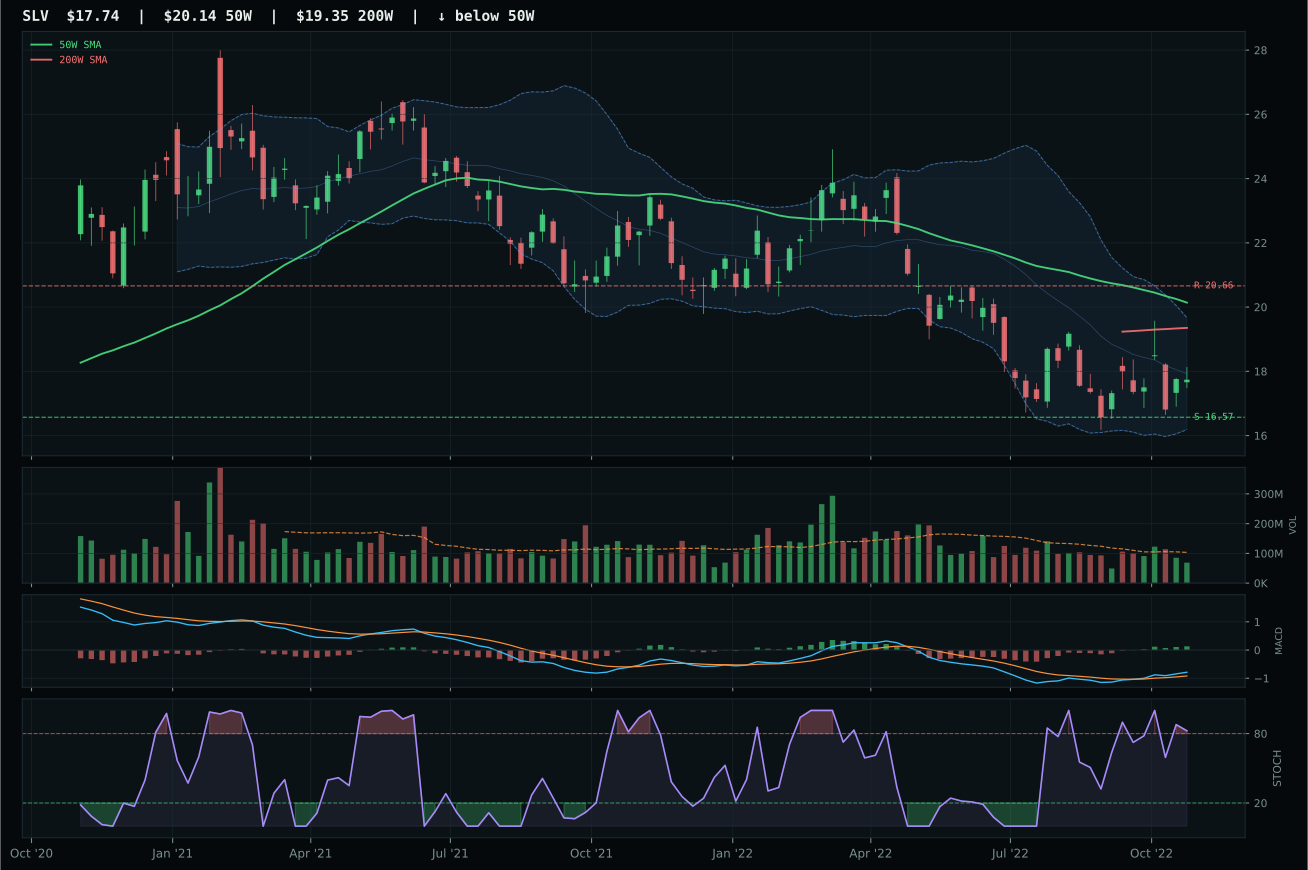
SLV has a neutral structure profile with 0.4% 13-week relative strength versus SPY.
A failed hold above support would weaken the setup.
Actionable but governed by invalidation levels.
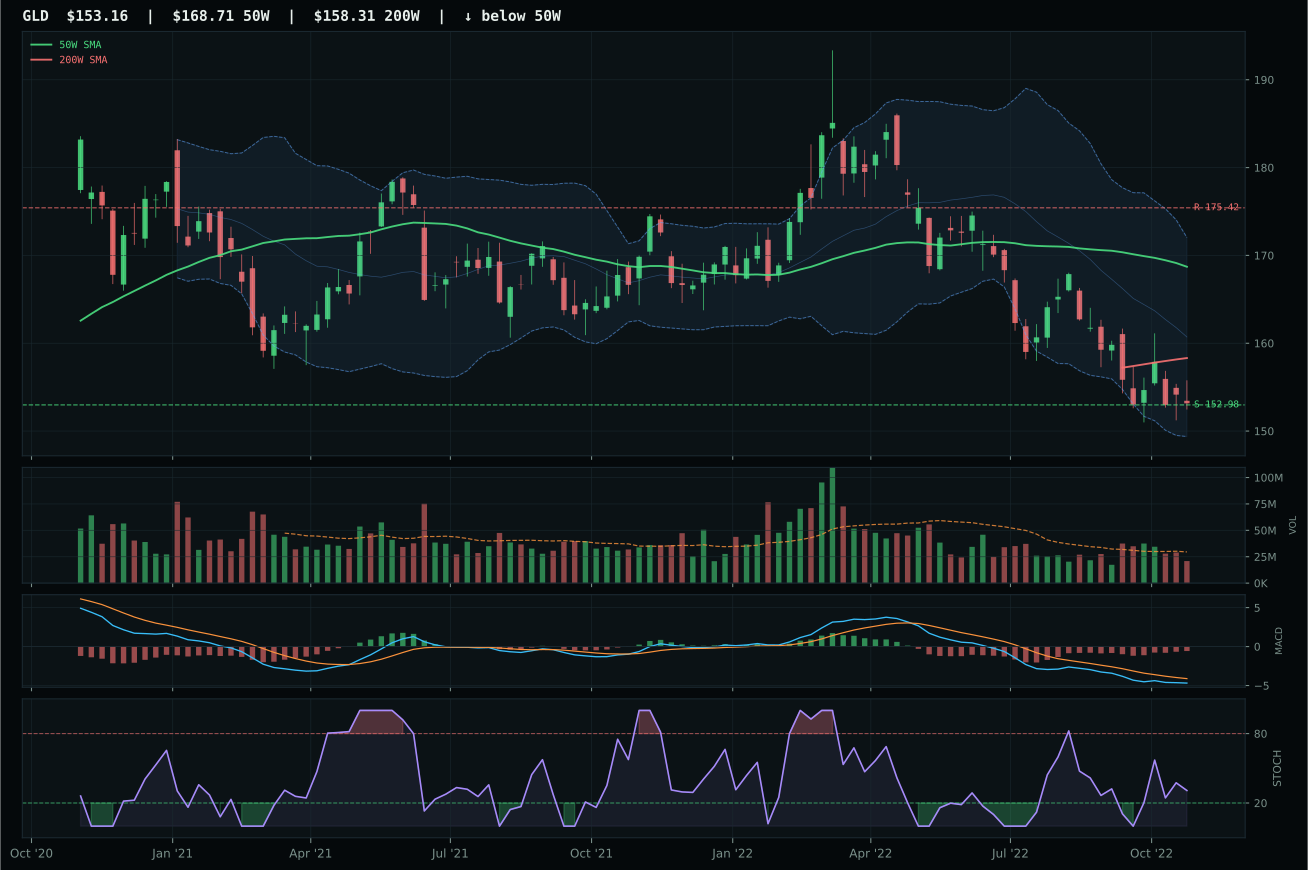
GLD has a pullback into support profile with -1.1% 13-week relative strength versus SPY.
A failed hold above support would weaken the setup.
Actionable but governed by invalidation levels.
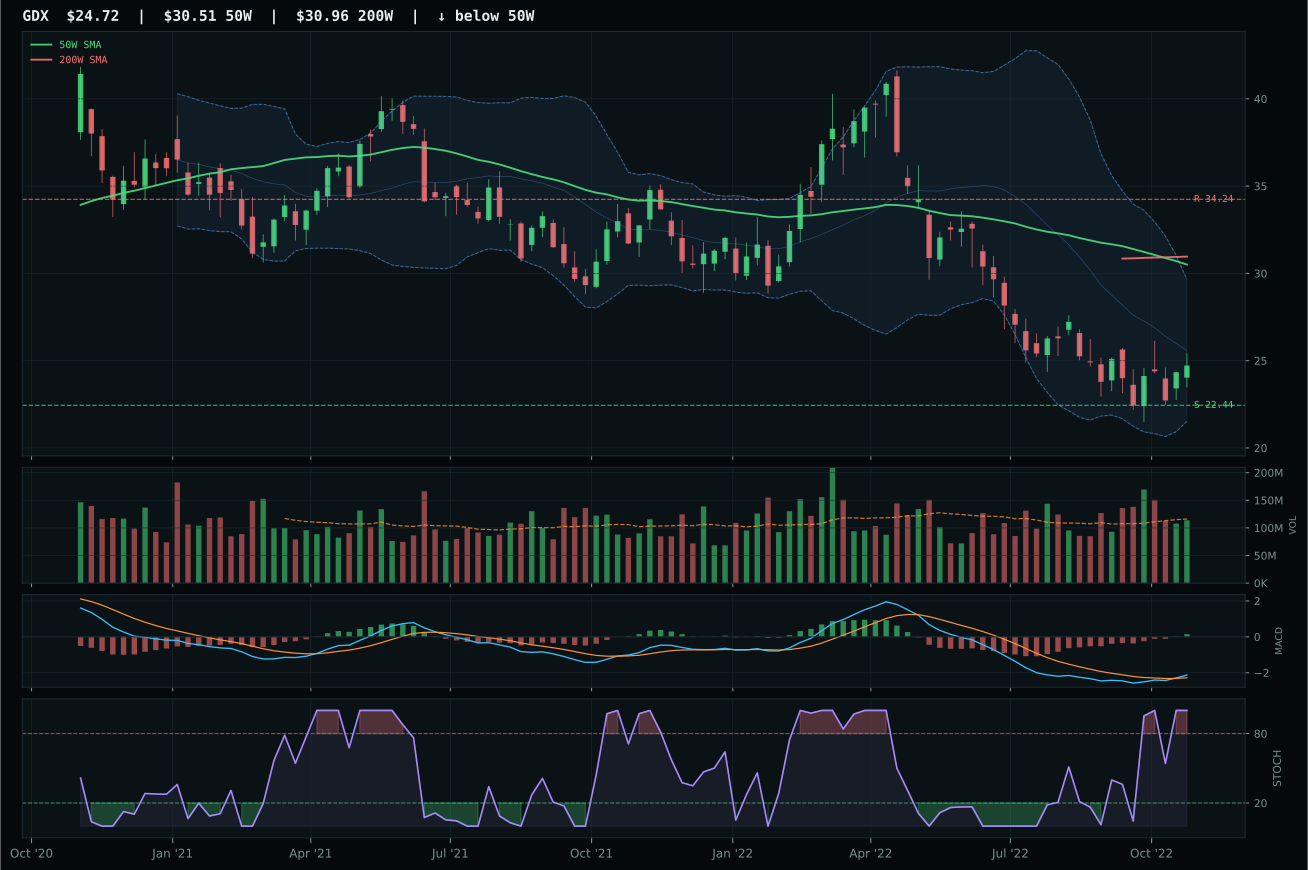
GDX has a neutral structure profile with -0.3% 13-week relative strength versus SPY.
Extension and support failure are the main tactical risks.
Tracked, but not top-2 eligible because: structurally broken.
GLD won by a narrow margin (41.8 vs SLV's 43.8 reasoned technical evidence) because its timing (85.0 vs 37.0) and setup structure decisively beat silver's technical confusion. Gold is pulled into support at 152.98 after a near 52W low repair, with stochastic RSI falling/neutral at 0.31 and MACD bearish but improving—a classic capitulation setup where defined support (0.1% downside) offers risk clarity that SLV's overbought-rolling-over stochastic cannot match. Silver has bullish MACD, which looks better on paper, but overbought stochastic rolling over is a distribution signal in thin volume, whereas GLD's falling stochastic in pullback is a washout setup. Both face identical macro tailwinds: monetary hedge bid active (+14), defensive rotation active (+6), dollar pressure active (+2 for silver, +3 for gold). The 2-point margin reflects GLD's superiority in timing and structure quality, not relative strength—SLV posts +0.4% RS versus SPY, but that strength is being rejected at the technical level.
Precious Metals earned 5% on macro fit (74.0) despite weak technical evidence (32.4 for GLD) because monetary hedge bid is active (+14) and defensive rotation is active (+7), signaling institutional allocation to duration hedges rather than speculation. The category macro fit is strongest in the portfolio after Defense and Traditional Energy, reflecting how late-cycle reflation with liquidity stress and dollar pressure forces portfolio managers toward monetary hedges. GLD's 13W return of -6.7% and RS versus SPY of -1.1% tell you this is a catch position, not a growth bet; the allocator is holding 5% for tail protection and rotation rebalancing, not for capital appreciation. For the position to expand, gold would need to hold support cleanly and begin posting positive relative strength; currently it's insurance that the macro regime holds, not a conviction long.
Technology — XLK
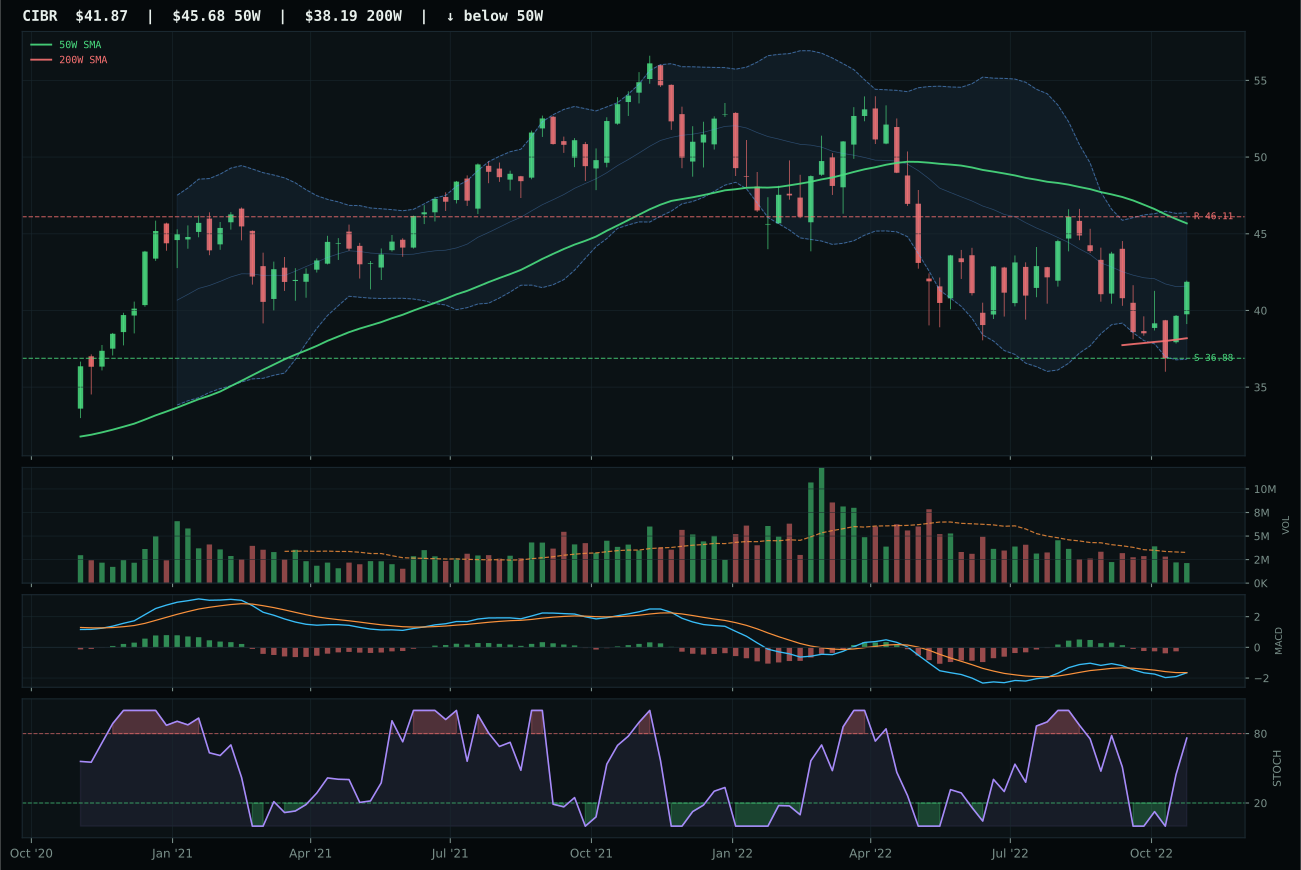
CIBR has a neutral structure profile with 4.9% 13-week relative strength versus SPY.
A failed hold above support would weaken the setup.
Actionable but governed by invalidation levels.
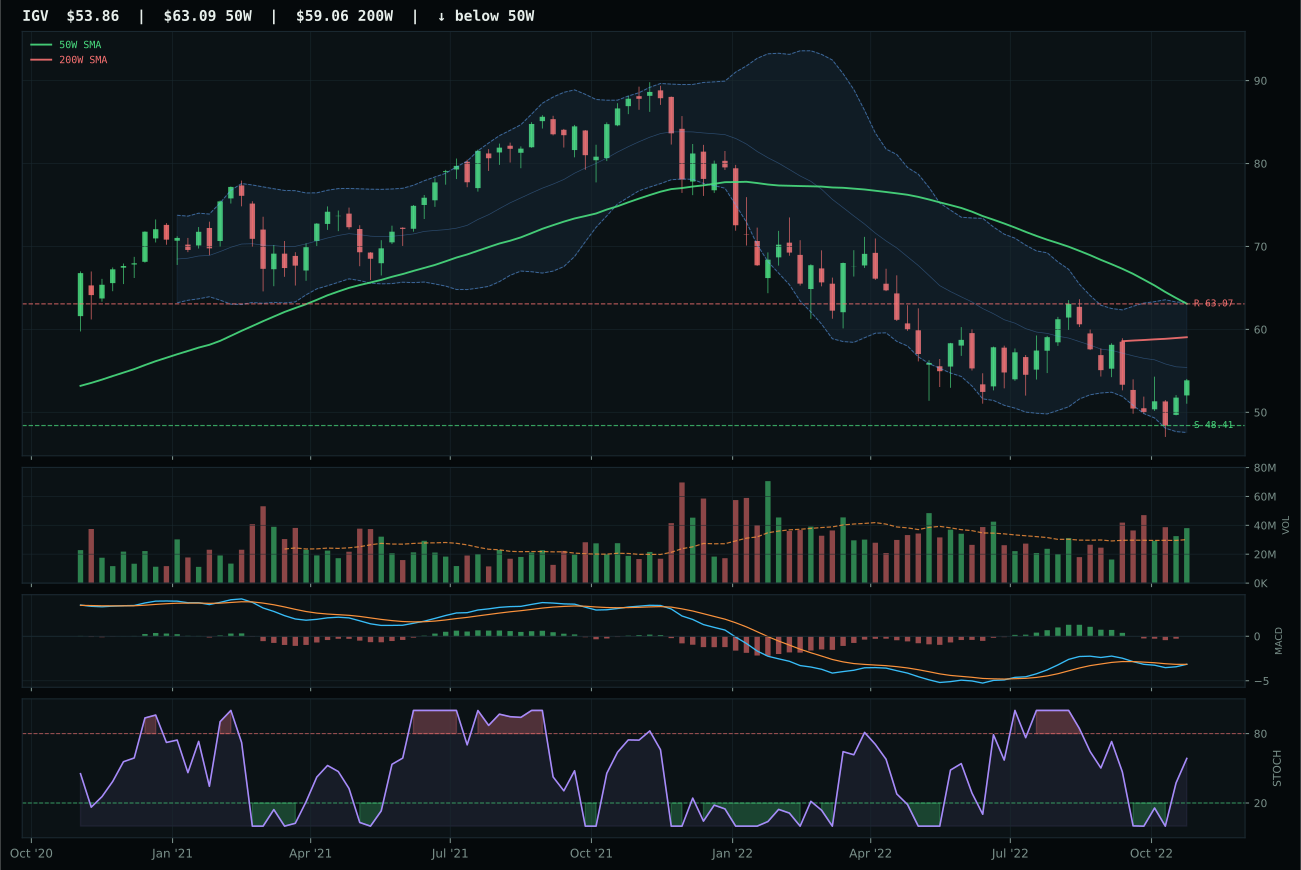
IGV has a neutral structure profile with -3.2% 13-week relative strength versus SPY.
A failed hold above support would weaken the setup.
Actionable but governed by invalidation levels.
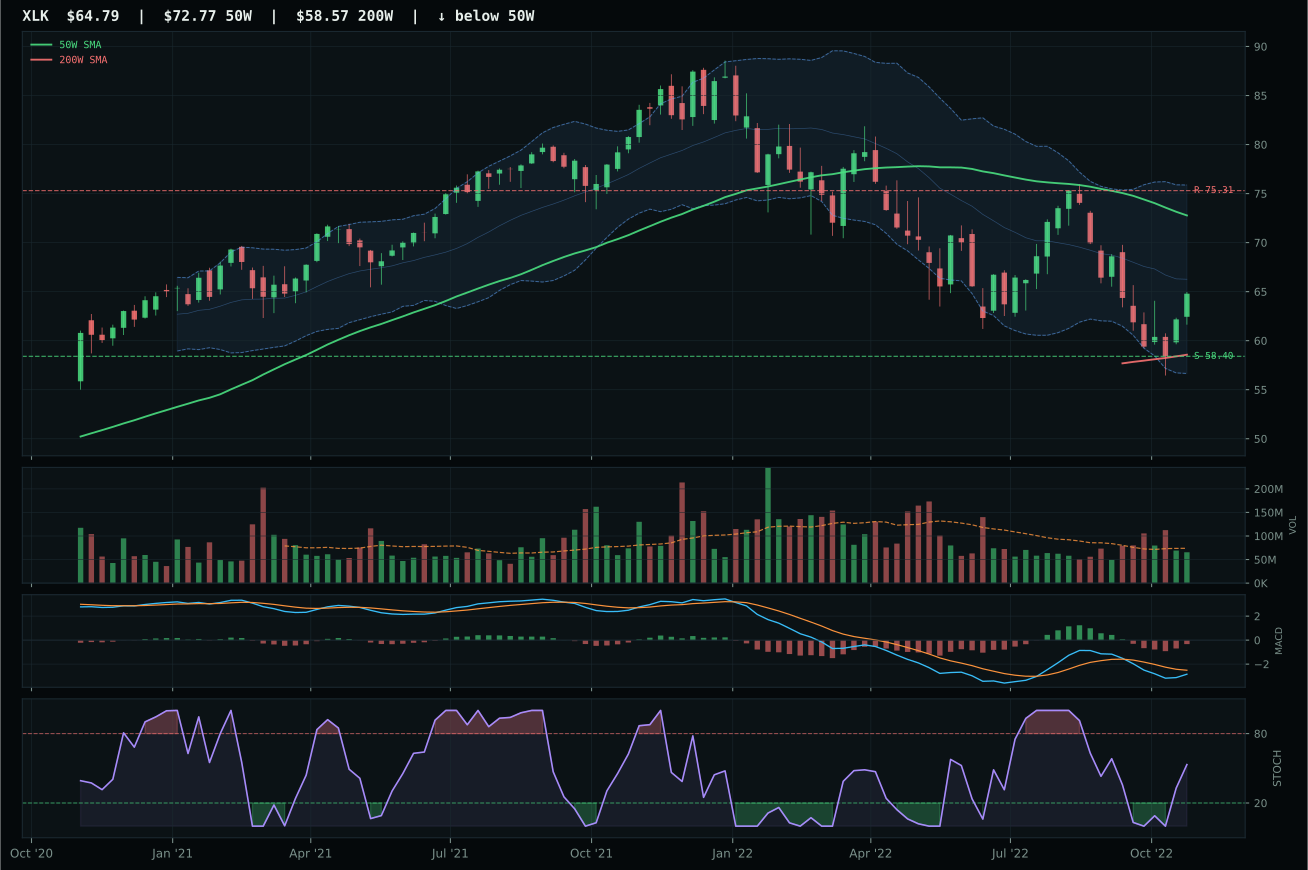
XLK has a neutral structure profile with -4.6% 13-week relative strength versus SPY.
A failed hold above support would weaken the setup.
Actionable but governed by invalidation levels.
XLK won the category despite trailing CIBR in composite score because its risk-reward setup (76.0 vs 57.2) offered asymmetry that matters in a liquidity-stressed regime. Price sits 11% below the 50W in a neutral structure with support at 58.40 and resistance at 75.31, meaning the downside to support is 10.9% against an upside of just 14% to resistance—a 1.3:1 payoff that rewards patience over chase. CIBR looked tighter on trend (RS +4.9% vs XLK's -4.6%), but that strength came on thin participation, which in late-cycle reflation with active liquidity stress signals late rotation rather than sponsorship. MACD is bearish but improving across both; the difference is XLK's neutral volume at 0.89x the 20W average versus CIBR's thin participation, meaning accumulated weakness is more likely to find buyers at support in XLK's case.
Technology earned 5% because the category macro fit (31.0) is being crushed by liquidity stress (-10), dollar pressure (-5), and inflation pressure (-4), pushing the category to the bottom tier despite neutral structure. The allocator isn't hiding from tech; it's recognizing that a 3/2/1 weighted basket starting at 54.9 doesn't survive testing against late-cycle reflation's headwinds when the representative shows trend at only 51.1 and momentum confirmation at 49.4. XLK itself has 13W return of -10.2% and RS versus SPY of -4.6%, which tells you defensive rotation is active and risk appetite is broken—two macro conditions that make breadth plays worse, not better. For this 5% slot to expand, either liquidity stress needs to ease or the category needs to show cross-asset outperformance that justifies the macro drag; neither is happening this week.
AI — SMH
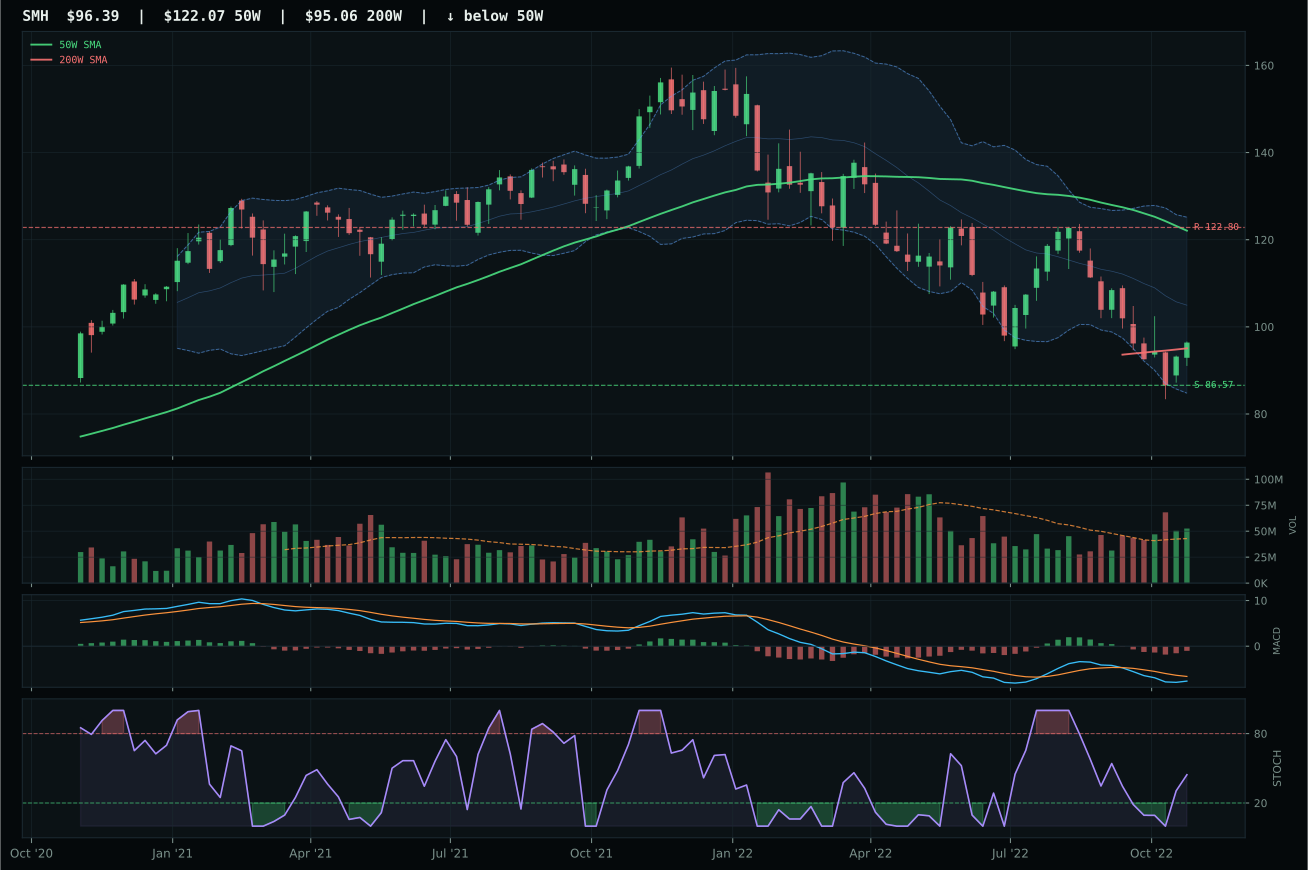
SMH has a neutral structure profile with -13.1% 13-week relative strength versus SPY.
A failed hold above support would weaken the setup.
Actionable but governed by invalidation levels.
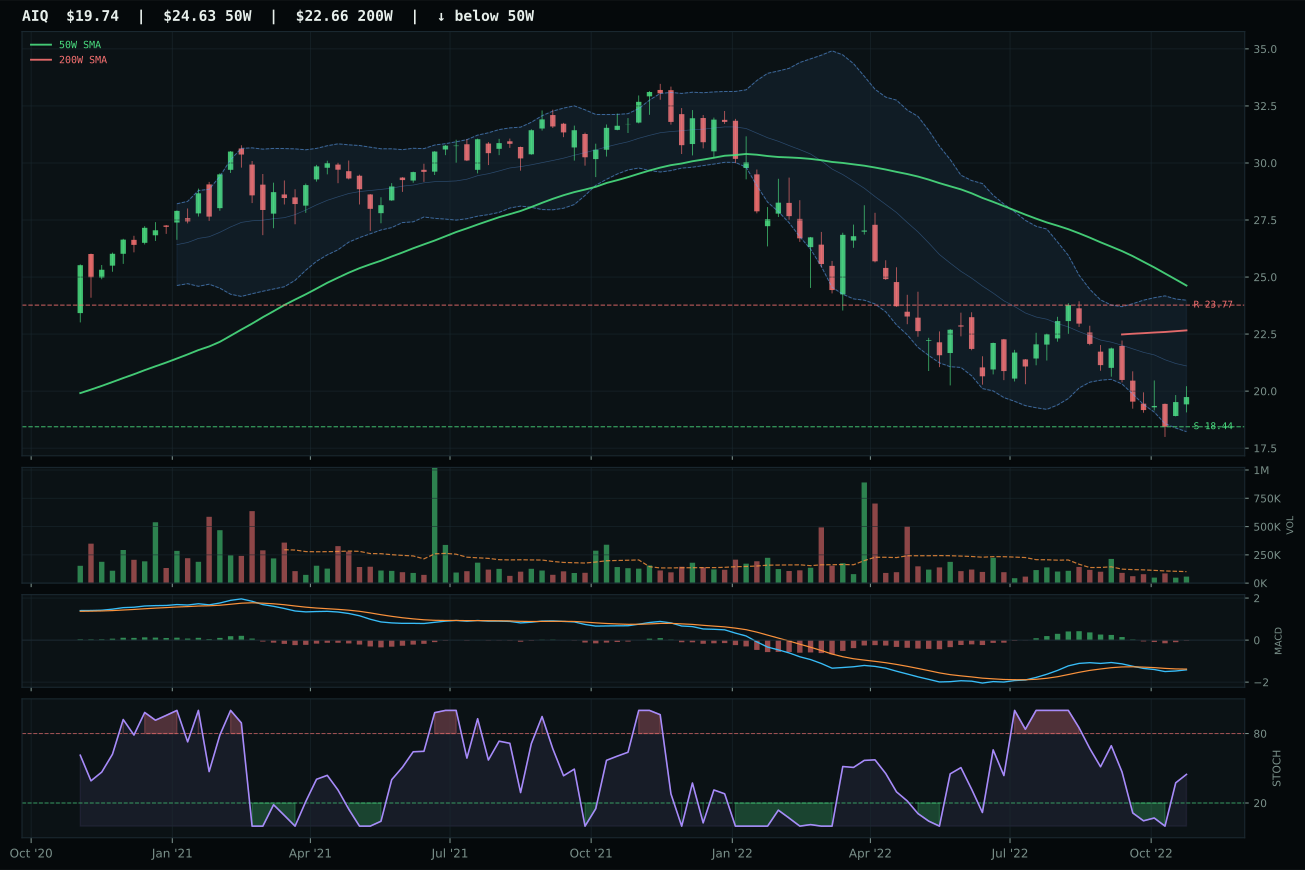
AIQ has a neutral structure profile with -6.7% 13-week relative strength versus SPY.
A failed hold above support would weaken the setup.
Tracked, but not top-2 eligible because: .
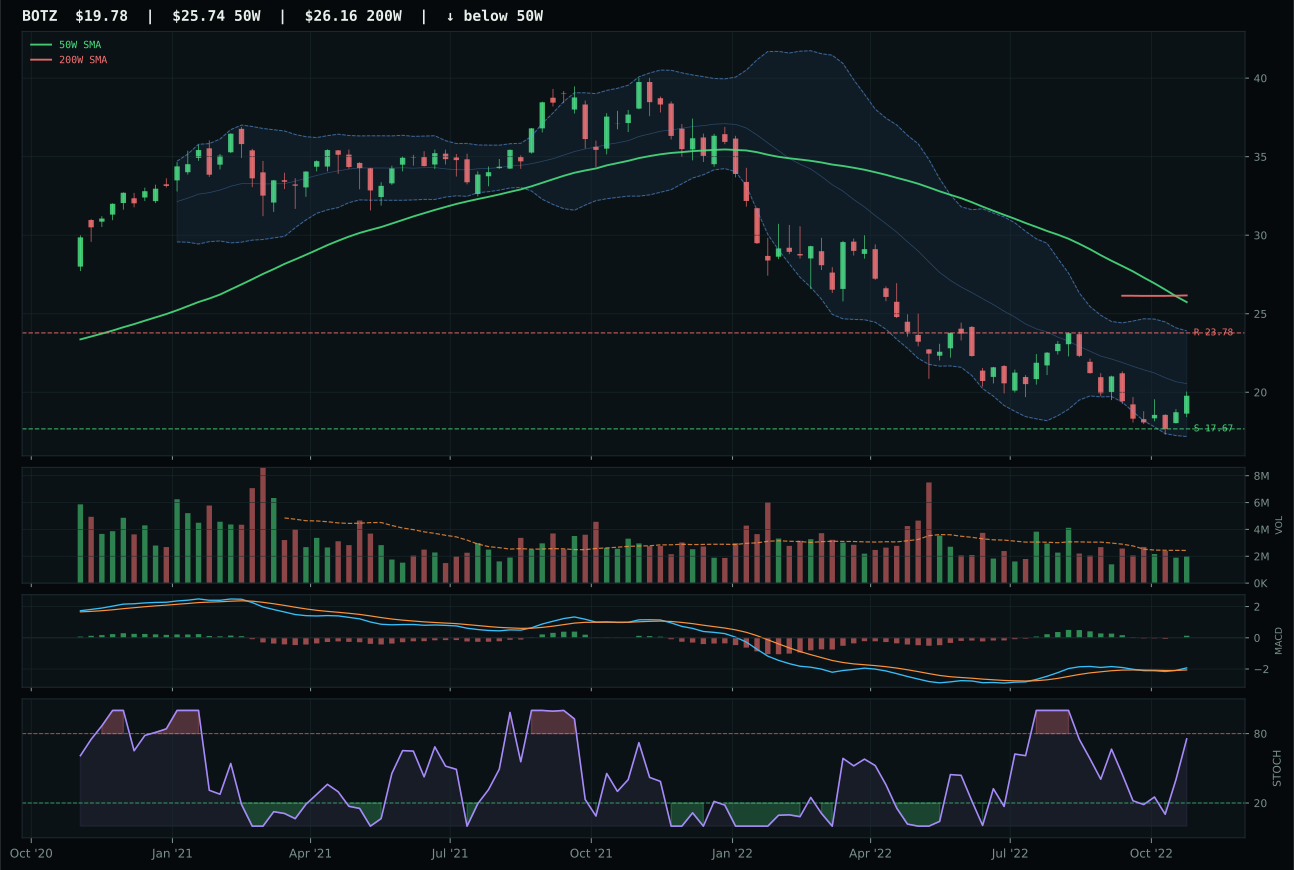
BOTZ has a neutral structure profile with -6.6% 13-week relative strength versus SPY.
Extension and support failure are the main tactical risks.
Tracked, but not top-2 eligible because: structurally broken.
SMH won despite the lowest momentum confirmation (14.6) in its peer set because its structure (67.2) and timing (63.0) held up better under stress, and above-average volume (1.23x) at worst price in 52 weeks gives the setup definition. The semiconductor compute thesis is heavily damaged—13W return is -18.7%, RS versus SPY is -13.1%—but the setup is clean pullback to support at 86.57 with resistance at 122.80, making the risk-reward 11.3% down against 21.5% up. AIQ looked like better momentum (30 vs 15) and posted better relative strength at -6.7% versus SPY, but its thin participation volume and structure score of 64.8 meant buyers weren't accumulated here; they were just bouncing off lows. The 6.1-point gap over AIQ is narrow, reflecting how both ETFs are being killed by liquidity stress (-12) and risk appetite broken (-8), but SMH's heavy volume participation earned the allocation against the softer technicals.
AI receives 0% allocation this week, ranking 9th or 10th among the 10 categories with a final score of just 10.5. The category-level macro fit of 26.0/100 is being crushed by three active headwinds: liquidity stress (-12), broad market bear (-8), and dollar pressure (-4). Even SMH's winning technical setup cannot overcome the fact that semiconductor demand is a leading indicator of risk appetite, and risk appetite is explicitly broken in this macro regime. The 3/2/1 basket score started at a reasonable 38.2, but the category reasoner stepped it down to 10.5 after testing against persistence (31.1/100 for the winner), volume-price confirmation (25.6/100), and the depth of macro stress. Recovery into AI requires either a reset of the broad market bear flag or a meaningful shift in liquidity conditions; until then, capital stays deployed in categories where macro tailwinds exist rather than headwinds.
Emerging Markets — INDA
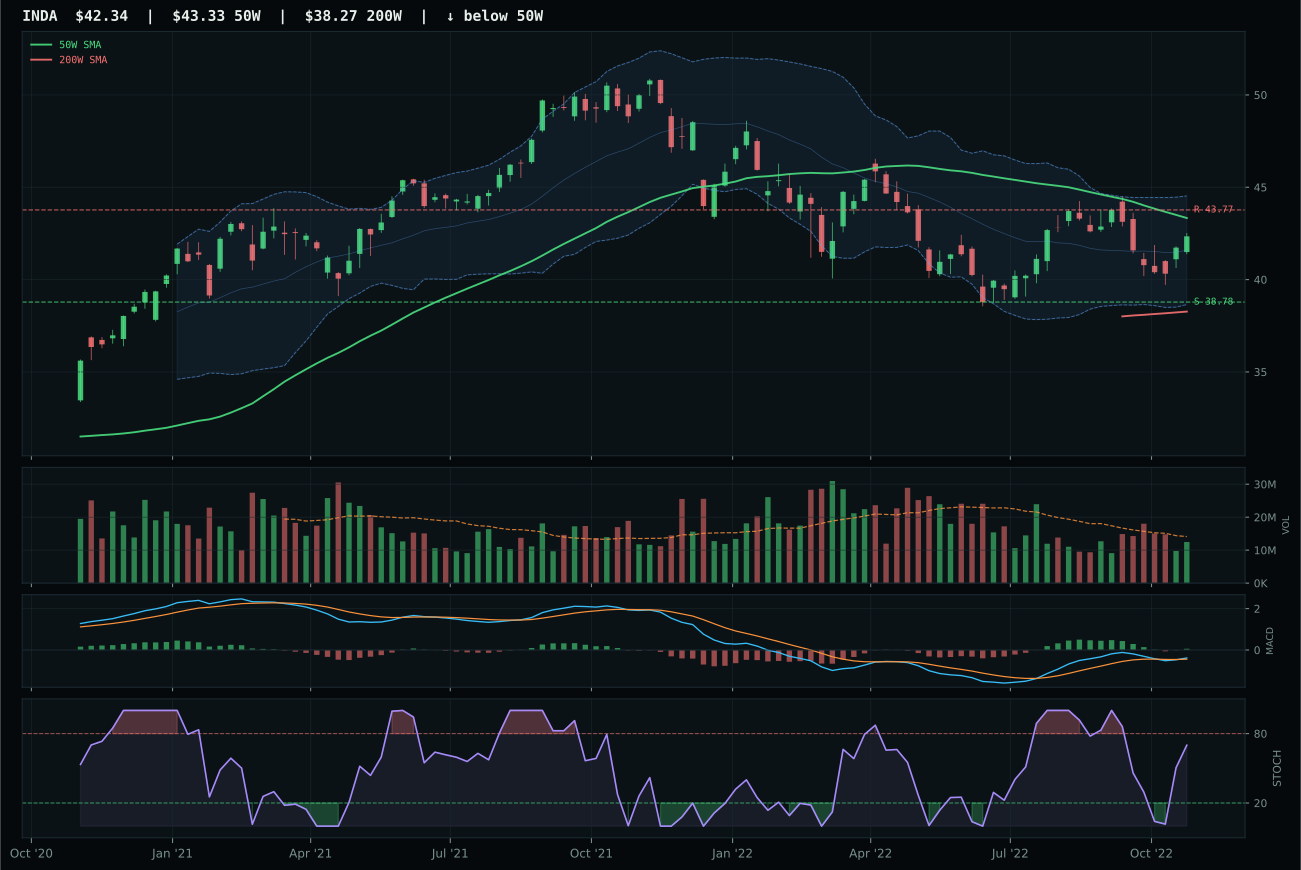
INDA has a compression near 50W profile with 4.8% 13-week relative strength versus SPY.
A failed hold above support would weaken the setup.
Actionable but governed by invalidation levels.
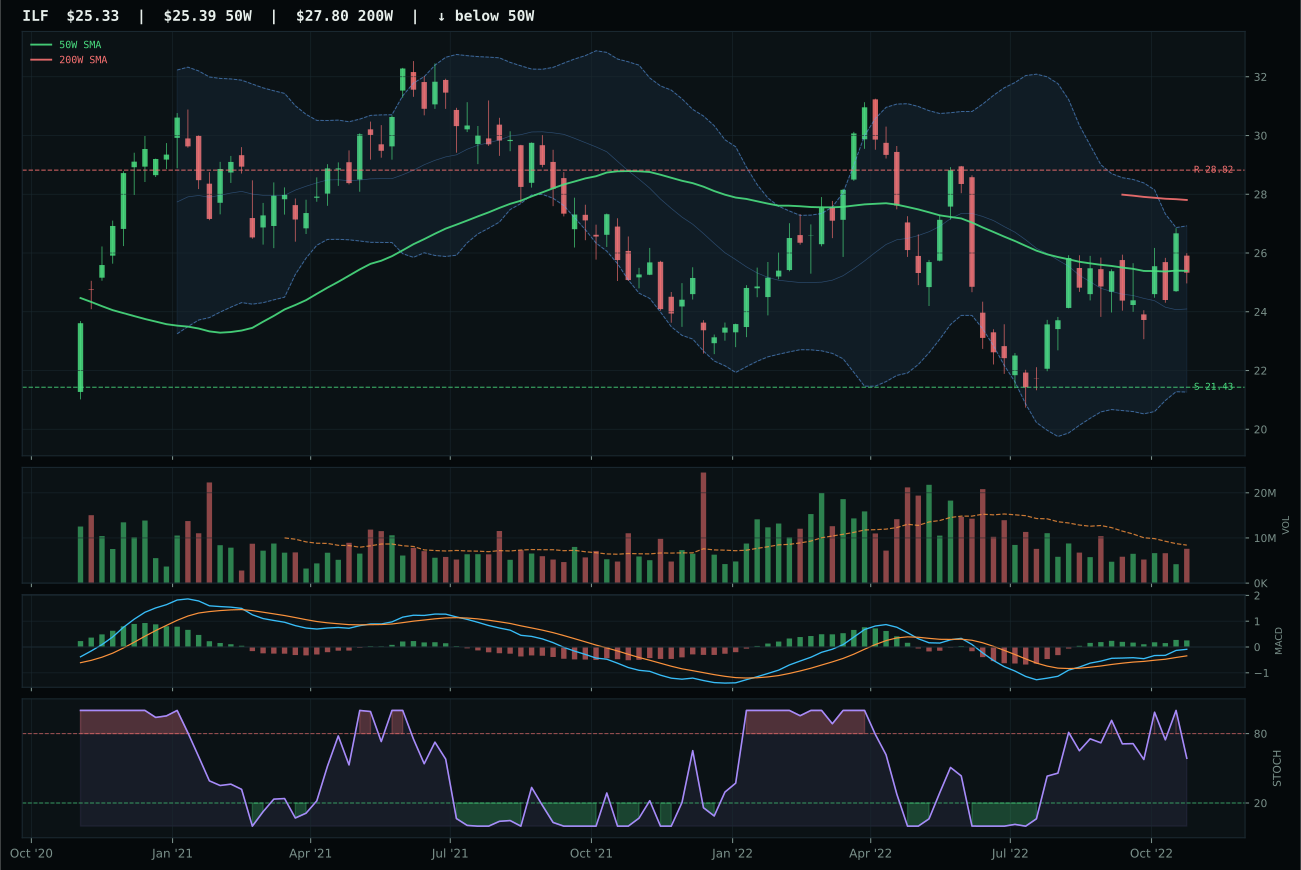
ILF has a compression near 50W profile with 13.0% 13-week relative strength versus SPY.
Extension and support failure are the main tactical risks.
Tracked, but not top-2 eligible because: structurally broken.
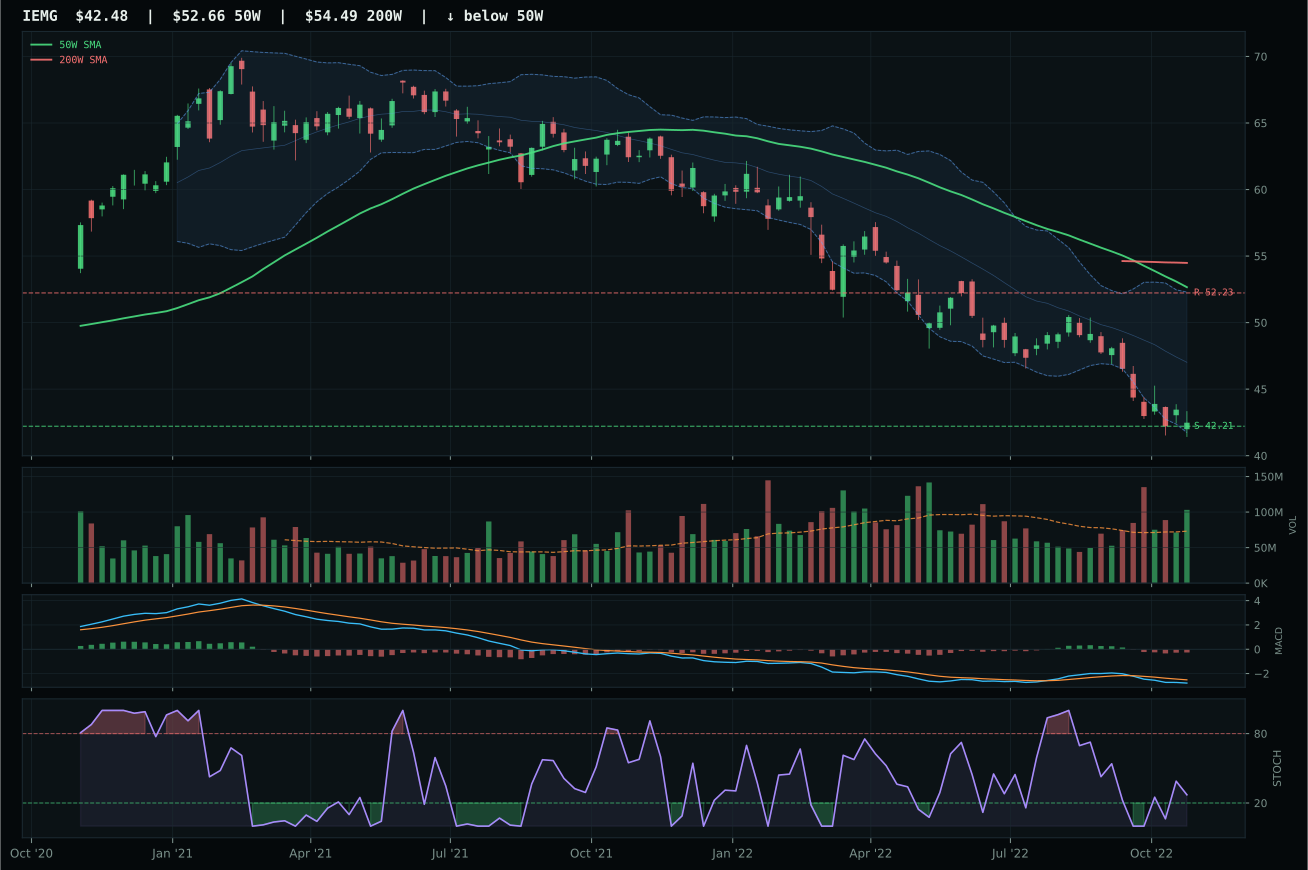
IEMG has a pullback into support profile with -7.8% 13-week relative strength versus SPY.
Extension and support failure are the main tactical risks.
Tracked, but not top-2 eligible because: structurally broken.
INDA won decisively over ILF with a 32.3-point technical gap despite ILF posting superior relative strength (13.0% RS versus SPY vs INDA's 4.8%), because structure (70.1 vs 38.5) and timing (100.0 vs 100.0 tied) were destroyed by ILF's broken technical framework. INDA shows compression near the 50W at -2.3% distance with MACD bullish but flattening and stochastic RSI rising mid-zone at 0.70—textbook accumulation setup for quality-growth rotation. ILF posted bullish-and-improving MACD (better than INDA's bullish-but-flattening), but stochastic RSI falling/neutral and structure coded as broken signals distribution and structural failure, not strength. ILF's 7.5% 13W return looks impressive until you realize it came with deteriorating breadth and volume confirmation that failed hard filters; INDA at -0.8% 13W is a reset, not a breakdown. India's macro exposure to dollar pressure (-5) and liquidity stress (-5) is identical to Latin America's in aggregate, but India's higher earnings growth and tech exposure survive late-cycle reflation better than commodity-and-value Latin America.
Emerging Markets receives 0% allocation, ranked 10th with a final score of just 5.0. The macro fit of 17.0/100 is the death knell: dollar pressure is active (-14), liquidity stress active (-10), and broad market bear active (-9)—three overlapping headwinds that make emerging markets a crowded short trade rather than a diversification hedge. Even though INDA posted a respectable 69.6/100 technical evidence score and 100/100 timing, the portfolio cannot justify allocating to a category that is being actively squeezed by dollar strength, liquidity withdrawal, and equity bear pressure. INDA's compression setup is genuinely good, but good technicals inside a bad macro regime do not earn capital allocation. Recovery to a 5% position requires meaningful reversal of the dollar pressure descriptor and a reset of the broad market bear flag; until then, emerging market exposure remains off the board.