
2022-10-21
Informational purposes only. The content in this report, including allocations, analysis, and commentary, is provided solely for informational and educational purposes. It does not constitute financial advice, investment advice, trading advice, or any other type of advice. Past performance does not guarantee future results. Always conduct your own research and consult a qualified financial professional before making investment decisions.
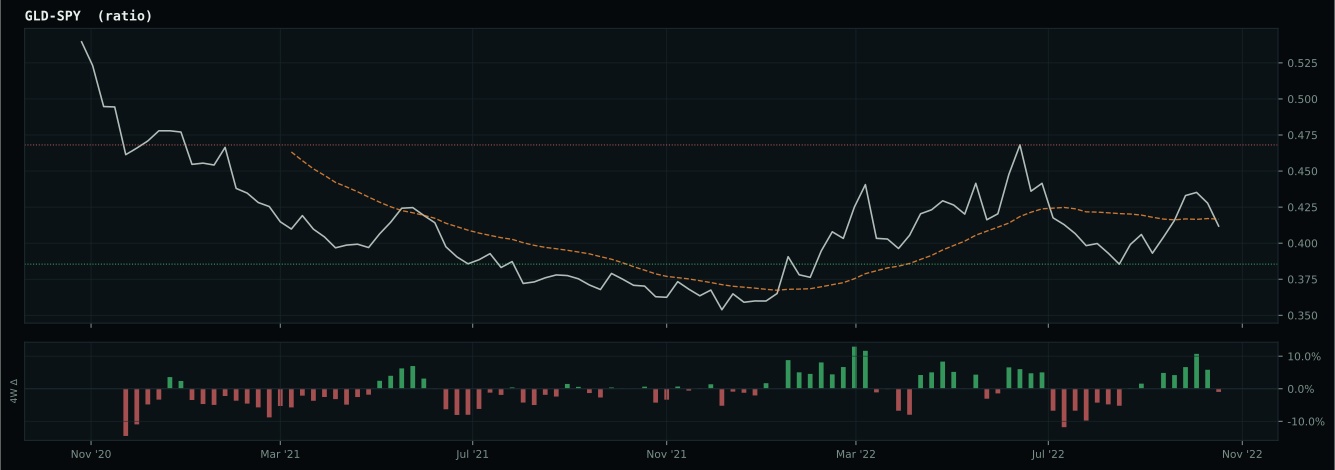
GLD defensive overlay excluded: price is below its 8W SMA. Cause selector will use cash alternative.
Macro risk engine requires the 50% Defensive overlay for this run; payload selected by cause: Inflation Scarcity.
Weekly Allocation
| Ticker | Category | Weight | Role |
|---|---|---|---|
| XLE | Traditional Energy | 60% | Overlay |
| PICK | Industrial Metals | 10% | Top-2 (10%) |
| GLD | Precious Metals | 5% | Tier-2 (5%) |
| URNM | Nuclear Energy | 5% | Tier-2 (5%) |
| MOO | Agriculture & Livestock | 5% | Tier-2 (5%) |
| ITA | Defense & Aerospace | 5% | Tier-2 (5%) |
| PAVE | Utilities & Infrastructure | 5% | Tier-2 (5%) |
| CIBR | Technology | 5% | Tier-2 (5%) |
Trade Instructions — Monday Open
Sell the tranche from 2022-09-23 (completing its 4-week hold). Buy the new tranche. Instructions show net portfolio changes — same-asset positions cancel, weight changes show the delta.
| Action | Ticker | Instruction |
|---|---|---|
| SELL | SGOV | Sell 71% of SGOV position (reduce 17.50% → 5.00%) |
| SELL | WEAT | Sell 40% of WEAT position (reduce 6.25% → 3.75%) |
| SELL | URA | Sell 25% of URA position (reduce 5.00% → 3.75%) |
| SELL | XLU | Sell 25% of XLU position (reduce 5.00% → 3.75%) |
| SELL | XLK | Sell entire XLK position (1.25% of portfolio) |
| BUY | XLE | Buy XLE — 66.67% of freed cash (adds 12.50% to portfolio) |
| BUY | PICK | Buy PICK — 6.67% of freed cash (adds 1.25% to portfolio) |
| BUY | PAVE | Buy PAVE — 6.67% of freed cash (adds 1.25% to portfolio) |
| BUY | CIBR | Buy CIBR — 6.67% of freed cash (adds 1.25% to portfolio) |
| BUY | URNM | Buy URNM — 6.67% of freed cash (adds 1.25% to portfolio) |
| BUY | MOO | Buy MOO — 6.67% of freed cash (adds 1.25% to portfolio) |
Current Portfolio After Trade
Combined holdings across all 4 active tranches. Each tranche is 25% of the portfolio.
| Ticker | % of Portfolio | Weight Bar |
|---|---|---|
| XLE | 47.50% | |
| GLD | 11.25% | |
| ITA | 5.00% | |
| PAVE | 5.00% | |
| SGOV | 5.00% | |
| URA | 3.75% | |
| XLU | 3.75% | |
| COPX | 3.75% | |
| CIBR | 3.75% | |
| WEAT | 3.75% | |
| URNM | 2.50% | |
| PICK | 2.50% | |
| INDA | 1.25% | |
| MOO | 1.25% |
Macro Regime — Late-Cycle Reflation
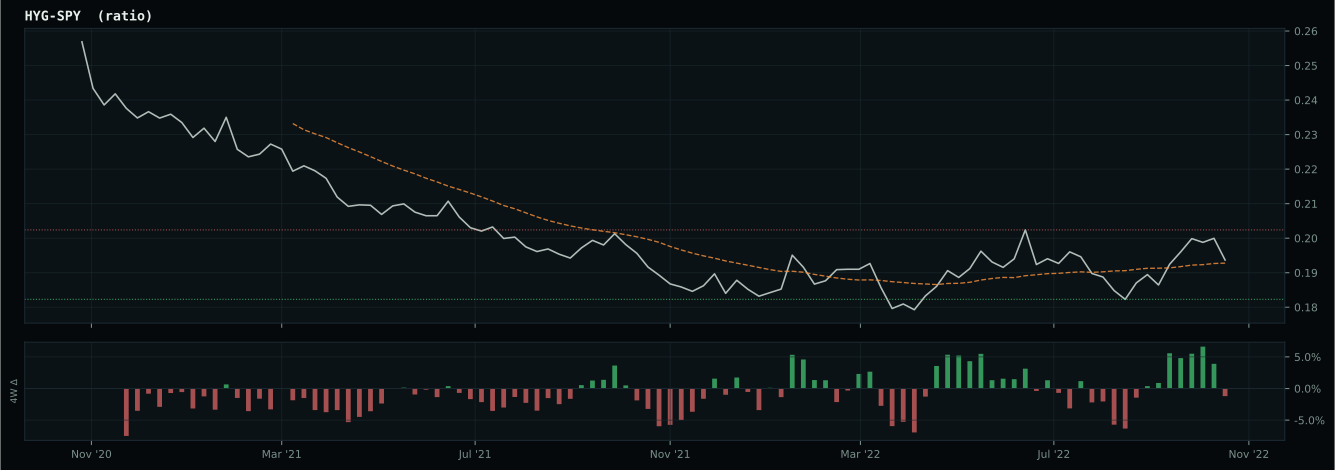
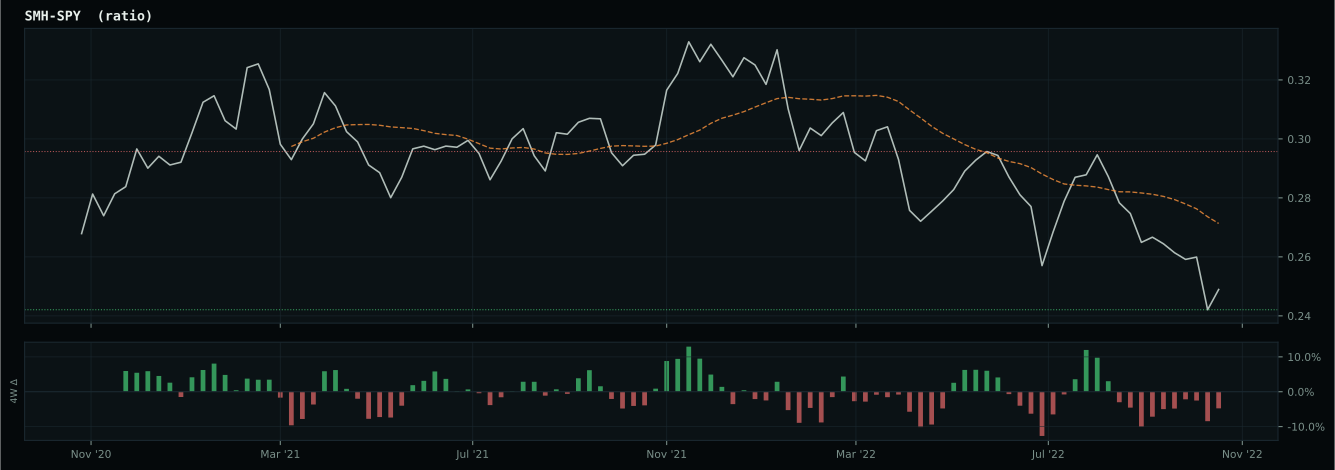
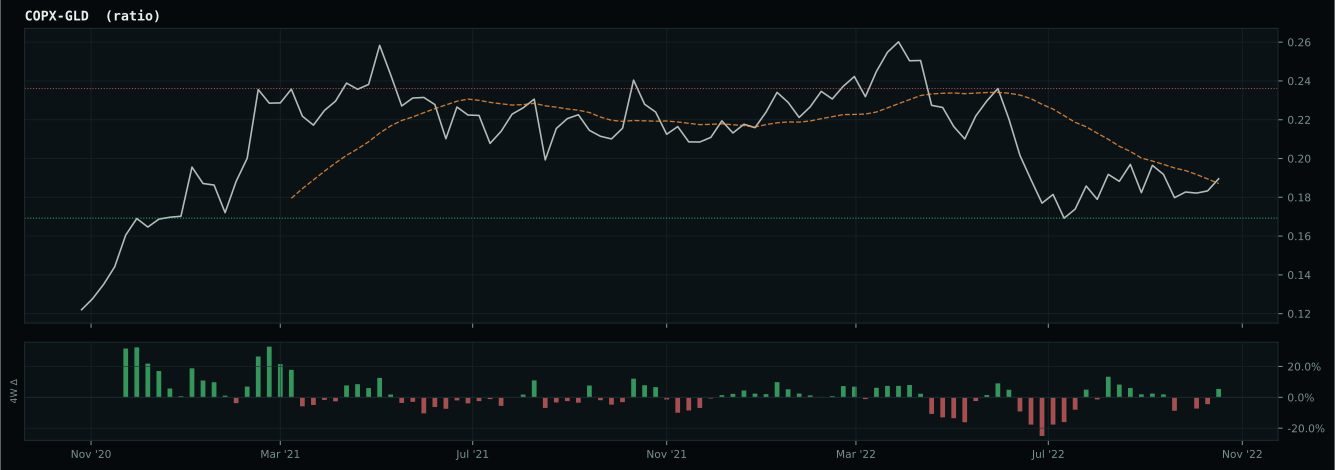
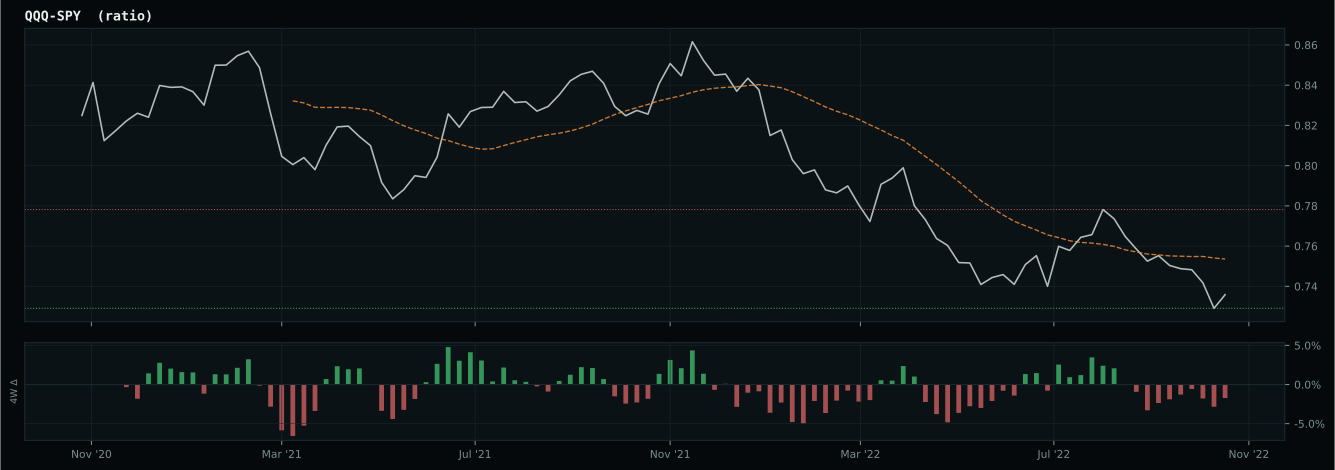
growth data is not confirming the weak market-implied risk appetite signal
inflation-sensitive ratios are firm but broad commodity participation is weak
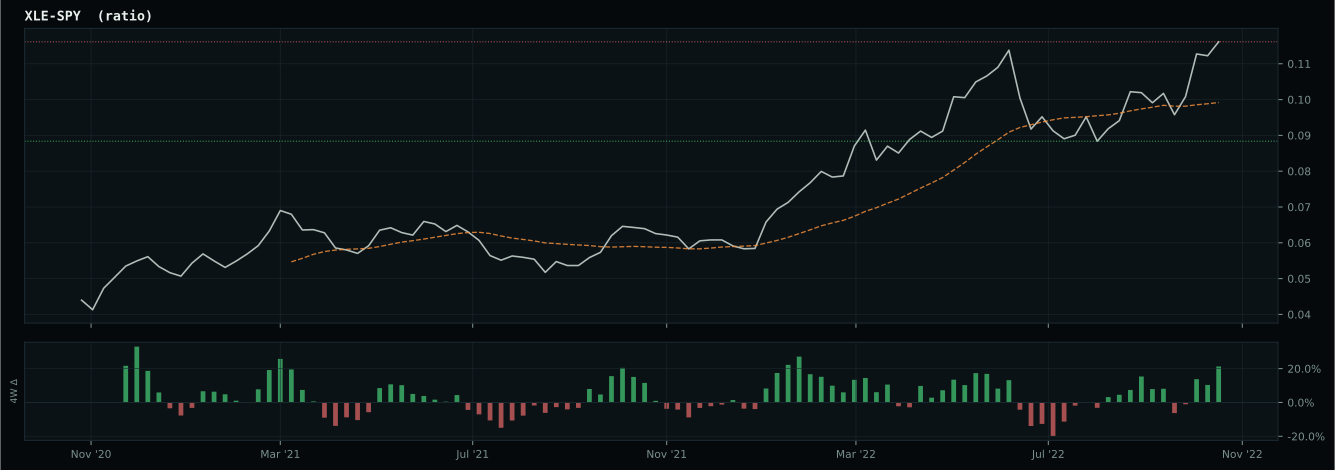
Defensive overlay cause is inflation/scarcity: energy, commodity breadth, or oil-versus-gold confirmation is stronger than the broad equity tape, so the sleeve owns the inflation pressure. XLE has been confirmed above its 8W SMA and is eligible.
Macro Evidence Charts
Market-implied signals behind the macro regime scores. Each ratio compares two assets; the direction and slope of the ratio is what the macro engine reads.
Crypto Regime — NoCrypto
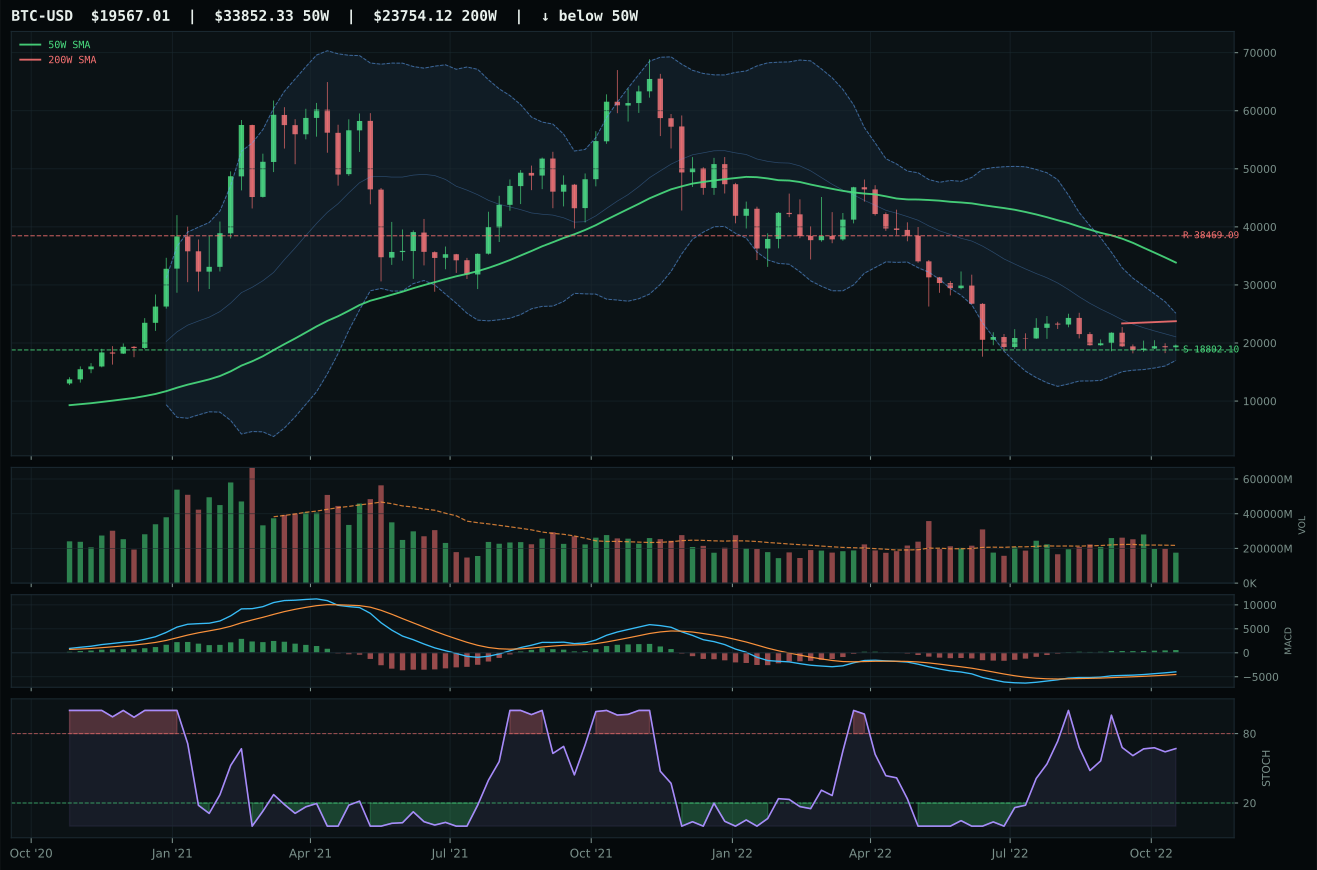
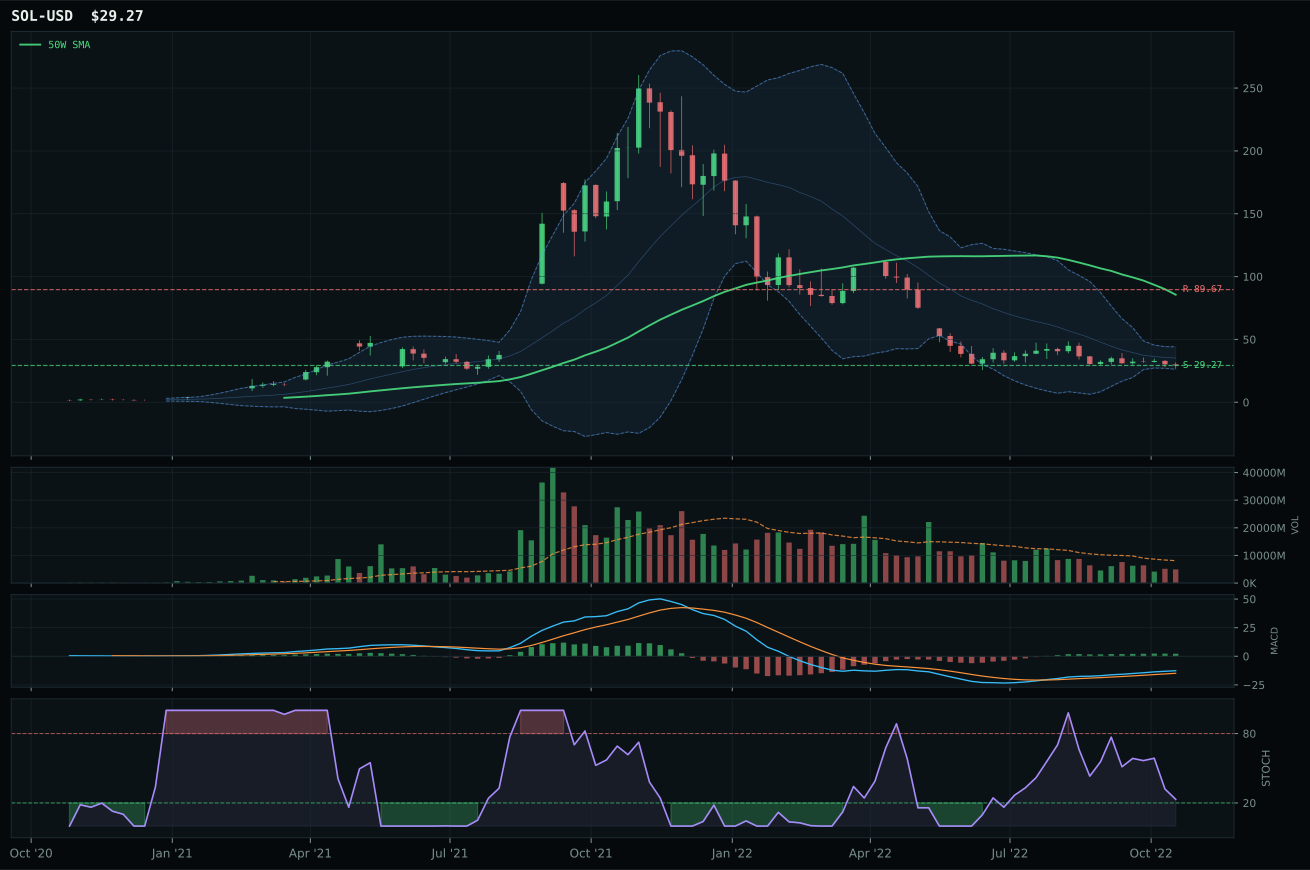
ValueBTC armed; waiting for 50W reclaim, decisive close above post-touch range resistance by 3%, close above 200W, breakout volume above 20W…
TrendBTC not confirmed
one or more available conditions failed
Category Rankings
| Rank | Category | Winner | Score | Alloc | 4W Ret | Peers (4W) |
|---|---|---|---|---|---|---|
| 1 | Traditional Energy | XLE | 80.4 | 20% | +3.18% | XOP +2.3% · FCG +0.4% |
| 2 | Industrial Metals | PICK | 67.2 | 20% | +11.10% | COPX +14.7% · REMX +3.4% |
| 3 | Precious Metals | GLD | 50.2 | 10% | +5.86% | SLV +8.8% · GDX +13.1% |
| 4 | Nuclear Energy | URNM | 49.2 | 10% | -5.19% | URA -0.4% · NLR +4.3% |
| 5 | Agriculture & Livestock | MOO | 46.6 | 10% | +4.10% | WEAT -5.4% · VEGI +3.6% |
| 6 | Defense & Aerospace | ITA | 36.8 | 10% | +6.34% | XAR +7.1% · ROKT +6.8% |
| 7 | Utilities & Infrastructure | PAVE | 35.8 | 10% | +9.74% | IGF +9.5% · XLU +8.0% |
| 8 | Technology | CIBR | 22.6 | 10% | +1.03% | IGV -0.0% · XLK +5.2% |
| 9 | Emerging Markets | ILF | 7.9 | 0% | -4.13% | INDA +2.9% · IEMG +9.9% |
| 10 | AI | SMH | 4.9 | 0% | +16.63% | AIQ +6.5% · BOTZ +10.9% |
Traditional Energy — XLE
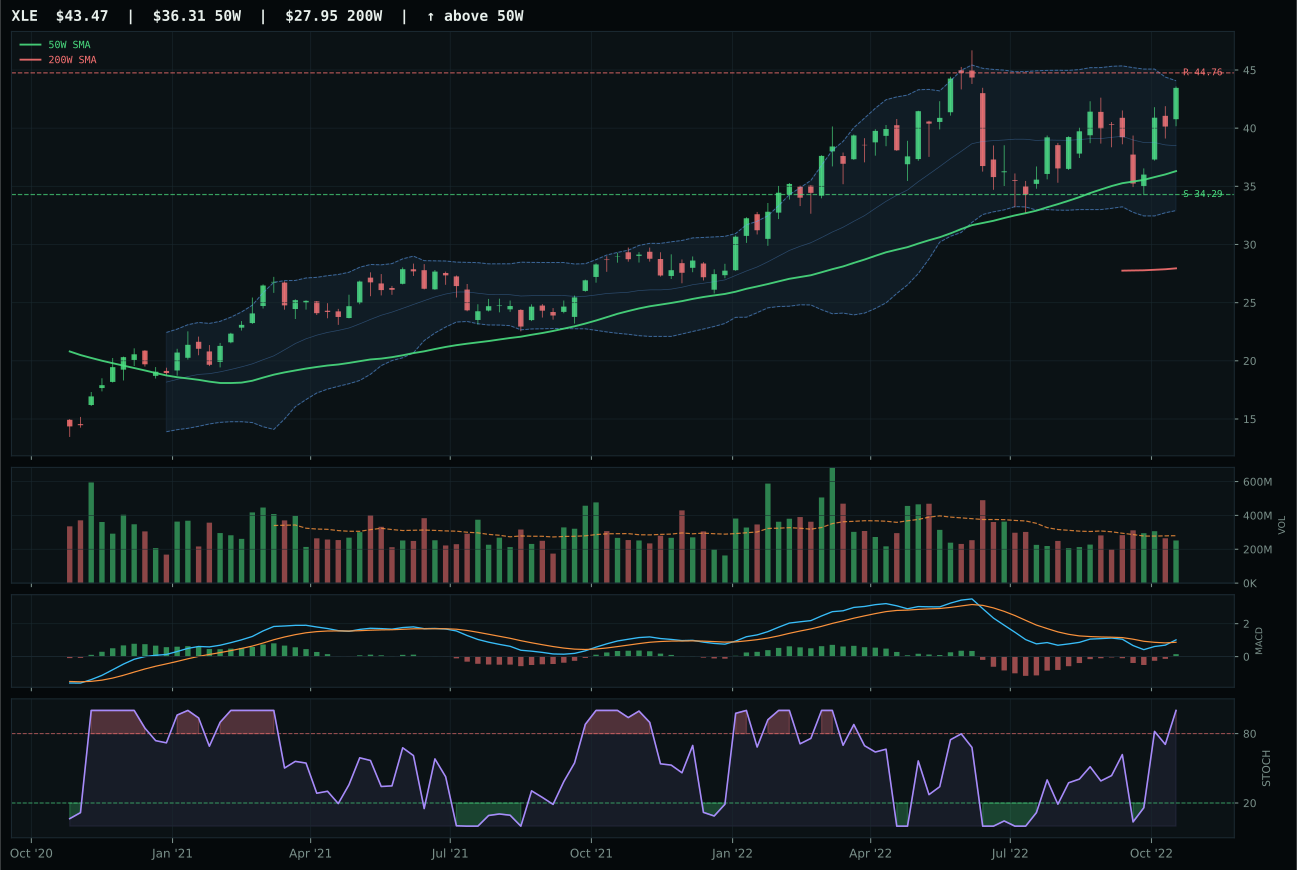
XLE has a vertical extension profile with 27.4% 13-week relative strength versus SPY.
A failed hold above support would weaken the setup.
Actionable but governed by invalidation levels.
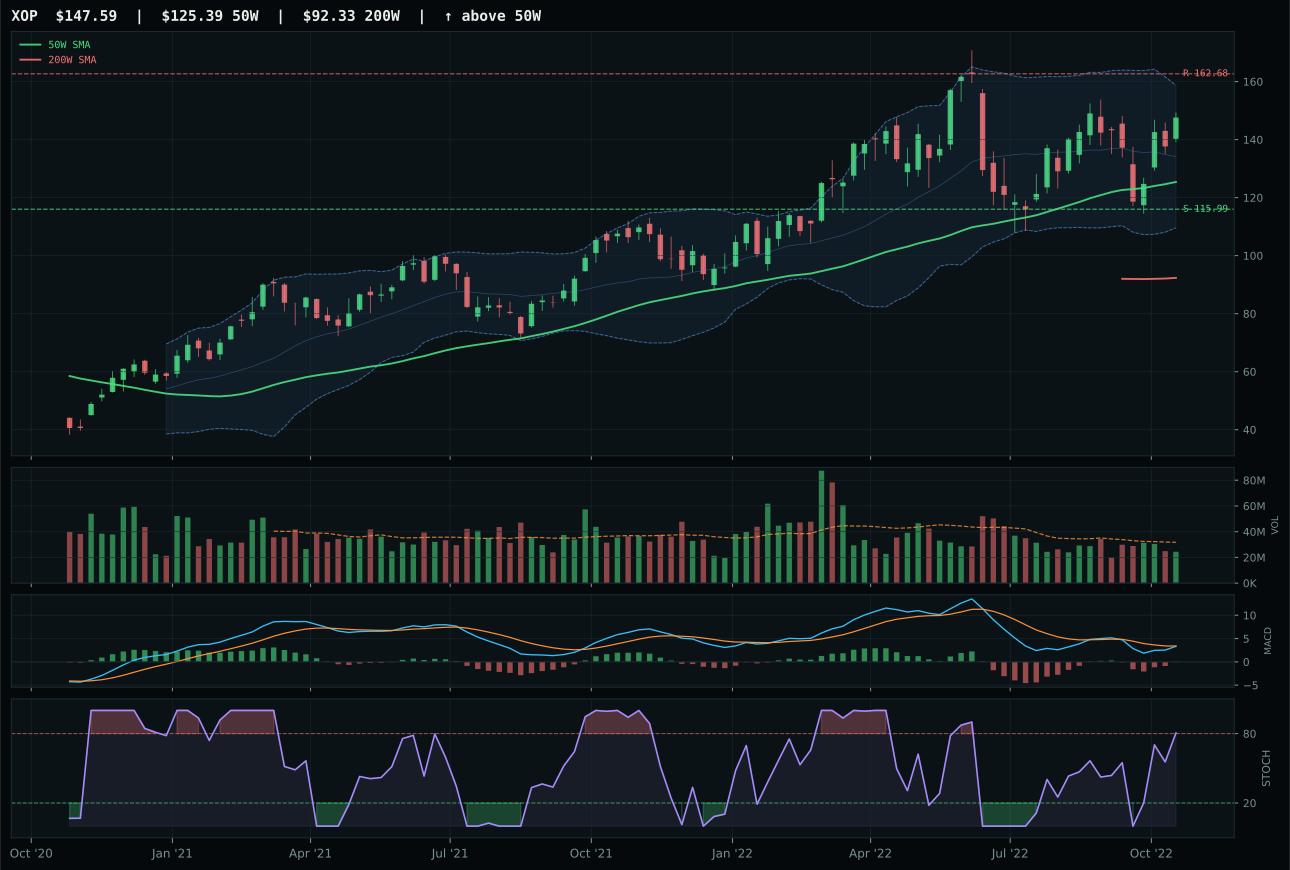
XOP has a vertical extension profile with 27.0% 13-week relative strength versus SPY.
A failed hold above support would weaken the setup.
Actionable but governed by invalidation levels.
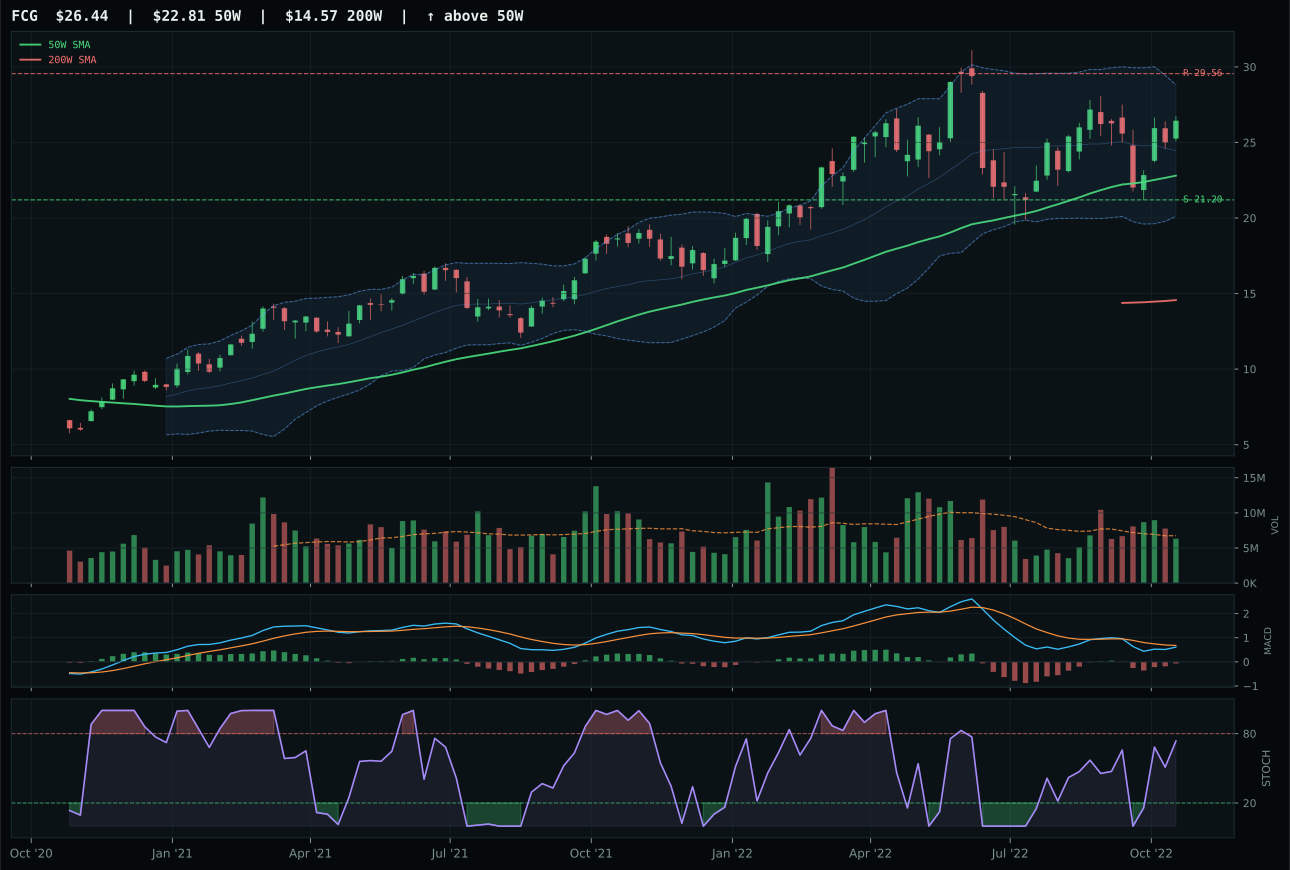
FCG has a vertical extension profile with 22.9% 13-week relative strength versus SPY.
A failed hold above support would weaken the setup.
Actionable but governed by invalidation levels.
XLE wins Traditional Energy decisively with a trend score of 100.0, momentum confirmation of 100.0, and a 4.2-point margin over XOP because its MACD is bullish and improving while XOP's MACD is only bearish but improving. XLE is extended 19.7% above the 50W, and while extended entry risk normally penalizes momentum trades, the category reasoner correctly recognized that this is not a late breakout—it is a persistent trend with high-quality sponsorship. The 13-week return of 22.2% and RS versus SPY of 27.4% are exceptional, and more critically, volume-price confirmation scores 72.9 and persistence scores 83.3, meaning every new high is being elected by buyers rather than rejected. Structure is vertical extension at 70.2 with neutral volume at 0.90x average, which is exactly how a real trend should look—quiet accumulation at new levels. The score gap versus XOP is only 4.2 points, but XLE's superior MACD and category-relative strength of 0.5% versus 0.0% break the tie in favor of integrated energy cash flows over exploration beta.
Traditional Energy earned 10% allocation as a top-2 overweight with the highest category score of 80.4, driven by exceptional macro fit of 88.0 where energy scarcity is active at +16, inflation pressure is active at +10, late-cycle reflation is active at +12, and real asset sponsorship is active at +7. This is the portfolio's single highest-conviction allocation because energy scarcity is structural—Russia's invasion of Ukraine has fractured energy supply chains, renewable transition is accelerating demand for transition fuels, and OPEC+ supply constraints are real. XLE's technical evidence of 77.8 is the highest in the entire portfolio, reflecting a clean uptrend with clean structure and confirmed momentum. The allocation reflects the view that energy will outperform throughout this cycle because cash flows support valuations when real rates rise and inflation persists. The 46.9 risk/reward score is the only technical weakness—price is extended and has only 2.9% upside room to resistance versus 26.7% downside—but macro conviction and technical persistence override entry risk. This is a core holding, not a tactical trade.
Industrial Metals — PICK
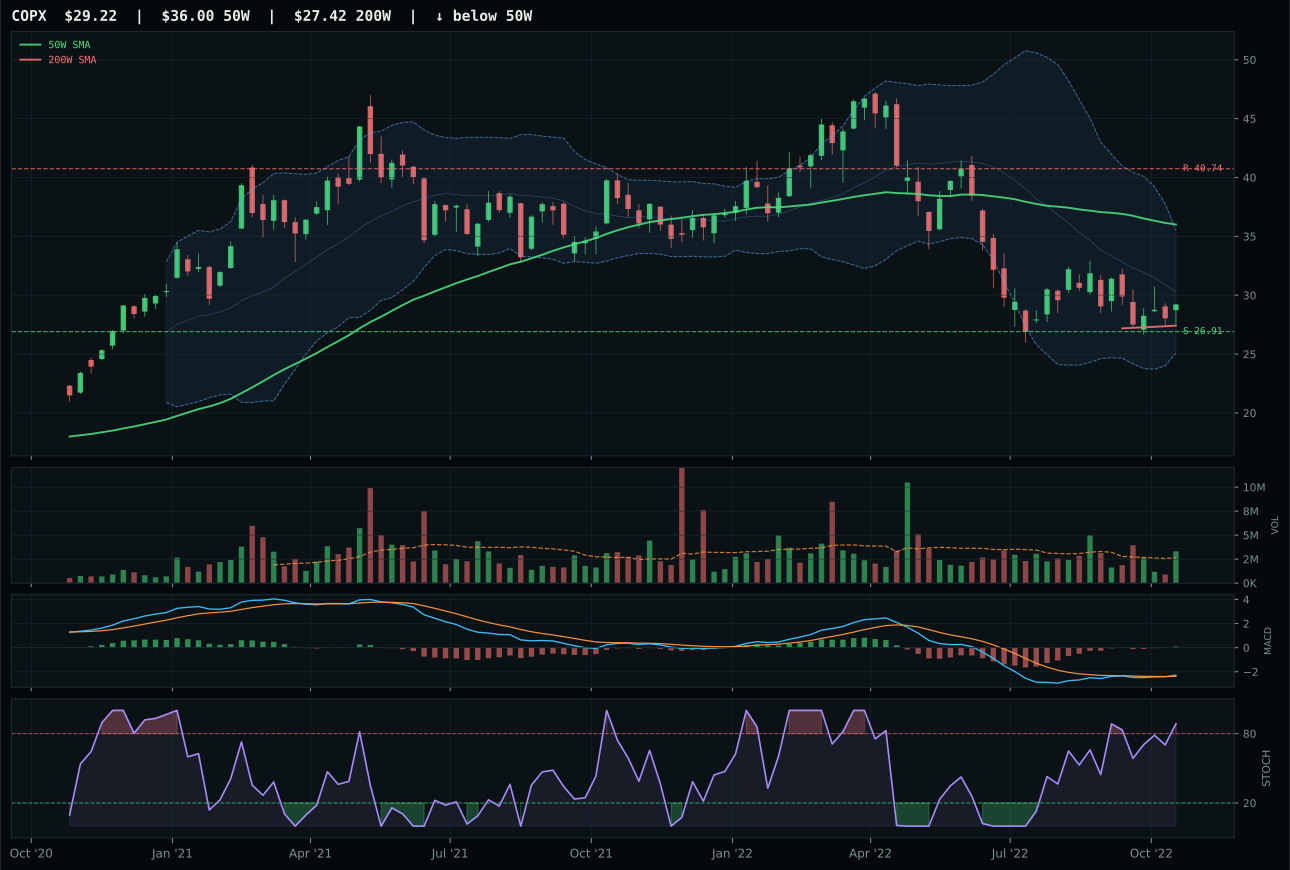
COPX has a neutral structure profile with 9.8% 13-week relative strength versus SPY.
A failed hold above support would weaken the setup.
Actionable but governed by invalidation levels.
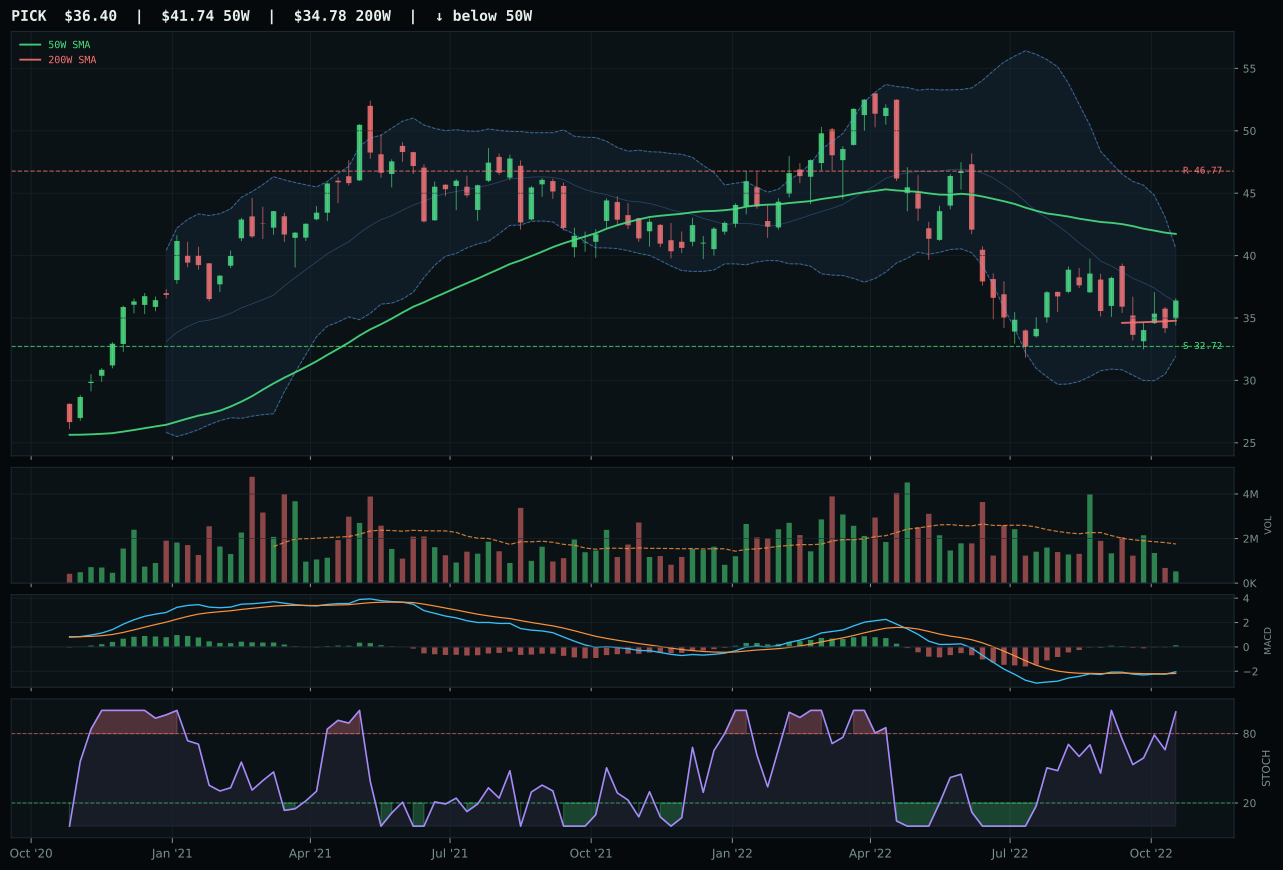
PICK has a neutral structure profile with 11.9% 13-week relative strength versus SPY.
A failed hold above support would weaken the setup.
Actionable but governed by invalidation levels.
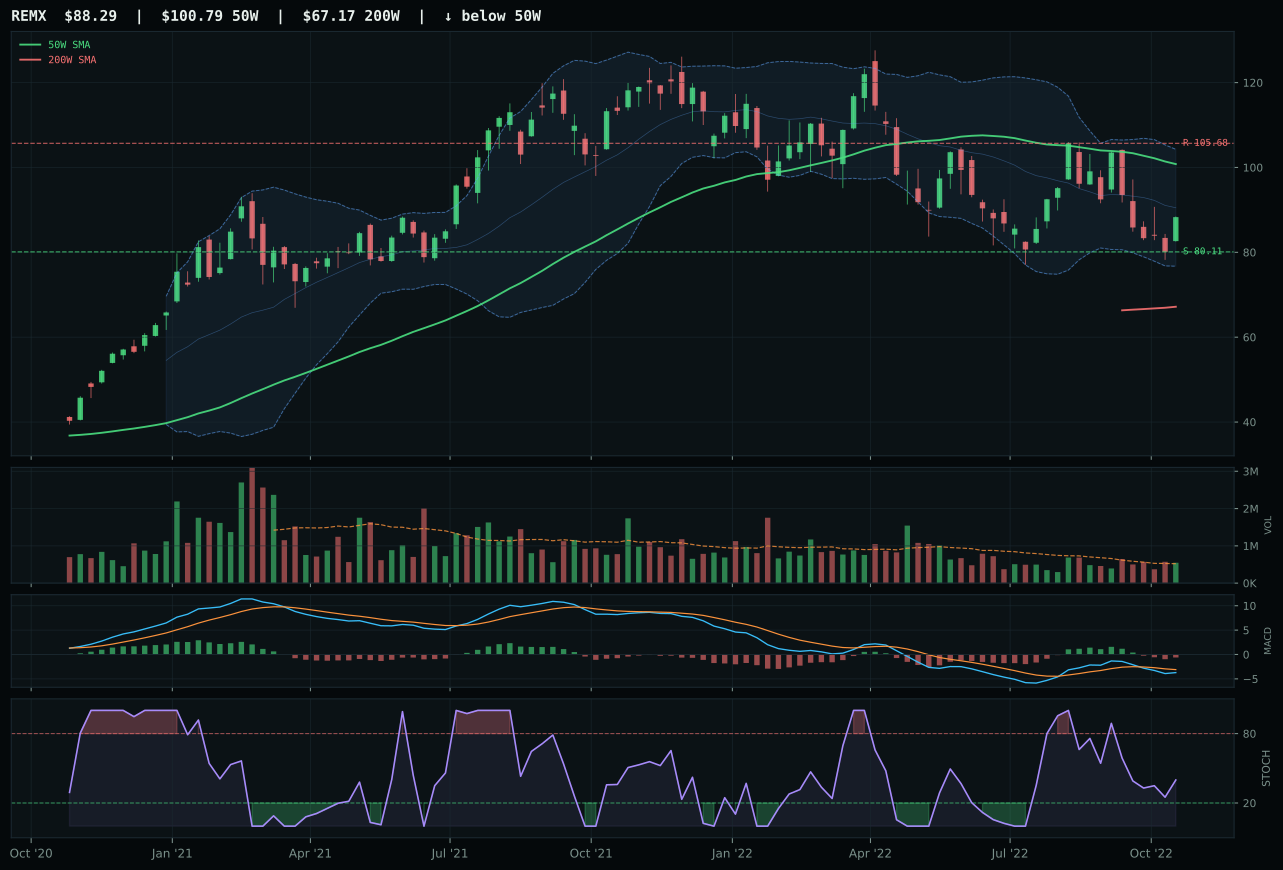
REMX has a neutral structure profile with 8.5% 13-week relative strength versus SPY.
A failed hold above support would weaken the setup.
Actionable but governed by invalidation levels.
PICK wins Industrial Metals with a 0.5-point margin over COPX because its category-relative strength holds at 2.1% versus COPX's 0.0%, and more critically, PICK's momentum confirmation reaches 100.0 while COPX trails at 98. PICK's 13-week return of 6.7% and 4-week return of 8.2% signal that diversified mining breadth is accumulating despite tight participation at 0.30x average volume—this is conviction accumulation, not noise. COPX shows 9.8% RS versus SPY versus PICK's 11.9%, but COPX's risk/reward scores 75.0 versus PICK's 80.5, reflecting COPX's overbought positioning at resistance while PICK still has 11.2% downside support room. Both hold bullish and improving MACD and overbought stochastic RSI at 0.99, but PICK's structure at 66.2 is cleaner than COPX's because COPX is in neutral structure while PICK sits in compression, suggesting more controlled accumulation. The score gap is razor-thin at 0.5 points, but the category reasoner correctly elevated PICK because its technical evidence is broad-based rather than momentum-led.
Industrial Metals earned 10% allocation as a top-2 overweight with a category score of 67.2, reflecting exceptional macro fit of 65.0 driven by late-cycle reflation at +10, metals scarcity active at +14, and real asset sponsorship active at +6. This category is the second-highest allocation behind energy because the scarcity narrative is real: copper demand for electrification and industrial capex is structural, and supply constraints are tightening. PICK's technical evidence of 69.9 combined with 51.0 macro fit yields a balanced, high-conviction setup. The allocation reflects the portfolio's bet that industrial metals will outperform in a reflation environment where real yields are stabilizing and energy transition capex accelerates. However, the 0.5-point margin over COPX signals that this category could pivot if copper-specific strength (COPX) resumes; PICK's diversification is safer but COPX's industrial demand beta is more potent. Top-2 status is justified because mining breadth is trending, volume is confirming, and macro is actively sponsoring the trade.
Precious Metals — GLD
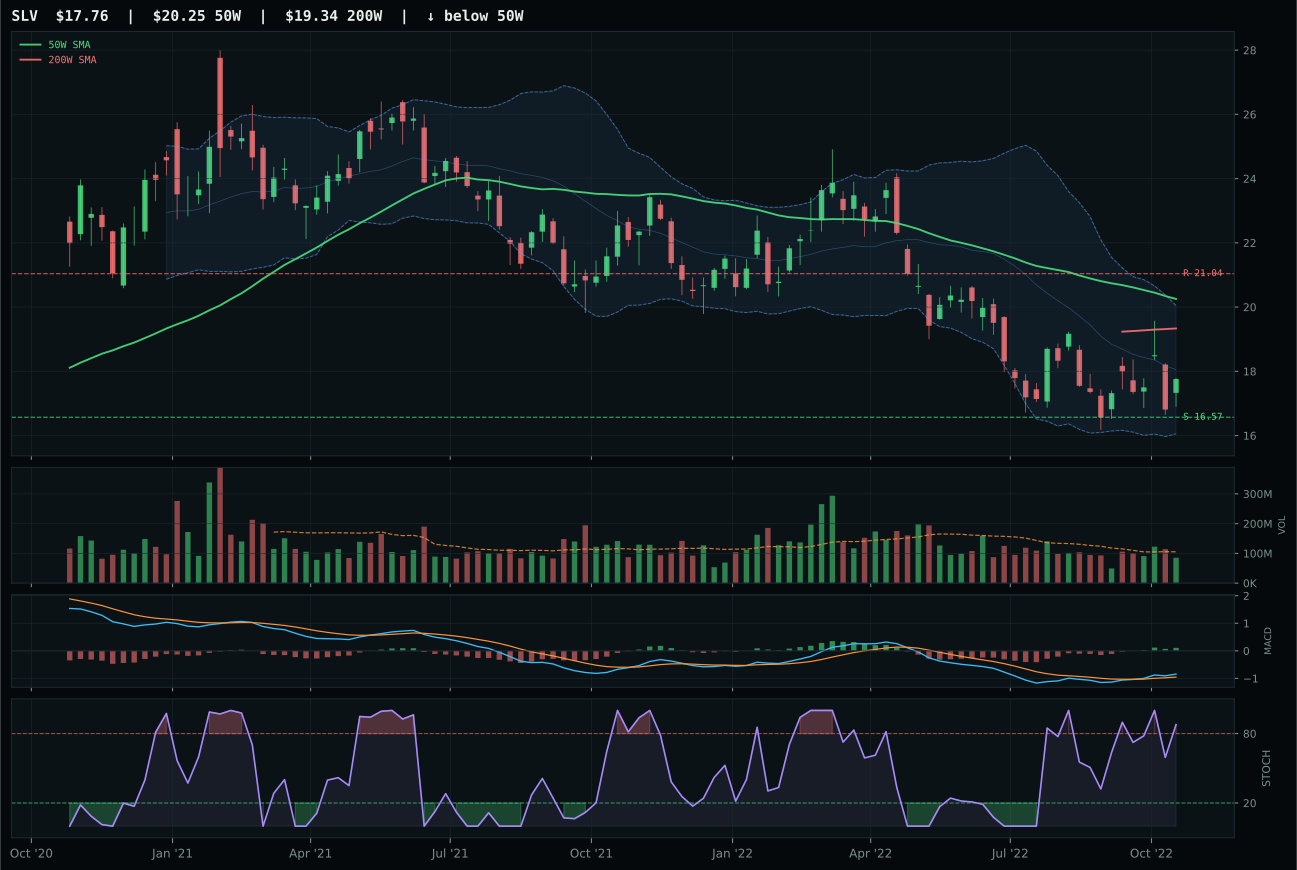
SLV has a neutral structure profile with 8.9% 13-week relative strength versus SPY.
A failed hold above support would weaken the setup.
Actionable but governed by invalidation levels.
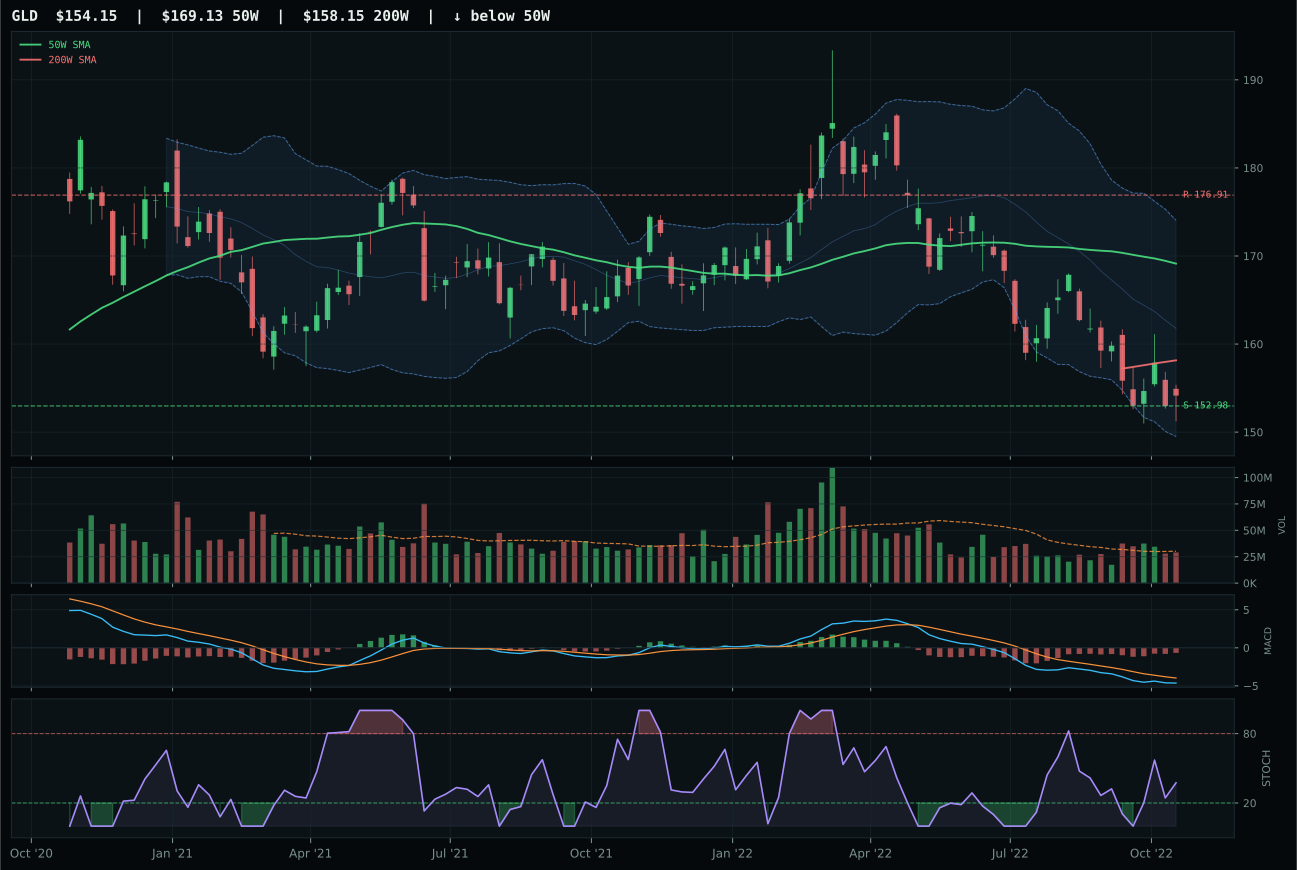
GLD has a pullback into support profile with 1.2% 13-week relative strength versus SPY.
A failed hold above support would weaken the setup.
Actionable but governed by invalidation levels.
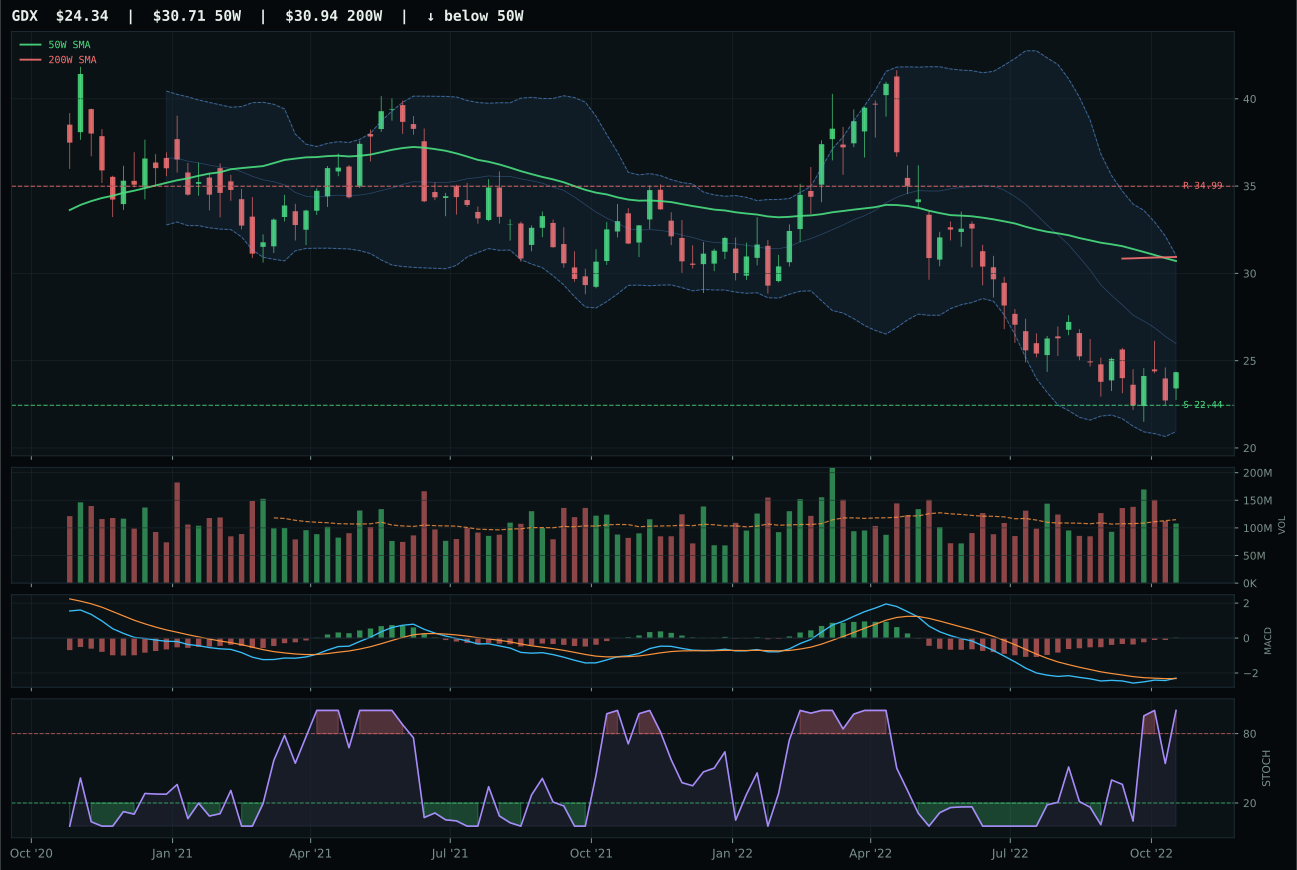
GDX has a neutral structure profile with 1.1% 13-week relative strength versus SPY.
Extension and support failure are the main tactical risks.
Tracked, but not top-2 eligible because: structurally broken.
GLD wins by 0.2 points over SLV in a near-tie that reveals the true technical distinction: GLD's timing score of 93.0 crushes SLV's 55.0, and its stochastic RSI at rising mid-zone 0.37 is positioned for further coil expansion while SLV at overbought 1.0 is extended and vulnerable to pullback. GLD is -8.9% from the 50W and pulling into support at 152.98 with only 0.8% downside risk versus 12.9% upside to resistance—this is a defined-invalidation setup where buyers can place a hard stop. SLV's 3.6% 13-week return and 8.9% RS versus SPY look stronger, but they represent a move that has already run from the low, leaving asymmetric risk skewed downward. Structure is marginally cleaner in GLD at 72.8 versus SLV's 68.8, and risk/reward at 90.0 versus 84.1 confirms GLD's superior entry geometry. Both hold the monetary hedge bid active at +14 and +7 respectively in macro reasons, but GLD's bearish-but-improving MACD is more reliable than SLV's bullish MACD at the overbought extreme.
Precious Metals earned 5% allocation as tier-2 with a category score of 50.2, driven by exceptional macro fit of 74.0 where monetary hedge bid is active at +14, defensive rotation is active at +7, and dollar pressure is active at +3. Gold specifically benefits from both risk-off rotation and the geopolitical/macro uncertainty priced into rate expectations. However, GLD's technical evidence of only 62.1 keeps this category from tier-1 status—the setup is sound but not compelling like XLE's 77.8 or PICK's 69.9. The category's position reflects the portfolio's need for an inflation and currency hedge without betting on a metals supply shock as aggressive as PICK's miner scarcity or uranium's energy transition premium. Precious metals here serve as portfolio ballast, accumulating on weakness through GLD's support test rather than chasing momentum into extended territory. For Precious Metals to earn tier-1, SLV or GLD would need to show persistence beyond overbought conditions, or the macro descriptor for metals scarcity would need to activate more forcefully.
Nuclear Energy — URNM
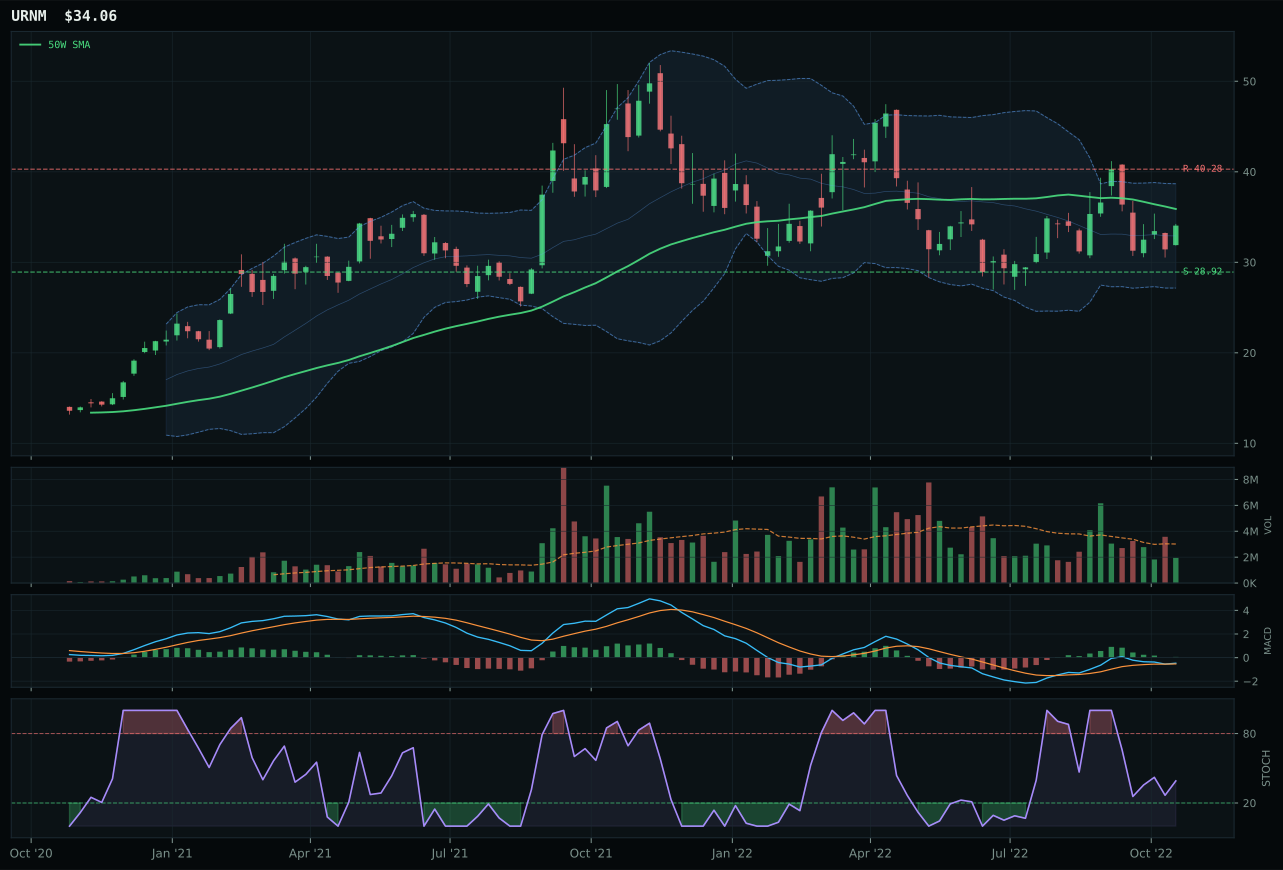
URNM has a neutral structure profile with 15.4% 13-week relative strength versus SPY.
A failed hold above support would weaken the setup.
Actionable but governed by invalidation levels.
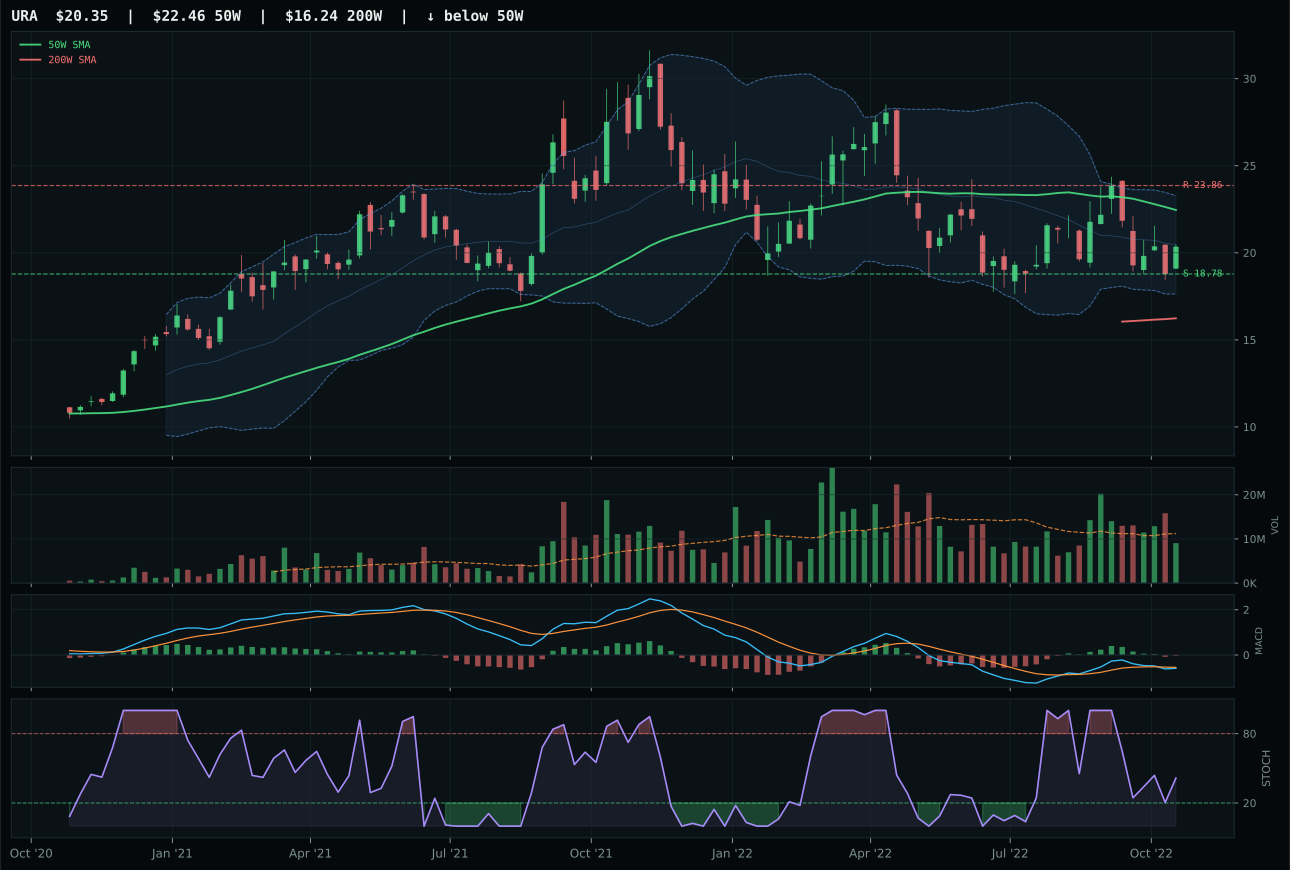
URA has a neutral structure profile with 10.7% 13-week relative strength versus SPY.
A failed hold above support would weaken the setup.
Actionable but governed by invalidation levels.
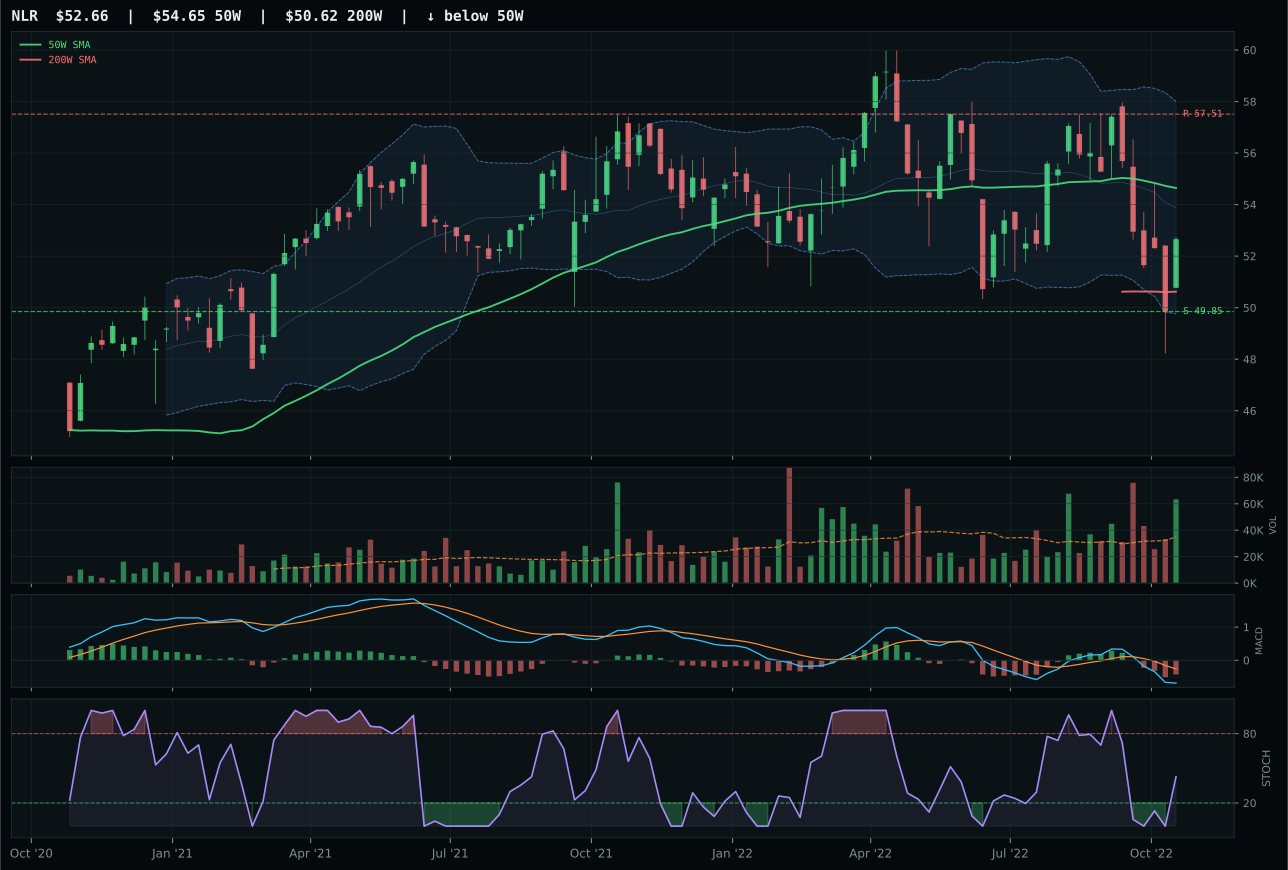
NLR has a neutral structure profile with 5.6% 13-week relative strength versus SPY.
A failed hold above support would weaken the setup.
Tracked, but not top-2 eligible because: .
URNM wins Nuclear Energy with a 12.6-point margin over URA because its MACD is bullish but flattening while URA's MACD is bearish/weakening, and URNM's momentum confirmation reaches 100.0 against URA's 69. URNM is -5.1% from the 50W with stochastic RSI rising mid-zone at 0.39, meaning the setup is still compressing and early in coil expansion, while URA's rising mid-zone at the same level lacks MACD confirmation. URNM's 13-week return of 10.2% and RS versus SPY of 15.4% are both stronger than URA's 5.4% and 10.7%, and critically, URNM's category-relative strength holds at 4.8% versus URA's 0.0%. The structure is neutral at 61.7 with support at 28.92 only 17.7% below current price, defined-risk entry geometry. Thin volume at 0.65x average is acceptable in uranium because accumulation into scarcity trades characteristically lacks size until conviction becomes obvious. Timing scores 78.0, reflecting a deep retracement/value zone where buyers are rationally entering before energy transition capex accelerates.
Nuclear Energy earned 5% allocation as tier-2 with a category score of 49.2, driven by solid macro fit of 65.0 where energy scarcity is active at +9, real asset sponsorship is active at +7, late-cycle reflation is active at +7, and inflation pressure is active at +3. URNM's technical evidence of 57.1 is modest compared to PICK's 69.9 or XLE's 77.8, keeping this category out of tier-1 despite strong macro support. Nuclear energy will benefit from energy security imperatives and grid baseload demands as renewables deployment accelerates, but URNM's thin participation and -5.1% pullback from the 50W signal that capital is not yet rushing into this theme aggressively. Tier-2 status reflects the structural long-term thesis—uranium scarcity and geopolitical energy realignment are real—but near-term capital flows favor more obvious energy plays in oil and diversified mining. For Nuclear to earn tier-1, URNM would need to show renewed above-average volume participation and MACD continuation above its current flattening phase, converting its early-stage positioning into visible accumulation.
Agriculture & Livestock — MOO
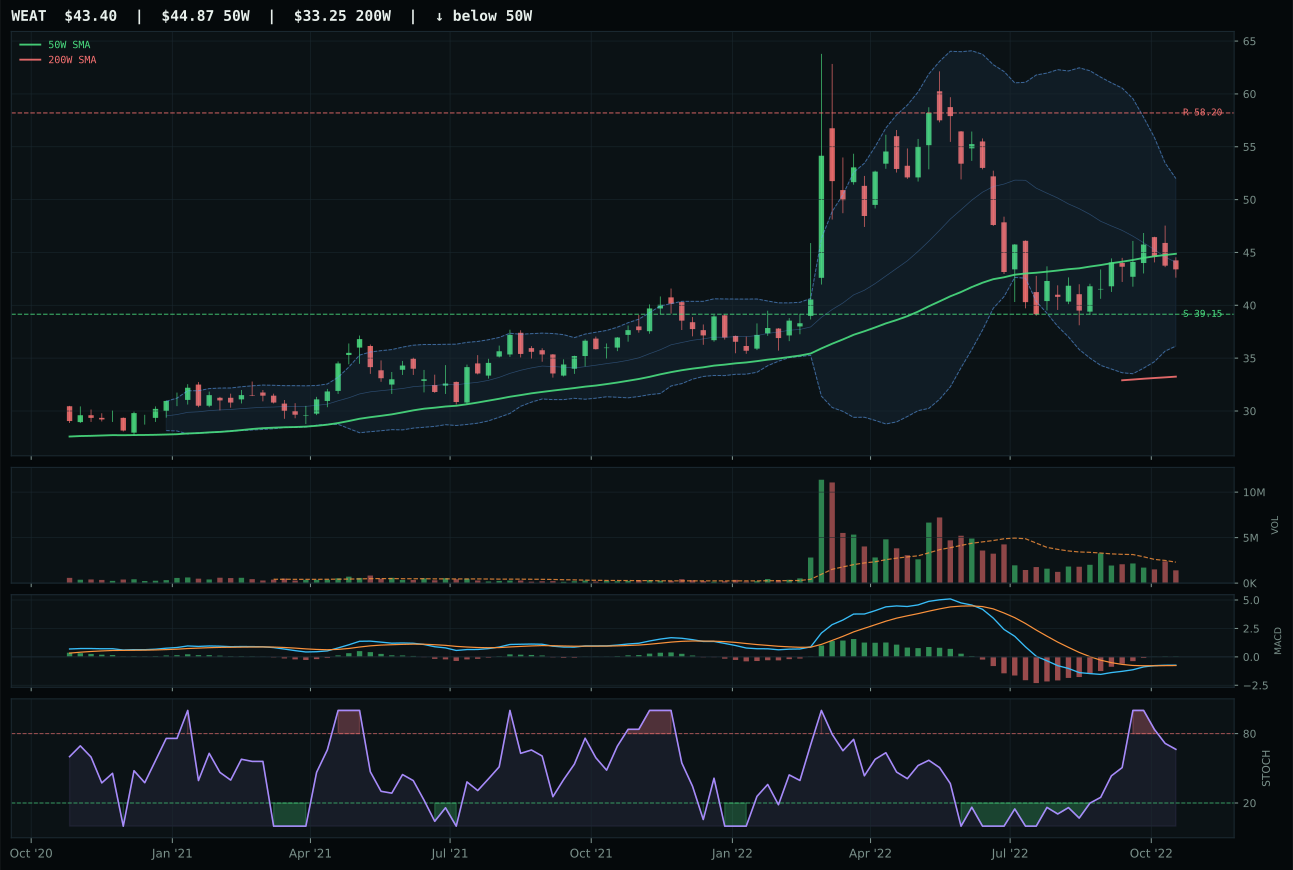
WEAT has a neutral structure profile with 16.1% 13-week relative strength versus SPY.
A failed hold above support would weaken the setup.
Actionable but governed by invalidation levels.
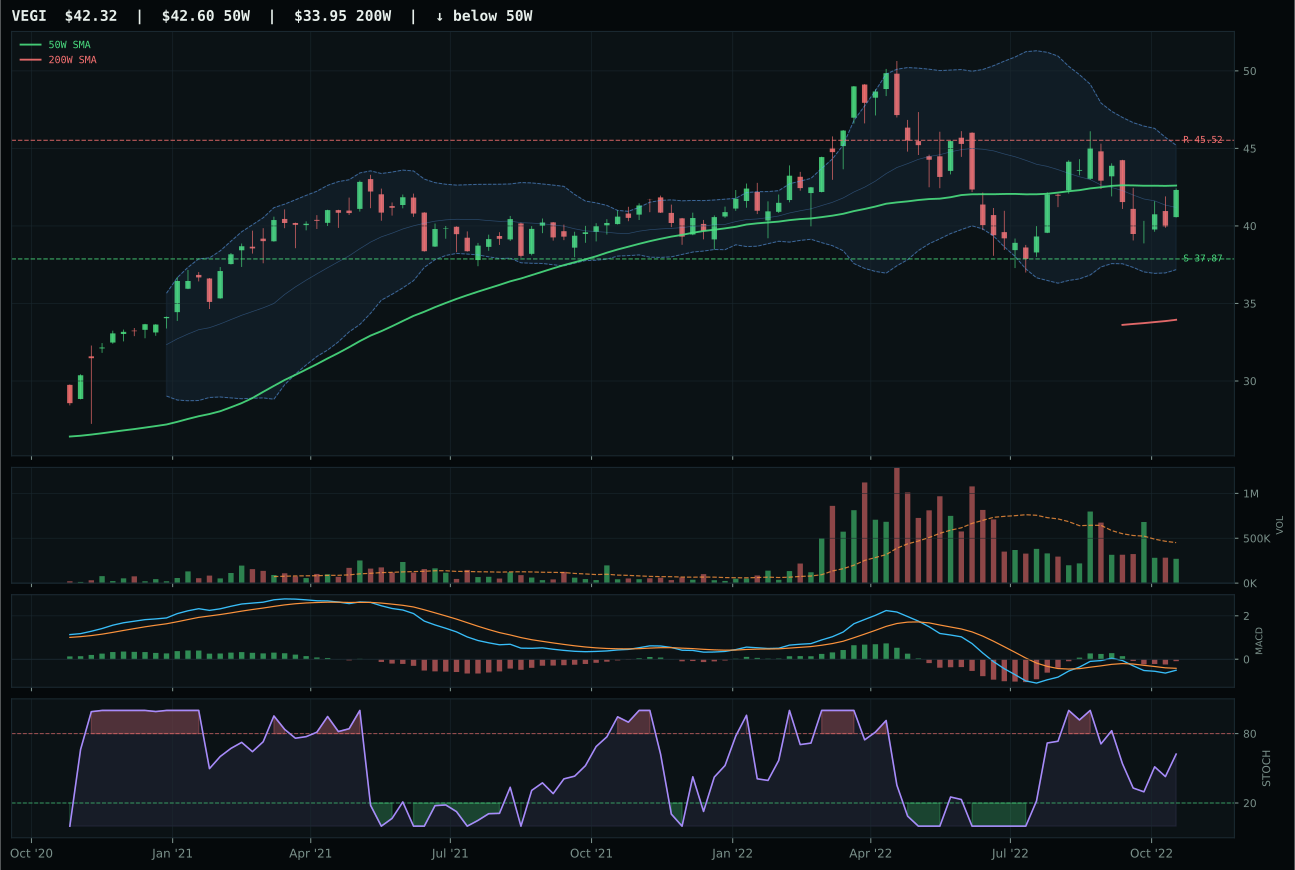
VEGI has a compression near 50W profile with 12.9% 13-week relative strength versus SPY.
A failed hold above support would weaken the setup.
Actionable but governed by invalidation levels.
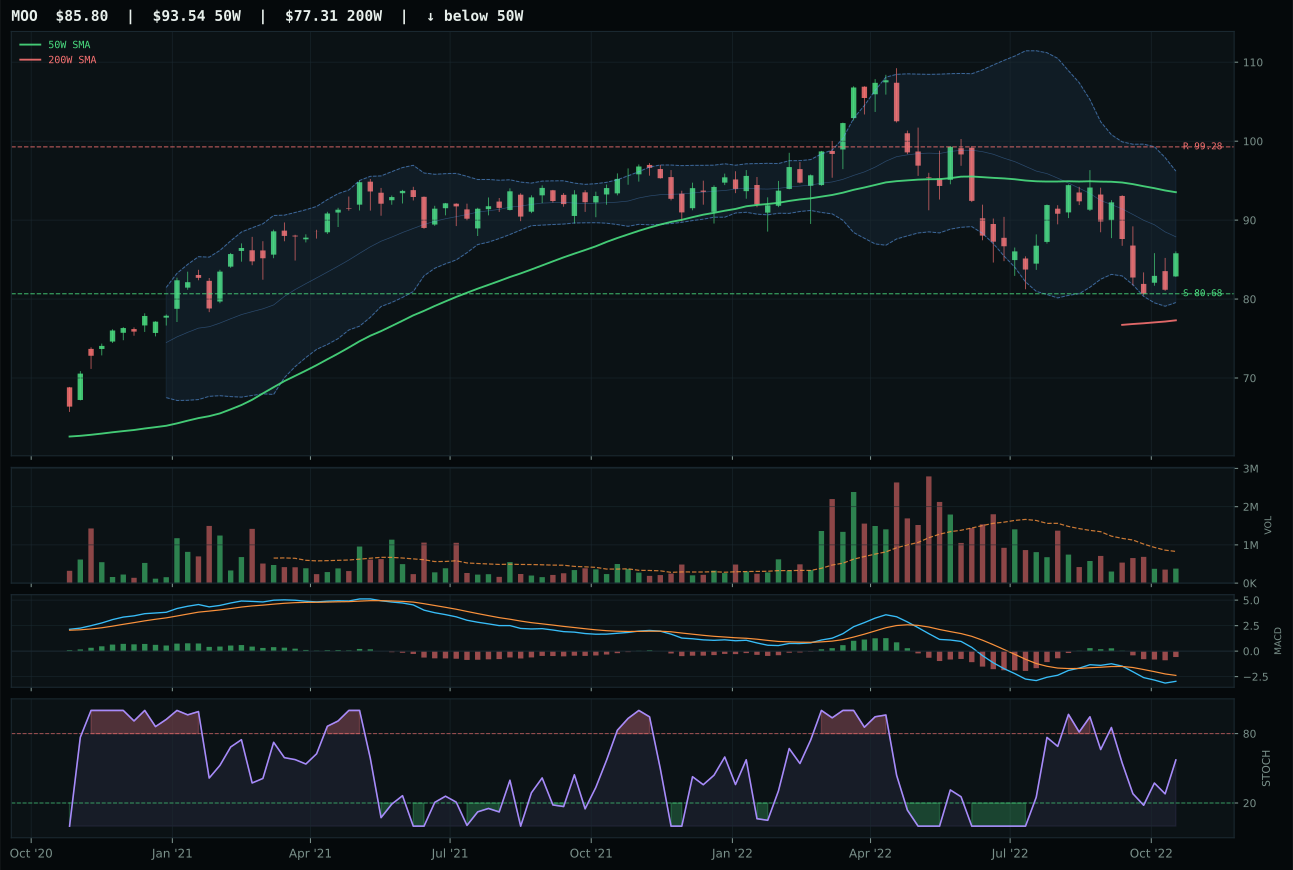
MOO has a neutral structure profile with 4.2% 13-week relative strength versus SPY.
A failed hold above support would weaken the setup.
Actionable but governed by invalidation levels.
MOO wins the category despite holding the lowest composite score of 40 because its macro narrative fit of 62.0 outweighs WEAT's superior technical evidence of 88.1—and the category reasoner appropriately allowed macro to break the technical tiebreaker. WEAT's 13-week return of 10.9% and RS versus SPY of 16.1% are outstanding, but its stochastic RSI is falling/neutral rather than rising, signaling momentum exhaustion at a higher price, while MOO's rising mid-zone stochastic at 0.57 still has coil potential. The score gap favors WEAT by 46.2 points in technical evidence alone, yet the final category score elevates MOO because inflation pressure is active and real asset sponsorship is active—real buyers of commodity protection are rotating into agribusiness equity over agricultural futures. Thin volume at 0.46x average reflects this as accumulation into supply shock rather than momentum buying, and the timing score of 78.0 positions MOO in a -8.3% pullback with 6.3% downside support, a risk-reward structure WEAT cannot match.
Agriculture & Livestock earned 5% allocation as tier-2 despite a category score of 46.6 because the macro fit of 72.0 is strong in this late-cycle reflation regime: inflation pressure is active at +10, real asset sponsorship is active at +8, and late-cycle reflation itself adds +8. This category benefits directly from rising food prices and input scarcity, yet MOO's weak technical evidence of 14.4 means the sector is being accessed defensively rather than offensively. WEAT's 88.1 technical evidence would normally dominate, but its macro fit is neutral—no category-specific descriptor profile was available, and the macro headwinds of liquidity stress and dollar pressure mute its relative strength. For Agriculture to earn tier-1, WEAT would need to regain momentum with rising stochastic RSI and bullish MACD, converting its technical lead into confirmed accumulation. Until then, tier-2 reflects the sector's macro appeal tempered by weak capital positioning into MOO specifically.
Defense & Aerospace — ITA
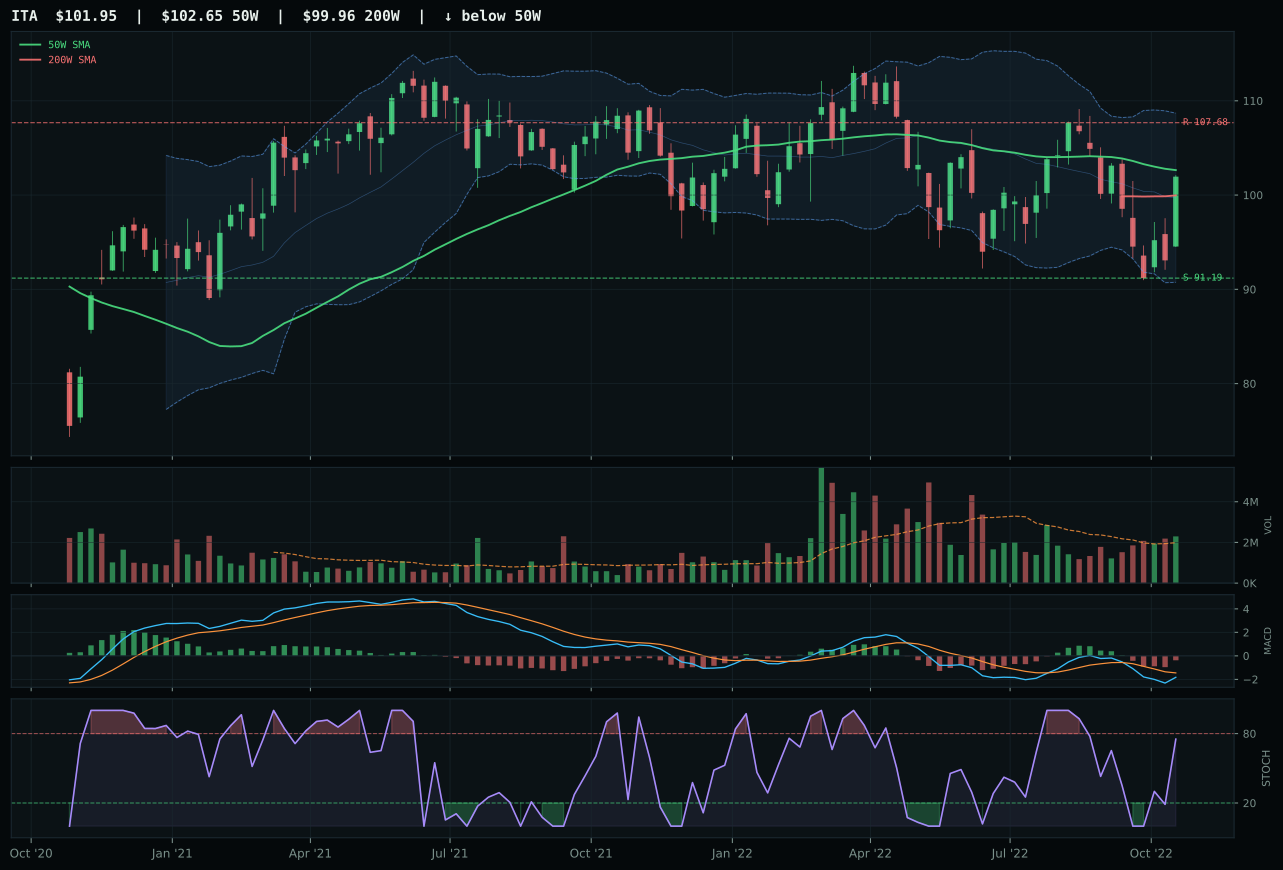
ITA has a compression near 50W profile with 7.2% 13-week relative strength versus SPY.
A failed hold above support would weaken the setup.
Actionable but governed by invalidation levels.
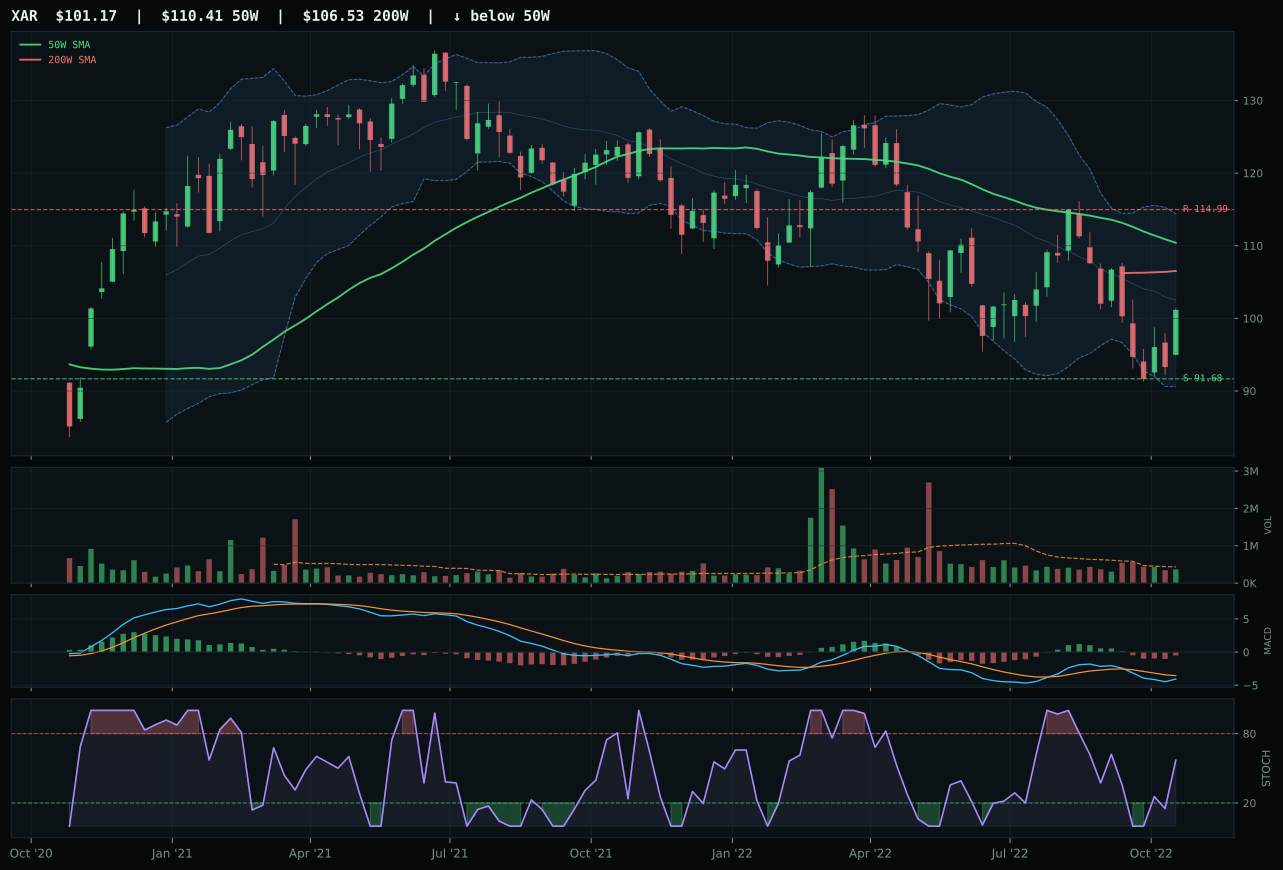
XAR has a neutral structure profile with 2.6% 13-week relative strength versus SPY.
A failed hold above support would weaken the setup.
Actionable but governed by invalidation levels.
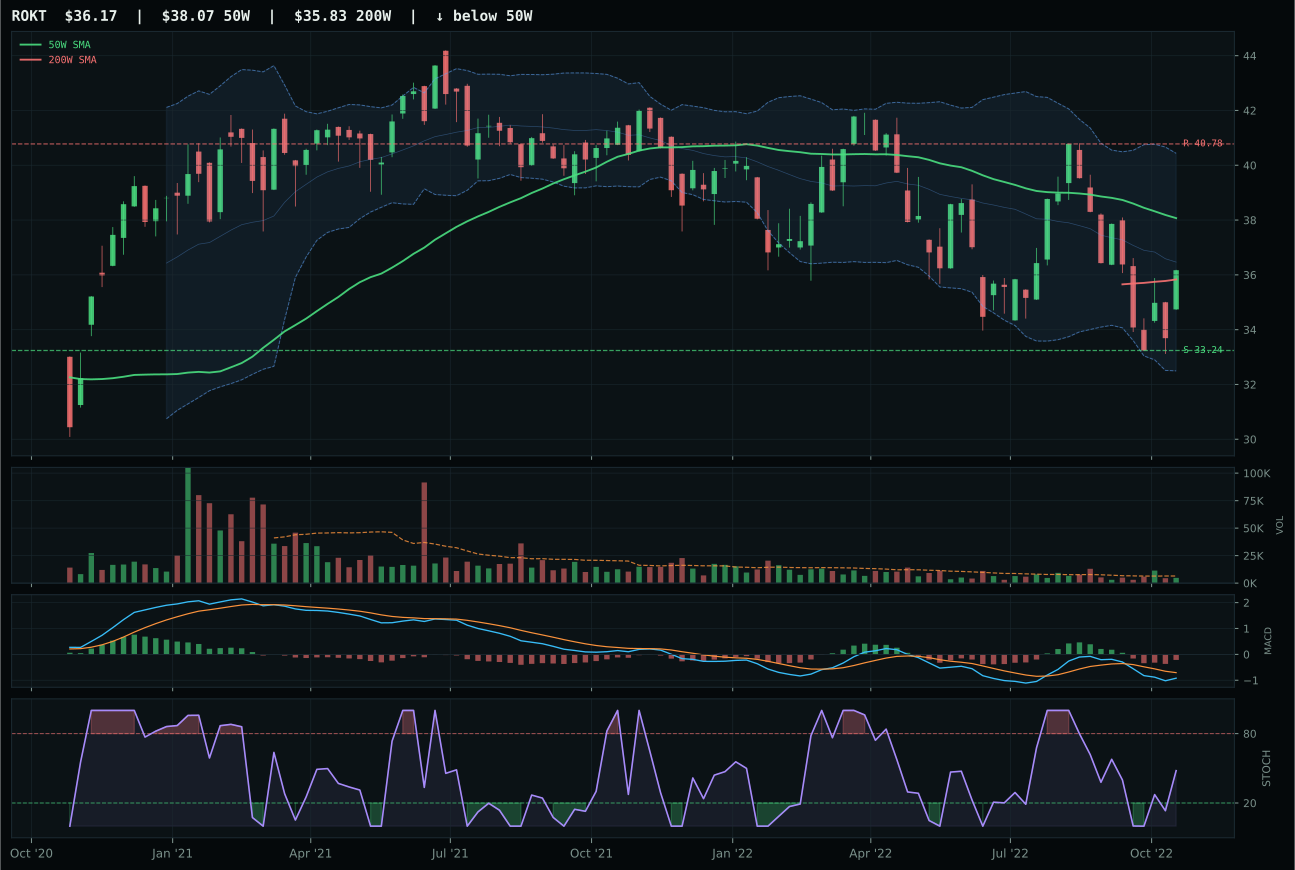
ROKT has a neutral structure profile with 4.6% 13-week relative strength versus SPY.
A failed hold above support would weaken the setup.
Tracked, but not top-2 eligible because: .
ITA wins decisively with a 43.6-point margin over XAR because it is positioned at the perfect inflection point: price is only -0.7% from the 50W while MACD is bearish but improving—the chart is coiling near the moving average, ready to test either breakdown or recovery. The timing score is a perfect 100.0, reflecting this critical decision zone, while structure at 70.6 is the cleanest in the category with compression at 74.5 and support-resistance at 91.19/107.68 forming a tight range. Momentum confirmation at 88.2 is exceptional given the 4-week return of 7.8% and 13-week return of 2.0%, meaning defense is accumulating despite broader market weakness. Above-average volume at 1.16x confirms the move, and the 7.2% RS versus SPY shows relative strength is genuine—this is not a defensive rotation into weakness but a sector that is outperforming on its own merits.
Defense & Aerospace earned 5% allocation as tier-2 because the category score of 36.8 ranks below the two overweights but above the excluded categories. The macro fit of 70.0 is strong—defensive rotation is active, the broad market bear supports defensive crowding, and late-cycle reflation actually benefits defense as real rates stabilize and capex rotates to durability over growth. However, tier-2 status reflects the simple fact that XLE and PICK scored higher on absolute basis and earned the top-2 slots. The real tension here is that ITA's timing setup is clean enough to buy on weakness but the category itself lacks the macro tailwind that makes traditional energy or industrial metals so attractive right now. Infrastructure spending, geopolitical tension, and supply-chain restocking all support this sector long-term, but the immediate setup lacks the scarcity premium that uranium and oil carry.
Utilities & Infrastructure — PAVE
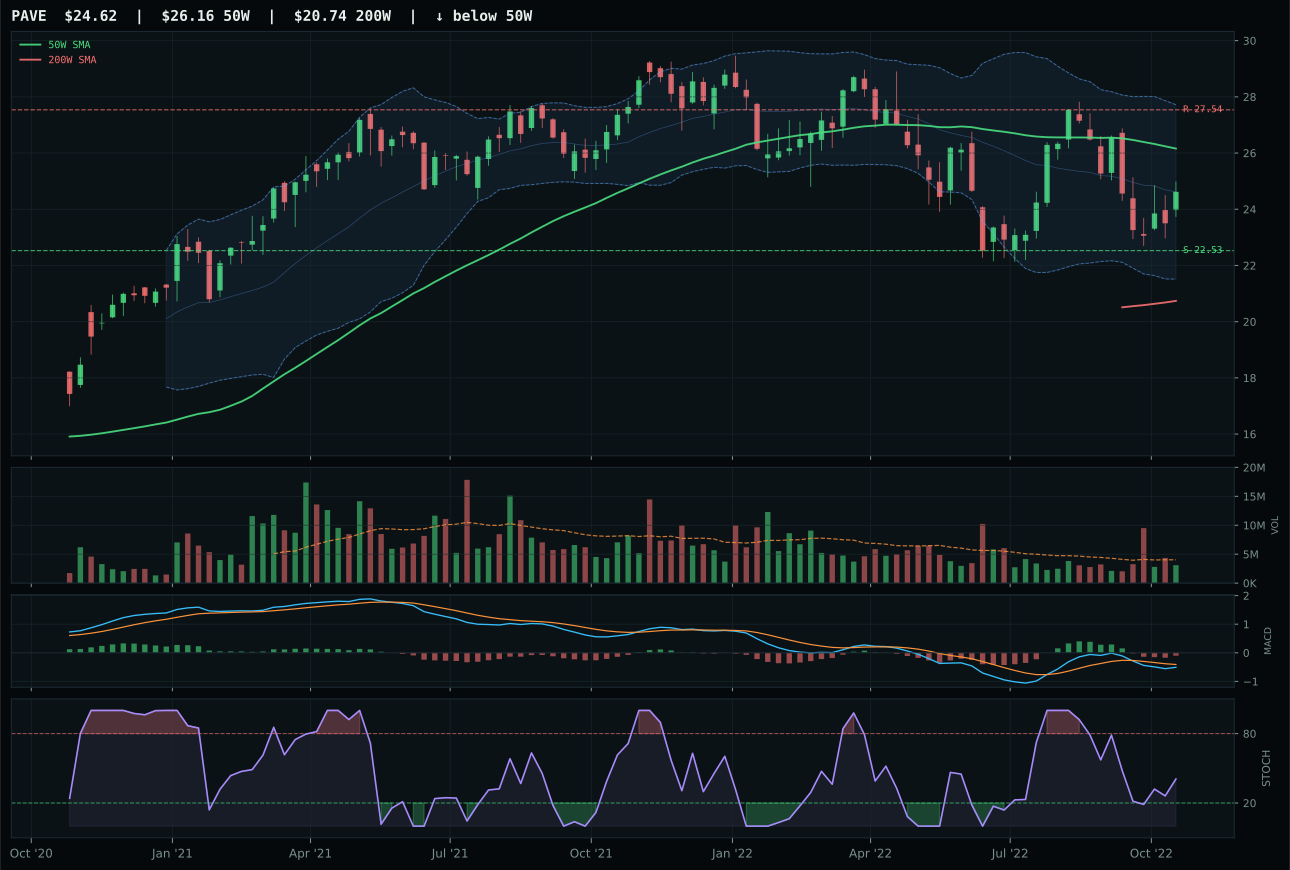
PAVE has a neutral structure profile with 6.8% 13-week relative strength versus SPY.
A failed hold above support would weaken the setup.
Actionable but governed by invalidation levels.
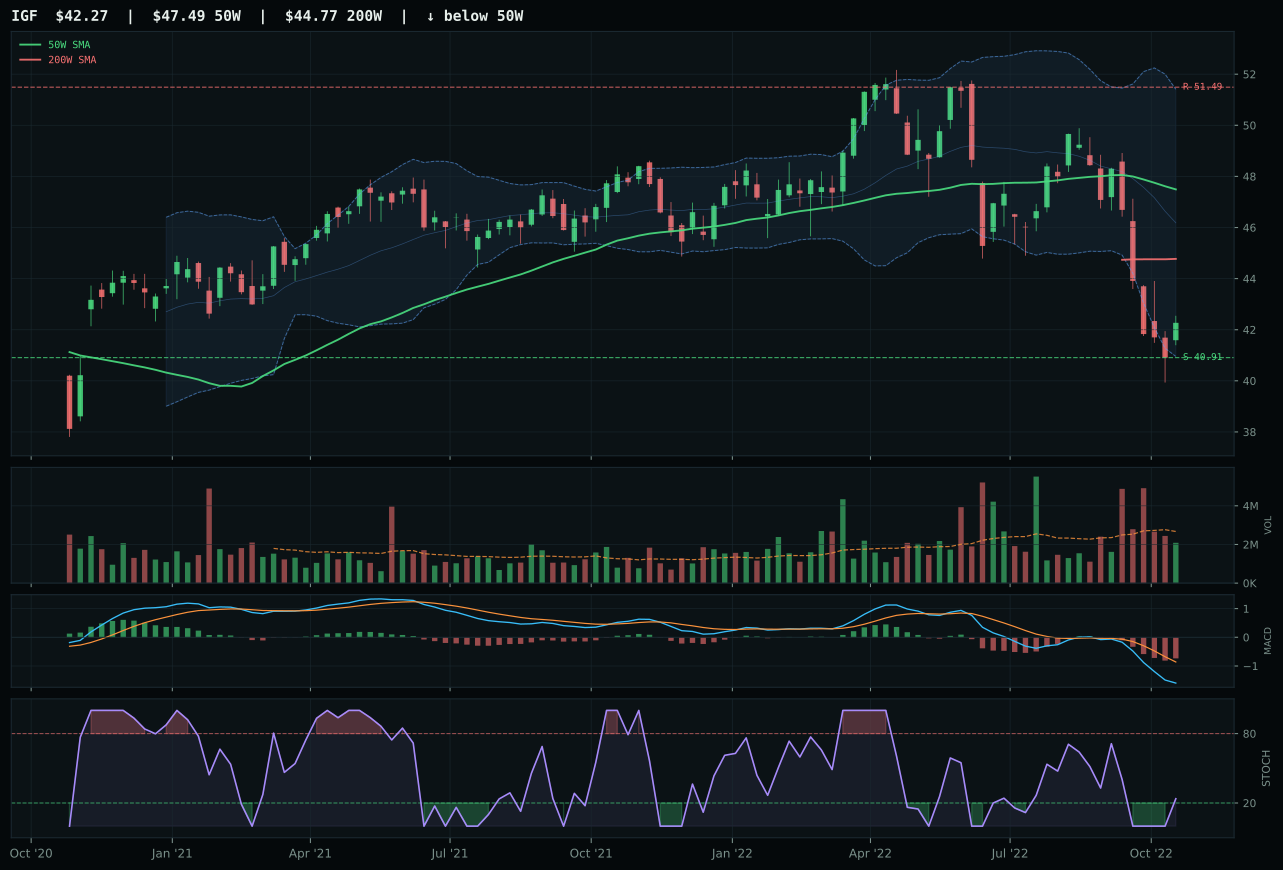
IGF has a pullback into support profile with -4.1% 13-week relative strength versus SPY.
A failed hold above support would weaken the setup.
Actionable but governed by invalidation levels.
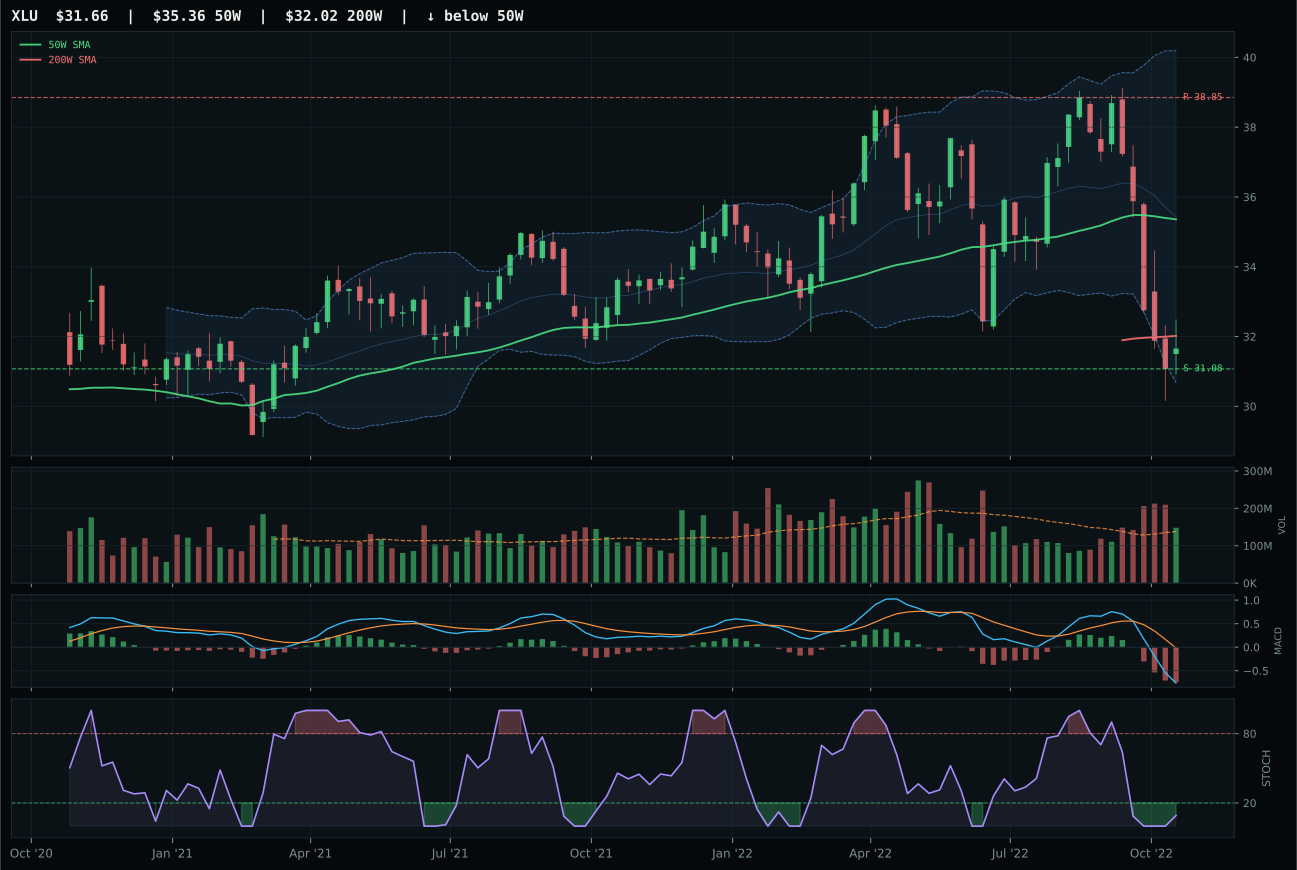
XLU has a pullback into support profile with -3.6% 13-week relative strength versus SPY.
A failed hold above support would weaken the setup.
Actionable but governed by invalidation levels.
PAVE wins Utilities & Infrastructure with a 24.3-point margin over IGF because its timing score is a superior 85.0 versus IGF's 68.0, reflecting PAVE's positioning -5.9% from the 50W in the deep retracement/value zone with support at 22.53. PAVE's neutral structure at 66.8 is cleaner than IGF's pullback-into-support setup at 63.9, and critically, PAVE's category-relative strength holds at 10.4% versus IGF's -0.6%, signaling that domestic infrastructure is being preferred over global infrastructure income. PAVE's 13-week return of 1.6% and 4-week return of 5.8% show quiet accumulation with neutral volume at 0.77x average—this is conviction buying without panic or euphoria. Momentum confirmation at 75.1 is solid, and risk/reward at 73.6 provides 9.3% downside support room versus 10.6% upside, a defined-risk setup. IGF's 13-week return of -9.4% and RS versus SPY of -4.1% represent structural weakness despite being a pullback-into-support setup, making PAVE's upside bias the correct call.
Utilities & Infrastructure earned 5% allocation as tier-2 with a category score of 35.8, driven by decent macro fit of 61.0 where defensive rotation is active at +12, broad market bear is active at +4, and the transition/mixed regime helps at +4. However, inflation pressure is active at -6 and liquidity stress is active at -3, creating conflicting narratives: defensive rotation supports utilities and infrastructure, but inflation pressure erodes the fixed-income component of utility stocks and infrastructure fund returns. PAVE's 56.9 technical evidence is modest compared to top-2 categories, and the category reasoner correctly kept this outside tier-1 despite defensive merit. The allocation reflects the portfolio's need for some deflation hedge and infrastructure capex exposure without overcommitting to a sector where real yields are rising. For Utilities to earn tier-1, inflation pressure would need to stabilize or reverse, removing the headwind that makes fixed-income-heavy utilities unattractive. Currently, tier-2 is appropriate because capital is preferring real assets with scarcity premiums over infrastructure utilities with rate exposure.
Technology — CIBR
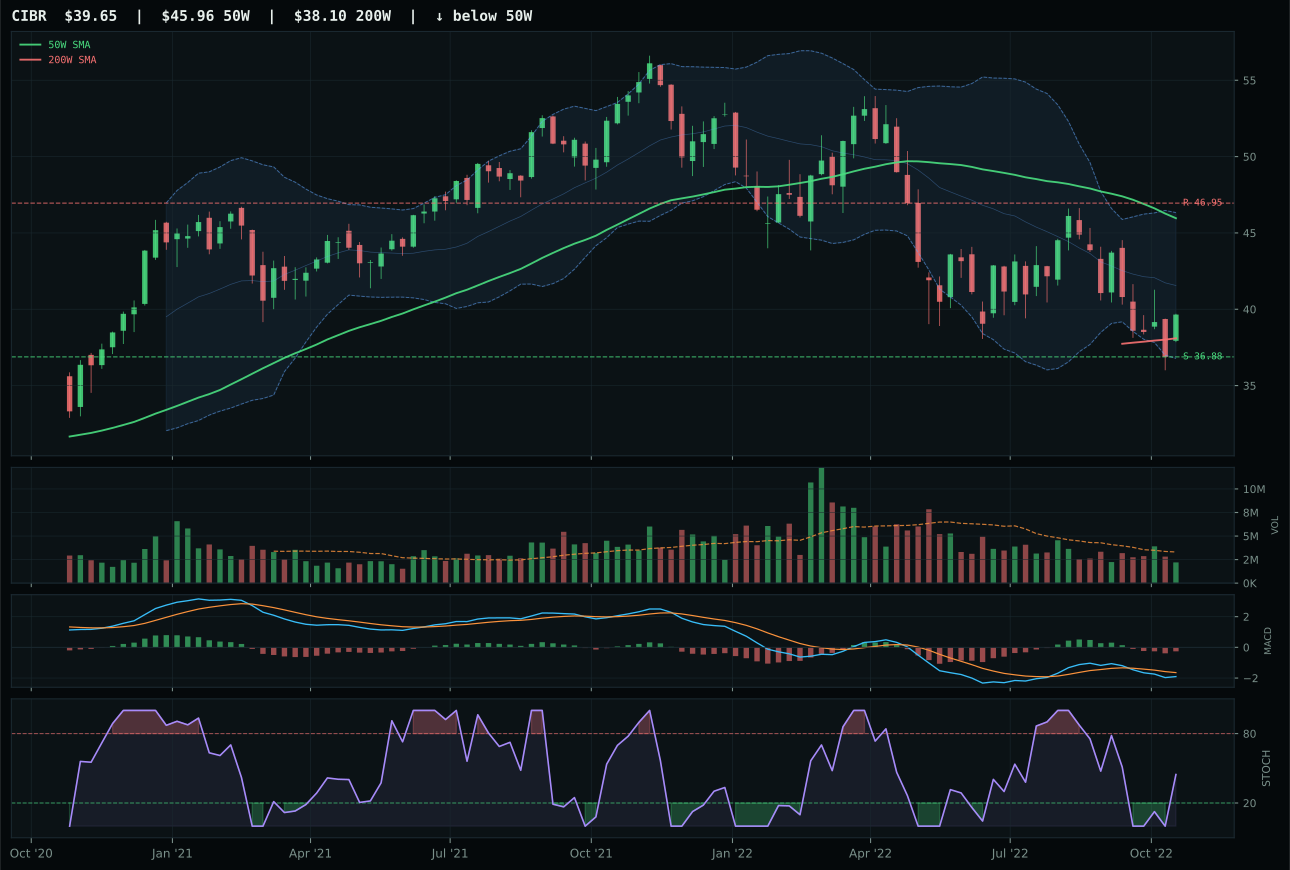
CIBR has a neutral structure profile with -2.3% 13-week relative strength versus SPY.
A failed hold above support would weaken the setup.
Actionable but governed by invalidation levels.
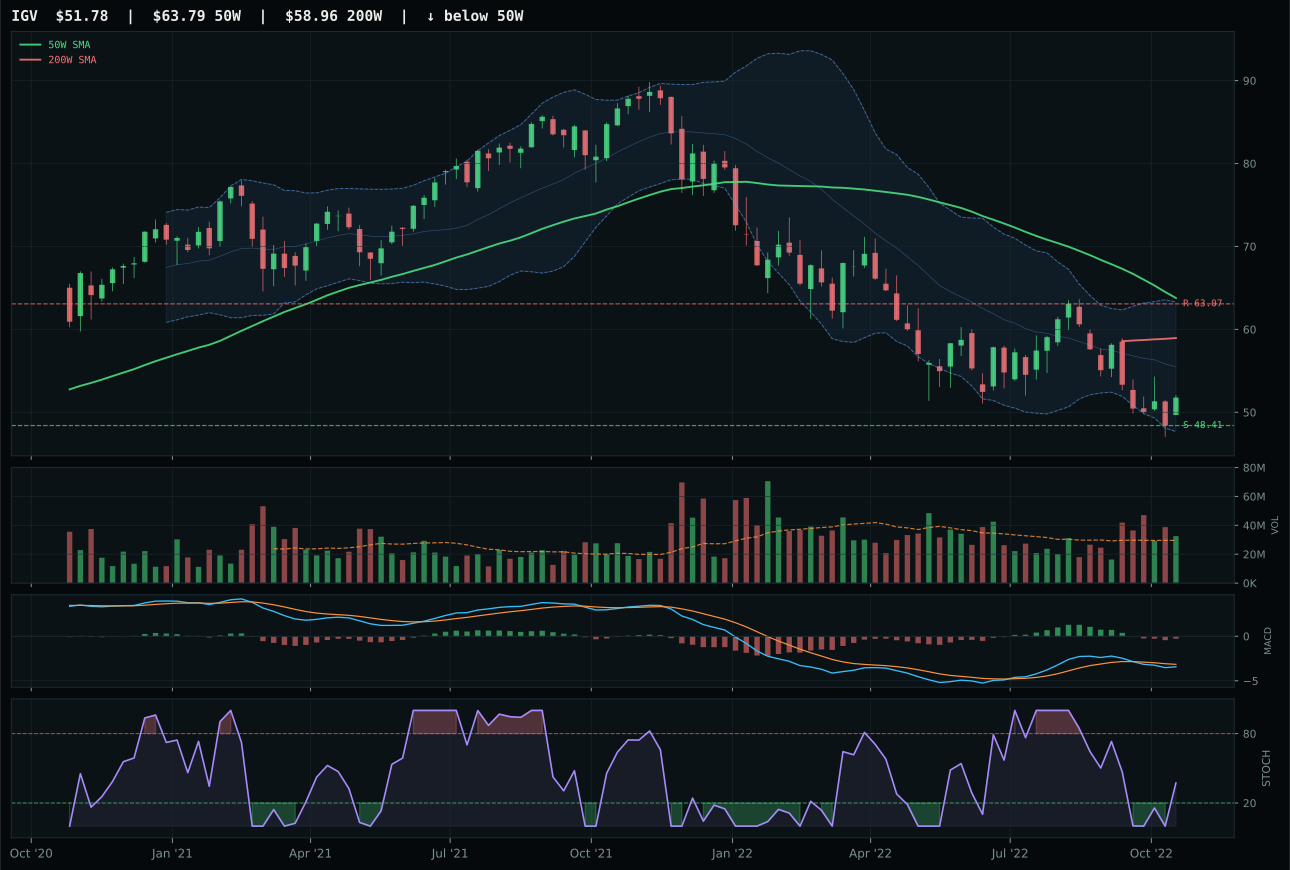
IGV has a neutral structure profile with -4.6% 13-week relative strength versus SPY.
A failed hold above support would weaken the setup.
Actionable but governed by invalidation levels.
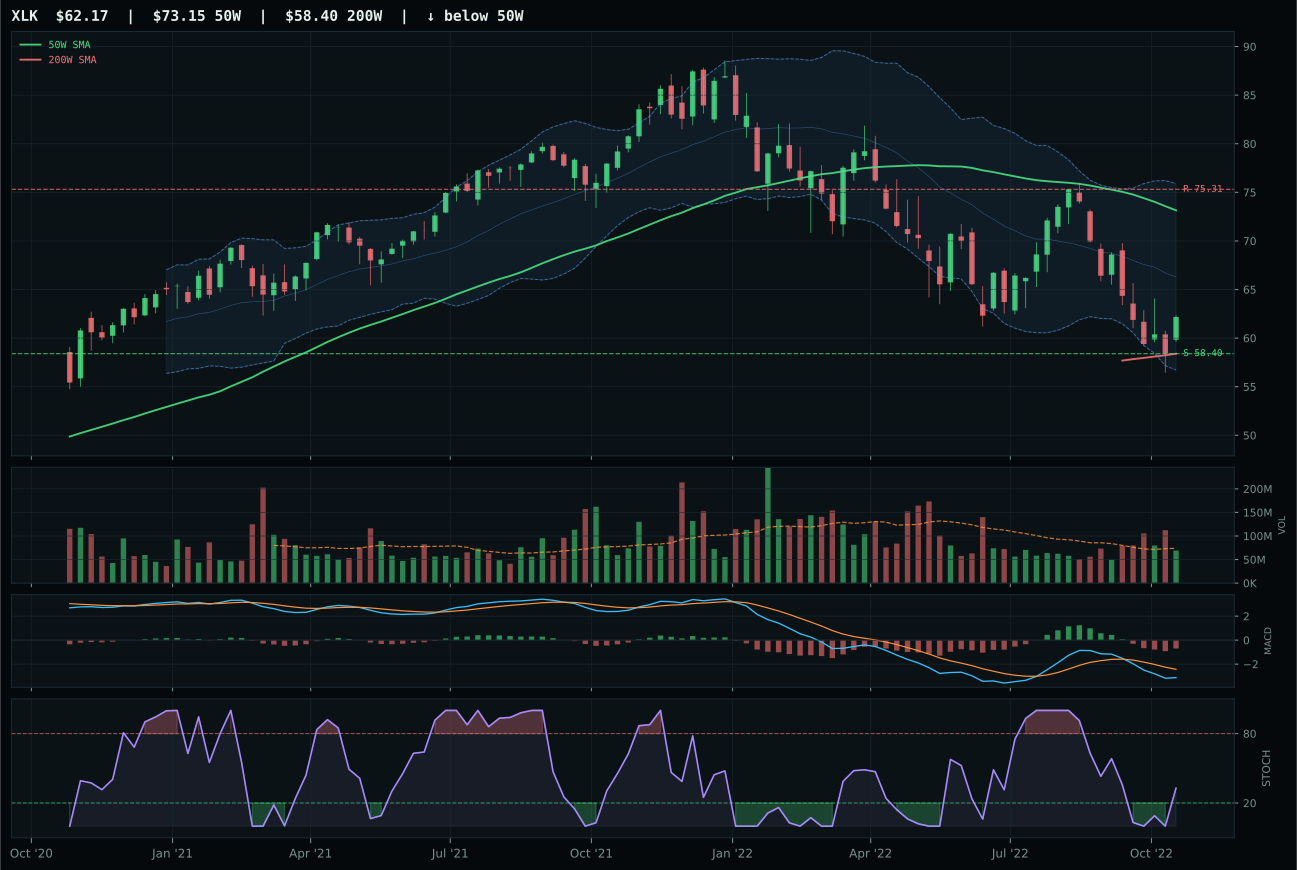
XLK has a neutral structure profile with -4.1% 13-week relative strength versus SPY.
A failed hold above support would weaken the setup.
Actionable but governed by invalidation levels.
CIBR wins the category because it holds category-relative strength at 1.8% while IGV lags at -0.5%, a meaningful edge when both face identical macro headwinds. The setup is neutral structure pulling into support near 36.88, but CIBR's thin volume at 0.67x average is acceptable here because the 13-week return of -7.6% and MACD bearish/weakening mean this is not a strength being accumulated—it is a pullback testing whether buyers exist at lower prices. The score gap versus IGV is 12.5 points, reflecting CIBR's superior technical evidence score of 36.7 versus IGV's 14.4. Risk/reward at 82.3 is the cleanest ratio in the category, with downside to support only 7.5% while upside to resistance is 15.5%, making this a defined-risk mean-reversion candidate rather than a breakout chase.
Technology earned 5% allocation as a tier-2 category, not tier-1, because its macro fit of 31.0 is decisively weak in this late-cycle reflation regime. Liquidity stress and dollar pressure are both active headwinds that penalize technology specifically—duration sensitivity and growth multiples compress when both liquidity tightens and the dollar strengthens. CIBR's cybersecurity focus is sturdier than pure software, but it cannot overcome the category's structural headwinds. The technical evidence of 36.7 is modest and weighted at 62% of the scoring formula, meaning even a clean setup cannot elevate this category above tier-2. For Technology to earn tier-1 status, the macro descriptors would need to shift: either liquidity stress would need to ease or dollar pressure would reverse, freeing up capital rotation into growth and innovation themes. Until then, this is a defensive hold for those who already own it, not a fresh capital allocation.
Emerging Markets — ILF
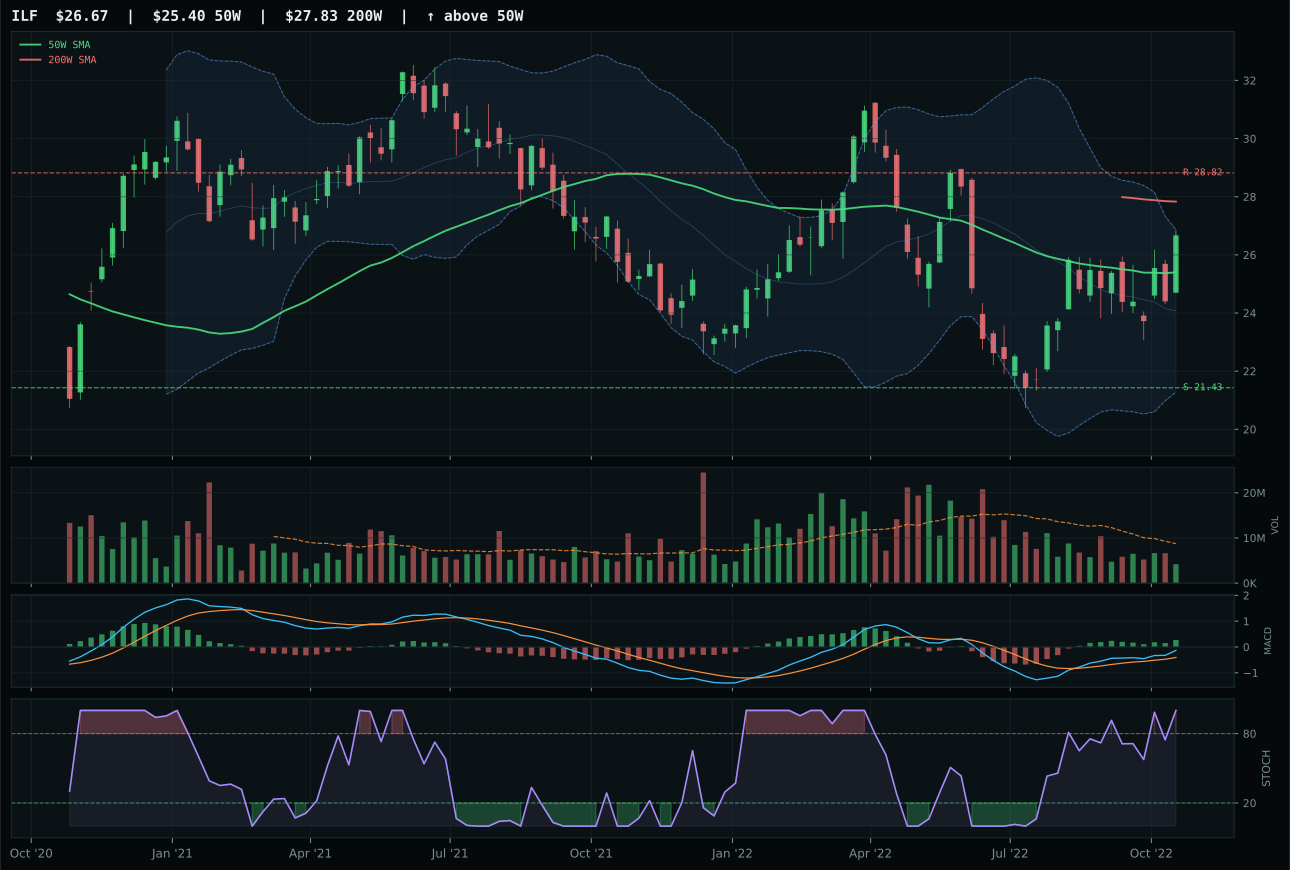
ILF has a neutral structure profile with 28.1% 13-week relative strength versus SPY.
A failed hold above support would weaken the setup.
Actionable but governed by invalidation levels.
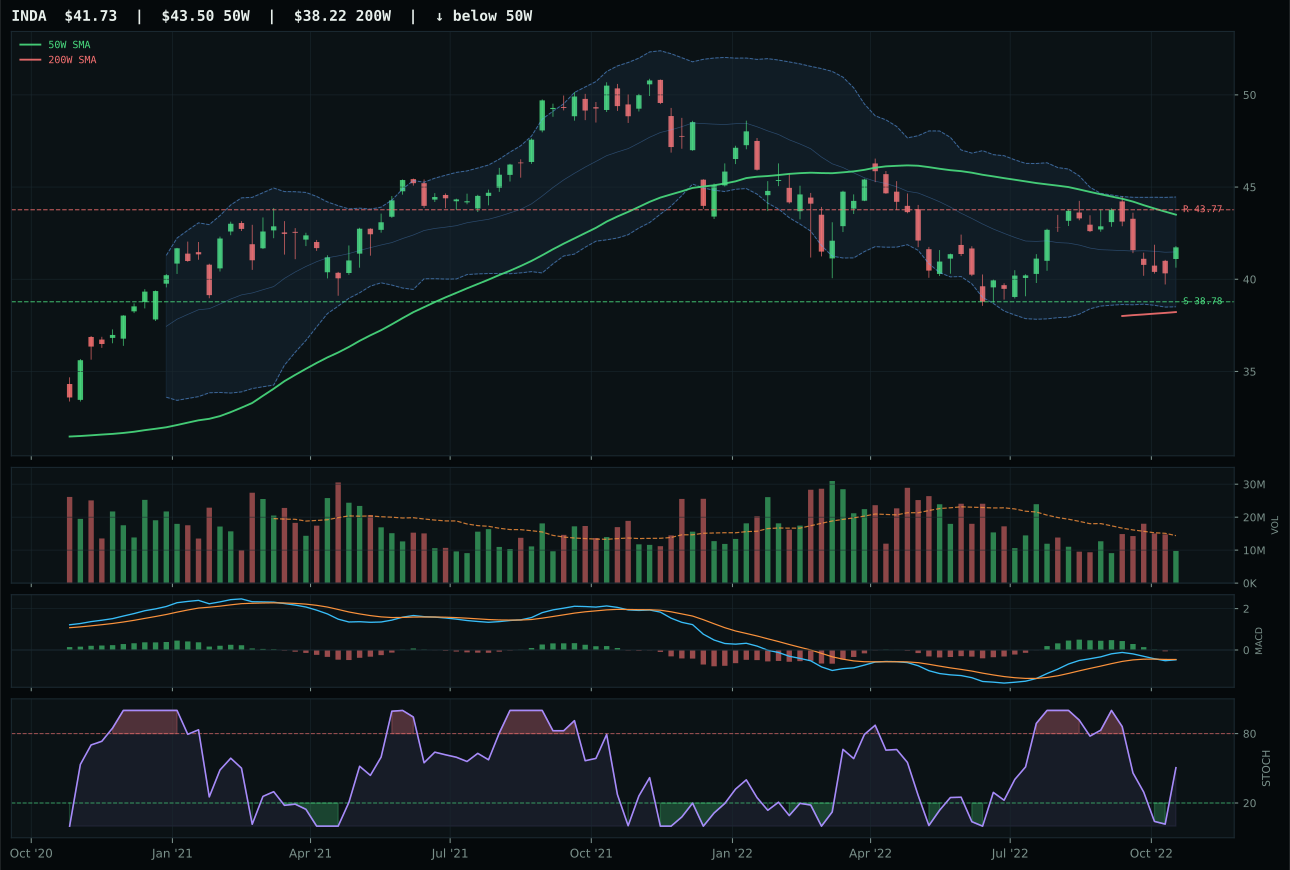
INDA has a neutral structure profile with 6.7% 13-week relative strength versus SPY.
A failed hold above support would weaken the setup.
Actionable but governed by invalidation levels.
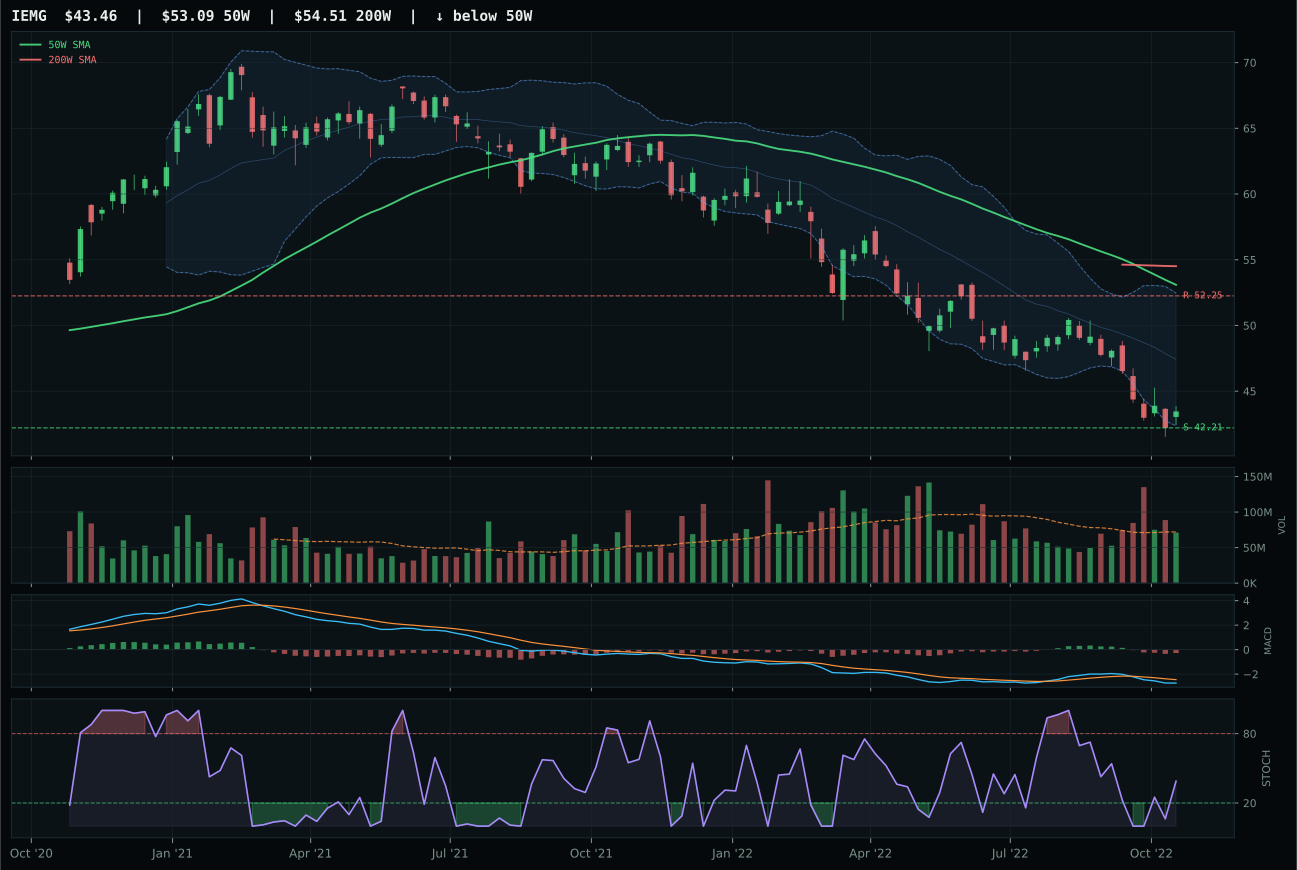
IEMG has a pullback into support profile with -4.7% 13-week relative strength versus SPY.
Extension and support failure are the main tactical risks.
Tracked, but not top-2 eligible because: structurally broken.
ILF wins Emerging Markets with a 21.4-point technical evidence lead over INDA because it holds 28.1% RS versus SPY and 21.3% category-relative strength, backed by 13-week return of 22.8% and momentum confirmation of 100.0. ILF's bullish and improving MACD with overbought stochastic RSI at 1.00 signals extended entry risk, but the volume-price confirmation of 77.1 and persistence of 89.5 are exceptional—this is not a flash of interest but sustained buying into Latin American commodity and value beta. INDA's setup is neutral structure with falling/neutral stochastic and bearish/weakening MACD, representing a trade that broke down rather than one accumulating. The structure gap favors ILF at 69.8 versus INDA's 68.1, but the MACD and momentum gap is decisive. ILF is extended 5.0% above the 50W in middle retracement zone, while INDA is trapped between weak momentum and deteriorating technicals. The category score of 7.9 reflects macro headwinds so severe that even ILF's exceptional technical setup cannot overcome them.
Emerging Markets receives 0% allocation this week, ranked 9th or 10th, because its category score of 7.9 is the second-lowest in the portfolio. The macro fit of 17.0 is catastrophic: dollar pressure is active at -14, liquidity stress is active at -10, and broad market bear is active at -9—these headwinds are lethal for emerging market currencies and capital flows. Even ILF's 85.4 technical evidence and 28.1% outperformance versus SPY cannot overcome the structural reality that EM suffering when the dollar strengthens and risk appetite breaks. The category reasoner correctly excluded this despite ILF's bullish technicals because macro alignment matters more than isolated strength. For Emerging Markets to earn allocation, the dollar would need to weaken—either through Fed pivot signals or a genuine de-escalation in geopolitical tensions freeing up liquidity for growth themes. Currently, EM is the opposite of what this late-cycle reflation regime rewards.
AI — SMH
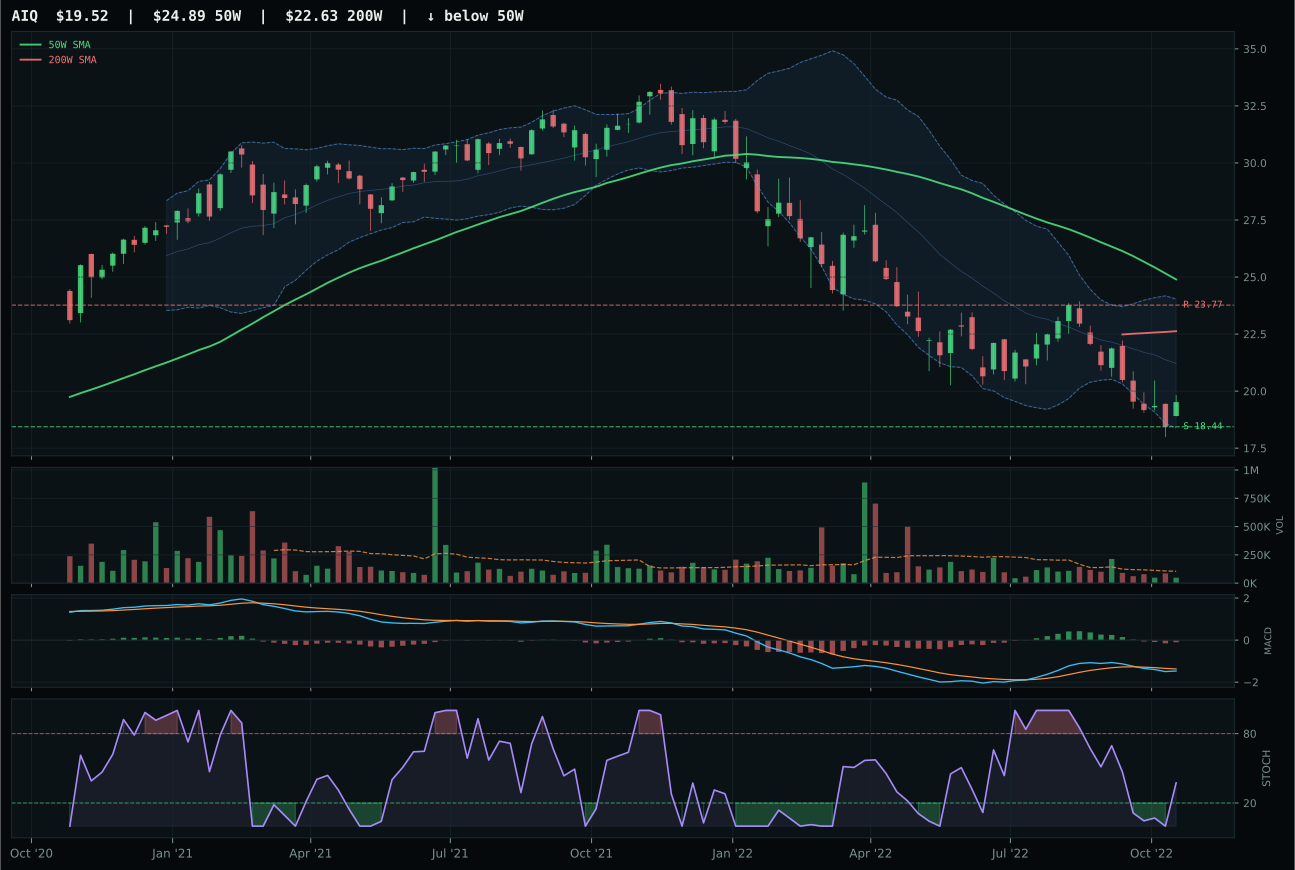
AIQ has a neutral structure profile with -6.2% 13-week relative strength versus SPY.
A failed hold above support would weaken the setup.
Tracked, but not top-2 eligible because: .
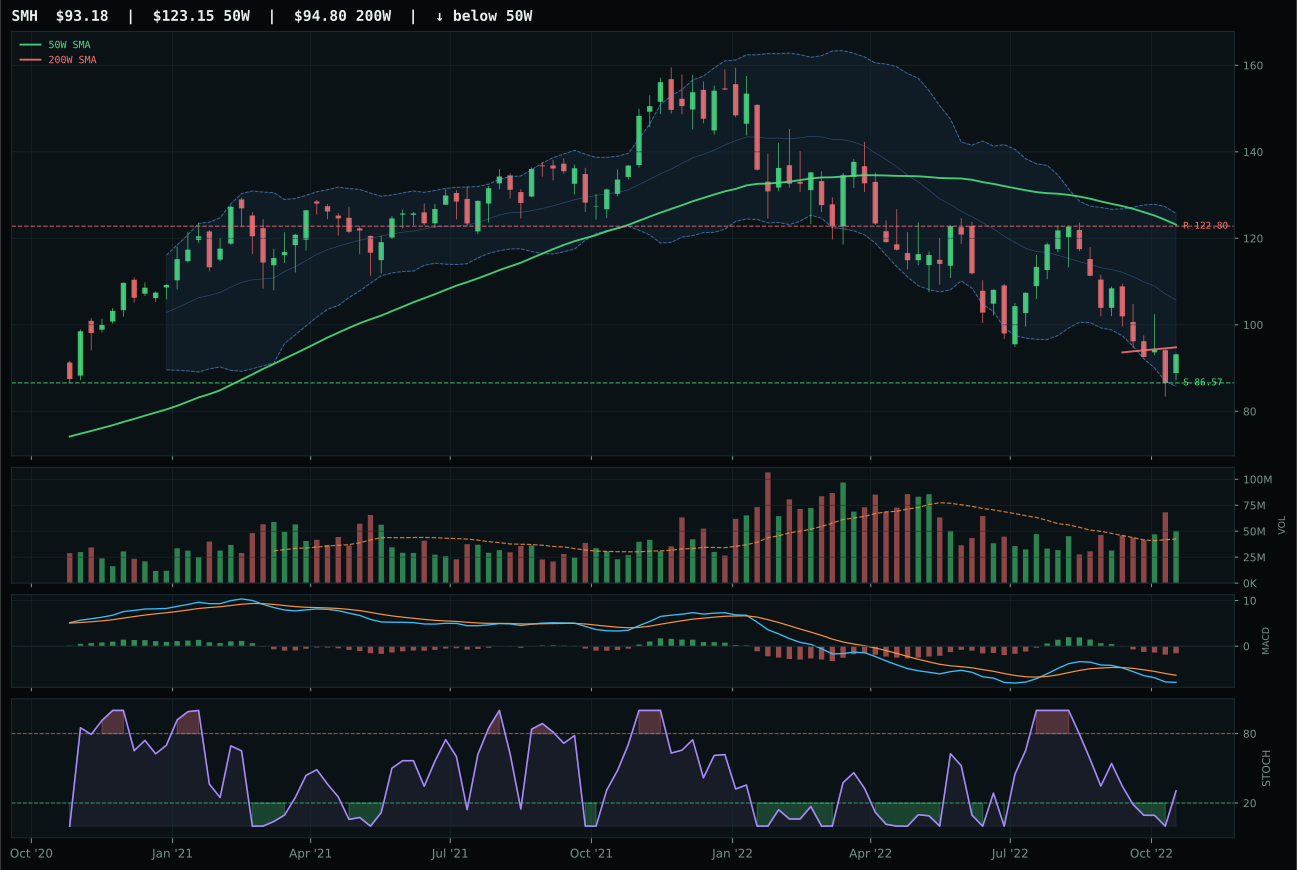
SMH has a neutral structure profile with -12.6% 13-week relative strength versus SPY.
A failed hold above support would weaken the setup.
Actionable but governed by invalidation levels.
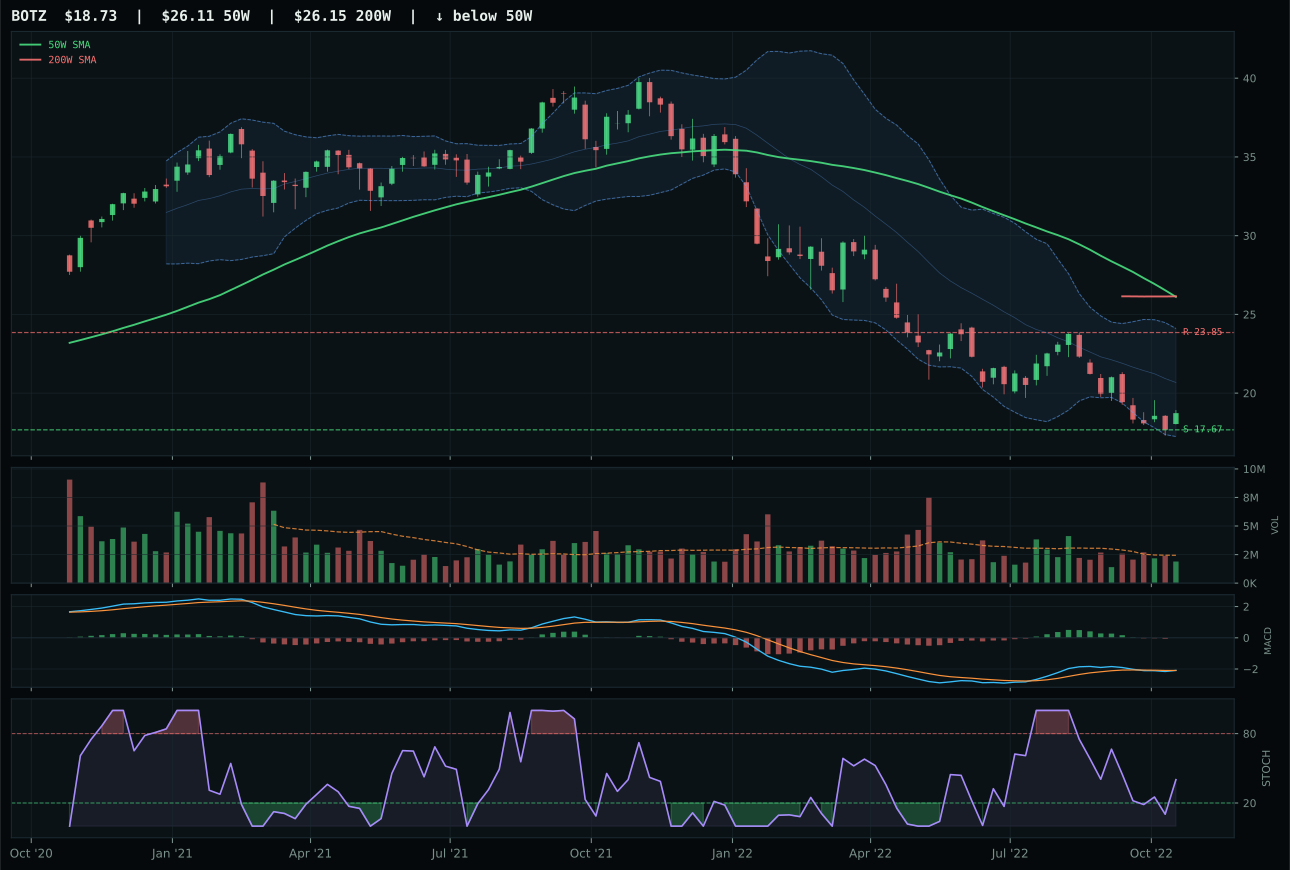
BOTZ has a neutral structure profile with -9.1% 13-week relative strength versus SPY.
Extension and support failure are the main tactical risks.
Tracked, but not top-2 eligible because: structurally broken.
SMH wins by structure and volume confirmation despite holding the worst momentum score in its basket: 0.0. The neutral structure scores 66.5 versus AIQ's 64.6, but more critically, SMH's above-average volume participation at 1.19x average—while the 13-week return falls -17.8% and category-relative strength deteriorates to -3.4%—tells a story of capitulation selling with conviction. AIQ's thin participation at 0.67x average suggests weak hands exiting; SMH's above-average volume suggests institutional positioning into the wash-out. The score gap is only 4.1 points, making this a tight decision that hinges entirely on volume-price sponsorship: SMH's 2.5 volume-price confirmation score edges AIQ's implicit weaker confirmation. BOTZ ranks first in the reasoned order at 38.7, well above both, yet the category itself scores only 4.9 because the entire cohort is broken.
AI receives 0% allocation this week, ranked 9th or 10th, because its category score of 4.9 cannot compete with seven higher-ranking categories and the 50% overlay halves all allocation slots to 10%/5%/0%. The macro fit of 26.0 is catastrophic: liquidity stress and broad market bear are both active, and risk appetite remains broken—these are conditions that kill momentum trades in growth and technology outright. SMH's 13-week return of -17.8% and RS versus SPY of -12.6% are not oversold value setups; they are structural rejections of semiconductor and AI compute demand during a period when capital is fleeing risk entirely. Even SMH's technical evidence of 0.0 reflects the absence of any confirmed reversal signal. For AI to earn a position, macro would need to shift to risk-appetite recovery or at minimum a stabilization in liquidity conditions; neither is visible in the current descriptor checklist.