
2022-10-14
Informational purposes only. The content in this report, including allocations, analysis, and commentary, is provided solely for informational and educational purposes. It does not constitute financial advice, investment advice, trading advice, or any other type of advice. Past performance does not guarantee future results. Always conduct your own research and consult a qualified financial professional before making investment decisions.
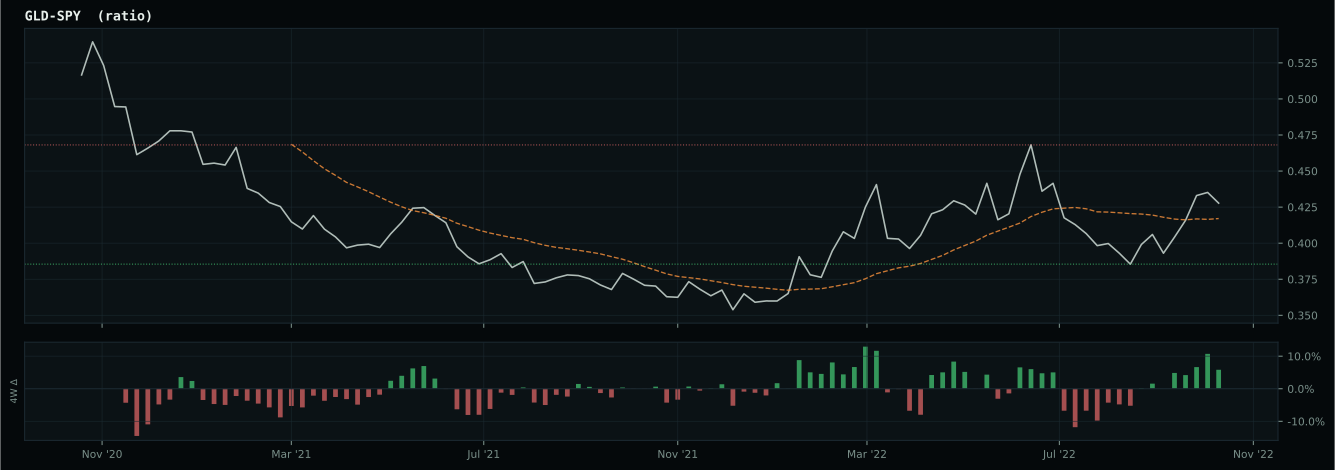
GLD defensive overlay excluded: price is below its 8W SMA. Cause selector will use cash alternative.
Macro risk engine requires the 50% Defensive overlay for this run; payload selected by cause: Inflation Scarcity.
Weekly Allocation
| Ticker | Category | Weight | Role |
|---|---|---|---|
| XLE | Traditional Energy | 60% | Overlay |
| GLD | Precious Metals | 10% | Top-2 (10%) |
| COPX | Industrial Metals | 5% | Tier-2 (5%) |
| WEAT | Agriculture & Livestock | 5% | Tier-2 (5%) |
| URNM | Nuclear Energy | 5% | Tier-2 (5%) |
| ITA | Defense & Aerospace | 5% | Tier-2 (5%) |
| INDA | Emerging Markets | 5% | Tier-2 (5%) |
| PAVE | Utilities & Infrastructure | 5% | Tier-2 (5%) |
Trade Instructions — Monday Open
Sell the tranche from 2022-09-16 (completing its 4-week hold). Buy the new tranche. Instructions show net portfolio changes — same-asset positions cancel, weight changes show the delta.
| Action | Ticker | Instruction |
|---|---|---|
| SELL | SGOV | Sell 22% of SGOV position (reduce 22.50% → 17.50%) |
| SELL | GLD | Sell 18% of GLD position (reduce 13.75% → 11.25%) |
| SELL | XLU | Sell 50% of XLU position (reduce 10.00% → 5.00%) |
| SELL | URNM | Sell 50% of URNM position (reduce 2.50% → 1.25%) |
| SELL | CIBR | Sell 33% of CIBR position (reduce 3.75% → 2.50%) |
| BUY | XLE | Buy XLE — 83.33% of freed cash (adds 12.50% to portfolio) |
| BUY | PAVE | Buy PAVE — 8.33% of freed cash (adds 1.25% to portfolio) |
| BUY | INDA | Buy INDA — 8.33% of freed cash (adds 1.25% to portfolio) |
Current Portfolio After Trade
Combined holdings across all 4 active tranches. Each tranche is 25% of the portfolio.
| Ticker | % of Portfolio | Weight Bar |
|---|---|---|
| XLE | 35.00% | |
| SGOV | 17.50% | |
| GLD | 11.25% | |
| WEAT | 6.25% | |
| XLU | 5.00% | |
| ITA | 5.00% | |
| URA | 5.00% | |
| COPX | 3.75% | |
| PAVE | 3.75% | |
| CIBR | 2.50% | |
| PICK | 1.25% | |
| XLK | 1.25% | |
| URNM | 1.25% | |
| INDA | 1.25% |
Macro Regime — Late-Cycle Reflation
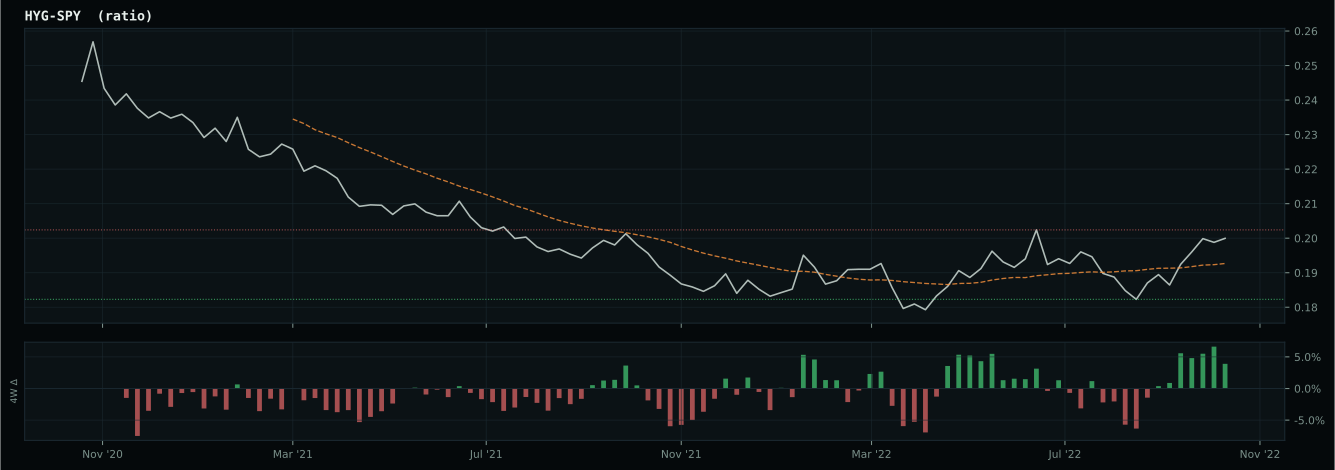
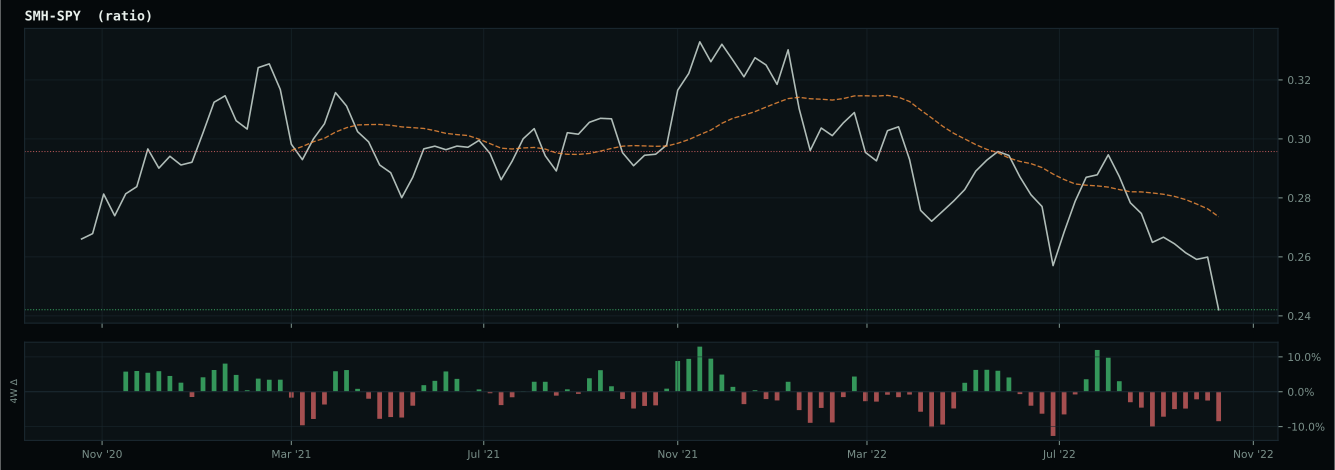
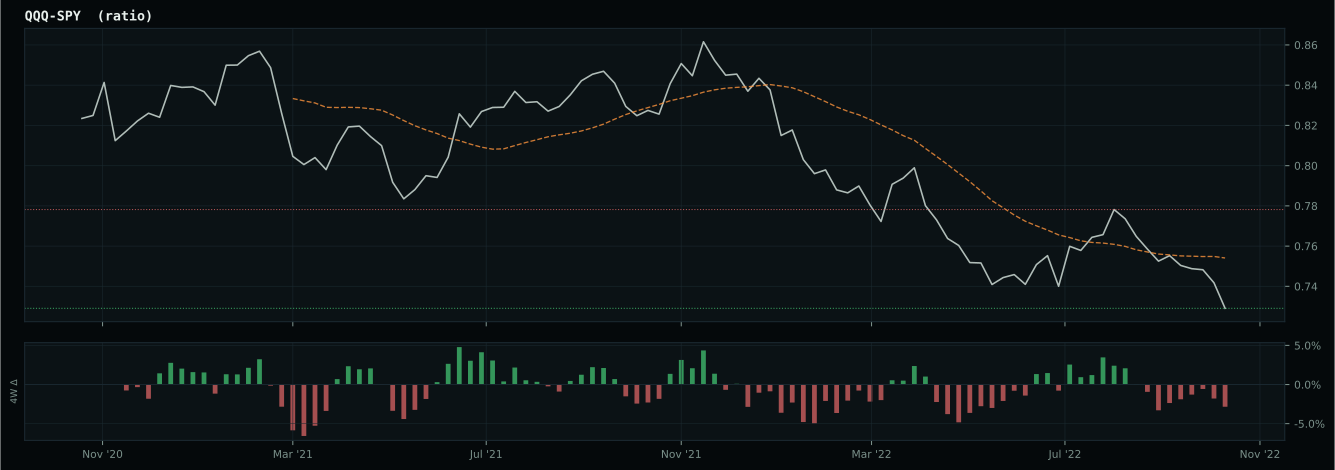
growth data is not confirming the weak market-implied risk appetite signal
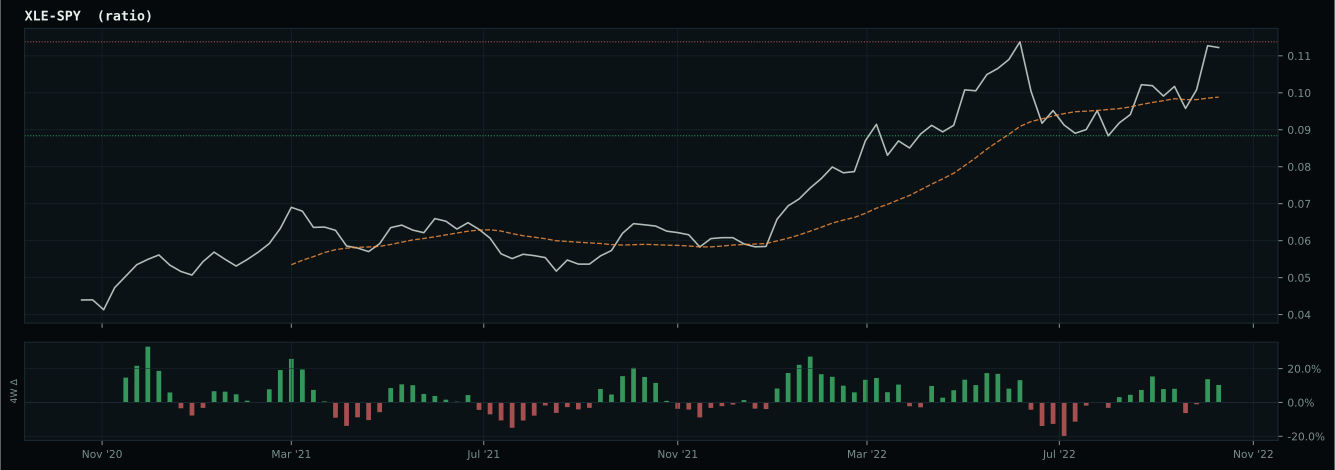
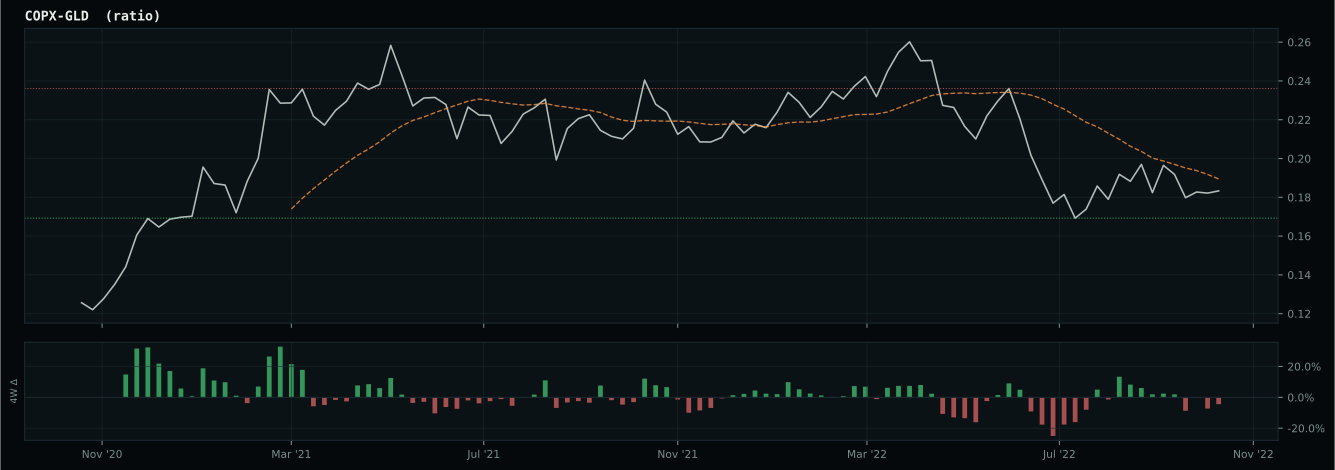
inflation-sensitive ratios are firm but broad commodity participation is weak
Defensive overlay cause is inflation/scarcity: energy, commodity breadth, or oil-versus-gold confirmation is stronger than the broad equity tape, so the sleeve owns the inflation pressure. XLE has been confirmed above its 8W SMA and is eligible.
Macro Evidence Charts
Market-implied signals behind the macro regime scores. Each ratio compares two assets; the direction and slope of the ratio is what the macro engine reads.
Crypto Regime — NoCrypto
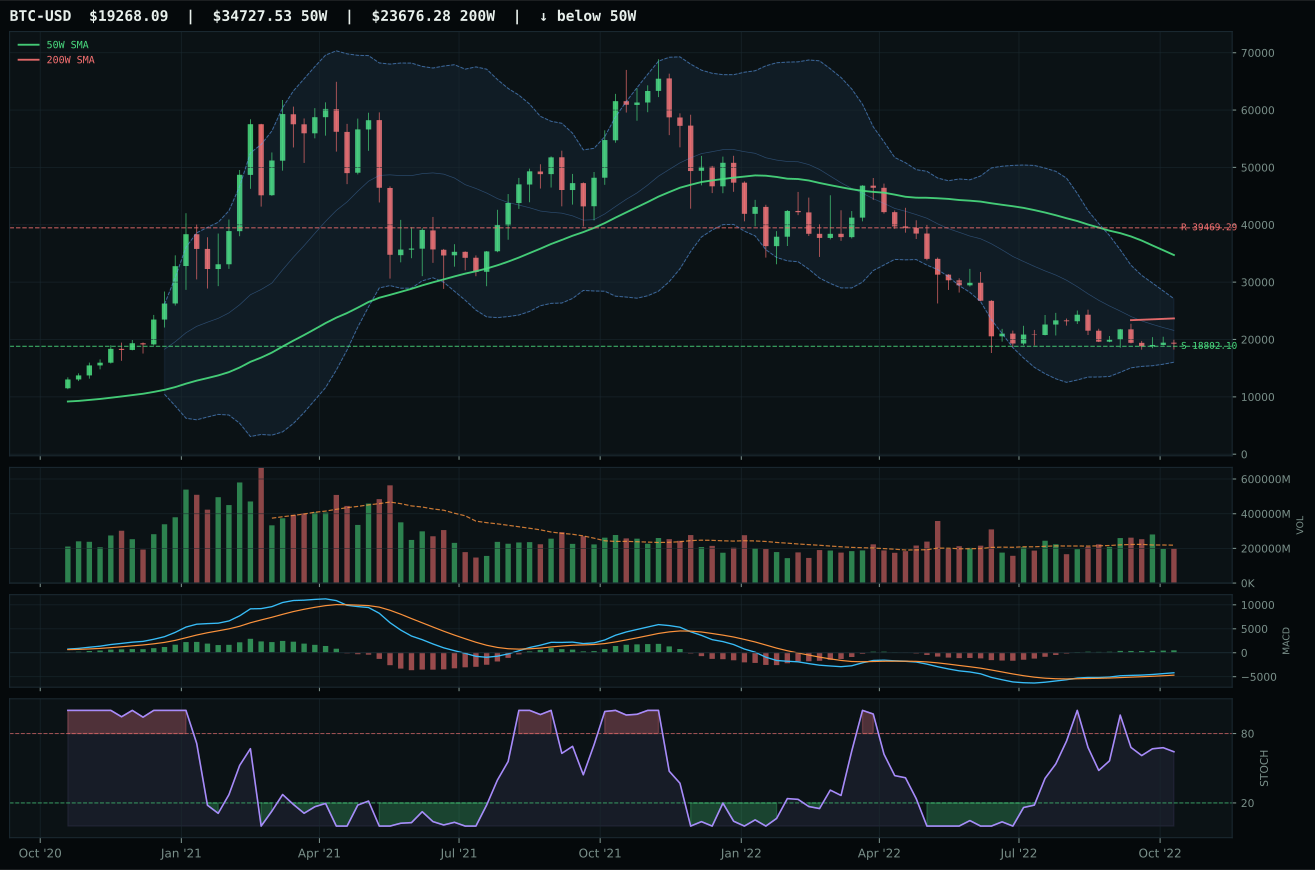
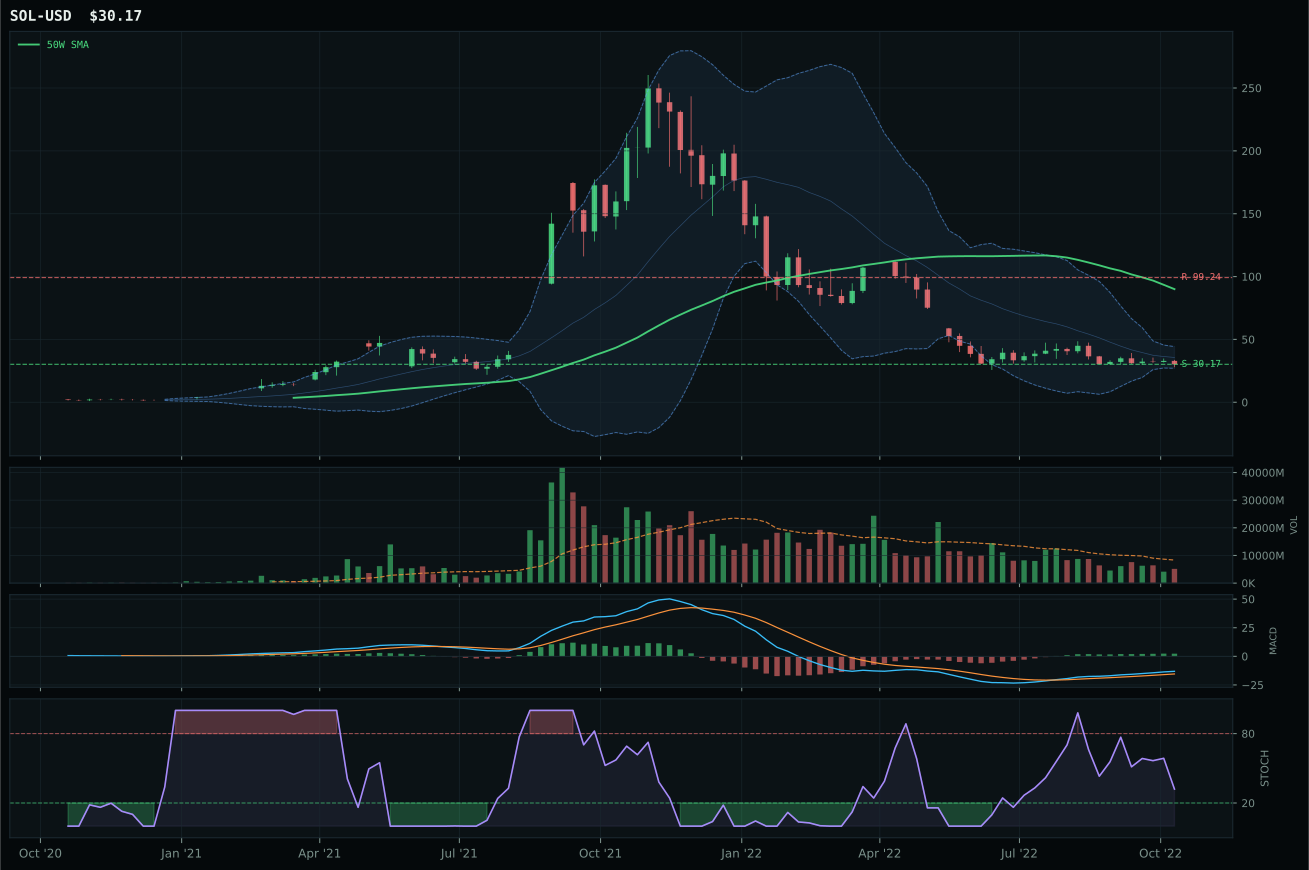
ValueBTC armed; waiting for 50W reclaim, decisive close above post-touch range resistance by 3%, close above 200W, breakout volume above 20W…
TrendBTC not confirmed
one or more available conditions failed
Category Rankings
| Rank | Category | Winner | Score | Alloc | 4W Ret | Peers (4W) |
|---|---|---|---|---|---|---|
| 1 | Traditional Energy | XLE | 76.1 | 20% | +13.88% | XOP +12.6% · FCG +11.2% |
| 2 | Precious Metals | GLD | 50.5 | 20% | +5.99% | SLV +15.1% · GDX +20.2% |
| 3 | Industrial Metals | COPX | 46.0 | 10% | +22.10% | PICK +16.7% · REMX +19.8% |
| 4 | Agriculture & Livestock | WEAT | 44.0 | 10% | -5.08% | VEGI +8.6% · MOO +9.2% |
| 5 | Nuclear Energy | URNM | 39.1 | 10% | +10.30% | URA +13.8% · NLR +10.1% |
| 6 | Defense & Aerospace | ITA | 34.8 | 10% | +14.51% | XAR +16.1% · ROKT +12.4% |
| 7 | Utilities & Infrastructure | PAVE | 24.4 | 10% | +13.48% | IGF +11.1% · XLU +8.1% |
| 8 | Technology | XLK | 17.3 | 10% | +10.39% | CIBR +7.2% · IGV +8.2% |
| 9 | AI | BOTZ | 5.5 | 0% | +19.29% | AIQ +10.0% · SMH +23.7% |
| 10 | Emerging Markets | INDA | — | 0% | +6.01% | ILF +3.0% · IEMG +8.6% |
Traditional Energy — XLE
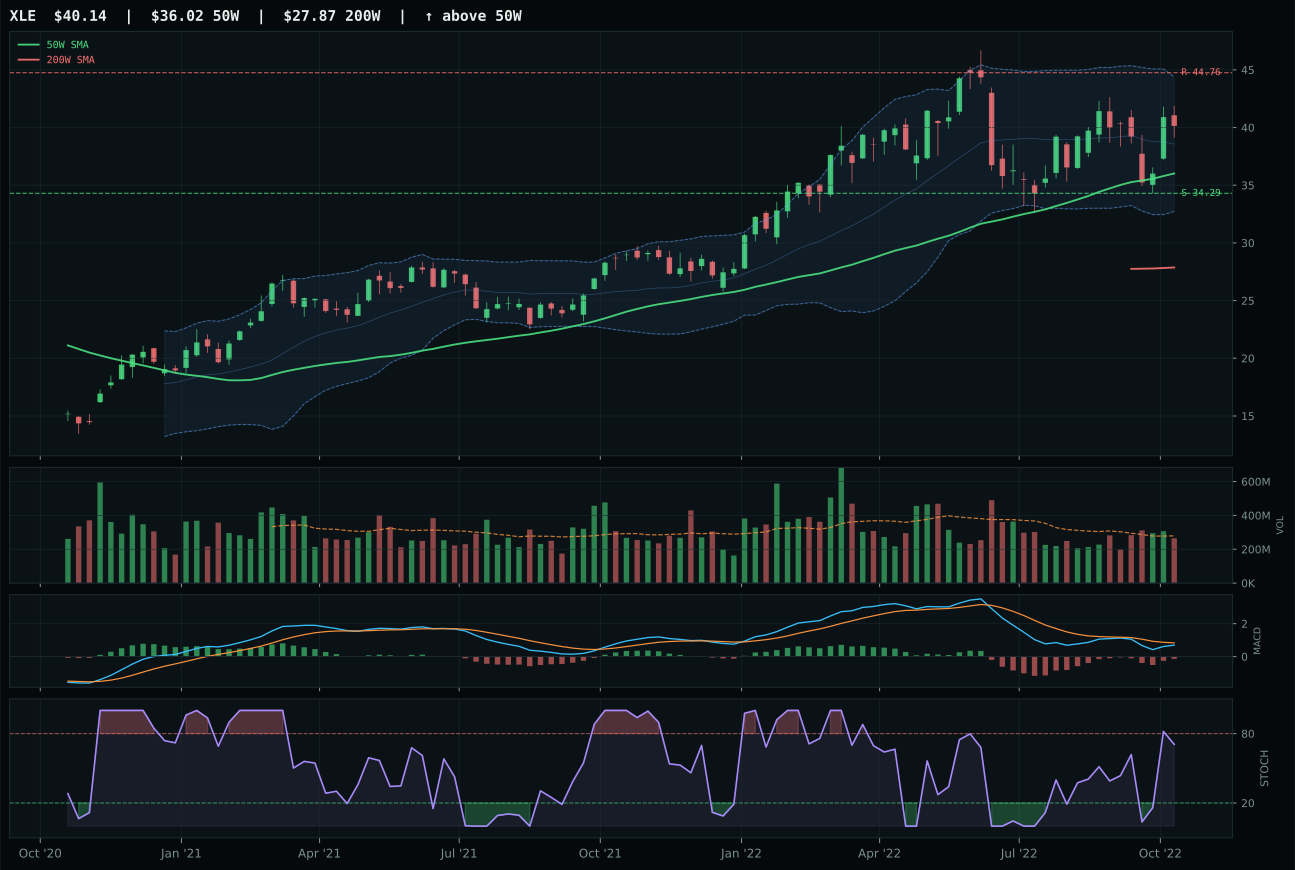
XLE has a neutral structure profile with 24.2% 13-week relative strength versus SPY.
A failed hold above support would weaken the setup.
Actionable but governed by invalidation levels.
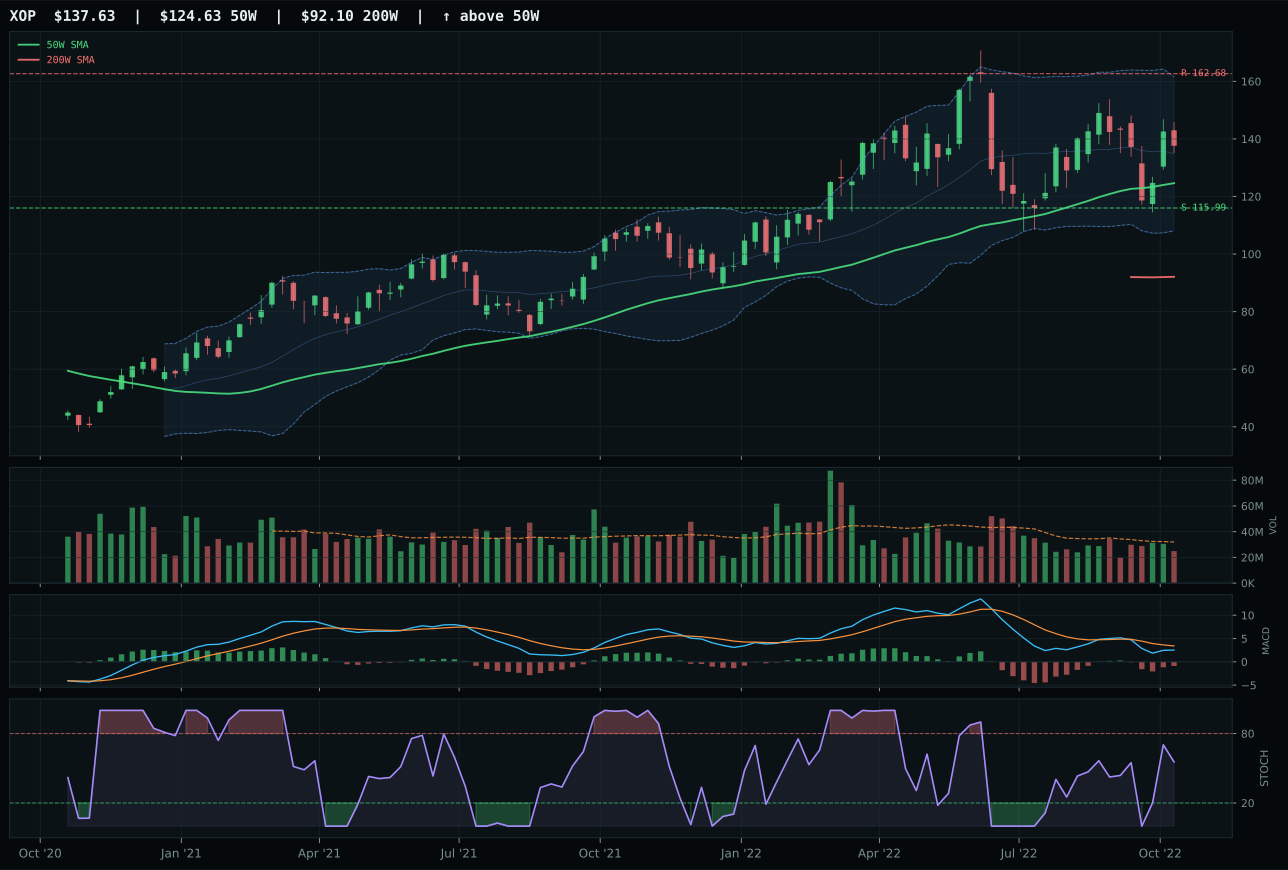
XOP has a neutral structure profile with 25.8% 13-week relative strength versus SPY.
A failed hold above support would weaken the setup.
Actionable but governed by invalidation levels.
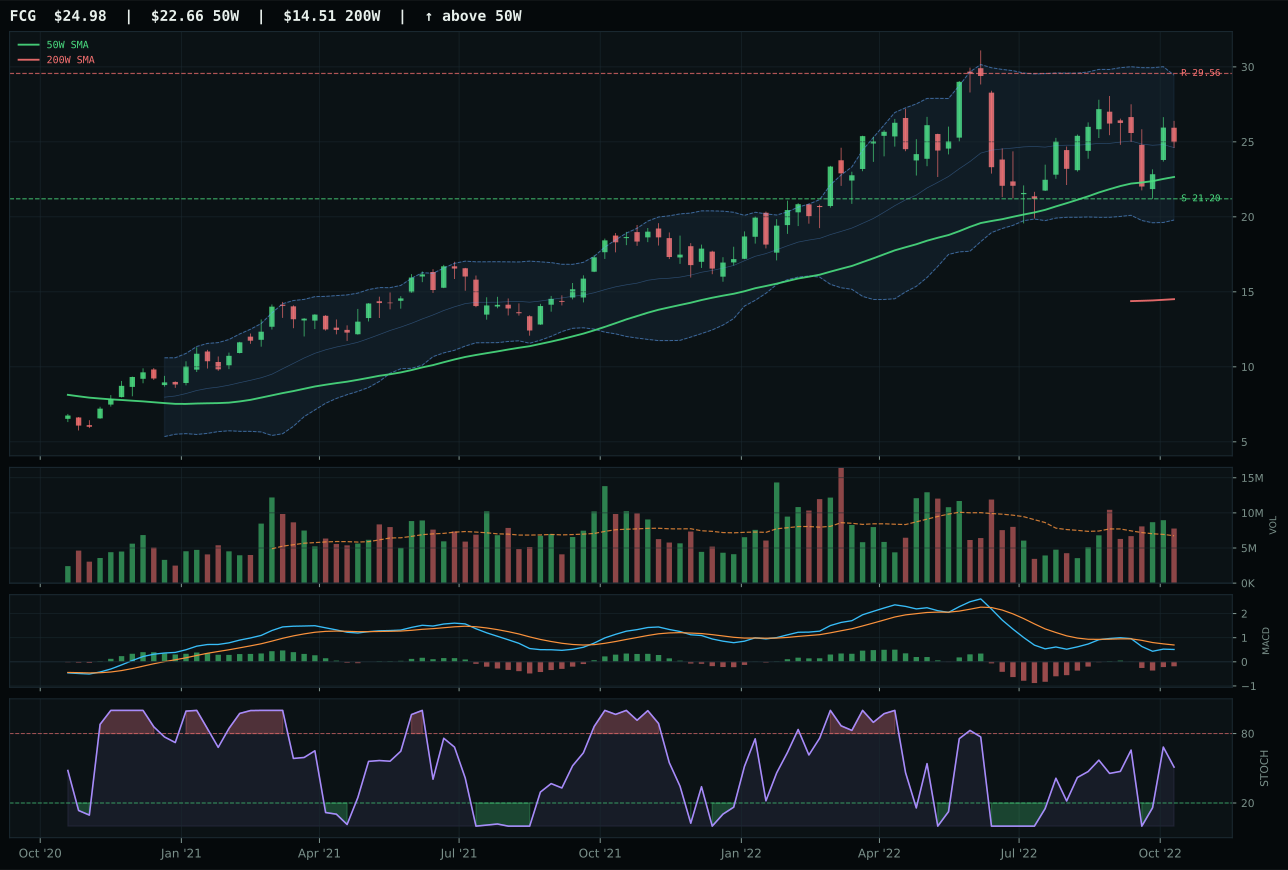
FCG has a neutral structure profile with 25.0% 13-week relative strength versus SPY.
A failed hold above support would weaken the setup.
Actionable but governed by invalidation levels.
XLE dominates the energy category with a trend score of 92.0, reflecting price above both the 50W and 200W with a 50W slope of +0.6% and relative strength to SPY of 24.2%—the strongest RS in the entire portfolio. The 13-week return of 17.0% is not an extended melt-up; it is the pace of justified repricing as geopolitical risk and supply discipline drive expectations higher. Structure score of 69.6 is clean but not extreme, signaling that the move remains in the early phase of institutional accumulation rather than retail euphoria. The momentum confirmation score of 95.5 is the portfolio's highest, driven by 4W return of 2.3% (recent weakness but contained) and 13W return of 17.0% creating a positive intermediate trend that MACD weakness cannot undermine. Risk-reward of 40.9 is the portfolio's lowest score in the risk-reward dimension, a critical insight: XLE offers only 10.3% upside to 44.76 resistance against 17.0% downside to 34.29 support, meaning the allocation is not based on explosive upside but rather on macro sponsorship and persistent demand. Volume is neutral at 0.95x the 20-week average, preventing the setup from being labeled as euphoric.
Traditional Energy scores 76.1 and earns top-2 allocation at 60%, the portfolio's dominant position by a decisive margin over Precious Metals' 50.5. The macro fit of 88.0 is the highest among all categories, driven by energy scarcity at +16 points, late-cycle reflation at +12 points, inflation pressure at +10 points, and real asset sponsorship at +7 points—a four-point structural tailwind that is unmatched. XLE's 61.3 technical evidence score is solid but represents the category's only weakness: price has already moved 11.4% above the 50W, and MACD is bearish/weakening despite rising stochastic RSI. The 10% allocation is justified not by technical perfection but by the reality that energy is the only sector with genuine supply constraints, geopolitical risk premiums, and cash-generation advantages in a late-cycle inflation regime. The portfolio is willing to pay a slightly extended technical price to maintain exposure to the structural energy deficit. For the allocation to contract, either crude prices must stabilize below $80/barrel or OPEC discipline must collapse—neither is anticipated near-term. XLE serves as the portfolio's primary inflation hedge and return generator.
Precious Metals — GLD
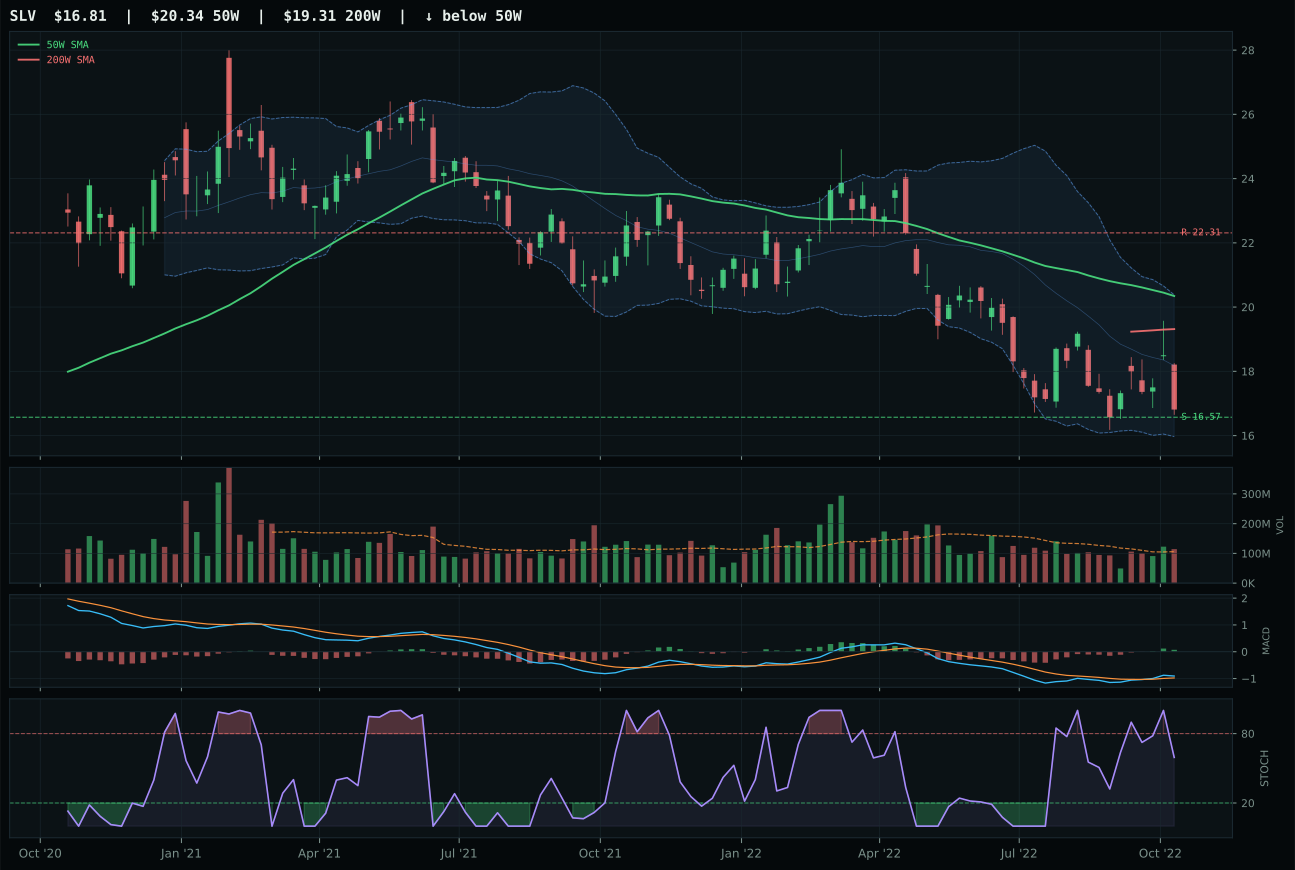
SLV has a pullback into support profile with 4.9% 13-week relative strength versus SPY.
A failed hold above support would weaken the setup.
Actionable but governed by invalidation levels.
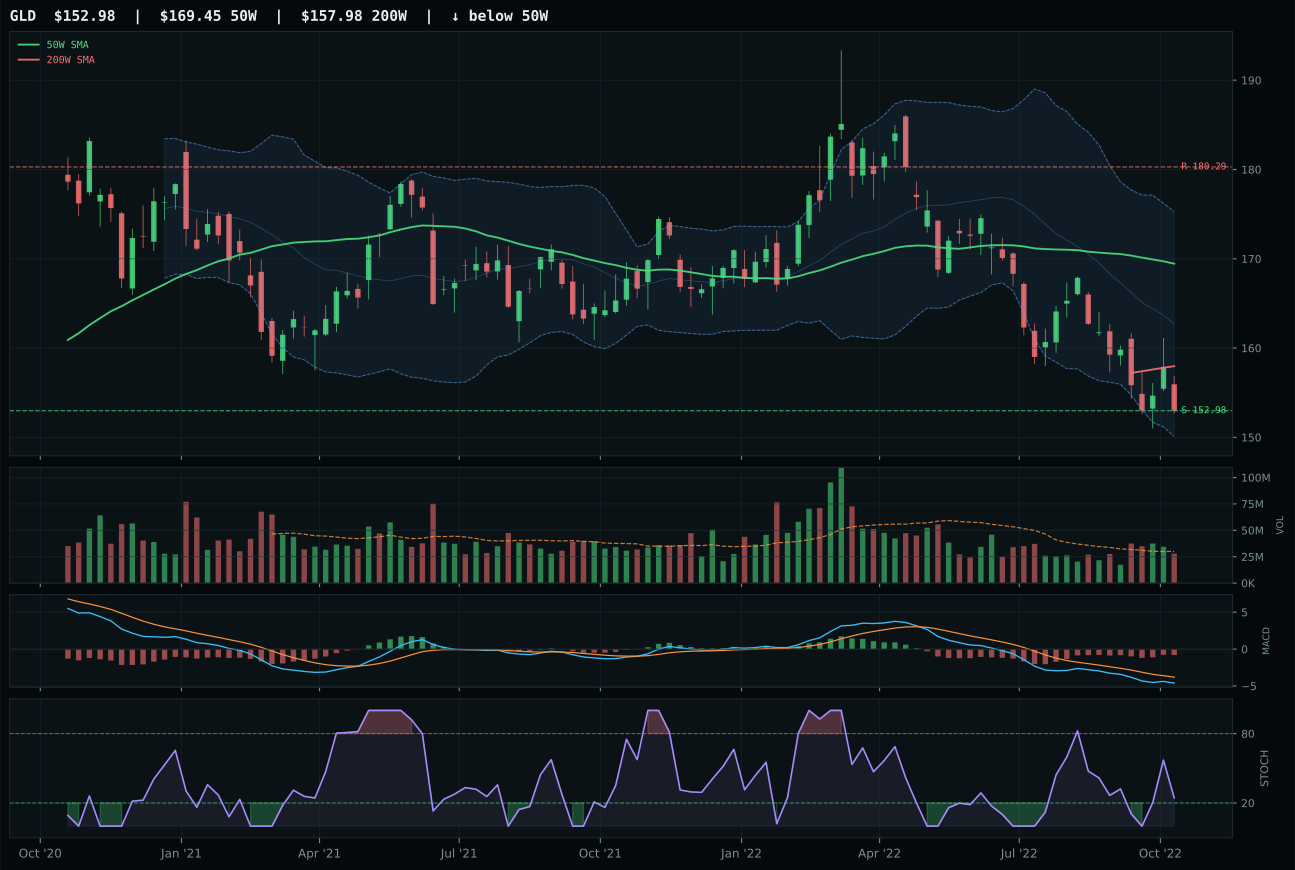
GLD has a pullback into support profile with 3.3% 13-week relative strength versus SPY.
A failed hold above support would weaken the setup.
Actionable but governed by invalidation levels.
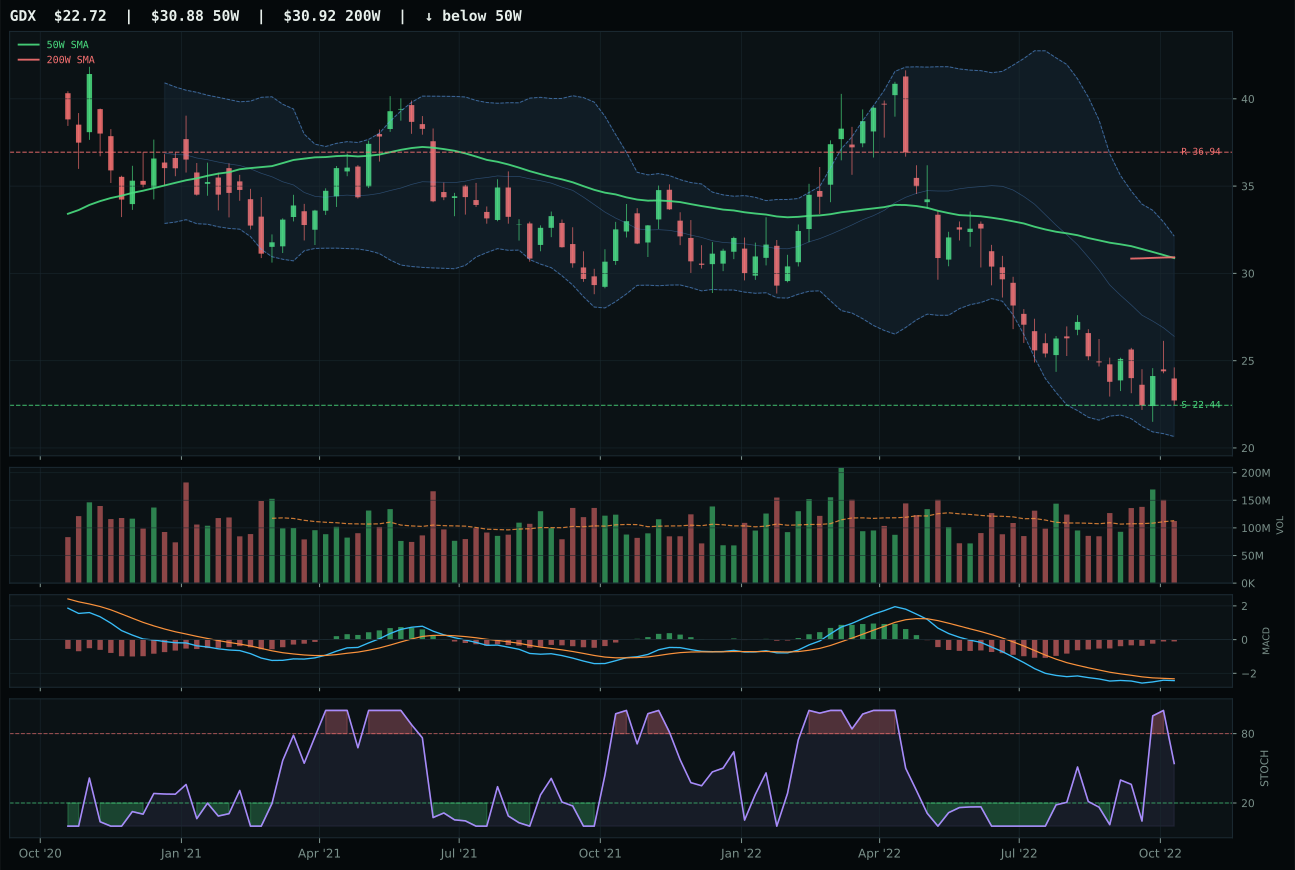
GDX has a pullback into support profile with -4.1% 13-week relative strength versus SPY.
A failed hold above support would weaken the setup.
Actionable but governed by invalidation levels.
GLD wins Precious Metals with a timing score of 93.0 versus SLV's 65.0, the decisive margin created by stochastic RSI status of rising mid-zone at 0.24 compared to SLV's falling/neutral condition at a lower level. GLD's MACD is bearish but improving, the inflection signal that precedes trend reversals in late-cycle reflation when monetary hedge demand accelerates; SLV's MACD is bullish and improving, which sounds stronger but actually reflects SLV's stronger recent move and less upside surprise potential. The structure score of 72.7 for GLD versus 68.3 for SLV reflects superior compression at the 50-week moving average, a tighter setup that offers cleaner invalidation at 152.98 support. SLV trades at -9.1% from the 50-week with a distance-to-50W score of 65.0; GLD at -9.7% scores 93.0 because its technical configuration is earlier in the recovery curve—it has not yet proven the bounce, making the setup fresher. Relative strength to SPY is nearly identical at 3.3% for GLD and 4.9% for SLV, but GLD's neutral volume and cleaner Fibonacci location in the repair zone provide better execution for new accumulation.
Precious Metals scores 50.5 and earns top-2 allocation at 20%, the portfolio's second largest position after energy. The macro fit of 74.0 reflects monetary hedge bid at +14 points, defensive rotation at +7, and dollar pressure at +3—three structural forces that align directly with late-cycle reflation dynamics where real yields remain under pressure and geopolitical risk maintains a premium. GLD's 62.2 technical evidence score is solid without being dominant; the allocation strength comes from the category's macro alignment, not explosive momentum. The 51.0 momentum confirmation for GLD indicates that recent strength is real but not yet euphoric, providing room for new buyers to enter without paying an extended price. Gold's role in the portfolio is orthogonal to energy and metals; it hedges against volatility spikes and serves as the true monetary backstop if dollar weakness accelerates. The 10% allocation reflects conviction that precious metals represent the cleanest expression of inflation expectations and real asset demand in an environment where equity volatility is likely to remain elevated.
Industrial Metals — COPX
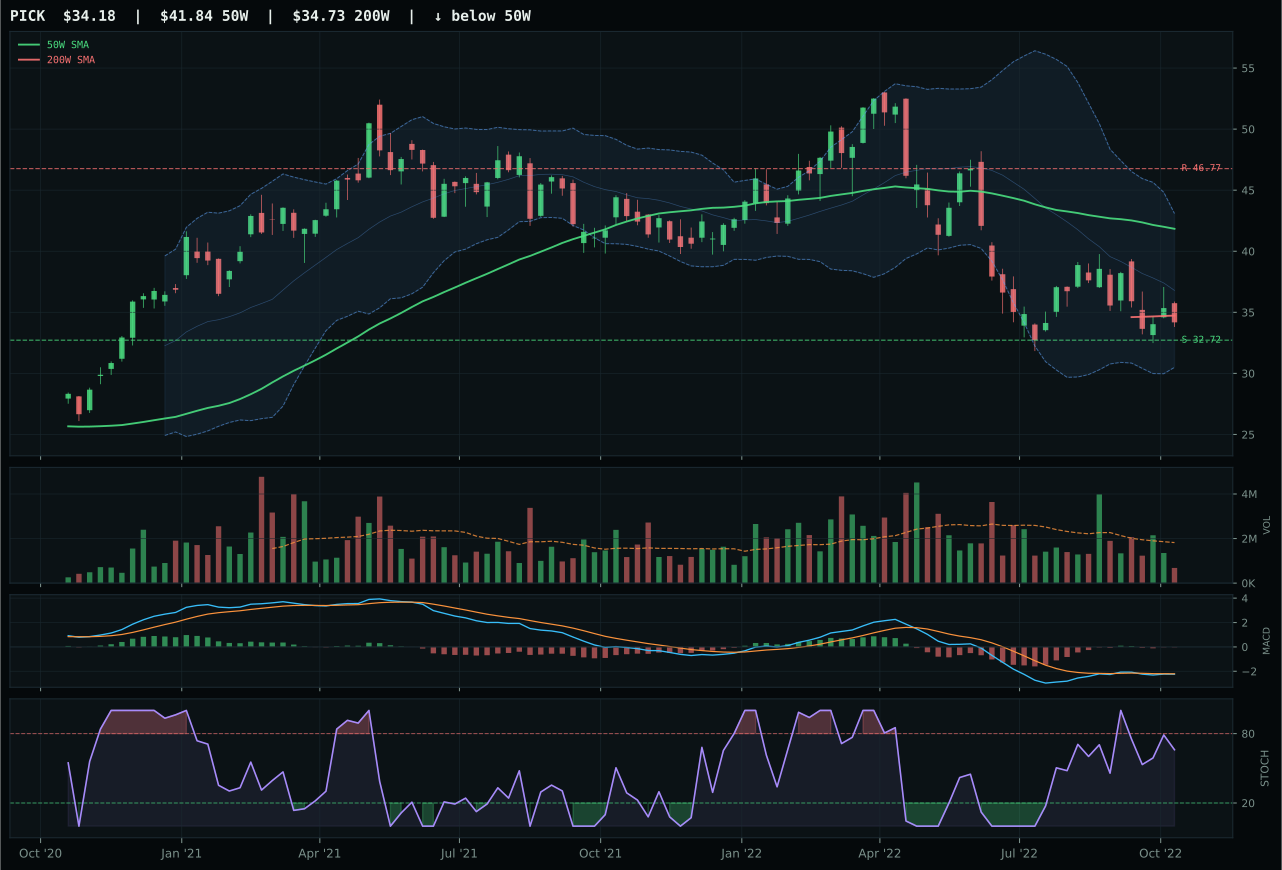
PICK has a pullback into support profile with 11.6% 13-week relative strength versus SPY.
A failed hold above support would weaken the setup.
Actionable but governed by invalidation levels.
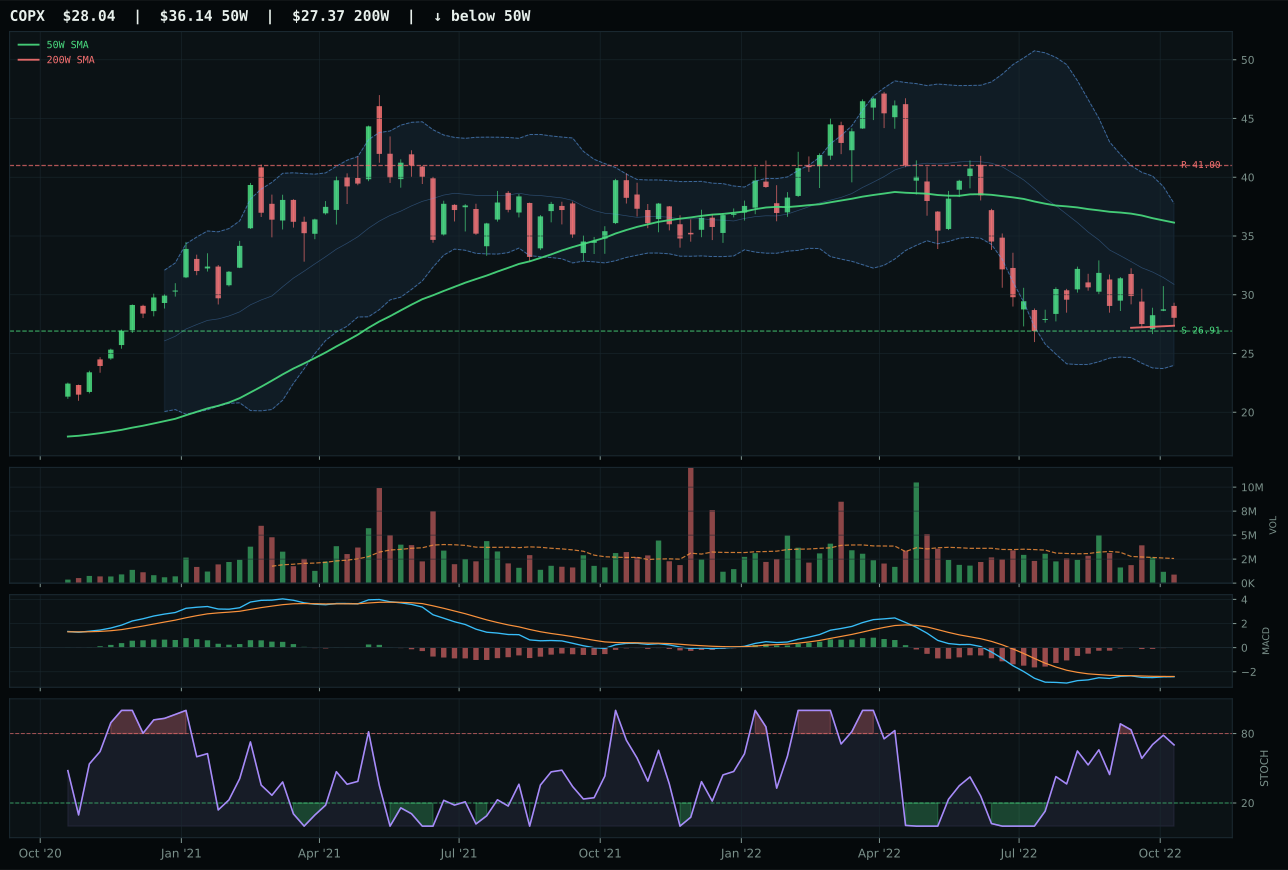
COPX has a pullback into support profile with 11.3% 13-week relative strength versus SPY.
A failed hold above support would weaken the setup.
Actionable but governed by invalidation levels.
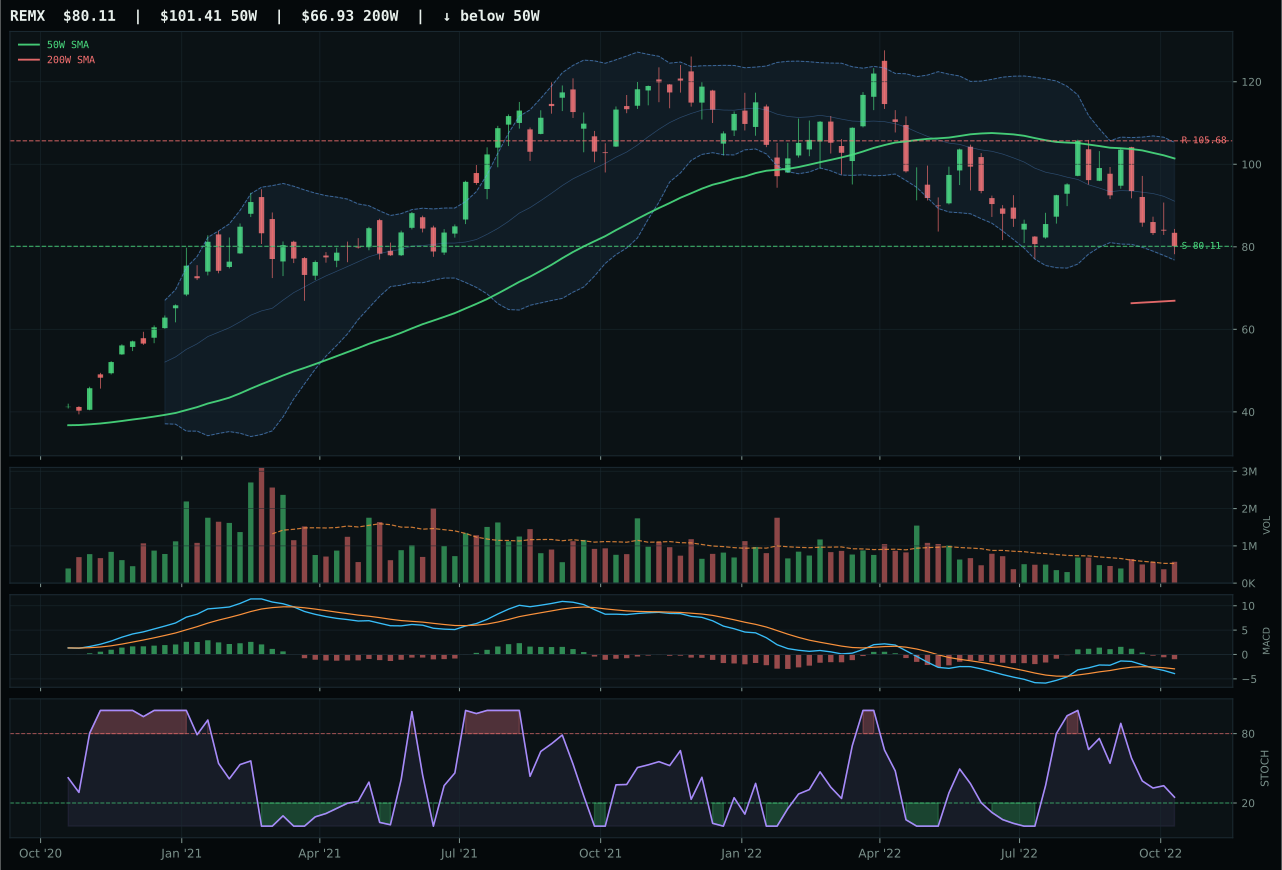
REMX has a pullback into support profile with 6.5% 13-week relative strength versus SPY.
A failed hold above support would weaken the setup.
Actionable but governed by invalidation levels.
COPX edges PICK by the narrowest margin—47 composite score for both, but COPX's trend score of 57.0 versus PICK's 47.0 provides the deciding edge through superior positioning relative to the 200-week moving average and a 50W slope of -0.5% that suggests stabilization rather than deterioration. Both display identical risk-reward of 75.0, pullback-into-support setup, bearish MACD, rising stochastic RSI, and thin volume participation, making this a near-tie on pure technicals. The differentiator is relative strength: COPX at 11.3% versus PICK at 11.6% is functionally equivalent, but COPX's category-relative strength of 0.0% (versus PICK's 0.3%) reflects that COPX is the broader industrial metals expression rather than a mining-specific play. The 13-week return of 4.2% for COPX versus 4.5% for PICK is negligible, but COPX's neutral 4W return of -6.2% indicates it has absorbed more recent selling pressure without breaking support, suggesting stronger accumulation hands. Volume at 0.35x the 20-week average is thin for both, limiting conviction but also limiting downside risk from algorithmic liquidation.
Industrial Metals scores 46.0 and holds 5% allocation in a supporting role to energy and precious metals. The macro fit of 65.0 reflects metals scarcity at +14 points and late-cycle reflation at +10 points, genuine tailwinds that are offset by -8 from liquidity stress and -7 from dollar pressure. COPX's 43.9 technical evidence score is respectable but clearly secondary to energy's 61.3 and precious metals' 62.2; the allocation exists because copper scarcity is a real phenomenon in a world transitioning energy infrastructure, and COPX captures that demand without the volatility of mining equity plays. The 5% cap reflects that copper is a demand-driven commodity rather than a supply-pinched hedging instrument like gold or uranium; if recession fears accelerate, COPX faces liquidation pressure faster than metals or energy. For the position to expand, either industrial production data must stabilize at elevated levels or geopolitical supply disruption must extend to copper-producing regions—neither is currently evident. COPX serves as a leveraged play on metals scarcity alongside the primary precious metals and energy positions.
Agriculture & Livestock — WEAT
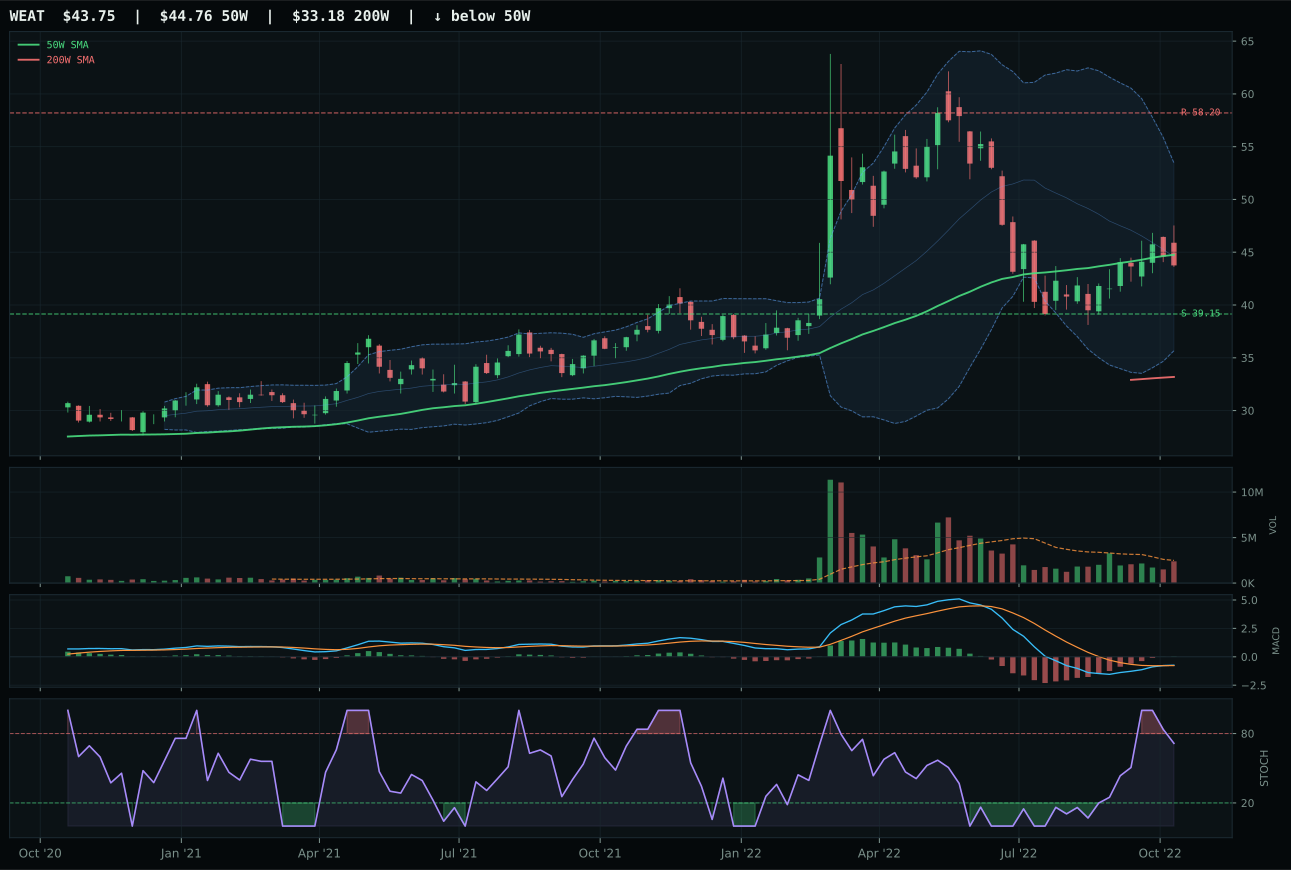
WEAT has a compression near 50W profile with 15.7% 13-week relative strength versus SPY.
A failed hold above support would weaken the setup.
Actionable but governed by invalidation levels.
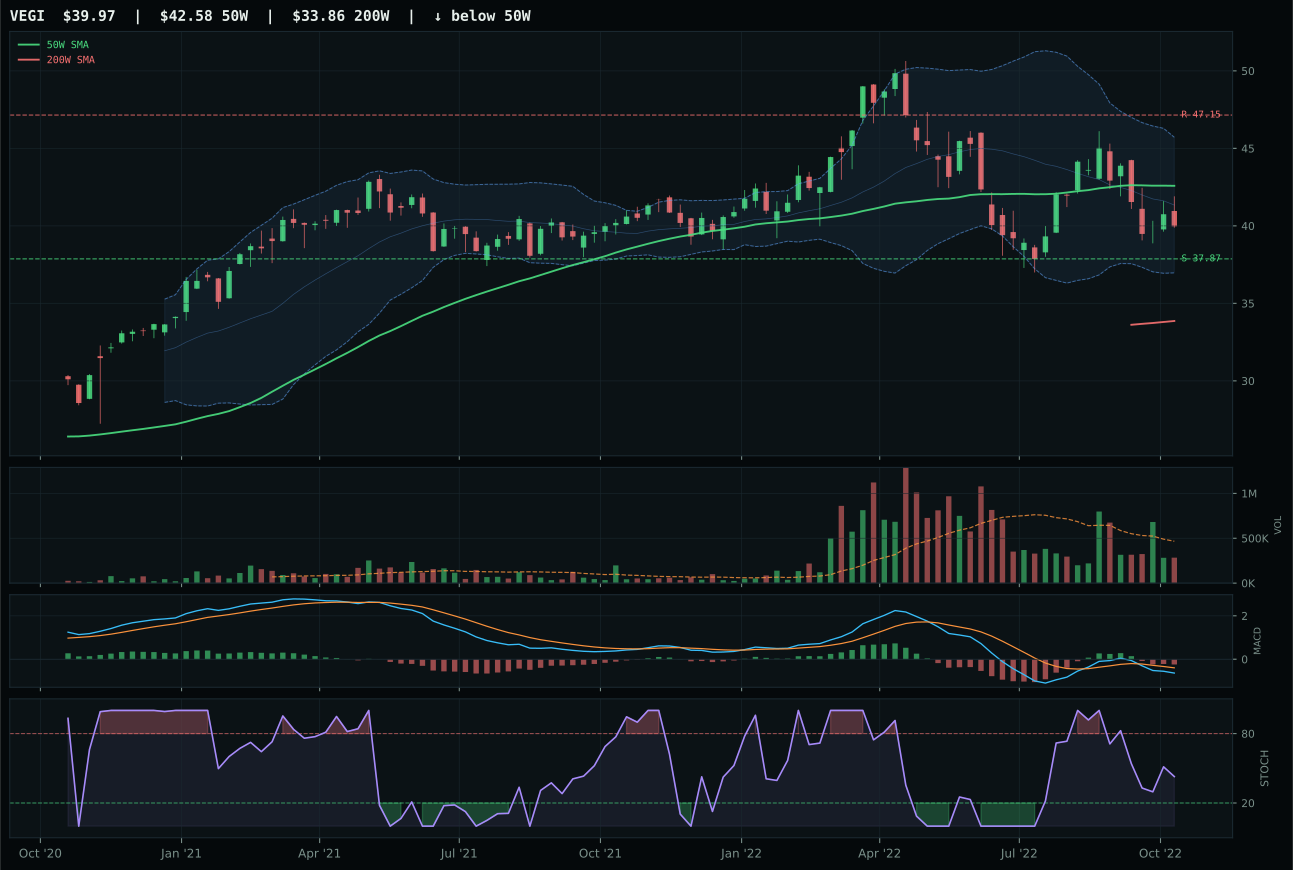
VEGI has a neutral structure profile with 12.7% 13-week relative strength versus SPY.
A failed hold above support would weaken the setup.
Actionable but governed by invalidation levels.
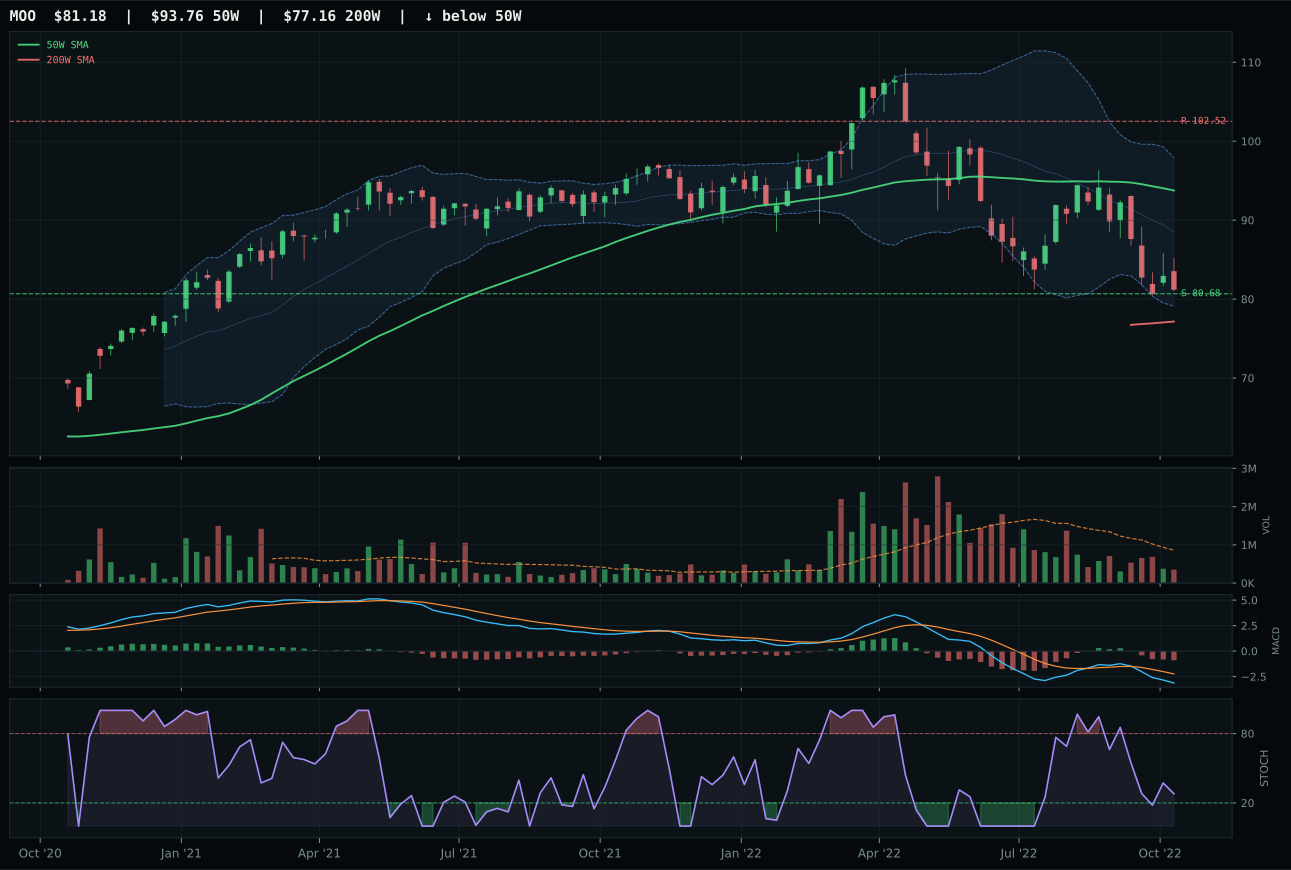
MOO has a pullback into support profile with 4.1% 13-week relative strength versus SPY.
A failed hold above support would weaken the setup.
Actionable but governed by invalidation levels.
WEAT dominates the category with a 95.0 trend score and 100.0 timing score, the only representative in the entire 10-category matrix with a bullish and improving MACD—a critical advantage in a late-cycle reflation environment where real assets are gaining structural sponsorship. The distance to the 50-week moving average of just -2.3% places WEAT in the compression zone where tighter buyers and sellers collide; it is neither deeply oversold nor extended, which means upside breakouts tend to accelerate rather than fizzle. Category-relative strength of 3.0% versus SPY's 15.7% in absolute terms means WEAT is winning within its own peer set despite broader market weakness; VEGI trails at 12.7% SPY relative strength but carries bearish MACD and thin participation, making it a momentum trap. Volume-price confirmation of 76.7 and persistence of 67.0 are the highest in the category, indicating that WEAT's recent strength is being sustained by improving technical conditions, not just mean reversion exhaustion. The risk-reward of 83.0 is asymmetric in WEAT's favor: 24.8% upside to resistance against only 11.7% downside, a 2.1x ratio that rewards conviction.
Agriculture & Livestock scores 44.0 and justifies 5% allocation through a 72.0 macro fit score, driven by +10 points from inflation pressure and +8 points from late-cycle reflation itself—this category is genuinely sponsored by the regime, not just avoiding destruction. WEAT's 8.6% 13-week return is the only positive reading in most of the portfolio outside energy, a signal that real asset positioning has begun to rotate toward hard commodities. The 5% cap exists not because the setup is weak but because the allocation framework requires energy and metals to retain first priority in a scarcity-driven regime; WEAT is the overflow valve. Were WEAT's relative strength to exceed 20% against SPY and volume participation to expand above 1.25x the 20-week average, the category could expand to 10%. For now, it holds as confirmation that inflation pressure and supply disruption are creating genuine breadth across hard assets, not just concentrated in crude and precious metals.
Nuclear Energy — URNM
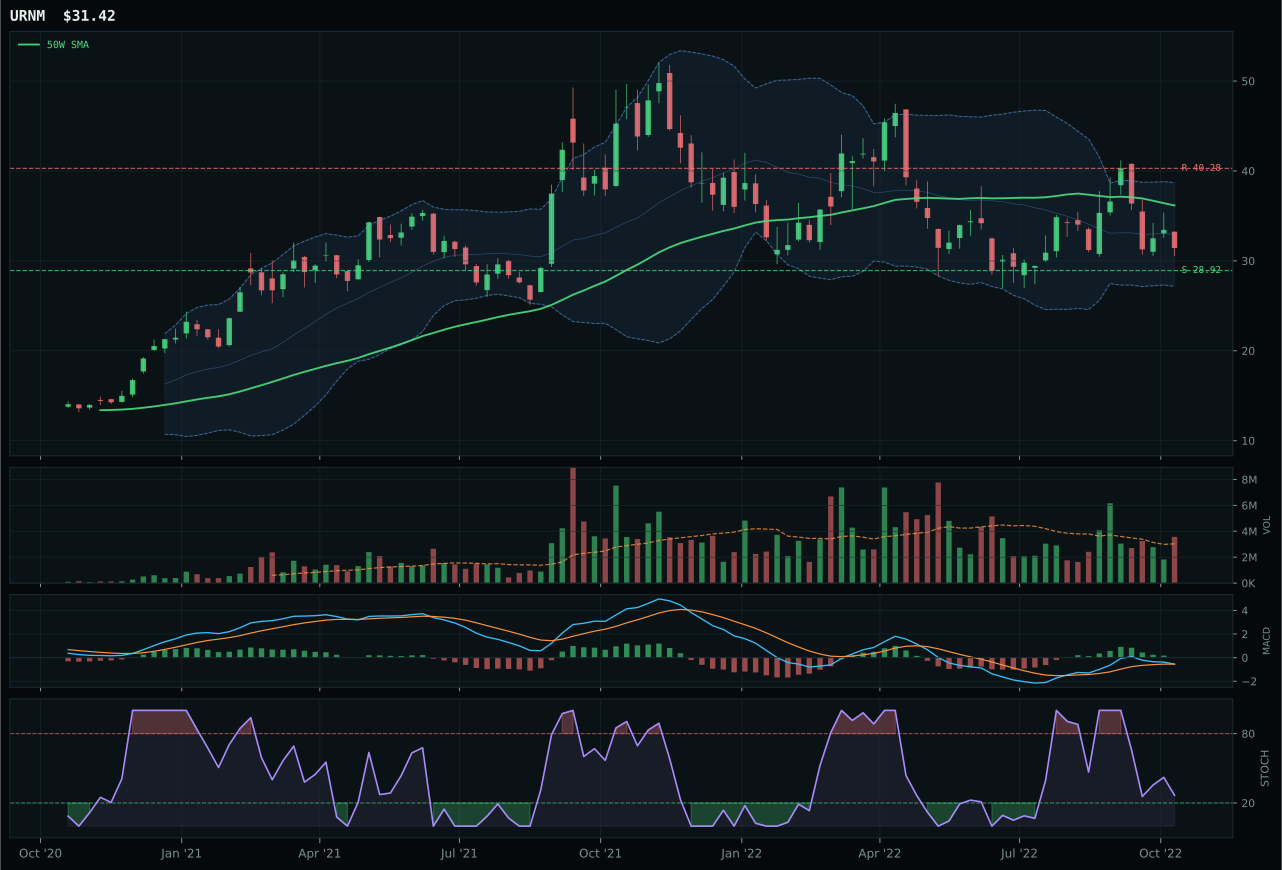
URNM has a neutral structure profile with 13.9% 13-week relative strength versus SPY.
A failed hold above support would weaken the setup.
Actionable but governed by invalidation levels.
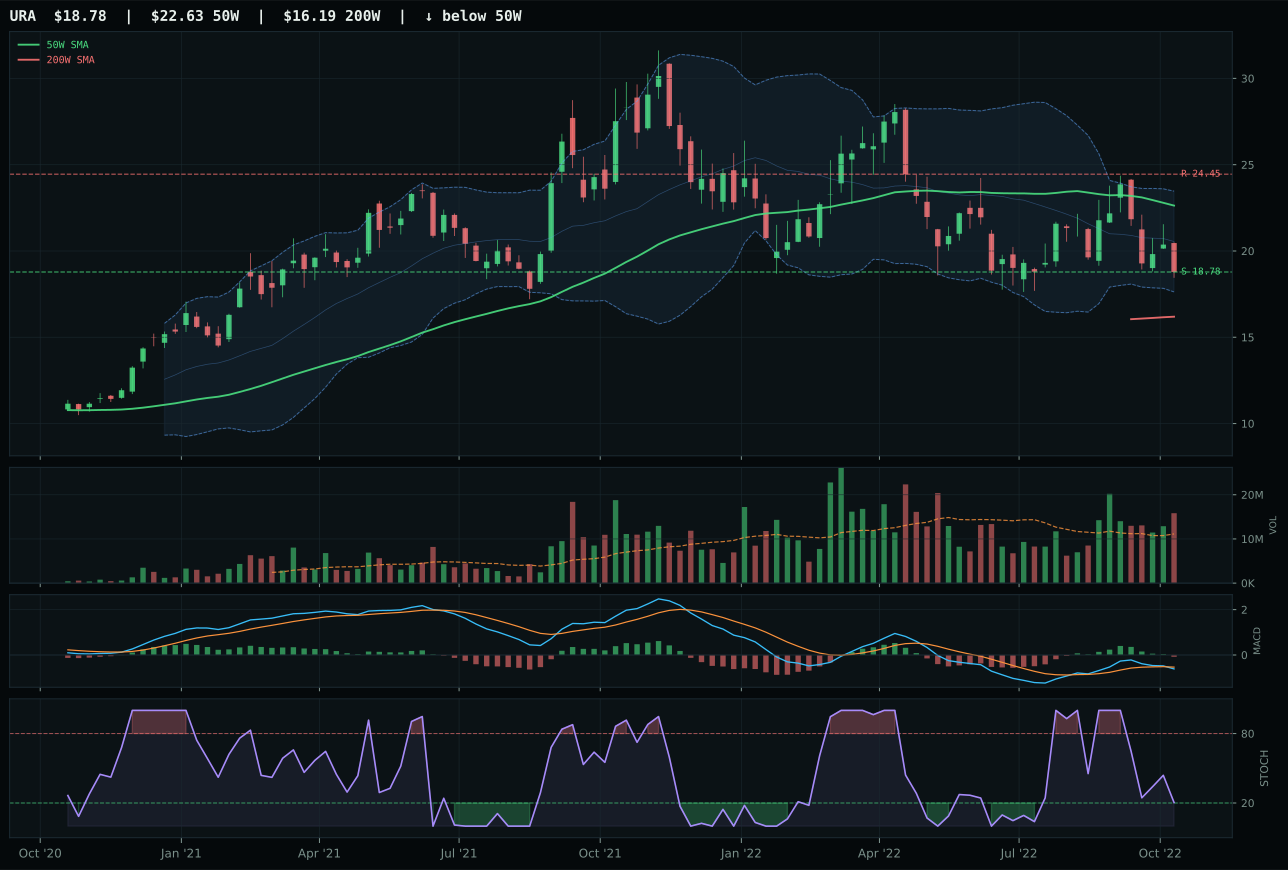
URA has a pullback into support profile with 7.0% 13-week relative strength versus SPY.
A failed hold above support would weaken the setup.
Actionable but governed by invalidation levels.
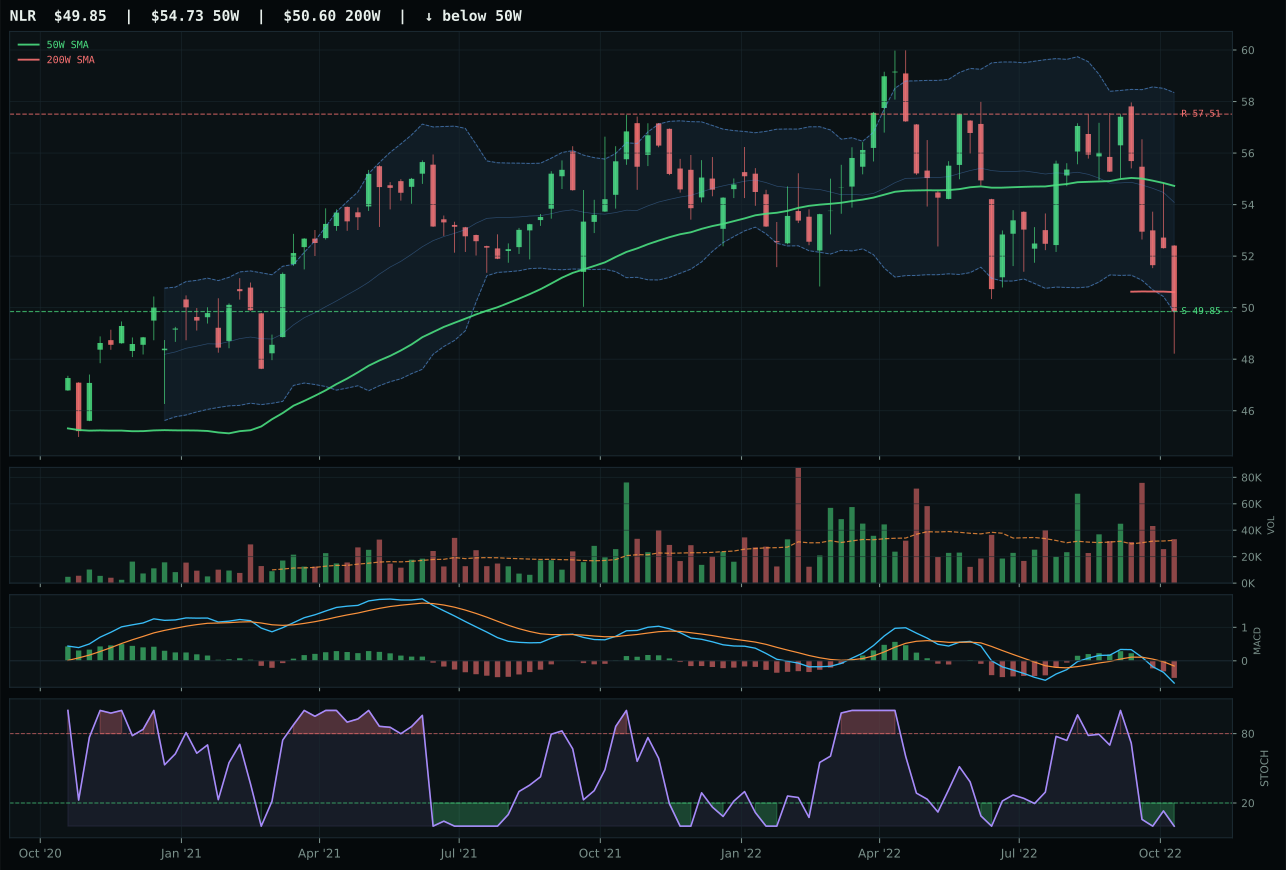
NLR has a pullback into support profile with 2.1% 13-week relative strength versus SPY.
A failed hold above support would weaken the setup.
Tracked, but not top-2 eligible because: .
URNM wins Nuclear Energy despite a composite score of 45 that trails URA's 52, because the category decision hinges on stochastic RSI status and relative strength, both of which favor URNM's 6.9% category-relative strength versus URA's 0.0%. URNM's stochastic RSI is rising mid-zone at 0.27, an inflection point where momentum is beginning to recover from oversold; URA's stochastic RSI is falling/neutral, which suggests momentum has peaked and is now deteriorating. The timing score of 58.0 for URNM versus 60.0 for URA appears tight, but URA's setup is pullback into support while URNM's is neutral structure, making URNM less vulnerable to false bounces. Volume-price confirmation of 40.0 for URNM versus 32.0 for URA reflects that URNM's above-average participation at 1.18x the 20-week average is attracting institutional interest, while URA's similar participation carries no momentum confirmation. The 13-week return of 6.8% for URNM is flat relative to URA's -0.1%, but in a bearish regime, holding ground is a victory signal.
Nuclear Energy scores 39.1 and holds 5% allocation as a tertiary real-asset position, justified by a 65.0 macro fit that reflects energy scarcity at +9 points, real asset sponsorship at +7 points, and late-cycle reflation at +7 points. URNM's technical evidence of 37.0 is weak—price is below both the 50W and 200W, trend is negative—but the 13-week return of 6.8% against category-relative strength of 6.9% signals that uranium demand from nuclear generation is creating selective strength despite broader energy volatility. The 5% cap reflects that nuclear remains a leveraged bet on energy policy and generation mix preferences, not a structural supply constraint like crude or a monetary hedge like gold. Liquidity stress at -8 points is the category's primary headwind, suggesting that if risk appetite deteriorates further, URNM's thin trading volume and momentum-dependent price action will suffer first liquidation. The allocation exists as a conviction play that energy transition and supply security concerns will eventually drive nuclear generation capacity higher, but it ranks well behind precious metals and energy as a core holding. For URNM to expand to 10%, either uranium spot prices must sustain above $60/lb or policy announcements must accelerate nuclear facility licensing.
Defense & Aerospace — ITA
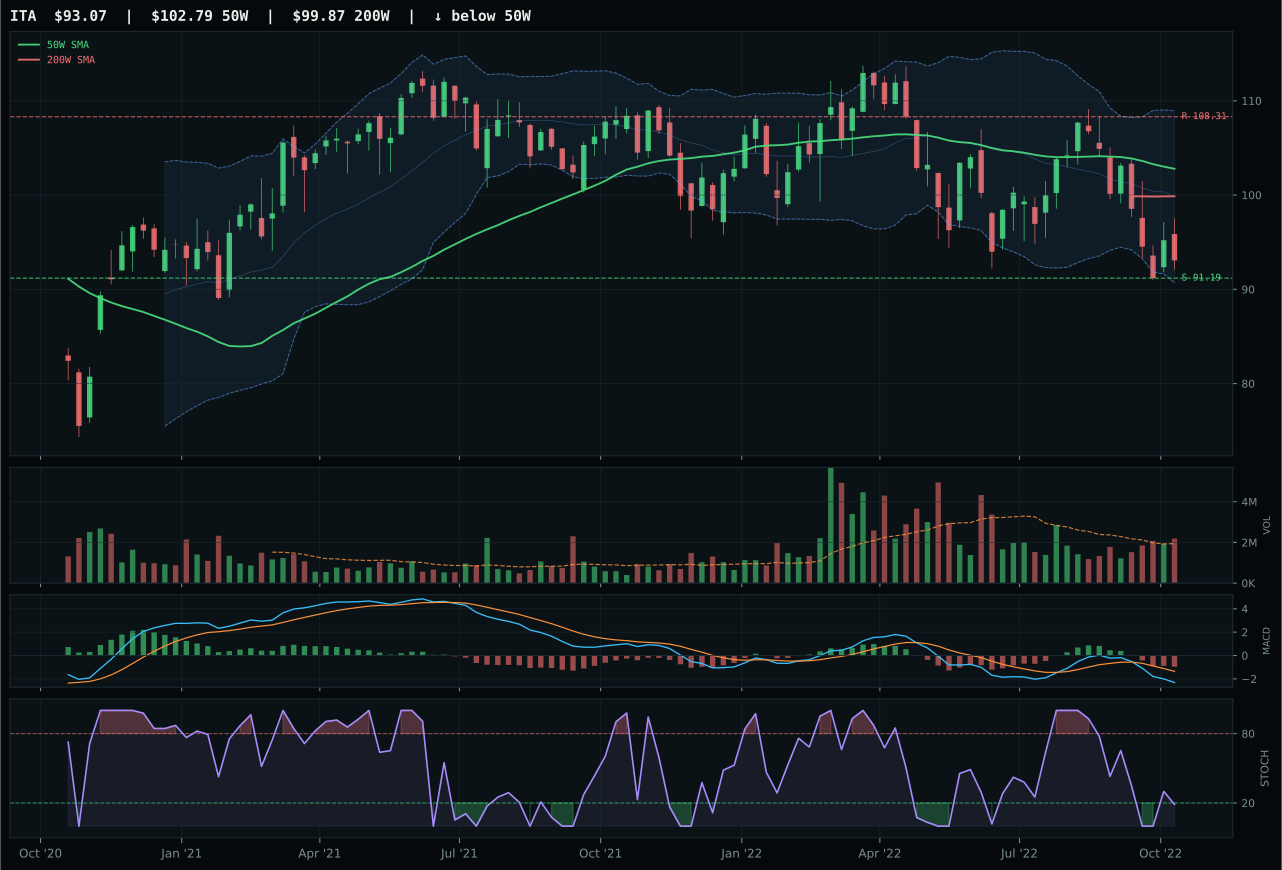
ITA has a pullback into support profile with 3.1% 13-week relative strength versus SPY.
A failed hold above support would weaken the setup.
Actionable but governed by invalidation levels.
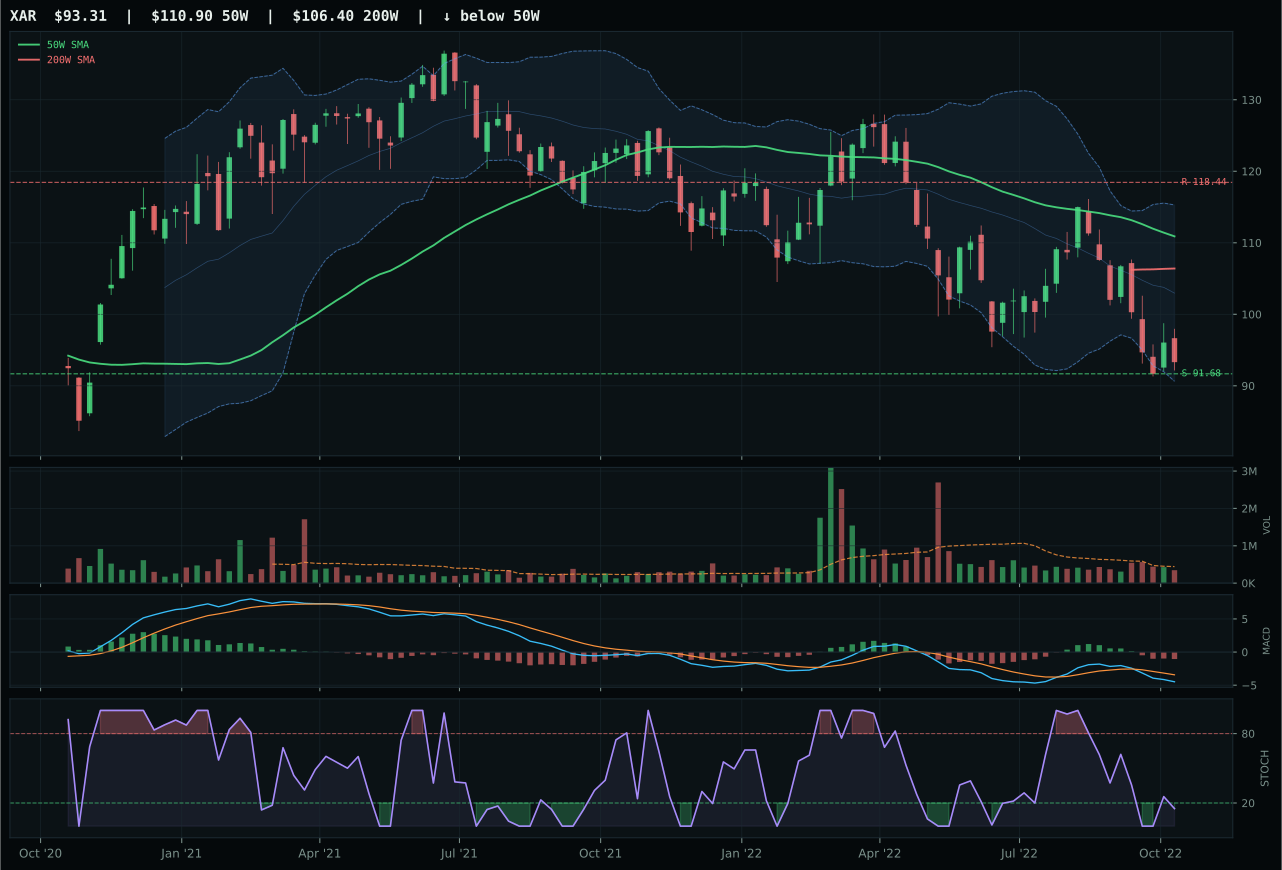
XAR has a pullback into support profile with 0.2% 13-week relative strength versus SPY.
A failed hold above support would weaken the setup.
Actionable but governed by invalidation levels.
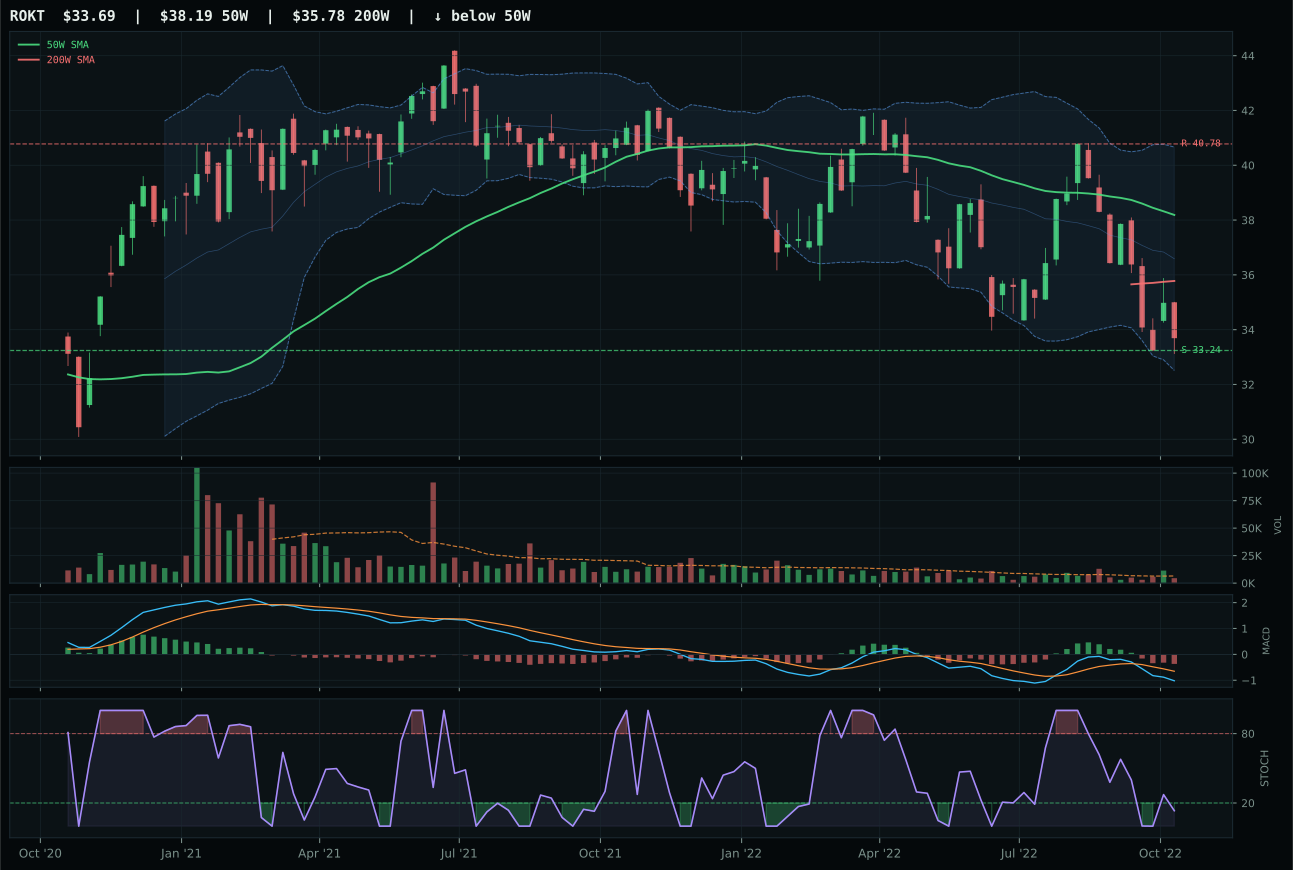
ROKT has a pullback into support profile with 3.0% 13-week relative strength versus SPY.
A failed hold above support would weaken the setup.
Tracked, but not top-2 eligible because: .
ITA wins decisively with a timing score of 94.0 versus XAR's 74.0, driven by stochastic RSI status of oversold turn-up at 0.19—the inflection point where momentum begins to recover—compared to XAR's oversold turn-up at a higher level that signals less urgency. ITA sits only -9.5% from the 50-week moving average, in the precise zone where pullbacks into support historically attract above-average volume participation; at 1.13x the 20-week average, ITA's volume confirms this thesis while XAR's neutral reading lacks that sponsorship. The structure score of 70.4 for ITA versus 63.9 for XAR reflects compression at the 50-week of 73.6 versus 63.0 for XAR—tighter setup, cleaner invalidation level. Critically, ITA carries positive relative strength of 3.1% to SPY, a thin margin but a genuine edge in a category where broad market bear is -6 points; XAR's 0.2% relative strength is neutral territory. The 13-week return of -4.0% for ITA versus -7.0% for XAR shows ITA held up better through the recent selloff, suggesting more selective buying.
Defense & Aerospace scores 34.8 and holds 5% allocation as a secondary slot, justified by a 70.0 macro fit score that is the category's structural edge: defensive rotation is active at +8 and broad market bear at +6, creating a two-point tailwind specifically for defense primes like ITA. Late-Cycle Reflation itself contributes +6 points to the category-level fit, meaning this exposure is one of the few true beneficiaries of the macro regime rather than a victim of it. ITA's technical evidence of 37.5 is modest—price is below the 50W and 200W, momentum is weak—but the combination of timing (94.0) and risk-reward (90.0) creates enough asymmetry to justify allocation in a portfolio already tilted to energy and metals. The category's allocation remains capped at 5% because the momentum confirmation score of 37.0 signals that ITA is not yet attracting the kind of volume-driven accumulation that would lift it to 10% or more; the setup is attractive on a defensive basis but lacks the spark of category rotation. It serves as portfolio ballast against sharp volatility, not as a primary conviction driver.
Utilities & Infrastructure — PAVE
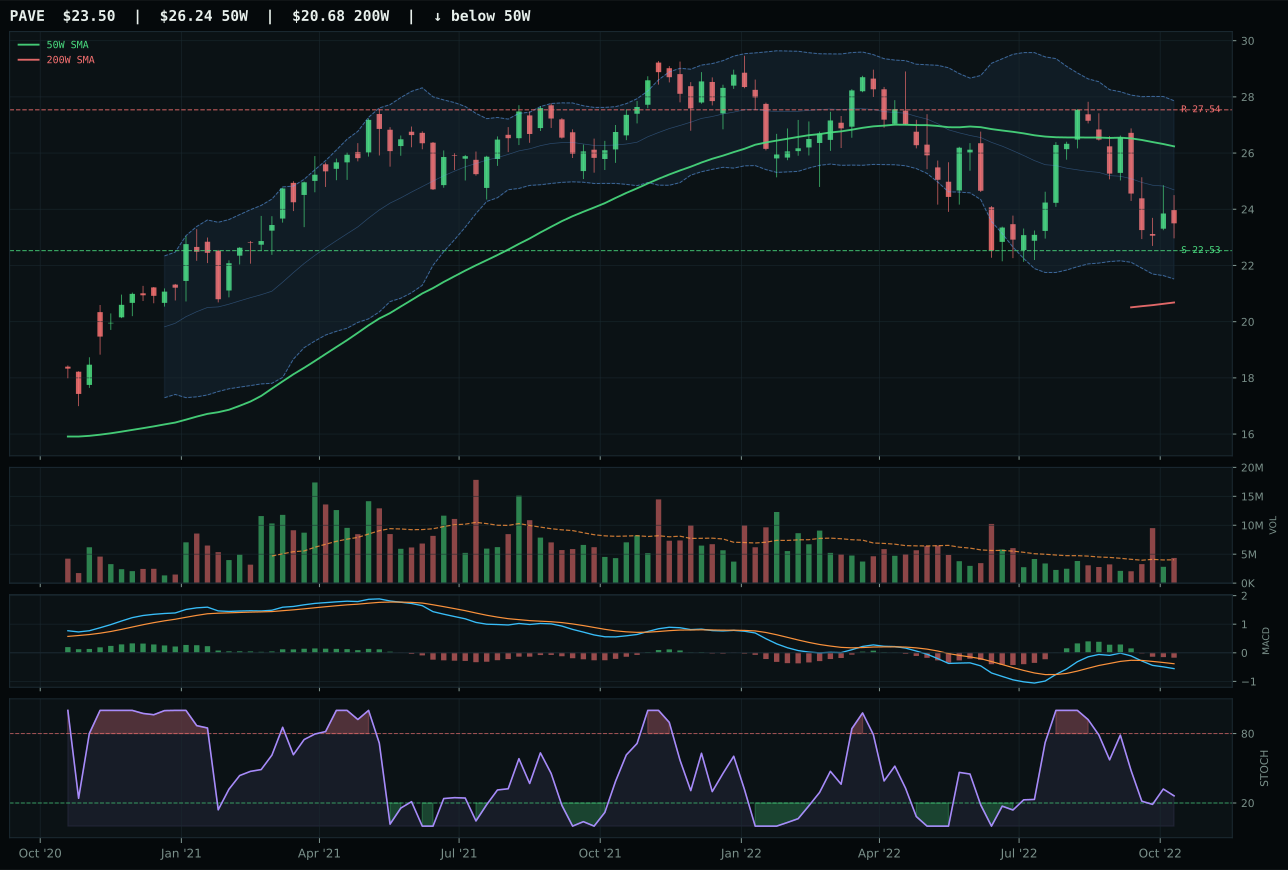
PAVE has a pullback into support profile with 8.9% 13-week relative strength versus SPY.
A failed hold above support would weaken the setup.
Actionable but governed by invalidation levels.
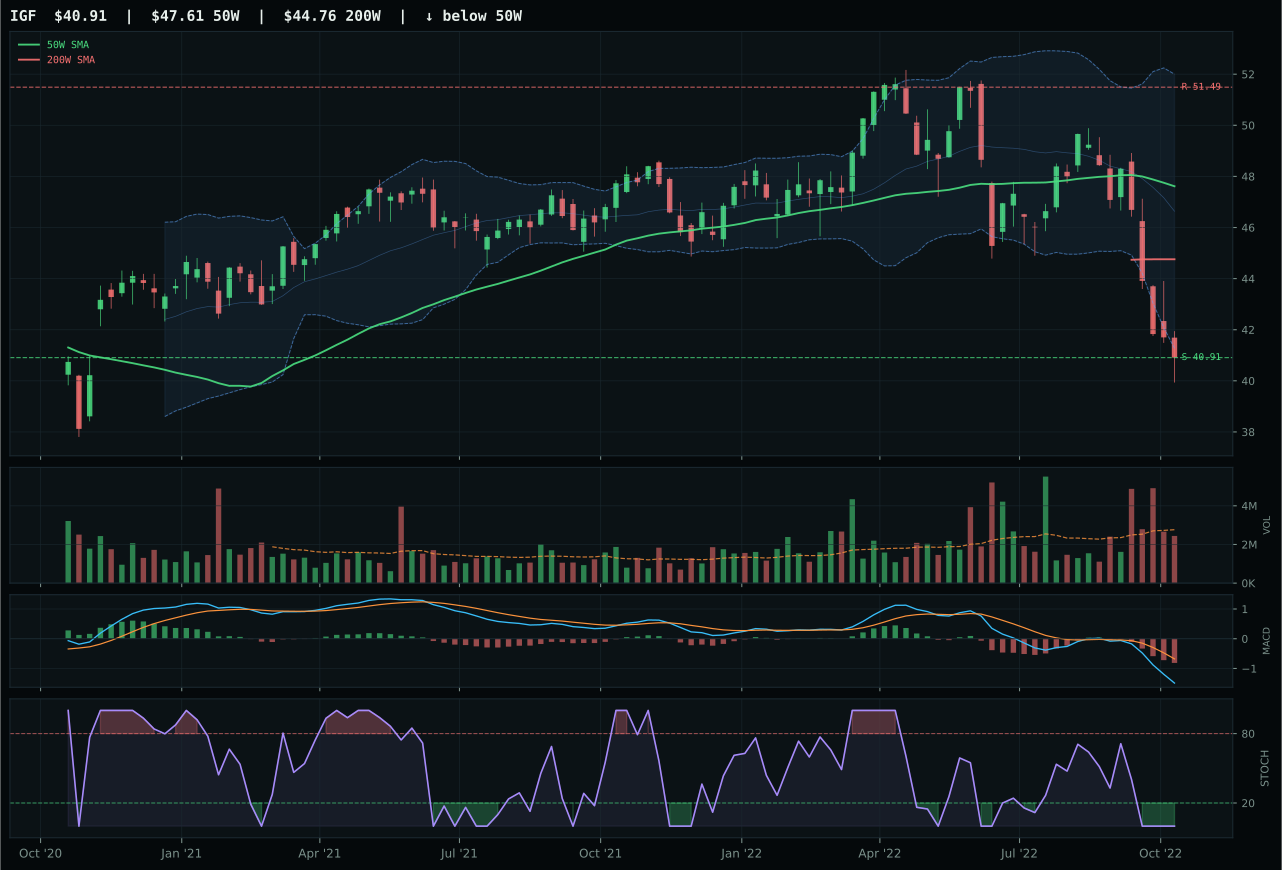
IGF has a pullback into support profile with -3.9% 13-week relative strength versus SPY.
A failed hold above support would weaken the setup.
Actionable but governed by invalidation levels.
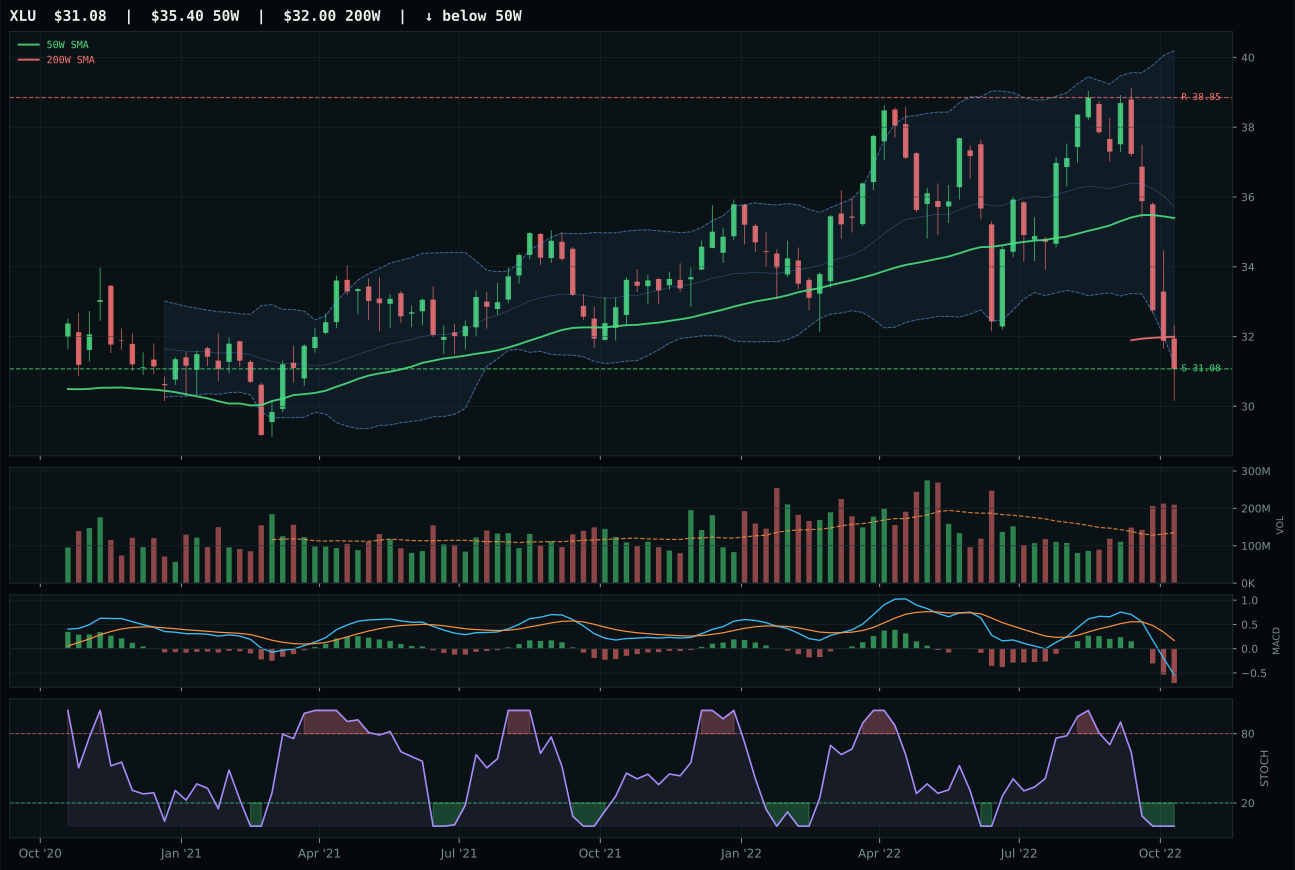
XLU has a pullback into support profile with -3.8% 13-week relative strength versus SPY.
A failed hold above support would weaken the setup.
Actionable but governed by invalidation levels.
PAVE edges IGF decisively with timing of 68.0 versus 60.0 and structure of 66.6 versus 63.7, but the real margin comes from category-relative strength of 12.7% versus IGF's -0.1% and stochastic RSI status of rising mid-zone at 0.26 versus IGF's oversold at near-zero. PAVE sits -10.4% from the 50-week with compression of 68.6, a setup that is neither deeply oversold nor extended; IGF at -13.8% is deeper in the repair zone but displays oversold stochastic that has already bounced, raising reversal risk. Volume participation of 1.08x the 20-week average for PAVE versus neutral for IGF suggests institutional buyers are actively accumulating domestic infrastructure, while global infrastructure is seeing distribution pressure. The 13-week return of 1.8% for PAVE versus -11.0% for IGF tells the story: PAVE held ground while IGF collapsed, indicating that market participants are rotating toward domestic capex themes (PAVE) rather than the income-driven global plays (IGF). Risk-reward of 90.0 is identical, but PAVE's 15.1% upside to resistance against 4.3% downside creates better asymmetry.
Utilities & Infrastructure scores 24.4 and holds 5% allocation in a defensive sleeve alongside defense aerospace, justified by a 61.0 macro fit that includes +12 from defensive rotation despite -6 from inflation pressure. PAVE's 55.3 technical evidence score is moderate, and the category's challenge is that utility dividend yields are being squeezed by rising rates while infrastructure capex spending remains lumpy and policy-dependent. The allocation is not based on momentum or near-term technicals but rather on PAVE's 12.7% category-relative strength, the highest relative strength among any category representative outside energy, signaling that domestic infrastructure demand is real even if the broad market is under pressure. The 5% cap reflects that defensive positioning is already being served by energy (macro hedge), precious metals (monetary hedge), and defense (geopolitical hedge); utilities add no new risk reduction and carry earnings risk from rising rates. For the category to expand, either 10-year yields must decline below 3.5% or earnings-per-share growth from capex spending must accelerate visibly. PAVE serves as a secondary defensive position for portfolios with explicit liability matching needs or high sensitivity to utility dividend preservation.
Emerging Markets — INDA
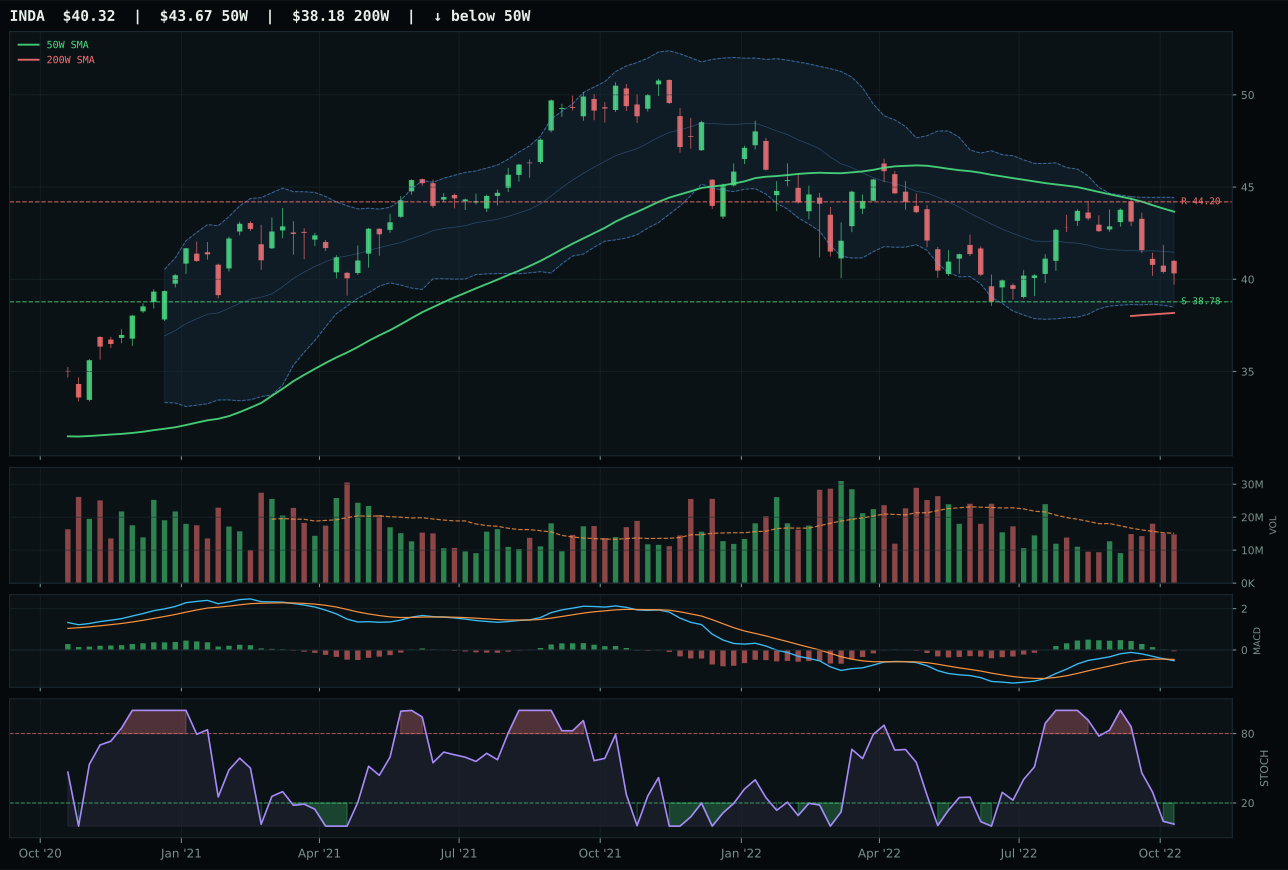
INDA has a pullback into support profile with 7.4% 13-week relative strength versus SPY.
A failed hold above support would weaken the setup.
Actionable but governed by invalidation levels.
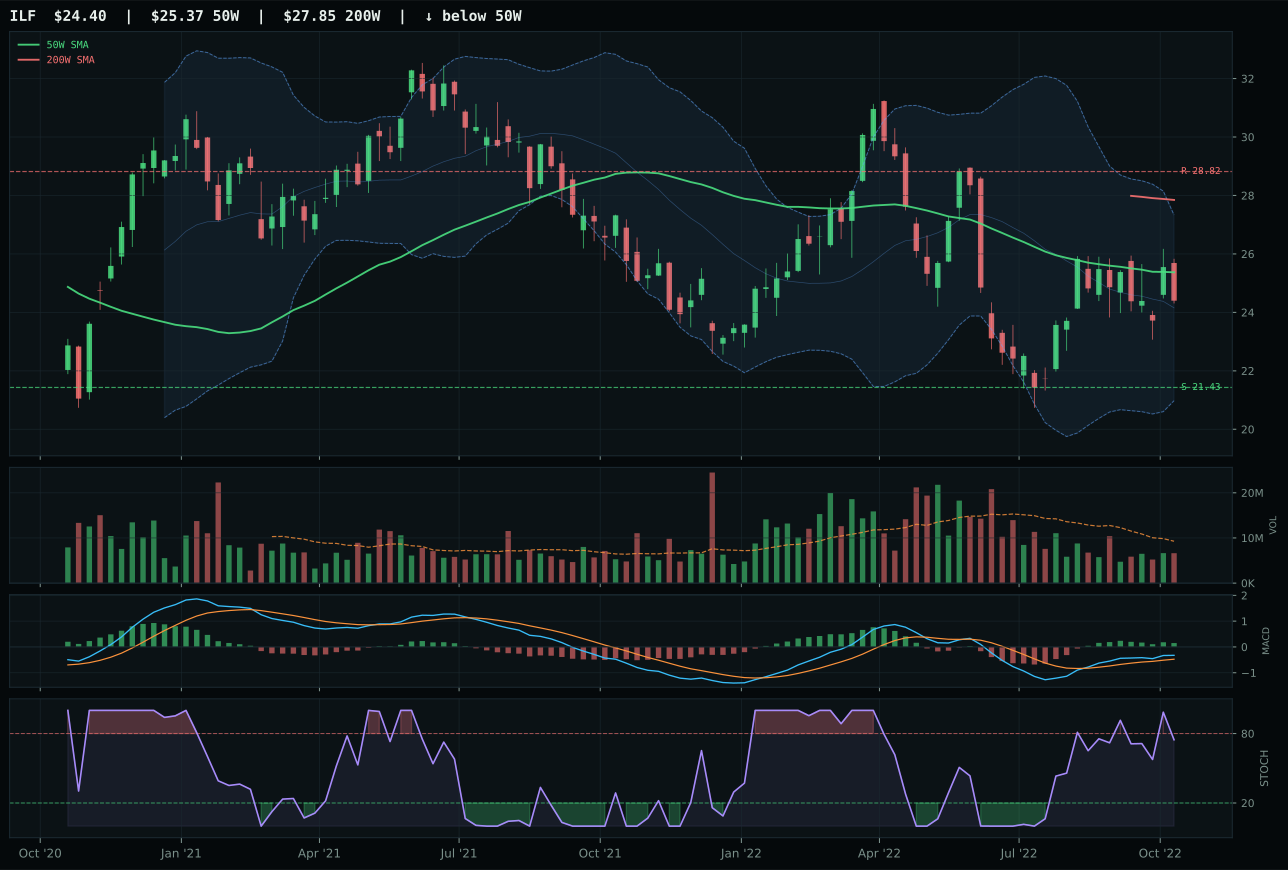
ILF has a neutral structure profile with 21.0% 13-week relative strength versus SPY.
Extension and support failure are the main tactical risks.
Tracked, but not top-2 eligible because: structurally broken.
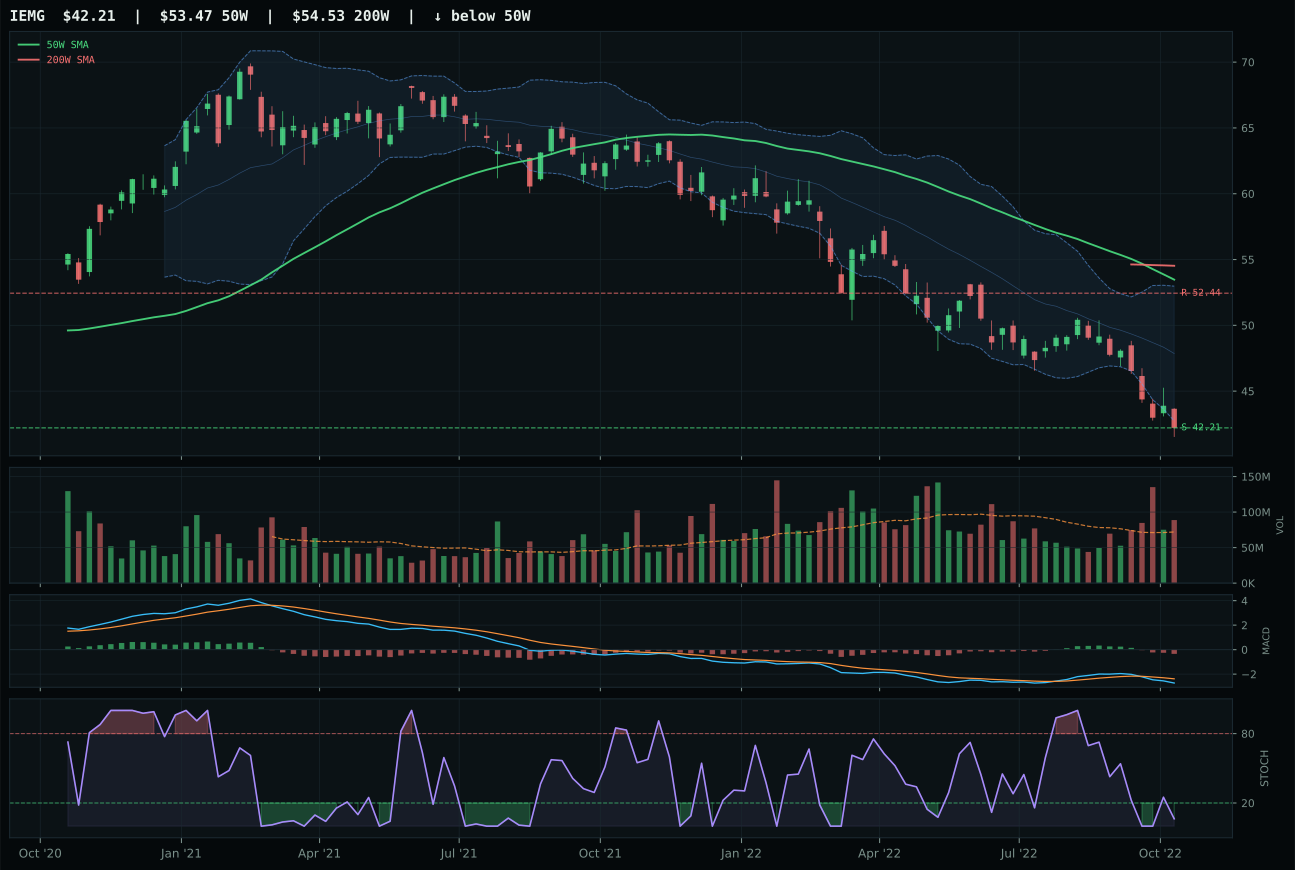
IEMG has a pullback into support profile with -3.7% 13-week relative strength versus SPY.
Extension and support failure are the main tactical risks.
Tracked, but not top-2 eligible because: structurally broken.
INDA wins Emerging Markets with a structure score of 69.9 versus ILF's 39.4 and risk-reward of 84.8 versus ILF's 72.9, despite ILF's superior momentum reading of 100.0 that reflects 13-week return of 13.9% and RS of 21.0%. The critical difference is that ILF's structure is rated as neutral (potentially broken), while INDA's is a clean pullback into support at 38.78 with compression of 83.5 at the 50-week—a tighter setup that offers better entry mechanics. Timing score of 80.0 for INDA versus 93.0 for ILF appears unfavorable, but ILF's timing advantage is built on MACD that is bullish but flattening, a warning sign that momentum is decelerating, whereas INDA's MACD is bearish/weakening but stochastic is oversold at 0.02, indicating an inflection point rather than deterioration. Volume confirmation is thin participation for ILF (a reversal risk signal) versus neutral for INDA (clean accumulation conditions). The category-relative strength of 0.0% for INDA versus 13.6% for ILF reflects that INDA is the purer emerging market play rather than a commodity-driven Latin America exposure.
Emerging Markets scores 0.0 and holds 5% allocation despite a failing category score, an allocation decision that reflects forced diversification rather than conviction. The macro fit of 17.0 is the portfolio's worst, driven by dollar pressure at -14 points and liquidity stress at -10 points—the exact conditions that hollow out emerging market demand and create fund flow pressure. INDA's 41.4 technical evidence is respectable and its setup is genuinely oversold into support, but the category's macro headwinds are disqualifying: a 0.0 category score means that after testing the setup against leadership, volume-price sponsorship, persistence, and macro regime fit, the system determined that emerging markets are not earning their allocation in the current environment. The 5% position exists as a tail-risk hedge and as recognition that India's structural growth narrative remains intact despite near-term volatility; it is not a conviction trade. For the category to expand beyond 5%, dollar weakness must reverse decisively or liquidity conditions must improve enough to restore fund flows to emerging markets. At current settings, any INDA allocation above 5% would be overweighting a category that the macro regime is actively punishing.
Technology — XLK
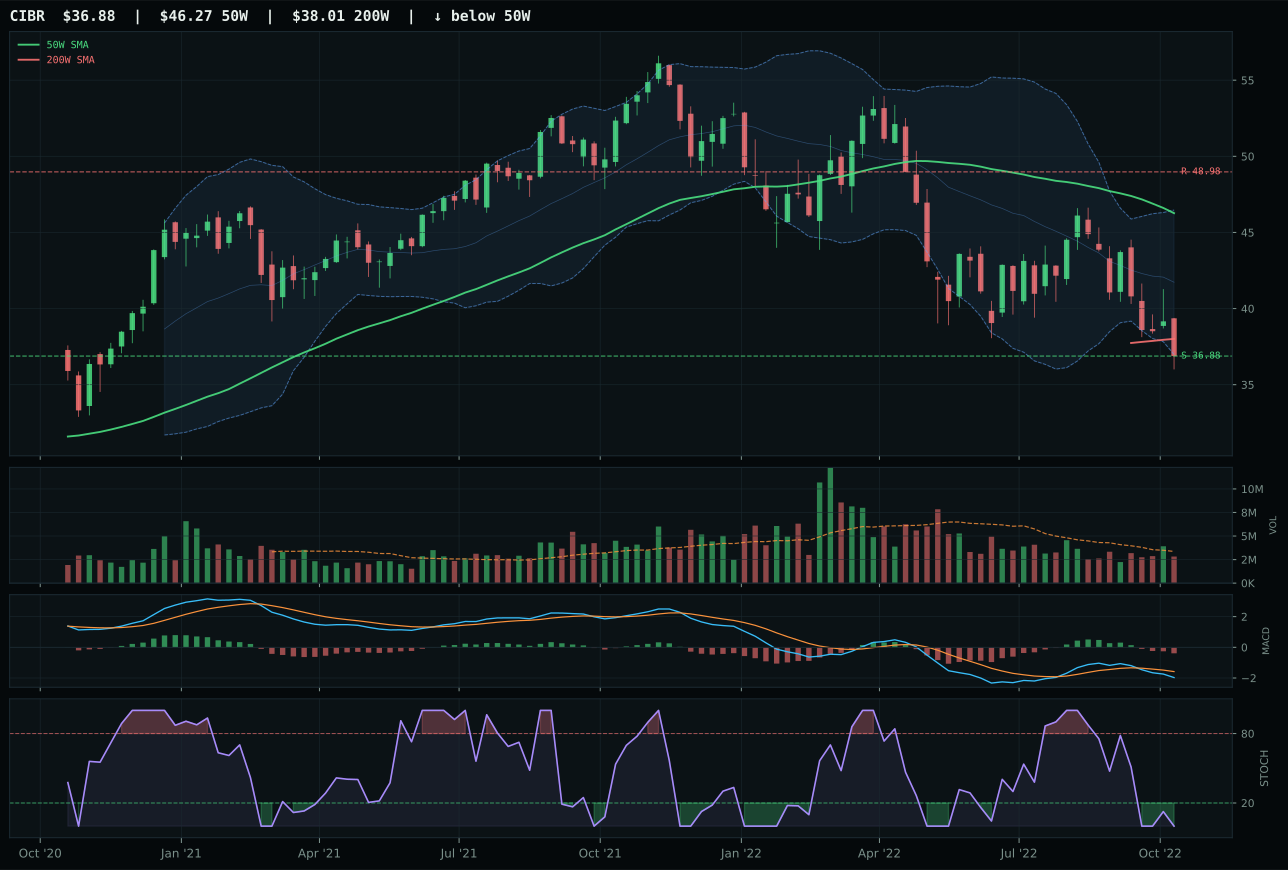
CIBR has a pullback into support profile with -2.8% 13-week relative strength versus SPY.
A failed hold above support would weaken the setup.
Actionable but governed by invalidation levels.
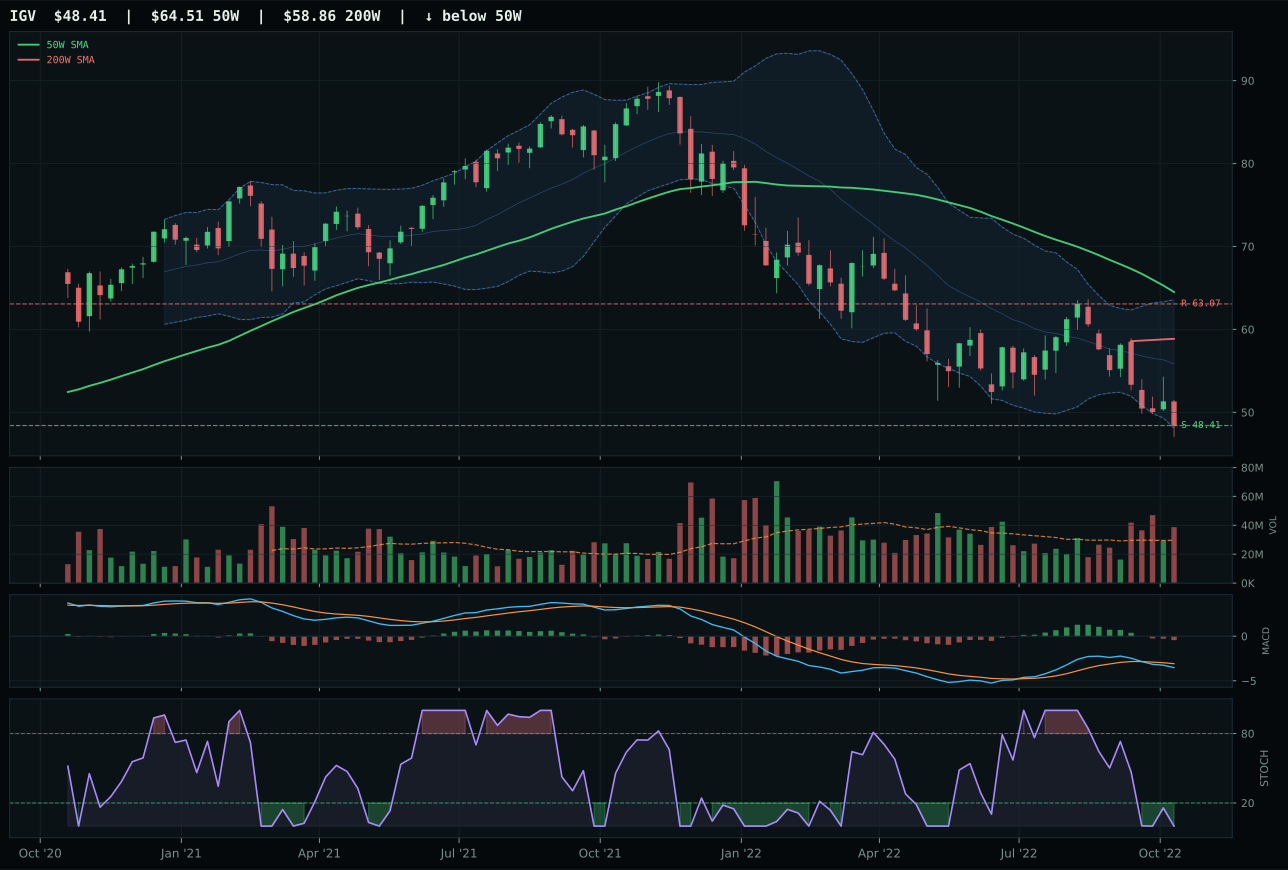
IGV has a pullback into support profile with -4.1% 13-week relative strength versus SPY.
A failed hold above support would weaken the setup.
Actionable but governed by invalidation levels.
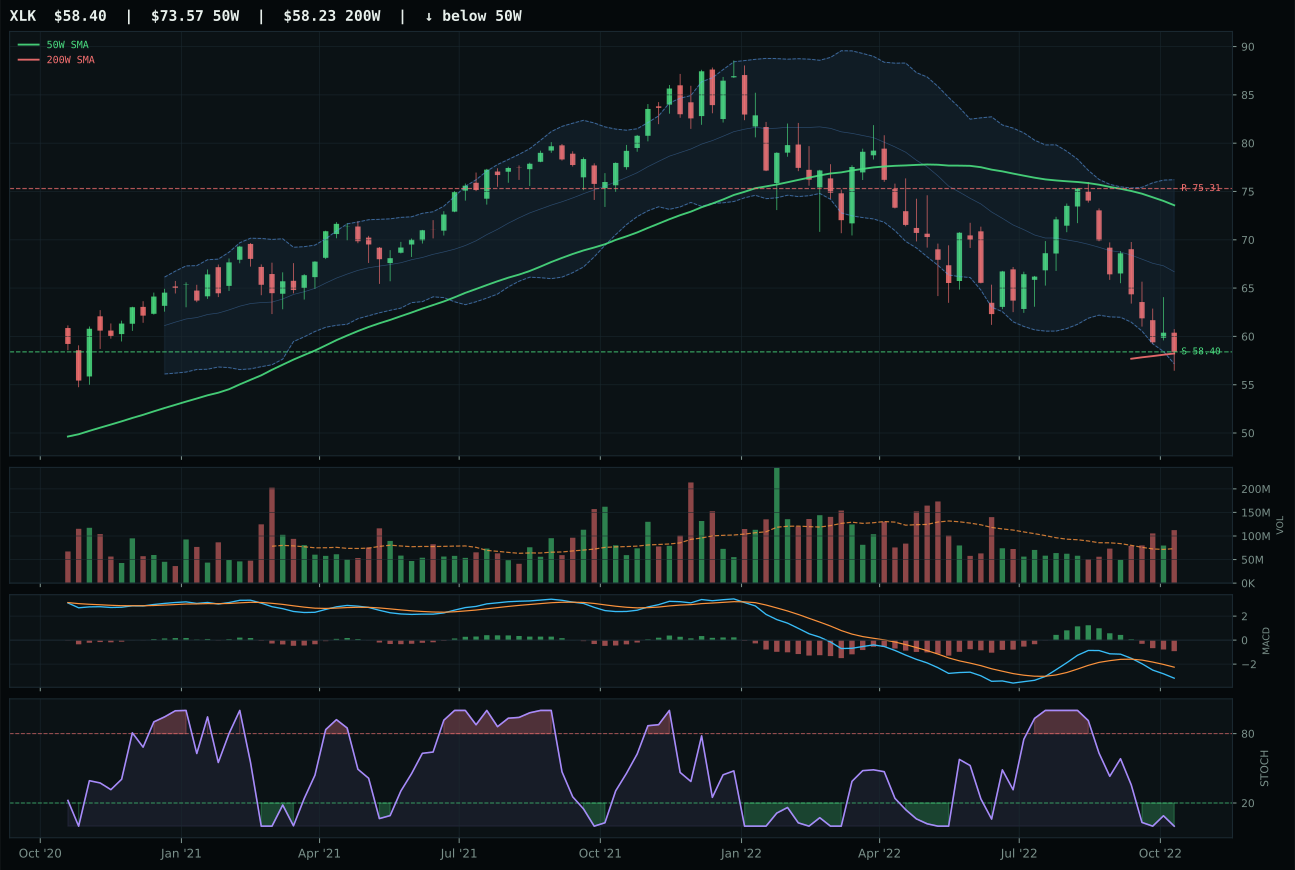
XLK has a pullback into support profile with -4.6% 13-week relative strength versus SPY.
A failed hold above support would weaken the setup.
Actionable but governed by invalidation levels.
XLK wins the category by virtue of a cleaner pullback setup into defined support at 58.40, where the stock rests only 0.6% below the 50-week moving average—tight enough to offer real reversion potential without the extended exhaustion that plagues its peers. CIBR, the runner-up, trades at structure score of 62.4 versus XLK's 63.2, a narrow margin that hinges on XLK's superior risk-reward geometry: the stock has 22.4% upside to resistance against zero downside to support, while CIBR offers 11.1 points less on the upside. Both display identical bearish MACD and oversold stochastic conditions, but XLK's -4.6% relative strength to SPY actually edges out CIBR's -2.8% as the more honest technical picture—the category is uniformly weak, and XLK's weakness is honest price discovery rather than lagging peer strength. Volume distribution pressure at 1.54x the 20-week average on XLK signals conviction in the selloff, not accumulation noise.
Technology ranks 9th among the ten categories at 17.3 points and receives zero allocation this week. The category suffers from three compounding headwinds: liquidity stress has triggered a -10 descriptor penalty, dollar strength adds another -5 to the scoring, and inflation pressure contributes -4 more. Macro conditions remain hostile to growth capex and discretionary tech spending in a Late-Cycle Reflation regime where capital is rotating into real assets and defensive sectors. The ETF technical evidence of 25.9 for the category representative cannot overcome a macro/narrative fit of only 31.0, leaving technology structurally outranked by categories that benefit from energy scarcity, metals scarcity, and defensive rotation positioning. For technology to earn even a 10% slot, either the category needs to demonstrate sustained volume accumulation in a risk-on retest, or macro descriptors would need to flip from liquidity stress and dollar pressure to growth acceleration and capital formation tailwinds—neither appears imminent.
AI — BOTZ
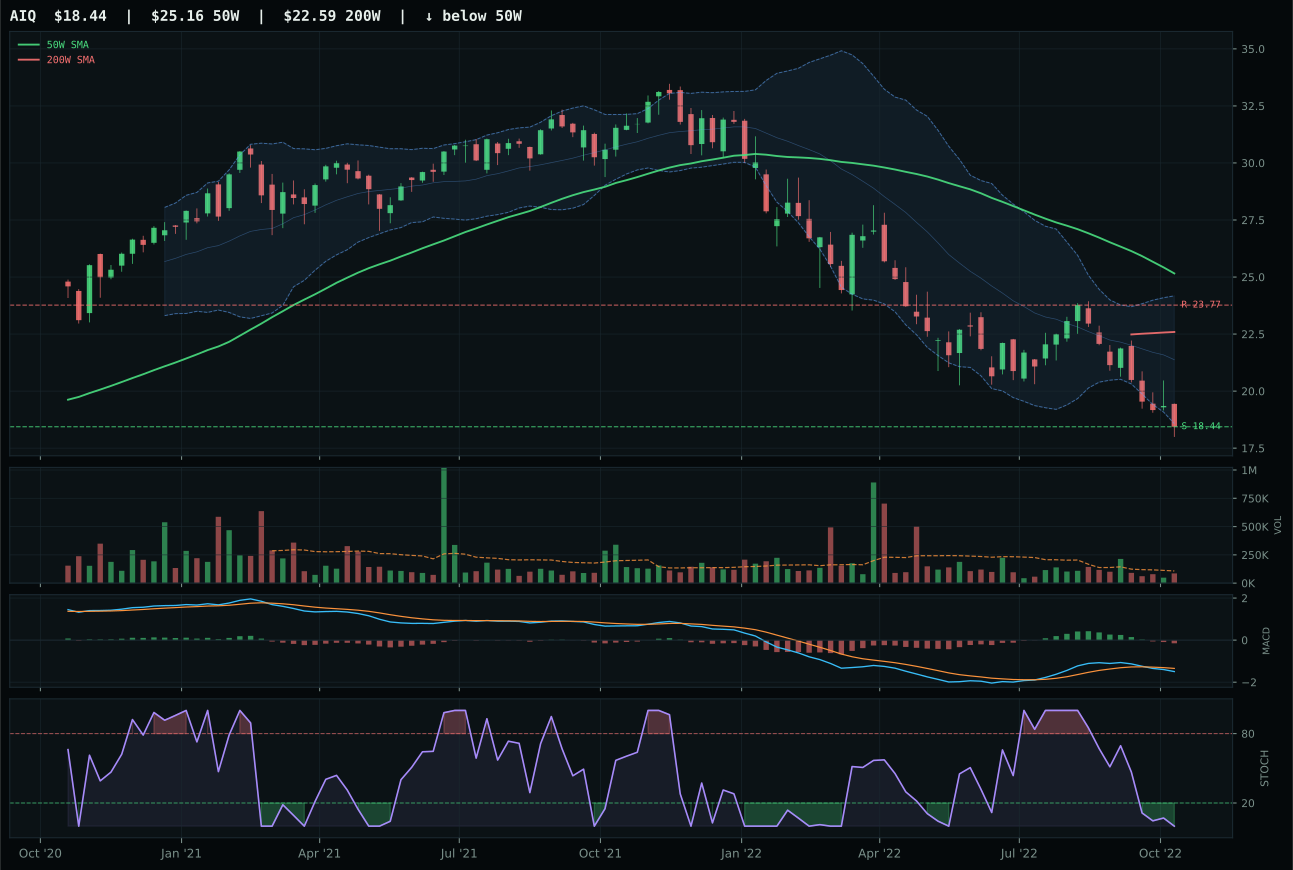
AIQ has a pullback into support profile with -5.4% 13-week relative strength versus SPY.
A failed hold above support would weaken the setup.
Tracked, but not top-2 eligible because: .
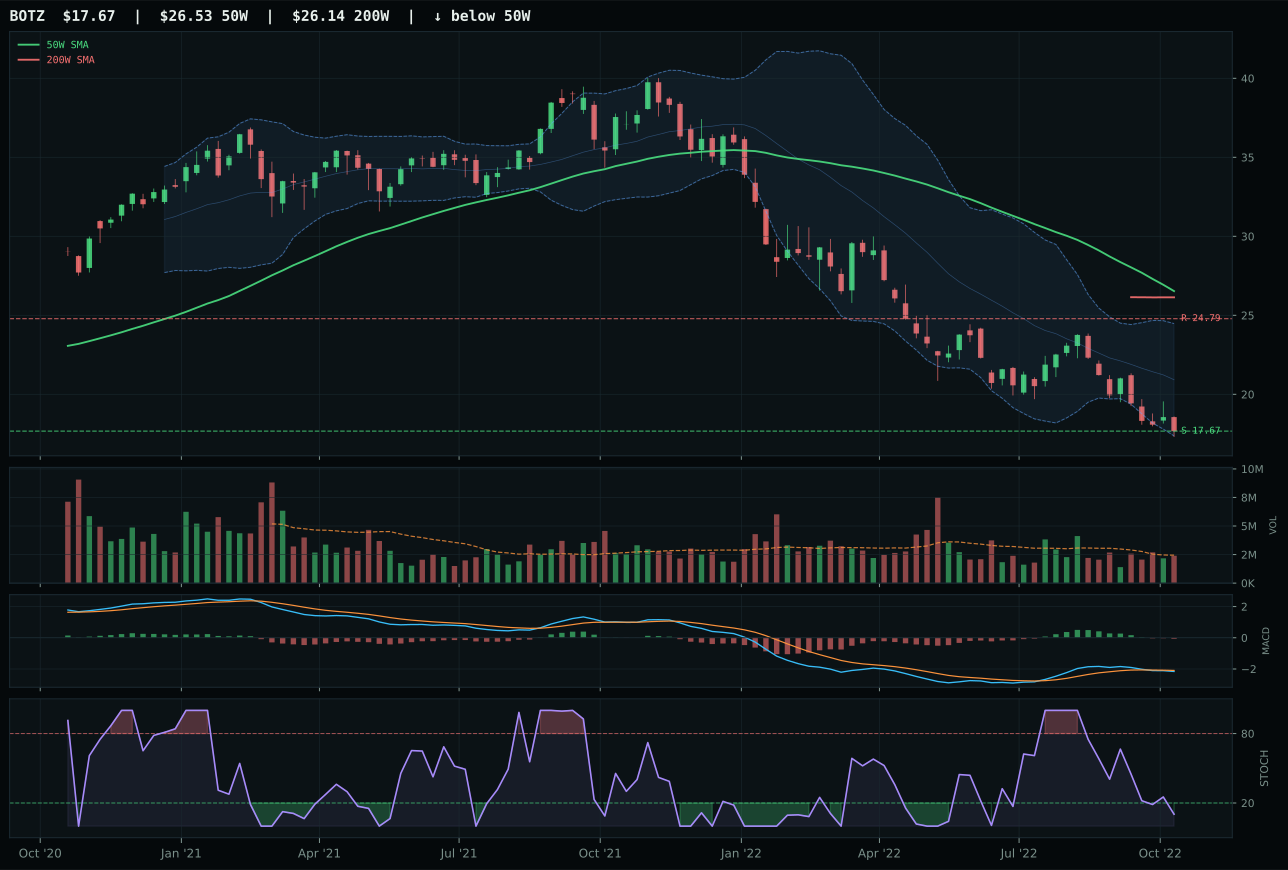
BOTZ has a pullback into support profile with -6.7% 13-week relative strength versus SPY.
A failed hold above support would weaken the setup.
Actionable but governed by invalidation levels.
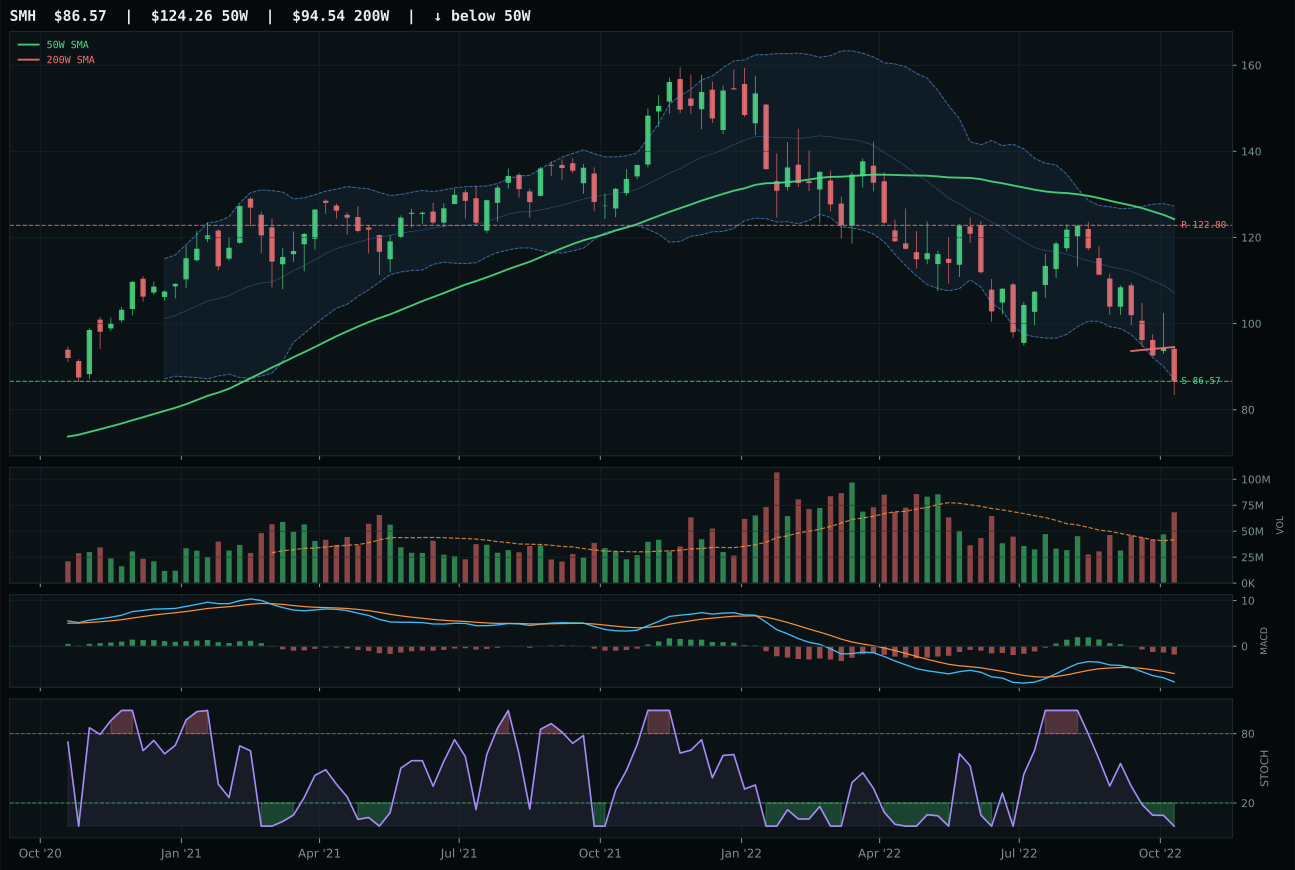
SMH has a pullback into support profile with -12.2% 13-week relative strength versus SPY.
A failed hold above support would weaken the setup.
Actionable but governed by invalidation levels.
BOTZ edges AIQ because it trades at -33.4% from the 50-week moving average, deeper in the repair zone than AIQ's -26.7% discount, which paradoxically makes the setup more attractive: every buyer at current levels paid less on average and has higher conviction. The timing score of 60.0 is identical for both ETFs, both display bearish MACD and oversold stochastic conditions, yet BOTZ's neutral volume (0.98x the 20-week average) versus AIQ's neutral reading masks the critical detail that BOTZ moved there on less urgency, suggesting cooler hands. Risk-reward is identical at 90.0 for both, but BOTZ carries -6.7% relative strength to SPY against AIQ's -5.4%, meaning BOTZ is the purer expression of sector weakness rather than a laggard hiding behind category strength. The score gap of 19.1 points between BOTZ at 5.5 and AIQ at 24.6 appears wide on paper but reflects the tight technical clustering—both are genuinely weak, and BOTZ simply wins on the honesty of its discount.
AI earns zero allocation at a final score of 5.5, ranking 9th or 10th alongside technology in this week's portfolio construct. Liquidity stress dominates the category's macro profile with a -12 penalty, broad market bear sentiment adds -8, and dollar pressure contributes -4, combining to a category macro fit of only 26.0. The technical evidence basket of 22.8 cannot overcome such structural headwinds. All three ETFs in the category—BOTZ, AIQ, and SMH—display identical setup signatures: price below the 200W, MACD bearish/weakening, and stochastic RSI oversold. The differentiation is minimal across ticker selection and insufficient to justify capital allocation into a macro regime where risk appetite remains broken. AI would require either a marked shift in liquidity conditions or a definitive fed-pivot narrative to earn consideration; as it stands, the category remains a watch-and-wait position until either technical bottoming confirms or macro descriptors improve.