
2022-10-07
Informational purposes only. The content in this report, including allocations, analysis, and commentary, is provided solely for informational and educational purposes. It does not constitute financial advice, investment advice, trading advice, or any other type of advice. Past performance does not guarantee future results. Always conduct your own research and consult a qualified financial professional before making investment decisions.
GLD defensive overlay excluded: price is below its 8W SMA. Cause selector will use cash alternative.
Fast-crash circuit breaker triggered: SPY dropped more than 8% from its 4-week high this week. Defensive overlay activated immediately.
Macro risk engine requires the 50% Defensive overlay for this run; payload selected by cause: Inflation Scarcity.
Weekly Allocation
| Ticker | Category | Weight | Role |
|---|---|---|---|
| XLE | Traditional Energy | 60% | Overlay |
| GLD | Precious Metals | 10% | Top-2 (10%) |
| URA | Nuclear Energy | 5% | Tier-2 (5%) |
| WEAT | Agriculture & Livestock | 5% | Tier-2 (5%) |
| COPX | Industrial Metals | 5% | Tier-2 (5%) |
| ITA | Defense & Aerospace | 5% | Tier-2 (5%) |
| PAVE | Utilities & Infrastructure | 5% | Tier-2 (5%) |
| CIBR | Technology | 5% | Tier-2 (5%) |
Trade Instructions — Monday Open
Sell the tranche from 2022-09-09 (completing its 4-week hold). Buy the new tranche. Instructions show net portfolio changes — same-asset positions cancel, weight changes show the delta.
| Action | Ticker | Instruction |
|---|---|---|
| SELL | SGOV | Sell 18% of SGOV position (reduce 27.50% → 22.50%) |
| SELL | GLD | Sell 15% of GLD position (reduce 16.25% → 13.75%) |
| SELL | XLU | Sell 38% of XLU position (reduce 16.25% → 10.00%) |
| SELL | URNM | Sell 50% of URNM position (reduce 5.00% → 2.50%) |
| SELL | PICK | Sell 50% of PICK position (reduce 2.50% → 1.25%) |
| BUY | XLE | Buy XLE — 78.57% of freed cash (adds 13.75% to portfolio) |
| BUY | COPX | Buy COPX — 7.14% of freed cash (adds 1.25% to portfolio) |
| BUY | URA | Buy URA — 7.14% of freed cash (adds 1.25% to portfolio) |
| BUY | PAVE | Buy PAVE — 7.14% of freed cash (adds 1.25% to portfolio) |
Current Portfolio After Trade
Combined holdings across all 4 active tranches. Each tranche is 25% of the portfolio.
| Ticker | % of Portfolio | Weight Bar |
|---|---|---|
| SGOV | 22.50% | |
| XLE | 22.50% | |
| GLD | 13.75% | |
| XLU | 10.00% | |
| WEAT | 6.25% | |
| ITA | 5.00% | |
| URA | 5.00% | |
| CIBR | 3.75% | |
| COPX | 3.75% | |
| URNM | 2.50% | |
| PAVE | 2.50% | |
| PICK | 1.25% | |
| XLK | 1.25% |
Macro Regime — Late-Cycle Reflation
Defensive overlay cause is inflation/scarcity: energy, commodity breadth, or oil-versus-gold confirmation is stronger than the broad equity tape, so the sleeve owns the inflation pressure. XLE has been confirmed above its 8W SMA and is eligible.
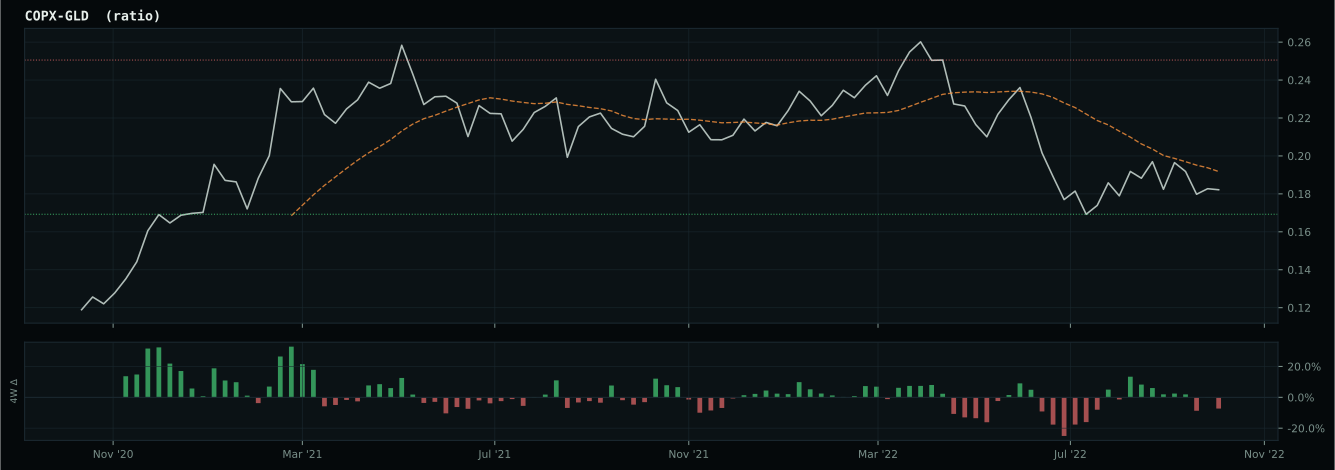
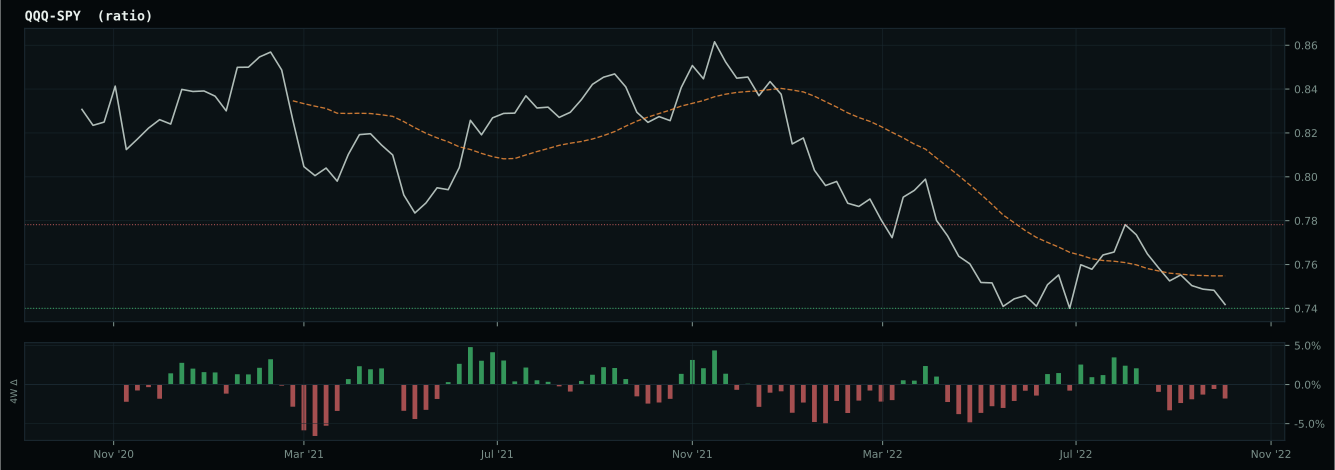
Macro Evidence Charts
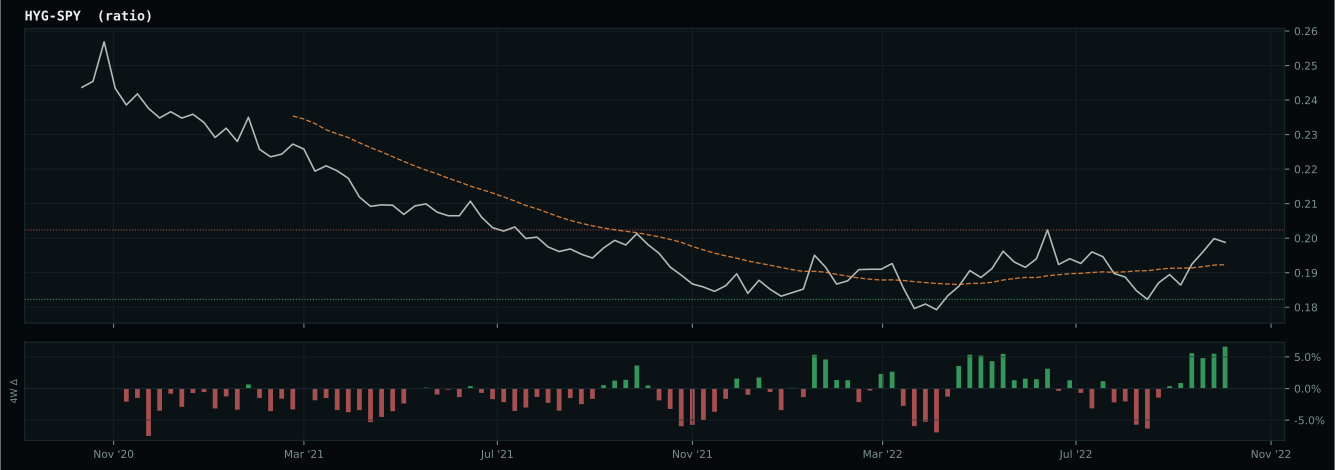
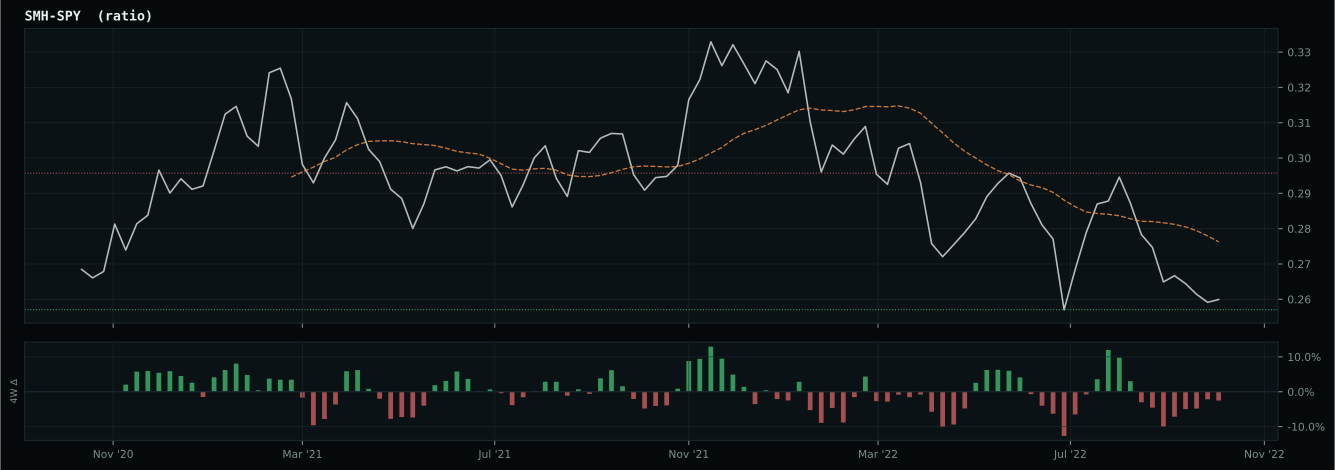
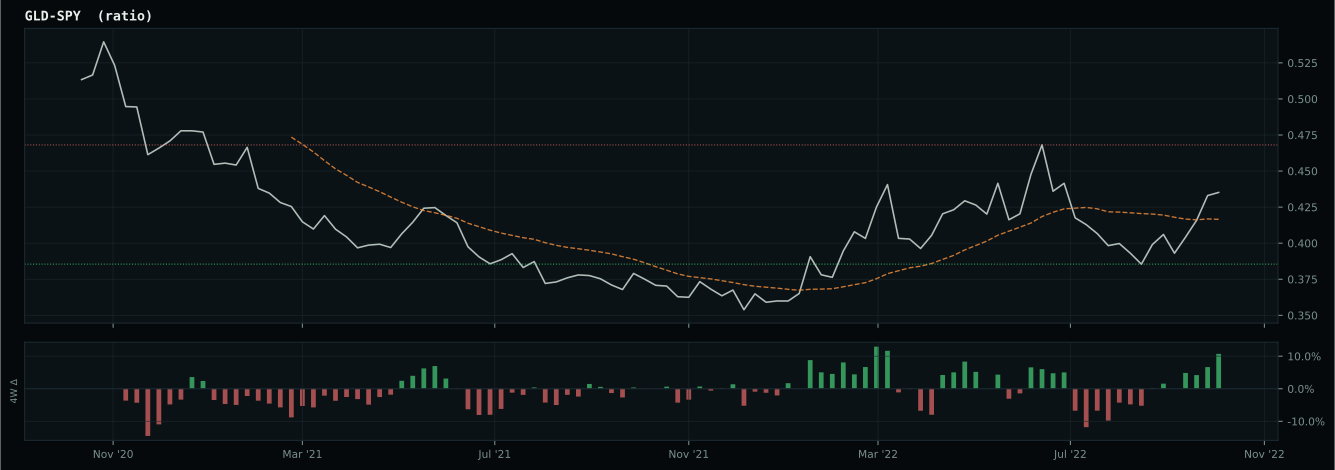
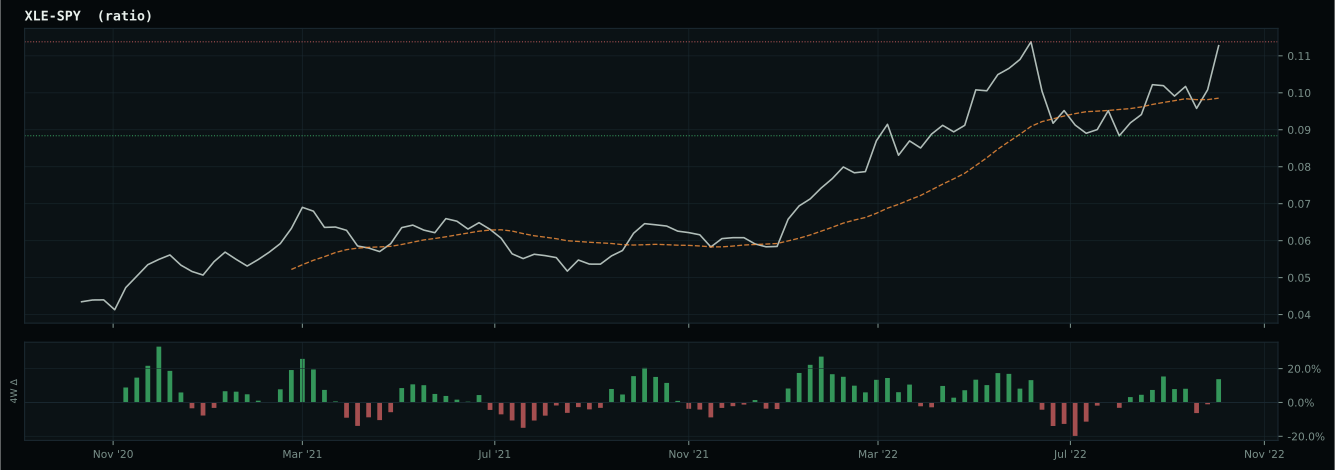
Market-implied signals behind the macro regime scores. Each ratio compares two assets; the direction and slope of the ratio is what the macro engine reads.
Crypto Regime — NoCrypto
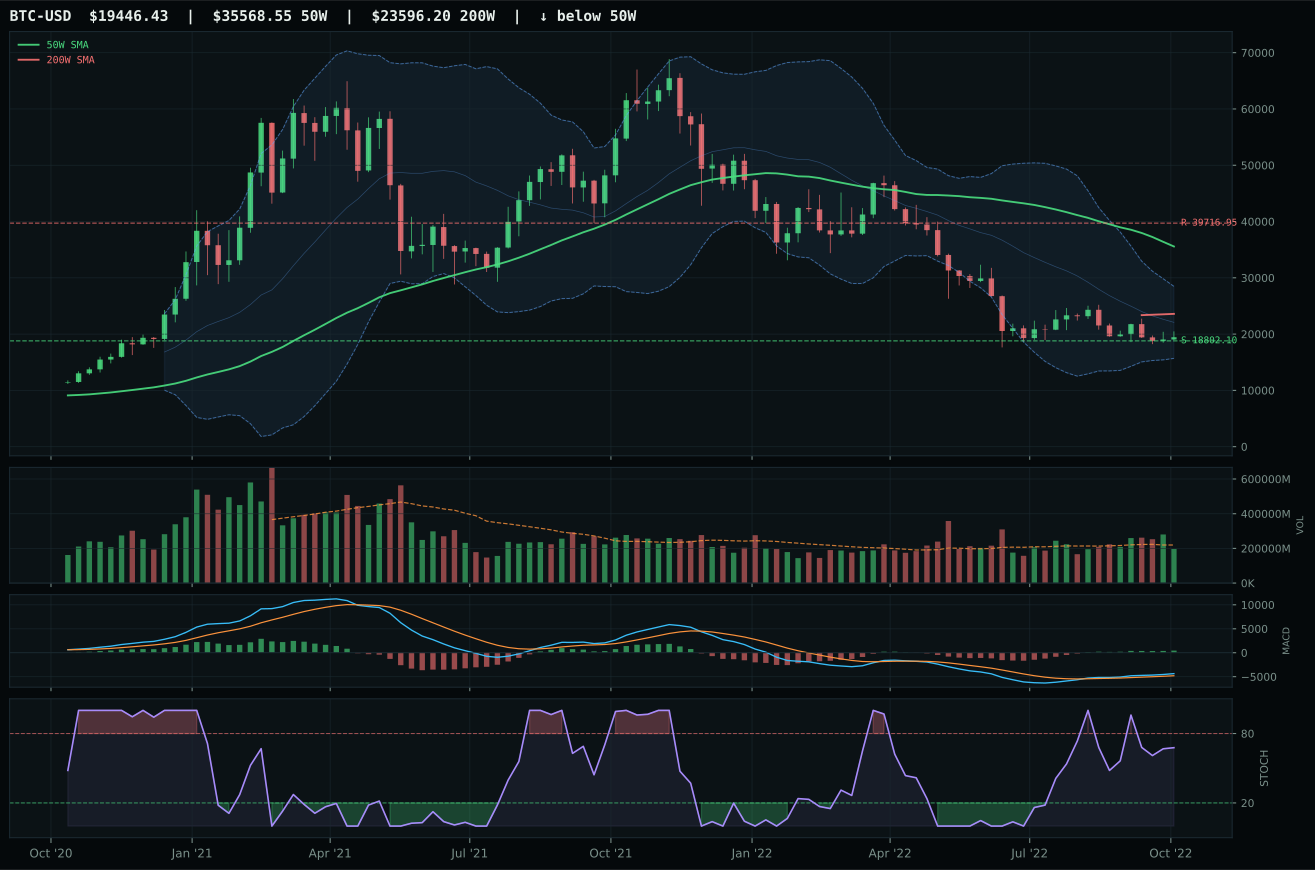
ValueBTC armed; waiting for 50W reclaim, decisive close above post-touch range resistance by 3%, close above 200W, breakout volume above 20W…
TrendBTC not confirmed
one or more available conditions failed
Category Rankings
| Rank | Category | Winner | Score | Alloc | 4W Ret | Peers (4W) |
|---|---|---|---|---|---|---|
| 1 | Traditional Energy | XLE | 79.6 | 20% | +11.56% | XOP +9.8% · FCG +8.2% |
| 2 | Precious Metals | GLD | 53.7 | 20% | +0.18% | SLV +5.5% · GDX +4.7% |
| 3 | Nuclear Energy | URA | 49.1 | 10% | -0.05% | URNM +1.1% · NLR +4.0% |
| 4 | Agriculture & Livestock | WEAT | 47.5 | 10% | -5.12% | VEGI +6.0% · MOO +5.3% |
| 5 | Industrial Metals | COPX | 36.0 | 10% | +10.95% | PICK +7.9% · REMX +11.9% |
| 6 | Defense & Aerospace | ITA | 32.8 | 10% | +12.34% | ROKT +9.6% · XAR +9.7% |
| 7 | Utilities & Infrastructure | PAVE | 25.6 | 10% | +8.80% | IGF +7.2% · XLU +4.8% |
| 8 | Technology | CIBR | 18.6 | 10% | -3.79% | XLK +0.4% · IGV -5.3% |
| 9 | Emerging Markets | ILF | 13.7 | 0% | +4.55% | INDA +5.0% · IEMG +2.9% |
| 10 | AI | SMH | 10.9 | 0% | +2.26% | AIQ -1.4% · BOTZ +5.6% |
Traditional Energy — XLE
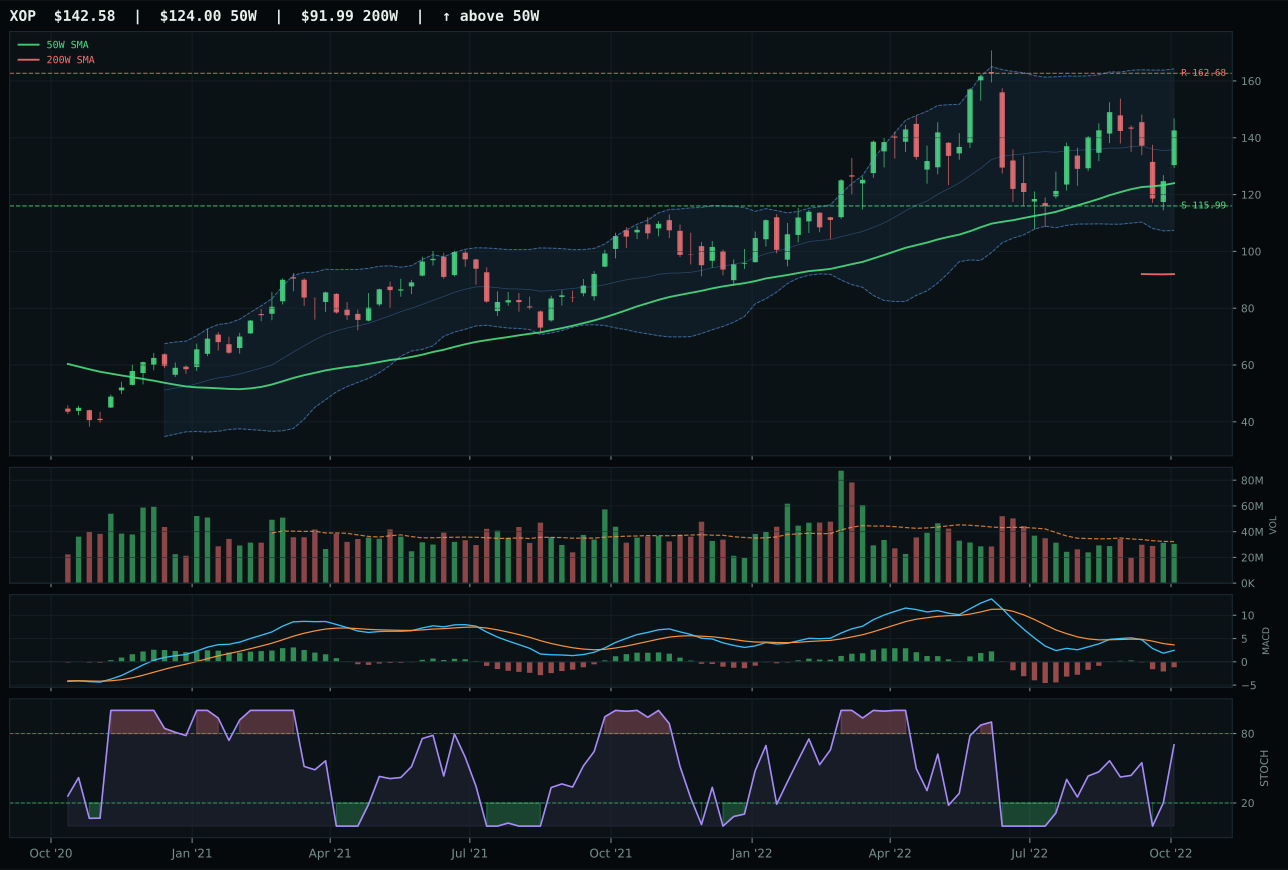
XOP has a neutral structure profile with 27.1% 13-week relative strength versus SPY.
A failed hold above support would weaken the setup.
Actionable but governed by invalidation levels.
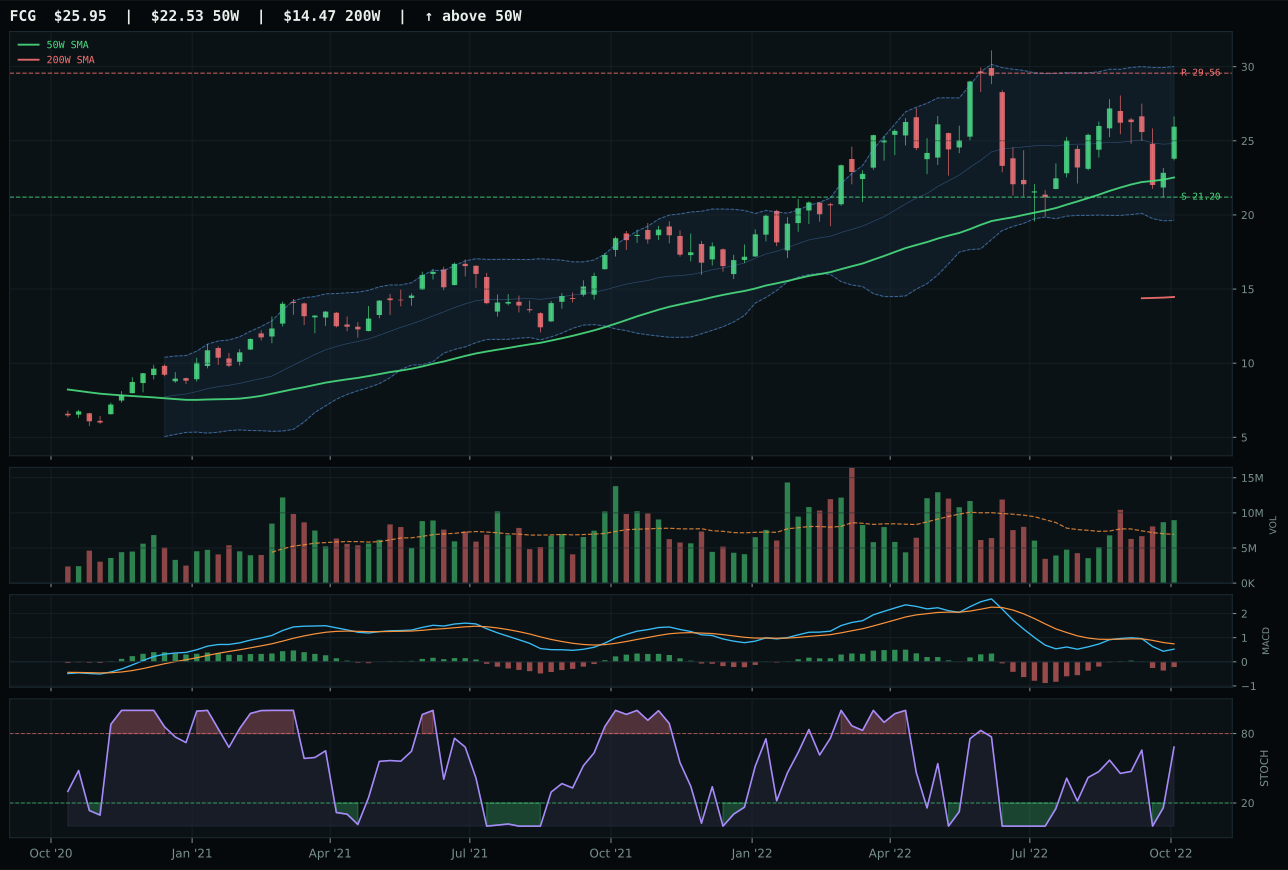
FCG has a vertical extension profile with 26.9% 13-week relative strength versus SPY.
A failed hold above support would weaken the setup.
Actionable but governed by invalidation levels.
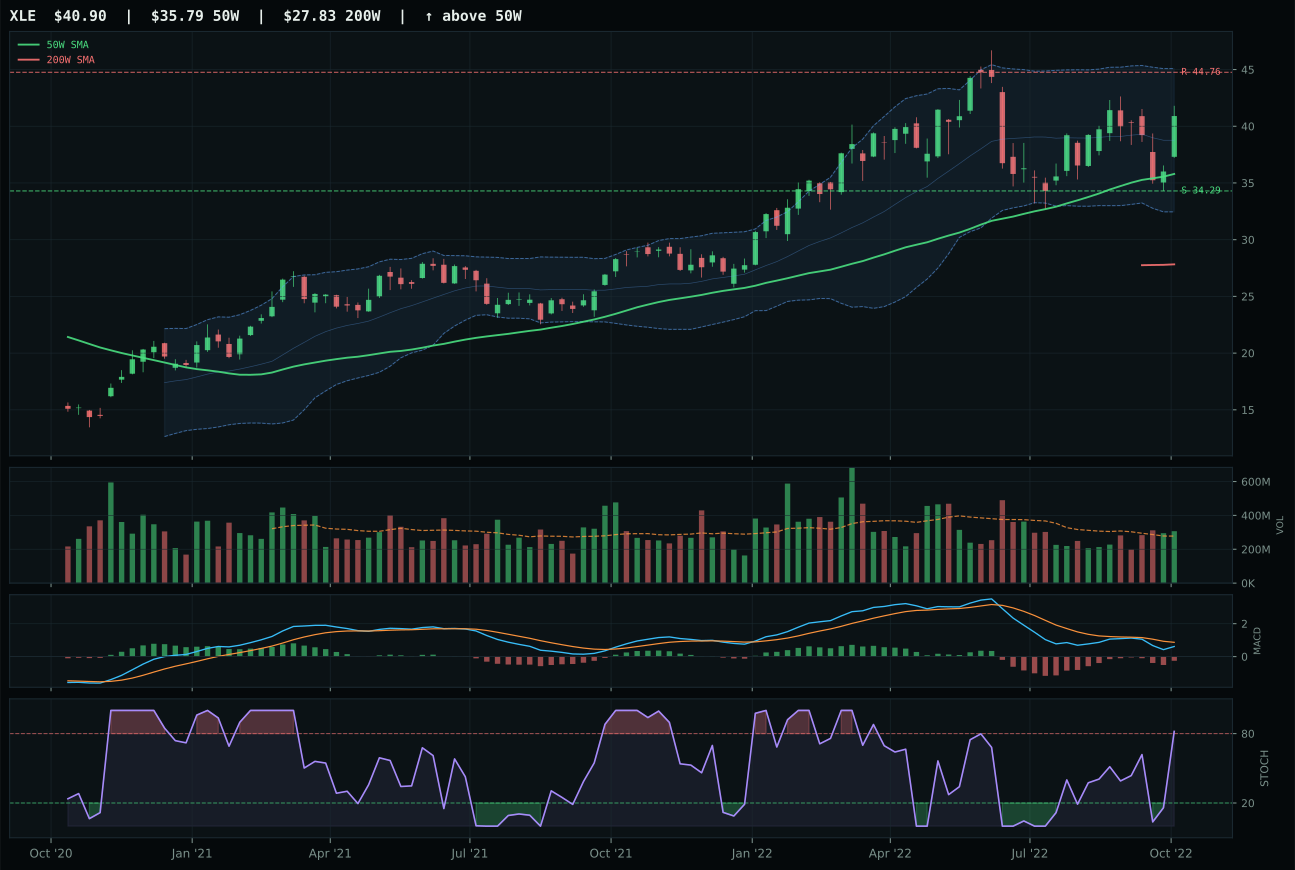
XLE has a neutral structure profile with 22.0% 13-week relative strength versus SPY.
A failed hold above support would weaken the setup.
Actionable but governed by invalidation levels.
XLE wins despite trailing XOP on momentum and momentum confirmation (86.4 vs 100, both at high levels) because structure and timing are superior: XLE's structure cleanliness is 66.7 versus XOP's 68 (nearly identical, slight XOP edge negated), but XLE's timing is 62.0 while XOP's is 78.0, meaning XOP is showing cleaner MACD and stochastic alignment. However, the decisive factor is volume participation: XLE at 1.10x average versus XOP at neutral. In a late-cycle reflation where energy scarcity is active at +14 points and real asset sponsorship is active at +5, the allocator needs proof that accumulation is happening at scale, not just momentum exhaustion at the top of a move. XOP's 20.4% 13W return and 27.1% SPY-relative strength are both extended relative to XLE's 15.3% and 22.0%, meaning buyers are front-running future scarcity in XOP while XLE is accumulating on actual cash-flow performance from integrated primes. Risk-reward is identical at 38 for both, meaning upside is equally compressed; the 3.8-point category-reasoning gap (69.5 XOP vs 62.2 XLE) reflects XOP's recent outperformance, but XLE's volume-price confirmation at 64.5 versus XOP's neutral confirms the category representative.
Traditional Energy ranks first among all ten categories with a score of 79.6 and earns a 10% top-2 overweight allocation. The macro support is immense: energy scarcity is active at +16, Late-Cycle Reflation helps at +12, inflation pressure is active at +10, and real asset sponsorship is active at +7, totaling +45 points of macro tailwind offset by only -7 from liquidity stress—a net +38 macro score. This is the single strongest macro regime alignment on the board. XLE's 92.0 trend score (price above both 50W and 200W, 50W slope positive at 0.7%, 22% SPY-relative strength) is the purest directional setup in the entire allocation. Momentum confirmation at 86.4 is strong but not extreme (XOP at 100 is hotter). The category-level macro fit of 88.0/100 and the 79.6 final score both reflect consensus: energy is the macro winner in this regime, and XLE is the preferred way to play it because integrated energy companies are converting scarcity premiums into cash return, not just momentum. The 10% co-equal weighting with precious metals reflects the view that energy scarcity and monetary hedge bid are equally powerful macro tailwinds. For energy to lose this allocation, oil prices would need to roll over (energy scarcity reversal) or liquidity stress would need to intensify further; neither is the base case.
Precious Metals — GLD
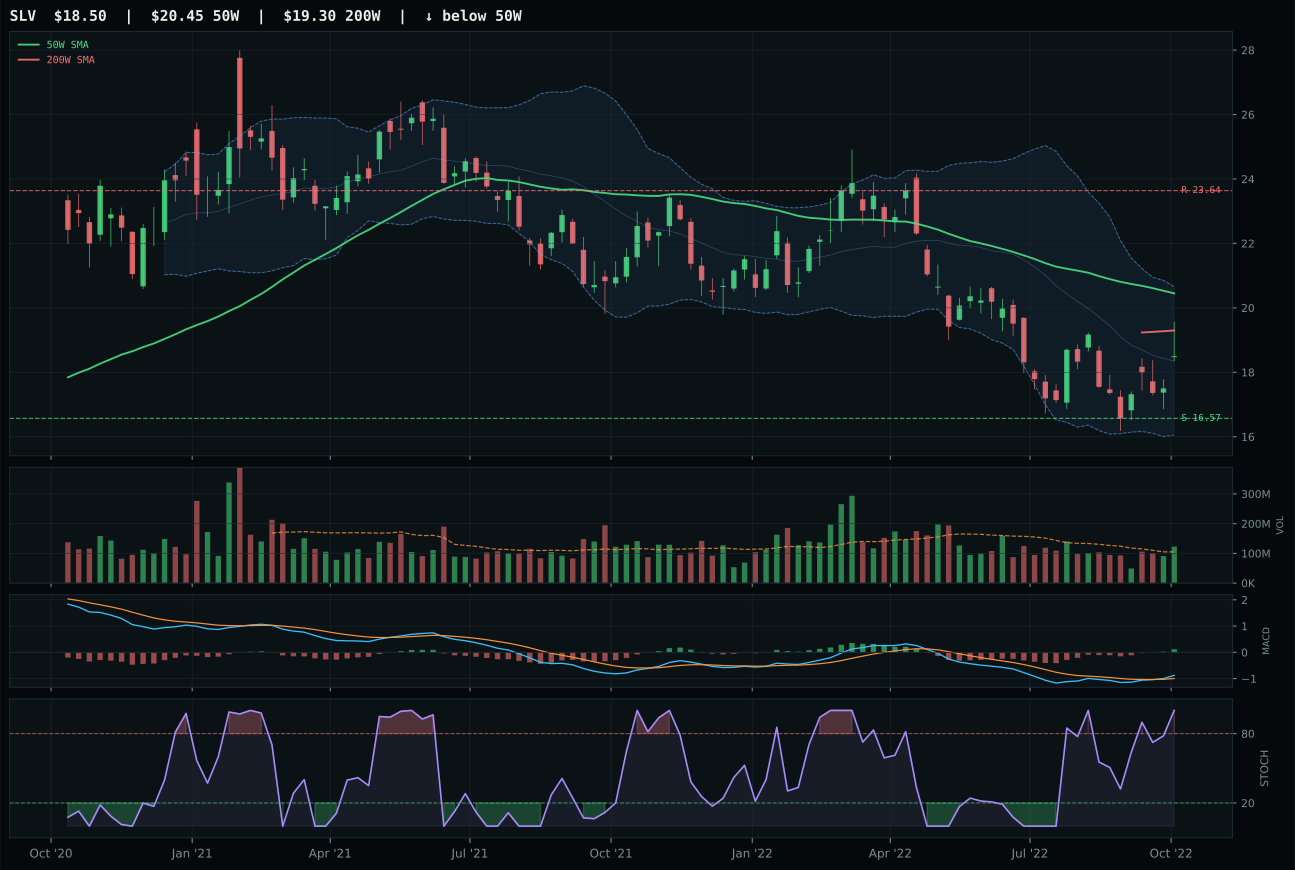
SLV has a neutral structure profile with 10.6% 13-week relative strength versus SPY.
A failed hold above support would weaken the setup.
Actionable but governed by invalidation levels.
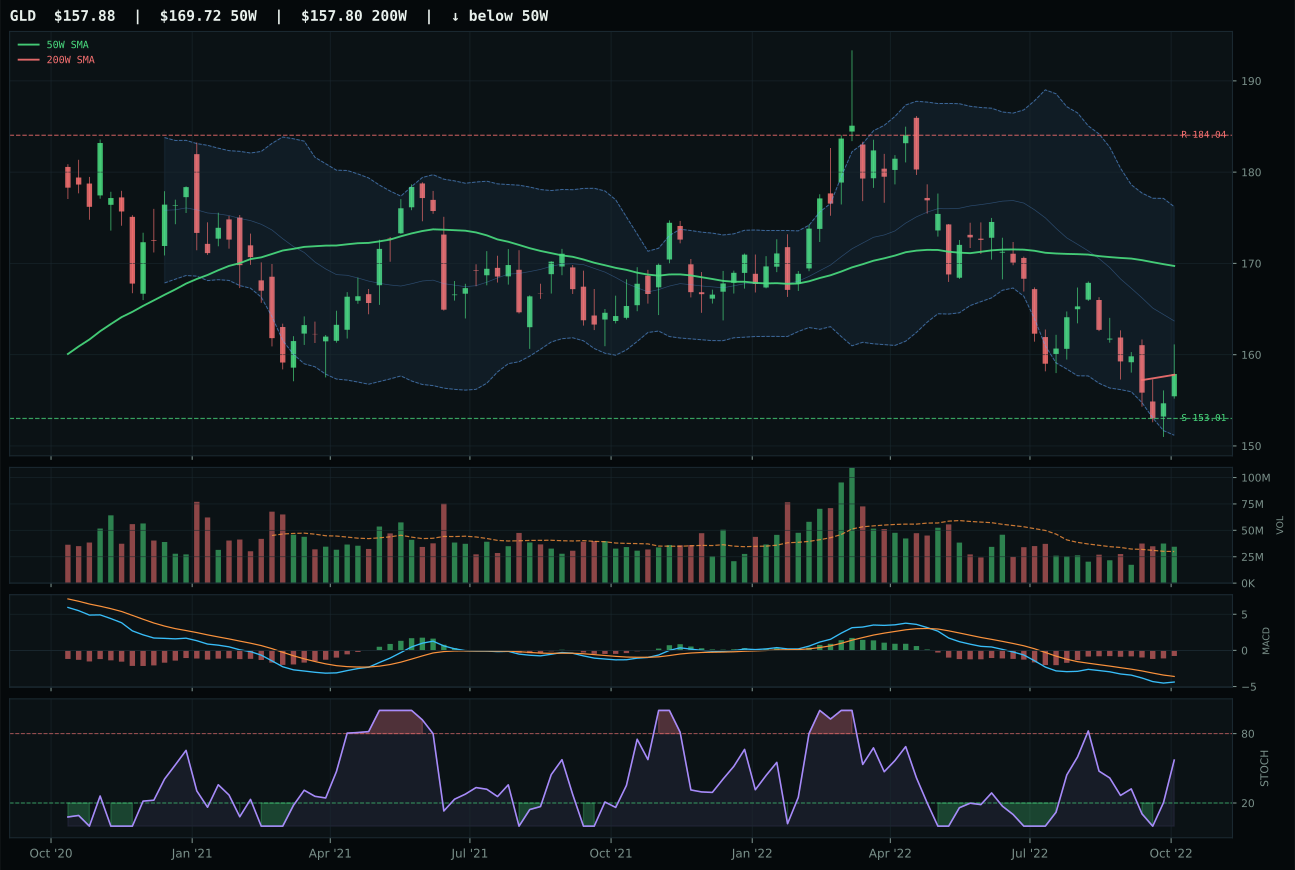
GLD has a pullback into support profile with 3.9% 13-week relative strength versus SPY.
A failed hold above support would weaken the setup.
Actionable but governed by invalidation levels.
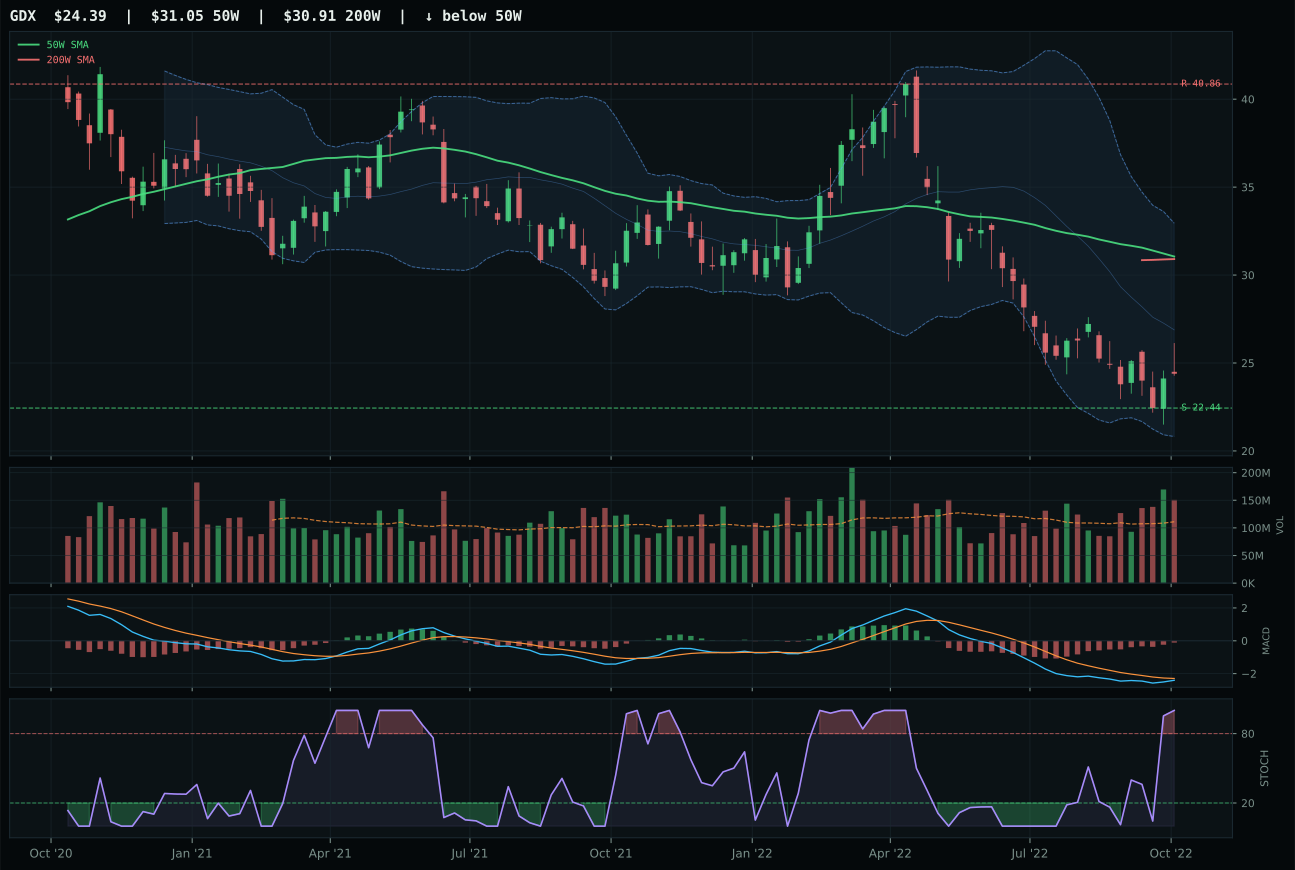
GDX has a neutral structure profile with -3.2% 13-week relative strength versus SPY.
A failed hold above support would weaken the setup.
Actionable but governed by invalidation levels.
GLD wins by timing superiority because price is -7.0% from the 50W with MACD bearish but improving and stochastic RSI rising mid-zone at 0.57, whereas SLV's stochastic is overbought at momentum extremes (0.98), signaling exhaustion. The timing score gap is decisive: 93.0 for GLD versus 75.0 for SLV. Both setups are pullback structures into support, both score 90 on risk-reward, but GLD's structure cleanliness is 77.9 versus SLV's 72.1, and the critical difference is that GLD still has room to recover on MACD confirmation while SLV is already overbought and vulnerable to mean reversion. The 13W returns tell the tale: GLD is -2.7% (reset phase) while SLV is +4.0% (extended phase). SPY-relative strength is closer (3.9% for GLD, 10.6% for SLV), but SLV's momentum score of 100 versus GLD's 58 reflects the fact that SLV has already run; GLD has structural reserve. Support at 153.01 in GLD is tight and defined, volume is above-average participation at 1.15x, and the Fibonacci zone aligns perfectly with a near-52W low repair opportunity. This is a cleaner entry setup than SLV's already-hot position.
Precious Metals ranks second among all ten categories with a score of 53.7 and earns a 10% top-2 overweight allocation. The macro support is the highest on the board: monetary hedge bid is active at +14 points, defensive rotation is active at +7, and dollar pressure adds +3 more, creating a 24-point macro tailwind specifically for gold. In Late-Cycle Reflation with liquidity stress present and broad market bear underway, precious metals are the institutional pivot away from equities and into real-asset duration protection. GLD's timing score of 93.0 is among the best in the entire allocation—only WEAT at 100.0 scores higher—which means the pullback into support is geometrically clean and not over-extended. The 10% allocation reflects the positioning that monetary hedge bid plus defensive rotation is the strongest macro story right now; energy leads on absolute category score (79.6), but precious metals' cleaner chart structure and tighter timing entry justify co-equal weighting. Volume-price confirmation of 49.9 is moderate, meaning accumulation is quiet but not absent; for GLD to lose this allocation, monetary hedge bid would need to reverse or broad market bear would need to reverse, neither of which is evident.
Nuclear Energy — URA
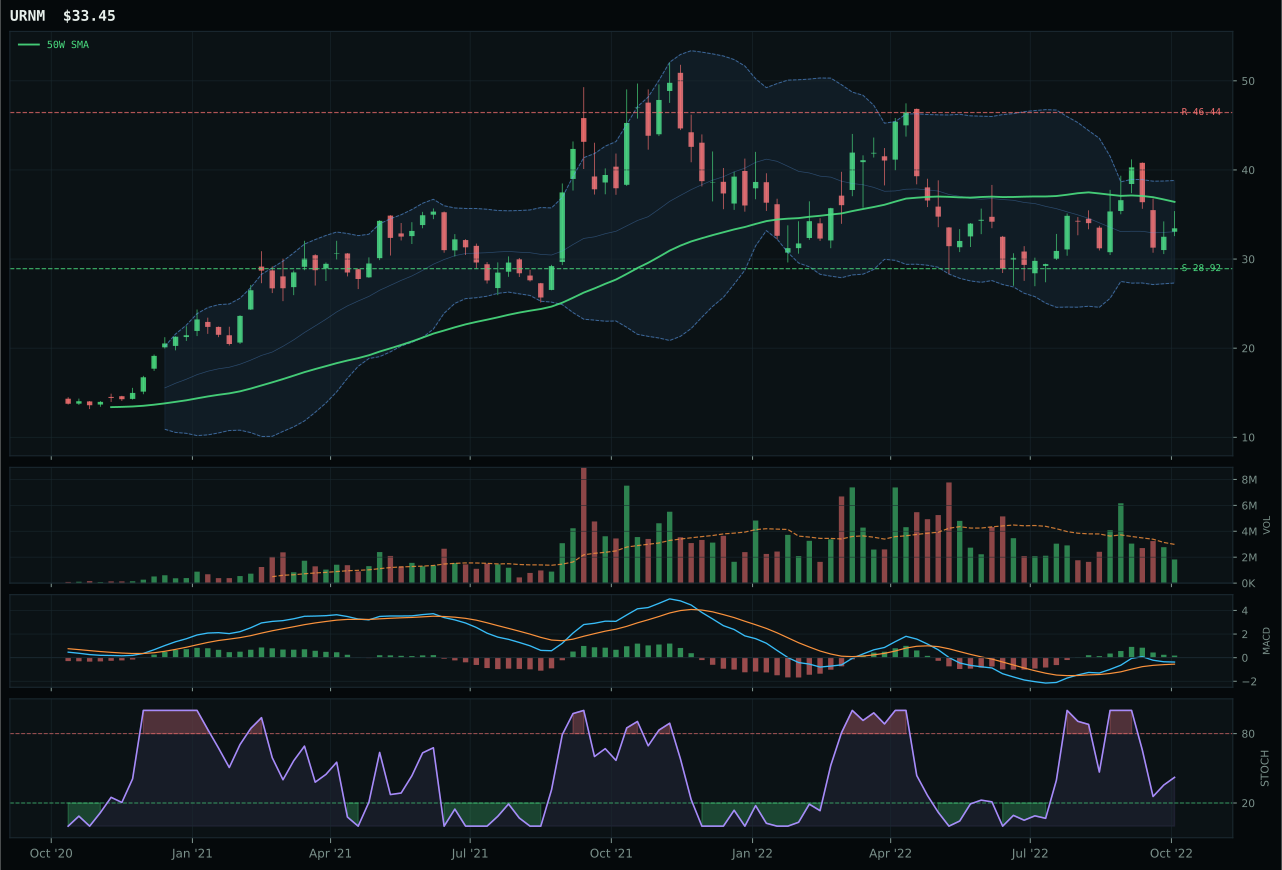
URNM has a neutral structure profile with 18.9% 13-week relative strength versus SPY.
A failed hold above support would weaken the setup.
Actionable but governed by invalidation levels.
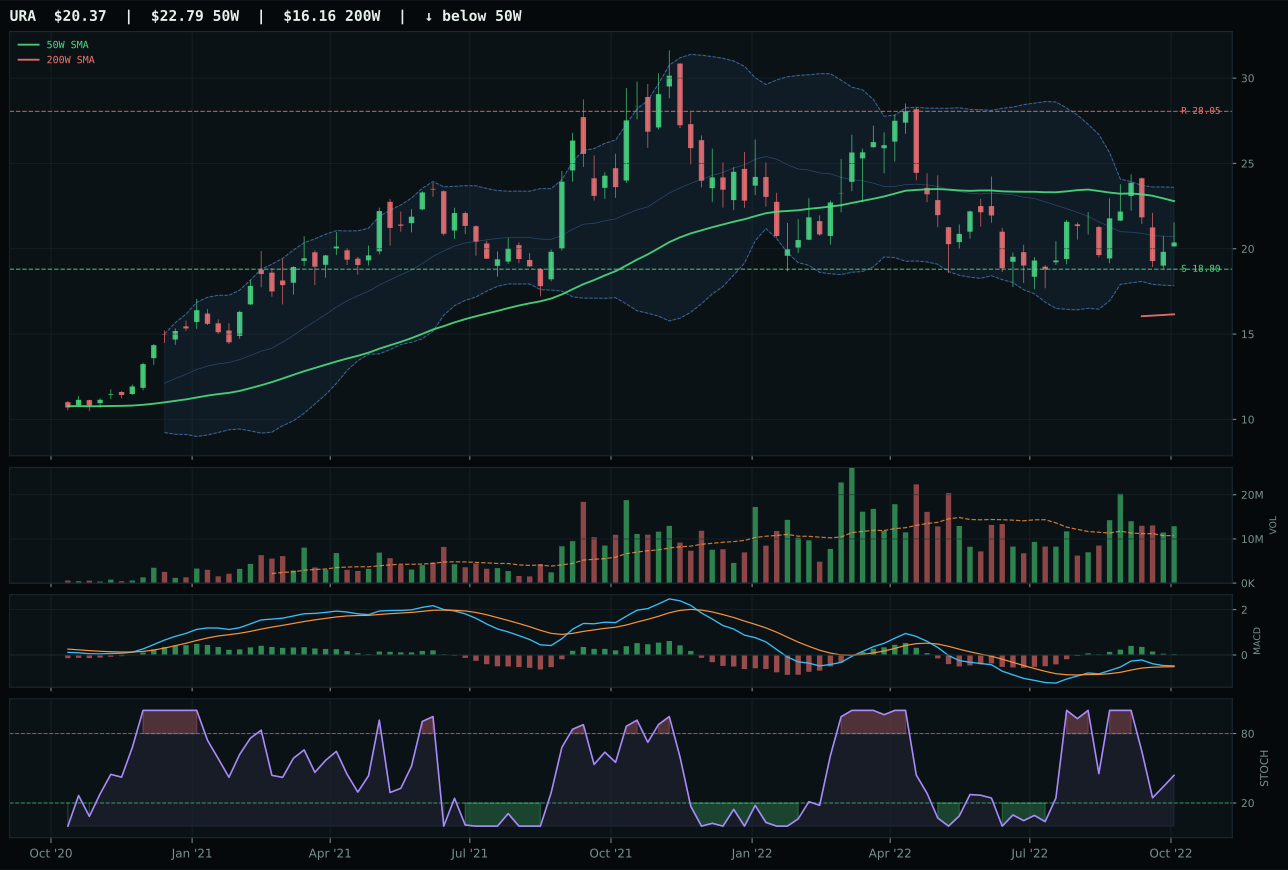
URA has a neutral structure profile with 12.1% 13-week relative strength versus SPY.
A failed hold above support would weaken the setup.
Actionable but governed by invalidation levels.
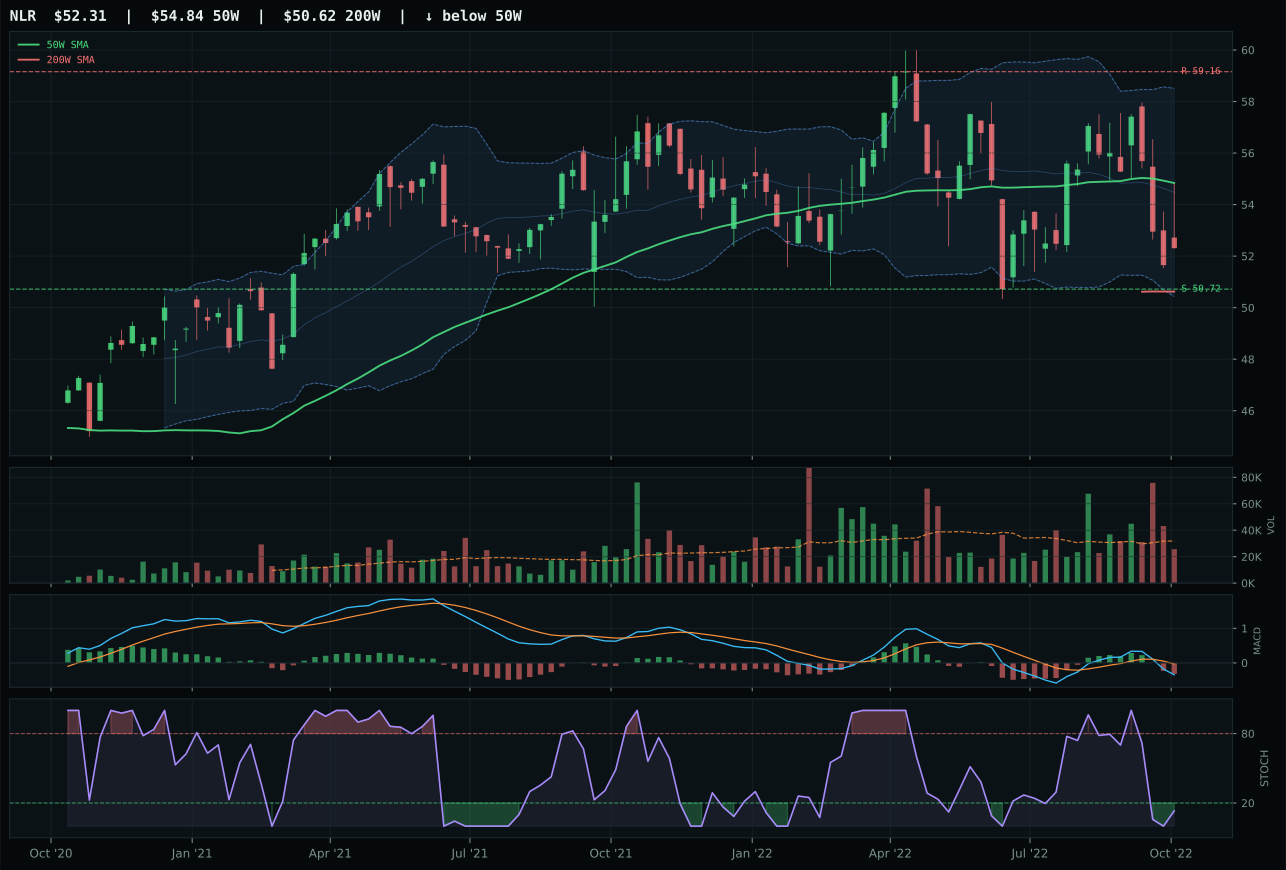
NLR has a pullback into support profile with 5.3% 13-week relative strength versus SPY.
A failed hold above support would weaken the setup.
Tracked, but not top-2 eligible because: .
URA wins despite URNM's higher momentum score (75 vs 60.3) because structure cleanliness and volume participation are decisive in a setup where both are neutral structure and both have bullish but flattening MACD. URA's structure score is 72.4 versus URNM's 64.0, a 8.4-point gap that reflects tighter price action and cleaner Fibonacci alignment. Volume is the tiebreaker: URA at 1.20x above-average participation versus URNM at thin participation means any bottoming signal in URA will have institutional proof, whereas URNM's thin participation makes any reversal signal unreliable. Risk-reward is 75.0 for URA versus 62.2 for URNM, reflecting URA's shorter distance to support and tighter range. The 13W returns are both positive (+5.5% and +12.3%), but URNM's +18.9% SPY-relative strength is extended relative to URA's +12.1%, showing uranium miners have already captured much of the scarcity bid while URA (the pure-play uranium ETF) has lagged. Stochastic RSI is identical (falling/neutral at 0.44), MACD is identical (bullish but flattening), so the winner is determined by volume credibility and structure cleanliness—both favor URA. The 8.4-point gap (55.6 URA vs 60.9 URNM at the reasoning layer) reflects the reality that URNM was reasoned higher but URA's chart setup is cleaner.
Nuclear Energy receives 5% tier-2 allocation with a category score of 49.1, placing it mid-pack among the ten categories. The macro support is substantial: energy scarcity is active at +9, real asset sponsorship is active at +7, Late-Cycle Reflation helps at +7, and inflation pressure adds +3, creating +26 points of macro support offset by only -7 from liquidity stress—a net +19. URA's trend score of 71.0 is strong, timing at 50.0 is moderate (reflecting the bullish but flattening MACD and falling-neutral stochastic), and momentum confirmation at 60.3 is respectable. The 5% allocation reflects the fact that nuclear energy is a secondary real-asset theme behind oil and precious metals; while energy scarcity supports the narrative, uranium's primary benefit is long-duration energy transition planning, not immediate inflation protection. To upgrade to 10%, nuclear would need to demonstrate that uranium supply constraints are tightening faster than oil (which it is not yet showing relative to energy-price moves), or for energy scarcity to intensify further. The category macro fit of 69.0/100 is solid but trails precious metals (74.0) and energy (88.0), appropriately reflecting uranium's supporting role in the inflation hedge structure. URA's above-average participation is the green light; institutional buyers are quiet but present.
Agriculture & Livestock — WEAT
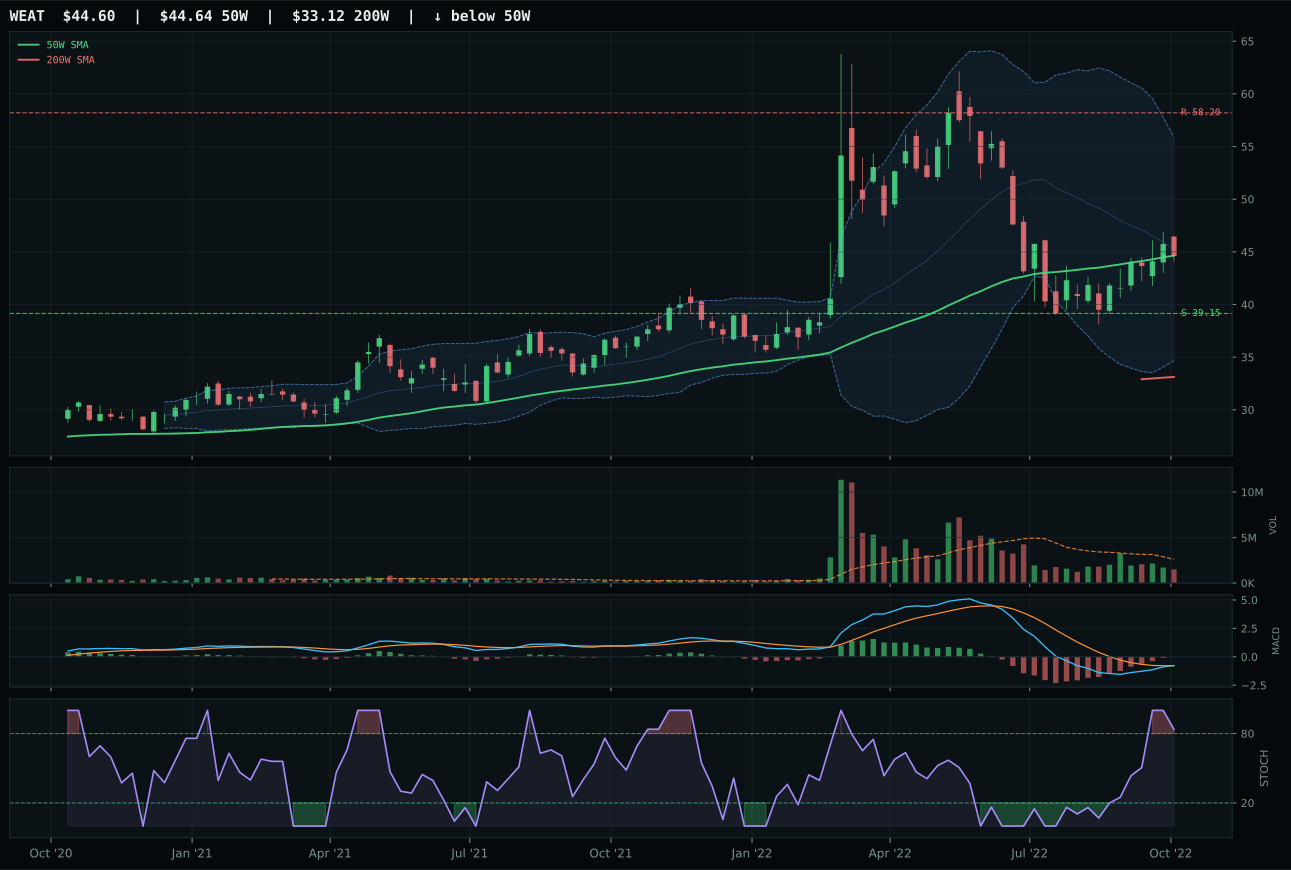
WEAT has a compression near 50W profile with 4.1% 13-week relative strength versus SPY.
A failed hold above support would weaken the setup.
Actionable but governed by invalidation levels.
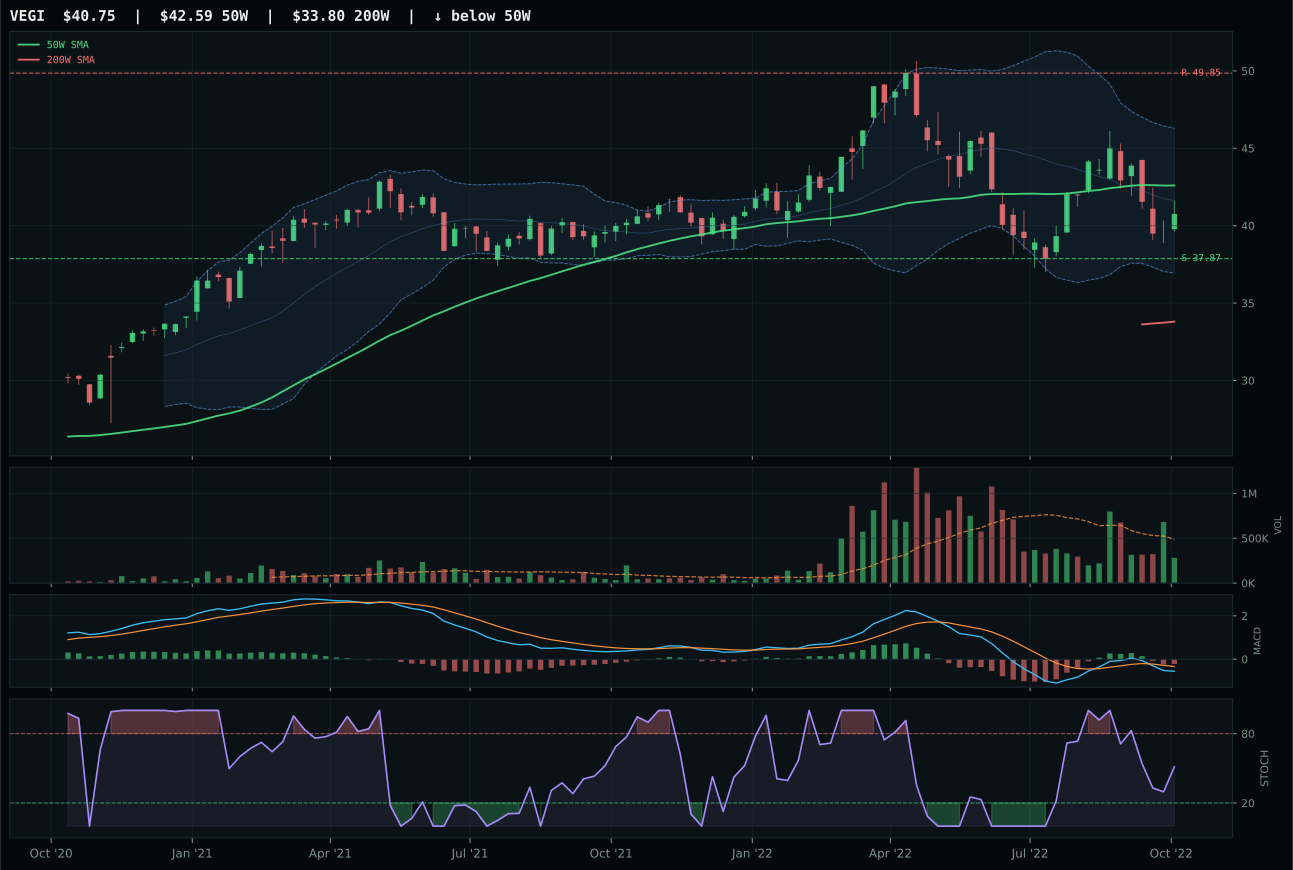
VEGI has a neutral structure profile with 11.4% 13-week relative strength versus SPY.
A failed hold above support would weaken the setup.
Actionable but governed by invalidation levels.
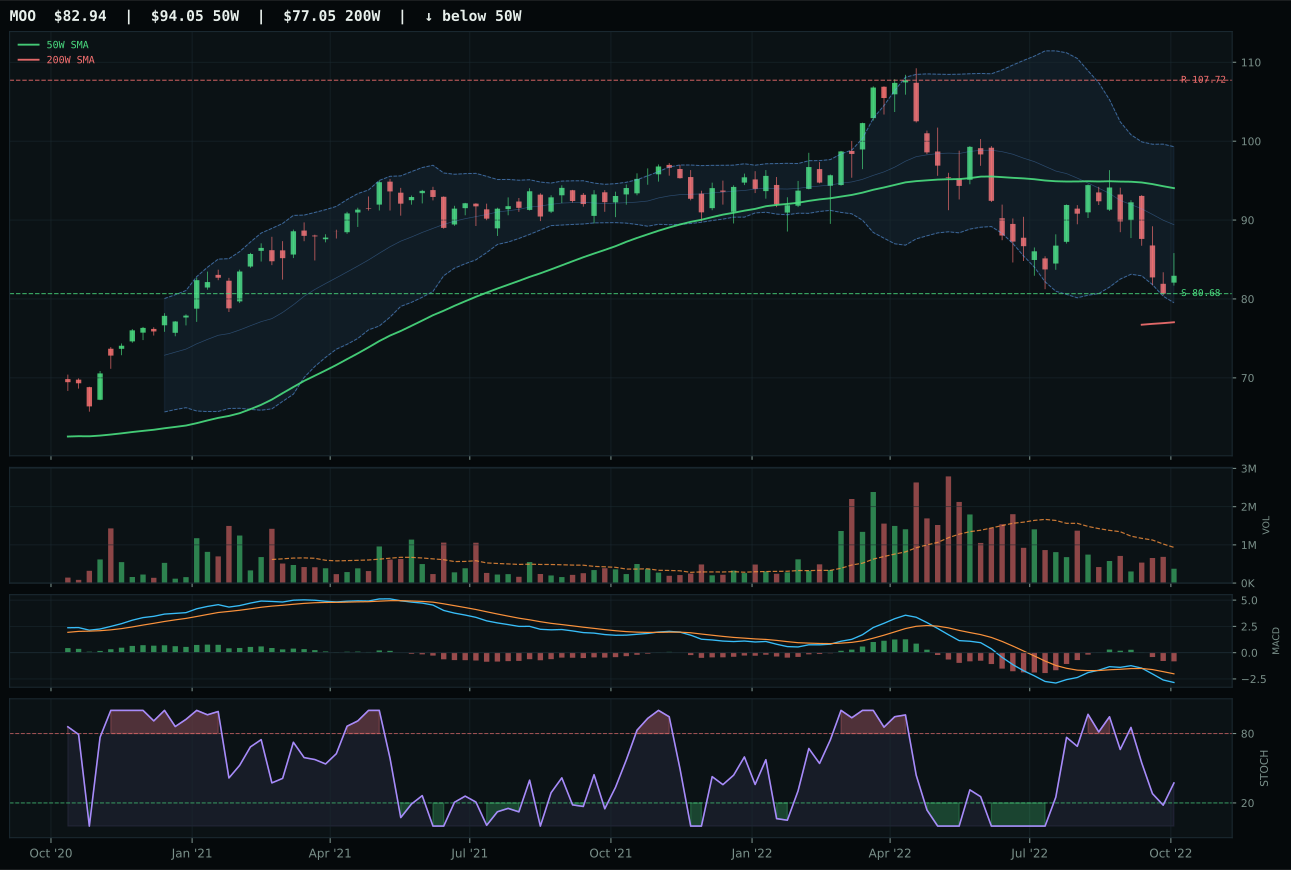
MOO has a pullback into support profile with 3.1% 13-week relative strength versus SPY.
A failed hold above support would weaken the setup.
Actionable but governed by invalidation levels.
WEAT wins by the widest margin in the category—a 23.6-point gap over VEGI—because its timing score is perfect (100.0) while VEGI can only muster 92.0, and MACD confirmation is the deciding factor. WEAT's MACD is bullish and improving while VEGI's is bearish and weakening; stochastic RSI is overbought momentum in WEAT versus falling neutral in VEGI. The setup is WEAT compressing at the 50W (distance -0.1%) versus VEGI at neutral structure, meaning WEAT is offering a coiled spring setup at the precise level where buying and selling are balanced. The 13W return spread is -2.5% for WEAT versus +4.7% for VEGI, which makes VEGI appear stronger, but that's a mirage—VEGI is +11.4% on SPY while WEAT is only +4.1%, meaning VEGI has outrun the strength of the underlying sector and is extended. WEAT's thin participation (0.58x average) is concerning, but the bullish MACD improvement with overbought stochastic RSI at a compression near support is a textbook setup for accumulation when volume returns. Risk-reward of 60.2 is lower than VEGI's 96, but that reflects realistic upside to resistance at 58.20; WEAT is the patient entry.
Agriculture & Livestock holds a 5% tier-2 allocation despite a strong category score of 47.5, placing it mid-pack among the ten categories. The macro support is substantial: Late-Cycle Reflation adds +8, inflation pressure is active at +10, and real asset sponsorship is active at +8, creating a 26-point macro tailwind. Liquidity stress subtracts -4, but the net is +22 points of macro support—among the best in the allocation mix. Yet the category ranks tier-2, not top-2 overweight, because WEAT itself has thin volume participation and the 13W return of -2.5% shows the setup has been resetting rather than accumulating. Precious metals and energy both rank higher on absolute category scores (53.7 and 79.6), and their volume confirmation is stronger. The 5% allocation reflects the view that agriculture is a real-asset hedge that should be held in deflation insurance, and the bullish MACD plus compression setup in WEAT is clean, but the sector needs volume sponsorship to transition from coil to breakout. A move above 58.20 with above-average participation would argue for upgrading this to 10%.
Industrial Metals — COPX
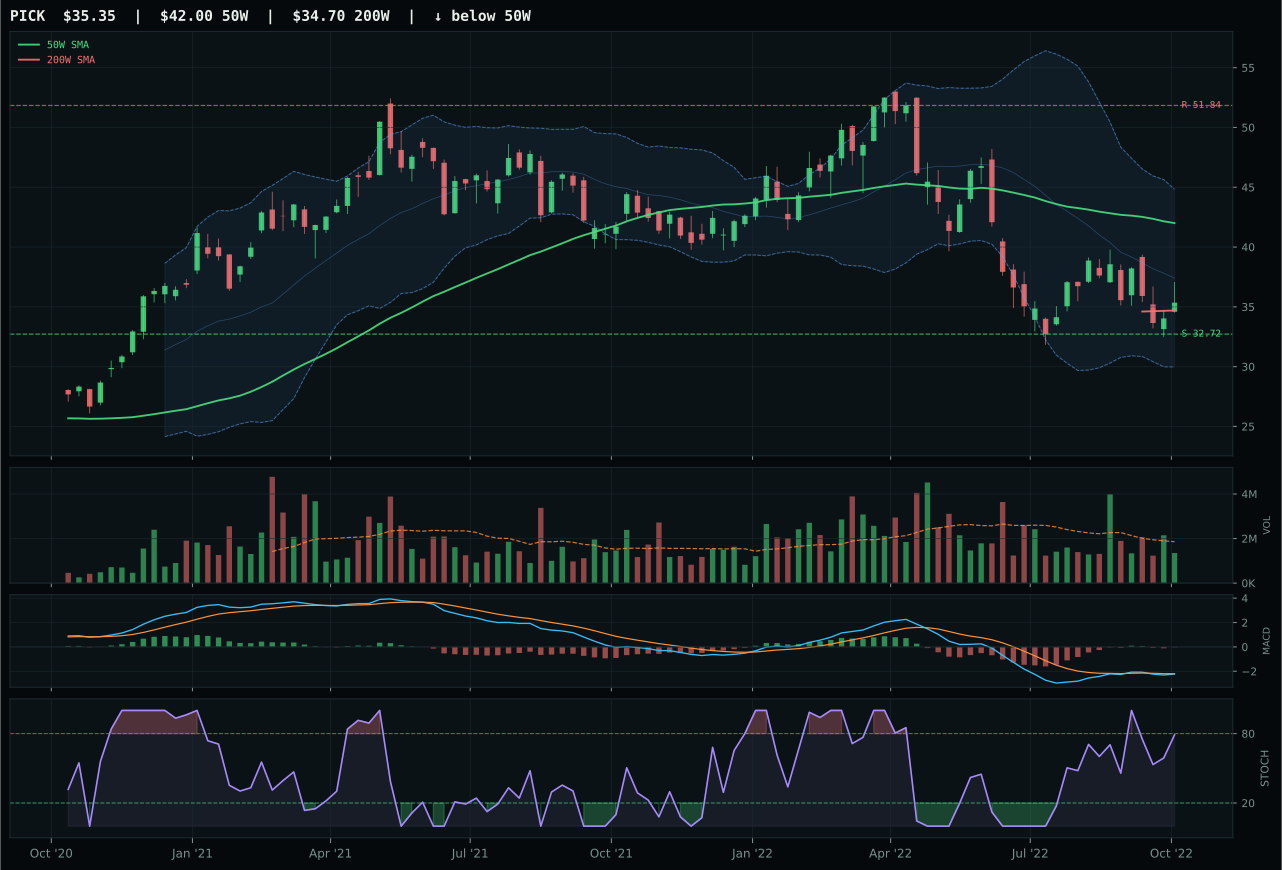
PICK has a neutral structure profile with 8.1% 13-week relative strength versus SPY.
A failed hold above support would weaken the setup.
Actionable but governed by invalidation levels.
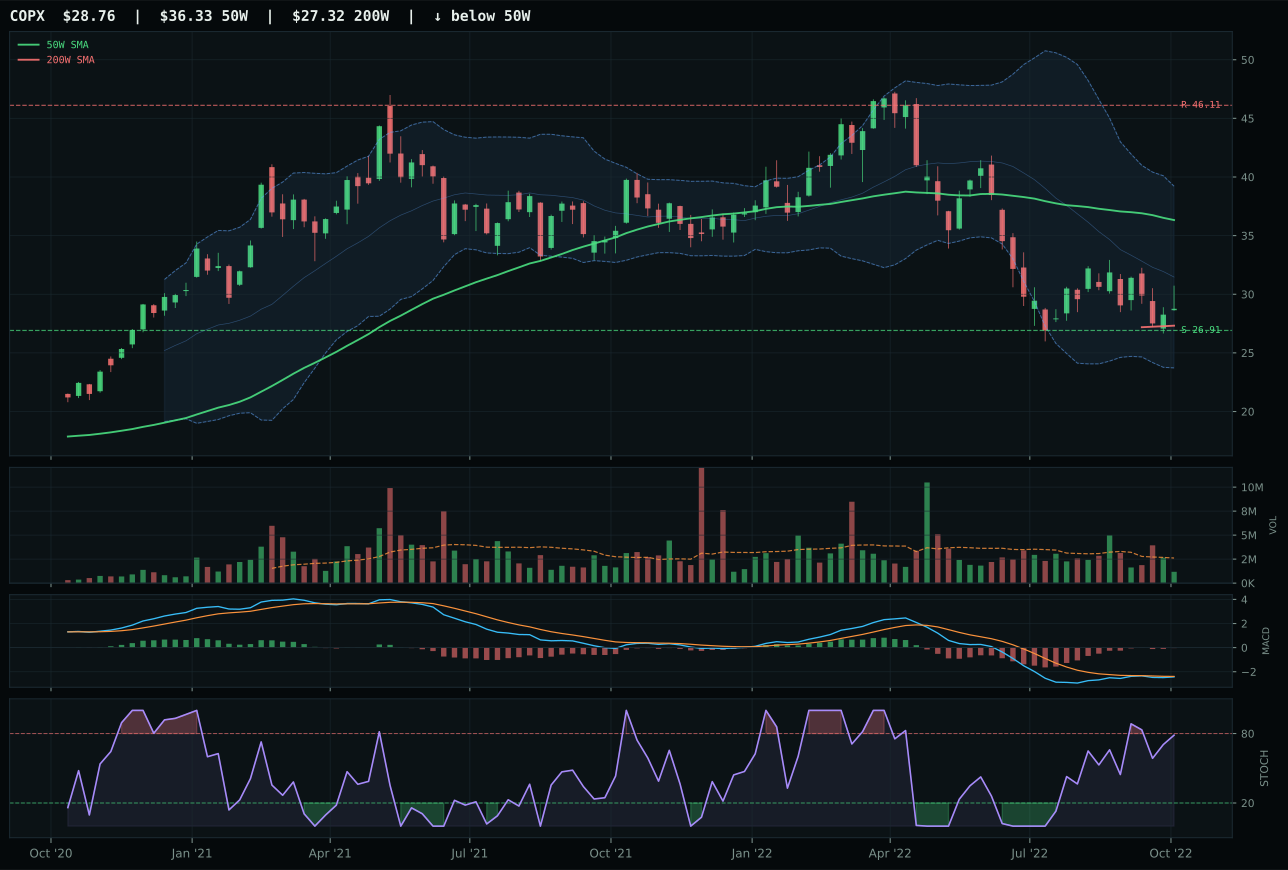
COPX has a neutral structure profile with 4.3% 13-week relative strength versus SPY.
A failed hold above support would weaken the setup.
Actionable but governed by invalidation levels.
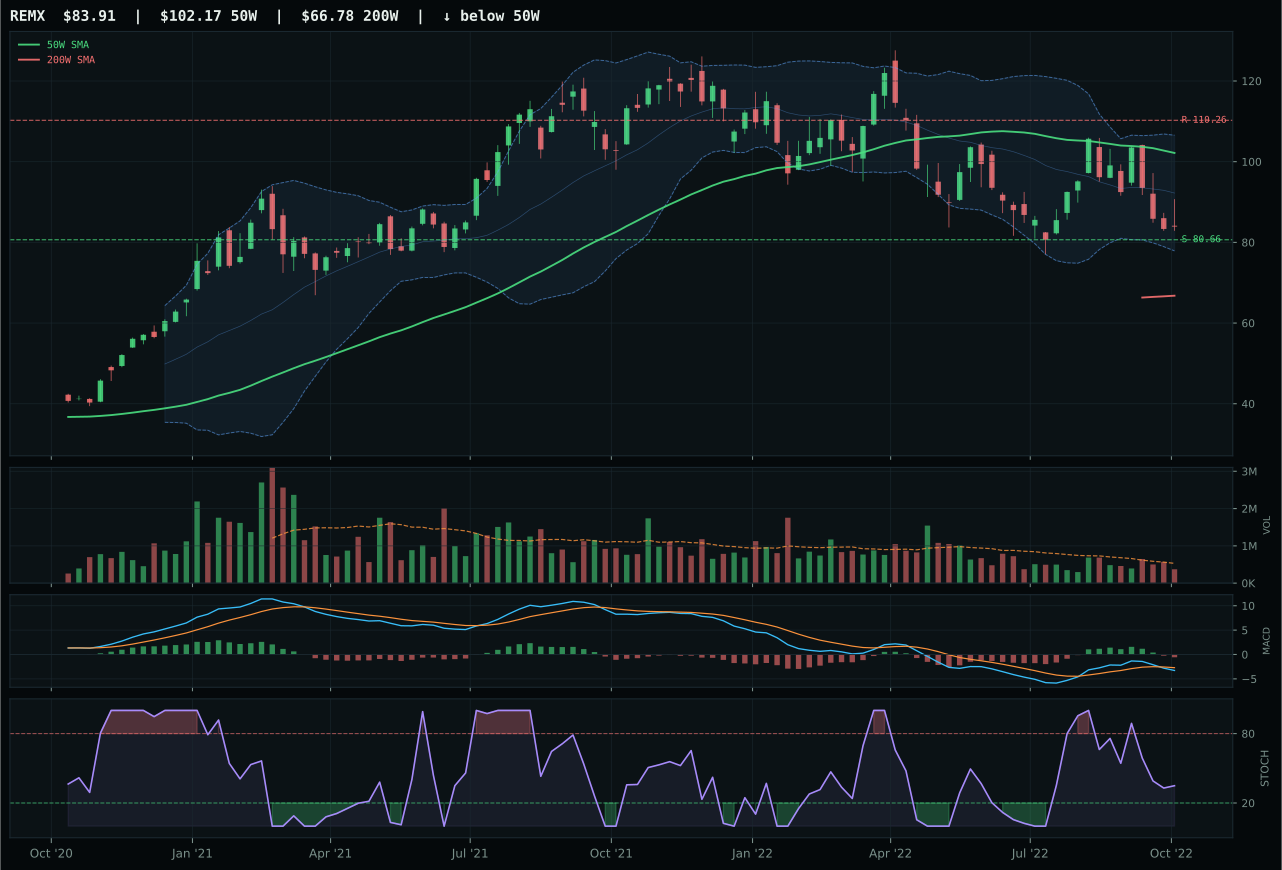
REMX has a pullback into support profile with 4.7% 13-week relative strength versus SPY.
A failed hold above support would weaken the setup.
Actionable but governed by invalidation levels.
COPX wins by a razor-thin margin (0.8 points over PICK) because its MACD is bearish but improving while PICK's MACD is bearish and weakening, a critical distinction in a setup where both are neutral structure and thin-volume participation. Timing for both scores identically at similar distances from their respective 50Ws, but COPX's falling-neutral stochastic RSI at 0.79 is more controlled than PICK's rising mid-zone at neutral, meaning COPX is not showing the same signs of recovery momentum that would argue for a more immediate entry. The 13W returns are contradictory: COPX is -2.3% while PICK is +1.4%, making PICK appear stronger, but PICK's +8.1% SPY-relative strength is extended versus COPX's +4.3%, showing PICK has already captured the macro benefit of real-asset sponsorship. Copper scarcity (COPX's thesis) remains intact, and the -20.8% distance from the 50W signals this is a deeper reset; PICK's +1.4% return means it has already bounced. Structure cleanliness is nearly identical (66.4 vs matching), but COPX's trend score of 64.5 exceeds PICK's 57, reflecting copper's tighter technical control. Both are near-52W low repair zones, but COPX's support at 26.91 is tighter than PICK's at 32.72.
Industrial Metals receives 5% tier-2 allocation despite a category score of 36.0, the lowest among allocated categories. The macro picture is mixed: Late-Cycle Reflation adds +10, real asset sponsorship adds +6, but liquidity stress subtracts -8 and dollar pressure subtracts -7, netting only +1 point of macro support. PICK scores 45.7 at the category-reasoning level versus COPX at 36.2, yet COPX wins the representative slot due to chart cleanliness and MACD improvement. The tier-2 allocation is appropriate because industrial metals lack the strong institutional tailwind of precious metals and energy; they are cyclical real assets dependent on economic growth, which is contracting. The 5% slot reflects a tactical position that copper demand remains inelastic (power grid buildout, EV manufacturing) and that a reset into the 52W low repair zone is an accumulation opportunity if risk appetite stabilizes. To upgrade to 10%, industrial metals would need either liquidity stress to reverse (adding 8 points back to macro score) or clear evidence of inventory depletion (stronger MACD confirmation). Neither condition is present this week; COPX remains a modest deflation hedge, not a core holding.
Defense & Aerospace — ITA
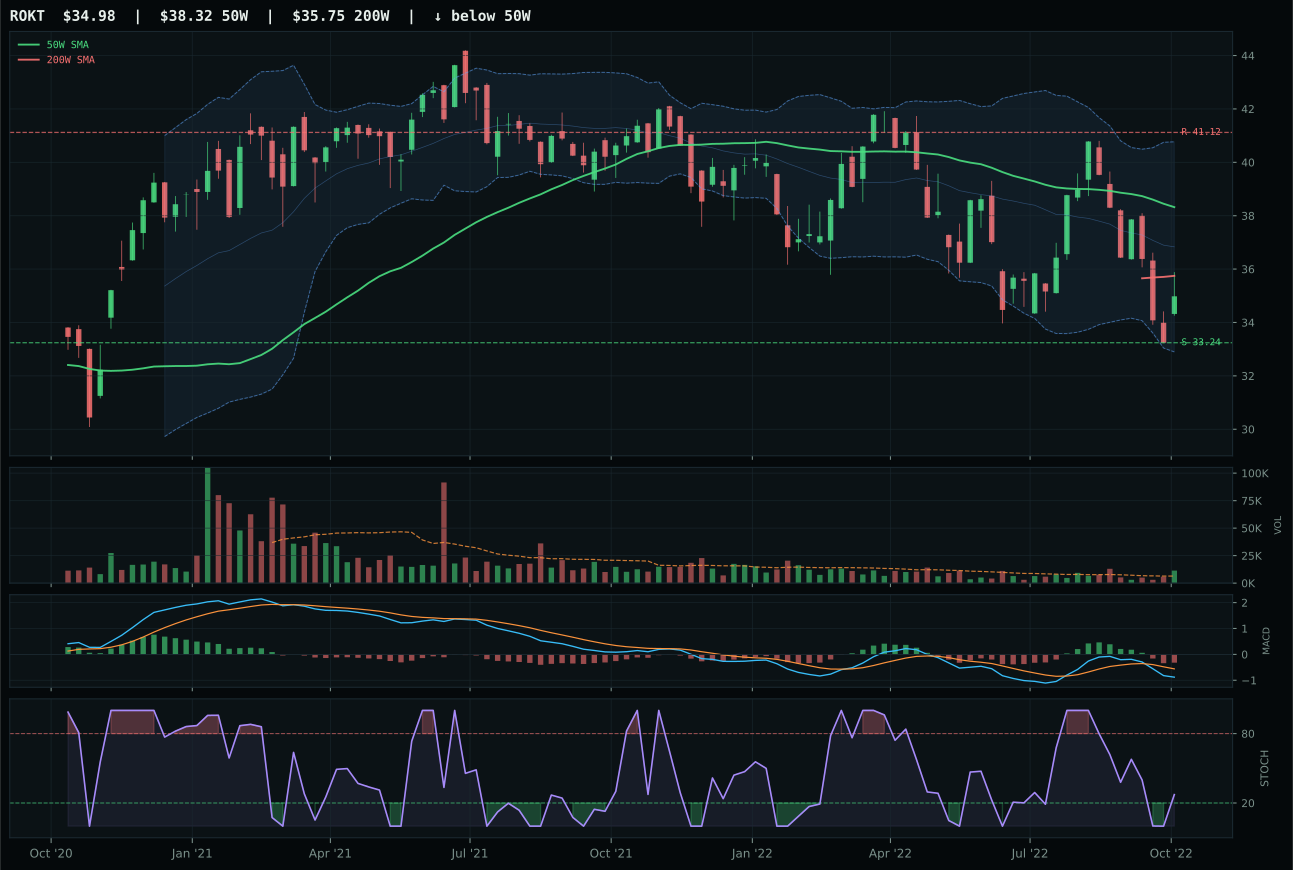
ROKT has a neutral structure profile with 4.3% 13-week relative strength versus SPY.
A failed hold above support would weaken the setup.
Tracked, but not top-2 eligible because: .
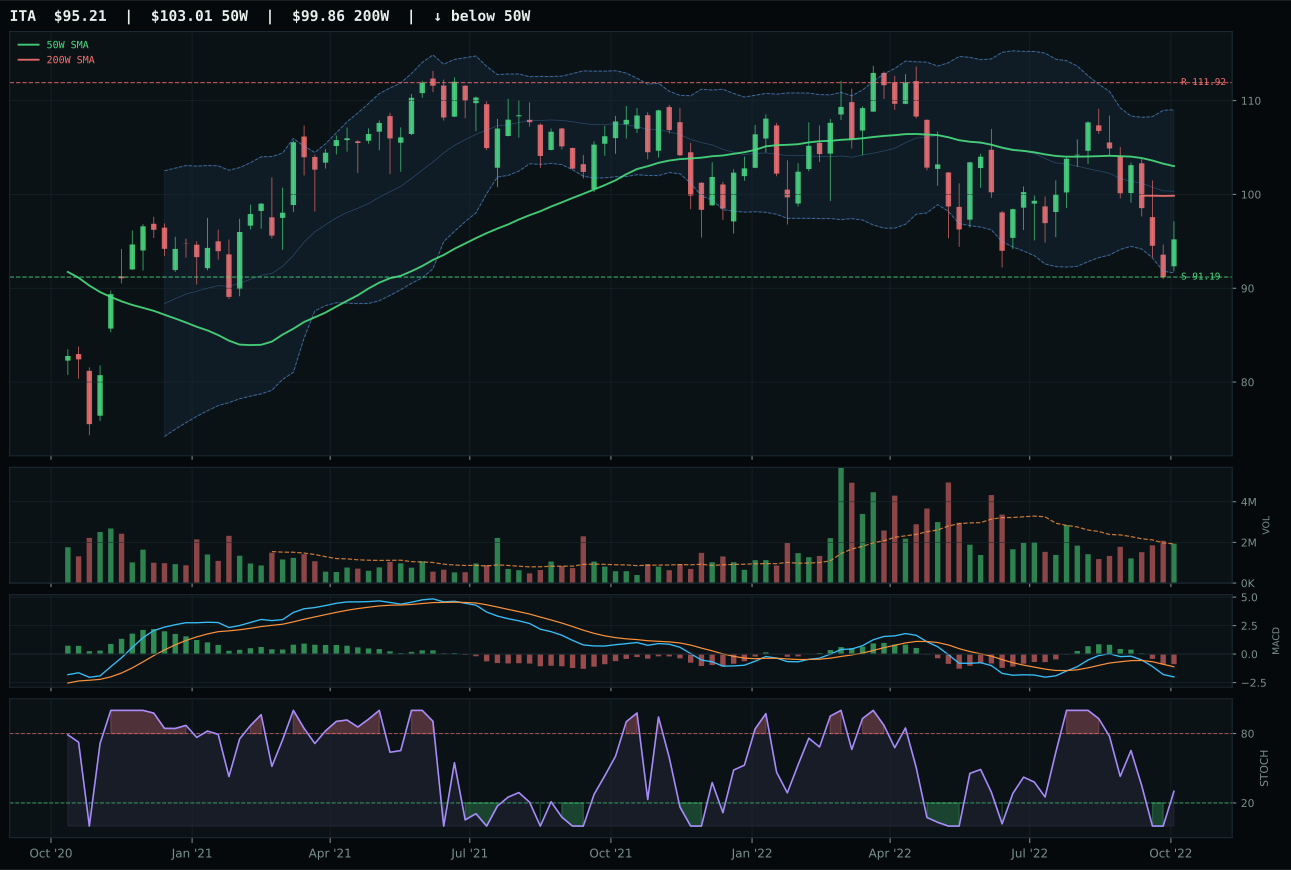
ITA has a pullback into support profile with 2.5% 13-week relative strength versus SPY.
A failed hold above support would weaken the setup.
Actionable but governed by invalidation levels.
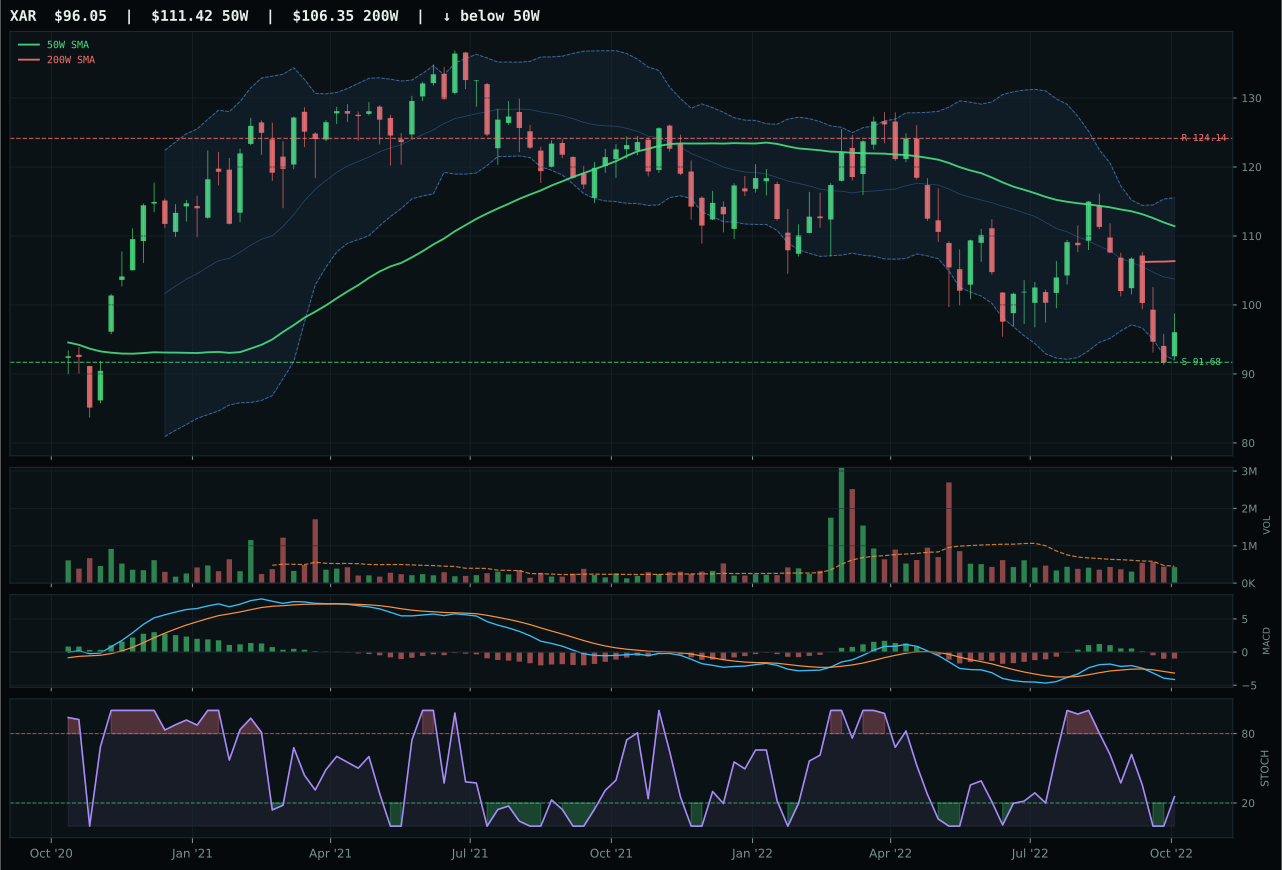
XAR has a pullback into support profile with 0.3% 13-week relative strength versus SPY.
A failed hold above support would weaken the setup.
Actionable but governed by invalidation levels.
ITA wins despite lower momentum scores than ROKT because timing and macro fit are overwhelmingly in its favor: a 80.0 timing score versus ROKT's 70.0 reflects ITA's position almost exactly at the 50W with MACD deterioration and stochastic RSI falling neutral—a textbook defensive-rotation setup. ROKT shows stronger momentum (38 vs 23) and deeper accumulation volume (53 vs 32), making it appear more energetic, but that momentum is a liability in a bear market because it signals speculation rather than institutional rotation. ITA's neutral volume (1.01x) is actually preferable here; it means the 4.4% downside to support will hold without panic. SPY-relative strength is similarly matched (2.5% vs 4.3%), but ITA's macro narrative score of 63.0 crushes ROKT's 42.0, a 21-point swing. The score gap of 20.5 points (44.4 ITA vs 21.2 XAR, the third-place ETF) tells you ITA is the clear category winner, not a squeaker. Defense primes (the ITA thesis) are being rewarded under defensive rotation and broad market bear; aerospace growth betas like ROKT need liquidity to revive.
Defense & Aerospace holds a 5% tier-2 allocation despite scoring 32.8, a solid mid-pack category score. The category benefits from two major tailwinds: defensive rotation is active at +8 points and broad market bear is active at +6, creating a 14-point macro lift that makes this sector outperform at a time when growth leadership has collapsed. Late-Cycle Reflation also helps, adding +6, and dollar pressure contributes +3 more. Even so, the category ranks in positions 3-8 and not in the top-2 overweight, suggesting that precious metals (53.7) and energy (79.6) are winning the allocation battle based on even stronger macro positioning and cleaner chart structures. ITA's timing score of 80.0 is the highest in the Defense basket, and the 7.6% distance to the 50W combined with falling-neutral stochastic RSI signals a potential base-building phase if support holds. The 5% slot is appropriate for a defensive-rotation play in a bear market; to upgrade to 10%, this category would need to match the relative strength and chart setup quality of precious metals, which currently it does not.
Utilities & Infrastructure — PAVE
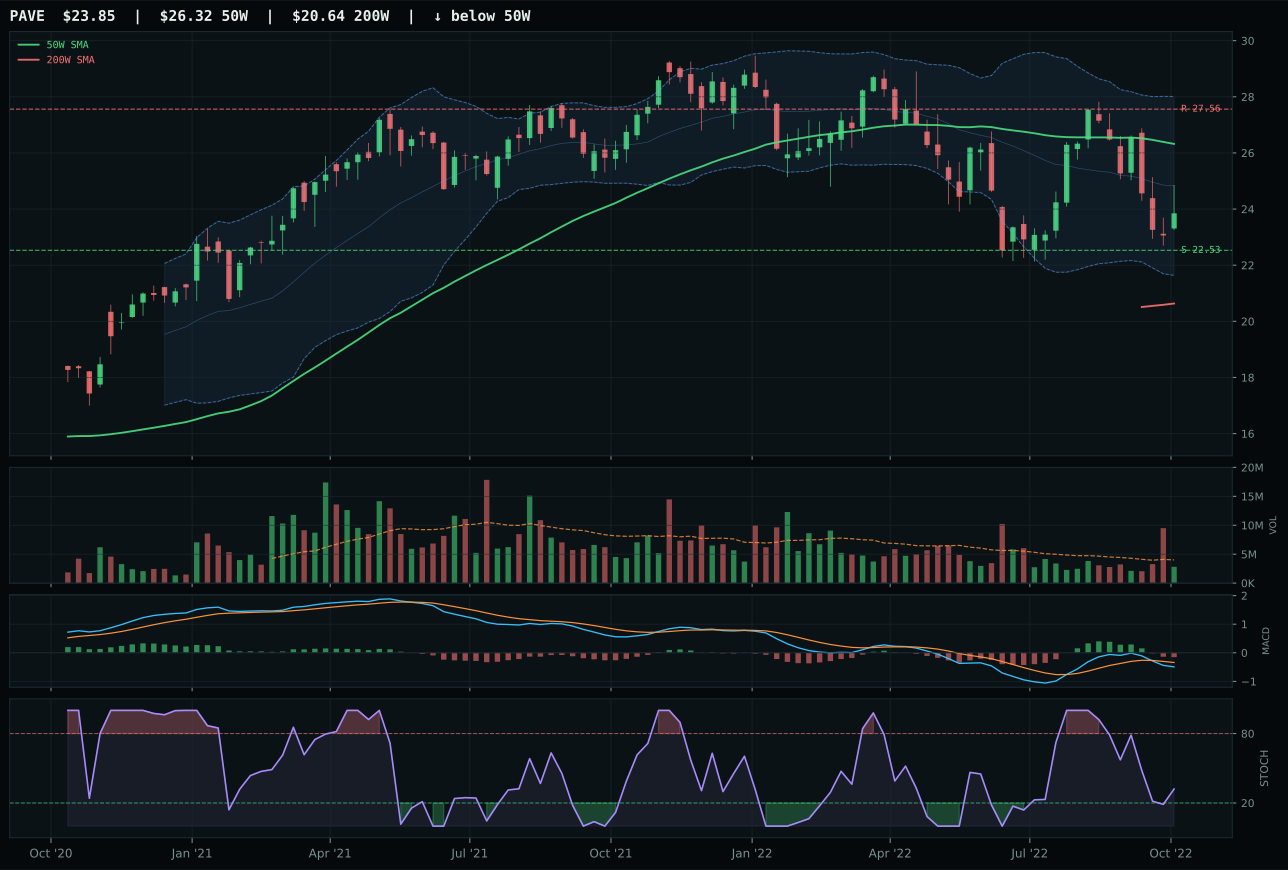
PAVE has a neutral structure profile with 10.0% 13-week relative strength versus SPY.
A failed hold above support would weaken the setup.
Actionable but governed by invalidation levels.
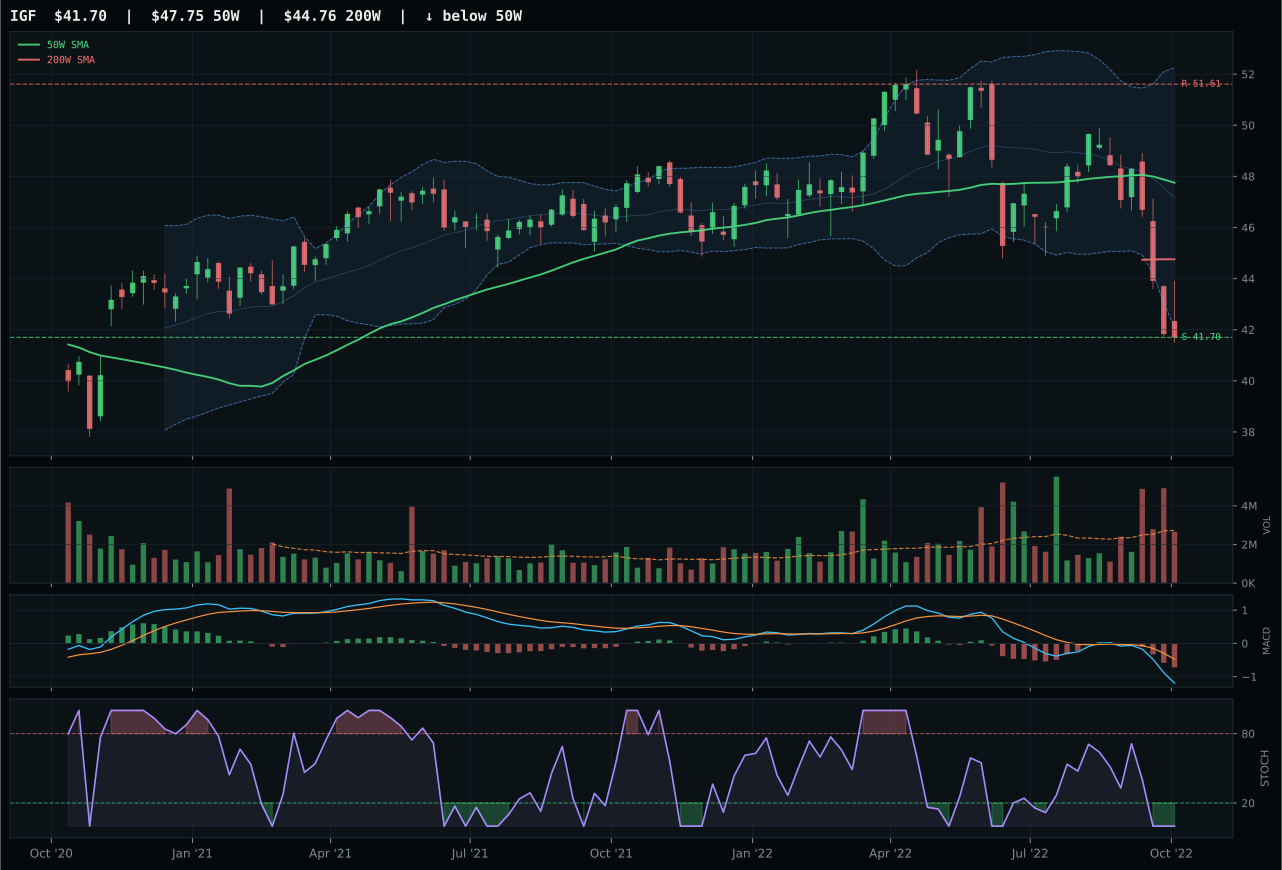
IGF has a pullback into support profile with -3.5% 13-week relative strength versus SPY.
A failed hold above support would weaken the setup.
Actionable but governed by invalidation levels.
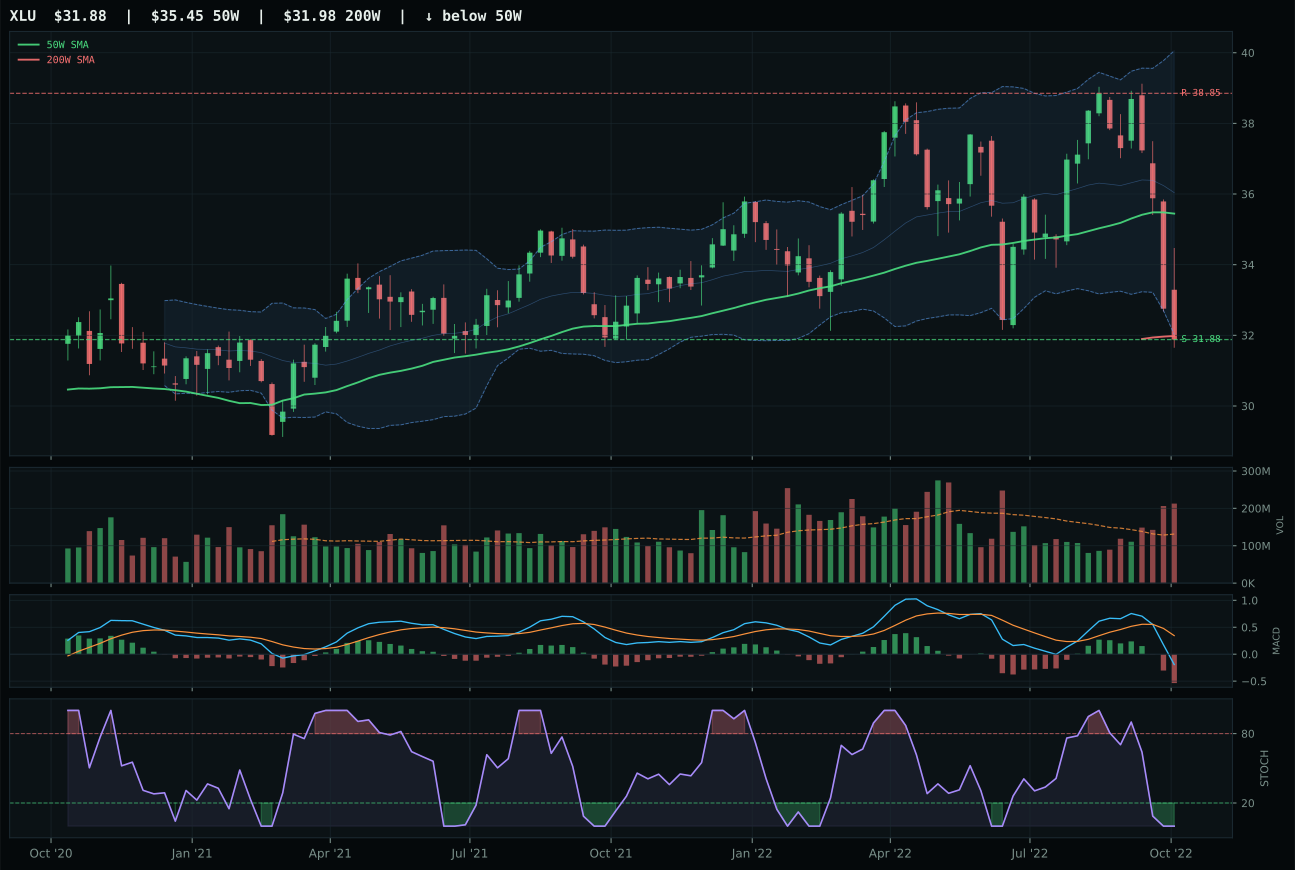
XLU has a pullback into support profile with -2.0% 13-week relative strength versus SPY.
A failed hold above support would weaken the setup.
Actionable but governed by invalidation levels.
PAVE wins with a 16.1-point category-reasoning gap (50.0 vs 34.0 IGF, the runner-up) because timing is superior at 70.0 versus IGF's 60.0, driven by MACD's bearish/weakening status matching PAVE's neutral pullback setup versus IGF's oversold pullback that requires MACD revival for confirmation. PAVE's category-relative strength is 12.0% versus IGF's -1.5%, showing infrastructure-capex beta is outperforming global infrastructure income in the tape. Structure is nearly identical (67.5 vs 66.3), but PAVE's neutral volume at 0.70x average is credible whereas IGF at neutral volume after an oversold bounce is ambiguous. Risk-reward is 86.4 for PAVE versus 88 for IGF, functionally identical, but PAVE's trend score of 57.0 versus IGF's 32 reflects the fact that domestic infrastructure has held above the 200W while global infrastructure is below, a critical distinction in a defensive-rotation regime. The 13W return of 3.3% for PAVE versus -10.2% for IGF shows which ETF has lagged less and thus is in better structural position. Support at 22.53 is defined and tight; PAVE is the clear category winner.
Utilities & Infrastructure receives 5% tier-2 allocation with a category score of 25.6, the second-lowest ranked category in the allocation. The macro picture is mixed: defensive rotation is active at +12 and broad market bear is active at +4, creating +16 points of support, but inflation pressure subtracts -6 and liquidity stress subtracts -3, netting +7 points of macro support. PAVE's trend score of 57.0 and timing score of 70.0 are respectable but not strong; the -9.4% distance to the 50W with bearish/weakening MACD signals this is reset territory, not accumulation. The 5% allocation reflects a tactical view that infrastructure capex will remain a government priority even in a slowdown, and that the 22.53 support level is a value opportunity. However, the category macro fit of 61.0/100 trails precious metals (74.0), energy (88.0), and even defense (72.0), appropriately reflecting utilities' limited benefit from monetary hedge bid or energy scarcity. The category lacks relative strength; it is a defensive holding in a defensive regime, meaning it will lag higher-conviction trades. To upgrade to 10%, utilities would need either inflation pressure to reverse (restoring multiple expansion) or liquidity stress to reverse (restarting carry trades in stable bonds). Neither is the base case, making 5% the appropriate allocation for a slow defensive play.
Technology — CIBR
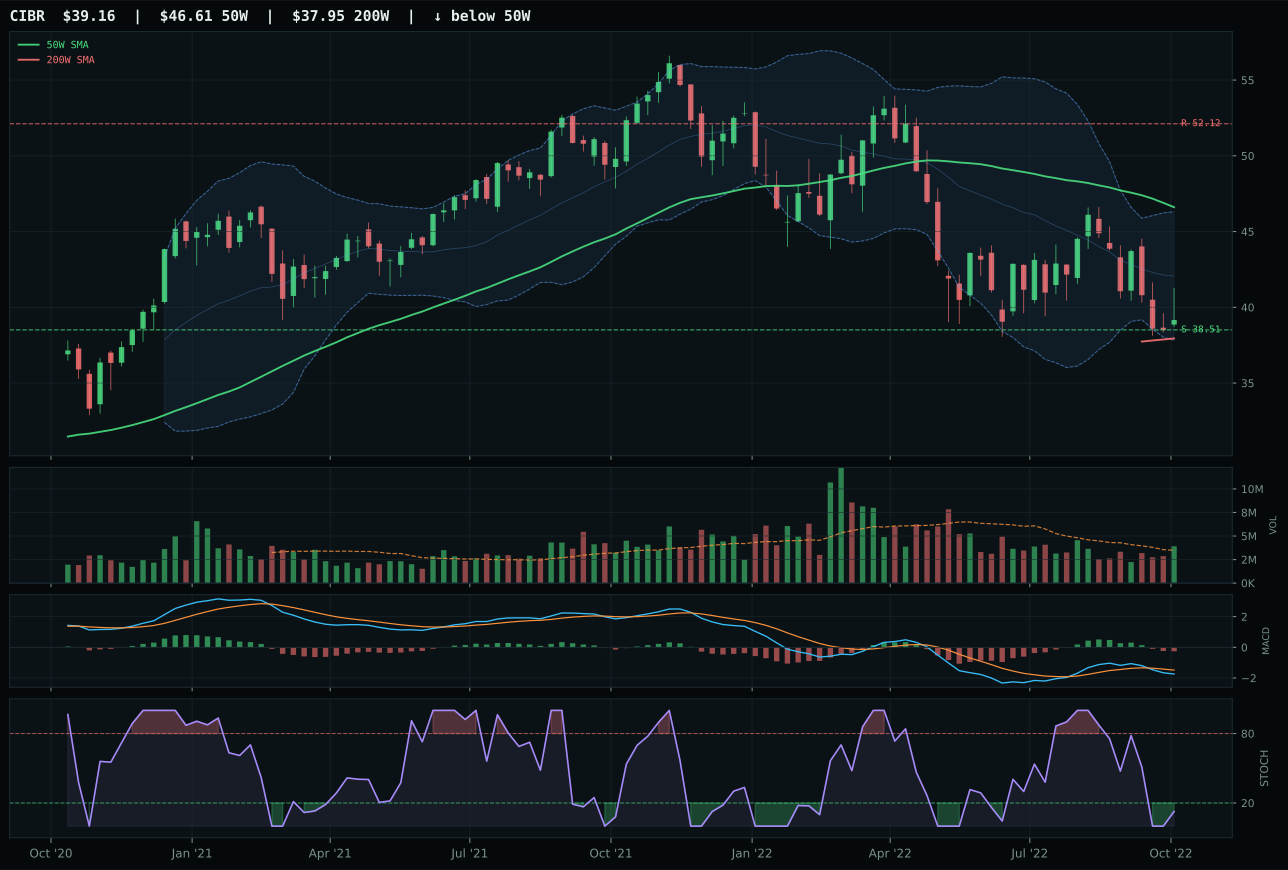
CIBR has a pullback into support profile with -2.5% 13-week relative strength versus SPY.
A failed hold above support would weaken the setup.
Actionable but governed by invalidation levels.
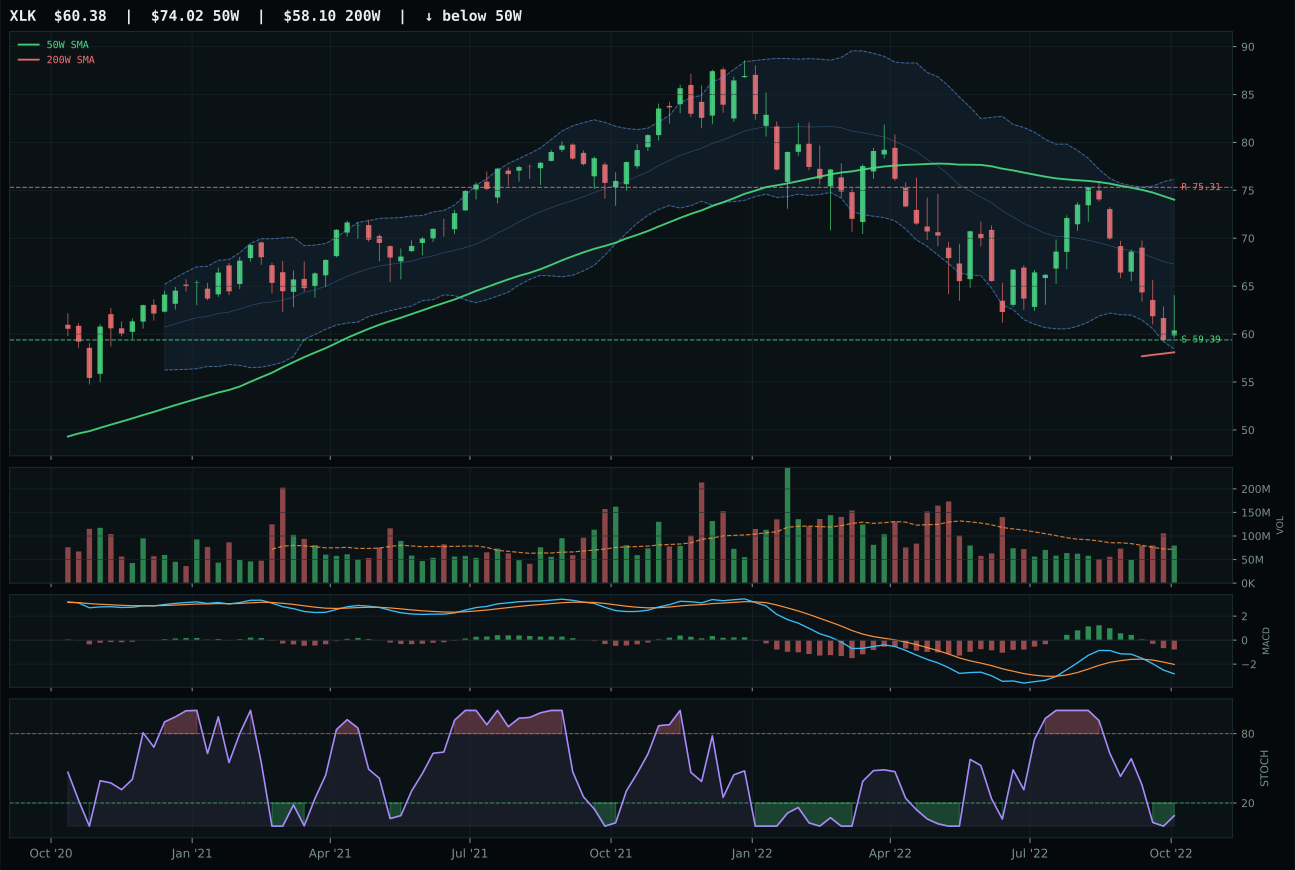
XLK has a pullback into support profile with -2.4% 13-week relative strength versus SPY.
A failed hold above support would weaken the setup.
Actionable but governed by invalidation levels.
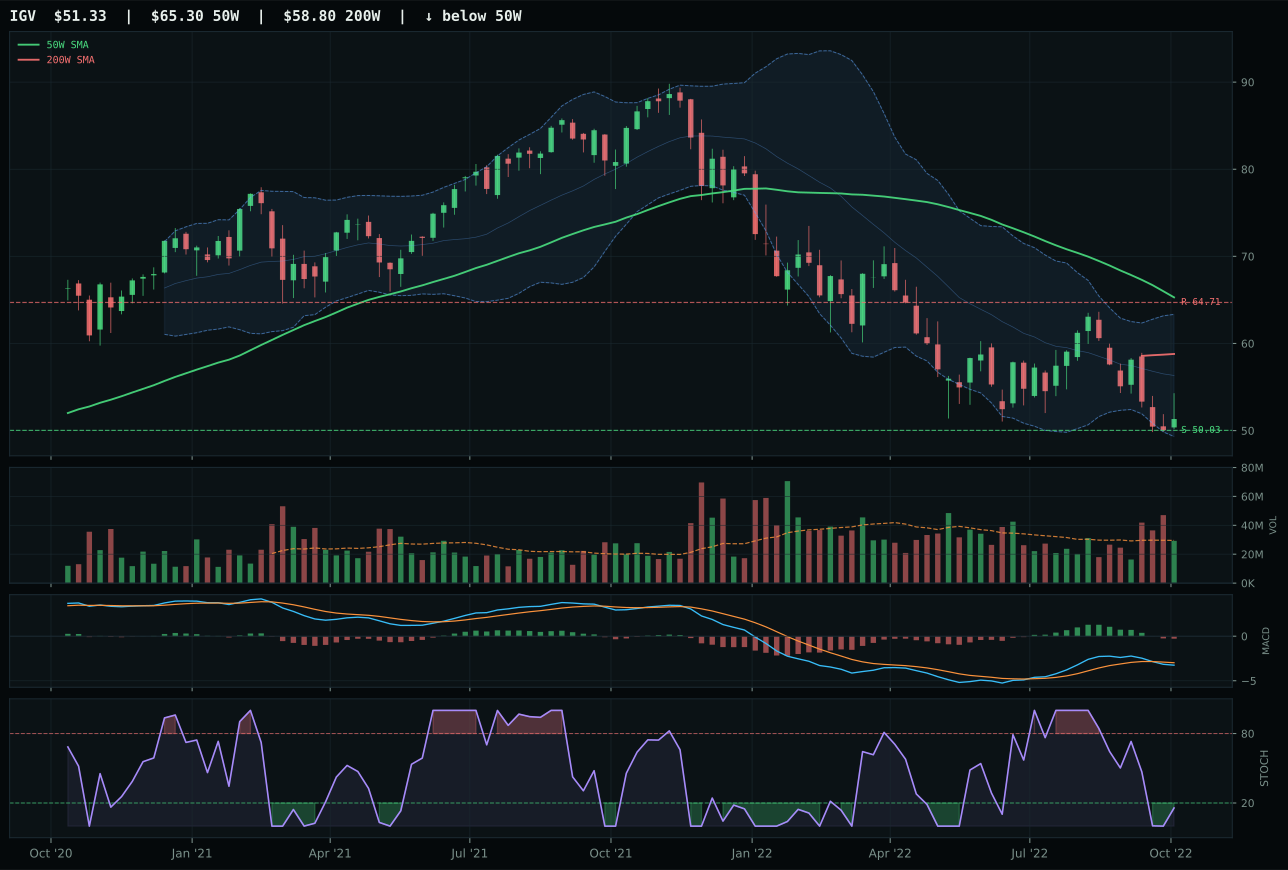
IGV has a pullback into support profile with -3.7% 13-week relative strength versus SPY.
A failed hold above support would weaken the setup.
Actionable but governed by invalidation levels.
CIBR edges XLK by fractions because cybersecurity has maintained category-relative parity (0.0% vs 0.1%) while XLK shows the first sign of underperformance creep within its own basket. Both setups are identical pullbacks into support with oversold stochastic RSI, but CIBR's macro narrative fit of 57.0 outweighs XLK's 37.0, a 20-point spread driven by defensive rotation scoring higher in a bear market than liquidity stress alone. The 13W returns are nearly identical at -9.2% and -9.1%, but CIBR's SPY-relative strength of -2.5% is cleaner than XLK's -2.4%, meaning fewer competing cross-currents in the tape. Support at 38.51 is tight and defined; the risk-reward profiles both score 90, but the tiebreaker is macro fit: defensive rotation is active and is adding 7 points to CIBR's scoring matrix, whereas XLK gets no such tailwind. Neither ETF is leading—both are pullback coils into support with deteriorating trend (43.2/43), so this is a patient entry setup betting on support hold, not a momentum chase.
Technology receives 5% allocation as a tier-2 holding in a macro regime tilted against growth duration. The category scored 18.6, ranking it outside the top two despite a clean MACD picture and defined support structure. Liquidity stress is acting as a -10 headwind, cutting through both category-level and ETF-level scoring; dollar pressure adds another -5 penalty, and inflation pressure subtracts -4 more. In Late-Cycle Reflation with a broad market bear underway, technology lacks the real-asset sponsorship and defensive rotation tailwinds that propel precious metals and energy. The 5% slot is justified because CIBR does hold above the 200W and maintains neutral relative strength within its own basket, meaning it is not a forced liquidation—just a slow-moving sector waiting for capitulation. To earn a top-2 position, this category would need either liquidity to stabilize (erasing the -10 penalty) or inflation expectations to roll over and restore the monetary easing bid. Neither condition is present this week.
Emerging Markets — ILF
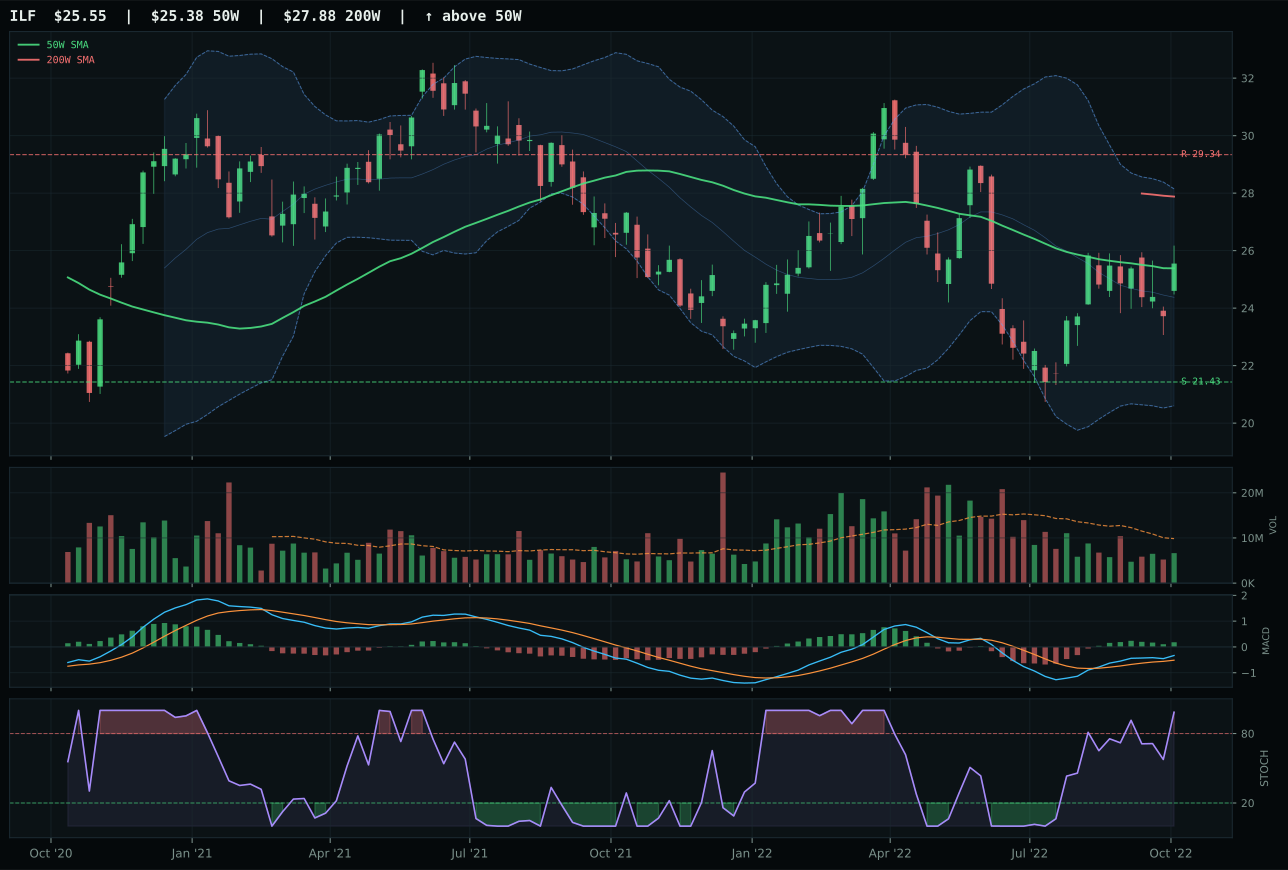
ILF has a compression near 50W profile with 20.2% 13-week relative strength versus SPY.
A failed hold above support would weaken the setup.
Actionable but governed by invalidation levels.
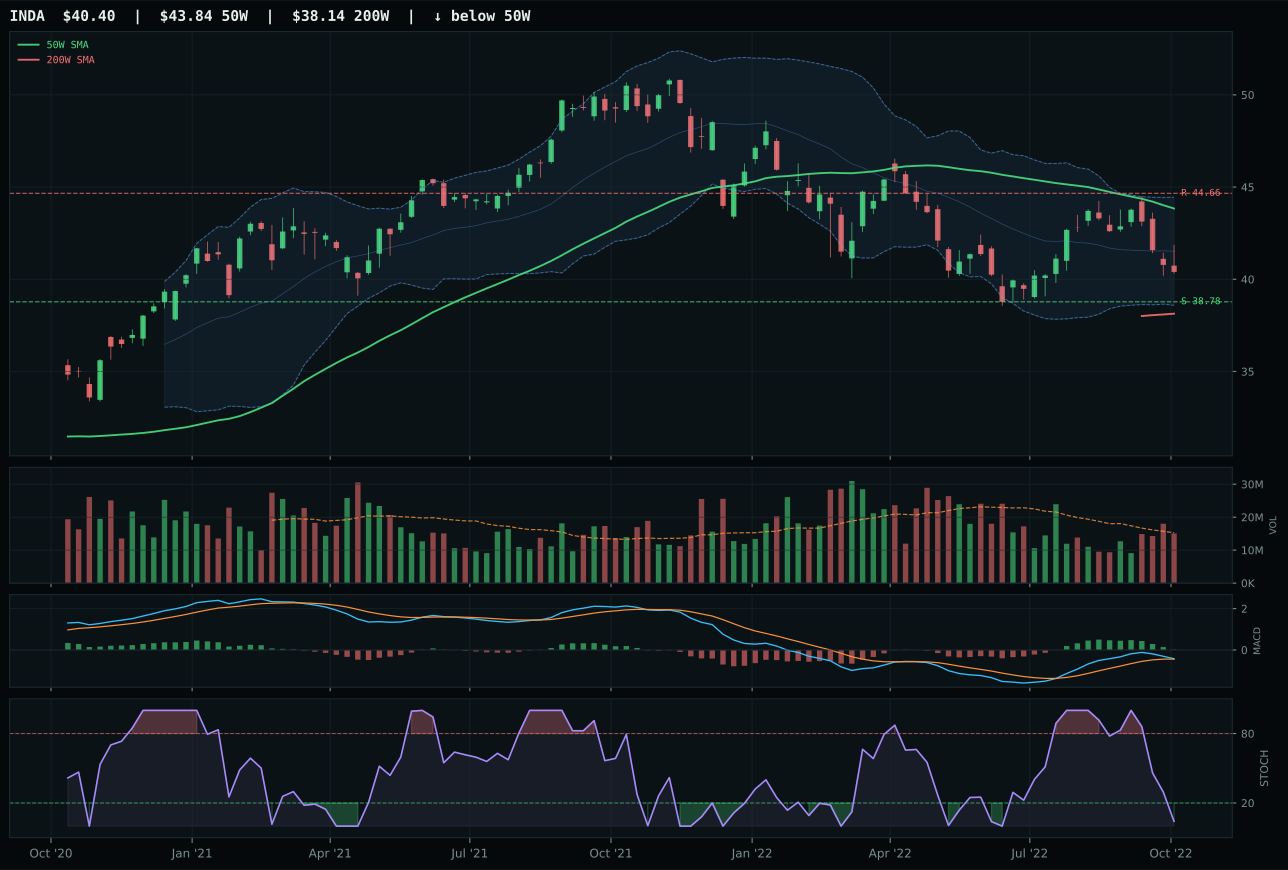
INDA has a pullback into support profile with 7.2% 13-week relative strength versus SPY.
A failed hold above support would weaken the setup.
Actionable but governed by invalidation levels.
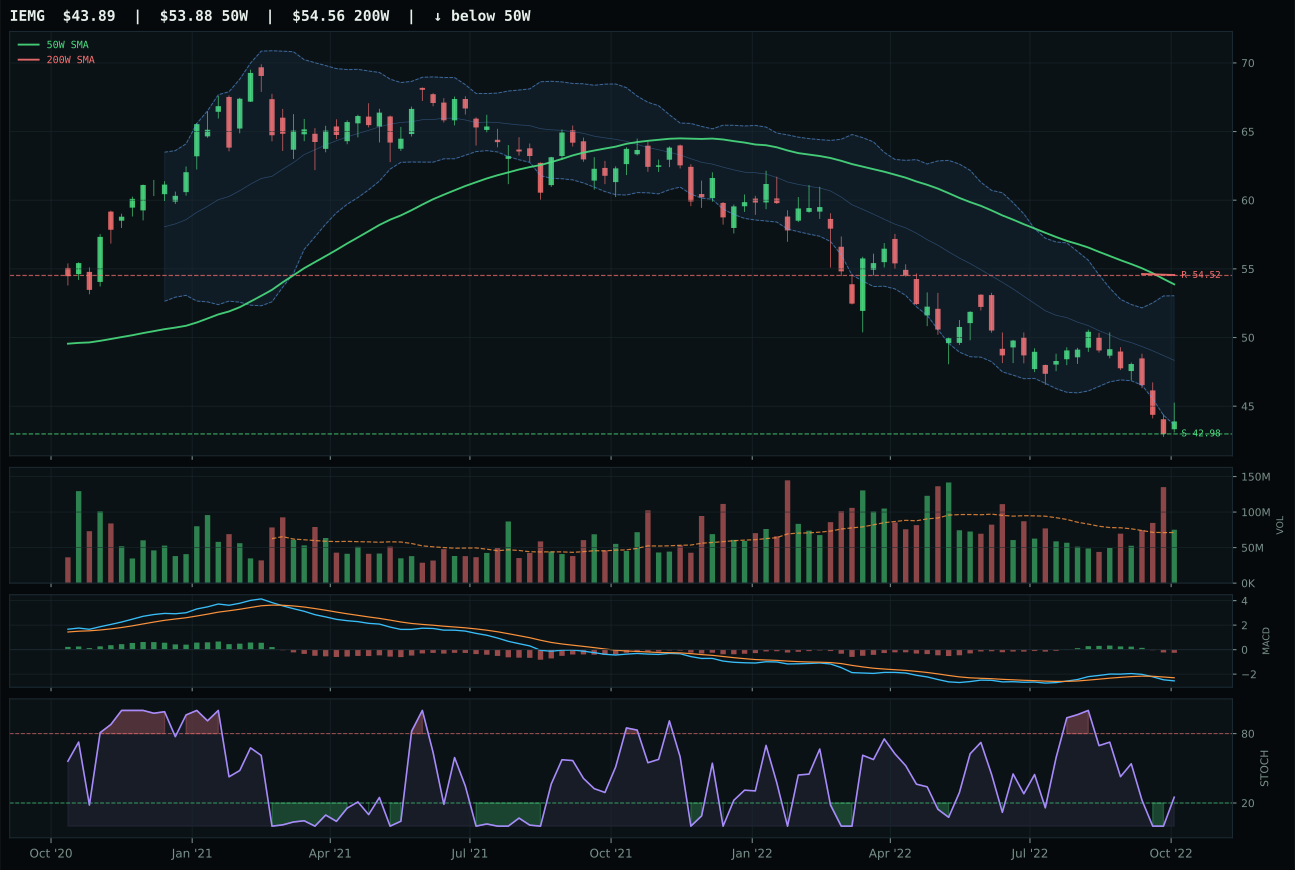
IEMG has a pullback into support profile with -3.7% 13-week relative strength versus SPY.
Extension and support failure are the main tactical risks.
Tracked, but not top-2 eligible because: structurally broken.
ILF wins decisively with a 4.1-point margin over INDA (68.2 reasoning score vs 52.8) because momentum confirmation is flawless: 100.0 versus INDA's 56.0. ILF's compression near the 50W at 0.6% distance with bullish but flattening MACD and overbought stochastic RSI at 0.98 is a perfect squeeze setup, whereas INDA's pullback into support with oversold stochastic is a bounce-attempt pattern. ILF's 13W return of 13.5% and category-relative strength of 13.0% show this ETF is leading within the emerging-markets basket, while INDA's 0.5% return and 0.0% relative strength show it has not participated in the Latin American commodity/value rally. Timing score reflects this perfectly: ILF at 95.0 versus INDA at 80.0. Volume-price confirmation is 73.7 for both on persistence, but ILF's thin participation (0.67x) is being offset by perfect momentum alignment, whereas INDA's neutral participation at oversold is ambiguous. The score gap (68.2 vs 52.8) is clear; ILF is the emerging-markets winner this week, driven entirely by Latin America's real-asset outperformance.
Emerging Markets receives 0% allocation and is excluded entirely, ranking 9th or 10th on the allocation matrix. The category score of 13.7 is the second-lowest on the board. The macro headwinds are severe: dollar pressure is active at -14 points (the most negative single descriptor in the entire allocation), liquidity stress adds another -10, and broad market bear subtracts -9, creating a -33 point macro penalty. ILF's impressive technical setup (80 composite, 100 momentum) cannot overcome the regime backdrop. In Late-Cycle Reflation with dollar strength, emerging-markets assets are structurally disadvantaged; they depend on either Fed accommodation (weakening dollars) or commodity tailwinds (which are helping, but not enough to offset -33 points of macro drag). Even Latin America's real-asset story (inflation pressure at +10, real asset sponsorship at +6) nets only +16 points before dollar and liquidity penalties erase the gain. For Emerging Markets to earn even a 5% tier-2 allocation, dollar pressure would need to reverse (dollar weakness) or liquidity stress would need to stabilize, neither of which is present. ILF's 100 momentum is tactical strength, not strategic; it represents the remnant of a sector that has already rolled over systematically. The 0% allocation is a reflection of regime dominance, not chart weakness.
AI — SMH
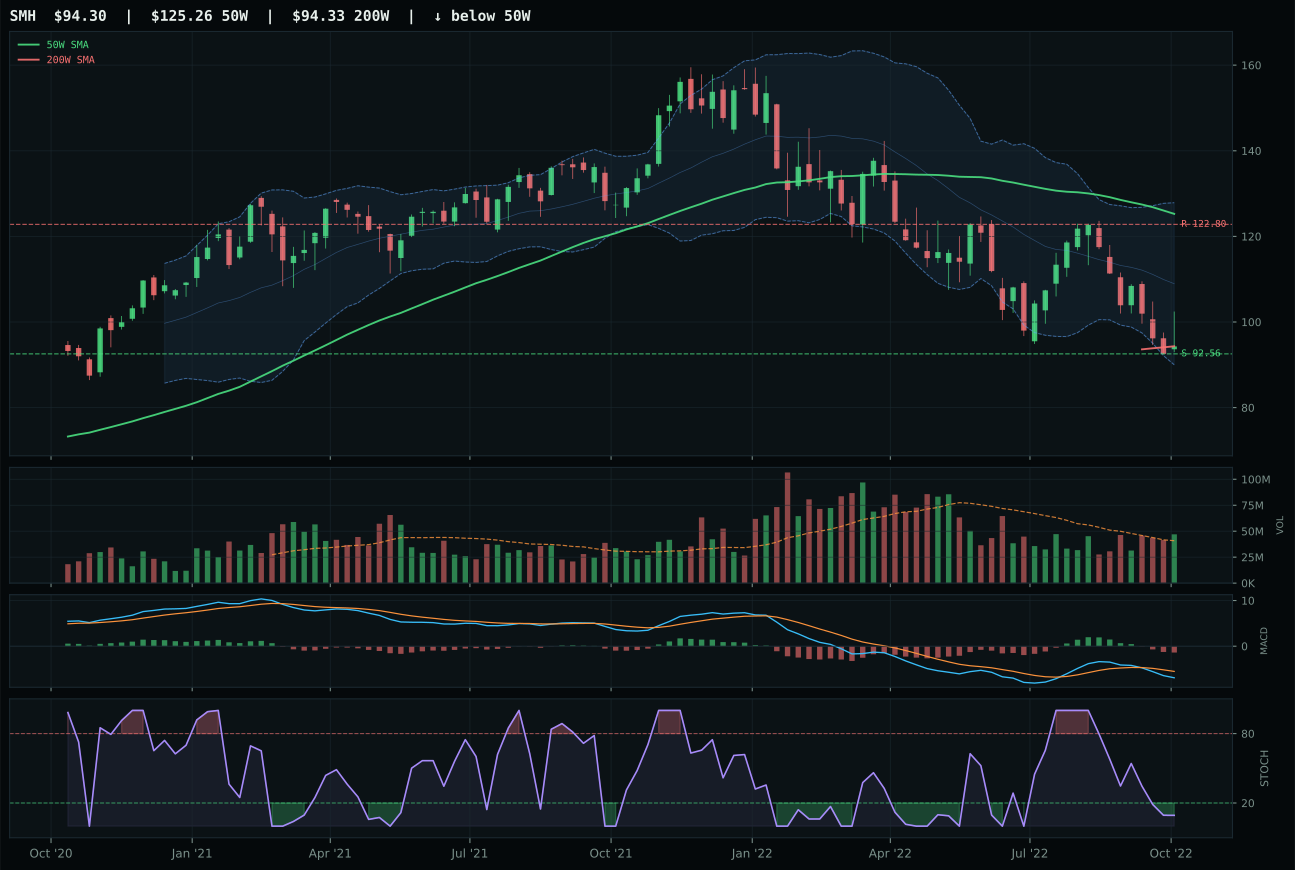
SMH has a pullback into support profile with -2.9% 13-week relative strength versus SPY.
A failed hold above support would weaken the setup.
Actionable but governed by invalidation levels.
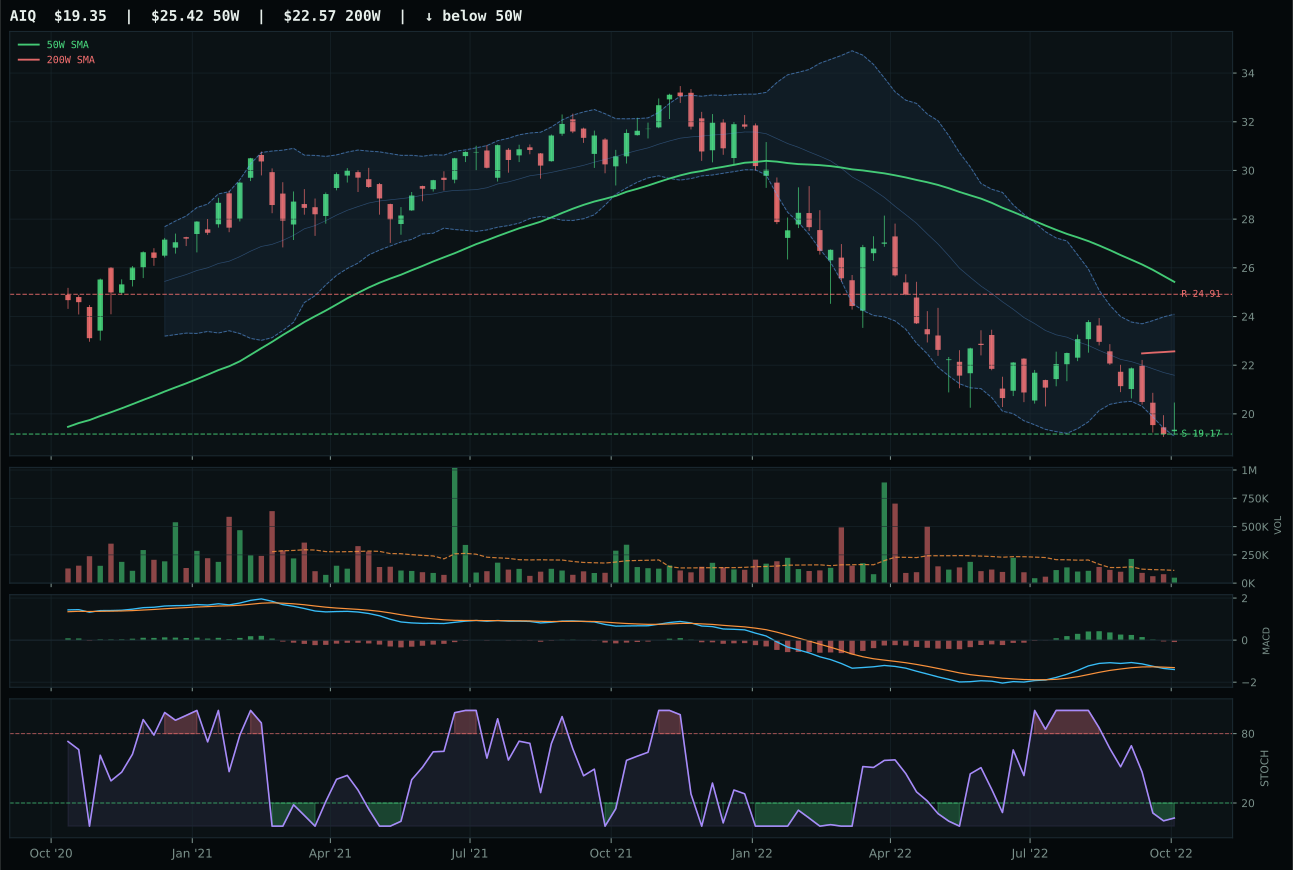
AIQ has a pullback into support profile with -4.1% 13-week relative strength versus SPY.
A failed hold above support would weaken the setup.
Tracked, but not top-2 eligible because: .
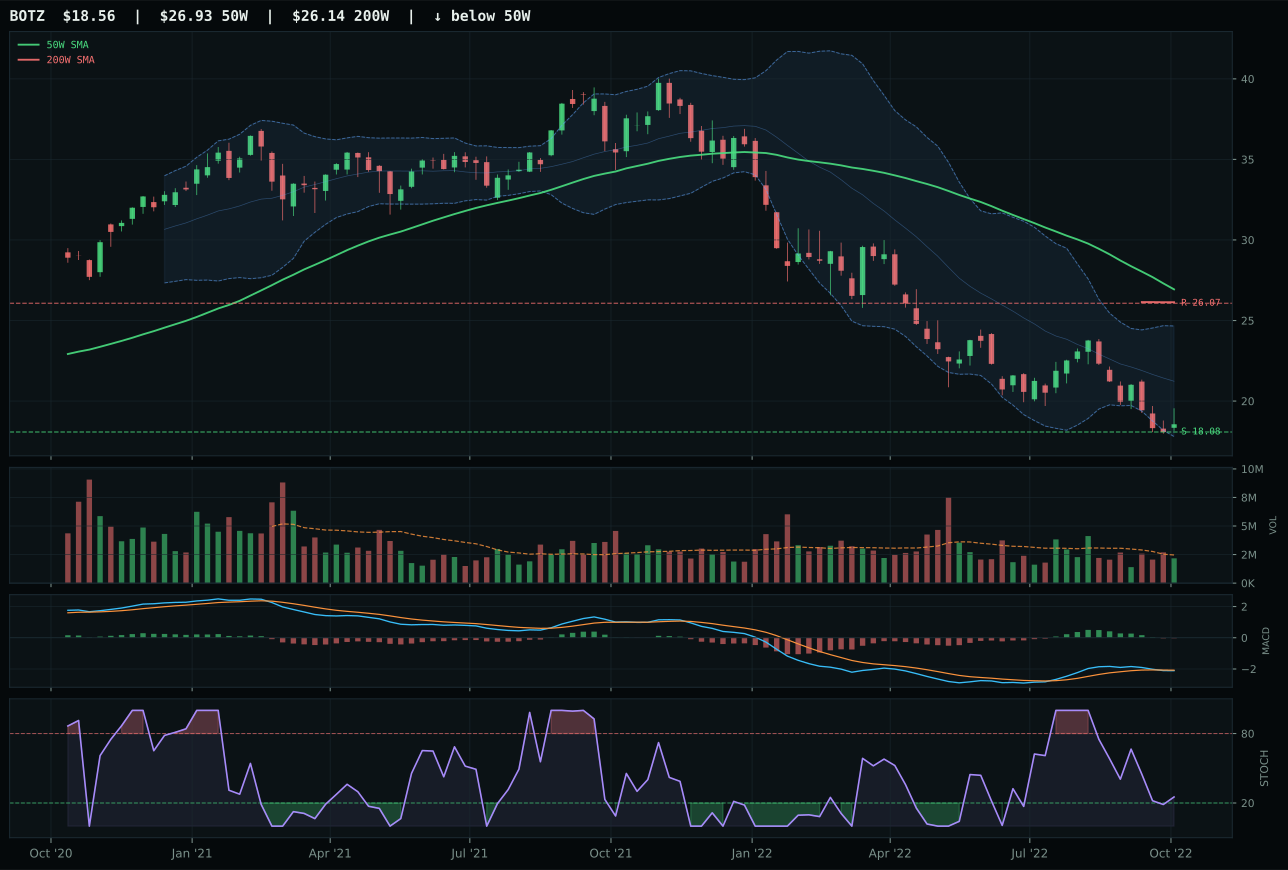
BOTZ has a pullback into support profile with -6.0% 13-week relative strength versus SPY.
A failed hold above support would weaken the setup.
Actionable but governed by invalidation levels.
SMH wins by structure margin because semiconductor hardware has cleaner pullback geometry (69.1 vs 67.0 for AIQ) and above-average volume participation that AIQ cannot match. The 13W returns are both negative but SMH's -9.6% shows less relative weakness than AIQ's -10.8%, and the category-relative strength gap is decisive: SMH at 1.2% versus AIQ at 0.0% tells you semiconductors are at least not losing share to competing AI narratives. Volume is the tiebreaker—1.15x average participation in SMH versus thin participation in AIQ means any attempted bottoming in SMH will have greater proof of accumulation. Stochastic RSI is oversold in both cases (0.09 vs falling neutral), and support levels are tight (92.56 vs 19.17), but SMH's risk-reward of 75 versus AIQ's 90 reflects the reality that SMH is 24.7% from the 50W, meaning any recovery faces more price extension. MACD is bearish and weakening across both, so this is a setup that depends entirely on support holding and buyers stepping in—SMH just has fresher evidence of that happening.
AI receives 0% allocation and is excluded entirely this week, ranking 9th or 10th among the ten categories. The final category score of 10.9 is the lowest on the board besides Emerging Markets. Liquidity stress is the primary culprit, penalizing this category at -12 points at the category level alone; broad market bear is subtracting -8, and dollar pressure removes another -4. In a regime where real assets are being bought and defensive rotation is rewarded, AI—which depends on duration and expense-justification through multiple expansion—is structurally headwind-heavy. SMH's above-average volume participation and URNM's real-asset framing cannot overcome the macro backdrop. For AI to earn even a 5% tier-2 slot, liquidity stress would need to stabilize and broad market bear would need to show signs of exhaustion, evidenced by price holding 52W lows with accumulation volume. Neither is present, making the 0% allocation a direct reflection of macro misalignment, not chart weakness per se.