
2022-09-30
Informational purposes only. The content in this report, including allocations, analysis, and commentary, is provided solely for informational and educational purposes. It does not constitute financial advice, investment advice, trading advice, or any other type of advice. Past performance does not guarantee future results. Always conduct your own research and consult a qualified financial professional before making investment decisions.
XLE defensive overlay excluded: price is below its 8W SMA. Cause selector will use GLD or cash alternative.
GLD defensive overlay excluded: price is below its 8W SMA. Cause selector will use cash alternative.
Fast-crash circuit breaker triggered: SPY dropped more than 8% from its 4-week high this week. Defensive overlay activated immediately.
Macro risk engine requires the 50% Defensive overlay for this run; payload selected by cause: Transition Defense.
Weekly Allocation
| Ticker | Category | Weight | Role |
|---|---|---|---|
| SGOV | 20% | Overlay | |
| GLD | Precious Metals | 20% | Overlay |
| XLU | 15% | Overlay | |
| XLE | Traditional Energy | 10% | Top-2 (10%) |
| URA | Nuclear Energy | 10% | Top-2 (10%) |
| COPX | Industrial Metals | 5% | Tier-2 (5%) |
| WEAT | Agriculture & Livestock | 5% | Tier-2 (5%) |
| ITA | Defense & Aerospace | 5% | Tier-2 (5%) |
| PAVE | Utilities & Infrastructure | 5% | Tier-2 (5%) |
| CIBR | Technology | 5% | Tier-2 (5%) |
Trade Instructions — Monday Open
Sell the tranche from 2022-09-02 (completing its 4-week hold). Buy the new tranche. Instructions show net portfolio changes — same-asset positions cancel, weight changes show the delta.
| Action | Ticker | Instruction |
|---|---|---|
| SELL | XLU | Sell 13% of XLU position (reduce 18.75% → 16.25%) |
| SELL | GDX | Sell entire GDX position (2.50% of portfolio) |
| SELL | URNM | Sell 20% of URNM position (reduce 6.25% → 5.00%) |
| SELL | MOO | Sell entire MOO position (1.25% of portfolio) |
| BUY | GLD | Buy GLD — 16.67% of freed cash (adds 1.25% to portfolio) |
| BUY | XLE | Buy XLE — 16.67% of freed cash (adds 1.25% to portfolio) |
| BUY | WEAT | Buy WEAT — 16.67% of freed cash (adds 1.25% to portfolio) |
| BUY | URA | Buy URA — 33.33% of freed cash (adds 2.50% to portfolio) |
| BUY | PAVE | Buy PAVE — 16.67% of freed cash (adds 1.25% to portfolio) |
Current Portfolio After Trade
Combined holdings across all 4 active tranches. Each tranche is 25% of the portfolio.
| Ticker | % of Portfolio | Weight Bar |
|---|---|---|
| SGOV | 27.50% | |
| GLD | 16.25% | |
| XLU | 16.25% | |
| XLE | 8.75% | |
| WEAT | 6.25% | |
| URNM | 5.00% | |
| ITA | 5.00% | |
| CIBR | 3.75% | |
| URA | 3.75% | |
| COPX | 2.50% | |
| PICK | 2.50% | |
| XLK | 1.25% | |
| PAVE | 1.25% |
Macro Regime — Late-Cycle Reflation
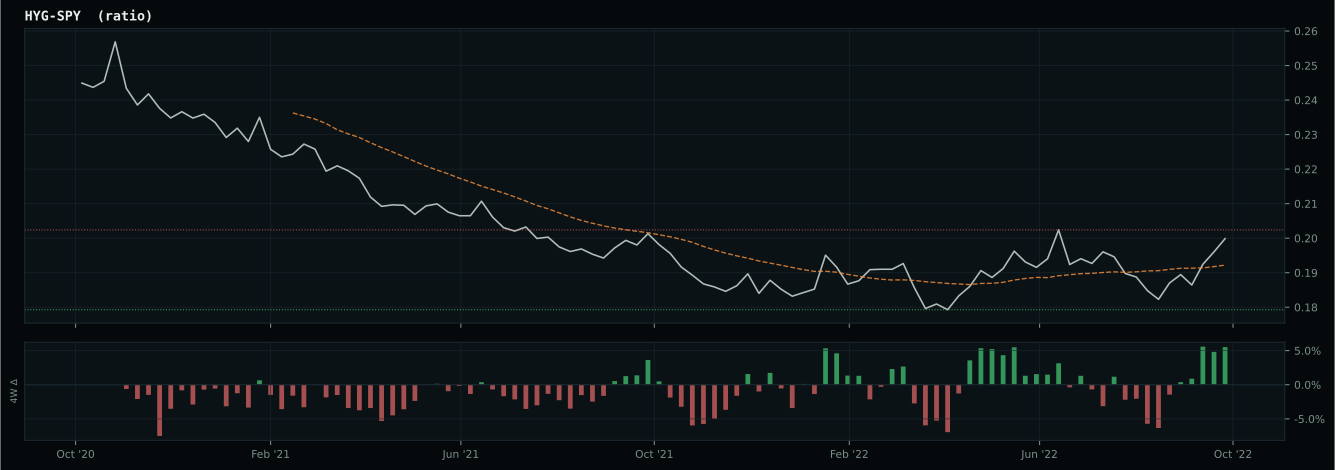
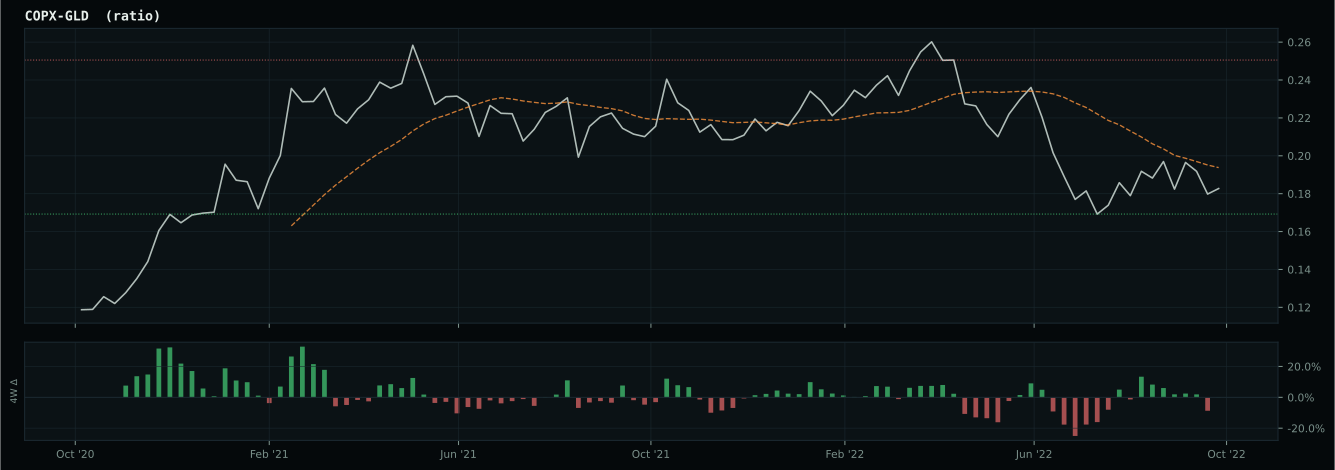
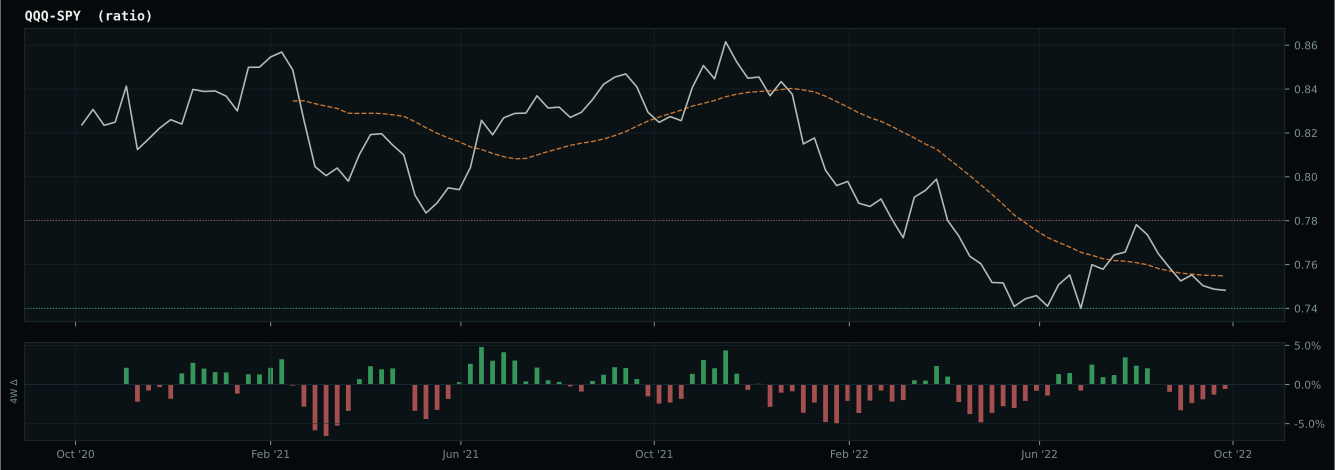
inflation-sensitive ratios are firm but broad commodity participation is weak
Defensive overlay cause is not singular enough to concentrate: the sleeve diversifies across liquidity, monetary defense, and defensive equity exposure while the market resolves the next regime.
Macro Evidence Charts
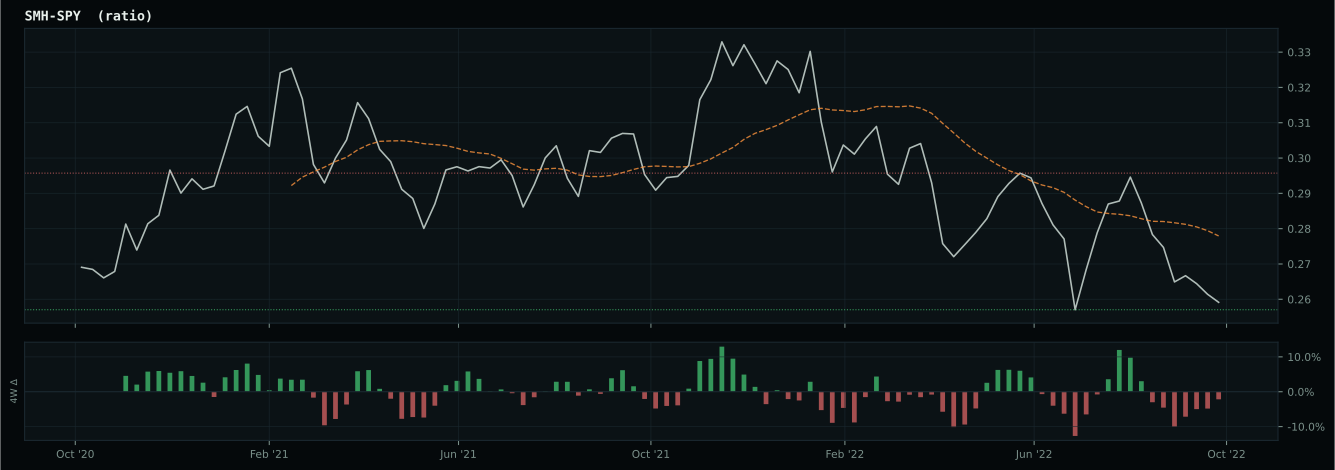
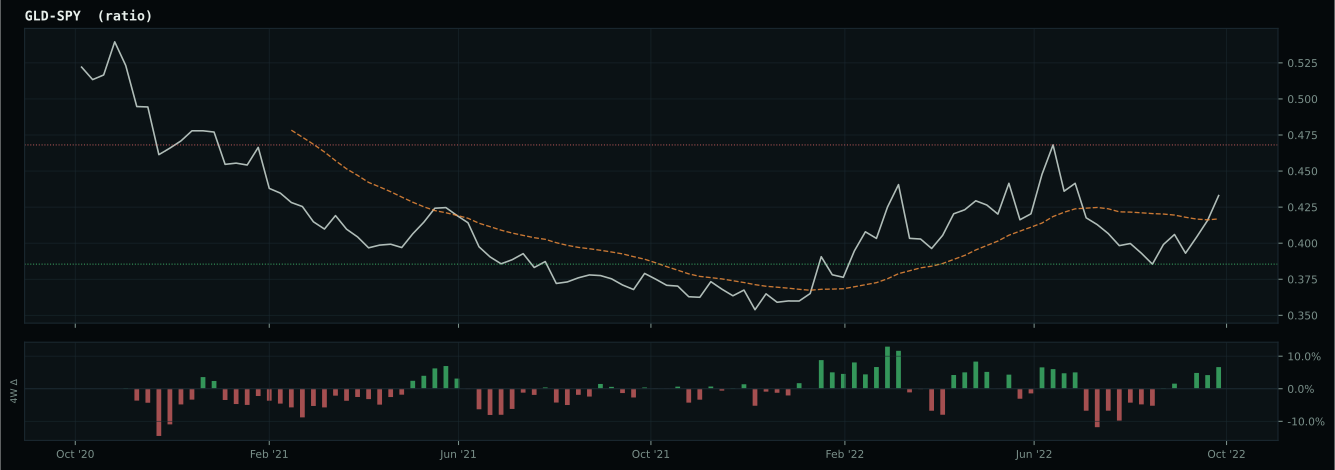
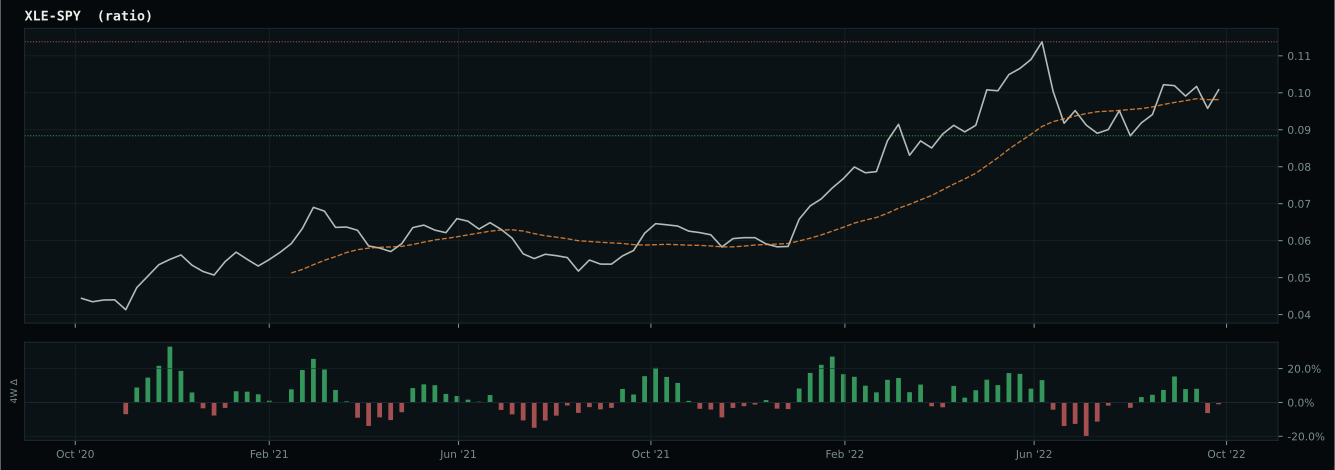
Market-implied signals behind the macro regime scores. Each ratio compares two assets; the direction and slope of the ratio is what the macro engine reads.
Crypto Regime — NoCrypto
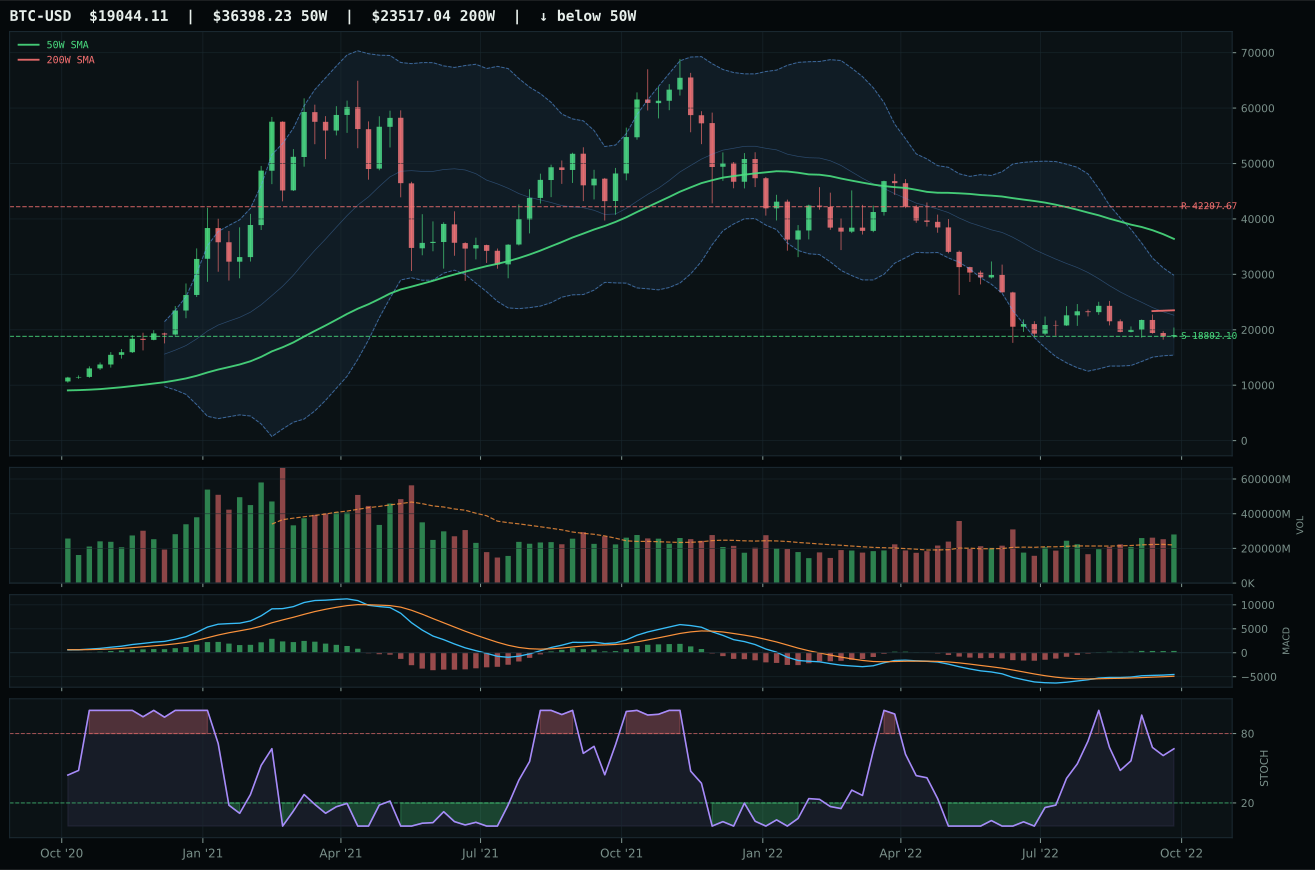
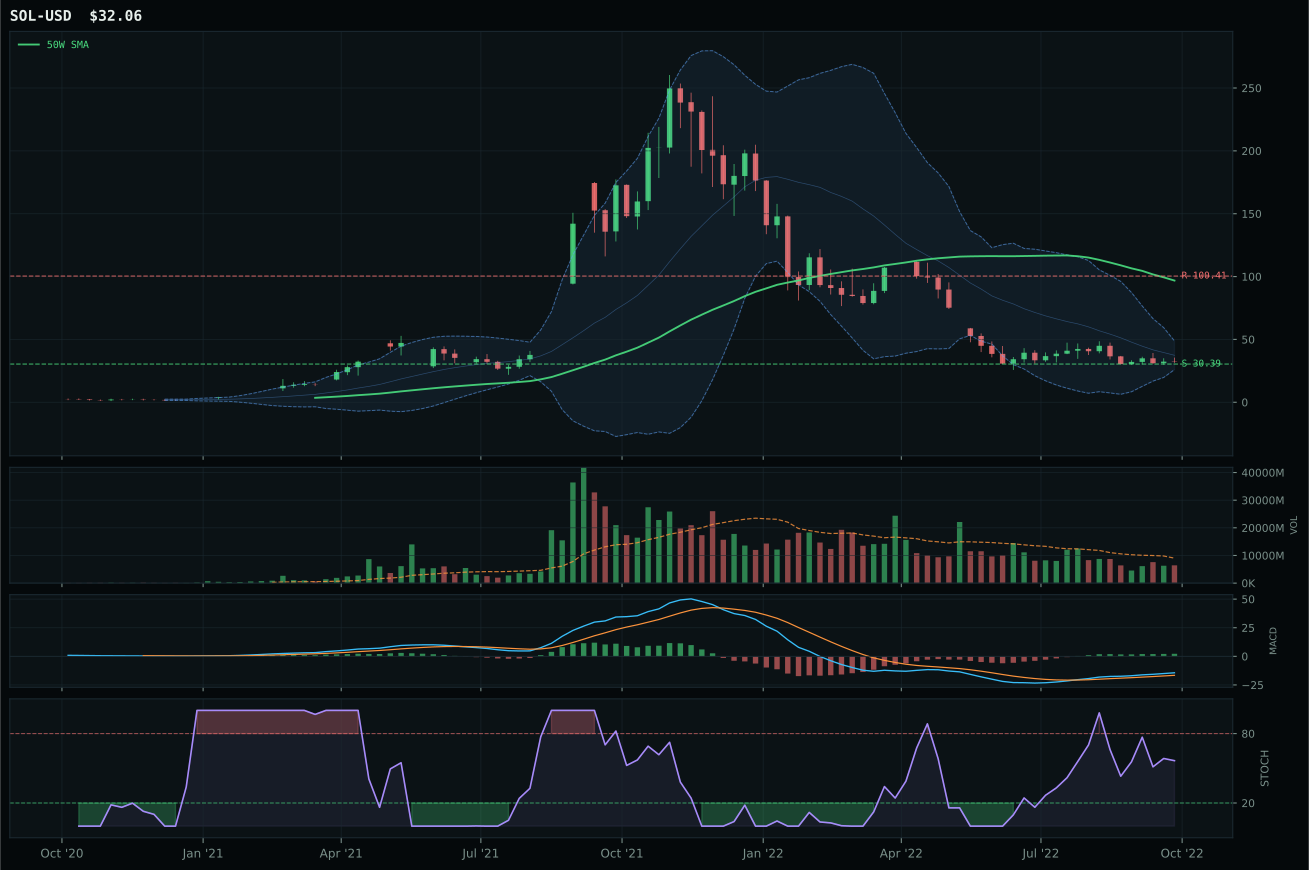
ValueBTC armed; waiting for 50W reclaim, decisive close above post-touch range resistance by 3%, close above 200W
TrendBTC not confirmed
one or more available conditions failed
Category Rankings
| Rank | Category | Winner | Score | Alloc | 4W Ret | Peers (4W) |
|---|---|---|---|---|---|---|
| 1 | Traditional Energy | XLE | 53.9 | 20% | +18.44% | FCG +12.1% · XOP +13.6% |
| 2 | Nuclear Energy | URA | 48.6 | 20% | +0.94% | URNM +3.3% · NLR +2.5% |
| 3 | Industrial Metals | COPX | 43.5 | 10% | +0.38% | PICK +1.4% · REMX +1.0% |
| 4 | Precious Metals | GLD | 43.1 | 10% | -2.11% | SLV -5.5% · GDX -0.5% |
| 5 | Agriculture & Livestock | WEAT | 42.2 | 10% | -3.77% | VEGI +8.8% · MOO +7.8% |
| 6 | Defense & Aerospace | ITA | 28.6 | 10% | +16.14% | ROKT +9.6% · XAR +14.5% |
| 7 | Utilities & Infrastructure | PAVE | 27.2 | 10% | +10.77% | XLU +1.0% · IGF +3.7% |
| 8 | Technology | CIBR | 19.6 | 10% | +6.85% | XLK +7.2% · IGV +6.0% |
| 9 | AI | SMH | 12.2 | 0% | +2.10% | AIQ +2.2% · BOTZ +7.1% |
| 10 | Emerging Markets | INDA | 4.3 | 0% | +3.22% | ILF +1.3% · IEMG -3.1% |
Traditional Energy — XLE
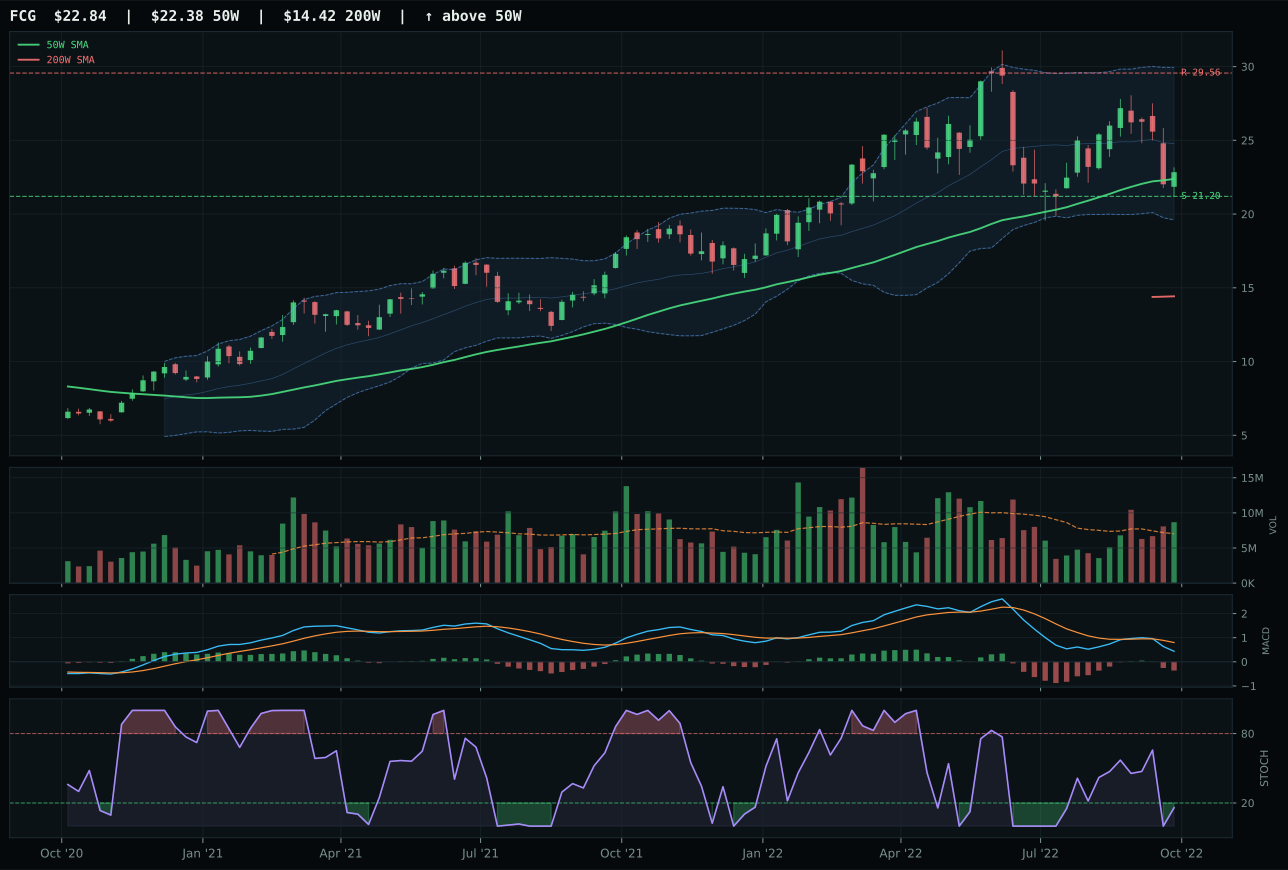
FCG has a compression near 50W profile with 9.8% 13-week relative strength versus SPY.
A failed hold above support would weaken the setup.
Actionable but governed by invalidation levels.
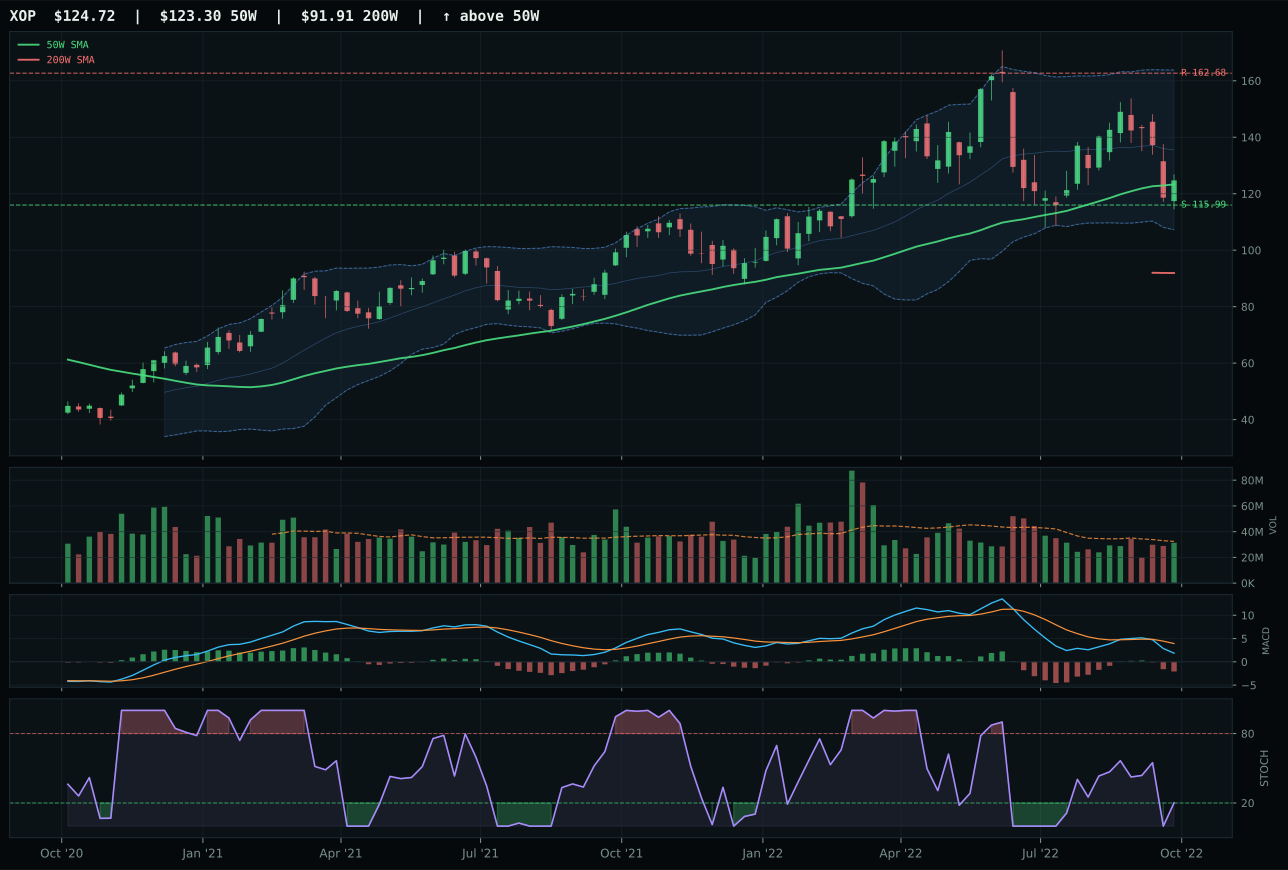
XOP has a compression near 50W profile with 9.5% 13-week relative strength versus SPY.
A failed hold above support would weaken the setup.
Actionable but governed by invalidation levels.
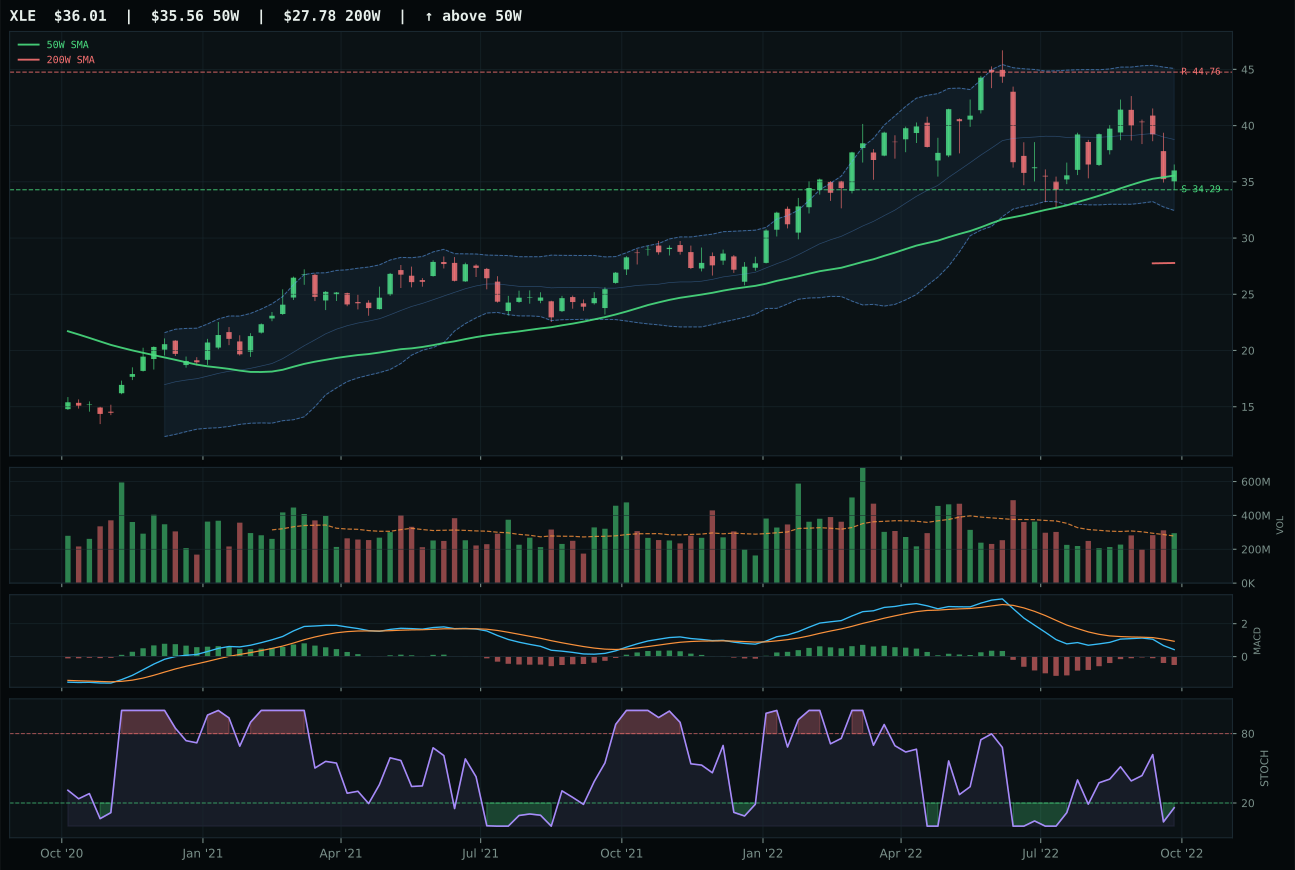
XLE has a compression near 50W profile with 5.5% 13-week relative strength versus SPY.
A failed hold above support would weaken the setup.
Actionable but governed by invalidation levels.
XLE wins top-2 positioning with a category score of 53.9, powered by exceptional trend (90.3) and timing (100.0) that align perfectly with Late-Cycle Reflation macro sponsorship. Price sits only 1.3% below the 50W in compression mode with a 0.4% positive slope, delivering exactly the setup that can break higher if support holds. RS versus SPY is +5.5%, strong enough to justify commitment without being extended, and the risk/reward is balanced at 83/19 (upside to resistance/downside to support). FCG boasts higher 13W return (+3.5%) and better category-relative strength (-0.3% vs -3.9%), but XLK's integrated cash-flow defense narrative and macro fit of 79.0/100 clinch the category win by offering durability alongside scarcity value. Momentum confirmation at 21.0/100 is weak, but in energy the allocator accepts flat near-term action if the setup is compressing and macro tailwind is active.
Traditional Energy earns 10% as a top-2 overweight, justified by the category's 53.9 score and 88.0/100 macro fit—the highest macro sponsorship in the portfolio this week. Energy scarcity (+16), inflation pressure (+10), real asset sponsorship (+7), and Late-Cycle Reflation support (+12) create a secular bid that overrides the soft momentum profile. XLE's compression setup near the 50W offers entry-level positioning ahead of potential upside, and the 5.5% RS versus SPY confirms that real money is re-establishing exposure. The 10% allocation reflects conviction that energy represents the cleanest real-asset play in the current regime, combining genuine scarcity value, cash return potential, and macro tailwind. Further conviction would require XLE to break above the 50W with volume confirmation and MACD recovery, but the current positioning is sized to ride the scarcity narrative without requiring additional technical improvement.
Nuclear Energy — URA
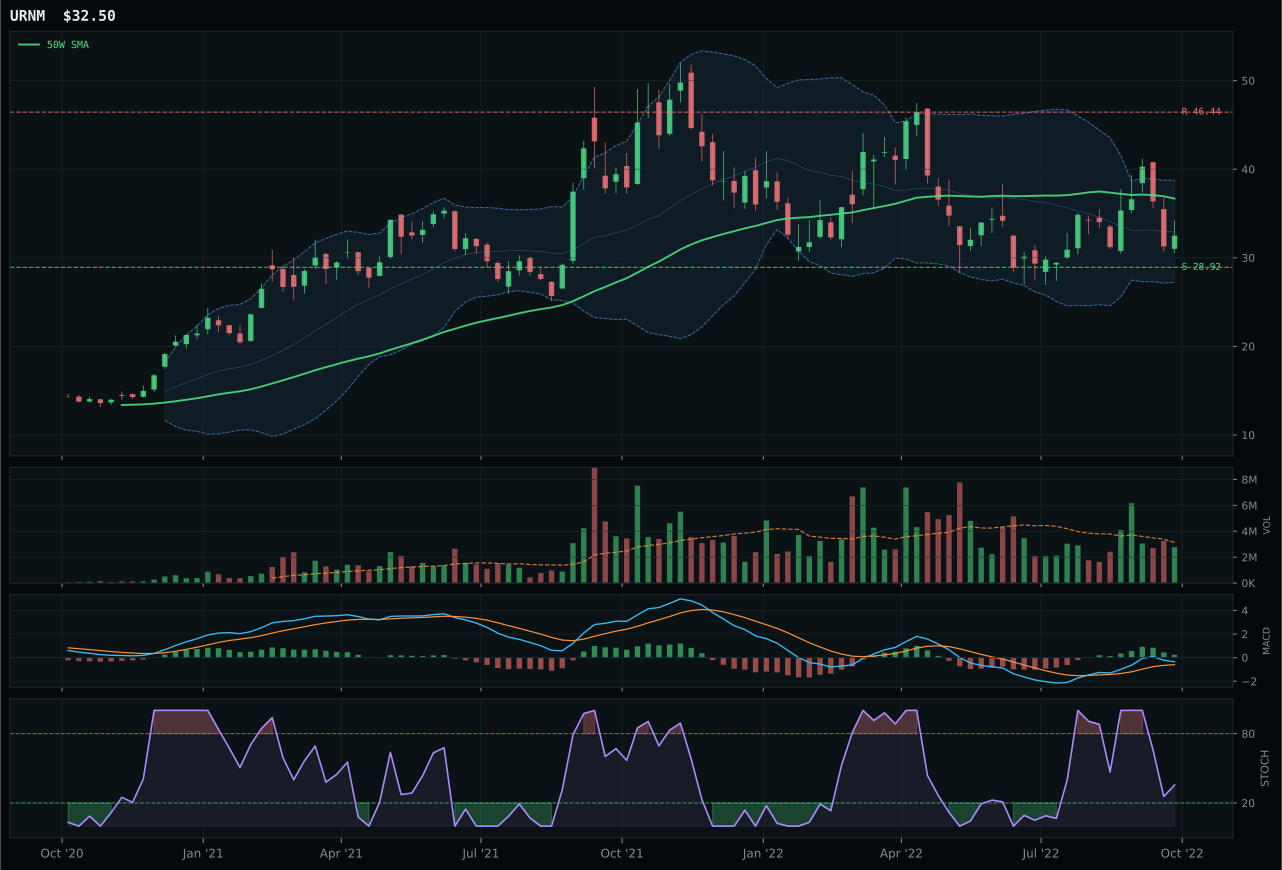
URNM has a neutral structure profile with 17.1% 13-week relative strength versus SPY.
A failed hold above support would weaken the setup.
Actionable but governed by invalidation levels.
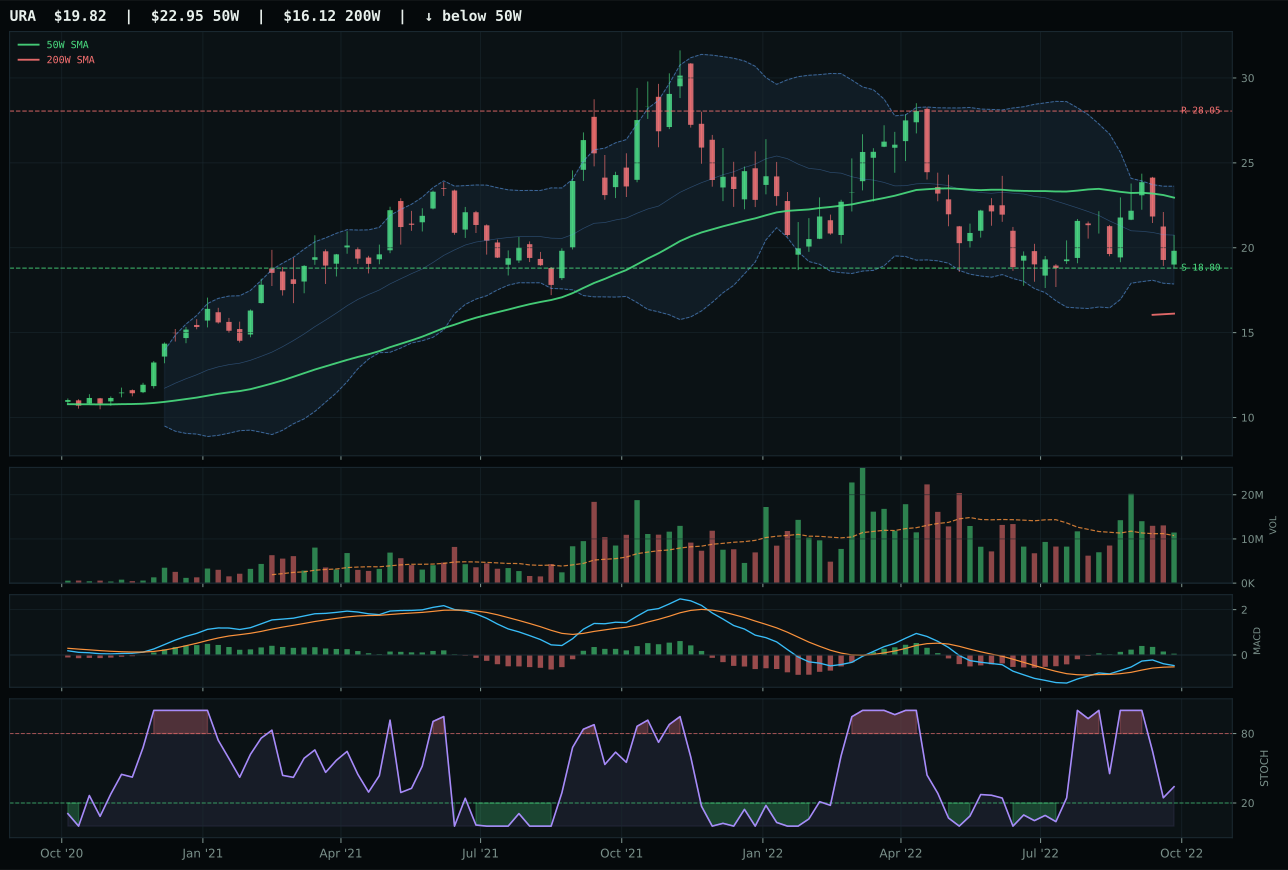
URA has a neutral structure profile with 10.5% 13-week relative strength versus SPY.
A failed hold above support would weaken the setup.
Actionable but governed by invalidation levels.
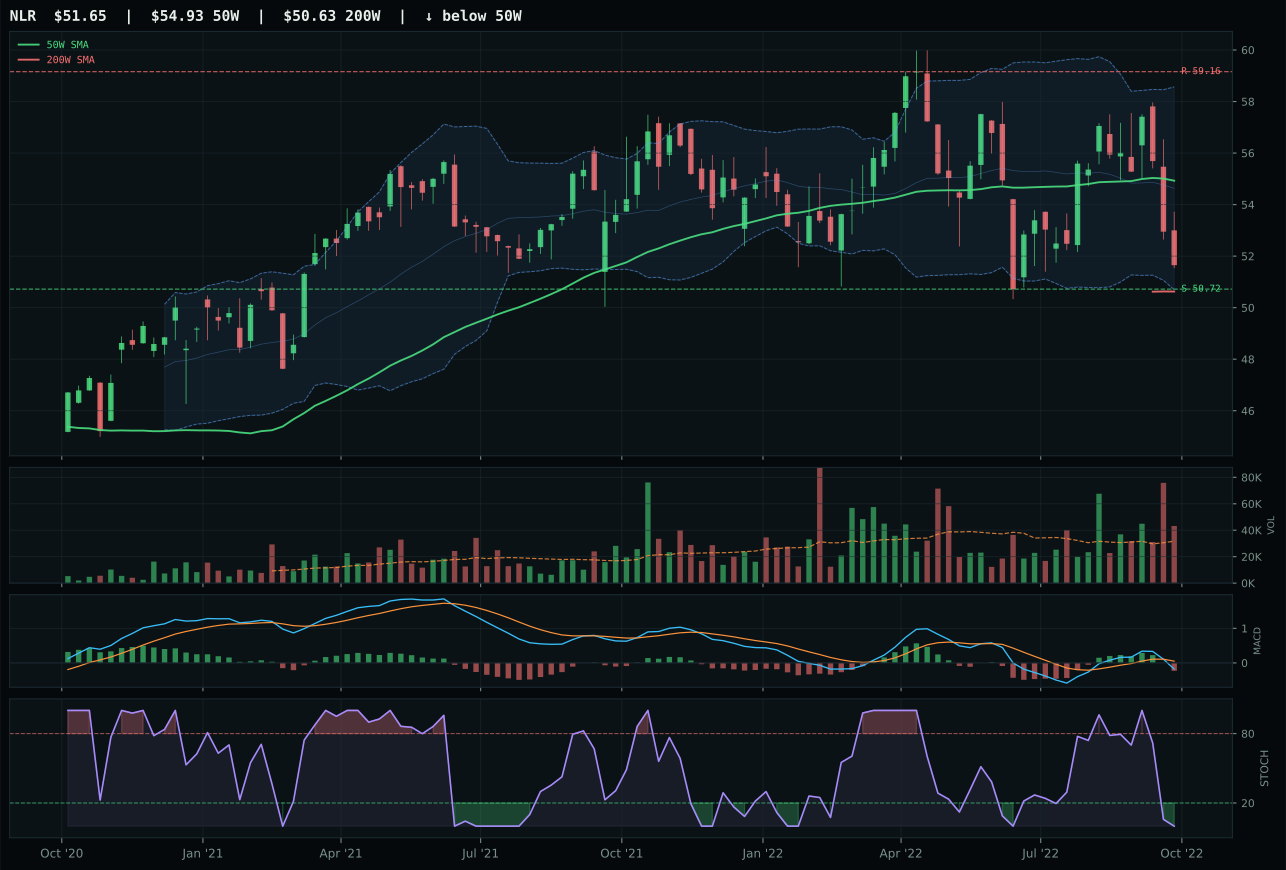
NLR has a pullback into support profile with 3.1% 13-week relative strength versus SPY.
A failed hold above support would weaken the setup.
Tracked, but not top-2 eligible because: .
URA wins top-2 positioning despite trailing URNM in technical evidence (53.2 vs 57.9), with the decisive factor being cleaner structure and lower risk asymmetry in a macro regime that favors both names equally. Both are neutral-structure pullbacks with bullish but flattening MACD and falling/neutral stochastic RSI, but URA's 66.7/100 structure score beats URNM's 62.7, and its risk/reward is slightly tighter (75 vs 73.7). URNM boasts 17.1% RS versus SPY and a +10.8% 13W return that outpace URA's +10.5% and +4.2%, but the allocator accepts URA's more cautious momentum profile because the chart is cleaner and the positioning is lower-leverage. At 13.6% below the 50W with support at 18.80, URA offers disciplined entry into energy scarcity without URNM's extended risk profile.
Nuclear Energy earns 10% as a top-2 overweight, sharing top-tier status with Traditional Energy based on a 48.6 category score and 69.0/100 macro fit powered by energy scarcity (+9), real asset sponsorship (+7), and Late-Cycle Reflation support (+7). URA's neutral-structure setup and positive 13W momentum (+4.2%) position the category as a genuine structural beneficiary of energy transition narratives and inflation persistence. The 10% allocation reflects conviction that nuclear and uranium supply constraints merit overweight sizing alongside traditional energy, offering diversification within the energy scarcity thesis. URNM's higher momentum could justify eventual rotation, but URA's cleaner structure and lower risk currently offers better entry-level positioning. For the category to expand beyond 10%, either URA would need a confirmed break above its 50W at 21.73, or macro signals would need to shift further toward real asset sponsorship and inflation persistence.
Industrial Metals — COPX
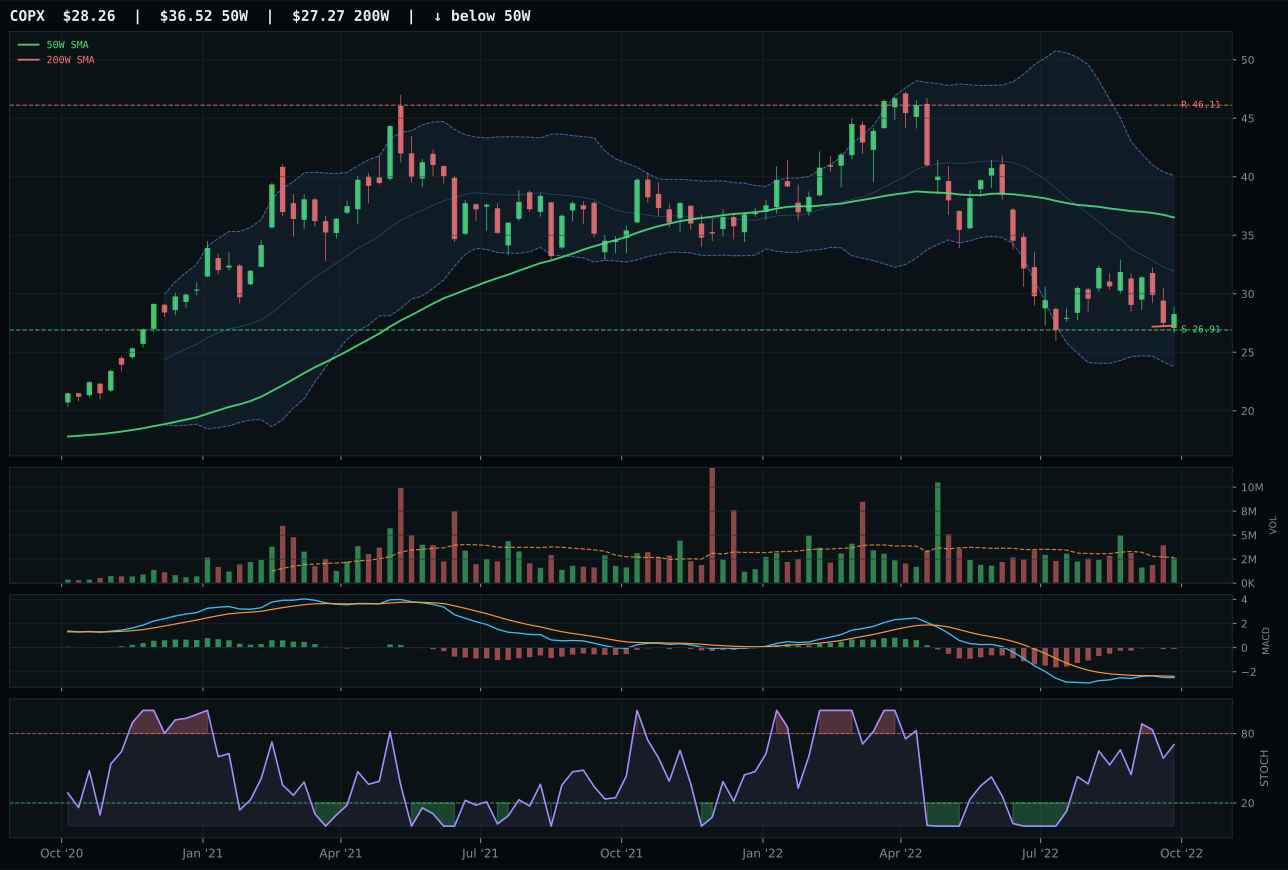
COPX has a neutral structure profile with 1.2% 13-week relative strength versus SPY.
A failed hold above support would weaken the setup.
Actionable but governed by invalidation levels.
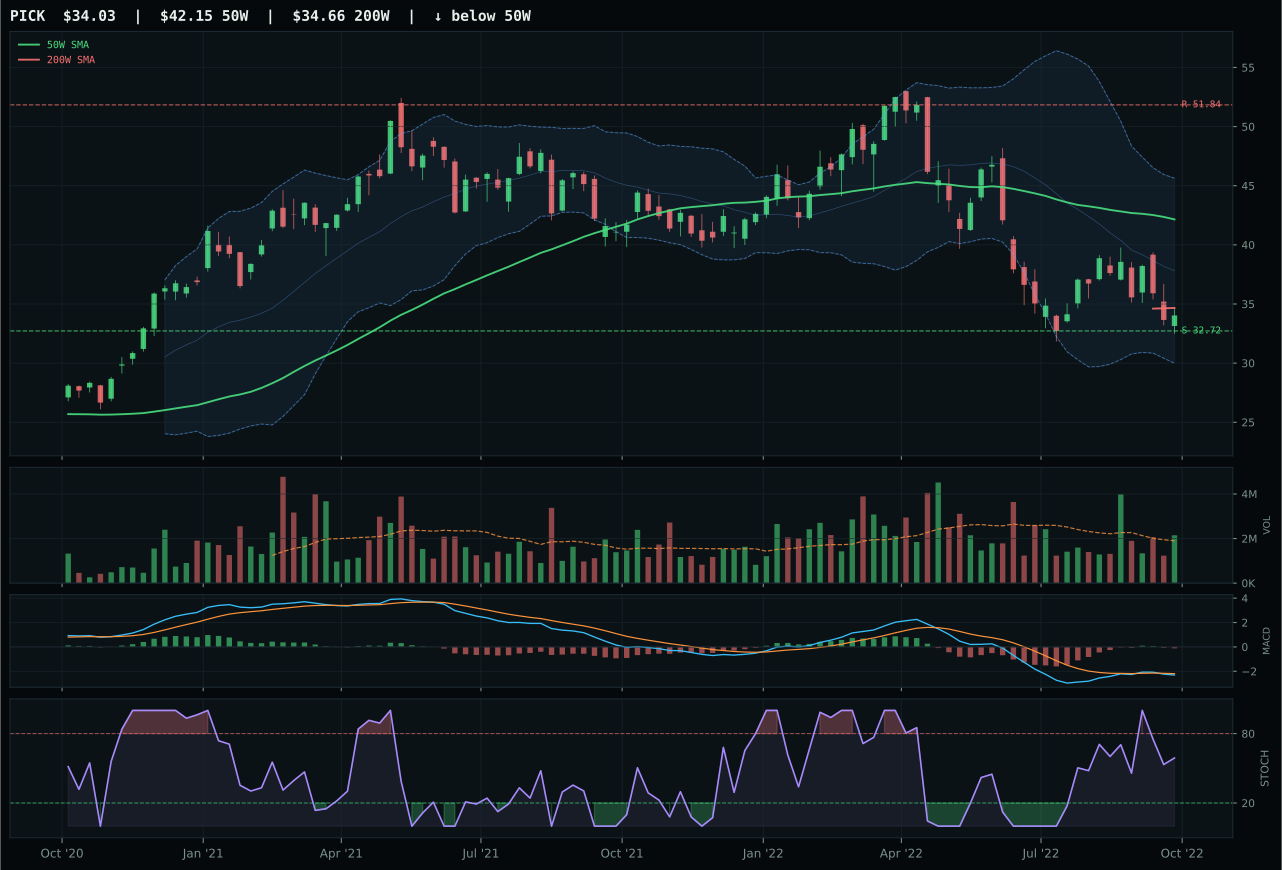
PICK has a pullback into support profile with 3.5% 13-week relative strength versus SPY.
A failed hold above support would weaken the setup.
Actionable but governed by invalidation levels.
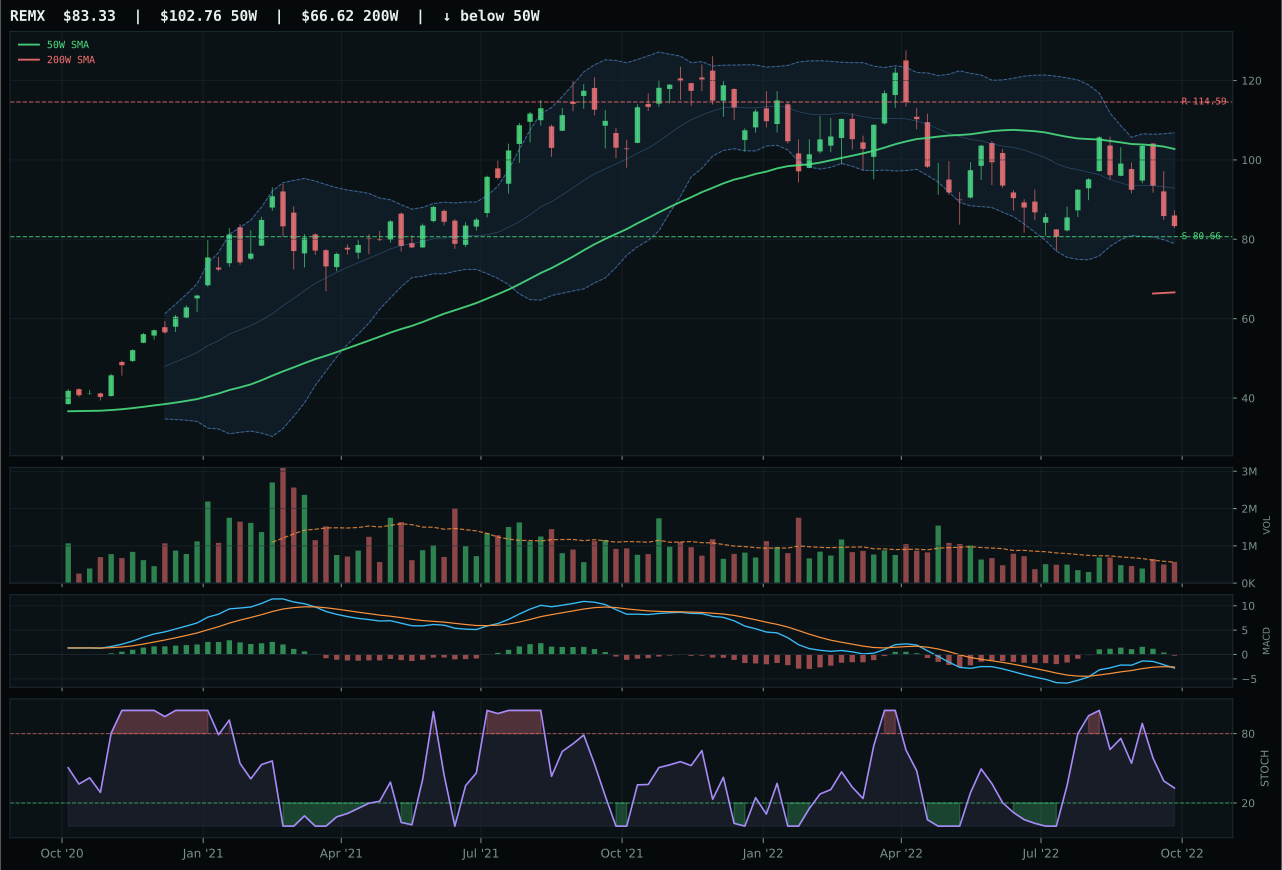
REMX has a pullback into support profile with 2.3% 13-week relative strength versus SPY.
A failed hold above support would weaken the setup.
Actionable but governed by invalidation levels.
COPX wins by 0.8 points over PICK in a near-identical matchup, with the decisive factor being trend composition and macro fit alignment. Both are neutral-structure pullbacks into support with nearly identical risk/reward (75 each) and timing scores near 55-60, but COPX's 59.8/100 trend score edges PICK's 42 through better 50W slope (-0.6% vs implied weaker slope) and category-relative strength. COPX's 49.0/100 macro fit reflects metals scarcity sponsorship (+12), partially offset by liquidity stress and dollar headwinds, while PICK's 51.0 reflects the same factors but with copper-focused narrative bias. The margin is hair-thin—this is a category decision driven by COPX's slight technical superiority in trend relative to a macro regime that favors both copper scarcity and mining breadth equally.
Industrial Metals earns 5% allocation as a tier-2 positioning, placed below XLE and URA despite a respectable 43.5 category score. The 65.0/100 macro fit is strong, driven by Late-Cycle Reflation support (+10), metals scarcity (+14), and real asset sponsorship (+6), offset by liquidity stress and dollar pressure headwinds. COPX and PICK are both viable expressions of the scarcity narrative—copper supply constraints and mining breadth—but the technical picture is soft across the basket. COPX sits 22.6% below the 50W with MACD only now beginning to improve, signaling early accumulation rather than confirmed uptrend. To earn 10%, the category would need either a confirmed breakout above the 50W with volume participation, or a material acceleration in real asset flow that pulls MACD firmly into bullish territory. Current positioning reflects the macro thesis without overcommitting to technicals that remain in repair mode.
Precious Metals — GLD
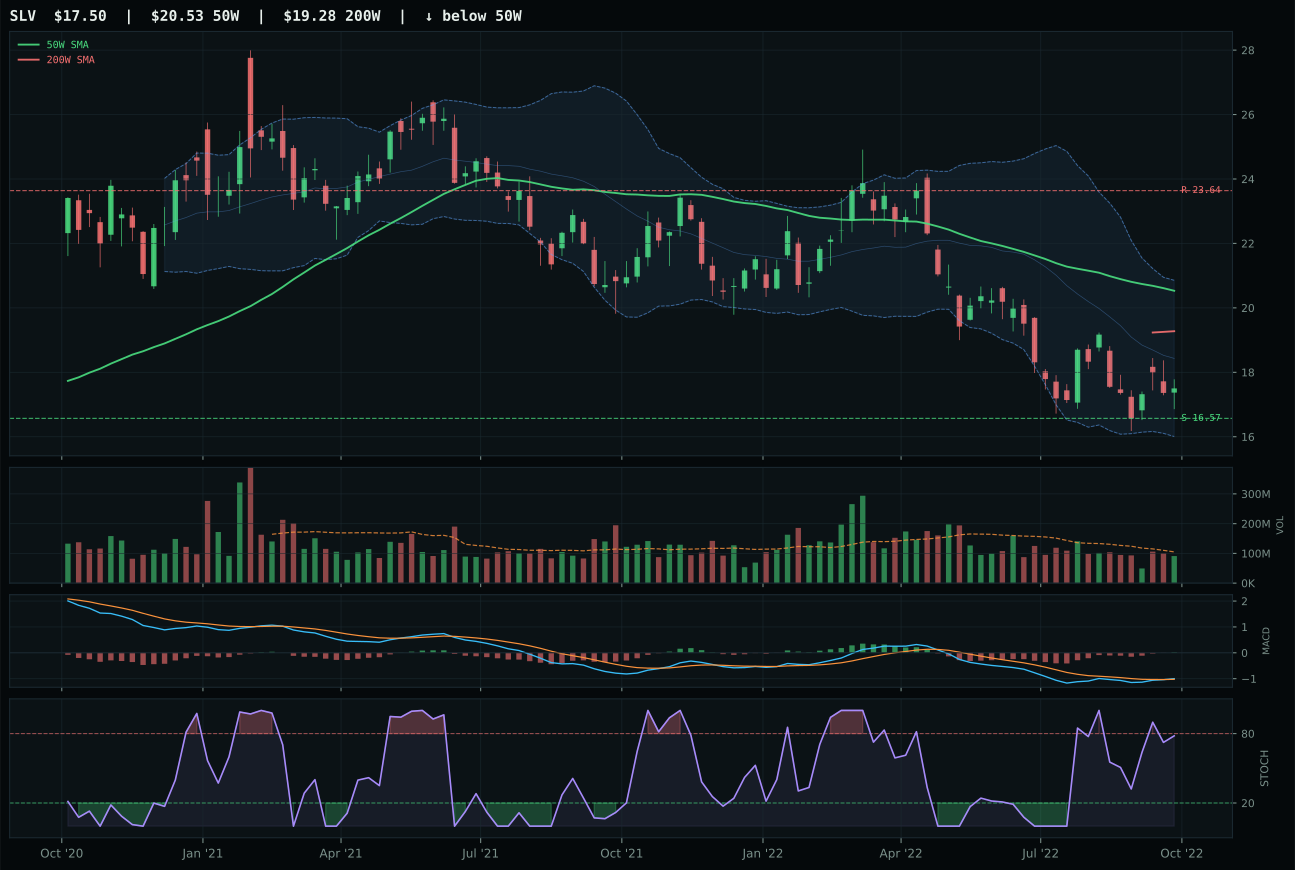
SLV has a neutral structure profile with 1.9% 13-week relative strength versus SPY.
A failed hold above support would weaken the setup.
Actionable but governed by invalidation levels.
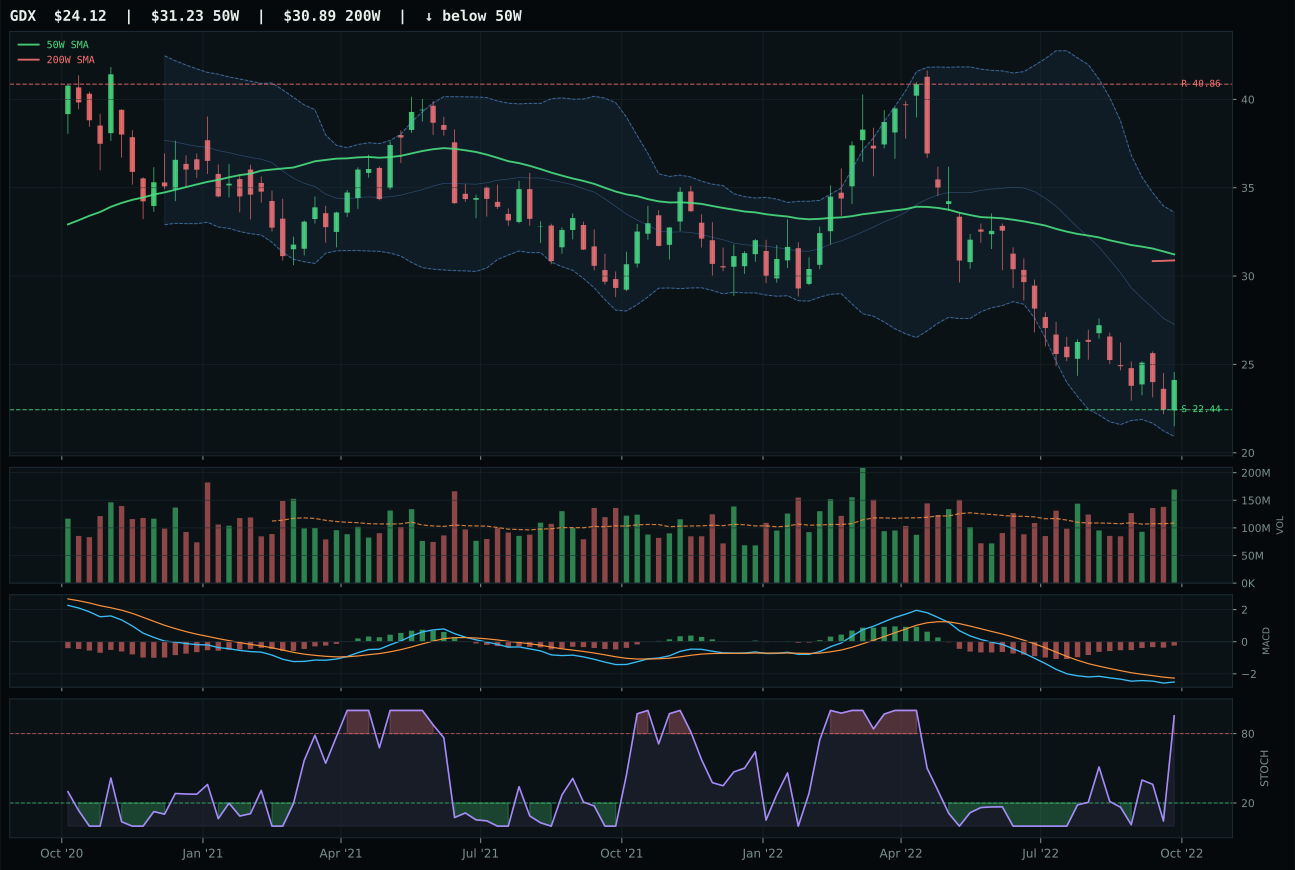
GDX has a neutral structure profile with -8.0% 13-week relative strength versus SPY.
A failed hold above support would weaken the setup.
Actionable but governed by invalidation levels.
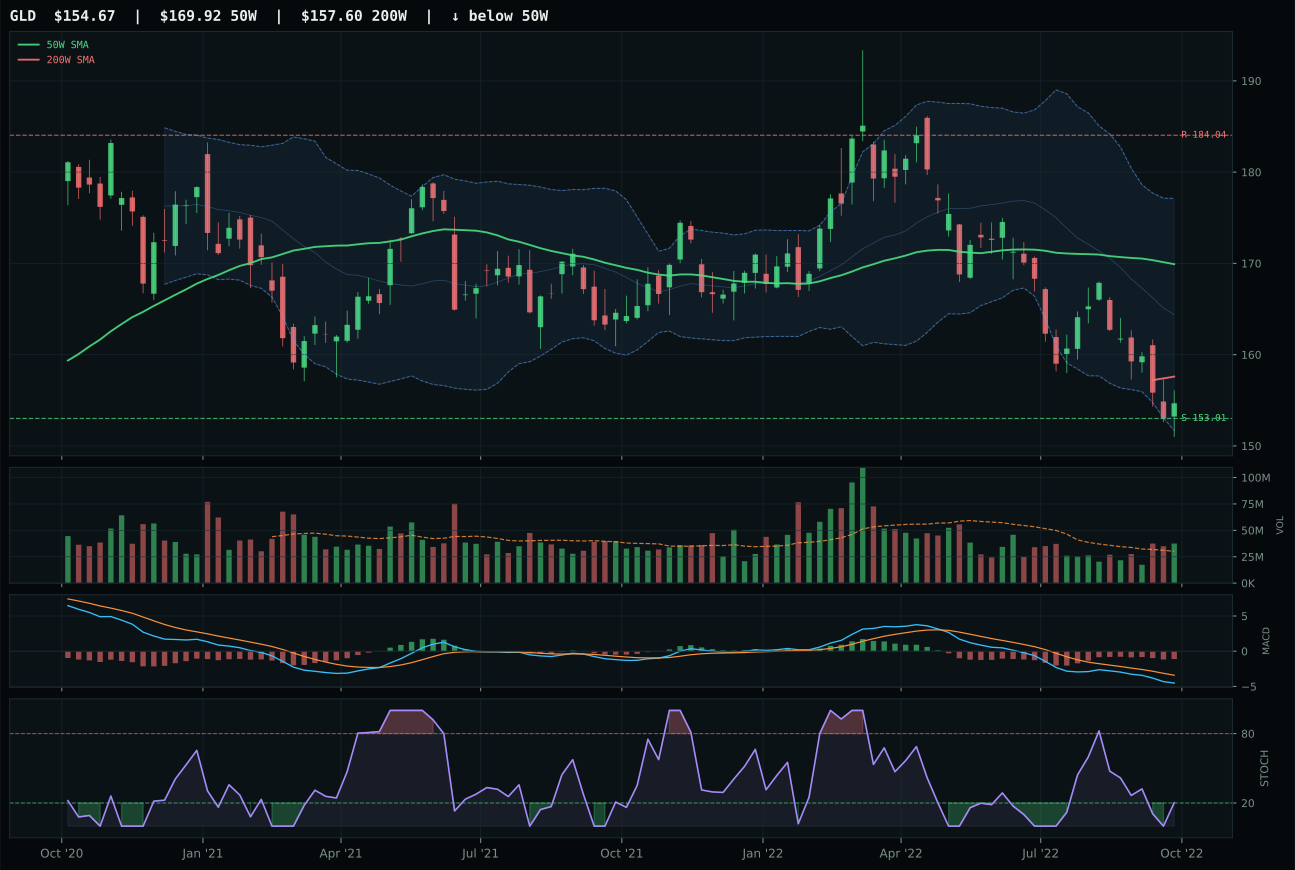
GLD has a pullback into support profile with -1.8% 13-week relative strength versus SPY.
A failed hold above support would weaken the setup.
Actionable but governed by invalidation levels.
GLD wins the category despite trailing SLV in technical evidence (32.6 vs 74.6) because macro sponsorship overrides momentum entirely. The gold narrative carries 72.0/100 macro fit driven by monetary hedge bid (+14), defensive rotation (+6), and dollar pressure (+2)—a profile that commands positioning regardless of whether the chart is moving. SLV boasts superior trend, bullish and improving MACD, and rising mid-zone stochastic RSI, all technically superior to GLD's bearish/weakening setup. Yet SLV's timing score is 17 points lower (63 vs 80), its structure is less clean, and its volume confirmation is neutral rather than above-average. In a monetary hedge regime, the allocator accepts GLD's 9.0% pullback to support near 153 and above-average volume participation as evidence that real money is stacking ahead of further policy stress.
Precious Metals earns 5% allocation as a tier-2 defensive sleeve, with the 43.1 category score placing it solidly in mid-tier rank. The 74.0/100 macro fit is robust, powered by monetary hedge bid, defensive rotation, and a nascent dollar pressure signal that favors hard assets. GLD's positioning as the clean monetary hedge provides ballast against further liquidity stress and inflation persistence, even as the technical picture remains broken. To move to 10%, the category would need either SLV to overtake GLD on a technical basis while maintaining macro fit, or GLD's chart to confirm a meaningful floor and accumulation pattern—neither present today. The 5% slot acknowledges that gold is earning real macro sponsorship in Late-Cycle Reflation, but the technical evidence is not compelling enough to justify overweight sizing relative to energy and nuclear, which combine superior technicals with equally strong macro narratives.
Agriculture & Livestock — WEAT
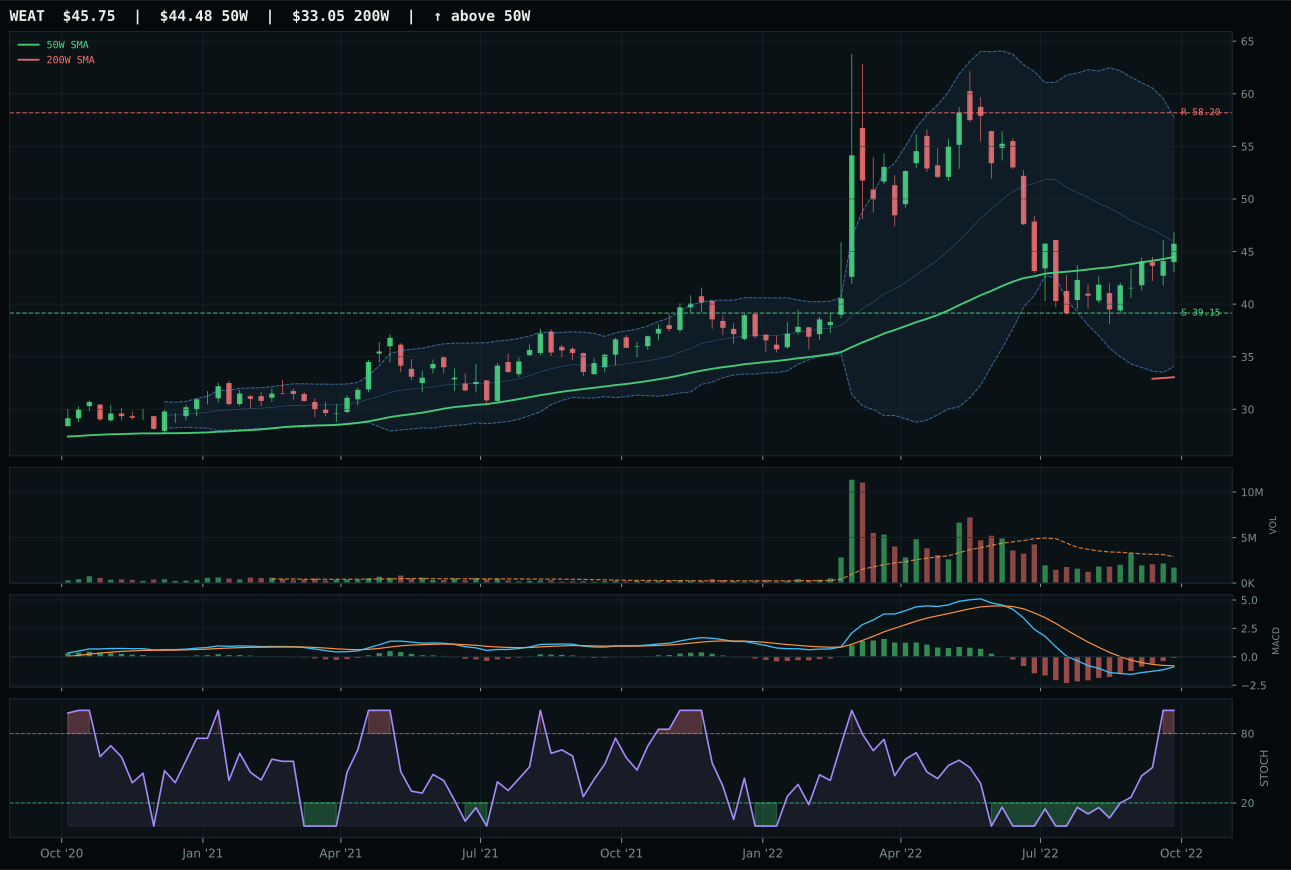
WEAT has a compression near 50W profile with 12.3% 13-week relative strength versus SPY.
A failed hold above support would weaken the setup.
Actionable but governed by invalidation levels.
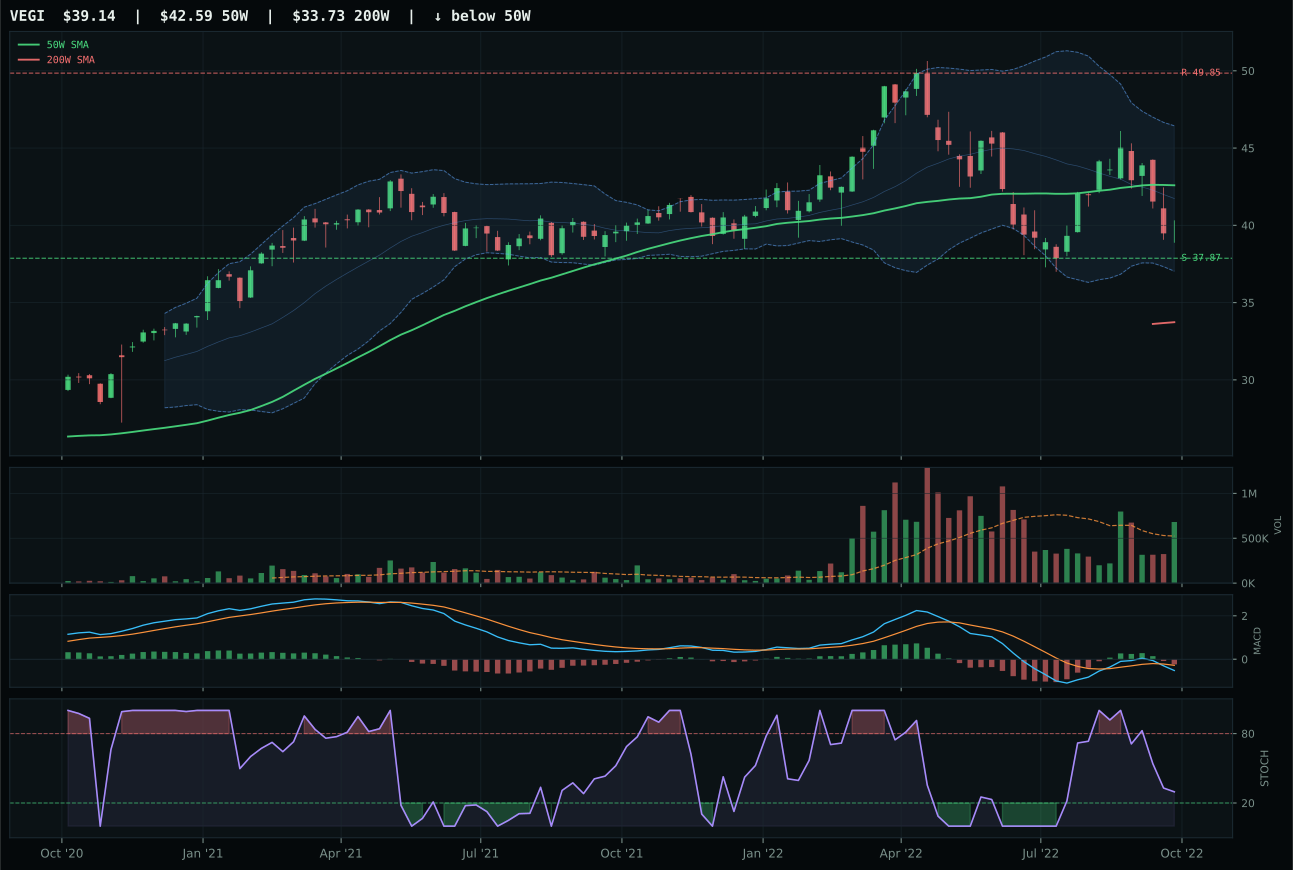
VEGI has a pullback into support profile with 6.2% 13-week relative strength versus SPY.
A failed hold above support would weaken the setup.
Actionable but governed by invalidation levels.
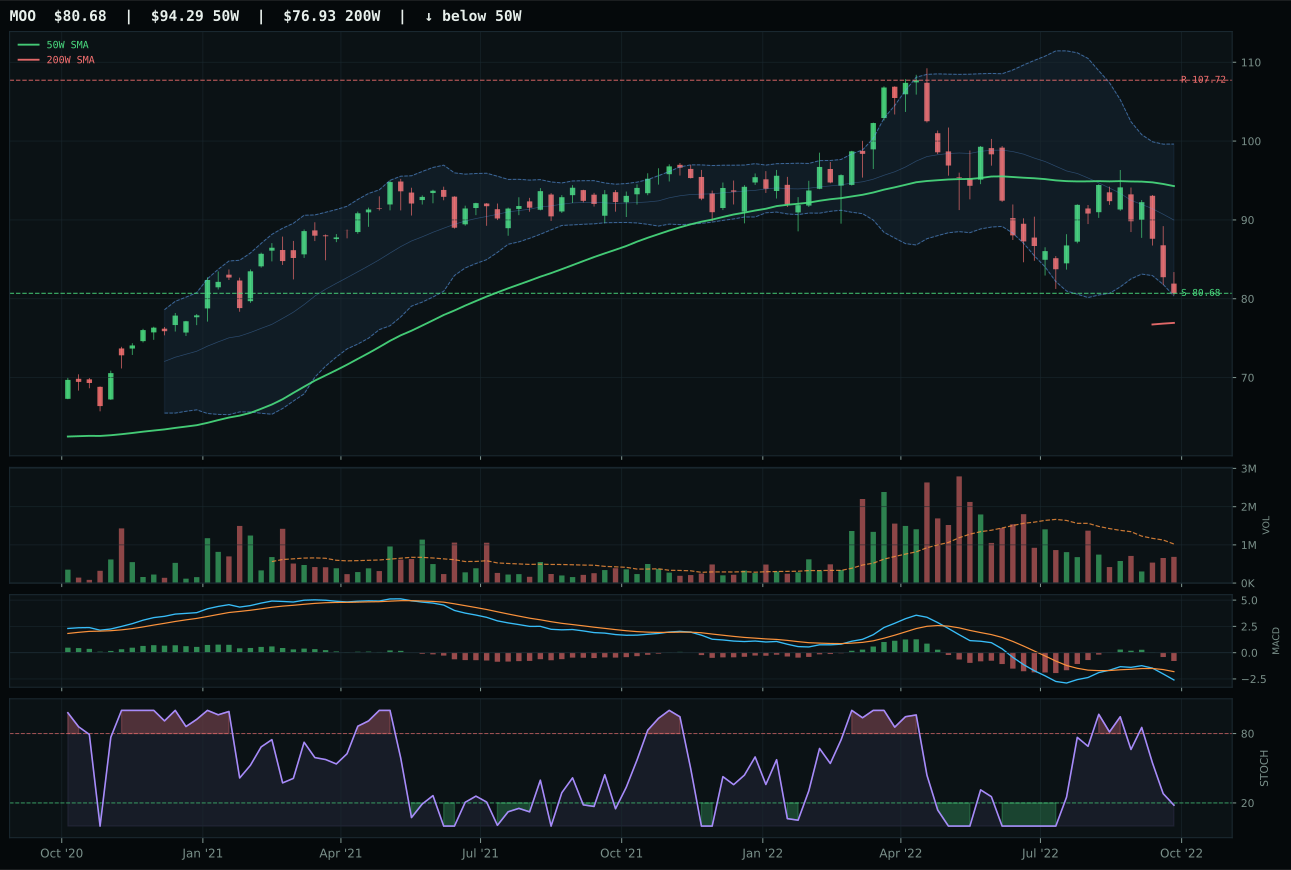
MOO has a pullback into support profile with -0.6% 13-week relative strength versus SPY.
A failed hold above support would weaken the setup.
Actionable but governed by invalidation levels.
WEAT dominates with a composite score of 92 across the technical dimension, crushing VEGI's 58 and MOO's 29 through a rare confluence of upside trend, positive momentum, and macro tailwind all firing together. Price sits only 2.8% below the 50W in compression mode with a 0.4% positive slope, 13W return of +6.0%, and RS versus SPY at +12.3%—a profile that screams the category is being accumulated rather than sold. The stochastic RSI is overbought momentum, not oversold washout, and MACD is bearish but improving, signaling a potential inflection. Thin participation at 0.59x volume suggests early institutional movement rather than crowded retail, and the Fib zone near 0.618 (value territory) provides technical justification for real-asset buyers to average down into inflation hedges.
Agriculture earns 5% allocation as a tier-2 holding despite WEAT's exceptional 77.1/100 technical score because the category score of 42.2 places it behind the two top-2 entries. The 72.0/100 macro fit reflects Late-Cycle Reflation's support (+8), active inflation pressure (+10), and real asset sponsorship (+8), offering genuine macro tailwind. What prevents a 10% position is the category's internal composition: VEGI and MOO lag by wide margins, and WEAT's thin volume creates positioning risk if real-asset flows reverse suddenly. The allocation works as a genuine inflation hedge and commodity carry, but upside is capped at resistance near 58.20 (-21.4% upside risk/reward) and downside has 16.9% support—an asymmetry that justifies tactical sizing rather than heavyweight overweight.
Defense & Aerospace — ITA
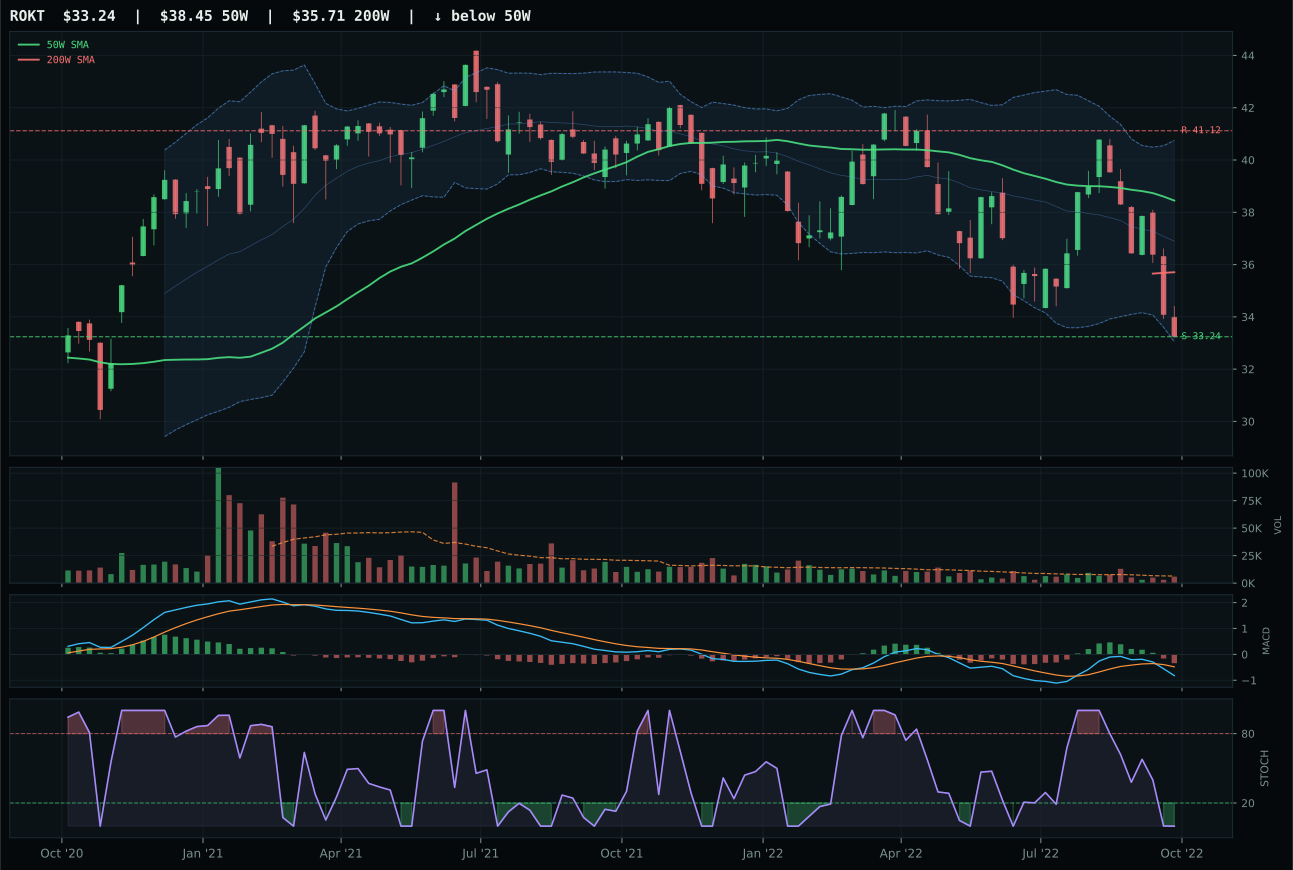
ROKT has a pullback into support profile with -0.2% 13-week relative strength versus SPY.
A failed hold above support would weaken the setup.
Tracked, but not top-2 eligible because: .
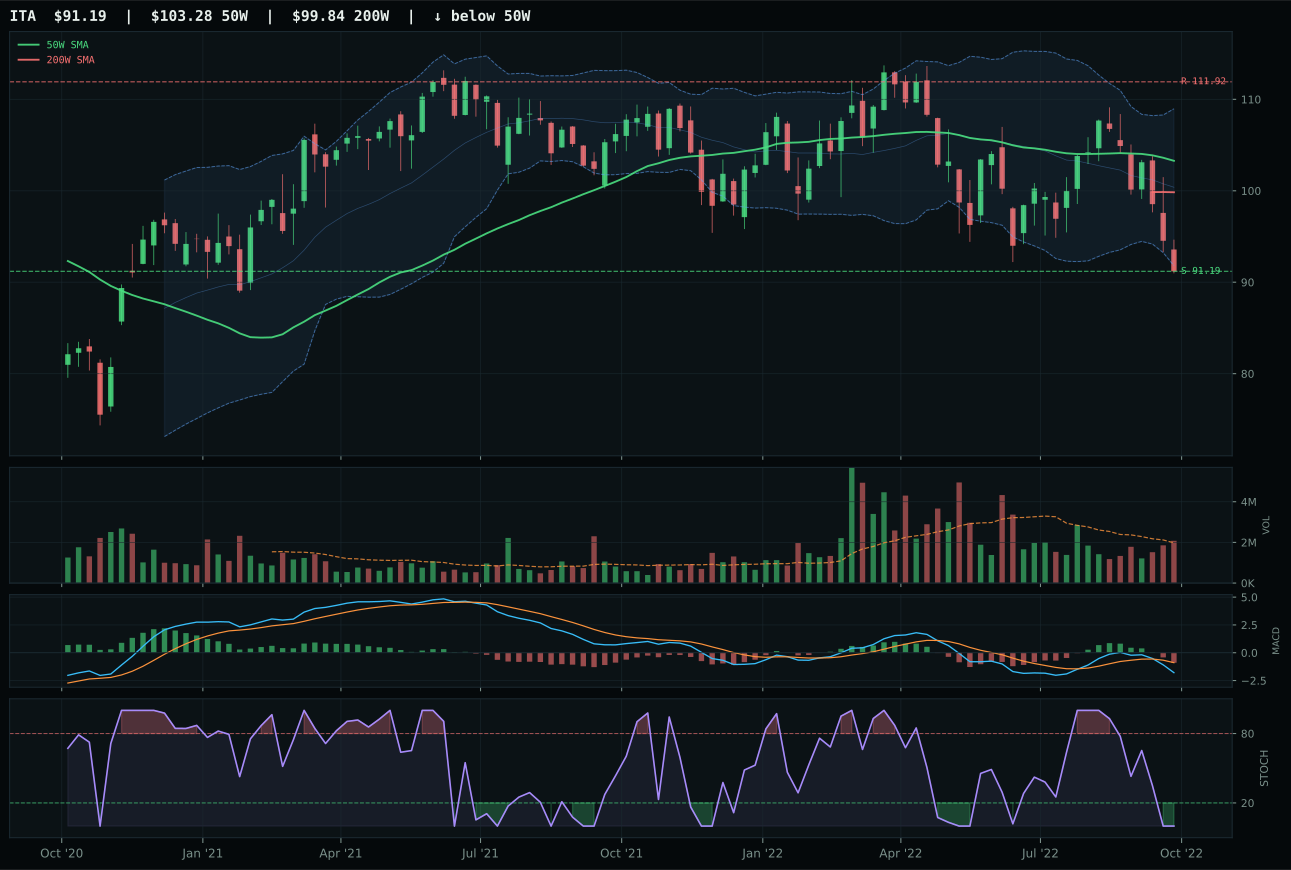
ITA has a pullback into support profile with -2.7% 13-week relative strength versus SPY.
A failed hold above support would weaken the setup.
Actionable but governed by invalidation levels.
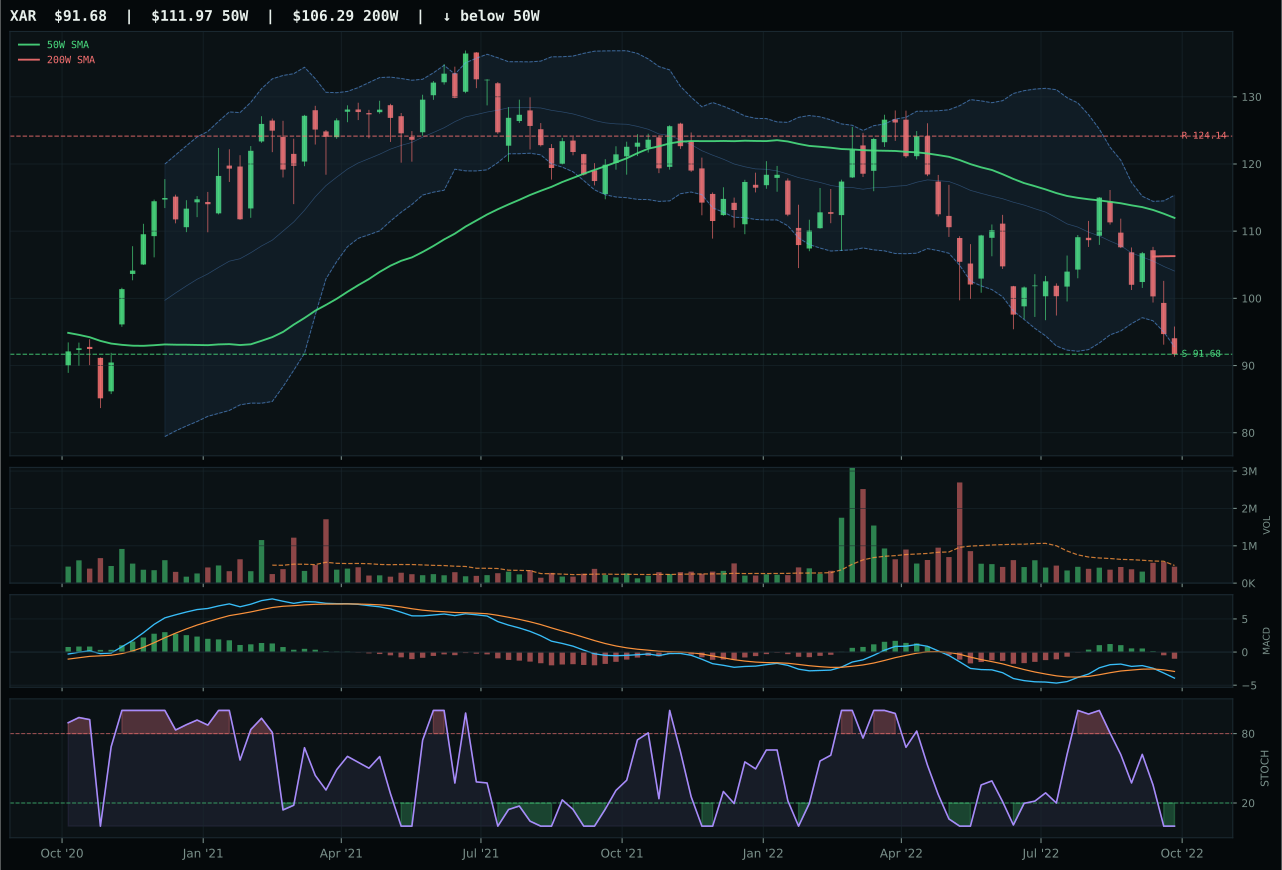
XAR has a pullback into support profile with -3.7% 13-week relative strength versus SPY.
A failed hold above support would weaken the setup.
Actionable but governed by invalidation levels.
ITA wins despite having the weakest trend score in the basket (22.9 vs ROKT's 37) because its macro narrative overwhelms technical fragility. The defense-prime theme carries 63.0/100 macro fit—nearly double the technical evidence score of 23.9—powered by active defensive rotation (+7), broad market bear (+6), and dollar pressure (+3). ROKT boasts better trend and relative strength in a vacuum, but ITA's setup is structurally superior (67.7 vs ROKT's neutral structure), and the timing score is identical at 60. In late-cycle reflation, macro sponsorship for durability overcomes speed; the allocator accepts ITA's -11.7% pullback from the 50W and stochastic oversold compression because the chart at least holds above the 200W and the narrative is being actively bought by liability-matching and geopolitical hedging flows.
Defense & Aerospace earns 5% as a tier-2 holding despite its 28.6 category score being respectable relative to many peers, because the top-2 categories simply ranked higher. The 72.0/100 macro fit is the second-best in the portfolio this week, exceeded only by Traditional Energy's 88.0, and the defensive rotation signal is flowing hard. What prevents ITA from moving to 10% is the absolute weakness in technical evidence: 23.9/100 trend and momentum confirmation at 7.2/100 are below average even for a defensive proxy. The setup works as a hedge against further broad market deterioration, but it offers no alpha or momentum participation if risk-on conditions return. ITA would need either a meaningful technical repair—MACD turning bullish, price reclaiming the 50W near 103—or a sharp spike in broad market bear signal to justify larger positioning.
Utilities & Infrastructure — PAVE
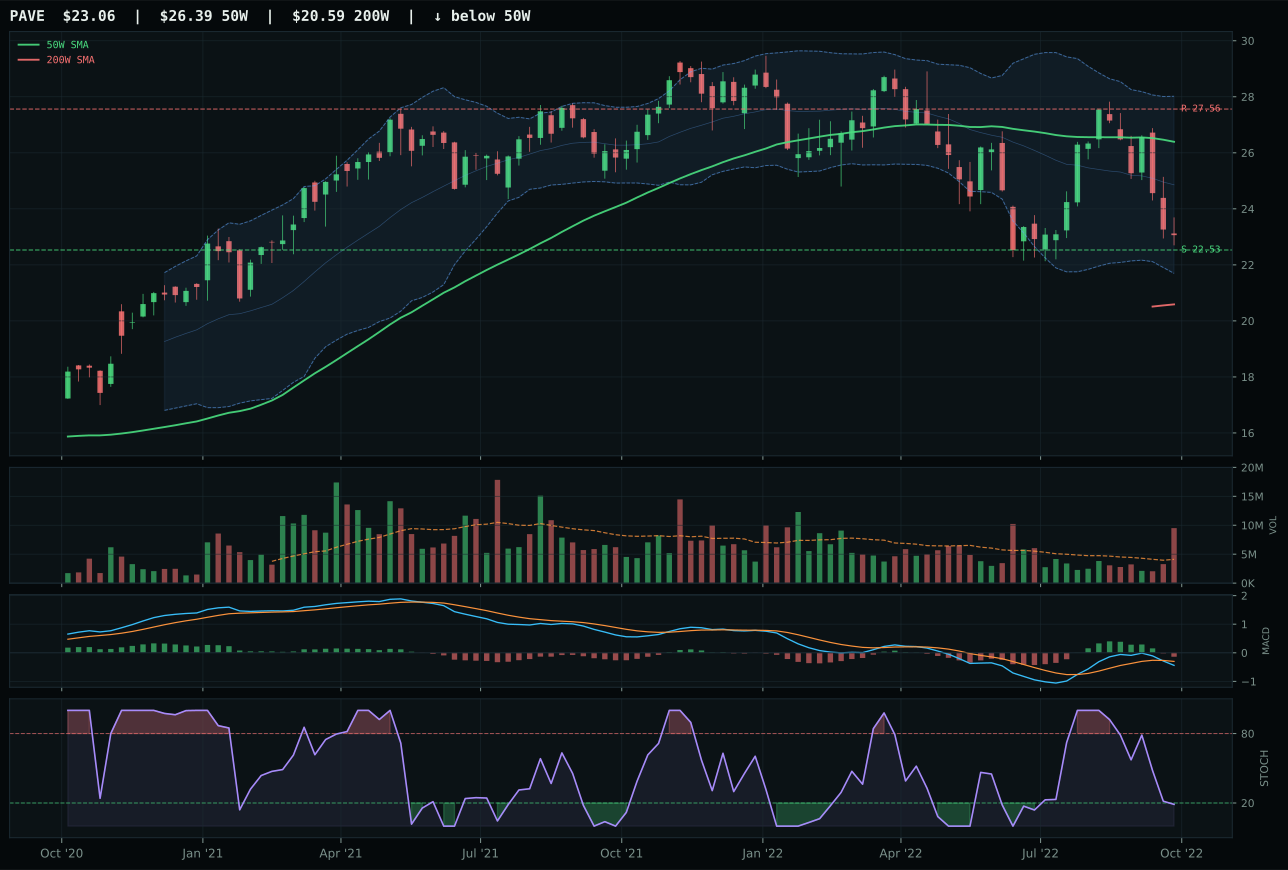
PAVE has a pullback into support profile with 6.9% 13-week relative strength versus SPY.
A failed hold above support would weaken the setup.
Actionable but governed by invalidation levels.
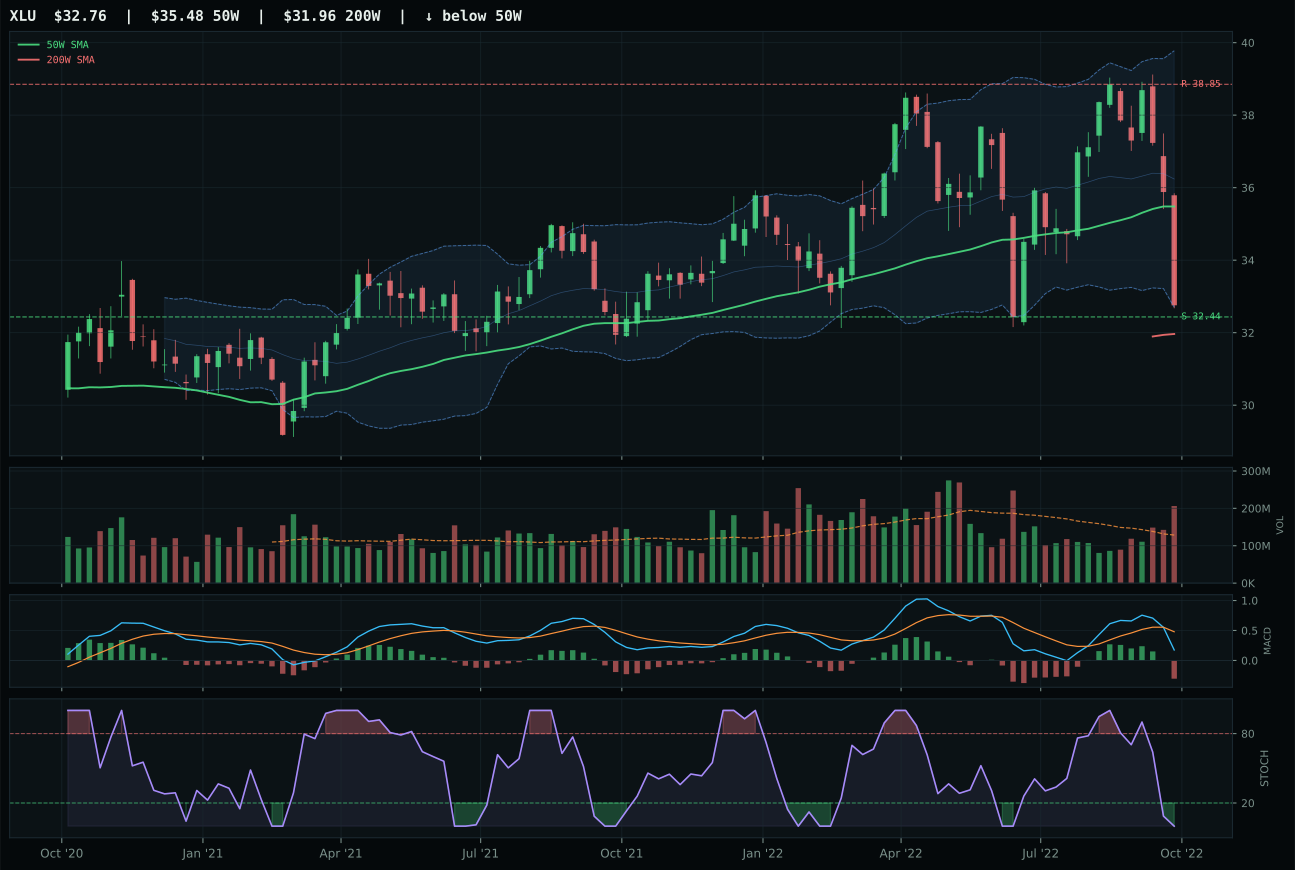
XLU has a pullback into support profile with -2.5% 13-week relative strength versus SPY.
A failed hold above support would weaken the setup.
Actionable but governed by invalidation levels.
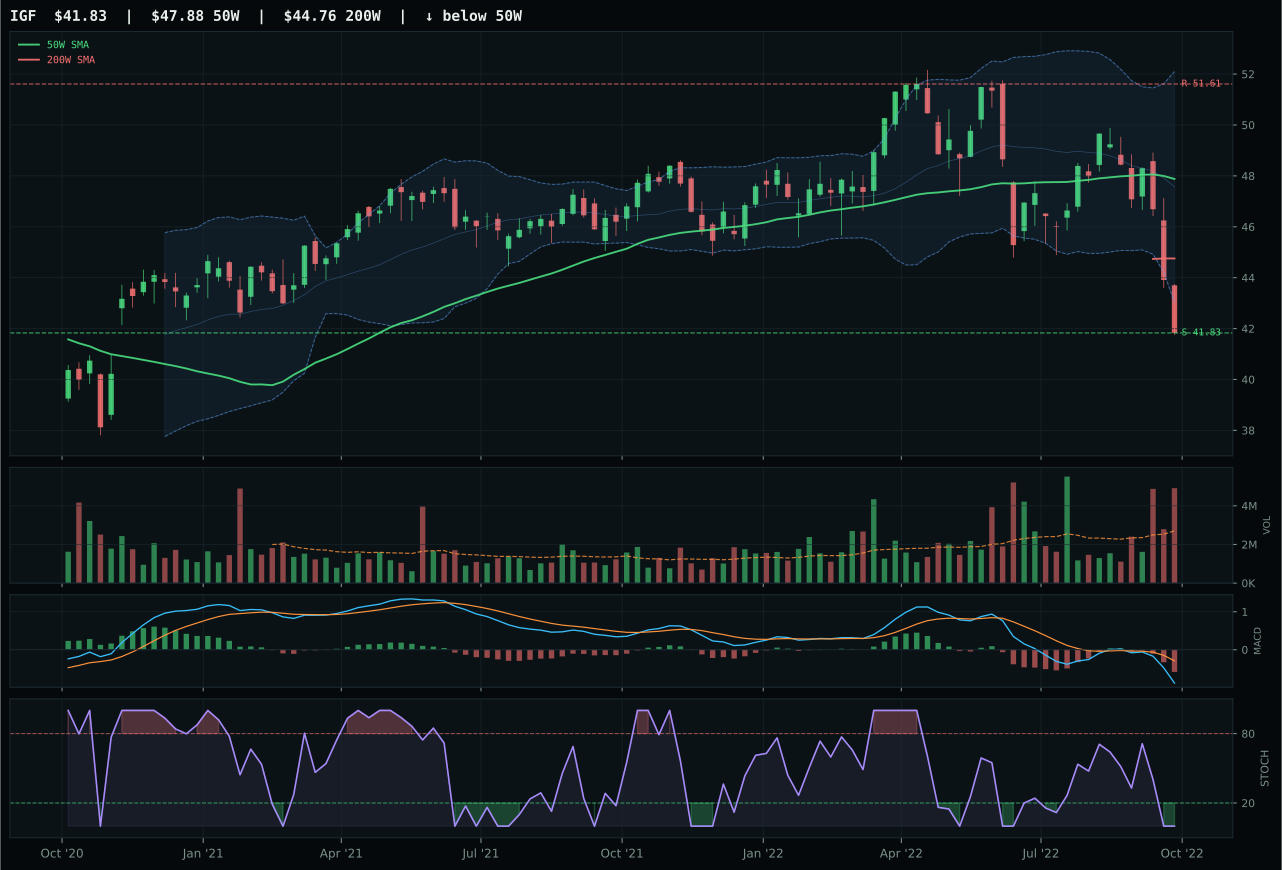
IGF has a pullback into support profile with -5.3% 13-week relative strength versus SPY.
A failed hold above support would weaken the setup.
Actionable but governed by invalidation levels.
PAVE wins the category with a composite score of 46, defeating XLU's 40 and IGF's 21 through superior category-relative strength (+9.4% vs XLU's 0.0%) despite identical pullback-into-support setups and oversold stochastic RSI readings. Both trade with distribution pressure at high multiples of 20W volume, signaling late-stage selling rather than accumulation, but PAVE's 6.9% RS versus SPY and +9.4% outperformance within the domestic infrastructure basket suggest real money is still rotating into infrastructure-capex narratives even as utilities tank. XLU's regulated-utility defense and 60.0/100 macro fit (driven by defensive rotation and broad market bear sponsorship) should win on narrative, but PAVE's +0.6% 13W return beats XLU's -8.8%, tipping the category decision toward capex beta over pure defensive utility exposure. This is a close call driven by PAVE's technical resilience in a macro regime that favors both defensiveness and infrastructure.
Utilities & Infrastructure earns 5% allocation as a tier-2 holding, reflecting its 27.2 category score and strong 61.0/100 macro fit driven by defensive rotation (+12) and broad market bear sponsorship (+4). PAVE's domestic infrastructure thesis offers exposure to capex-led stimulus and long-duration asset flows, even as the technical picture shows distribution pressure and oversold conditions. The allocation represents conviction in infrastructure allocation within a defensive sleeve, but does not justify overweight sizing due to weak absolute momentum (34.7/100 confirmation score) and volume-price rejection (distribution pressure at 2.32x). To earn 10%, the category would need either a confirmed transition from distribution to accumulation, or a break back above the 50W at 25.77 with sustained volume participation. Current 5% positioning acknowledges infrastructure as a defensive allocation play while respecting that near-term momentum and volume trends suggest caution against scaling further.
Technology — CIBR
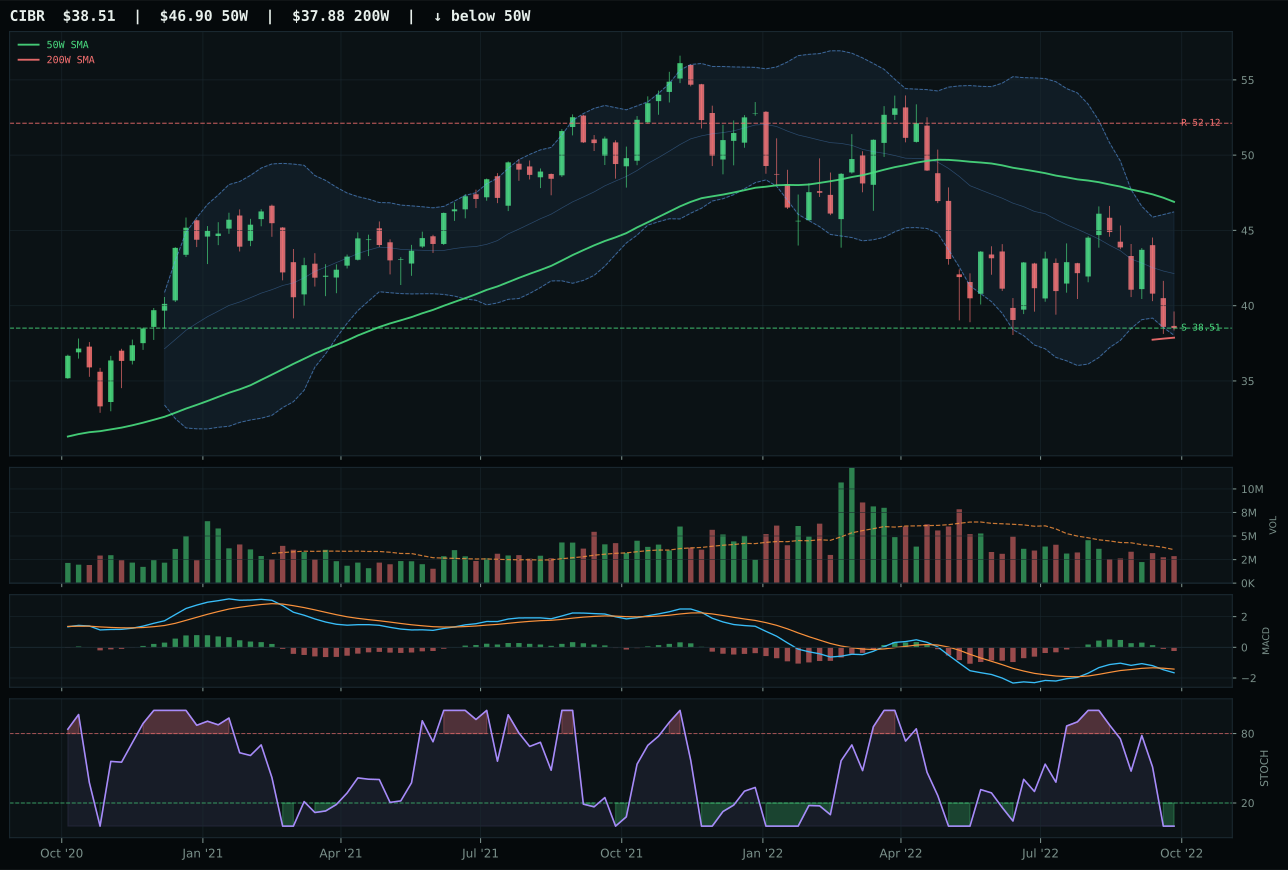
CIBR has a pullback into support profile with -0.1% 13-week relative strength versus SPY.
A failed hold above support would weaken the setup.
Actionable but governed by invalidation levels.
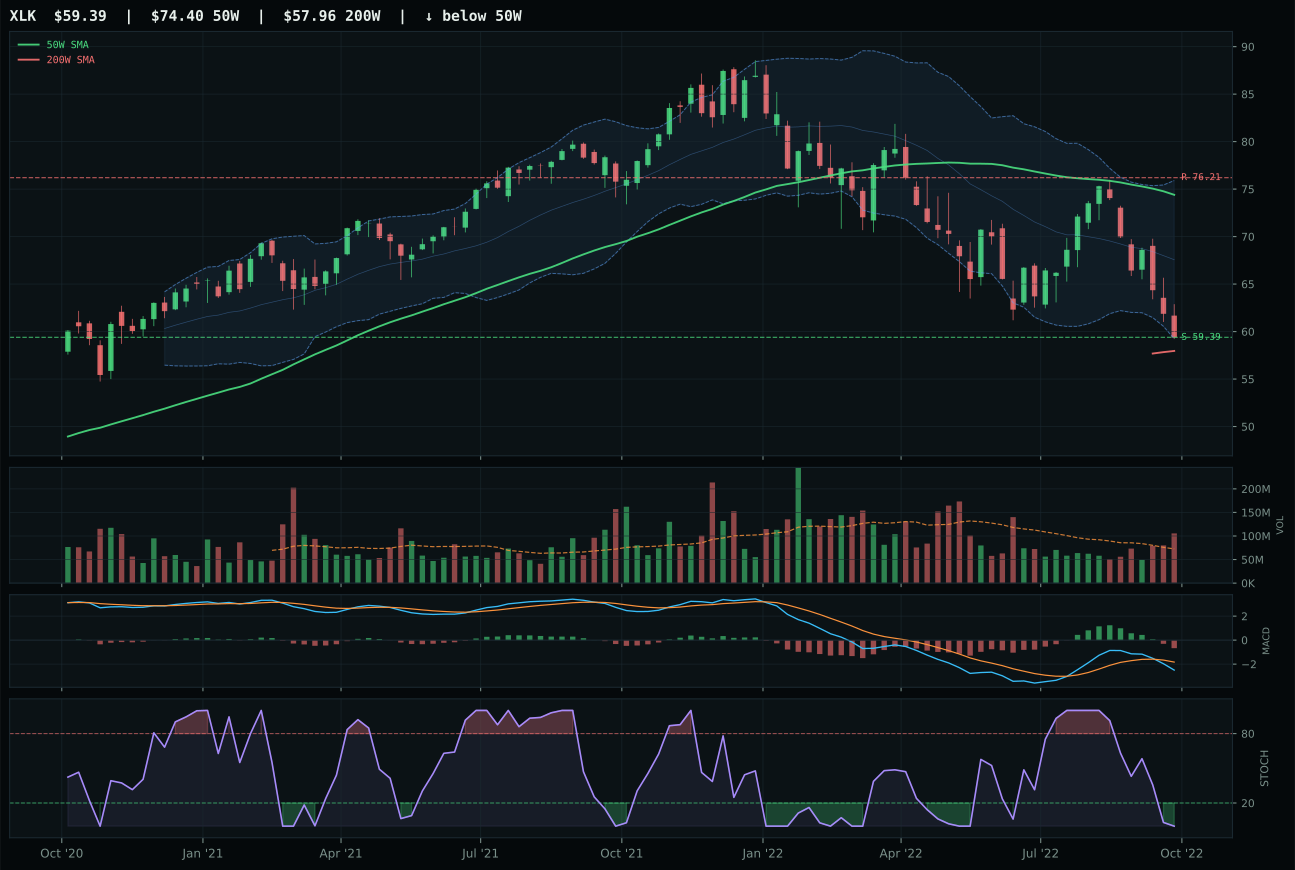
XLK has a pullback into support profile with -0.5% 13-week relative strength versus SPY.
A failed hold above support would weaken the setup.
Actionable but governed by invalidation levels.
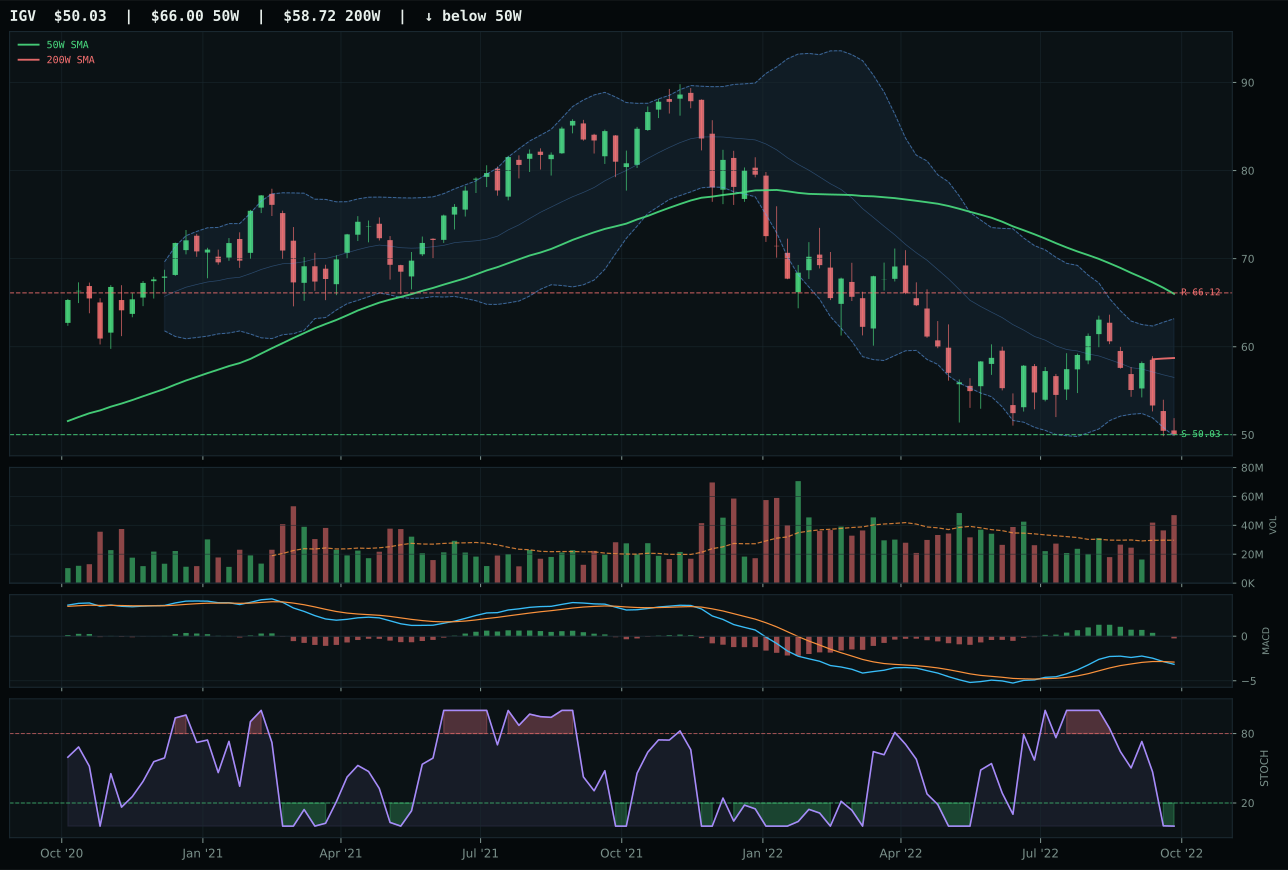
IGV has a pullback into support profile with -2.4% 13-week relative strength versus SPY.
A failed hold above support would weaken the setup.
Actionable but governed by invalidation levels.
CIBR wins the category by a razor-thin 0.1-point margin over XLK, a result that hinges entirely on relative strength inside the basket. Both trade below the 50W with identical pullback-into-support setups and oversold stochastic RSI, but CIBR's category-relative strength of 0.3% versus XLK's 0.0% tips the scales in a dead heat across trend, timing, and risk/reward. The decision underscores a critical dynamic in late-cycle bear markets: when absolute momentum is broken across a sector, the allocator leans on which name still has internal bid. XLK's broader profitable-tech exposure and above-average volume participation should theoretically help it, but neither factor can override CIBR's slight edge in who's still accumulating within the three-ETF cybersecurity universe.
Technology earns 5% allocation as a tier-2 holding, a position that reflects its rank below the two top-2 categories but above the 0% tier. The 31.0/100 macro fit score reveals why: liquidity stress, dollar pressure, and inflation pressure are all active headwinds that penalize growth narratives in equal measure whether they're broad or narrow. Cybersecurity as a defensive tech subtheme carries modestly better macro sponsorship than pure semiconductor or software plays, but not enough to overcome the category's structural collapse in late-cycle reflation. For CIBR to climb to top-2 tier next week, either the dollar needs to stabilize, liquidity conditions must materially improve, or the category score itself must break above 40—a jump that would require volume confirmation and MACD recovery, neither of which is visible today.
AI — SMH
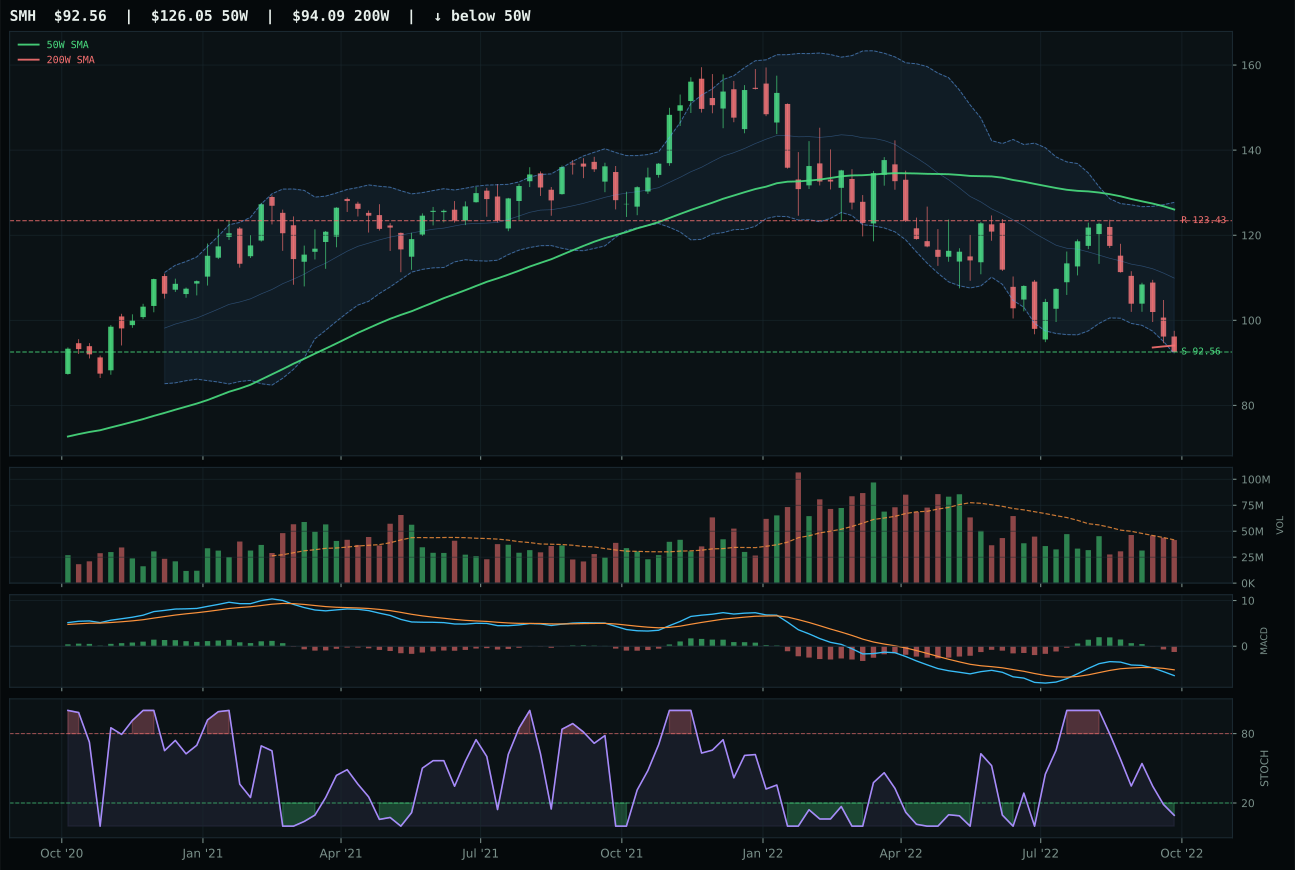
SMH has a pullback into support profile with 0.8% 13-week relative strength versus SPY.
A failed hold above support would weaken the setup.
Actionable but governed by invalidation levels.
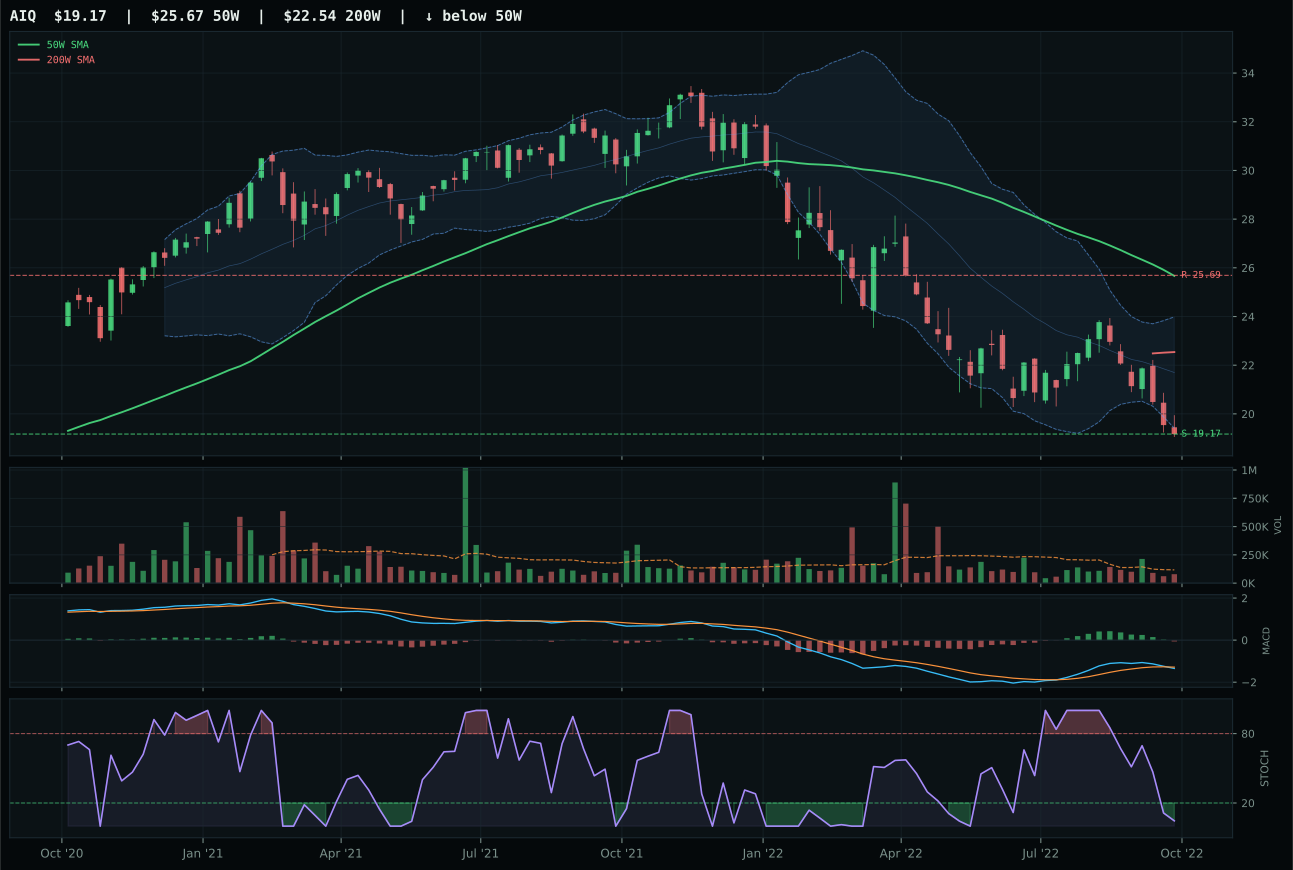
AIQ has a pullback into support profile with -1.9% 13-week relative strength versus SPY.
A failed hold above support would weaken the setup.
Tracked, but not top-2 eligible because: .
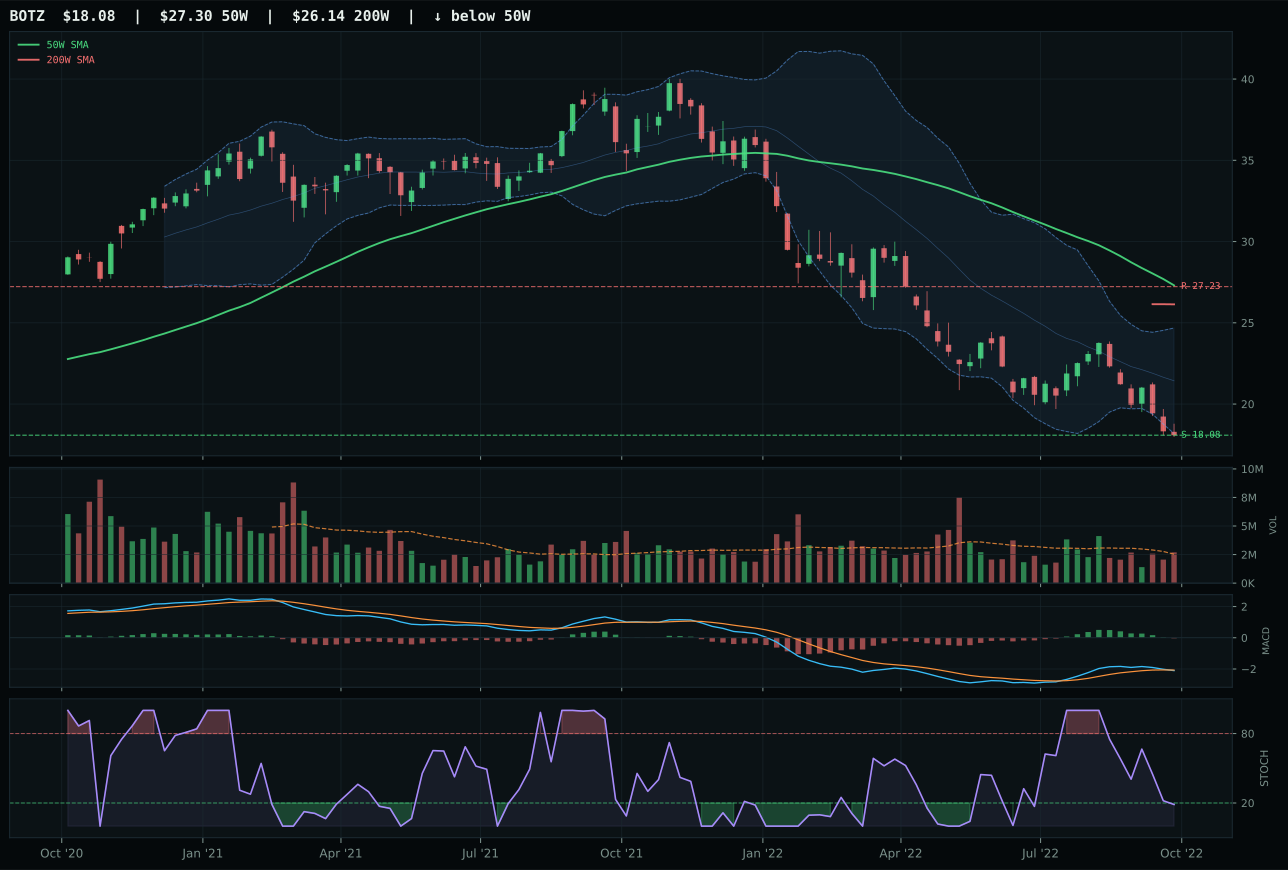
BOTZ has a pullback into support profile with -5.8% 13-week relative strength versus SPY.
A failed hold above support would weaken the setup.
Actionable but governed by invalidation levels.
SMH prevails as the lesser-damaged representative in a category that scores only 12.2 overall, winning because it has held 0.8% relative strength versus SPY while both AIQ and BOTZ have collapsed further into negative relative strength territory. The semiconductor-focused thesis outperforms software and robotics on structure cleanliness (50.0 vs 64.3 for AIQ's thin participation) and volume participation, but this is a victory of degrees in a sinking ship. Price sits 26.6% below the 50W with MACD weakening and stochastic RSI oversold, delivering exactly the pullback-into-support setup the macro regime abhors. Even SMH's 10.5% 4-week drawdown and category-relative strength of 2.6% cannot mask that this entire category is being systematically liquidated.
AI receives 0% allocation this week, ranked 9th or 10th in the portfolio depending on how the other zero-allocation categories settle. The 26.0/100 category macro fit reveals the killer confluence: liquidity stress, broad market bear, and dollar pressure combine for -24 net points, which no amount of technical improvement can offset in a 62/38 technical-to-macro weighting scheme. SMH's 29.7/100 technical evidence score itself is weak—below the portfolio's marginal acceptance threshold—and the macro narrative is actively hostile to semiconductor capex, venture-backed AI software, and robot deployment cycles. For AI to earn even a 5% slot, the broad market bear would need to flip, liquidity stress would need to reverse, or the 13W return profile would need to show genuine sustained outperformance. None of those conditions are present.
Emerging Markets — INDA
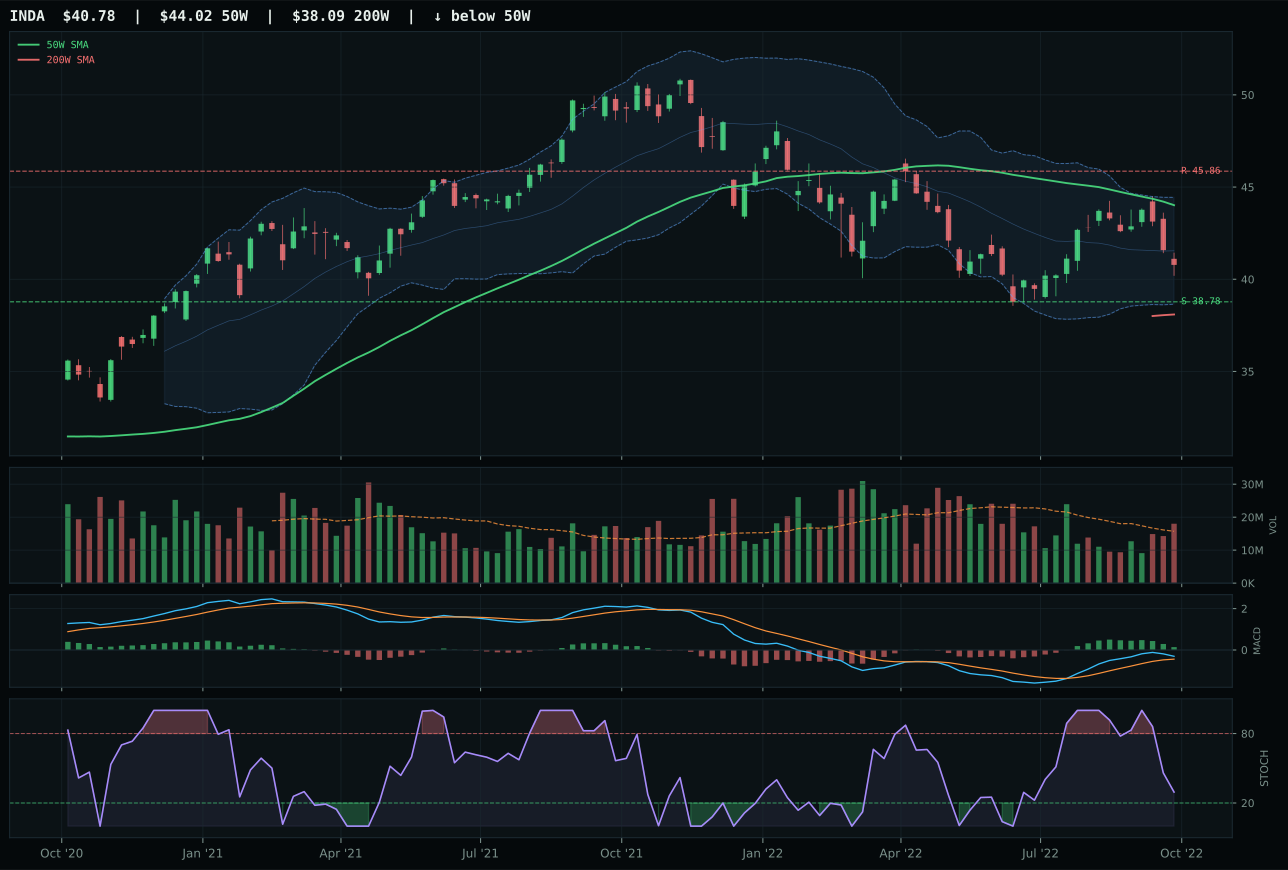
INDA has a neutral structure profile with 9.6% 13-week relative strength versus SPY.
A failed hold above support would weaken the setup.
Actionable but governed by invalidation levels.
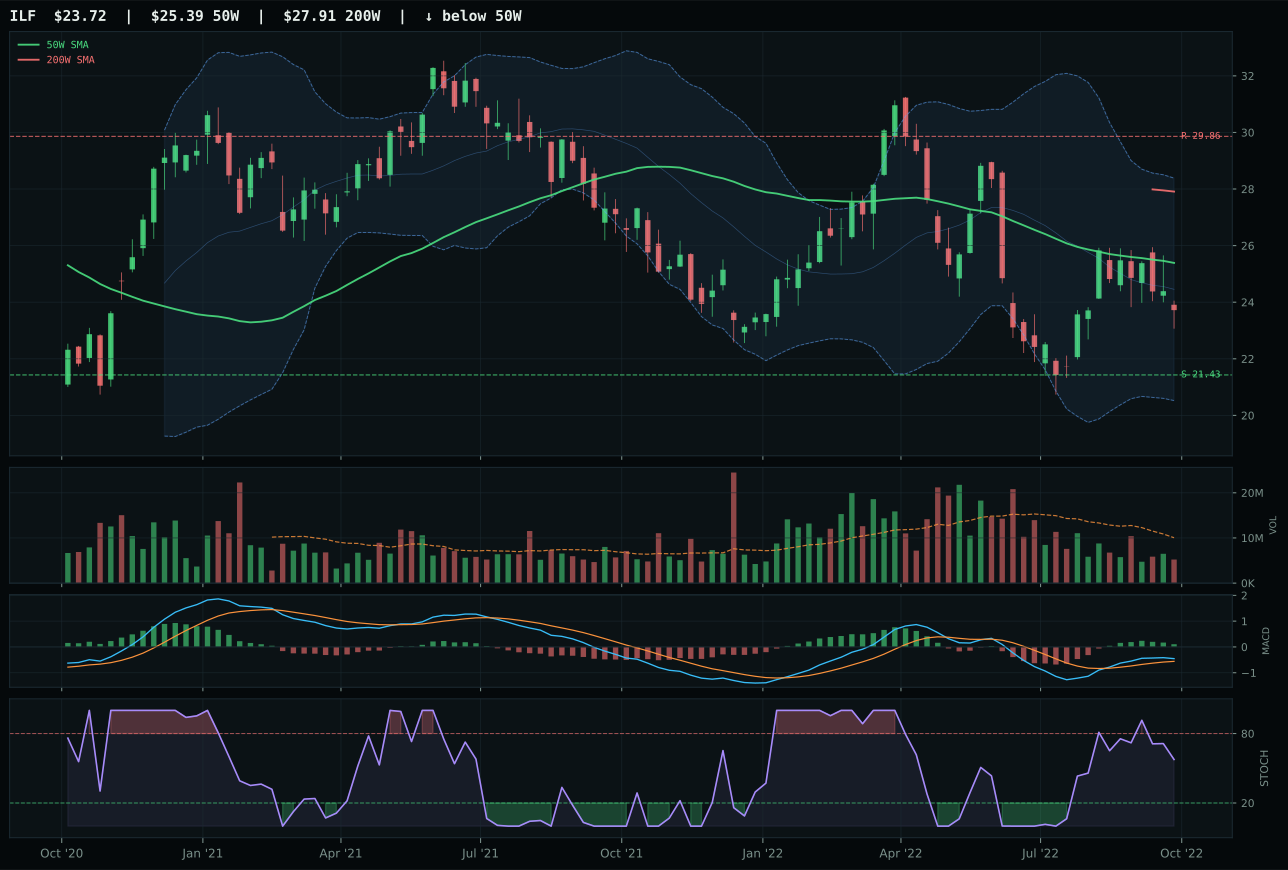
ILF has a neutral structure profile with 12.1% 13-week relative strength versus SPY.
Extension and support failure are the main tactical risks.
Tracked, but not top-2 eligible because: structurally broken.
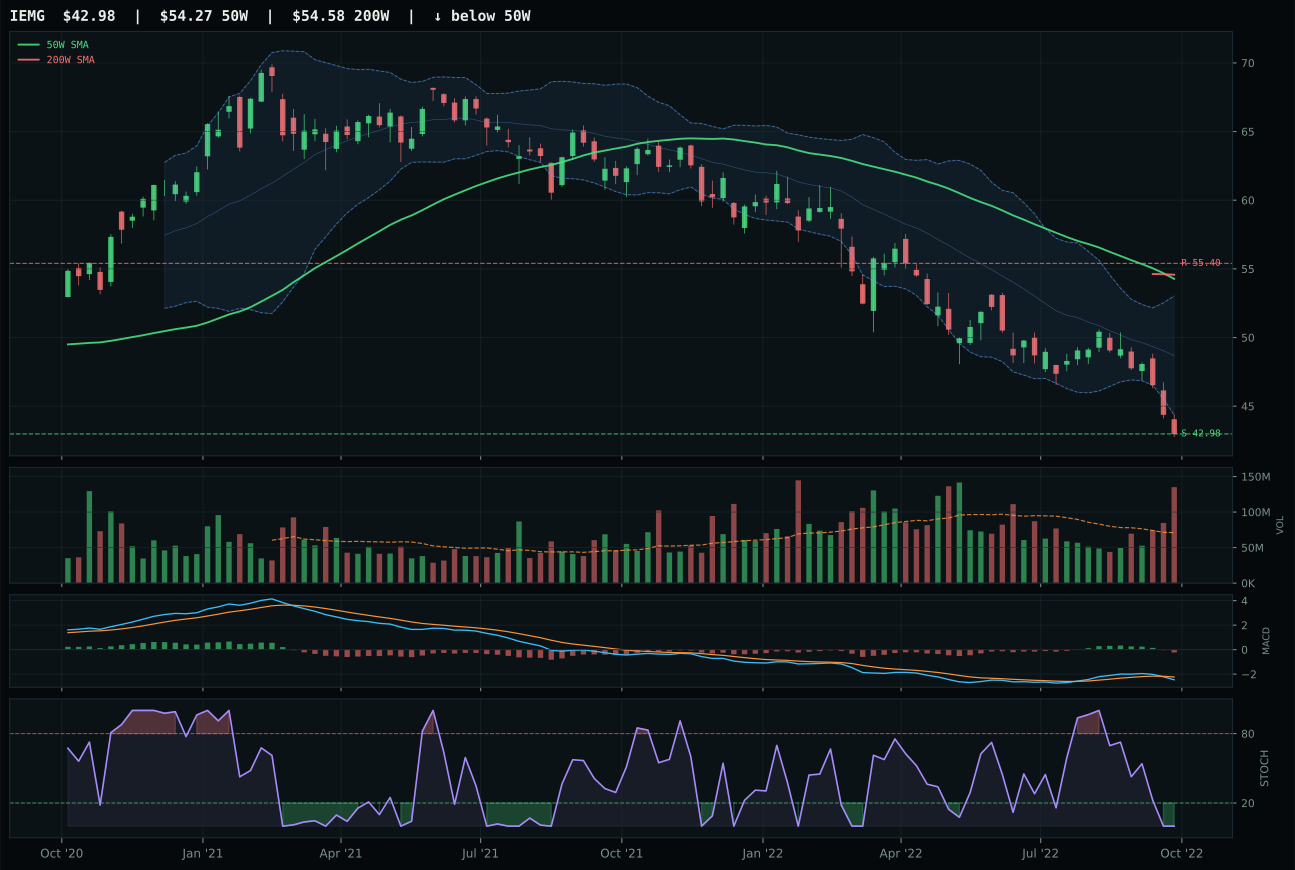
IEMG has a pullback into support profile with -5.4% 13-week relative strength versus SPY.
Extension and support failure are the main tactical risks.
Tracked, but not top-2 eligible because: structurally broken.
INDA wins with a composite score of 73, crushing ILF's 28 and IEMG's 0, through superior structure (77.7 vs 39.5), volume confirmation (above-average participation vs thin), and category-relative strength (0.0 vs 2.5 for ILF). Both INDA and ILF show bullish but flattening MACD and falling/neutral stochastic RSI, so the differentiation lies in structural integrity and accumulation evidence. INDA's neutral-structure compression near support with above-average volume screams institutional accumulation into India quality-growth exposure, while ILF's thin participation and broken structure suggest retail washout in Latin America commodity exposure. The 9.6% RS versus SPY for INDA also confirms that real money views India as the emerging-market proxy, not commodity-linked or broad-market EM baskets.
Emerging Markets receives 0% allocation this week, excluded from the portfolio due to its bottom-tier 4.3 category score and hostile 17.0/100 macro fit. Dollar pressure (-14), liquidity stress (-10), and broad market bear (-9) create a 33-point headwind that no amount of technical improvement can overcome in the current regime. INDA's 65.9/100 technical evidence would normally earn consideration, but the category-level macro rejection is absolute: a strong dollar environment systematically penalizes EM capital flows, and late-cycle liquidity stress creates redemption pressure across emerging-market funds regardless of underlying merit. The 9.6% RS versus SPY shows India-specific relative strength within a broken category, but positioning India while excluding EM entirely would violate category construction discipline. For Emerging Markets to earn even 5%, the dollar would need to reverse course, liquidity stress would need to flip from active headwind to neutral, or the broad market bear would need to be invalidated by a sustained risk-on setup.