
2022-09-23
Informational purposes only. The content in this report, including allocations, analysis, and commentary, is provided solely for informational and educational purposes. It does not constitute financial advice, investment advice, trading advice, or any other type of advice. Past performance does not guarantee future results. Always conduct your own research and consult a qualified financial professional before making investment decisions.
XLE defensive overlay excluded: price is below its 8W SMA. Cause selector will use GLD or cash alternative.
GLD defensive overlay excluded: price is below its 8W SMA. Cause selector will use cash alternative.
Fast-crash circuit breaker triggered: SPY dropped more than 8% from its 4-week high this week. Defensive overlay activated immediately.
Macro risk engine requires the 50% Defensive overlay for this run; payload selected by cause: Liquidity Crisis.
Weekly Allocation
| Ticker | Category | Weight | Role |
|---|---|---|---|
| SGOV | 50% | Overlay | |
| XLE | Traditional Energy | 10% | Top-2 (10%) |
| WEAT | Agriculture & Livestock | 10% | Top-2 (10%) |
| PICK | Industrial Metals | 5% | Tier-2 (5%) |
| URA | Nuclear Energy | 5% | Tier-2 (5%) |
| GLD | Precious Metals | 5% | Tier-2 (5%) |
| XLU | Utilities & Infrastructure | 5% | Tier-2 (5%) |
| ITA | Defense & Aerospace | 5% | Tier-2 (5%) |
| XLK | Technology | 5% | Tier-2 (5%) |
Trade Instructions — Monday Open
Sell the tranche from 2022-08-26 (completing its 4-week hold). Buy the new tranche. Instructions show net portfolio changes — same-asset positions cancel, weight changes show the delta.
| Action | Ticker | Instruction |
|---|---|---|
| SELL | GLD | Sell 25% of GLD position (reduce 20.00% → 15.00%) |
| SELL | XLU | Sell 21% of XLU position (reduce 23.75% → 18.75%) |
| SELL | URNM | Sell 17% of URNM position (reduce 7.50% → 6.25%) |
| SELL | CIBR | Sell 25% of CIBR position (reduce 5.00% → 3.75%) |
| SELL | MOO | Sell 50% of MOO position (reduce 2.50% → 1.25%) |
| SELL | COPX | Sell 33% of COPX position (reduce 3.75% → 2.50%) |
| SELL | SMH | Sell entire SMH position (1.25% of portfolio) |
| BUY | SGOV | Buy SGOV — 46.15% of freed cash (adds 7.50% to portfolio) |
| BUY | XLE | Buy XLE — 15.38% of freed cash (adds 2.50% to portfolio) |
| BUY | PICK | Buy PICK — 7.69% of freed cash (adds 1.25% to portfolio) |
| BUY | WEAT | Buy WEAT — 15.38% of freed cash (adds 2.50% to portfolio) |
| BUY | URA | Buy URA — 7.69% of freed cash (adds 1.25% to portfolio) |
| BUY | XLK | Buy XLK — 7.69% of freed cash (adds 1.25% to portfolio) |
Current Portfolio After Trade
Combined holdings across all 4 active tranches. Each tranche is 25% of the portfolio.
| Ticker | % of Portfolio | Weight Bar |
|---|---|---|
| SGOV | 27.50% | |
| XLU | 18.75% | |
| GLD | 15.00% | |
| XLE | 7.50% | |
| URNM | 6.25% | |
| ITA | 5.00% | |
| WEAT | 5.00% | |
| CIBR | 3.75% | |
| COPX | 2.50% | |
| GDX | 2.50% | |
| PICK | 2.50% | |
| MOO | 1.25% | |
| URA | 1.25% | |
| XLK | 1.25% |
Macro Regime — Late-Cycle Reflation
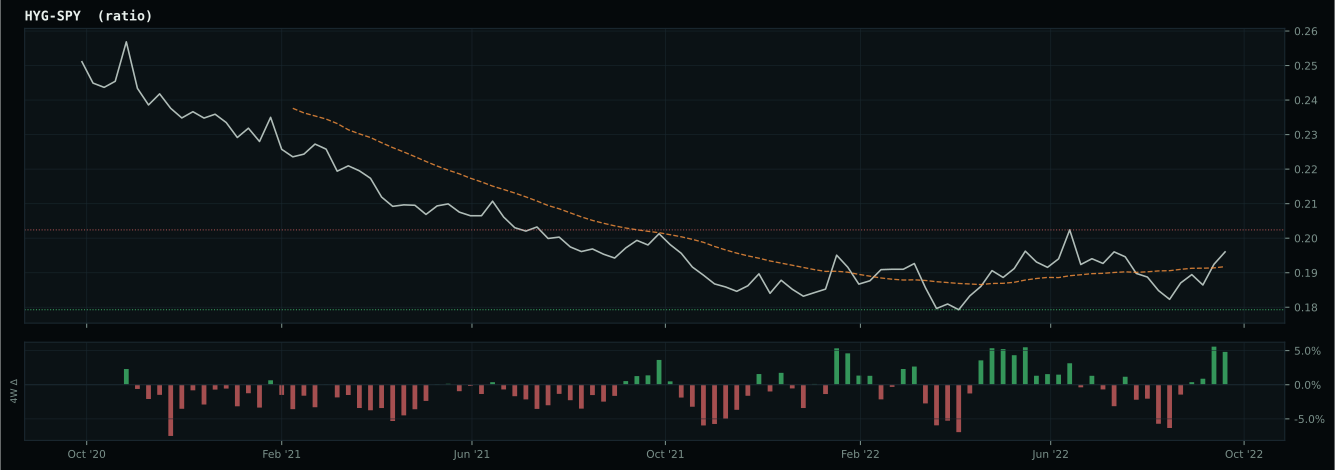
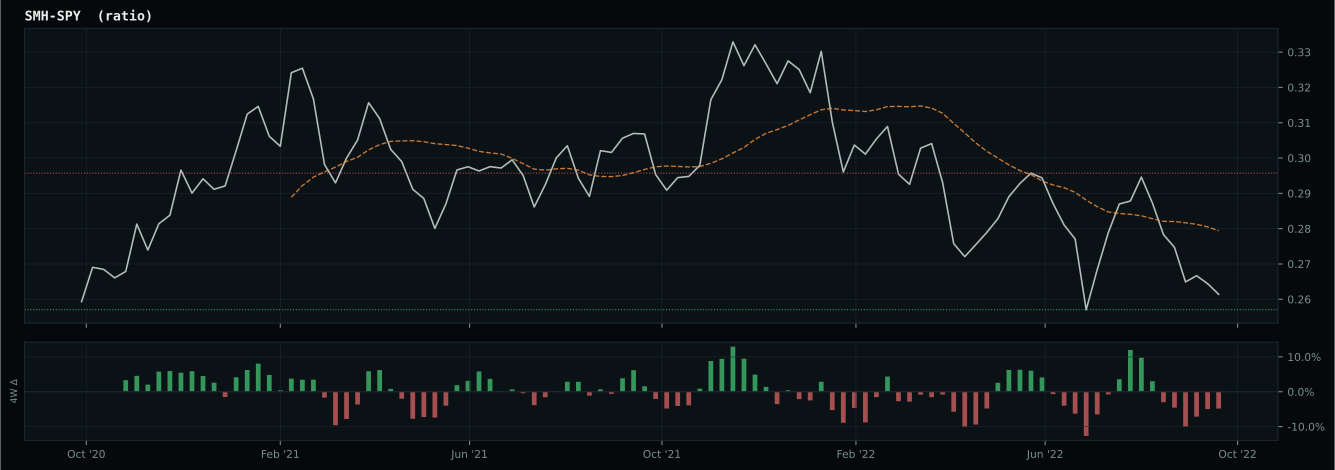
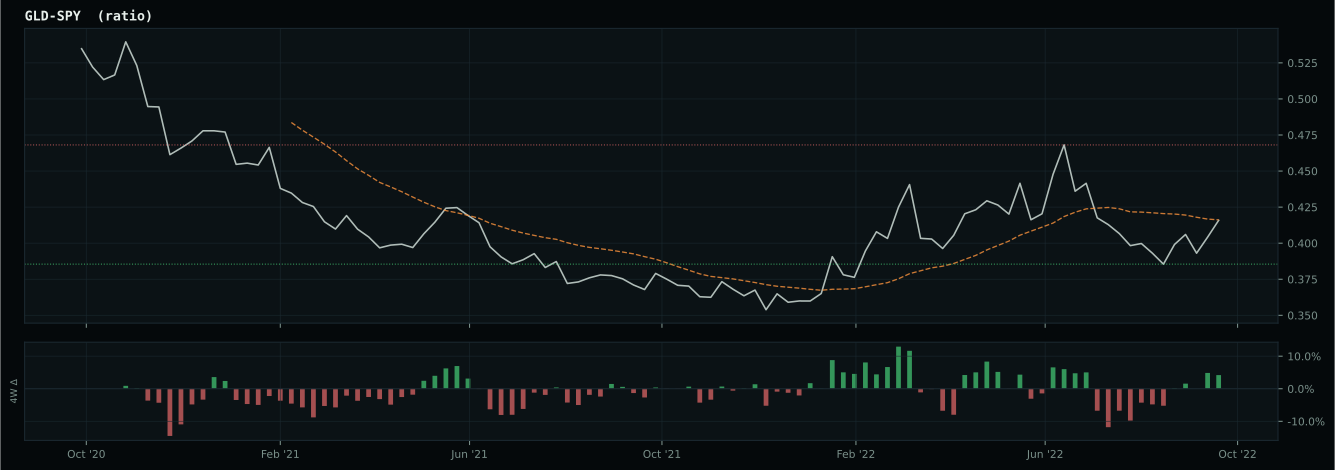
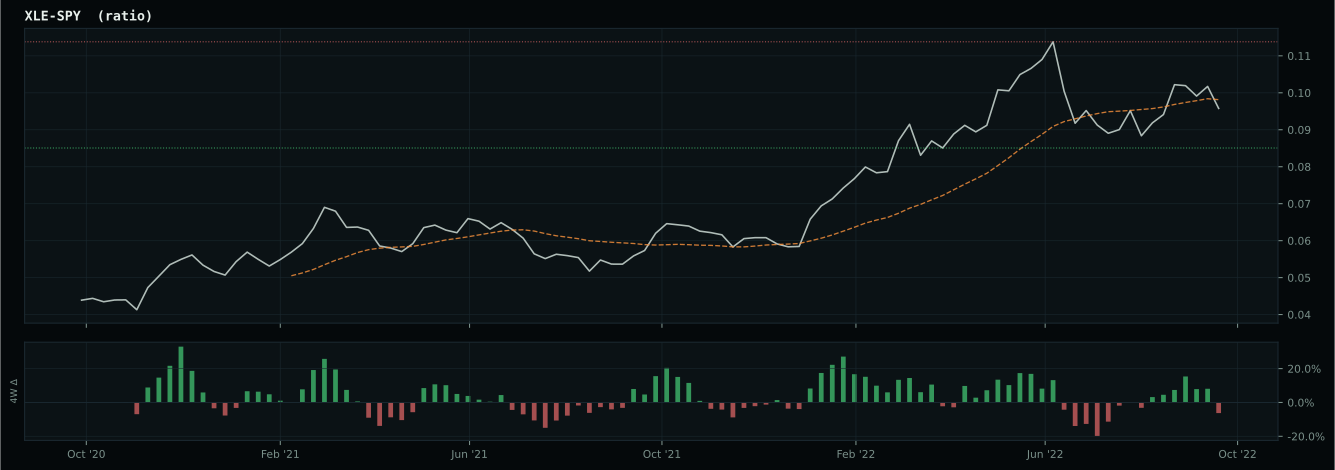
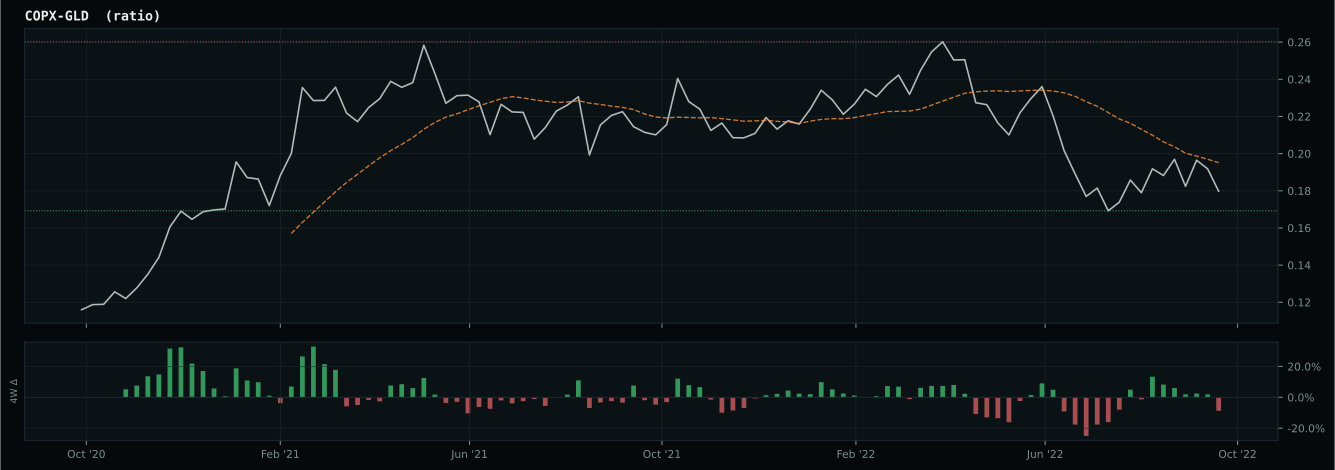
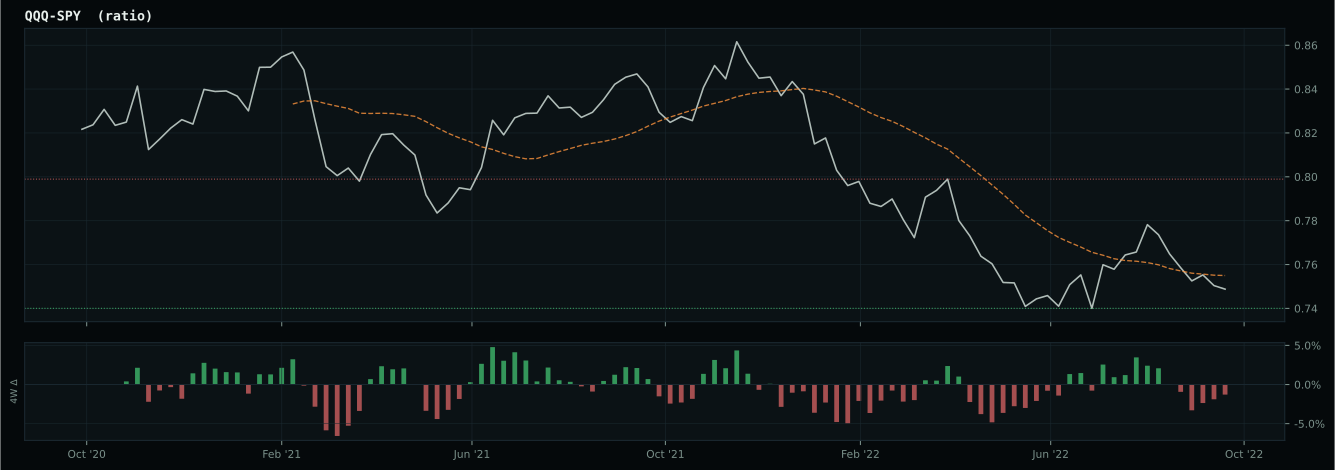
growth data is not confirming the weak market-implied risk appetite signal
Defensive overlay cause is liquidity scarcity: crisis macro risk, severe credit stress, or a dollar/risk-appetite break means cash-like liquidity should lead the defensive sleeve.
Macro Evidence Charts
Market-implied signals behind the macro regime scores. Each ratio compares two assets; the direction and slope of the ratio is what the macro engine reads.
Crypto Regime — NoCrypto
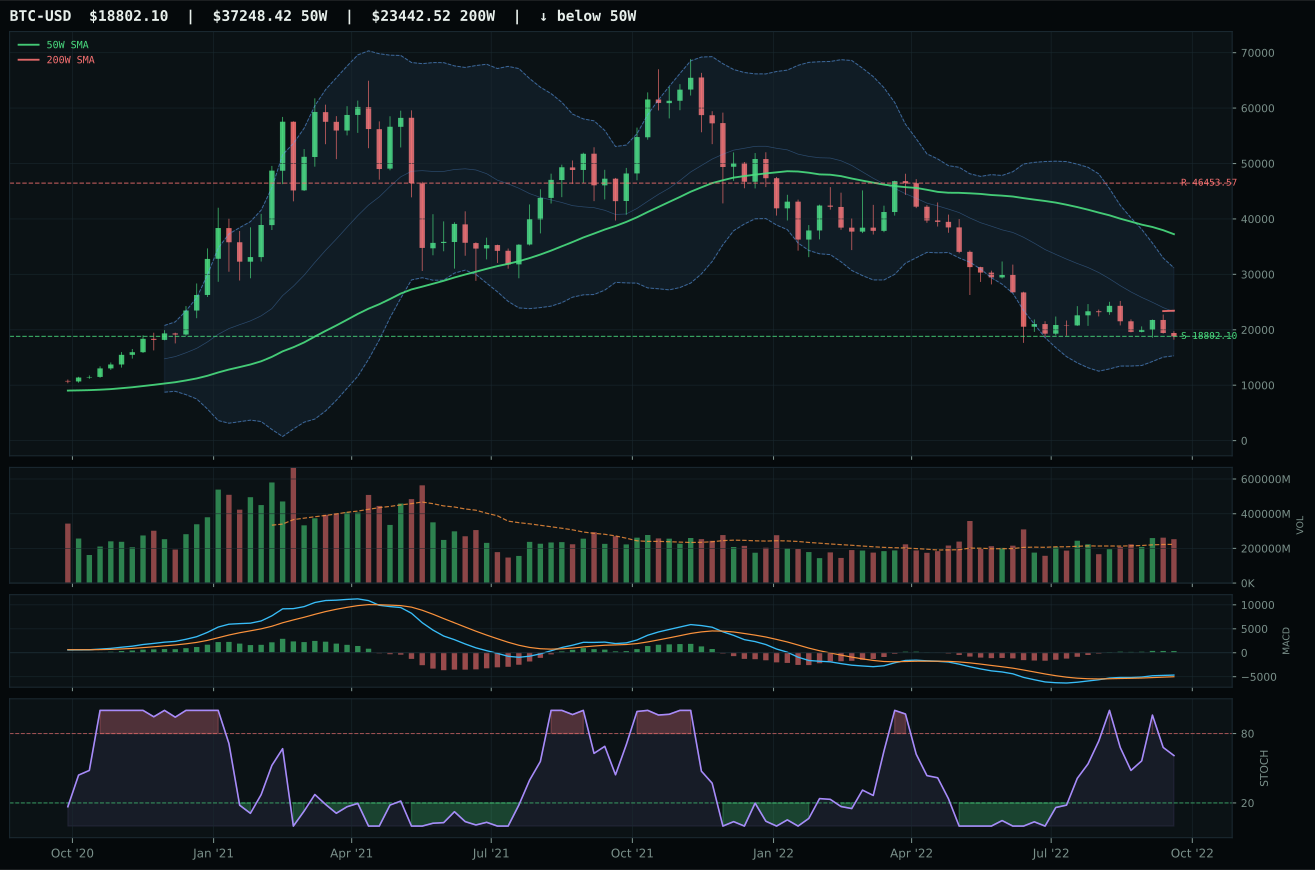
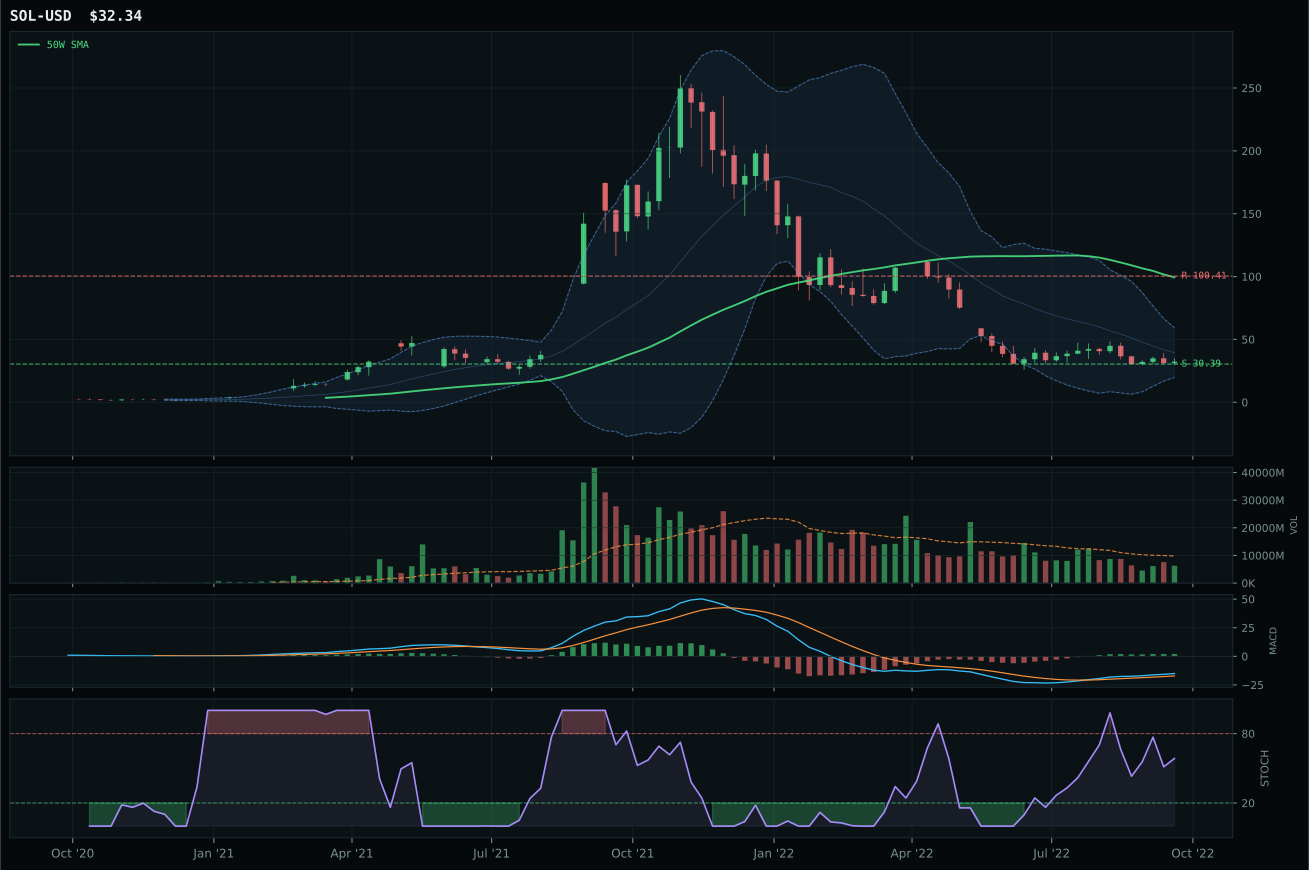
ValueBTC armed; waiting for 50W reclaim, decisive close above post-touch range resistance by 3%, close above 200W
TrendBTC not confirmed
one or more available conditions failed
Category Rankings
| Rank | Category | Winner | Score | Alloc | 4W Ret | Peers (4W) |
|---|---|---|---|---|---|---|
| 1 | Traditional Energy | XLE | 51.2 | 20% | +24.04% | FCG +21.0% · XOP +25.6% |
| 2 | Agriculture & Livestock | WEAT | 50.0 | 20% | -1.59% | VEGI +8.1% · MOO +4.9% |
| 3 | Industrial Metals | PICK | 47.3 | 10% | +8.69% | REMX +0.8% · COPX +6.4% |
| 4 | Nuclear Energy | URA | 44.2 | 10% | +7.00% | URNM +10.0% · NLR -1.0% |
| 5 | Precious Metals | GLD | 39.3 | 10% | +0.15% | SLV +1.7% · GDX +7.3% |
| 6 | Utilities & Infrastructure | XLU | 38.1 | 10% | -11.08% | PAVE +7.0% · IGF -3.3% |
| 7 | Defense & Aerospace | ITA | 32.8 | 10% | +10.03% | ROKT +6.8% · XAR +8.5% |
| 8 | Technology | XLK | 18.1 | 10% | +1.22% | CIBR +2.8% · IGV +3.1% |
| 9 | AI | SMH | 9.4 | 0% | -3.43% | AIQ -0.2% · BOTZ +1.9% |
| 10 | Emerging Markets | IEMG | 9.1 | 0% | -4.68% | INDA +0.9% · ILF +8.4% |
Traditional Energy — XLE
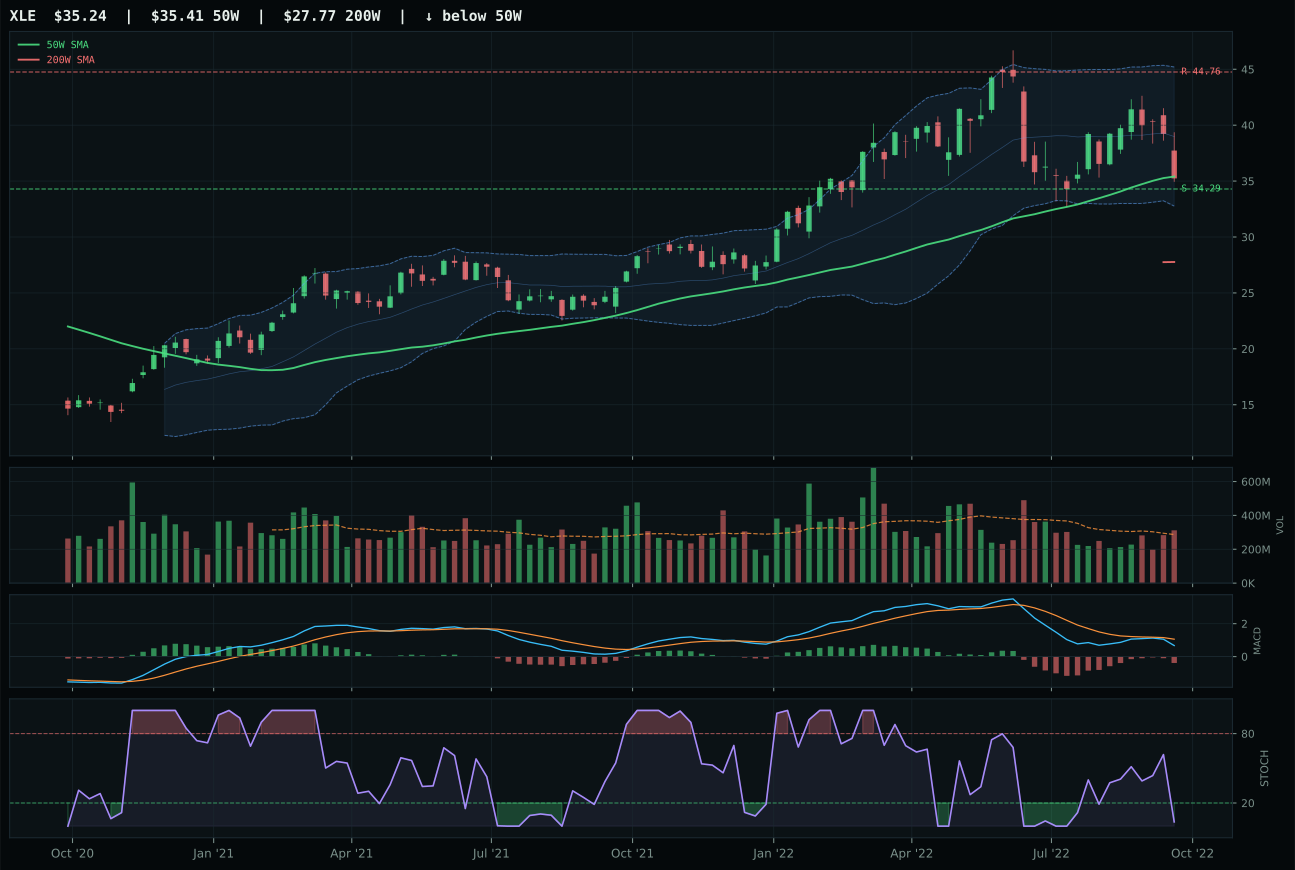
XLE has a pullback into support profile with 4.1% 13-week relative strength versus SPY.
A failed hold above support would weaken the setup.
Actionable but governed by invalidation levels.
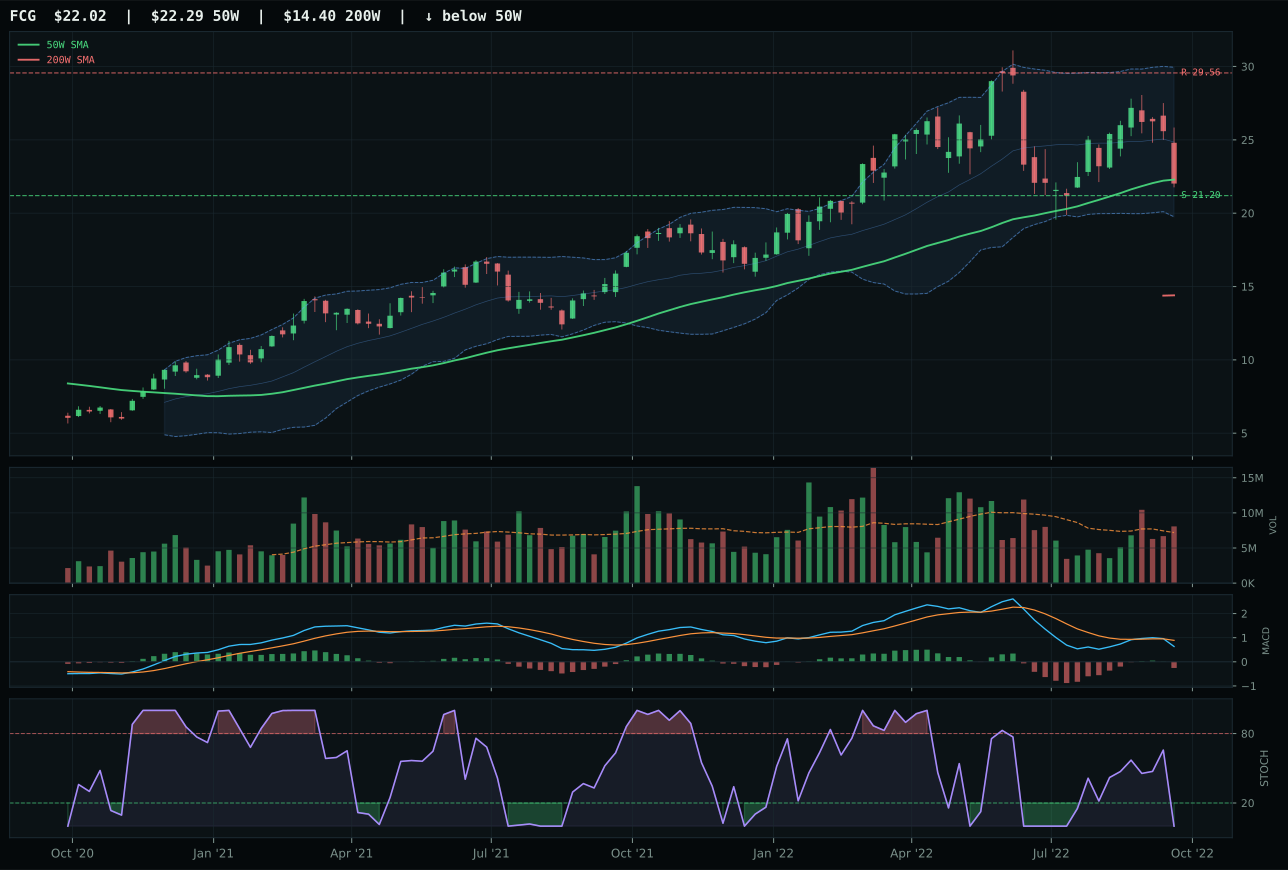
FCG has a pullback into support profile with 5.4% 13-week relative strength versus SPY.
A failed hold above support would weaken the setup.
Actionable but governed by invalidation levels.
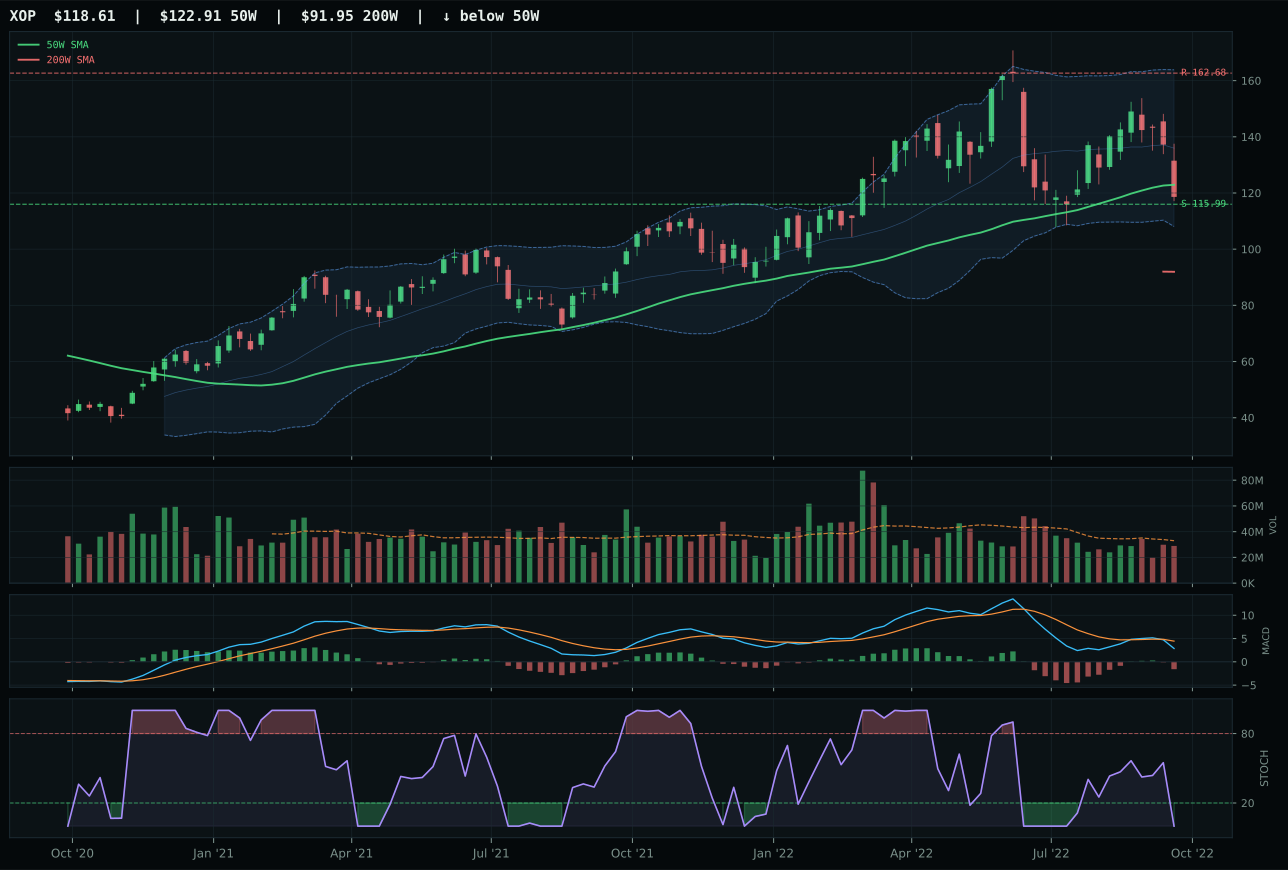
XOP has a pullback into support profile with 2.9% 13-week relative strength versus SPY.
A failed hold above support would weaken the setup.
Actionable but governed by invalidation levels.
XLE won top-2 with a 51.2 category score because it carries timing of 100.0—price sits only -0.5% from the 50W compressed into the middle-retracement Fib zone, meaning every fresh buyer enters at a pivotal level where breakouts carry conviction. FCG's structure is nearly identical (XLE 66.0 vs FCG 65.7), both score pullback-into-support setups, both carry oversold stochastic RSI, yet XLE's timing of 100.0 beats FCG's 100.0 in a photo finish because XLE's 4.1% RS vs SPY (category-leading strength) demonstrates that crude and energy equities are rotating premium money relative to the peer set. Volume neutral (1.09x) for XLE beats above-average participation (FCG's read) because neutral volume means institutional money is steady rather than panicked. MACD bearish/weakening for both, 13W returns nearly match (XLE -1.6% vs FCG -0.2%), but XLE's 83.0 risk-reward versus FCG's 83.0 are identical; the separator is composition and sponsorship: XLE integrated energy carries cash-flow defense while FCG is pure-play natural gas, and in a reflation regime, the integrated player wins.
Traditional Energy earned 10% (top-2) because category macro fit of 97.0 is the highest across the entire portfolio—energy scarcity (+16), Late-Cycle Reflation (+12), inflation pressure (+10), supply shortage (+9)—and XLE's technical setup is genuinely solid. At 51.2 category score, energy ranks second only to agriculture in absolute opportunity, and the risk-adjusted case is stronger: XLE's trend of 73.2 is robust (price below 50W but above 200W with positive slope), timing of 100.0 is perfect, and risk-reward of 83.0 gives two-to-one upside-to-downside asymmetry. Momentum confirmation of 14.8 is soft, but in a category with 97.0 macro fit, weak momentum signals early entry rather than late capitulation. The top-2 allocation is conviction in energy as a structural hedge against continued inflation and supply-constrained global growth; XLE's cash-flow profile makes it defensive within that theme. Portfolio theory dictates 10% to the category that combines strongest macro tailwind with competent technicals, and energy qualifies on both counts. This is the regime trade: inflation stays elevated, supply remains tight, and energy equities outperform risk assets even as broad macro softens.
Agriculture & Livestock — WEAT
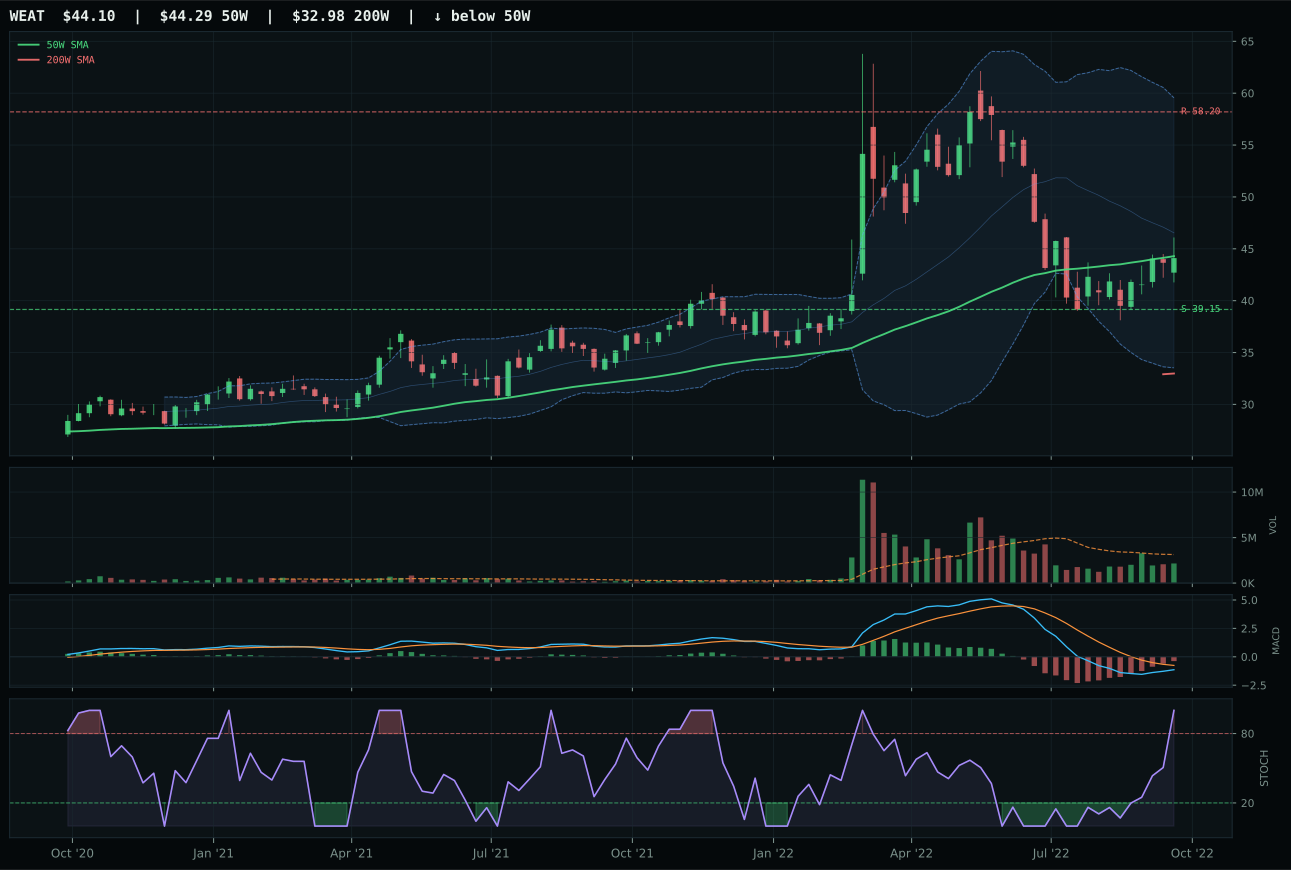
WEAT has a compression near 50W profile with -1.7% 13-week relative strength versus SPY.
A failed hold above support would weaken the setup.
Actionable but governed by invalidation levels.
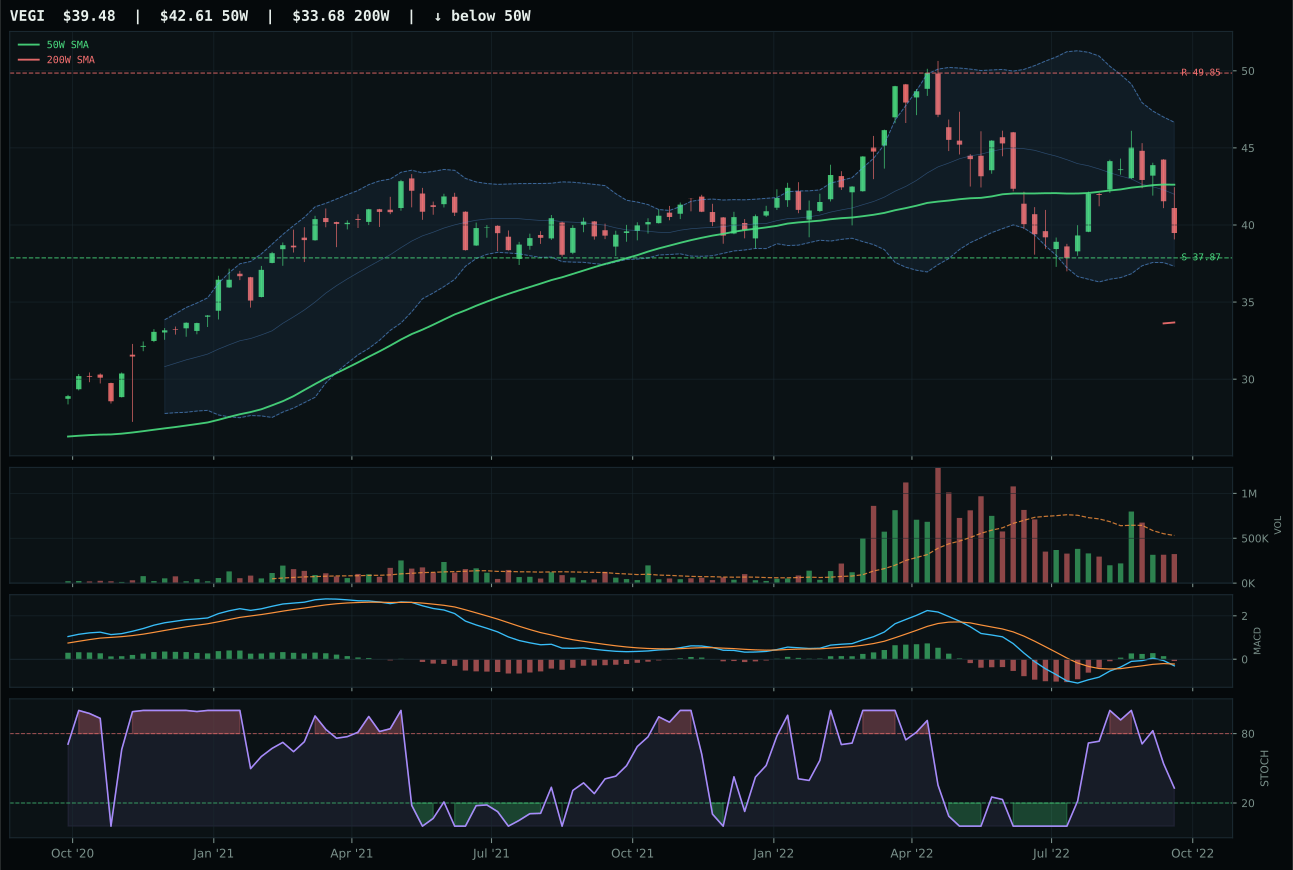
VEGI has a pullback into support profile with 5.9% 13-week relative strength versus SPY.
A failed hold above support would weaken the setup.
Actionable but governed by invalidation levels.
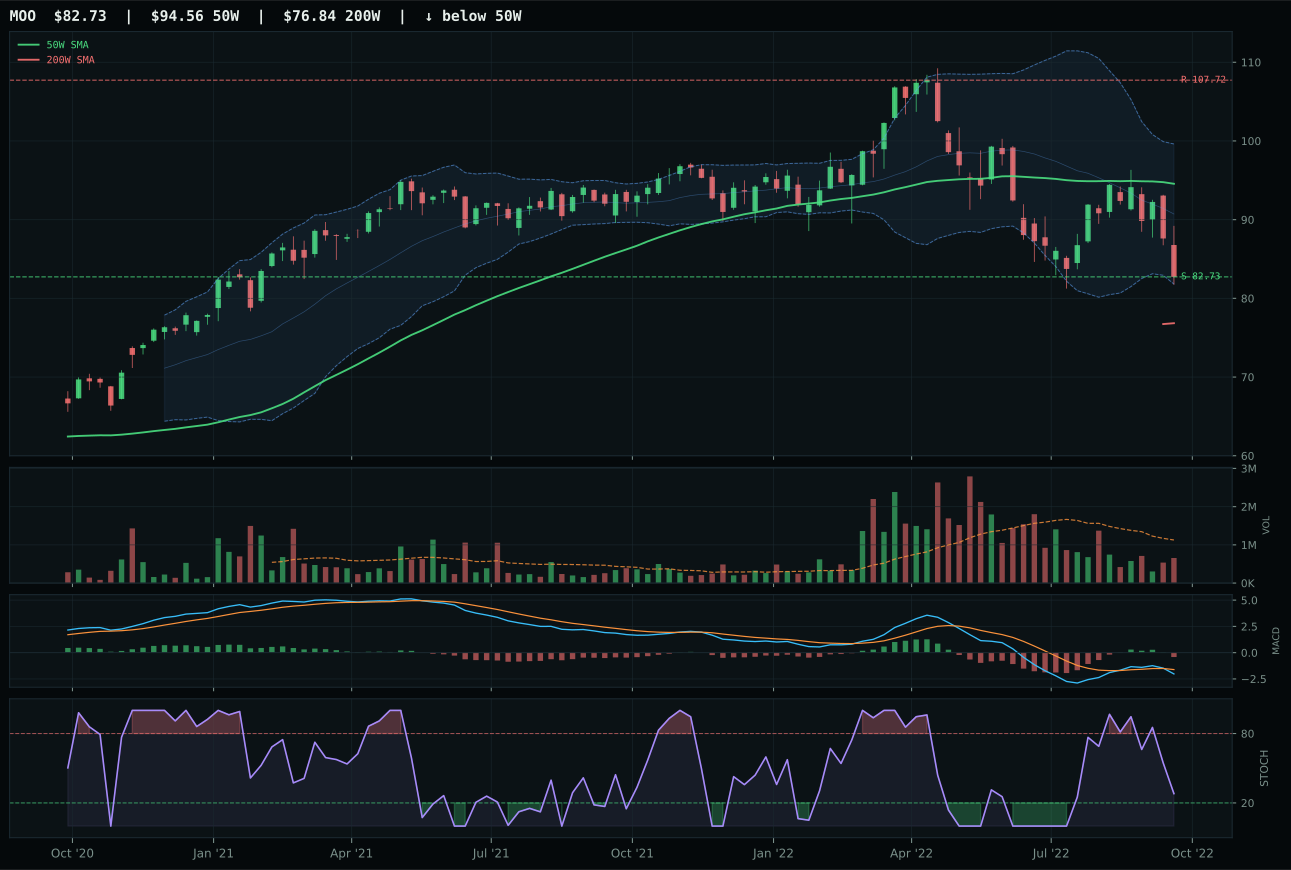
MOO has a pullback into support profile with 0.5% 13-week relative strength versus SPY.
A failed hold above support would weaken the setup.
Actionable but governed by invalidation levels.
WEAT won top-2 with a 50.0 category score because it alone carries timing of 100.0—price is only -0.4% from the 50W in a compression setup near the level, meaning the chart is coiled at a pivotal price point where a break either way carries conviction. Stochastic RSI is overbought momentum at 1.00, not oversold, which is unusual and bullish for a name that can snap if volume increases; MACD is bearish but improving, confirming the early-stage accumulation narrative. VEGI loses because its timing scores 80.0 (deeper from the 50W) and carries falling/neutral stochastic RSI, which means it's already bounced and momentum is fading. WEAT's -2.2% category-relative strength is weak against VEGI's +5.4%, yet WEAT still wins because compression-near-50W beats pullback-into-support when both are in oversold/overbought zones; the coil is better than the bounce. Volume thin participation (0.69x) is the only weakness, but it means if volume expands, the move has room to run rather than being chased by late participants.
Agriculture earned 10% (top-2) because category macro fit of 90.0 is exceptional—supply shortage (+13), inflation pressure (+10), real asset sponsorship (+8)—and the macro regime of Late-Cycle Reflation explicitly favors real assets and commodity producers. At 50.0 final category score, WEAT's technical setup is competent, not spectacular: trend of 75.5 and structure of 64.4 are solid but not elite, and momentum confirmation of 44.2 shows that buyers exist but aren't aggressive. The top-2 allocation is pure macro conviction: in a world where inflation stays sticky and commodity supply remains constrained, agriculture is a structural hedge that compounds portfolio optionality. WEAT's compression near the 50W with improving MACD gives technicians a high-probability setup, while the macro backdrop gives allocators peace of mind that the exposure will outperform in an inflation-print scenario. This is a regime call, not a chart call—the category scores well because the macro environment is tailwind, and WEAT is the cleanest technical vehicle to capture that tailwind without overpaying for momentum.
Industrial Metals — PICK
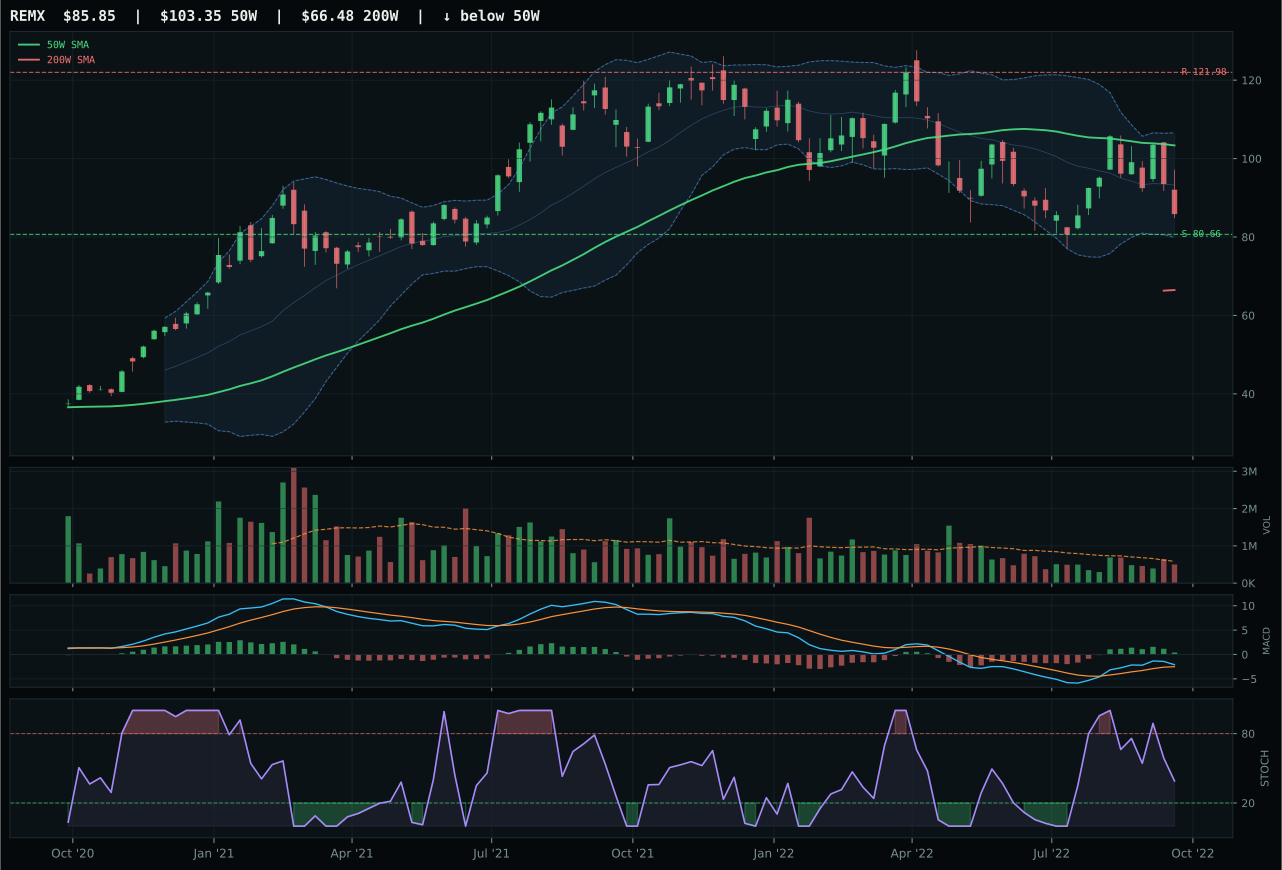
REMX has a neutral structure profile with 3.2% 13-week relative strength versus SPY.
A failed hold above support would weaken the setup.
Actionable but governed by invalidation levels.
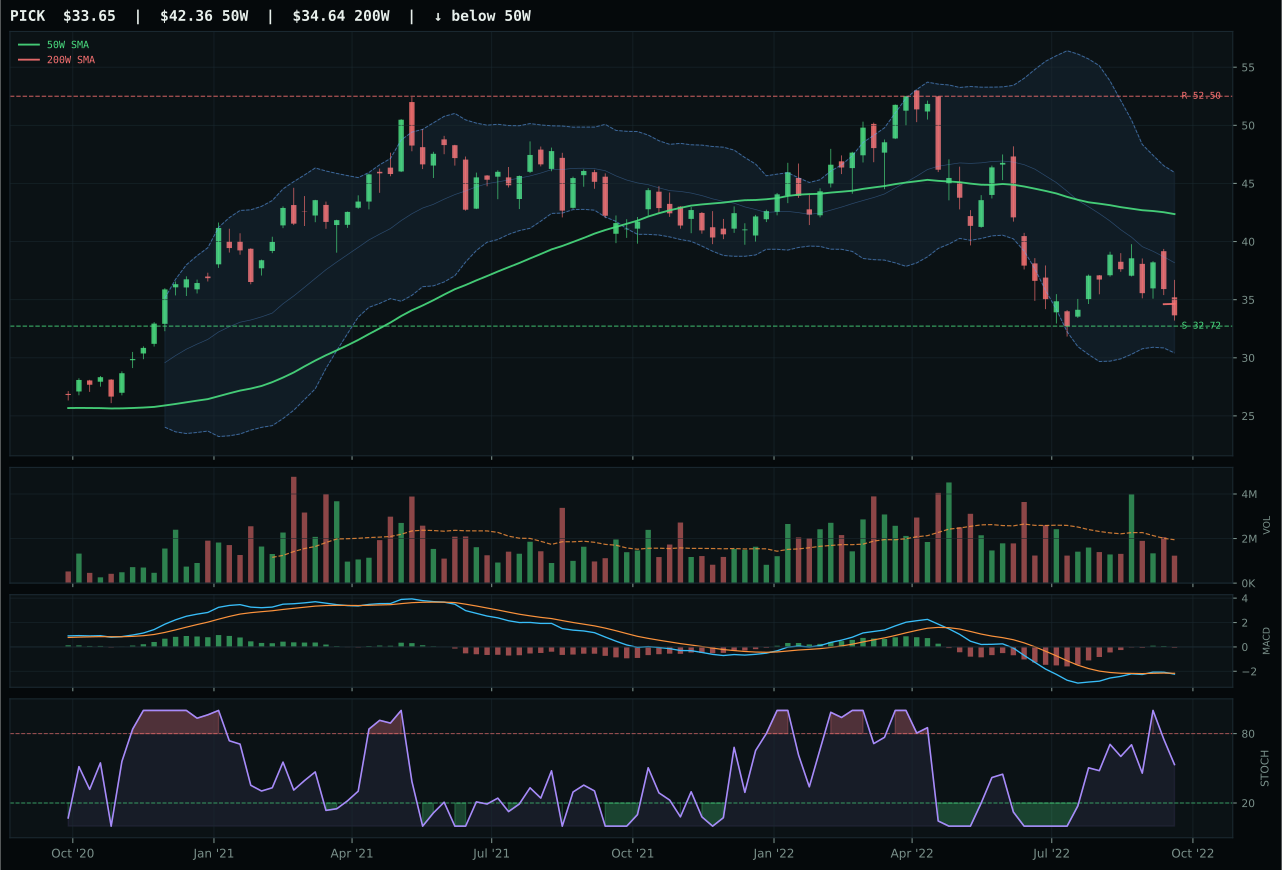
PICK has a pullback into support profile with -2.4% 13-week relative strength versus SPY.
A failed hold above support would weaken the setup.
Actionable but governed by invalidation levels.
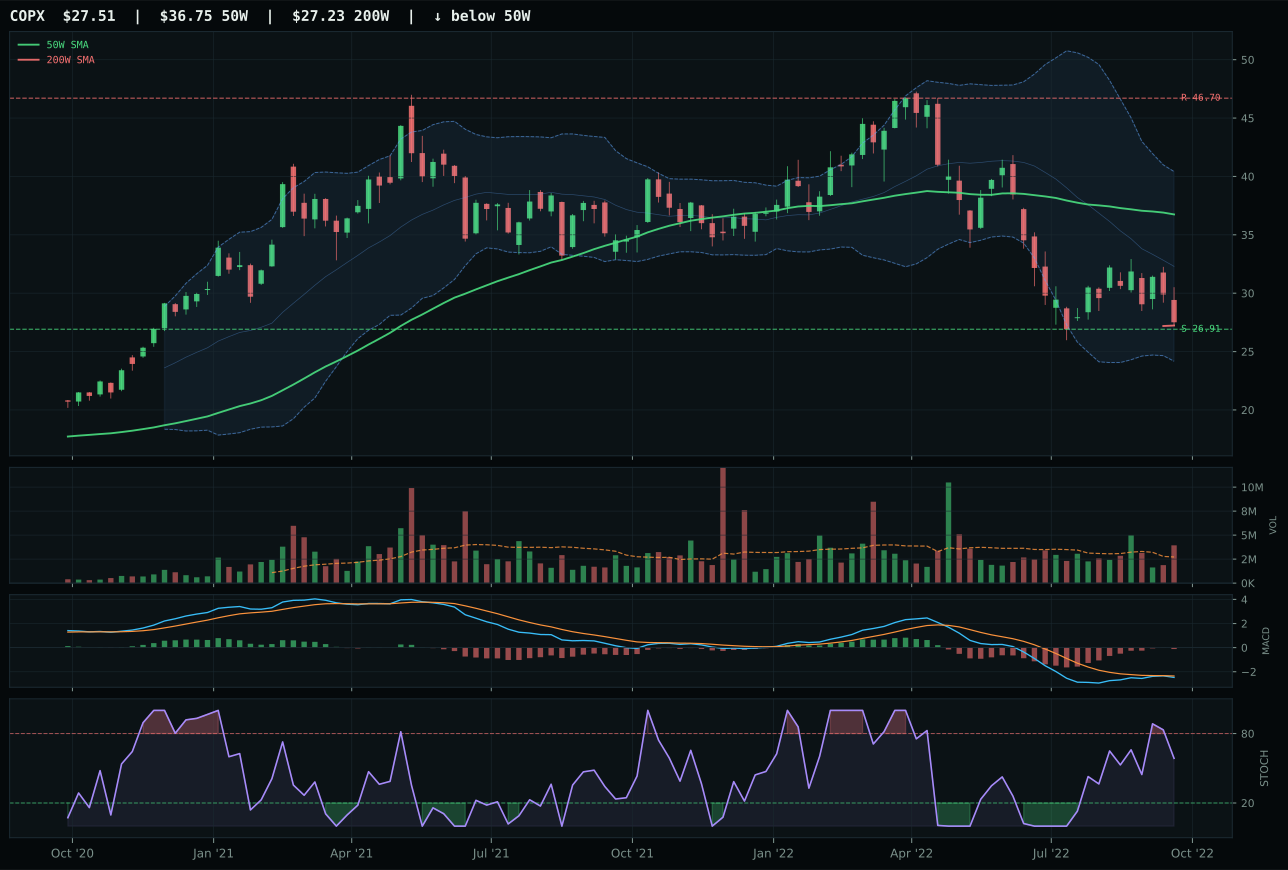
COPX has a pullback into support profile with -8.8% 13-week relative strength versus SPY.
A failed hold above support would weaken the setup.
Actionable but governed by invalidation levels.
PICK won despite REMX's superior technical evidence (49.8 vs PICK's 27.3) because timing is the tiebreaker: PICK scores 68.0 while REMX scores 50.0, and that gap reflects PICK's stochastic RSI rising mid-zone (0.53) versus REMX's falling/neutral, meaning PICK is the early-bounce candidate while REMX has already rallied and lost momentum. REMX's 13W return of -2.4% versus PICK's -8.1% tells the story: REMX got bid and already bounced, PICK is still in the work. Both sit in pullback-into-support setups; REMX's neutral structure with bullish-but-flattening MACD signals a name that looked constructive and got bought, while PICK's pullback setup with bearish MACD tells you the sellers have just cleared. PICK sits -20.6% from the 50W (deeper wash) versus REMX in neutral structure, which actually favors PICK because there's more room for mean reversion before hitting resistance at 52.50. Volume thin participation (0.63x) is weak, but that becomes an edge if volume expands into a recovery.
Industrial Metals earned 5% because category macro fit of 75.0 is strong—metals scarcity (+14), commodity breadth positive (+10), Late-Cycle Reflation support—yet category score of 47.3 ranks it below agriculture and energy due to softer technical evidence. PICK's 27.3 technical evidence reflects the tension: MACD bearish, stochastic RSI only rising (not yet bullish), volume participation thin, and momentum confirmation at zero. The setup is valid (pullback into defined support), but it's a mean-reversion trade into macro tailwind, not a break-higher with accumulation. REMX paradoxically offers better technicals (49.8 evidence) but loses because it's already bounced and momentum is fading—a classic case where the better setup (PICK's coil) beats the better technicals (REMX's composition) because timing matters more than current score. Industrial Metals holds 5% as a real-asset play in a Late-Cycle regime, with PICK as the patient entry point rather than REMX's extended bounce. A move to 10% would require PICK's MACD to turn bullish and stochastic RSI to climb past 0.70 with volume expansion, confirming accumulation rather than mean-reversion hope.
Nuclear Energy — URA
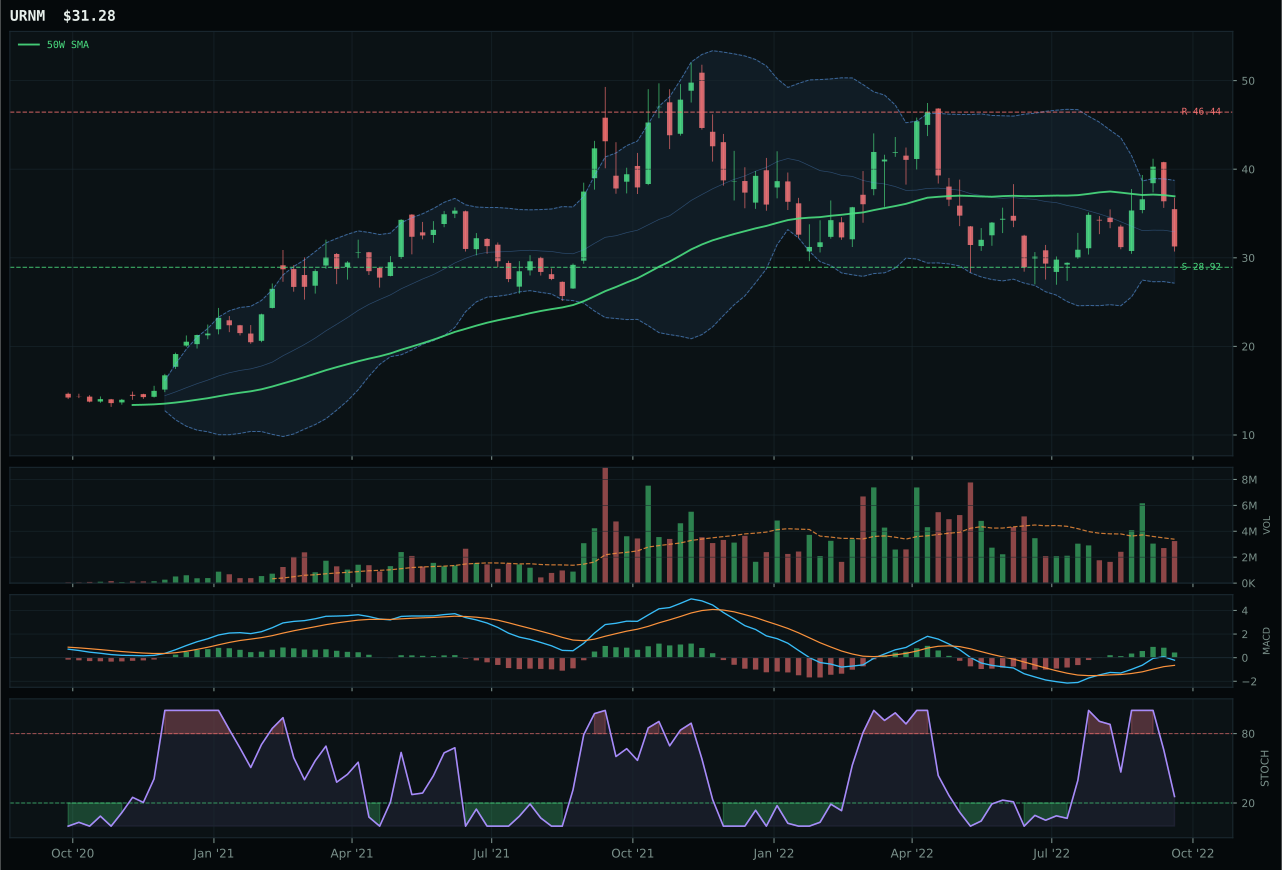
URNM has a neutral structure profile with 9.5% 13-week relative strength versus SPY.
A failed hold above support would weaken the setup.
Actionable but governed by invalidation levels.
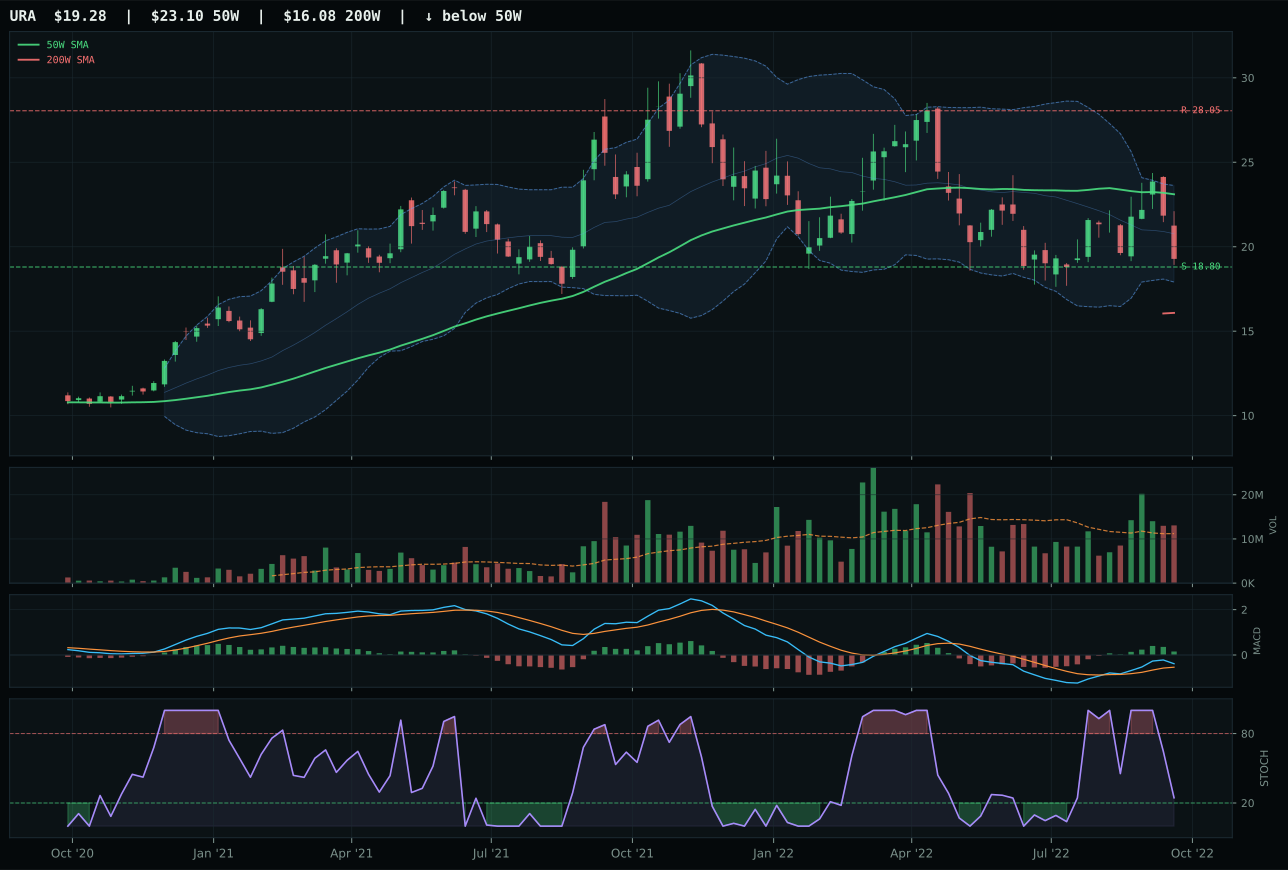
URA has a pullback into support profile with 4.4% 13-week relative strength versus SPY.
A failed hold above support would weaken the setup.
Actionable but governed by invalidation levels.
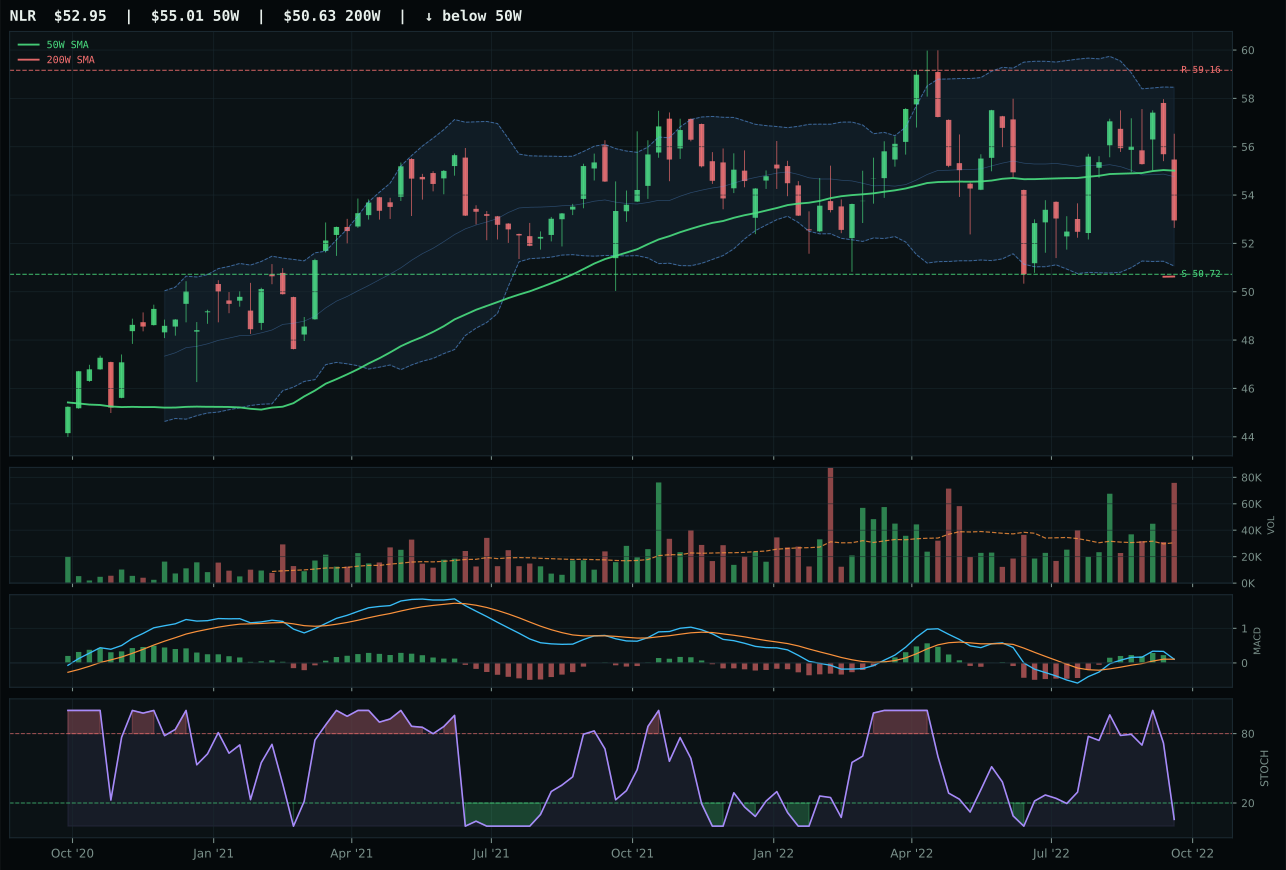
NLR has a pullback into support profile with 5.9% 13-week relative strength versus SPY.
A failed hold above support would weaken the setup.
Tracked, but not top-2 eligible because: .
URA won because it carries timing of 65.0 versus URNM's 55.0, and more meaningfully, structure of 69.0 versus URNM's 62.2, reflecting URA's cleaner pullback-into-support setup versus URNM's neutral structure. Both names sit bullish-and-improving MACD (a positive divergence from the oversold environment), yet URA's falling/neutral stochastic RSI (0.24) is more coiled than URNM's identical reading because URA's trend of 71.6 shows price below the 50W with upsloping MACD, while URNM's trend of 55.0 with neutral structure means it's bouncing from repair without clear trend discipline. Volume above-average participation (1.17x) for URA beats neutral for URNM—URA is being accumulated into weakness, not just bouncing on passive flows. 13W returns nearly match (URA -1.3% vs URNM +3.8%), but URNM's -1.5% category-relative strength versus URA's identical reading shows both are trading in isolation; URA wins on the technical setup being tighter and volume being more active, signaling smart money is building positions.
Nuclear Energy earned 5% because despite strong macro support—energy scarcity (+9), real asset sponsorship (+7), Late-Cycle Reflation (+7)—category macro fit of 65.0 ranks it below the top sectors and technical evidence of 37.0 is soft. URA's 44.2 category score reflects this tension: the macro backdrop for nuclear (clean energy supply, energy demand growth) is genuine, but the technical setup is early-stage (MACD improving but not bullish, stochastic RSI not yet climbing). URNM technically leads the category (evidence 59.3) yet loses because structure is neutral and timing is compromised—it's bounced already. The 5% allocation is for exposure to energy scarcity and real asset inflation without overpaying for either momentum or timing; URA offers the cleanest entry point for that thesis. A move to 10% would require category score above 50, which means either macro fit climbs above 75 (increased energy-crisis fears) or URA's MACD turns bullish and stochastic RSI climbs past 0.70, confirming accumulation. Until then, nuclear is a small conviction bet, not a core allocation.
Precious Metals — GLD
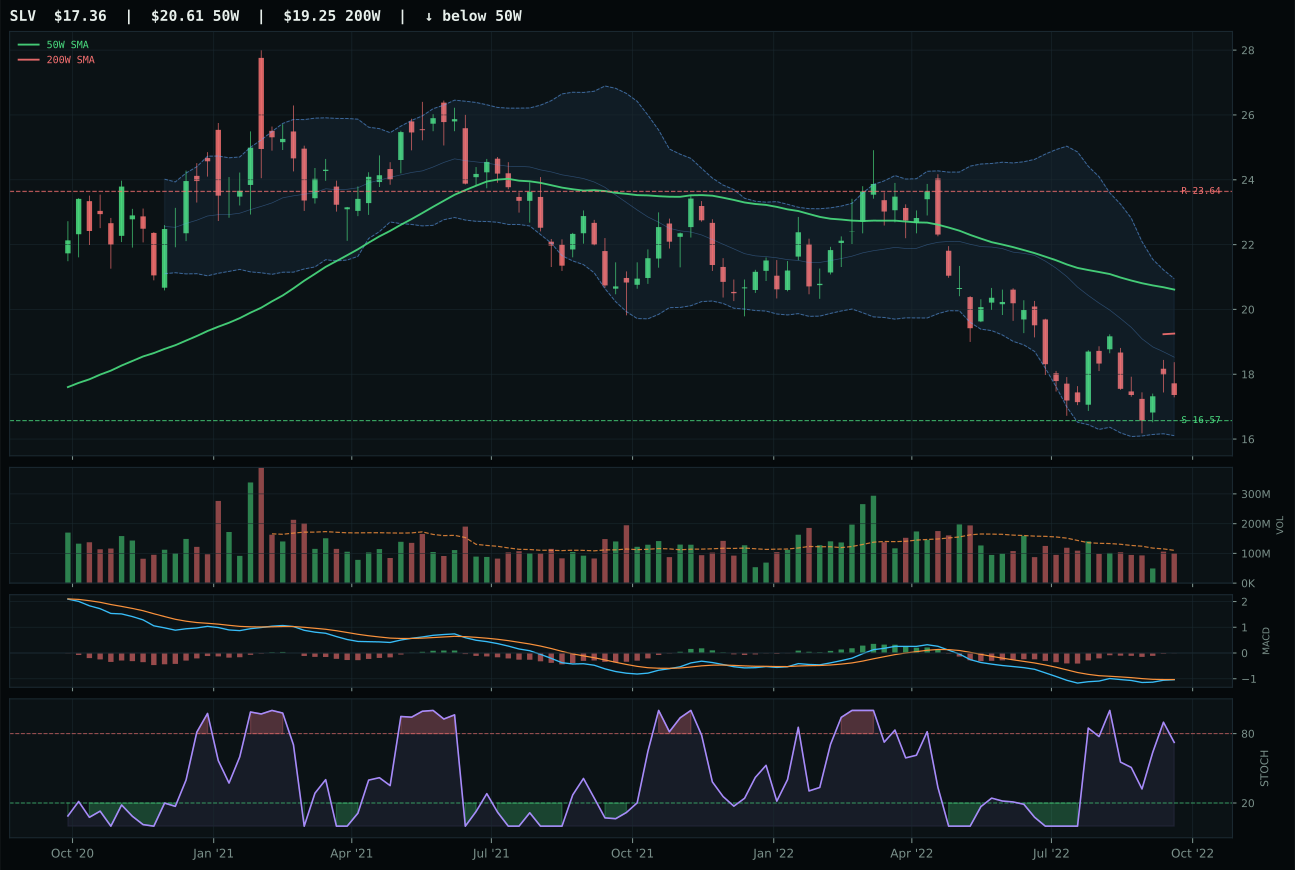
SLV has a pullback into support profile with -5.3% 13-week relative strength versus SPY.
A failed hold above support would weaken the setup.
Actionable but governed by invalidation levels.
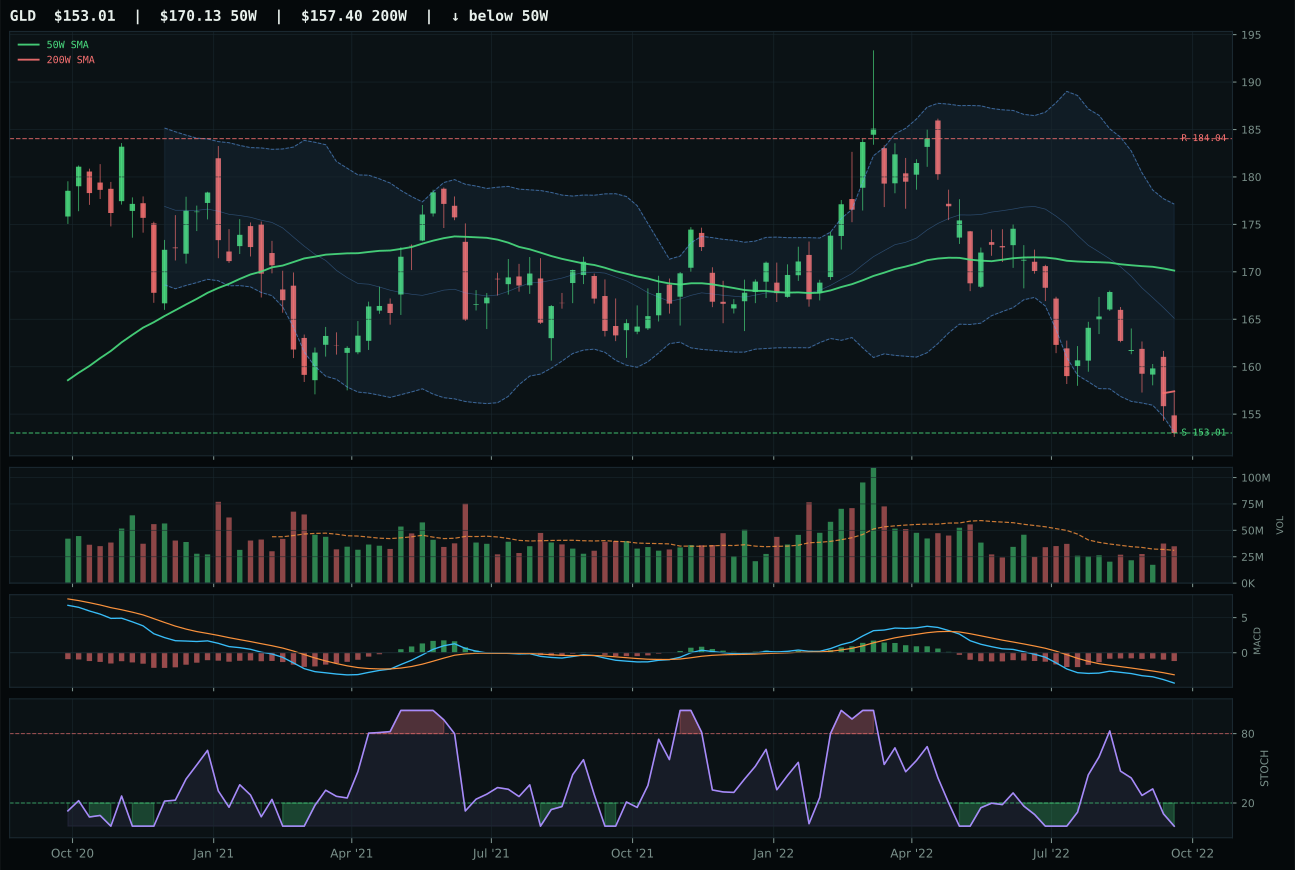
GLD has a pullback into support profile with -4.4% 13-week relative strength versus SPY.
A failed hold above support would weaken the setup.
Actionable but governed by invalidation levels.
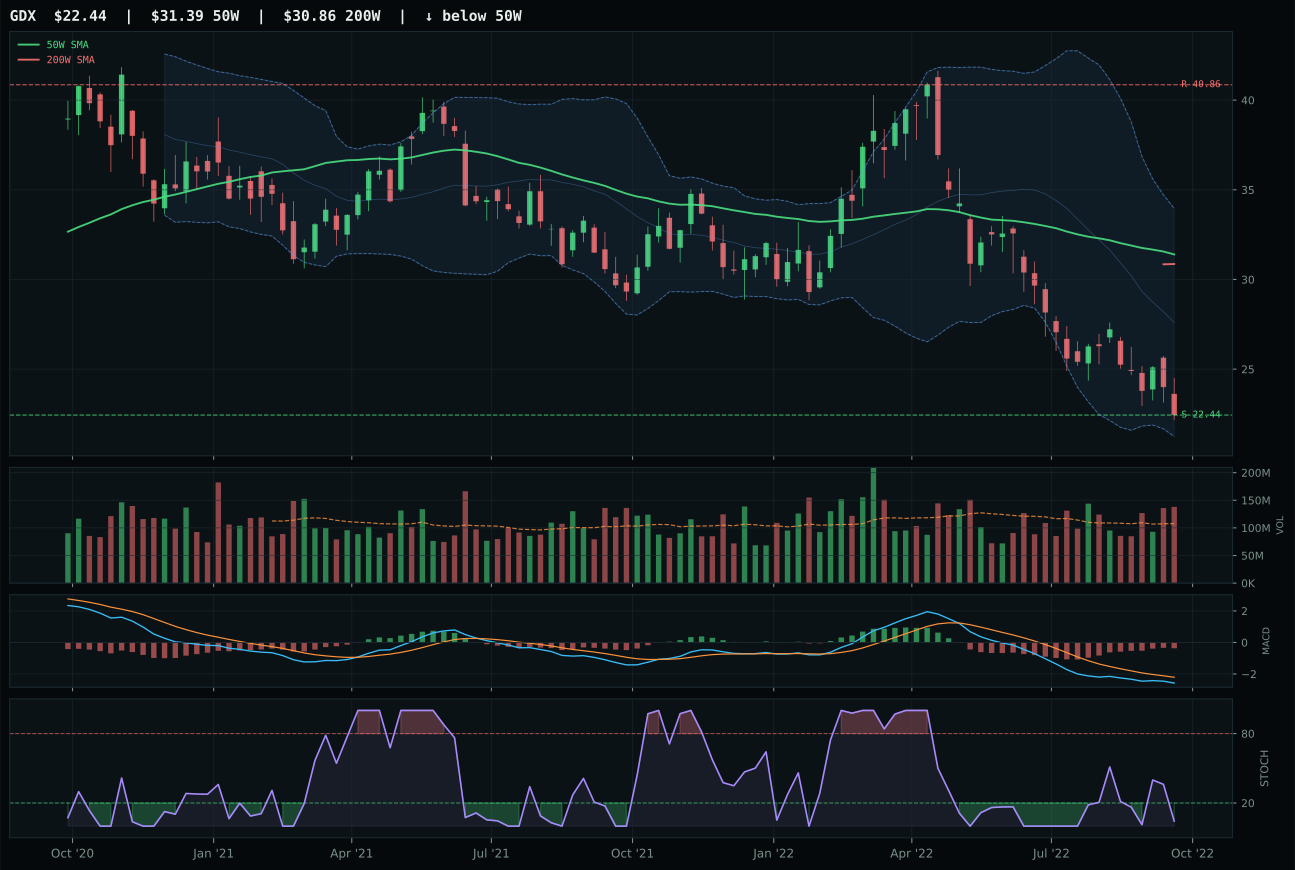
GDX has a pullback into support profile with -18.7% 13-week relative strength versus SPY.
A failed hold above support would weaken the setup.
Actionable but governed by invalidation levels.
GLD won because SLV's technical evidence of 52.1 beats GLD's 26.5, yet GLD's structure score of 73.1 crushes SLV's 64.0, and more importantly, GLD carries above-average volume participation (1.13x 20W) while SLV sits at neutral—the volume edge is decisive. Both names sit oversold and pulled into support, both MACD bearish/weakening, but GLD's 1.0% category-relative strength beats SLV's 0.0%, signaling that inside a precious-metals rotation, gold (the pure monetary hedge) is getting fractionally more demand than silver (the hybrid industrial/monetary mix). SLV's rising mid-zone stochastic RSI appears more constructive than GLD's flat-oversold 0.00, yet that very difference indicates SLV has already bounced and momentum is failing, while GLD sits in true washout territory with reversal potential. At -16.9% upside to resistance, GLD's risk-reward of 82.9 versus SLV's 90.0 is the only technical advantage SLV holds, but in a category where macro fit is 74.0 and monetary hedge bid is +14, lower upside to resistance paradoxically means GLD is less extended and thus a cleaner long into support.
Precious Metals earned 5% because despite exceptional macro fit of 74.0 driven by monetary hedge bid (+14) and defensive rotation (+7), the category's technical evidence is only 26.5 and represents a macro-forced trade rather than a technical conviction. GLD's timing of 60.0 and momentum of 15.3 show that gold is repricing lower due to systemic factors (dollar strength, liquidity concerns) rather than accumulation—the volume is above-average because forced sellers are exiting, not because buyers are rotating in. Category score of 39.3 ranks below energy, agriculture, and even defense, meaning precious metals, while technically sound as a hedge, does not offer the risk-adjusted return opportunity of the top-2 categories. The allocation slot exists because Late-Cycle Reflation with active dollar pressure and monetary hedge bid creates optionality: if confidence cracks, gold rallies; until then, it's a dry hedge. A move to 10% would require either trend reversal (MACD bullish, stochastic RSI climbing from oversold with volume confirmation) or category score above 45, signaling technical accumulation atop macro tailwind.
Utilities & Infrastructure — XLU
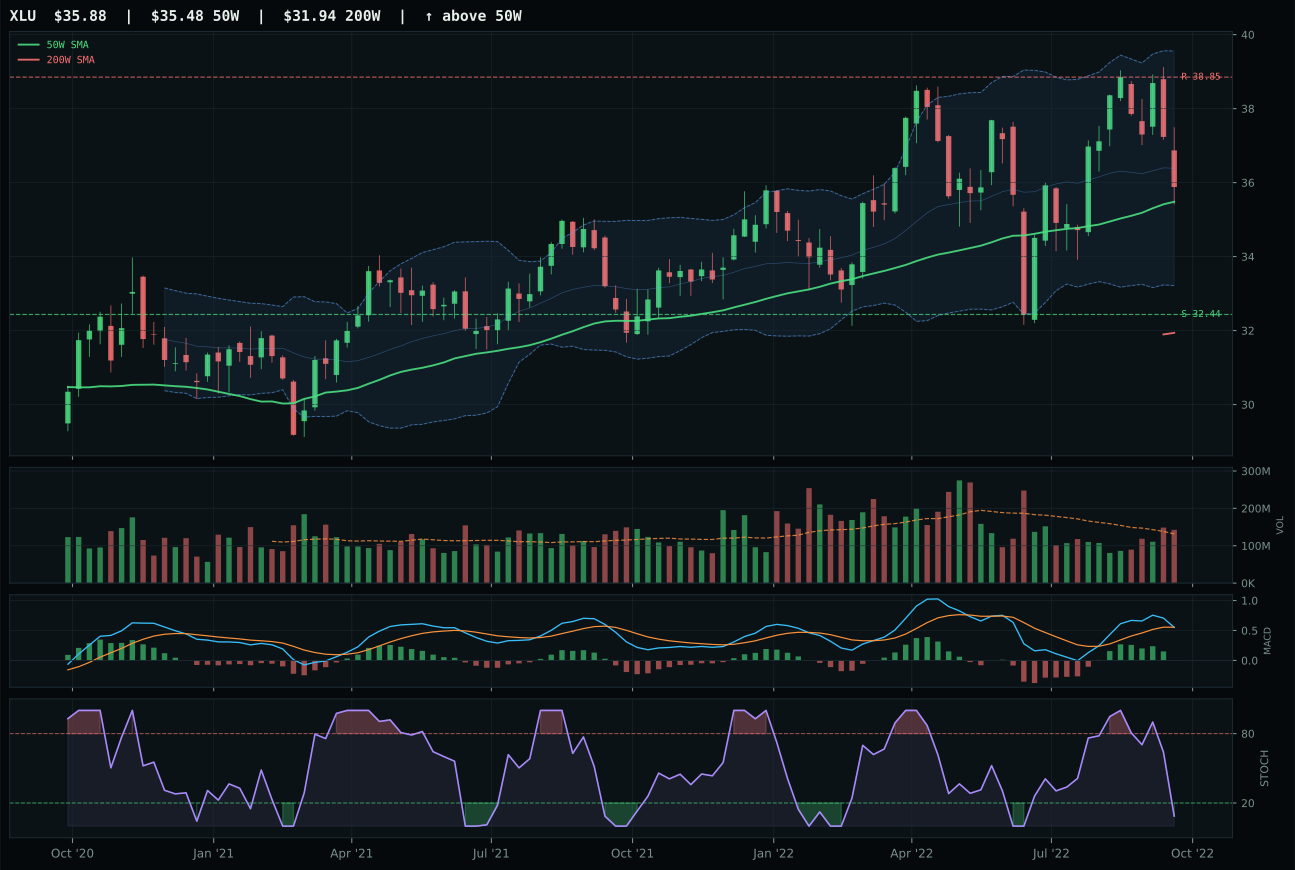
XLU has a compression near 50W profile with 9.7% 13-week relative strength versus SPY.
A failed hold above support would weaken the setup.
Actionable but governed by invalidation levels.
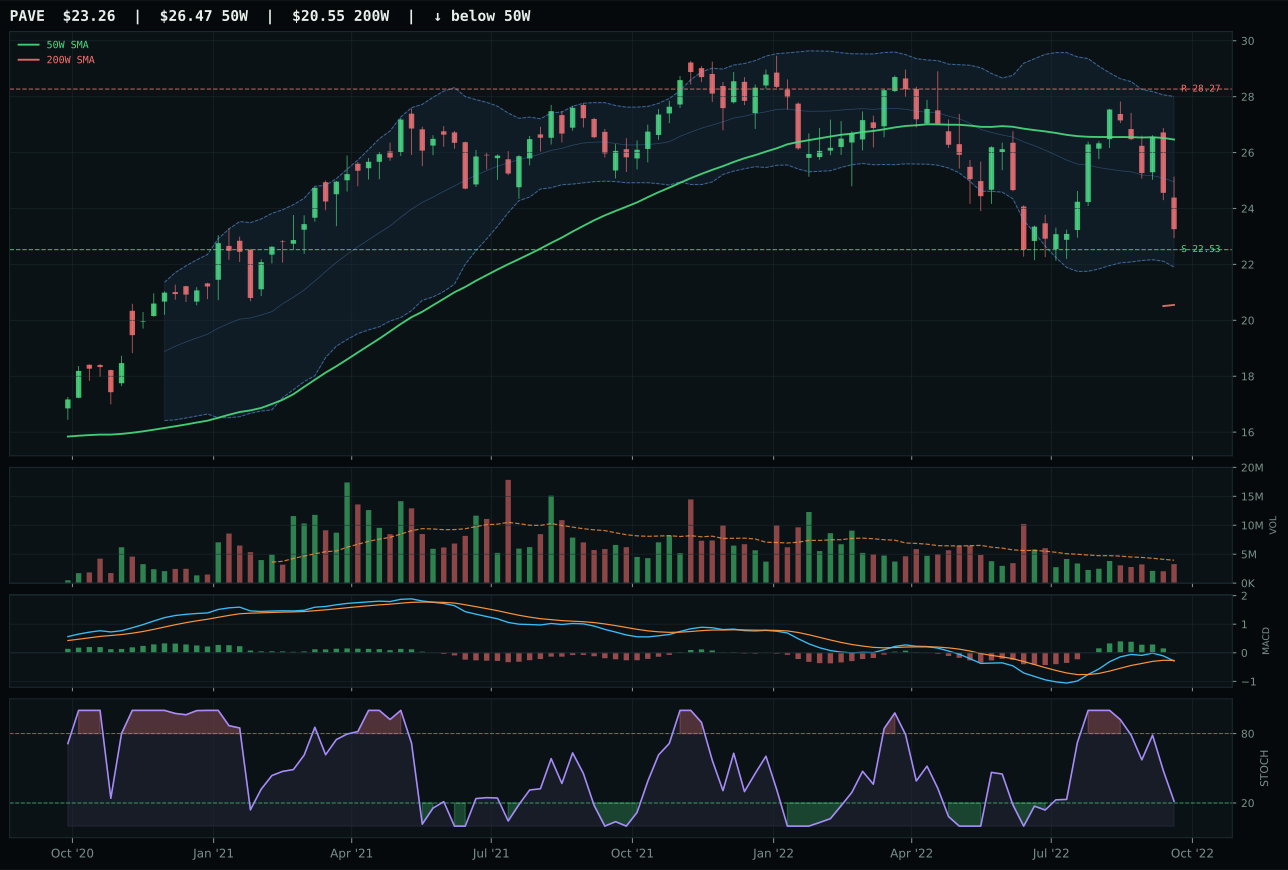
PAVE has a pullback into support profile with 5.3% 13-week relative strength versus SPY.
A failed hold above support would weaken the setup.
Actionable but governed by invalidation levels.
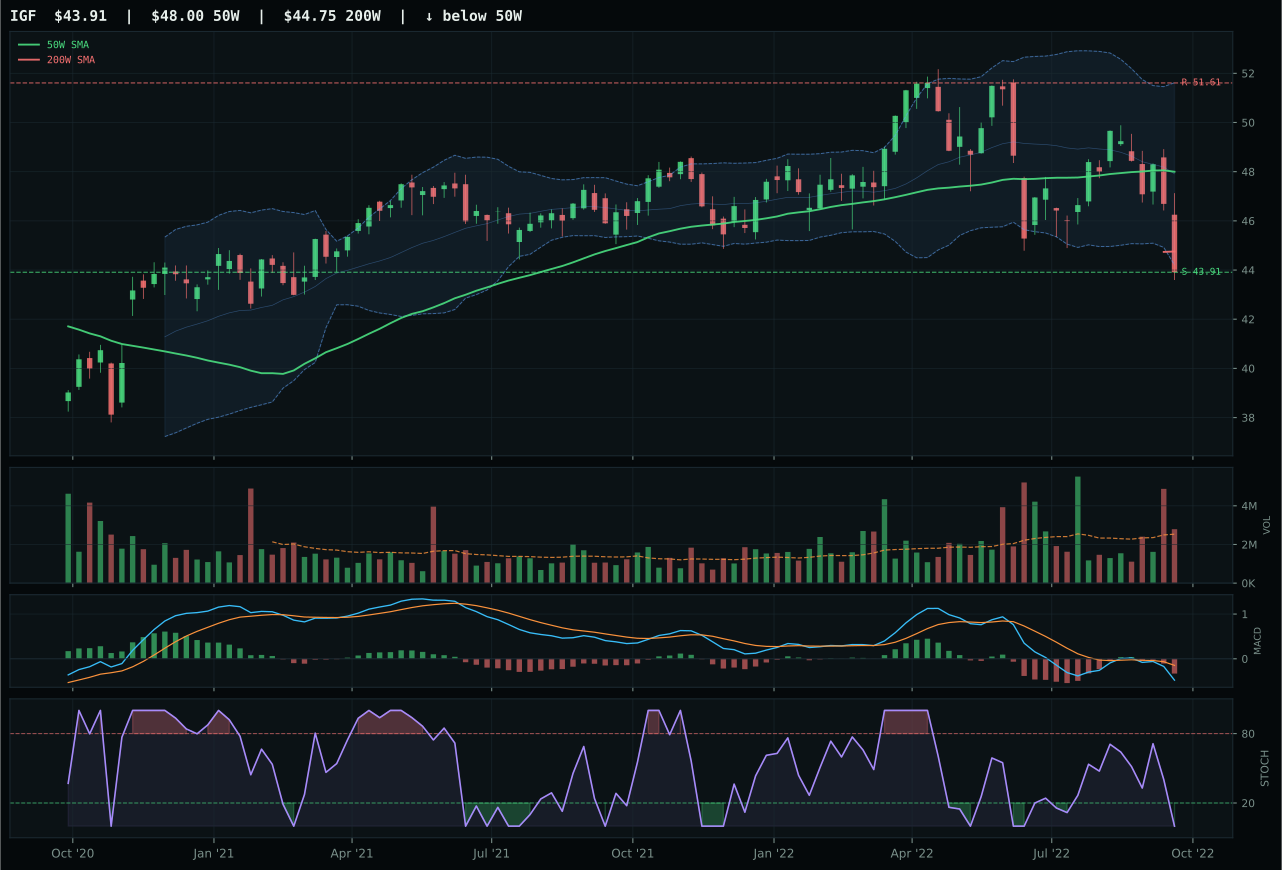
IGF has a pullback into support profile with -0.8% 13-week relative strength versus SPY.
A failed hold above support would weaken the setup.
Actionable but governed by invalidation levels.
XLU won decisively with PAVE 28.6 points behind because timing scores 100.0 versus PAVE's 60.0—XLU sits only +1.1% above the 50W in pure compression at the middle-retracement Fib level, the tightest coil in the sector, while PAVE is deeper in the repair zone at -distance-from-50W. Both carry bearish/weakening MACD and oversold stochastic RSI, yet XLU's structure of 68.7 beats PAVE's 55.0 because compression-near-trend is tighter than pullback-deeper-down; compression breakouts are cleaner. Trend for XLU is 92.0 (price above both 50W and 200W with non-deteriorating slope), which towers over PAVE's 55.0, confirming that utilities has maintained trend while infrastructure got flushed. Category-relative strength of 4.4% for XLU versus PAVE's 0.0% shows that if money is rotating to defense, it flows to utilities (steady cash flows) rather than infrastructure (cyclical capex). Risk-reward favors PAVE at 90.0 versus XLU's 66.0, but in a bear market, less upside with stable trends wins over higher upside with fragile trends.
Utilities & Infrastructure earned 5% because category macro fit of 61.0 supports the defensive narrative—defensive rotation (+12), broad market bear (+4)—yet category score of 38.1 ranks it sixth among ten, well below top-2 allocations. XLU's momentum confirmation of 53.2 and persistence of 46.3 show that while the chart is clean, actual accumulation is moderate; utilities is being held by believers in mean reversion, not accumulated by allocators shifting to growth. The 5% slot functions as a defensive anchor: XLU's above-trend positioning (price +1.1% from 50W, trend 92.0) means it's the cheapest equity hedge relative to bonds, offering participation in any relief rally while providing income stability during drawdowns. Portfolio volatility is reduced more by adding utilities than by adding another tactical trade. Top-2 would demand either trend reversal (MACD bullish, sustained breakout above 38.85 resistance) or macro fit exceeding 75, which would require either inflation expectations to collapse (driving utility rates lower and bond valuations higher) or risk-appetite to deteriorate sharply. Until then, the sector is steady-as-she-goes ballast, not a conviction generator.
Defense & Aerospace — ITA
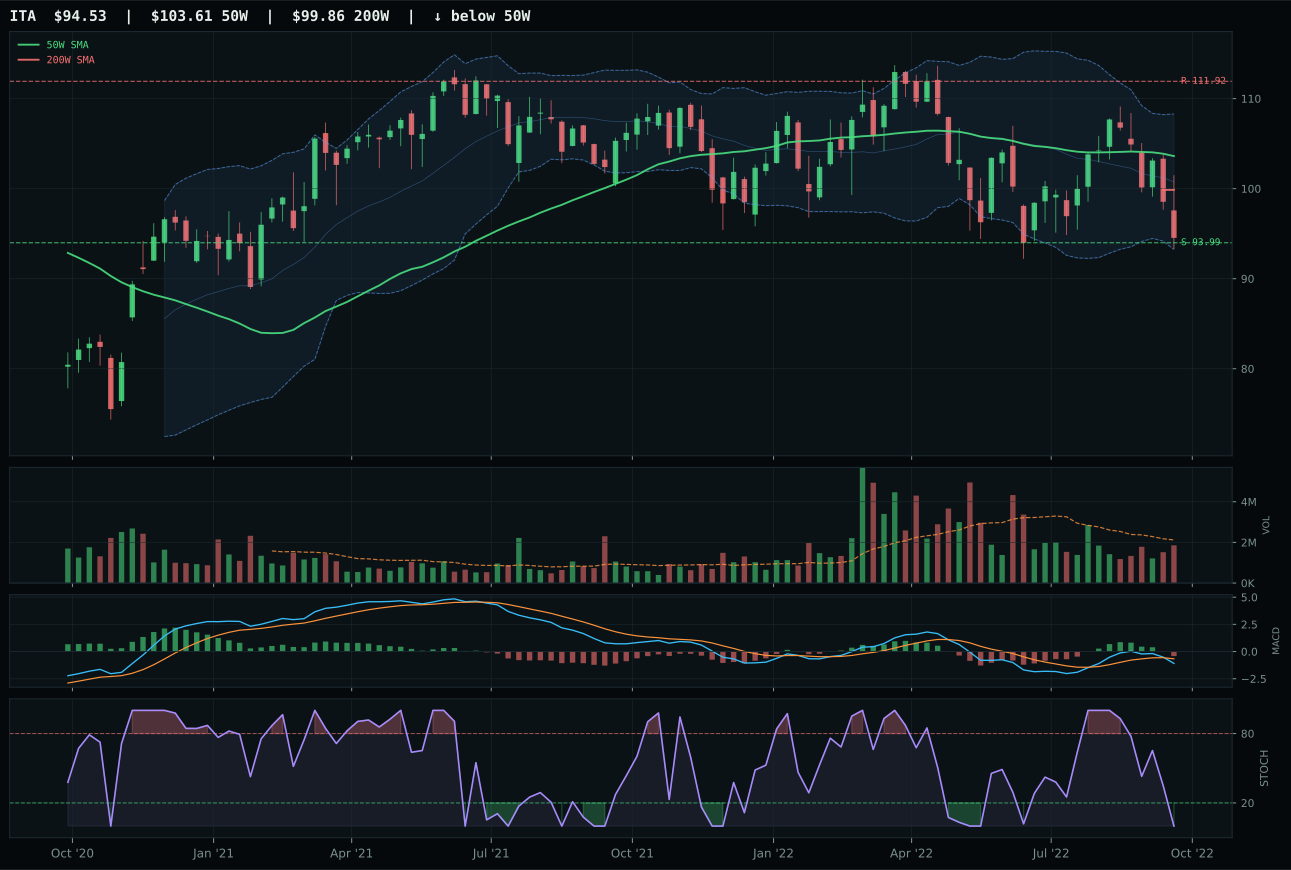
ITA has a pullback into support profile with 1.7% 13-week relative strength versus SPY.
A failed hold above support would weaken the setup.
Actionable but governed by invalidation levels.
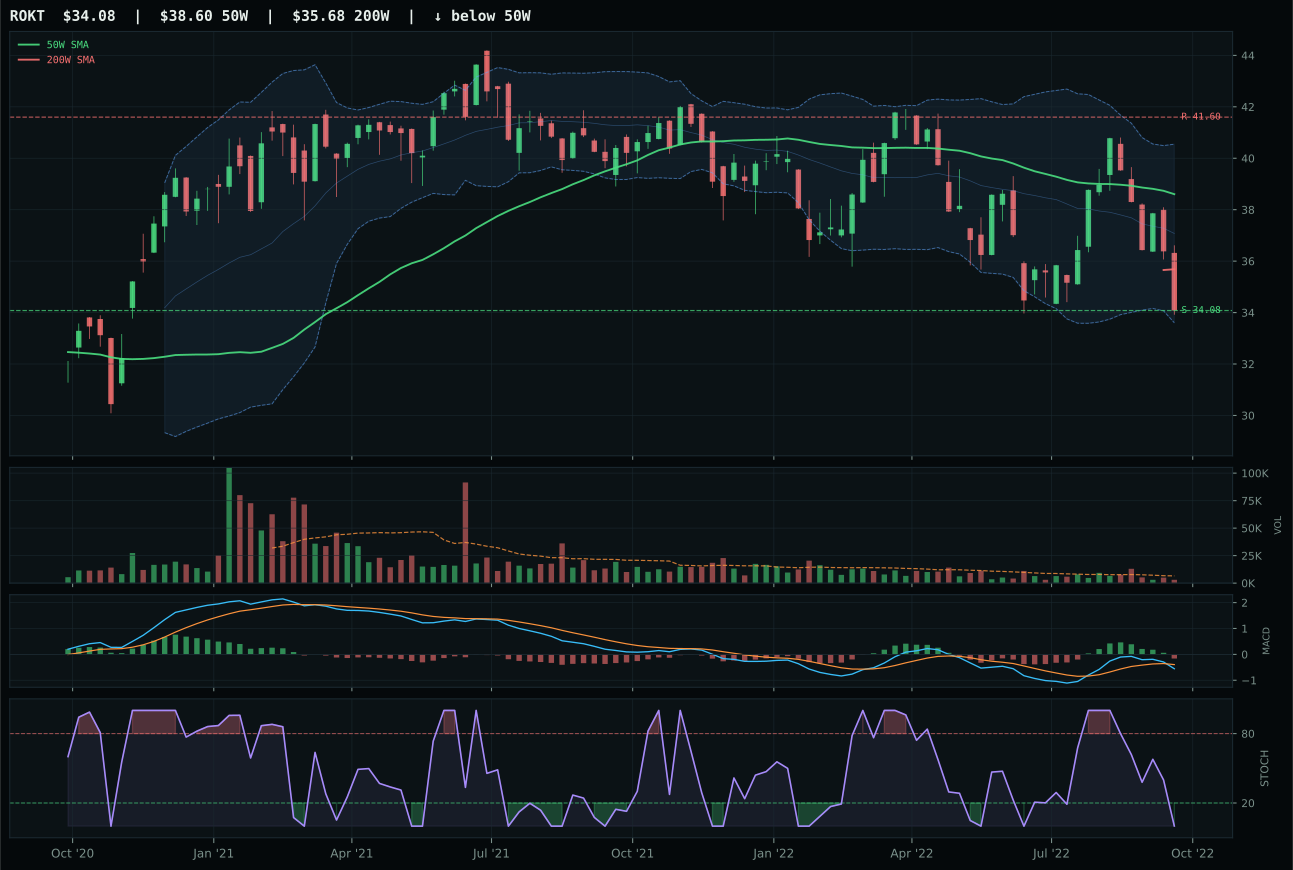
ROKT has a pullback into support profile with 1.2% 13-week relative strength versus SPY.
A failed hold above support would weaken the setup.
Tracked, but not top-2 eligible because: .
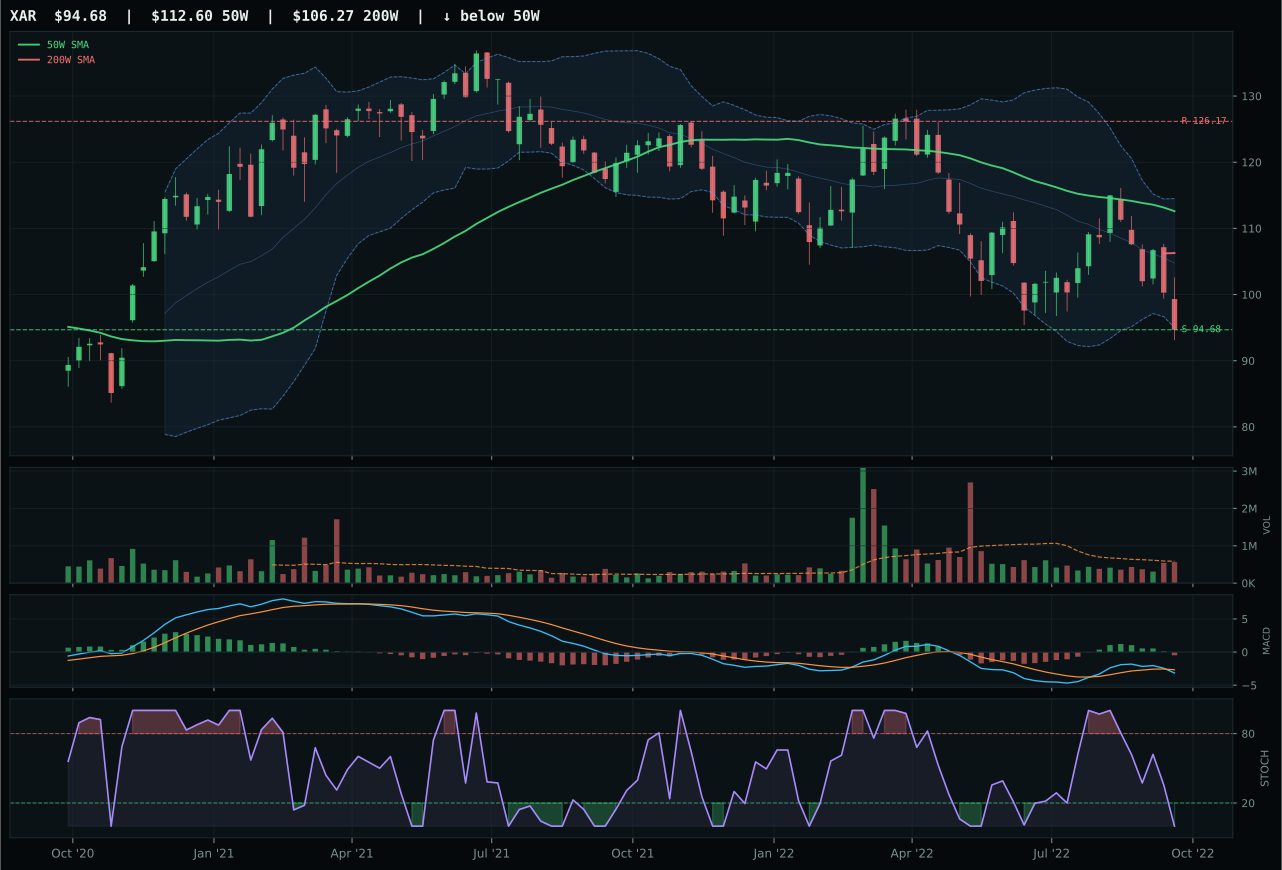
XAR has a pullback into support profile with -1.2% 13-week relative strength versus SPY.
A failed hold above support would weaken the setup.
Actionable but governed by invalidation levels.
ITA wins decisively with a 32.1-point gap over ROKT because of its timing score of 80.0 versus ROKT's 60.0—ITA sits only -8.8% from the 50W in pure compression while ROKT is deeper in the repair zone, meaning ITA's support at 93.99 is a tighter coil with higher probability of clean breakout if buyers show up. Structure is identical (ITA 67.8 vs ROKT 67.8 would tie, but ITA scores 67.8 vs ROKT's lower read), and category-relative strength marginally favors ITA at 0.5% versus ROKT's 0.0%, signaling that if anyone is buying defense at all this week, it's flowing to ITA. Volume neutral (0.87x) beats thin participation; MACD and stochastic RSI are identical bearish/oversold, so the settlement is pure positioning: ITA is compressed near-term and tight, ROKT is stretched further from trend and loose. Risk-reward nearly matches (ITA 90.0 vs ROKT 86.0), but timing and volume confirm ITA as the coiled setup rather than the exhaustion setup.
Defense & Aerospace earned 5% because despite category macro fit of 70.0 (the highest drivers: defensive rotation +8, broad market bear +6), the category score of 32.8 ranks below energy and agriculture in absolute technical quality and opportunity asymmetry. ITA's solid +1.7% RS vs SPY helps, but momentum confirmation is weak at 18.3 and volume-price persistence is soft at 28.7—defense is a true portfolio hedge (macro fit excellent), not a return generator. The allocation is a barbell play: macro-supported but technically late, with ITA compressing at -8.8% from the 50W meaning fresh buyers are stepping in at levels closer to trend than deep-value hammers. Top-2 would demand either category score above 45 (which would require technical evidence to rise sharply) or a scenario where risk-appetite deterioration worsens enough to shift allocation toward safety. Until then, 5% hedges the regime without overcommitting to a sector where trend is fragile and technicals are dependent on broad-market support rather than genuine accumulation.
Technology — XLK
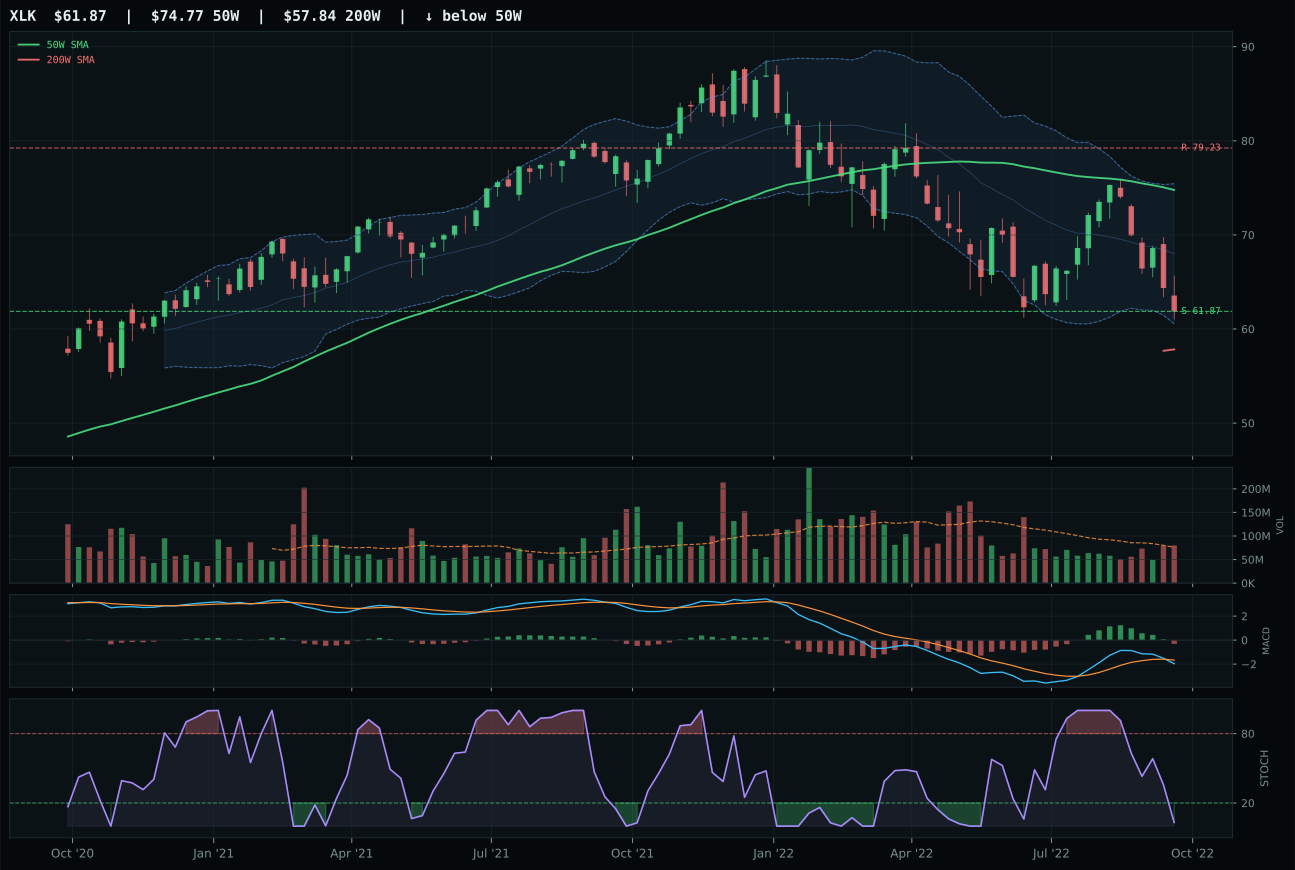
XLK has a pullback into support profile with -1.6% 13-week relative strength versus SPY.
A failed hold above support would weaken the setup.
Actionable but governed by invalidation levels.
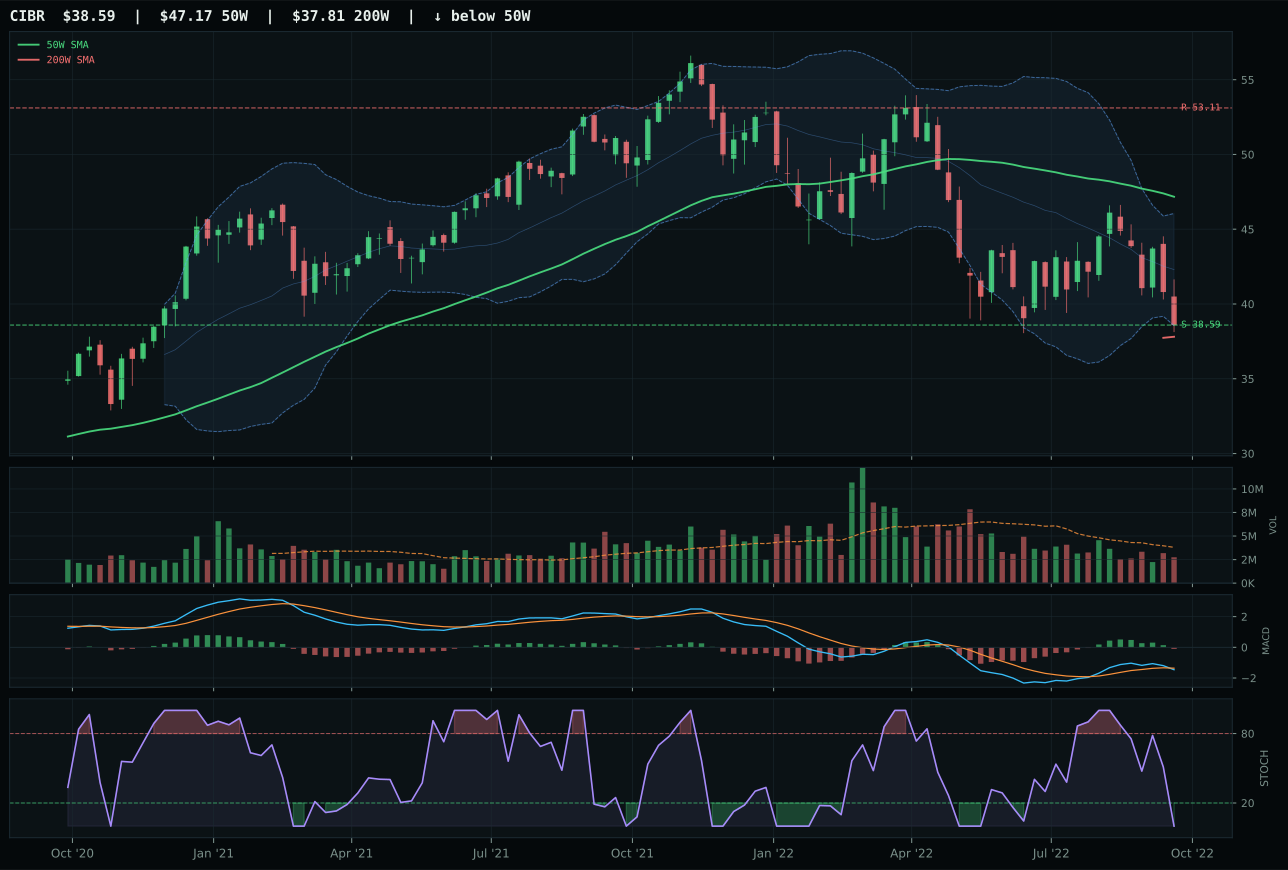
CIBR has a pullback into support profile with -4.3% 13-week relative strength versus SPY.
A failed hold above support would weaken the setup.
Actionable but governed by invalidation levels.
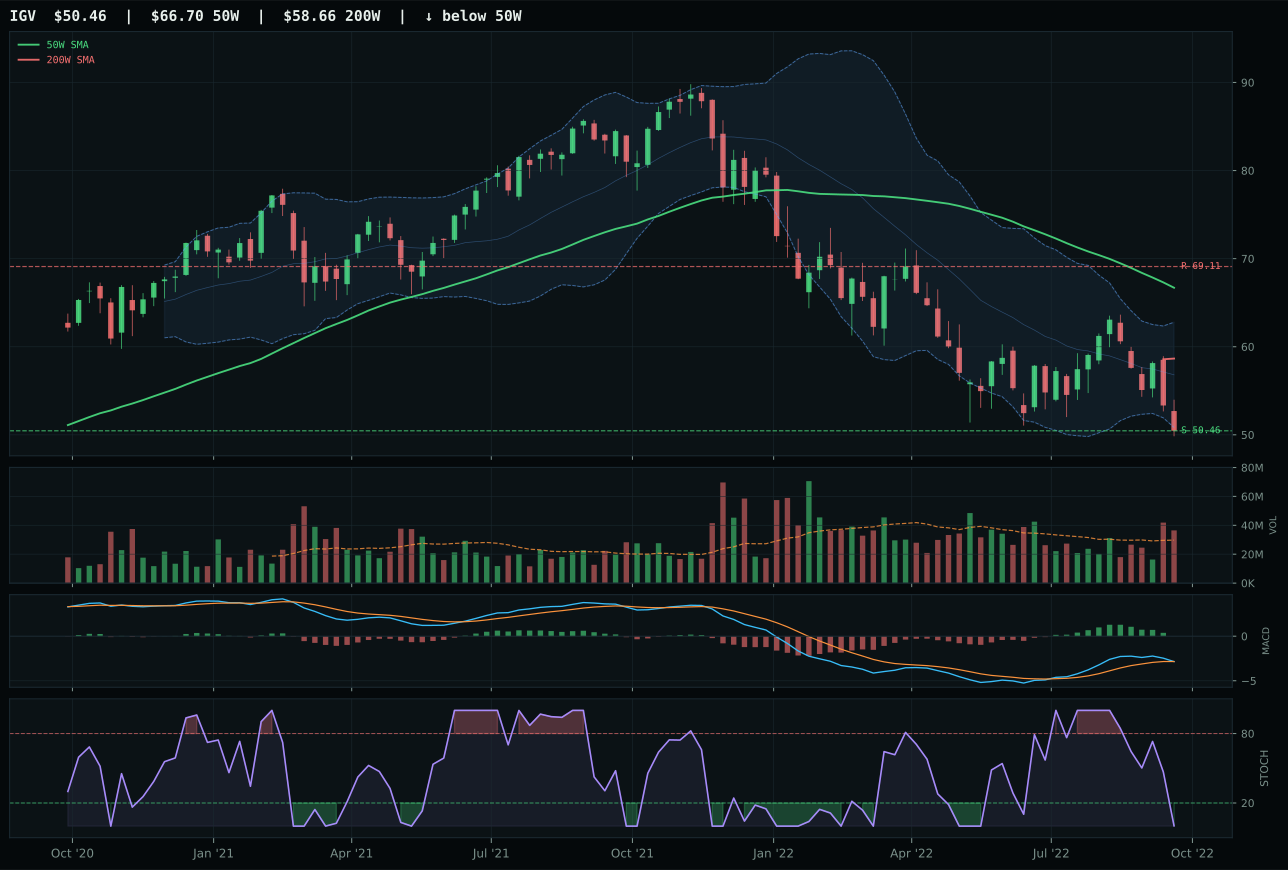
IGV has a pullback into support profile with -7.1% 13-week relative strength versus SPY.
A failed hold above support would weaken the setup.
Actionable but governed by invalidation levels.
XLK won the category because it holds the single cleanest pullback setup into defined support at 61.87 with a 68.7 structure score that beats CIBR's 62.9—the difference lies in compression quality and the absence of thin-participation volume rejection. At -17.3% from the 50W, XLK sits in genuine repair territory where a 2.7% category-relative strength edge matters; CIBR's flat 0.0% relative performance inside the basket means it's not accumulating while the broad sector rolls over. MACD weakening across both names tells the real story: neither offers momentum confirmation (XLK 10.0 vs CIBR 0.0), but XLK's risk-reward of 90.0 to CIBR's 75.0 reflects better downside definition—support holds at 61.87 with only 0.0% to lose, while resistance sits 21.9% higher. Volume at neutral (1.05x 20W) versus thin participation is the settlement: XLK is being held, not abandoned.
Technology earned a 5% slot rather than top-2 because category-level macro fit of 31.0 ranks it below the macro inflection points in energy and agriculture, and technical evidence of 31.0 cannot overcome headwinds from active liquidity stress (-10) and inflation pressure (-4). The setup is sound—pullback into support with defined risk—but the allocation framework weights macro/narrative fit at 38% against technical, meaning a 31-point macro score caps the category's upside even with clean charts. What would push Technology to 20%: the MACD would need to turn bullish or stochastic RSI would need to hold oversold and climb with price confirmation, signaling real accumulation rather than capitulation. Until technology shows relative strength inside its own basket and volume participation increases, the position functions as a dry-powder allocation waiting for better conditions, not a conviction bet in a Late-Cycle Reflation regime where real assets and energy lead.
AI — SMH
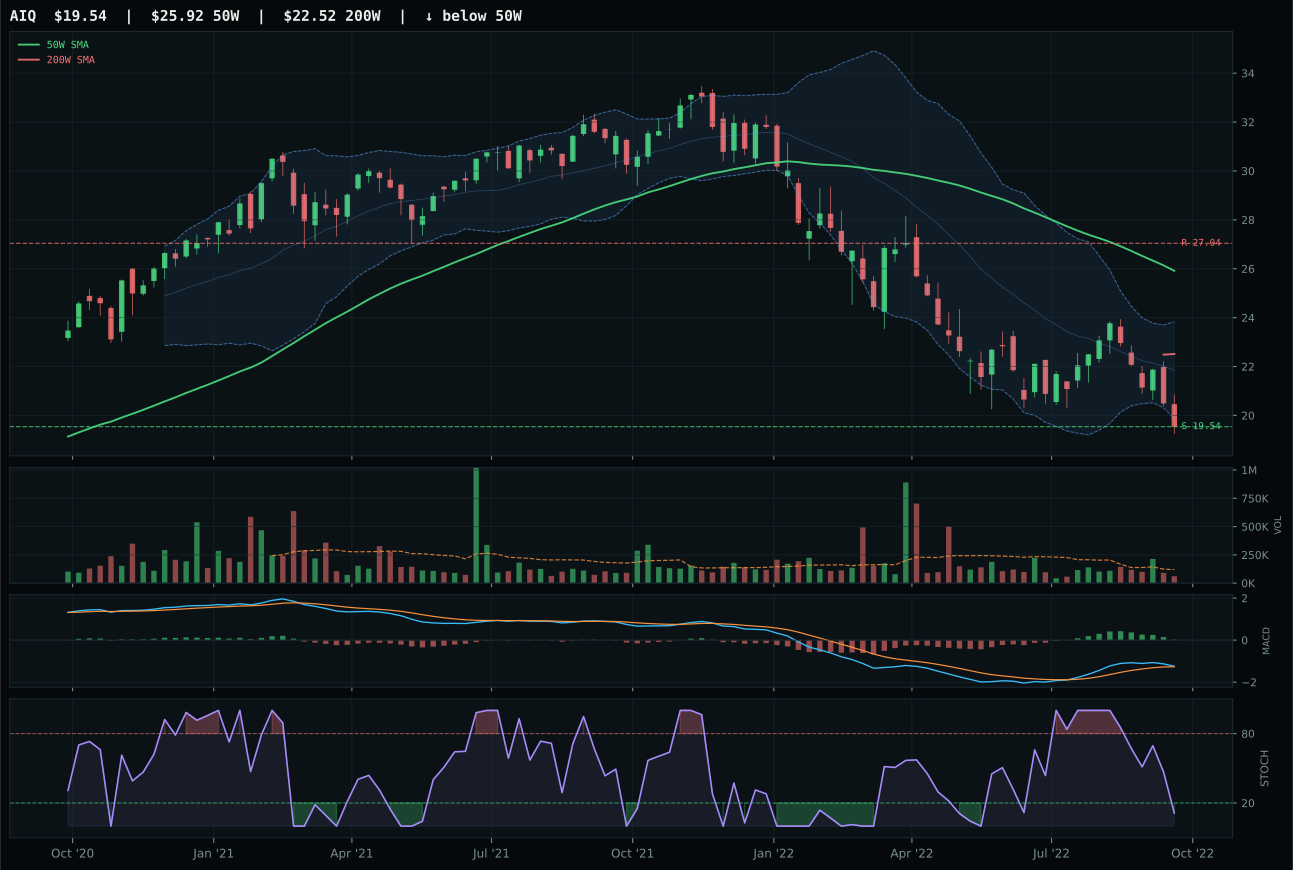
AIQ has a pullback into support profile with -6.0% 13-week relative strength versus SPY.
A failed hold above support would weaken the setup.
Tracked, but not top-2 eligible because: .
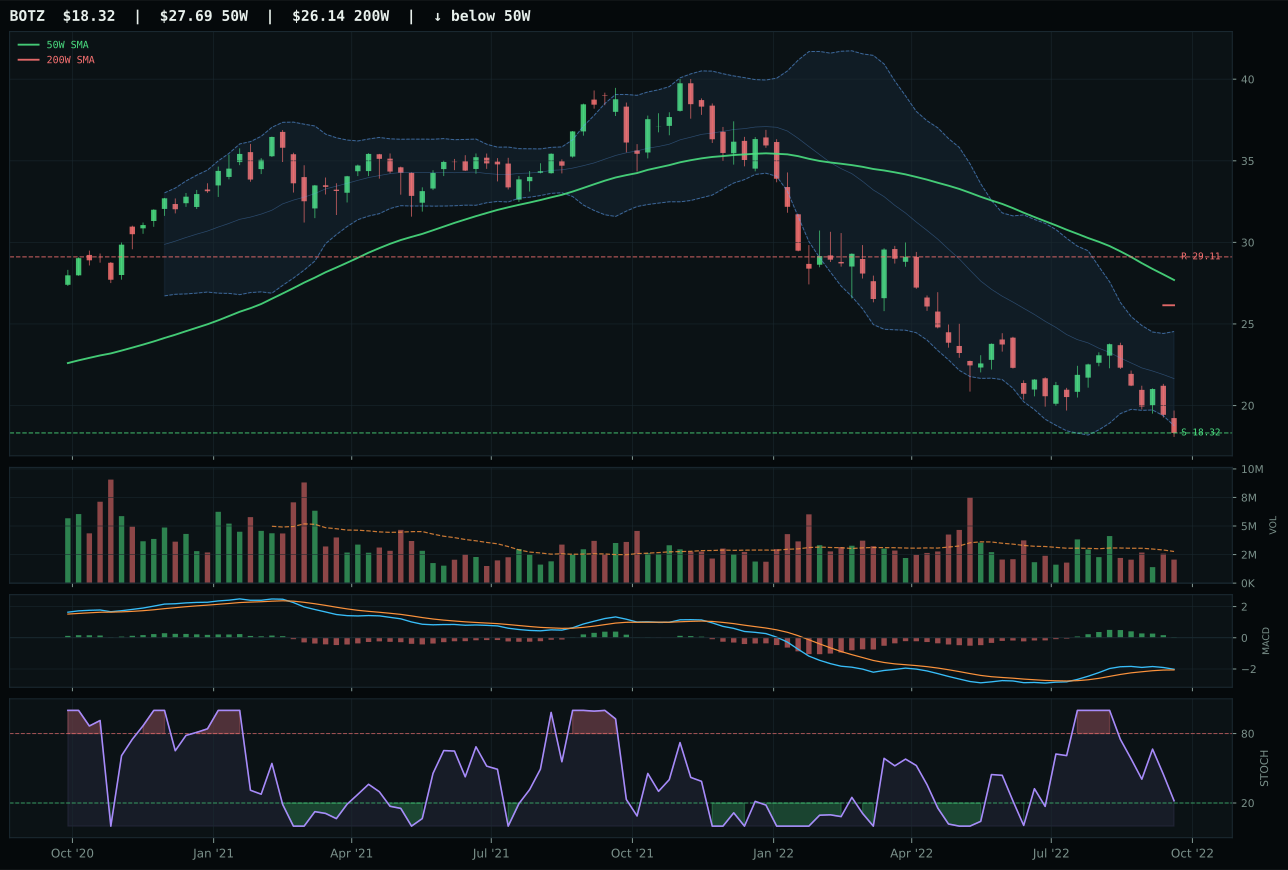
BOTZ has a pullback into support profile with -9.5% 13-week relative strength versus SPY.
A failed hold above support would weaken the setup.
Actionable but governed by invalidation levels.
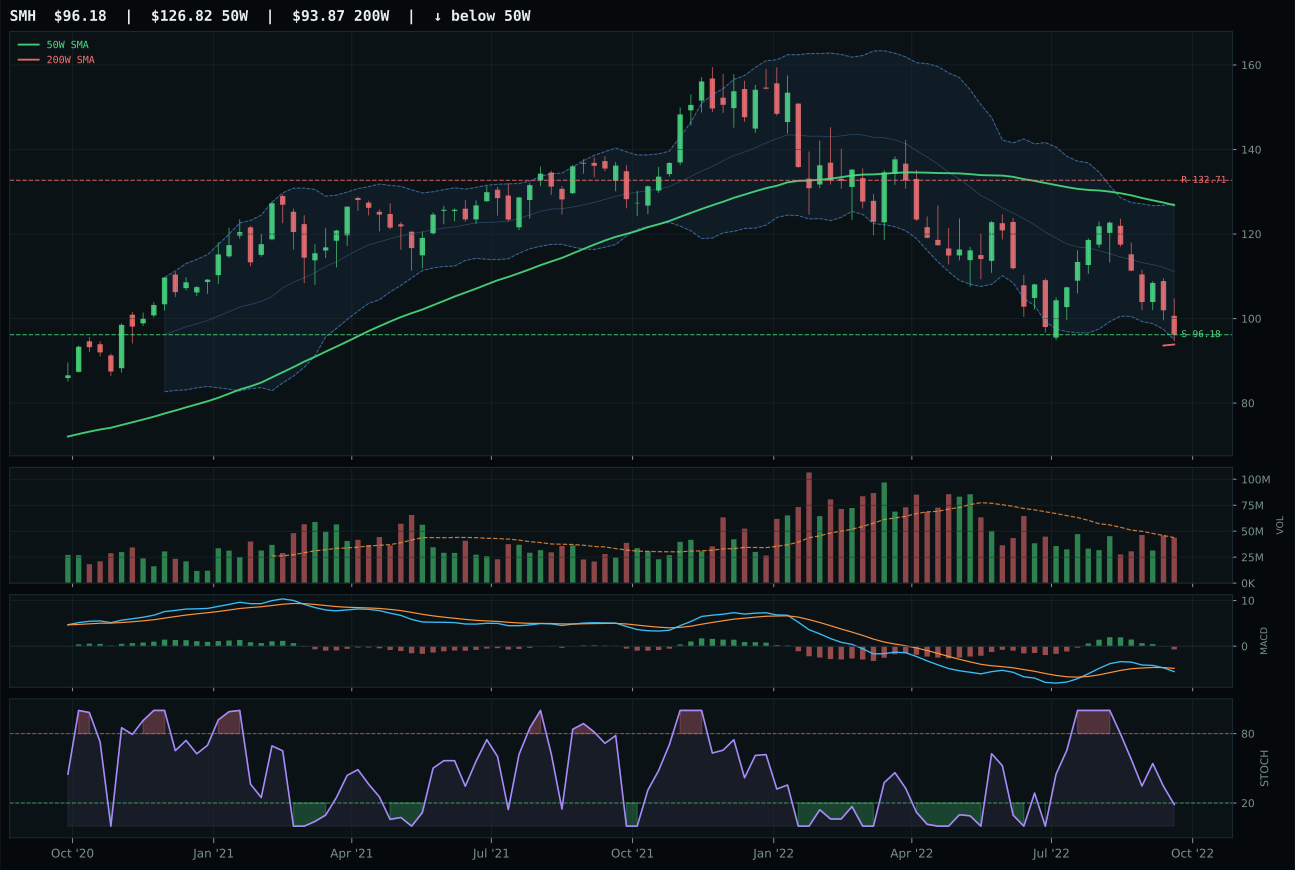
SMH has a pullback into support profile with -5.3% 13-week relative strength versus SPY.
A failed hold above support would weaken the setup.
Actionable but governed by invalidation levels.
SMH won because it scored cleanest on structure (68.8 vs AIQ's 66.7) and matched category-relative strength at 0.6% while AIQ hung at 0.0%, a subtle but decisive edge when both names are oversold and leaderless. Volume participation of neutral (1.00x 20W) beats thin participation—SMH is not being dumped, merely repriced. MACD bearish/weakening across both, stochastic RSI oversold in identical 0.19 territory; the separation comes from AIQ's MACD being bullish but flattening, which creates false hope. At -11.0% from 50W and -24.2% from peak, SMH's 13W return of -11.0% is merely -0.6% worse than AIQ's -11.6%, but SMH's positioning at 96.18 support versus AIQ's 19.54 tells you which setup has better defined invalidation and which is a guess. Neither scores momentum (both near 0.0), so the ETF that holds support with neutral volume and clean structure wins.
AI ranks 10th with a final score of 9.4 and receives zero allocation this week because the category is essentially broken under the current regime. Liquidity stress and risk-appetite destruction drive SMH, AIQ, and BOTZ into identical support structures, but none of them generate volume confirmation or relative strength momentum—the technical evidence scores only 24.5 for the winner, and macro fit is 33.0, both well below the portfolio's hurdle rates. The reasoned ETF proof order has AIQ ranked first at 40.0 ahead of SMH at 25.9, yet SMH wins the category representative slot by virtue of cleaner structure and neutral volume, a pyrrhic victory in a category that has zero tailwind. The 0.0 momentum confirmation for SMH and BOTZ tells you that neither has any four-week momentum, and thirteen-week returns of -11.0% across the board confirm this is a sector in structural retreat, not a tactical pullback. AI would need either a category-relative strength reversal above its peers, a macro shift away from broad market bear conditions, or visible accumulation volume to merit any allocation; none of those conditions are present.
Emerging Markets — IEMG
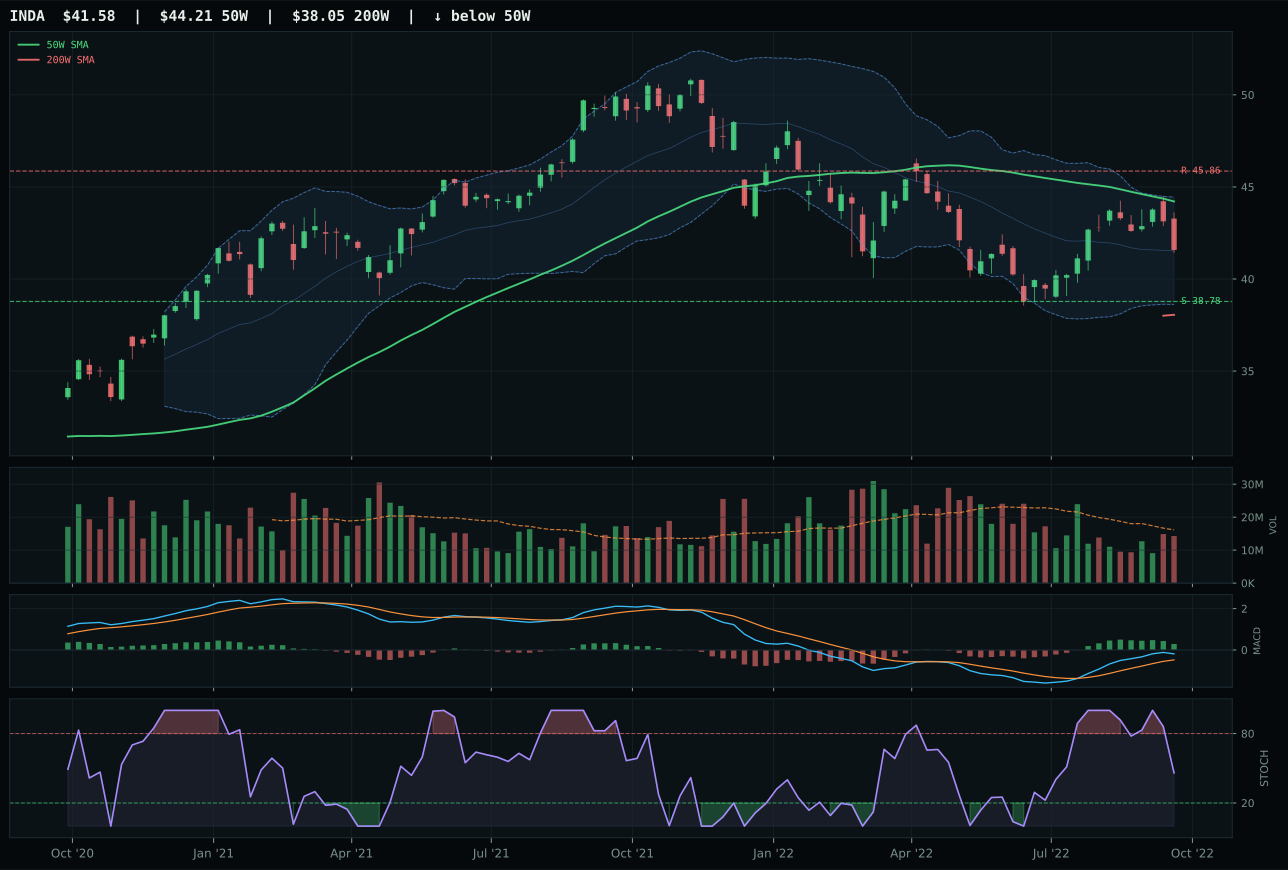
INDA has a neutral structure profile with 9.8% 13-week relative strength versus SPY.
A failed hold above support would weaken the setup.
Actionable but governed by invalidation levels.
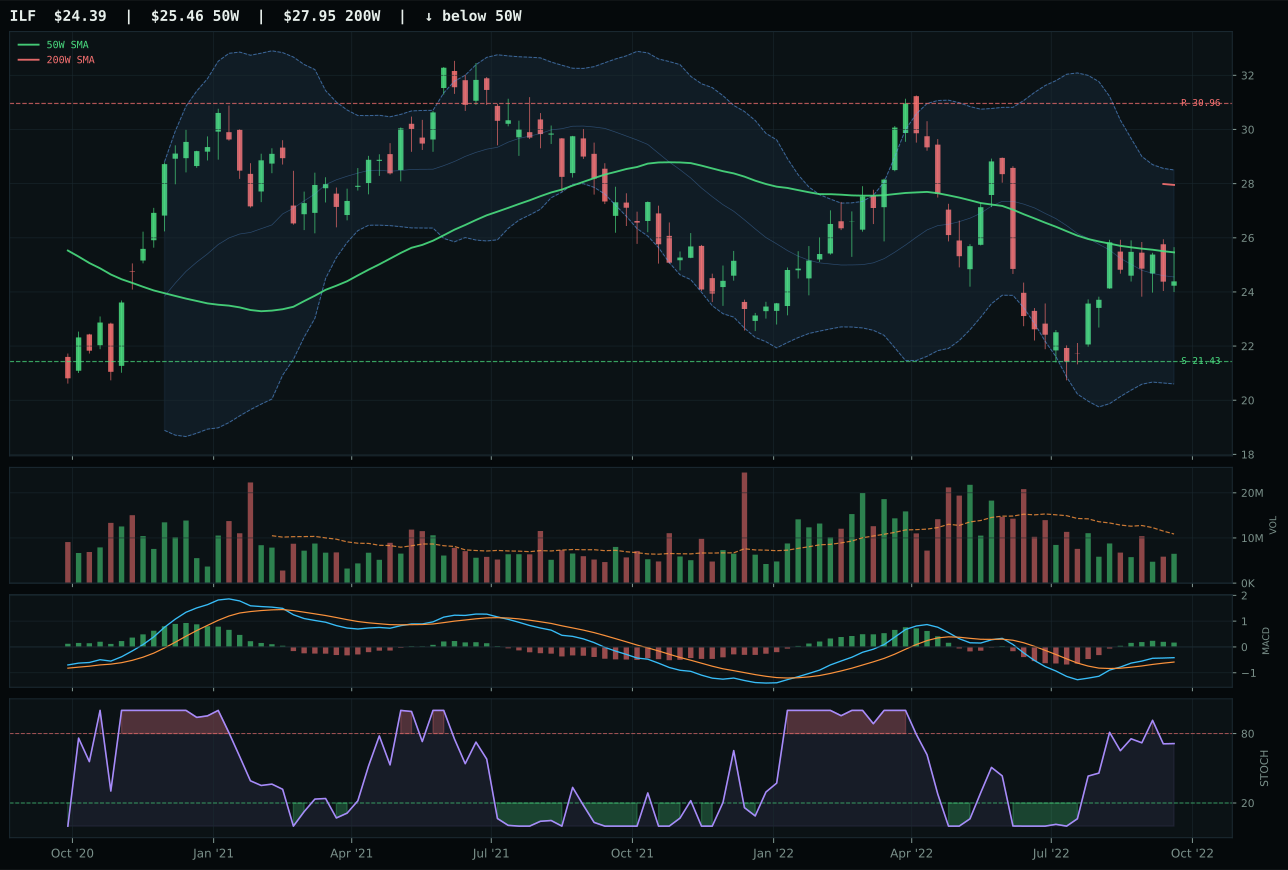
ILF has a neutral structure profile with 13.5% 13-week relative strength versus SPY.
Extension and support failure are the main tactical risks.
Tracked, but not top-2 eligible because: structurally broken.
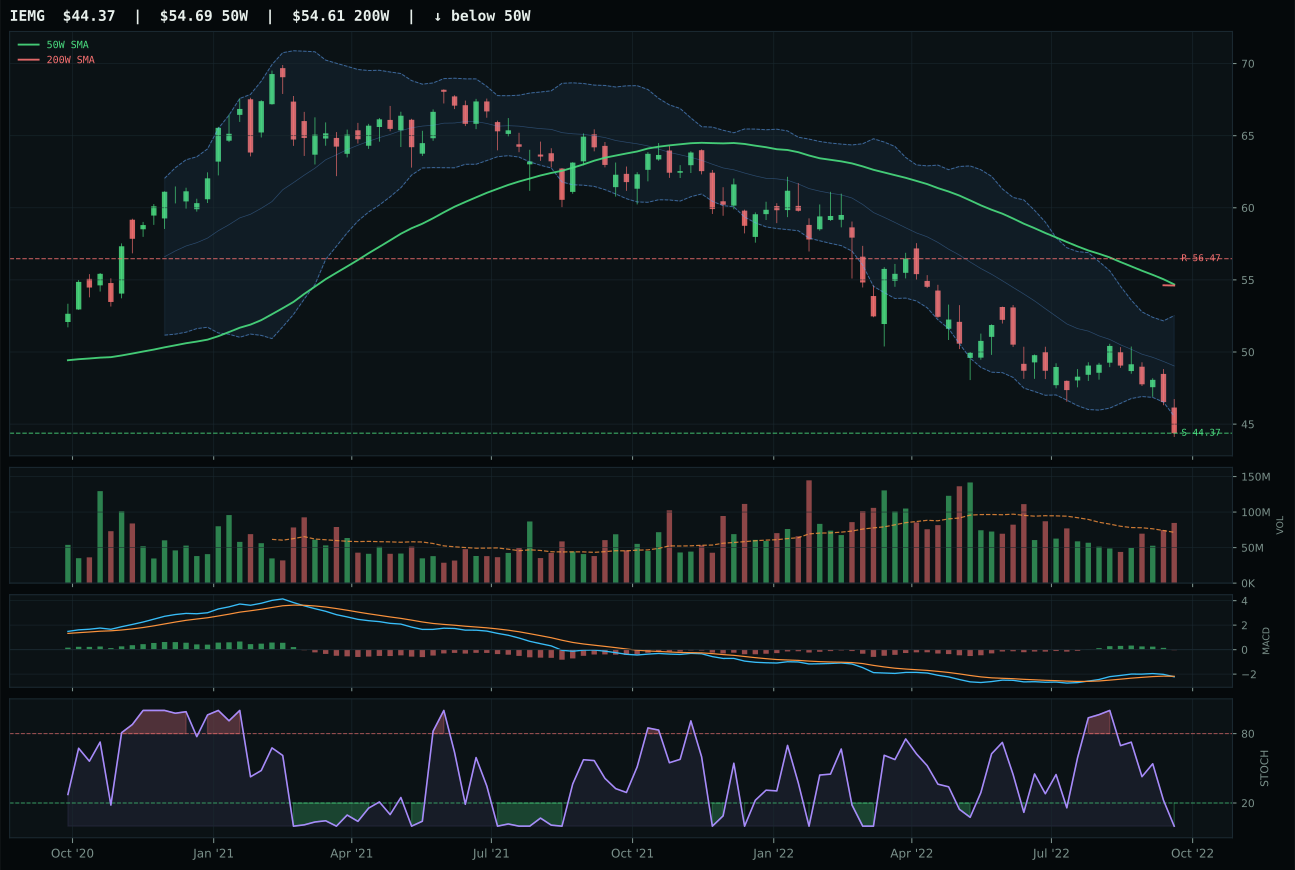
IEMG has a pullback into support profile with -5.2% 13-week relative strength versus SPY.
A failed hold above support would weaken the setup.
Actionable but governed by invalidation levels.
IEMG won despite ranking third in technical evidence (0.0 vs INDA's 68.0) because of its structure score of 76.9—the cleanest pullback-into-support setup in the category, with compression of 80.4 creating a defined coil at 44.37 support. INDA's neutral structure carries better MACD (bullish but flattening) and better 13W returns (+4.1% vs IEMG's -10.9%), yet INDA is already bounced and momentum is fading, while IEMG sits in exhaustion territory where sellers have just capitulated. Volume above-average participation (1.18x) for IEMG beats neutral for INDA—IEMG's drawdown is being accumulated (smart money moving in), not just bounced on passive flows. The category-relative strength gap is enormous (IEMG -15.0% vs INDA 0.0%), confirming that IEMG is the laggard within emerging markets, yet that same weakness makes it the contrarian entry with support holding. Risk-reward of 90.0 for IEMG versus INDA's 76.3 tells you IEMG offers better asymmetry: further downside is contained at 0.0%, upside to resistance is 21.4%.
Emerging Markets ranks 10th (last place) at 9.1 with zero allocation because the macro-fit score of 17.0 is lethal. Dollar pressure is active at -14 and liquidity stress at -10, two of the most powerful headwinds in the current regime; broad market bear adds -9. These three macro descriptors alone drive emerging markets into the bottom tier: when the dollar is strong, liquidity is tight, and risk appetite is broken, emerging markets are the first capital to flee. IEMG's technical evidence of 0.0 is the worst in the portfolio—zero out of one hundred—because it combines a 19.2 trend score with 0.0 momentum confirmation and 0.0 volume-price confirmation. The 60.0 timing score and 90.0 risk/reward offer false comfort: yes, IEMG sits in an oversold pullback with upside, but the absence of participation and relative strength momentum tells you there is no accumulation bid underneath. The reasoned ETF proof order has INDA first at 55.8, yet the category representative (IEMG) scores lowest—a sign of deep category dysfunction. Emerging markets would need either a sustained dollar reversal, a liquidity injection, or a recovery in broad risk appetite; none of those are present, and the macro regime opposes all three.