
2022-09-16
Informational purposes only. The content in this report, including allocations, analysis, and commentary, is provided solely for informational and educational purposes. It does not constitute financial advice, investment advice, trading advice, or any other type of advice. Past performance does not guarantee future results. Always conduct your own research and consult a qualified financial professional before making investment decisions.
XLE defensive overlay excluded: price is below its 8W SMA. Cause selector will use GLD or cash alternative.
GLD defensive overlay excluded: price is below its 8W SMA. Cause selector will use cash alternative.
Fast-crash circuit breaker triggered: SPY dropped more than 8% from its 4-week high this week. Defensive overlay activated immediately.
Macro risk engine requires the 50% Defensive overlay for this run; payload selected by cause: Transition Defense.
Weekly Allocation
| Ticker | Category | Weight | Role |
|---|---|---|---|
| SGOV | 20% | Overlay | |
| GLD | Precious Metals | 20% | Overlay |
| XLU | Utilities & Infrastructure | 20% | Overlay |
| XLE | Traditional Energy | 10% | Top-2 (10%) |
| URNM | Nuclear Energy | 10% | Top-2 (10%) |
| WEAT | Agriculture & Livestock | 5% | Tier-2 (5%) |
| ITA | Defense & Aerospace | 5% | Tier-2 (5%) |
| COPX | Industrial Metals | 5% | Tier-2 (5%) |
| CIBR | Technology | 5% | Tier-2 (5%) |
Trade Instructions — Monday Open
Sell the tranche from 2022-08-19 (completing its 4-week hold). Buy the new tranche. Instructions show net portfolio changes — same-asset positions cancel, weight changes show the delta.
| Action | Ticker | Instruction |
|---|---|---|
| SELL | GLD | Sell 6% of GLD position (reduce 21.25% → 20.00%) |
| SELL | XLU | Sell 5% of XLU position (reduce 25.00% → 23.75%) |
| SELL | XAR | Sell entire XAR position (1.25% of portfolio) |
| SELL | XLK | Sell entire XLK position (1.25% of portfolio) |
| SELL | URA | Sell entire URA position (1.25% of portfolio) |
| SELL | SMH | Sell 50% of SMH position (reduce 2.50% → 1.25%) |
| SELL | XOP | Sell entire XOP position (1.25% of portfolio) |
| SELL | REMX | Sell entire REMX position (1.25% of portfolio) |
| BUY | ITA | Buy ITA — 12.50% of freed cash (adds 1.25% to portfolio) |
| BUY | URNM | Buy URNM — 25.00% of freed cash (adds 2.50% to portfolio) |
| BUY | CIBR | Buy CIBR — 12.50% of freed cash (adds 1.25% to portfolio) |
| BUY | COPX | Buy COPX — 12.50% of freed cash (adds 1.25% to portfolio) |
| BUY | XLE | Buy XLE — 25.00% of freed cash (adds 2.50% to portfolio) |
| BUY | WEAT | Buy WEAT — 12.50% of freed cash (adds 1.25% to portfolio) |
Current Portfolio After Trade
Combined holdings across all 4 active tranches. Each tranche is 25% of the portfolio.
| Ticker | % of Portfolio | Weight Bar |
|---|---|---|
| XLU | 23.75% | |
| SGOV | 20.00% | |
| GLD | 20.00% | |
| URNM | 7.50% | |
| ITA | 5.00% | |
| CIBR | 5.00% | |
| XLE | 5.00% | |
| COPX | 3.75% | |
| MOO | 2.50% | |
| GDX | 2.50% | |
| WEAT | 2.50% | |
| SMH | 1.25% | |
| PICK | 1.25% |
Macro Regime — Late-Cycle Reflation
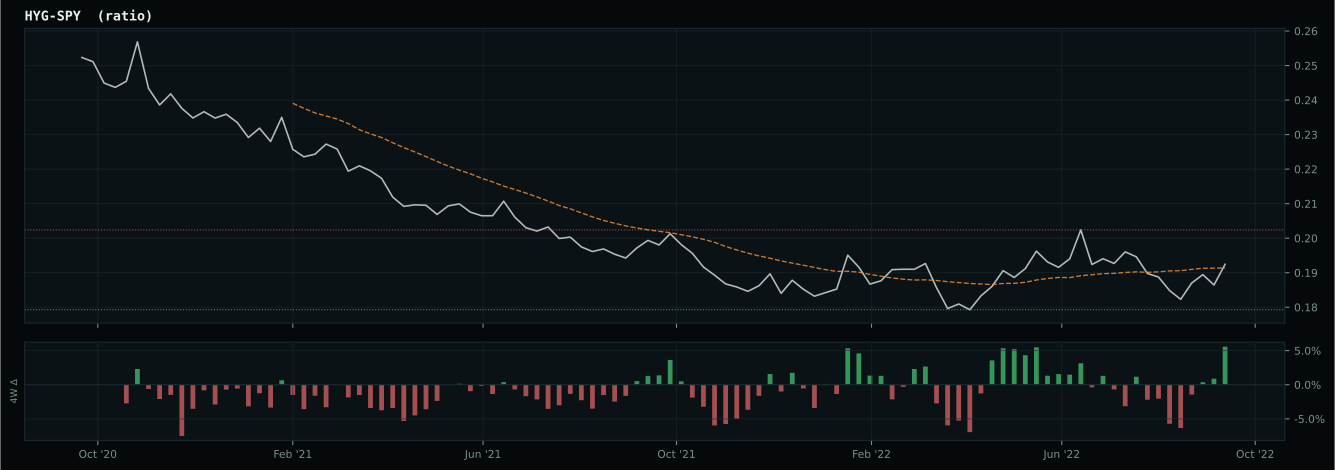
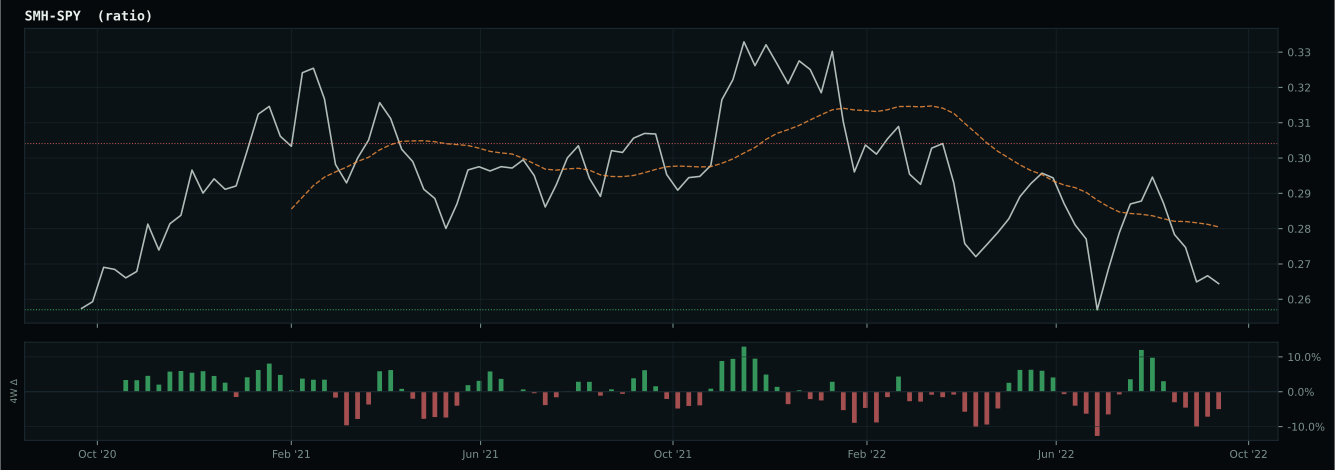
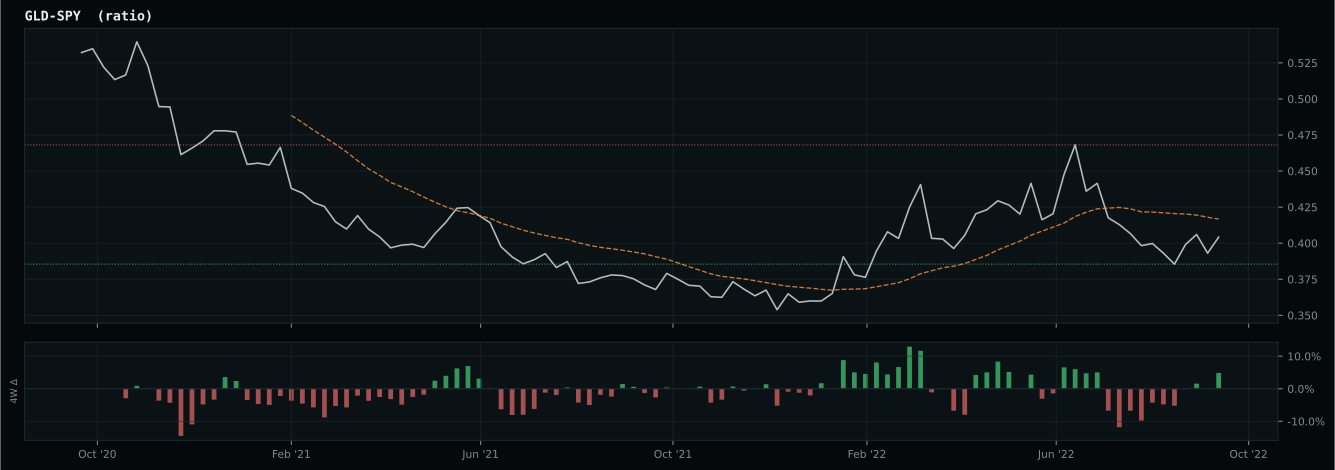
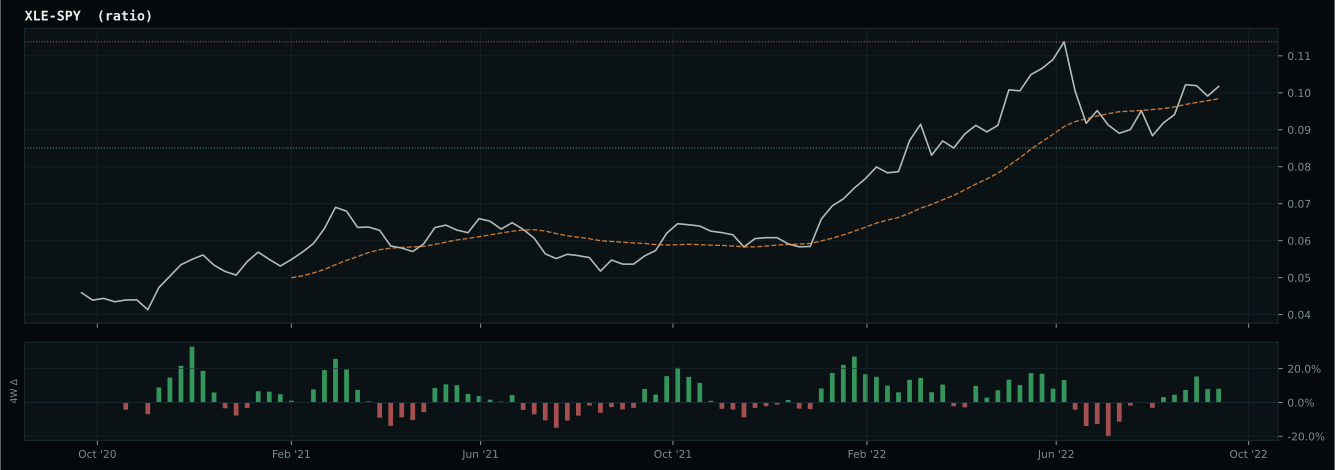
growth data is not confirming the weak market-implied risk appetite signal
Defensive overlay cause is not singular enough to concentrate: the sleeve diversifies across liquidity, monetary defense, and defensive equity exposure while the market resolves the next regime.
Macro Evidence Charts
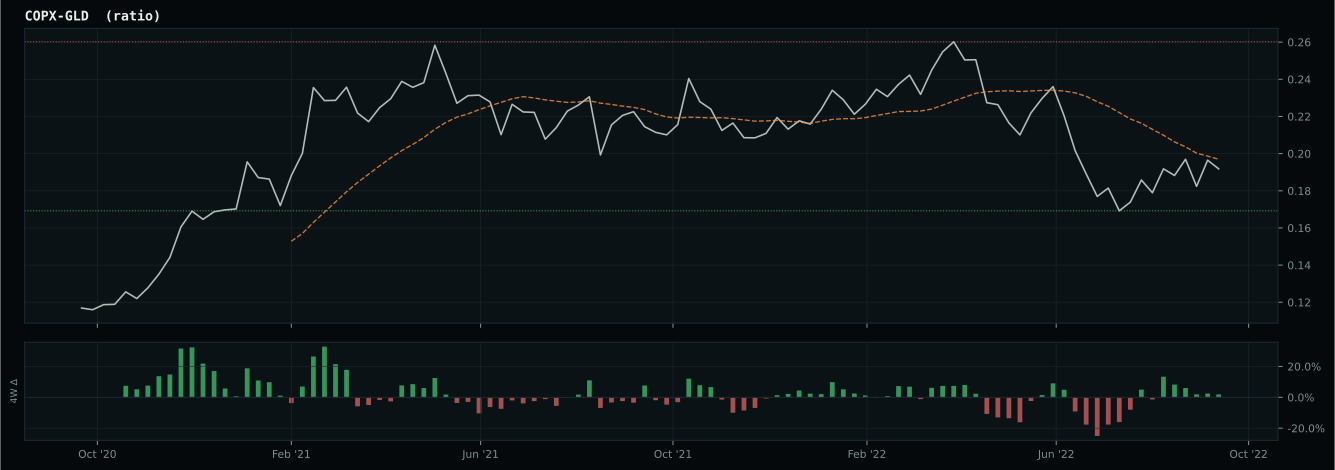
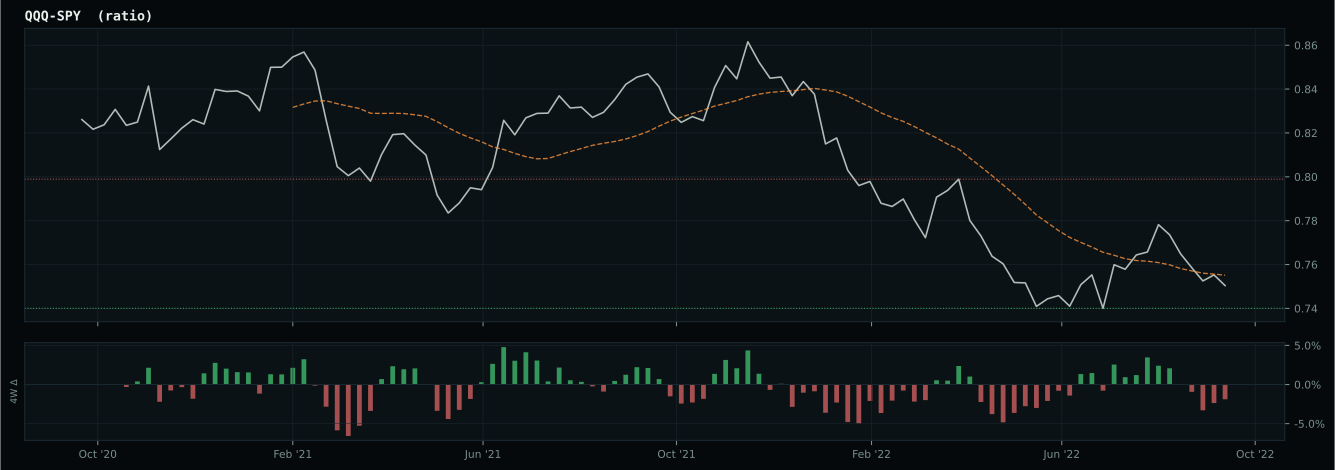
Market-implied signals behind the macro regime scores. Each ratio compares two assets; the direction and slope of the ratio is what the macro engine reads.
Crypto Regime — NoCrypto
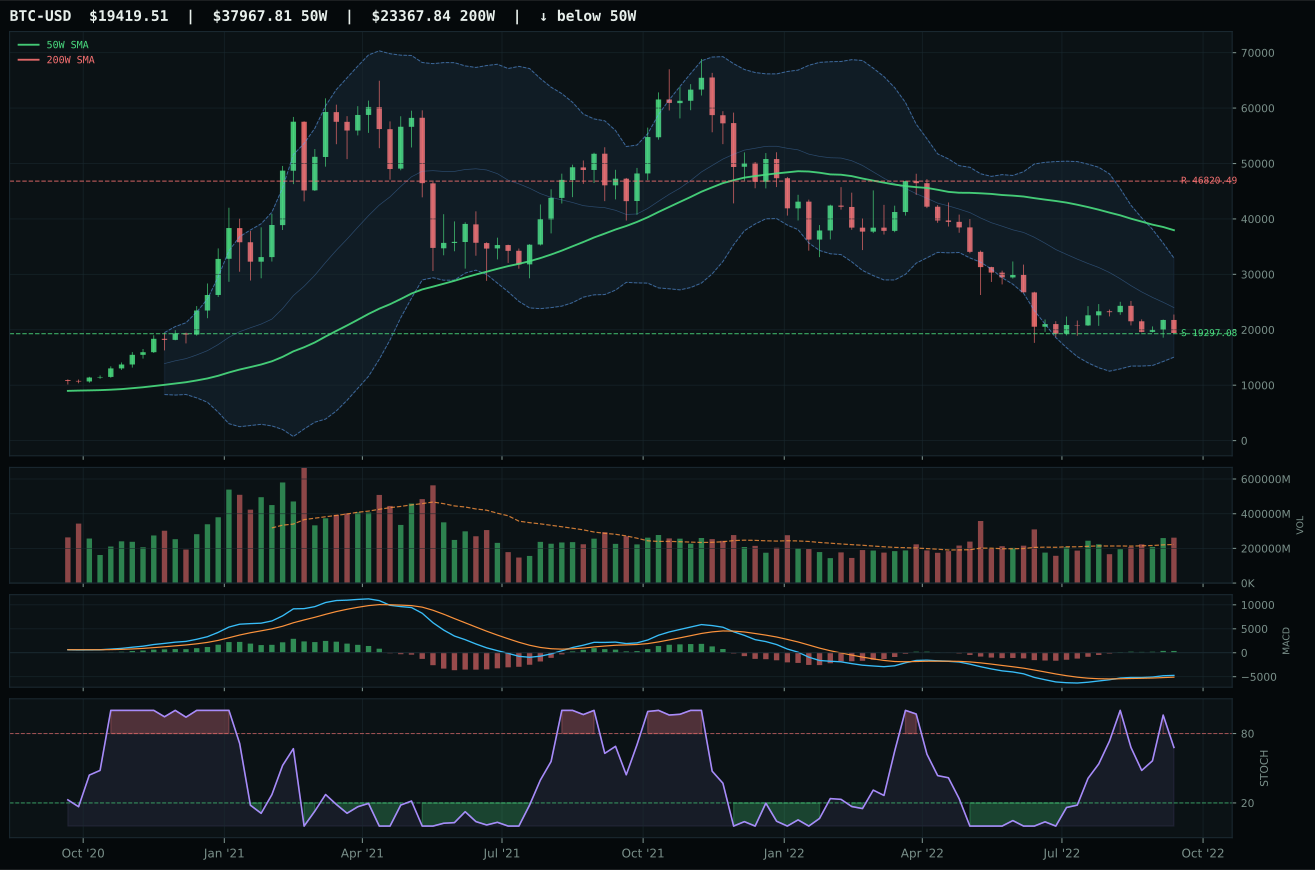
ValueBTC armed; waiting for 50W reclaim, decisive close above post-touch range resistance by 3%, close above 200W
TrendBTC not confirmed
one or more available conditions failed
Category Rankings
| Rank | Category | Winner | Score | Alloc | 4W Ret | Peers (4W) |
|---|---|---|---|---|---|---|
| 1 | Traditional Energy | XLE | 70.2 | 20% | +8.06% | FCG +1.9% · XOP +6.7% |
| 2 | Nuclear Energy | URNM | 65.0 | 20% | -10.12% | URA -10.2% · NLR -8.5% |
| 3 | Agriculture & Livestock | WEAT | 46.1 | 10% | +3.63% | VEGI -1.3% · MOO -4.5% |
| 4 | Utilities & Infrastructure | XLU | 43.5 | 10% | -14.56% | PAVE -1.7% · IGF -10.1% |
| 5 | Defense & Aerospace | ITA | 43.1 | 10% | -3.12% | ROKT -4.4% · XAR -4.4% |
| 6 | Precious Metals | GLD | 36.7 | 10% | +0.03% | SLV -2.2% · GDX -0.9% |
| 7 | Industrial Metals | COPX | 35.2 | 10% | -2.35% | REMX -10.2% · PICK -0.7% |
| 8 | Technology | CIBR | 26.8 | 10% | -6.35% | XLK -5.9% · IGV -5.7% |
| 9 | AI | BOTZ | 6.2 | 0% | -6.19% | AIQ -7.6% · SMH -11.7% |
| 10 | Emerging Markets | INDA | 3.2 | 0% | -5.04% | ILF +1.9% · IEMG -6.7% |
Traditional Energy — XLE
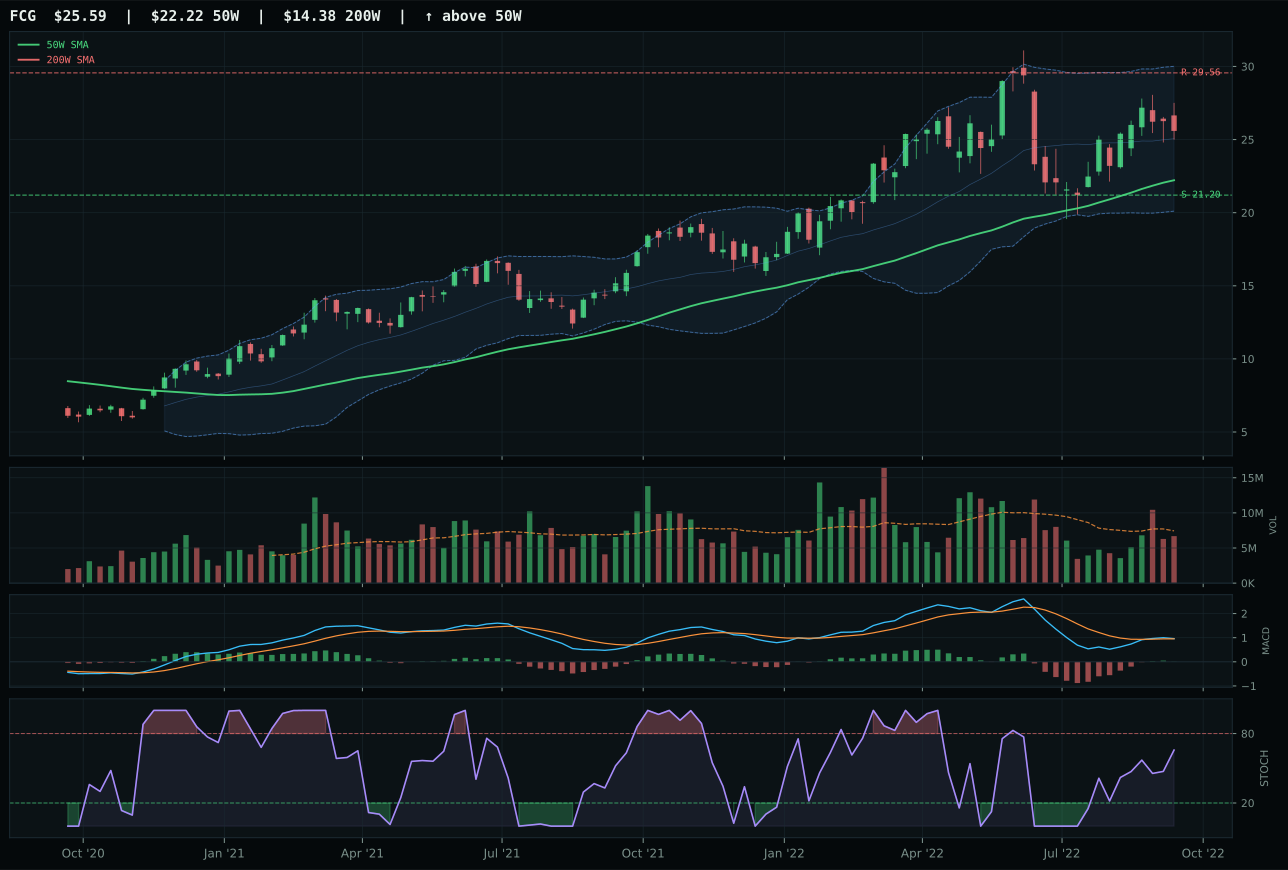
FCG has a vertical extension profile with 4.4% 13-week relative strength versus SPY.
A failed hold above support would weaken the setup.
Actionable but governed by invalidation levels.
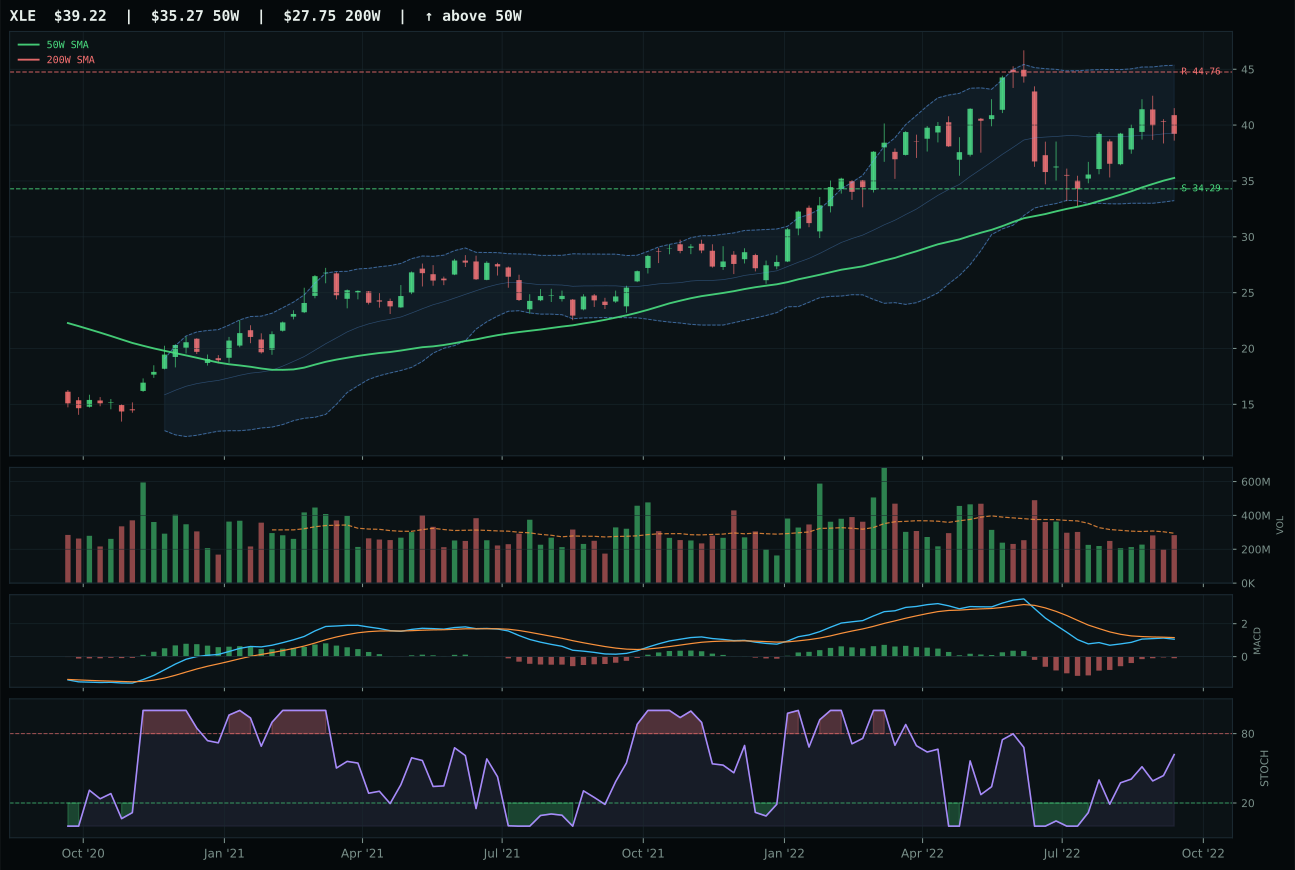
XLE has a neutral structure profile with 1.4% 13-week relative strength versus SPY.
A failed hold above support would weaken the setup.
Actionable but governed by invalidation levels.
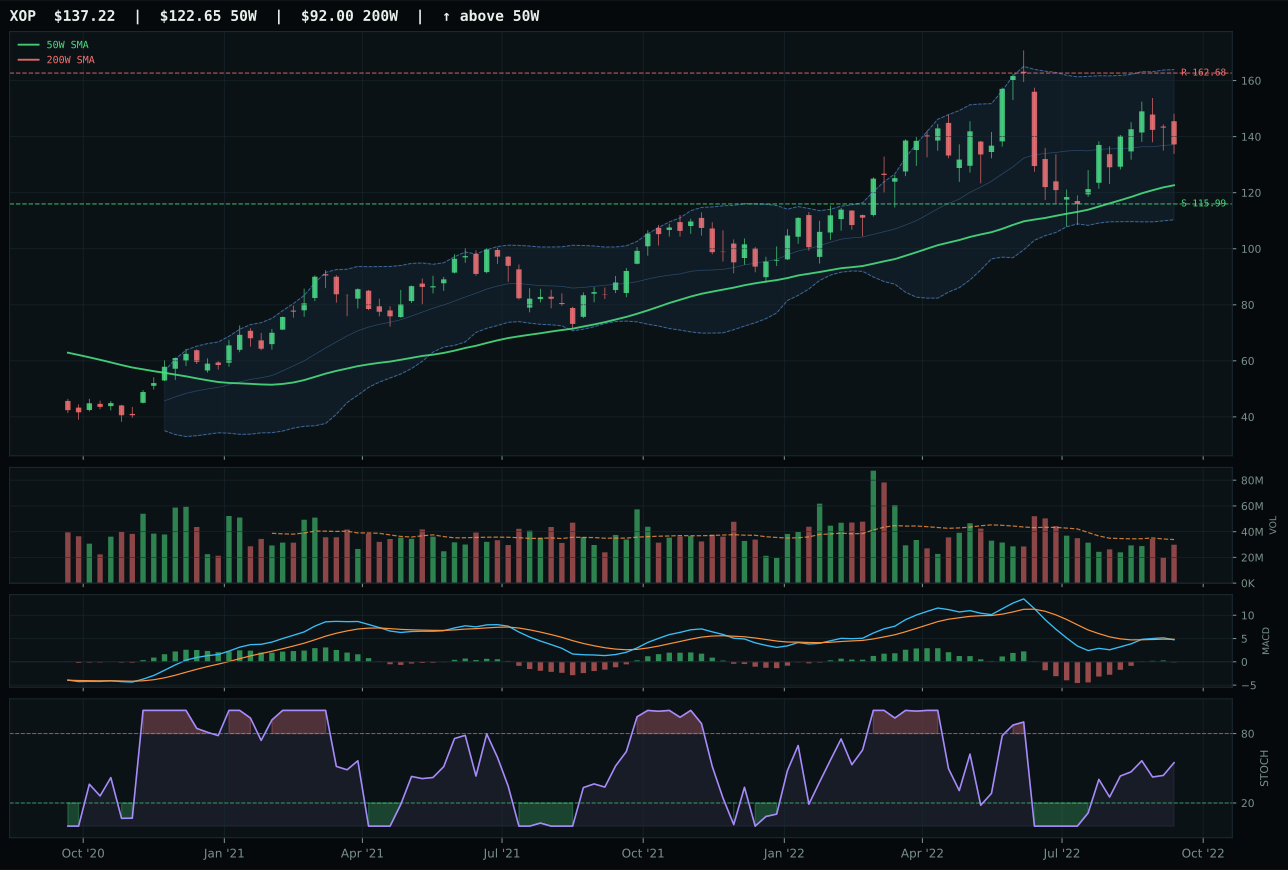
XOP has a neutral structure profile with 0.6% 13-week relative strength versus SPY.
A failed hold above support would weaken the setup.
Actionable but governed by invalidation levels.
XLE earned top-2 status at 10% allocation by scoring 70.2 and dominating Energy on a trend score of 95.0/100—the highest in the entire portfolio. Price is 11.2% above the 50W with above-50W slope of 0.7%, RSI versus SPY is positive 1.4%, and the structure is neutral, meaning breadth and sponsorship are carrying this move, not just technical momentum. Timing is strong at 83.0 because price sits in the upper retracement zone (Fib 0.382), stochastic RSI is rising mid-zone, and MACD is bearish but improving—a classic setup where the tape is leading the oscillators. Volume is neutral at 0.96x, meaning the move is orderly, not panicked buying. Versus runner-up FCG, XLE trades with better timing (83.0 vs 61.0), cleaner structure (68.7 vs 66.6), and superior risk/reward (45.5 vs 41.7).
Traditional Energy received 10% allocation as one of the two overweight categories, driven by a 70.2 category score and a 81.0/100 macro fit—the highest in the portfolio. Energy scarcity is active (+16), Late-Cycle Reflation helps (+12), inflation pressure is active (+10), and real-asset sponsorship is strong (+7). This is the macro sweet spot: commodity inflation persisting through rate hikes, supply constraints that cannot be solved this cycle, and geopolitical fracture ensuring no near-term glut. XLE's positioning above the 50W and neutral structure mean this is not an extended chase; it is a sustained trend in a regime where energy is the most reliable inflation hedge. The allocation reflects a belief that energy supply disruption and demand persistence will keep prices elevated regardless of near-term recession risk.
Nuclear Energy — URNM
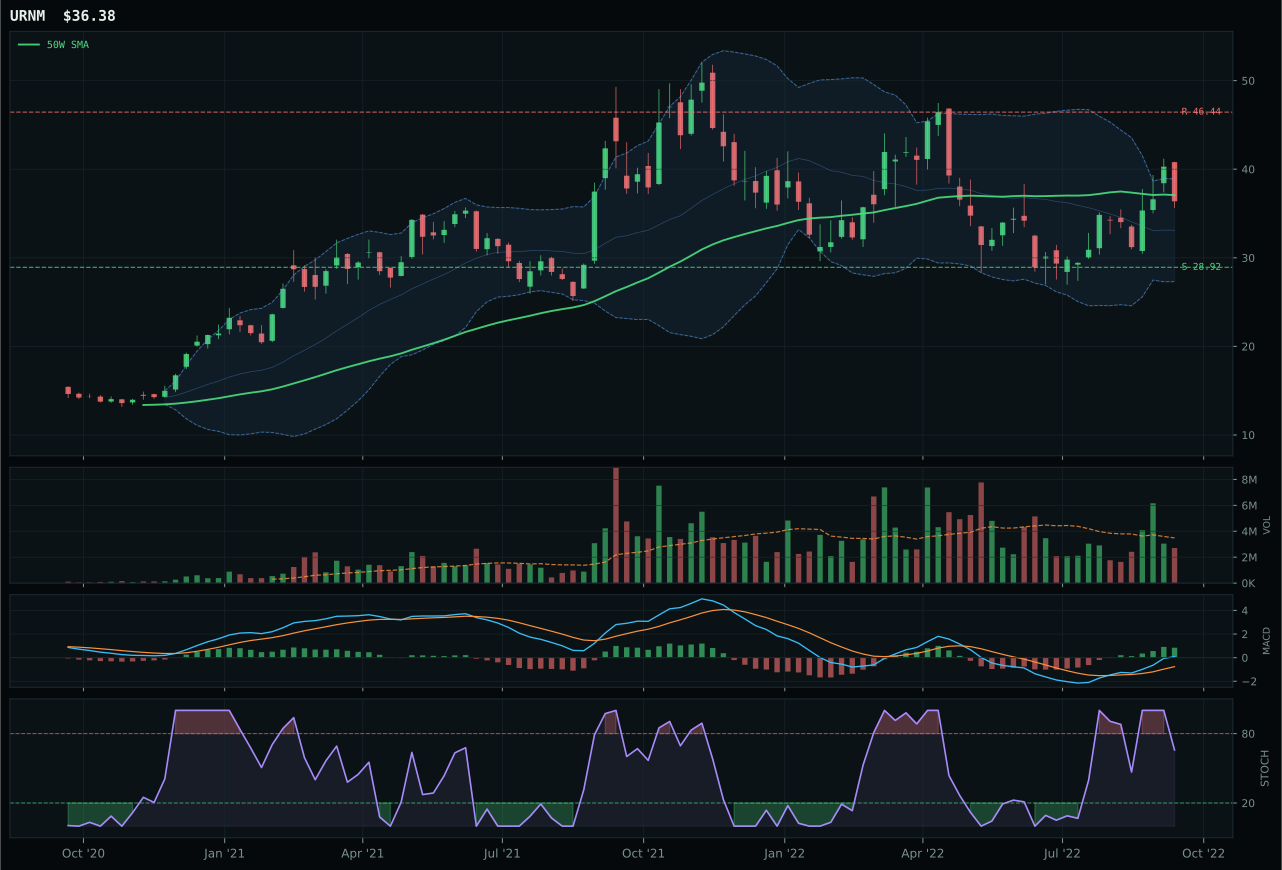
URNM has a compression near 50W profile with 20.4% 13-week relative strength versus SPY.
A failed hold above support would weaken the setup.
Actionable but governed by invalidation levels.
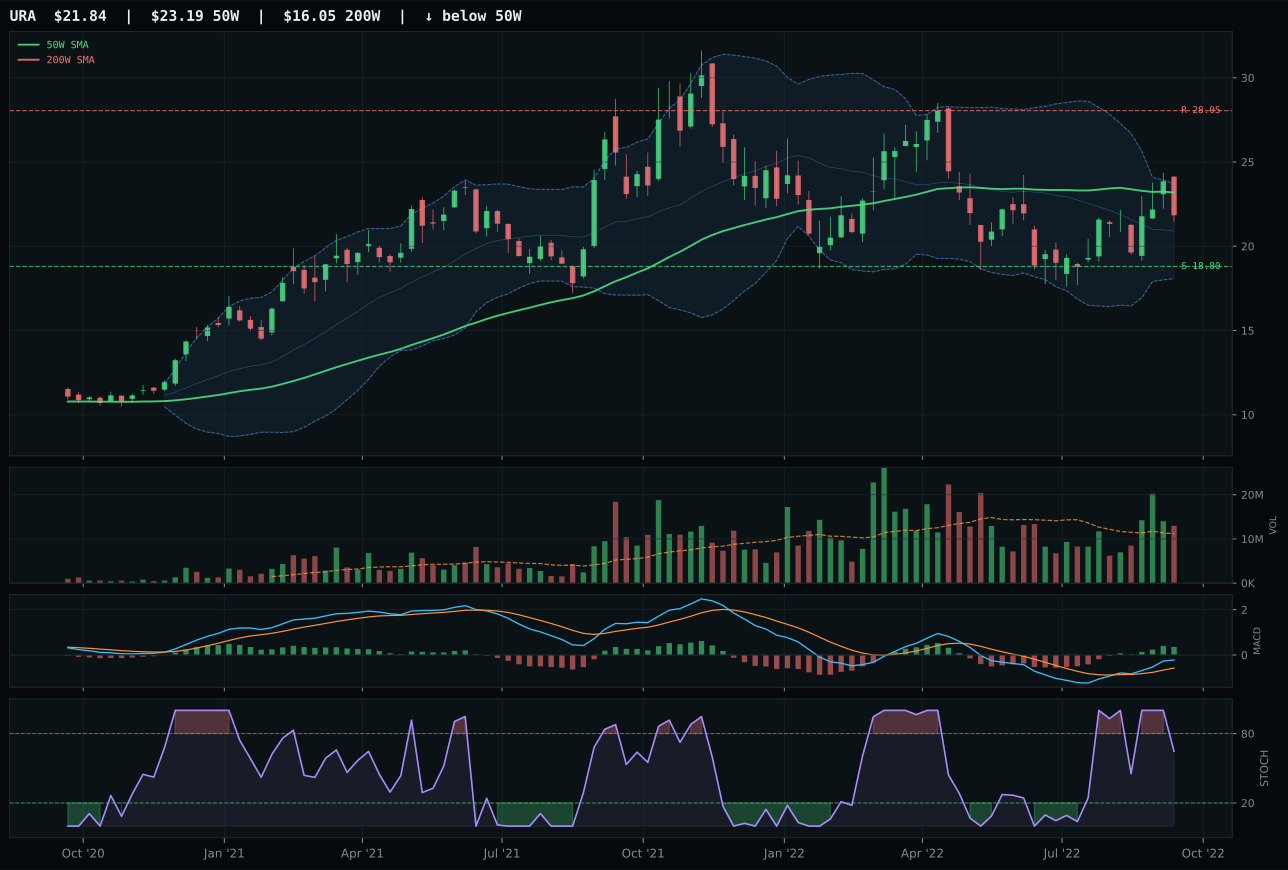
URA has a neutral structure profile with 10.4% 13-week relative strength versus SPY.
A failed hold above support would weaken the setup.
Actionable but governed by invalidation levels.
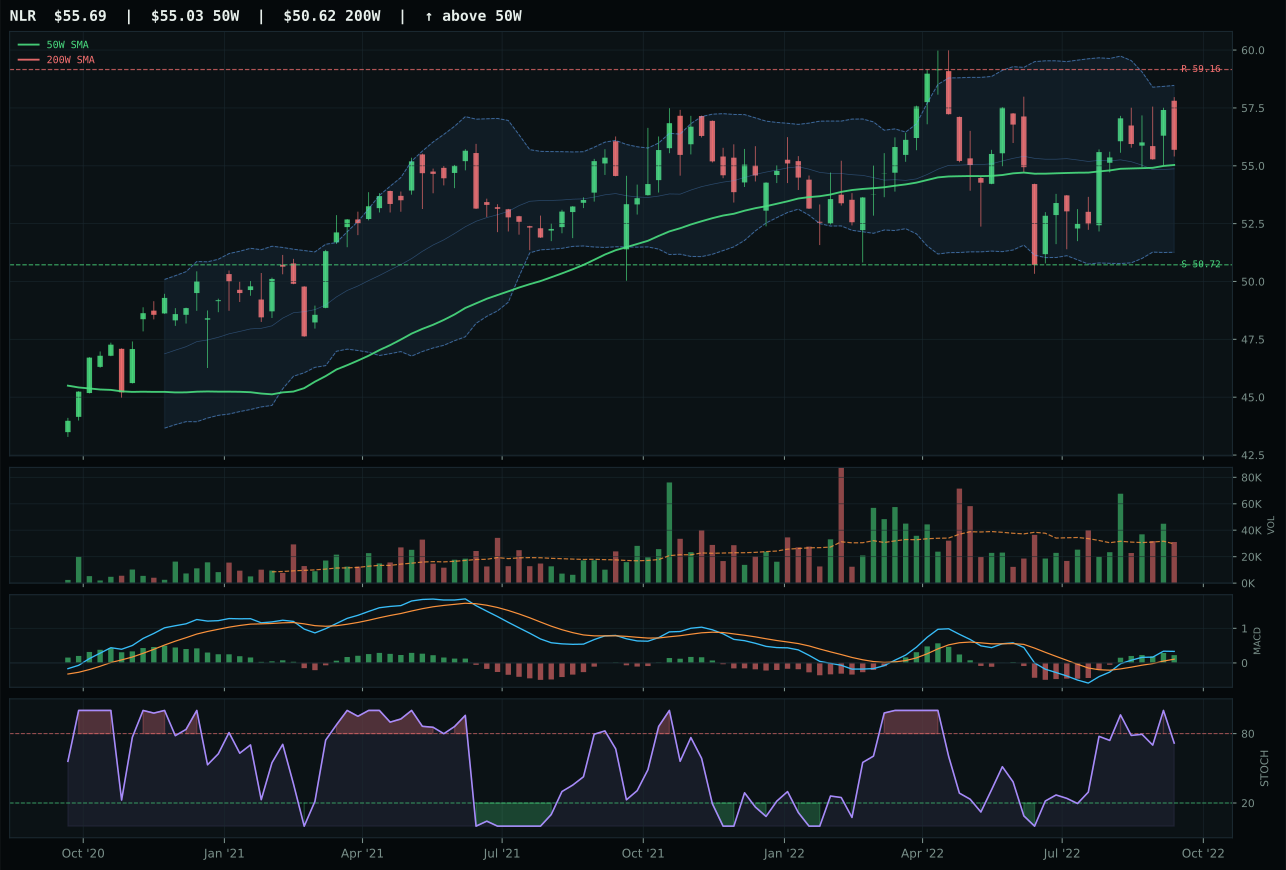
NLR has a compression near 50W profile with 4.4% 13-week relative strength versus SPY.
A failed hold above support would weaken the setup.
Tracked, but not top-2 eligible because: .
URNM earned top-2 status at 10% allocation by scoring 65.0 and delivering the rare combination of perfect timing (100.0/100) and perfect momentum (100.0/100). The uranium-miner ETF sits only 1.9% below the 50W in a tight compression (46.2/100), with MACD bullish and improving and stochastic RSI falling/neutral—meaning the setup is winding rather than unwinding. The 25.8% 13W return and 20.4% SPY-relative strength are the standout metrics: this is a category where new money is actively accumulating despite late-cycle headwinds. Versus runner-up URA, URNM's edge is crisp: timing at 100.0 versus 82.0, and category-relative strength at positive 10.0% versus zero. URA has higher absolute trend (85.0 vs 65.0) but sits in neutral structure rather than compression, making URA's move feel extended while URNM's feels coiled.
Nuclear Energy received 10% allocation as one of the two overweight categories, driven by a 65.0 category score and strong macro tailwinds. Energy scarcity is active (+9), real-asset sponsorship is strong (+7), Late-Cycle Reflation helps (+7), and inflation pressure is active (+3). The category macro fit is 60.0/100, lower than Energy but still robust. URNM's dual perfection scores (momentum and timing both at 100) reflect genuine conviction: uranium supply is structurally undersupplied, nuclear policy is shifting positively, and miners are compounding cash flows. The allocation is justified by both technical breadth (volume-price confirmation at 76.0/100) and macro fundamentals. Unlike XLE, which is defended by structural scarcity and near-term supply shock, URNM is a multi-year secular trade on energy transition and decarbonization policy tailwinds.
Agriculture & Livestock — WEAT
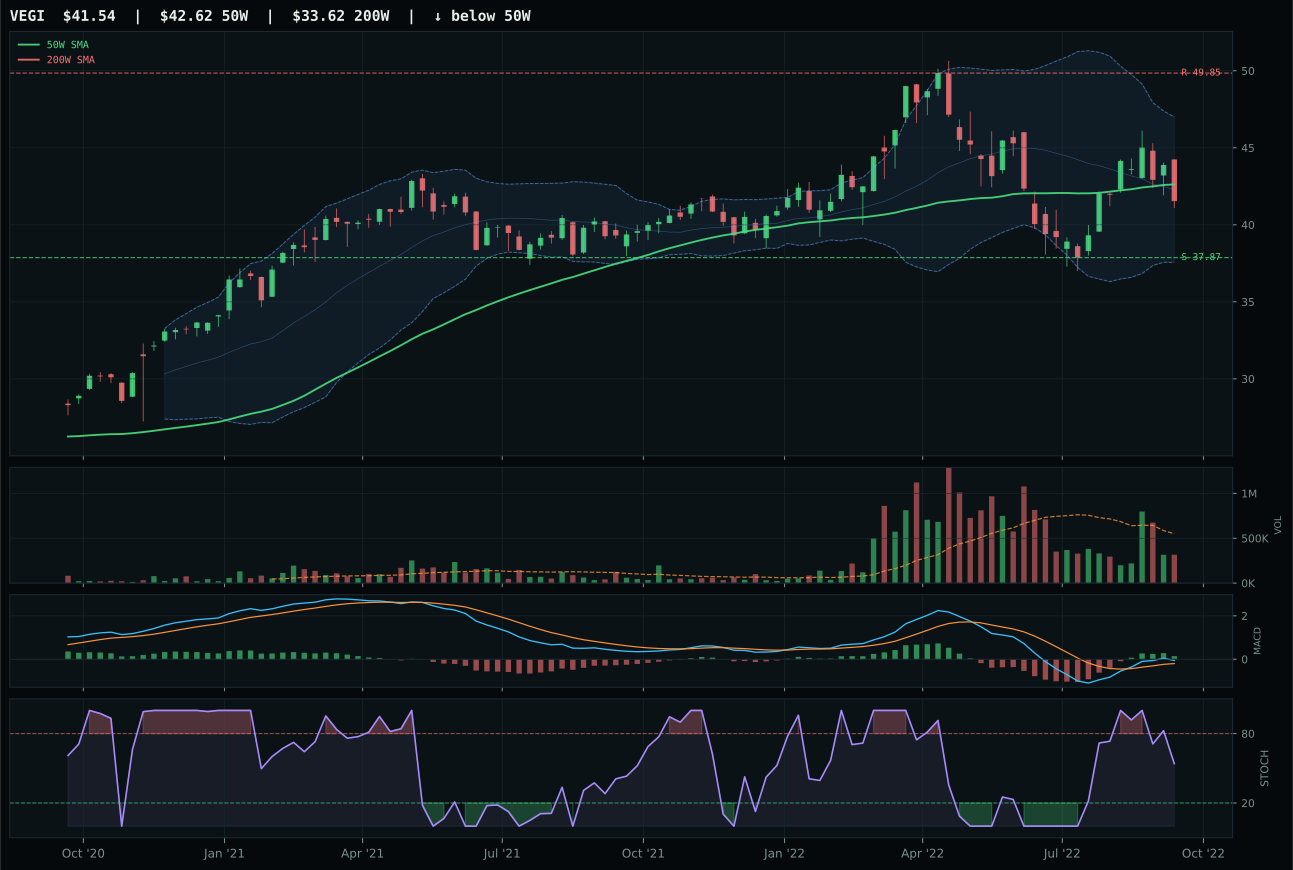
VEGI has a compression near 50W profile with -1.7% 13-week relative strength versus SPY.
A failed hold above support would weaken the setup.
Actionable but governed by invalidation levels.
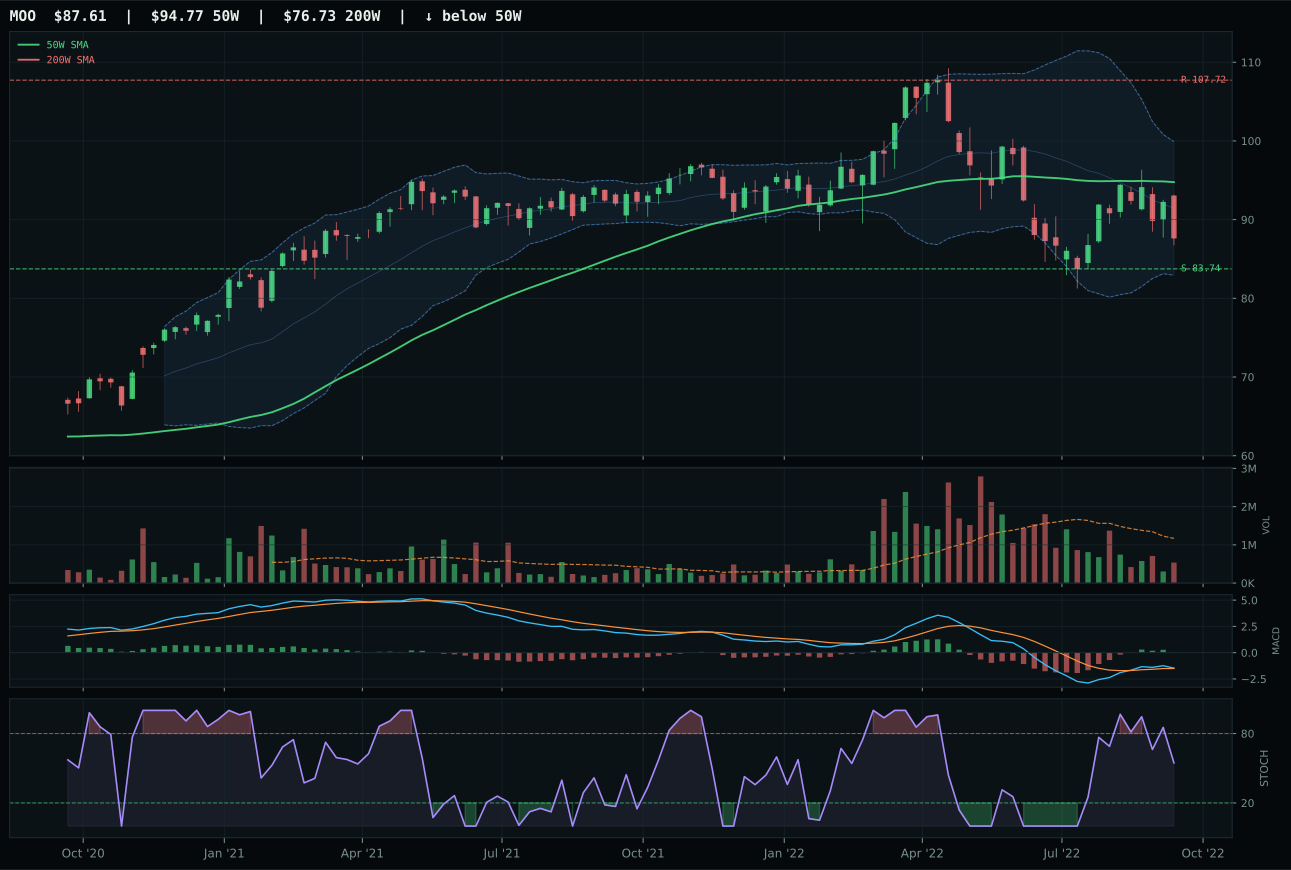
MOO has a pullback into support profile with -5.9% 13-week relative strength versus SPY.
A failed hold above support would weaken the setup.
Actionable but governed by invalidation levels.
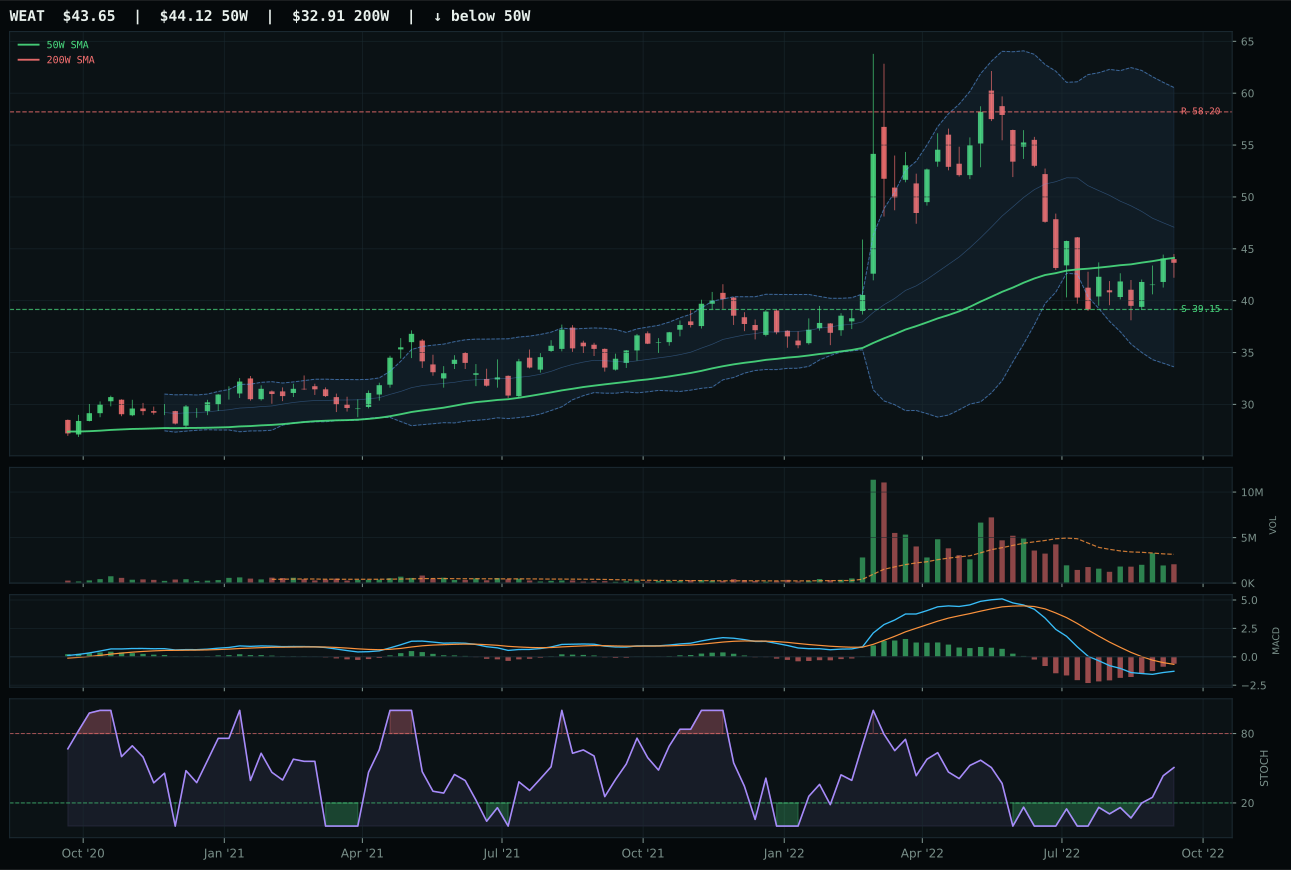
WEAT has a compression near 50W profile with -23.0% 13-week relative strength versus SPY.
A failed hold above support would weaken the setup.
Actionable but governed by invalidation levels.
WEAT won Agriculture by defeating VEGI on timing alone: both compress near the 50W, but WEAT's stochastic RSI is rising mid-zone (0.51) while VEGI's is falling/neutral. The wheat ETF is compressed within 1.1% of the 50W—an unusually tight coil—and sits directly on Fibonacci support at the 0.618 retracement (45.09). The setup earned a perfect 100.0/100 timing score because price is neither extended nor oversold, MACD is bearish but improving (not deteriorating), and the stochastic bounce is the first hint of revival. The cost is brutal: 13W return is negative 17.6%, category-relative strength is negative 17.2%, and volume confirmation is only 11.1/100. This is a coil built from capitulation, not accumulation.
Agriculture & Livestock received 5% allocation in tier-2 with a 46.1 category score, supported by a 72.0/100 macro fit driven by inflation pressure (+10) and Late-Cycle Reflation (+8). The allocation is not about near-term price recovery; it is about commodity scarcity and real-asset sponsorship persisting through late cycle. WEAT's technical score is only 10.8/100, the worst in the category, but macro fit lifted the category itself high enough to earn the slot. The trade is a bet that wheat supply remains constrained and that dollar weakness will support commodity prices relative to equities. VEGI, the runner-up with superior technicals (79.0/100), is structurally cleaner but offers no pricing power unless inflation narratives strengthen further.
Utilities & Infrastructure — XLU
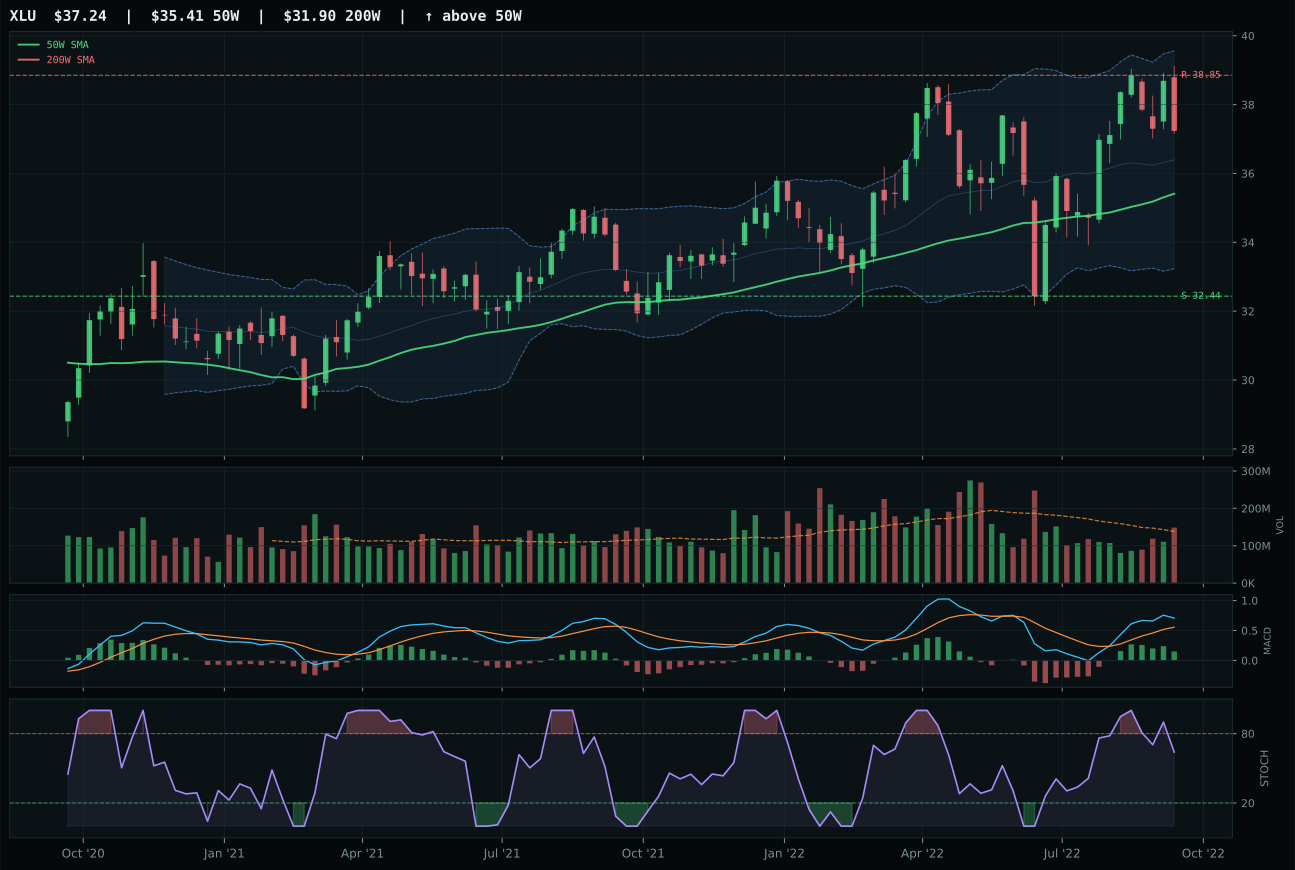
XLU has a neutral structure profile with 9.4% 13-week relative strength versus SPY.
A failed hold above support would weaken the setup.
Actionable but governed by invalidation levels.
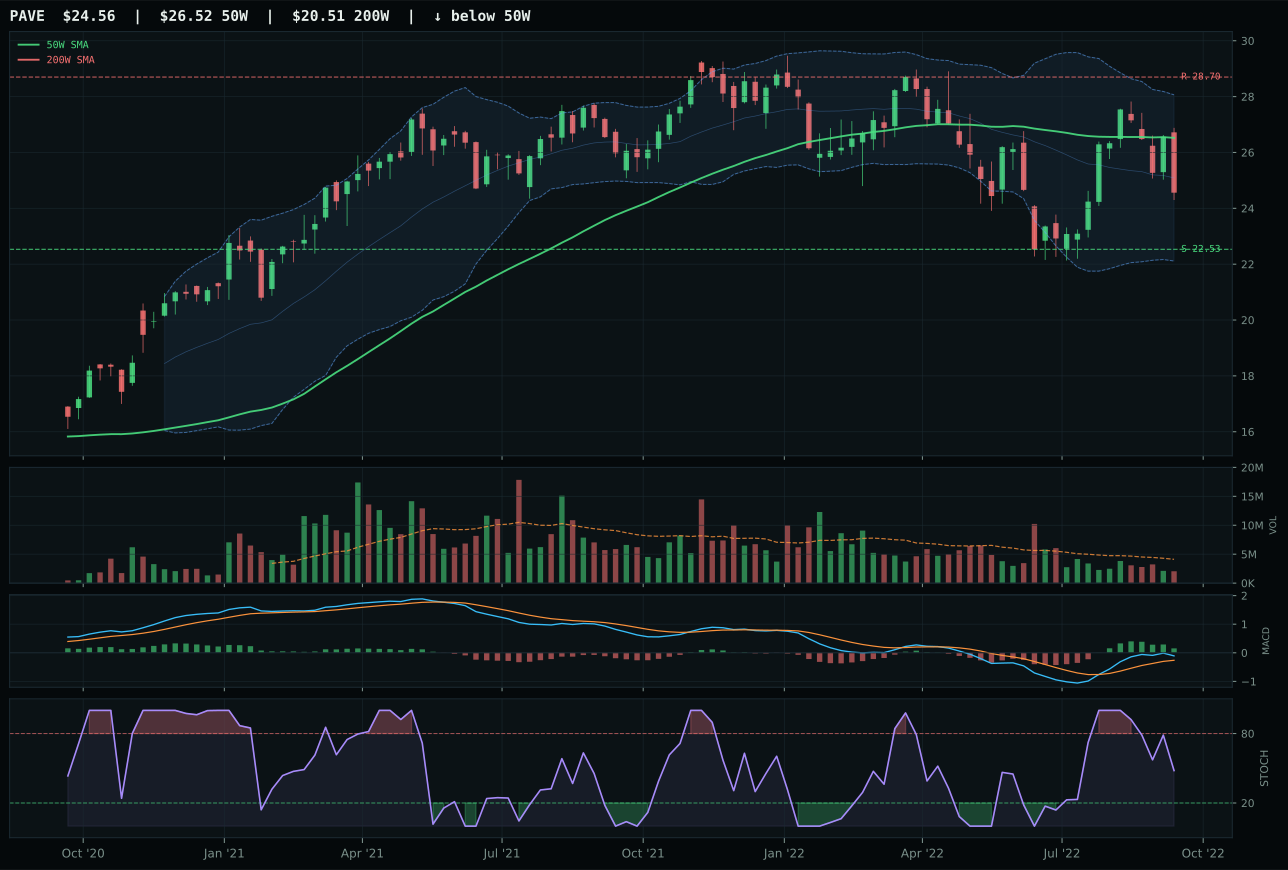
PAVE has a neutral structure profile with 3.6% 13-week relative strength versus SPY.
A failed hold above support would weaken the setup.
Actionable but governed by invalidation levels.
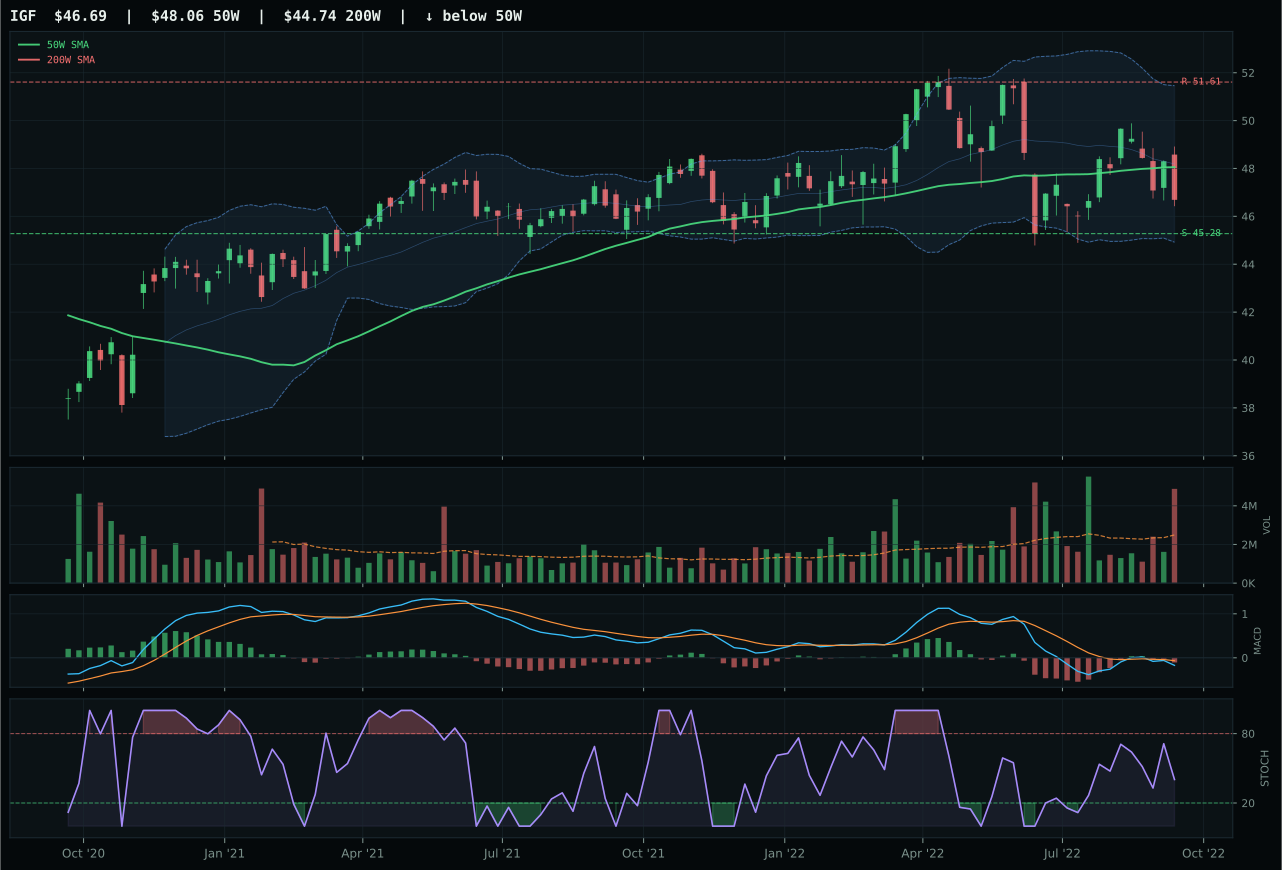
IGF has a pullback into support profile with -2.3% 13-week relative strength versus SPY.
A failed hold above support would weaken the setup.
Actionable but governed by invalidation levels.
XLU won Utilities & Infrastructure on the back of perfect trend confirmation (100.0/100) and strong momentum (87.5/100), making it the clear defensive leader in this category. Price is 5.1% above the 50W with a stable 50W slope of 0.3%, meaning the trend is established without extension. MACD is bullish but flattening and stochastic RSI is falling/neutral at 0.64—confirming strength while warning against chasing extended moves. The 13W return of positive 14.8% and SPY-relative outperformance of 9.4% prove that the defensive rotation is live in this name. Volume is neutral at 1.07x, and structure is clean (71.1/100). Versus runner-up PAVE, XLU's edges are decisive: trend at 100.0 versus 66.0, momentum at 87.5 versus 49.0, and category-relative strength at 5.8% versus 0.0%.
Utilities & Infrastructure earned 5% allocation in tier-2 with a 43.5 category score, supported by a 61.0/100 macro fit anchored by defensive rotation (+12) and broad market bear (+4). Late-Cycle Reflation does not help this category (the macro descriptor is actually negative on inflation at -6), but defensive positioning carries the trade. XLU's trend strength (100.0/100) and momentum (87.5/100) reflect a genuine rotation into rate-sensitive, low-volatility dividend stocks as growth expectations compress. The allocation is justified as a structural hedge: utilities and infrastructure offer downside protection via regulated cash flows and inflation-hedging tariffs. This is not a growth trade; it is an explicit capital preservation move in a rising-rate environment where traditional equity beta is unsafe.
Defense & Aerospace — ITA
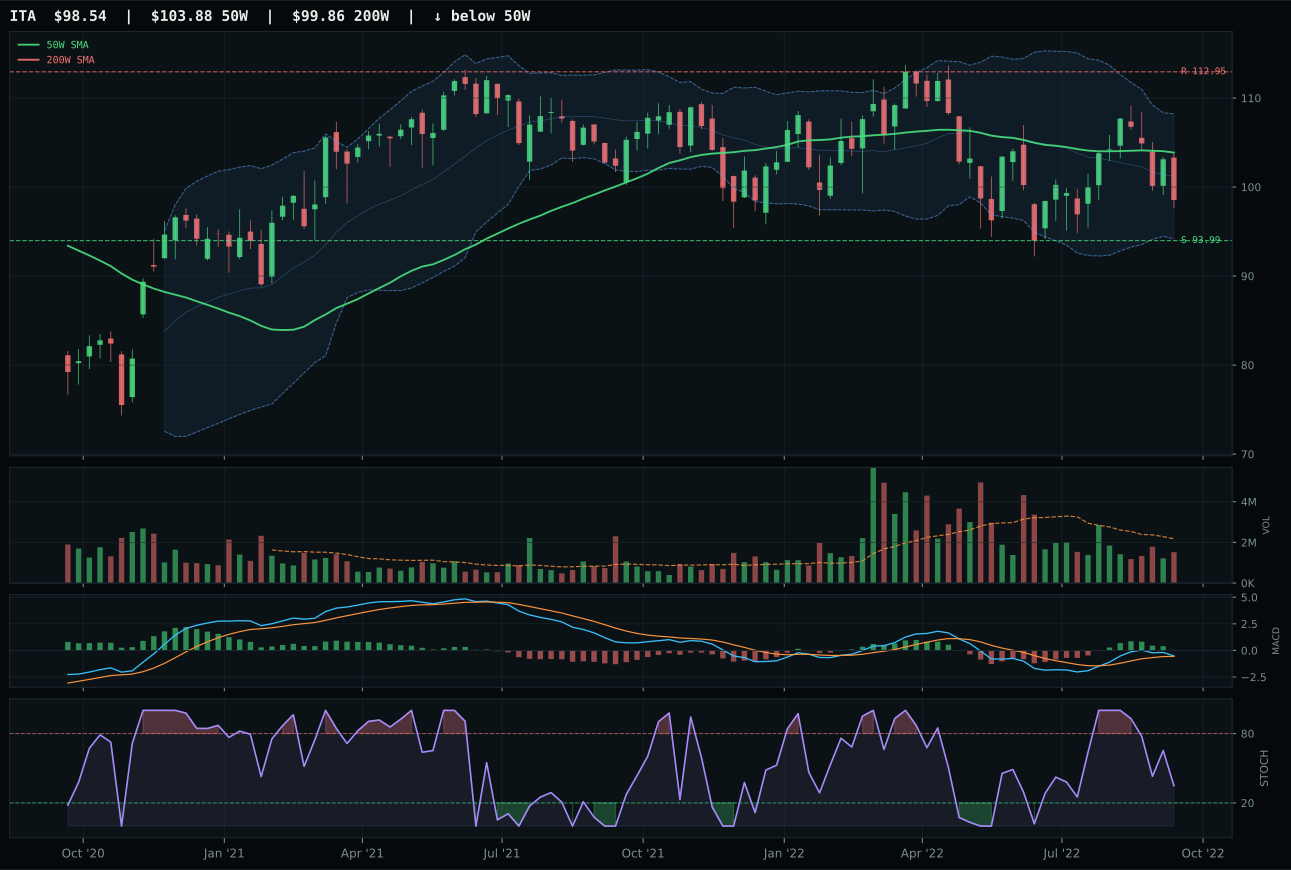
ITA has a pullback into support profile with -0.5% 13-week relative strength versus SPY.
A failed hold above support would weaken the setup.
Actionable but governed by invalidation levels.
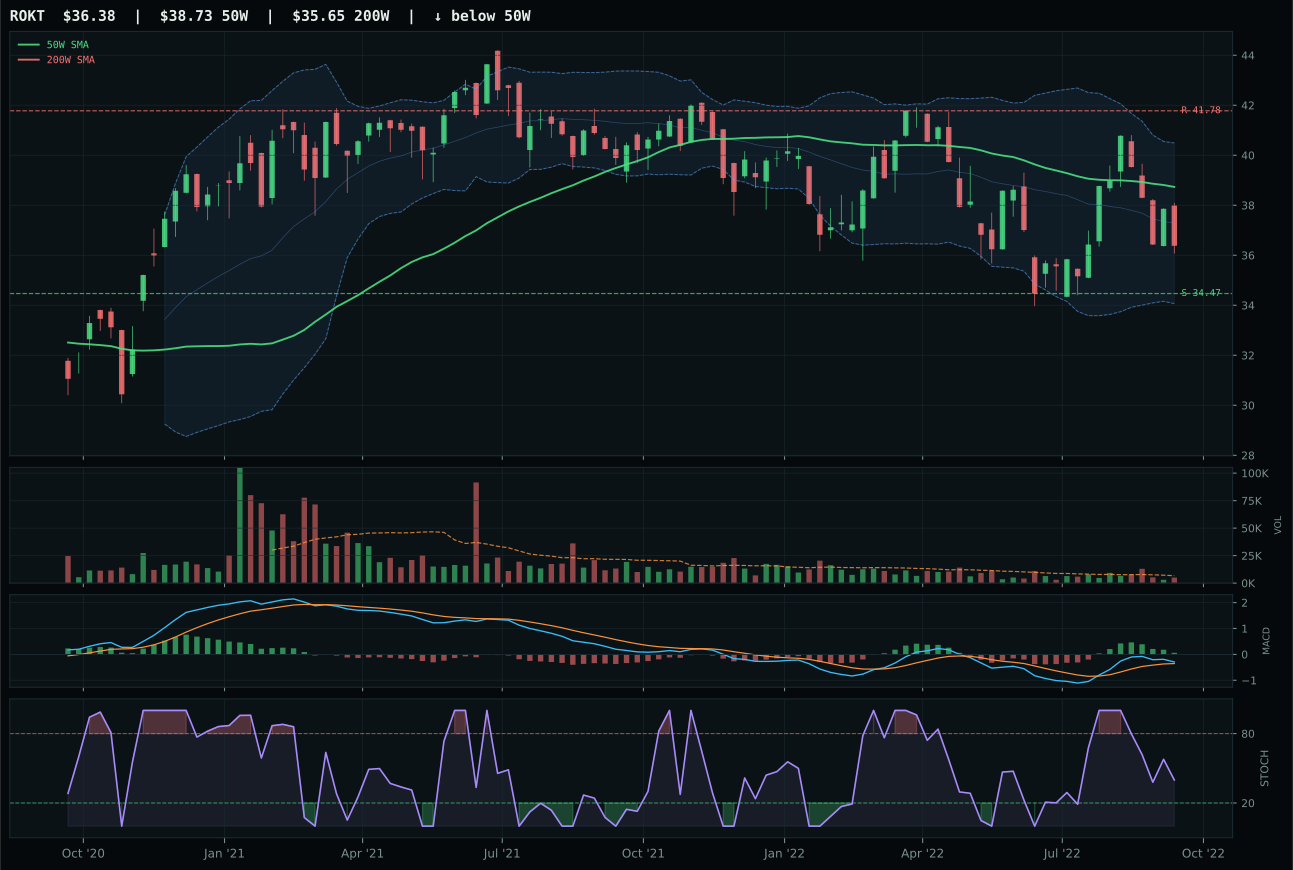
ROKT has a neutral structure profile with 0.2% 13-week relative strength versus SPY.
A failed hold above support would weaken the setup.
Tracked, but not top-2 eligible because: .
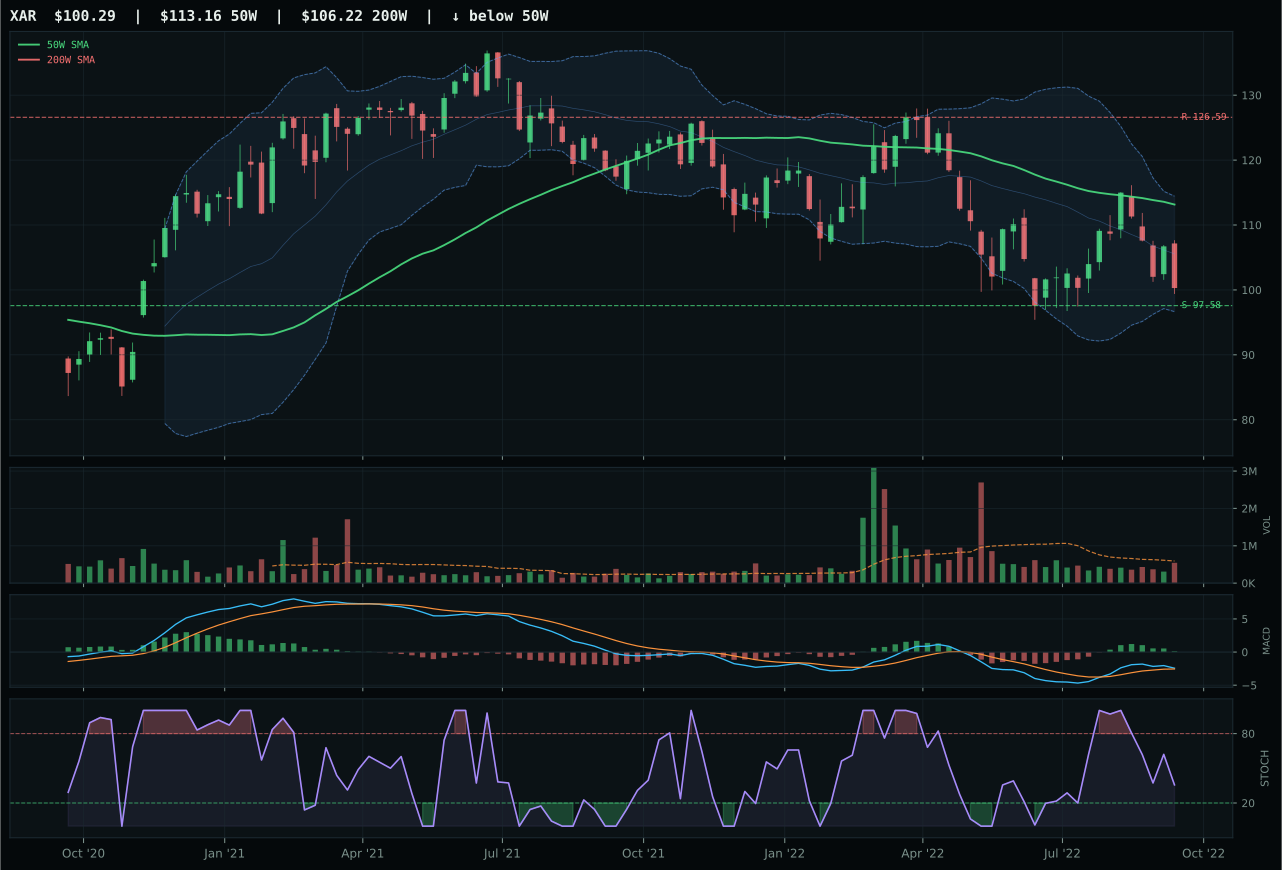
XAR has a pullback into support profile with -2.6% 13-week relative strength versus SPY.
A failed hold above support would weaken the setup.
Actionable but governed by invalidation levels.
ITA won Defense & Aerospace on the back of superior timing (80.0 vs 77.0 for runner-up ROKT) and cleaner risk/reward (98.0 vs 95.0). The integrated defense-prime ETF is sitting only 5.1% below the 50W after a pullback into support at 93.99, giving buyers a defined entry with minimal overshoot. The Fibonacci placement is deep retracement at 0.786 (96.83), which is value-zone territory, and the setup is compression into support rather than structural breakdown. MACD is bullish but flattening and stochastic RSI is falling/neutral—both confirming no fresh deterioration. Volume at 0.70x the 20W average means this is a thin pullback, not a flush, which is exactly what the defensive rotation regime should look like: orderly reallocation into stability, not panic.
Defense & Aerospace earned 5% allocation in tier-2, supported by a 43.1 final category score and stellar macro alignment. The category-level macro fit is 72.0/100, driven by defensive rotation (+8), broad market bear (+6), and Late-Cycle Reflation itself (+6). This is the regime where defense outperforms: when growth is broken and credit is stressed, investors rotate into durable, government-sponsored cash flows. ITA's setup is patient and technical rather than dynamic, but that matches the macro perfectly. The trade is not a crash-up; it is a managed entry into a secular safety bid that will persist as long as rate regime uncertainty and earnings compression remain active.
Precious Metals — GLD
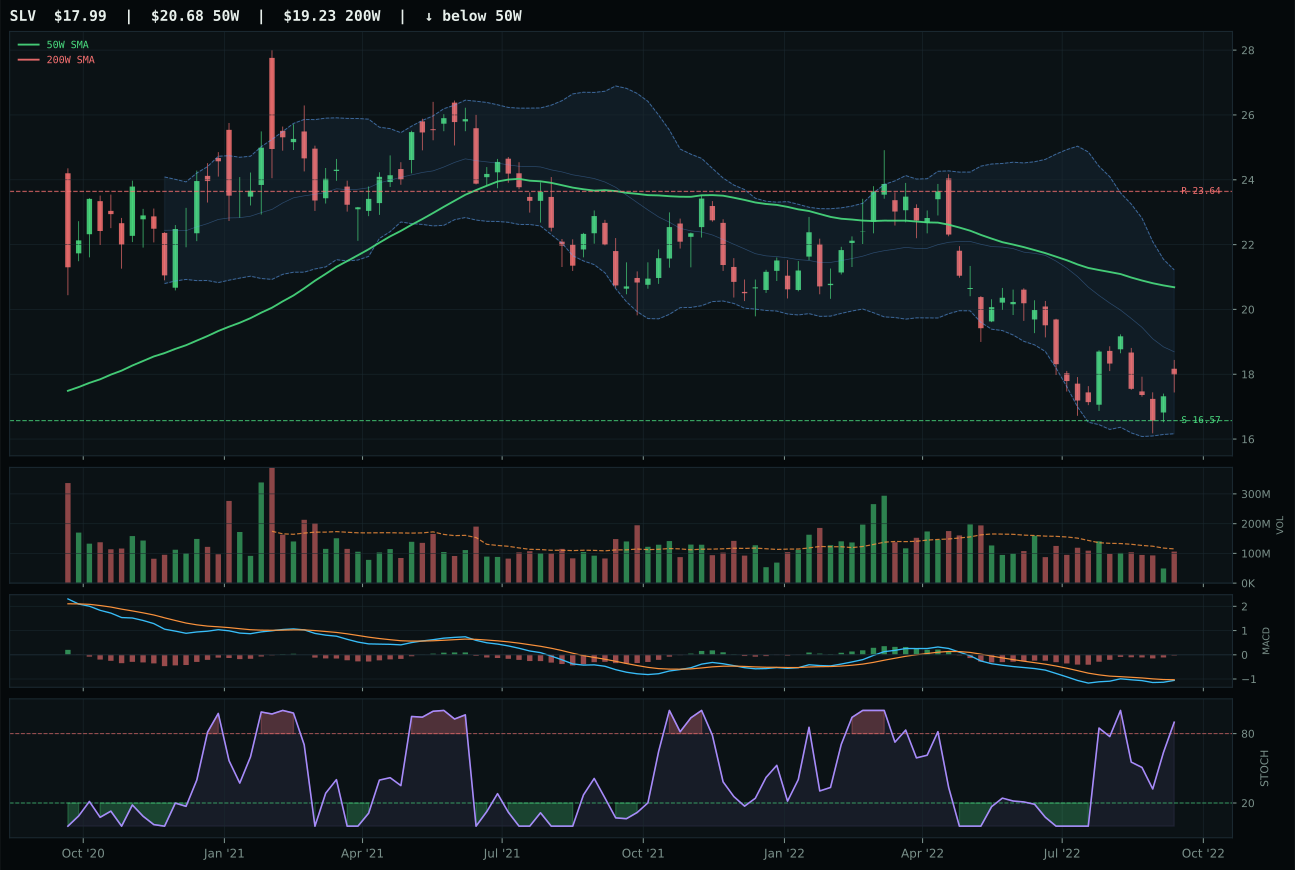
SLV has a neutral structure profile with -15.3% 13-week relative strength versus SPY.
A failed hold above support would weaken the setup.
Actionable but governed by invalidation levels.
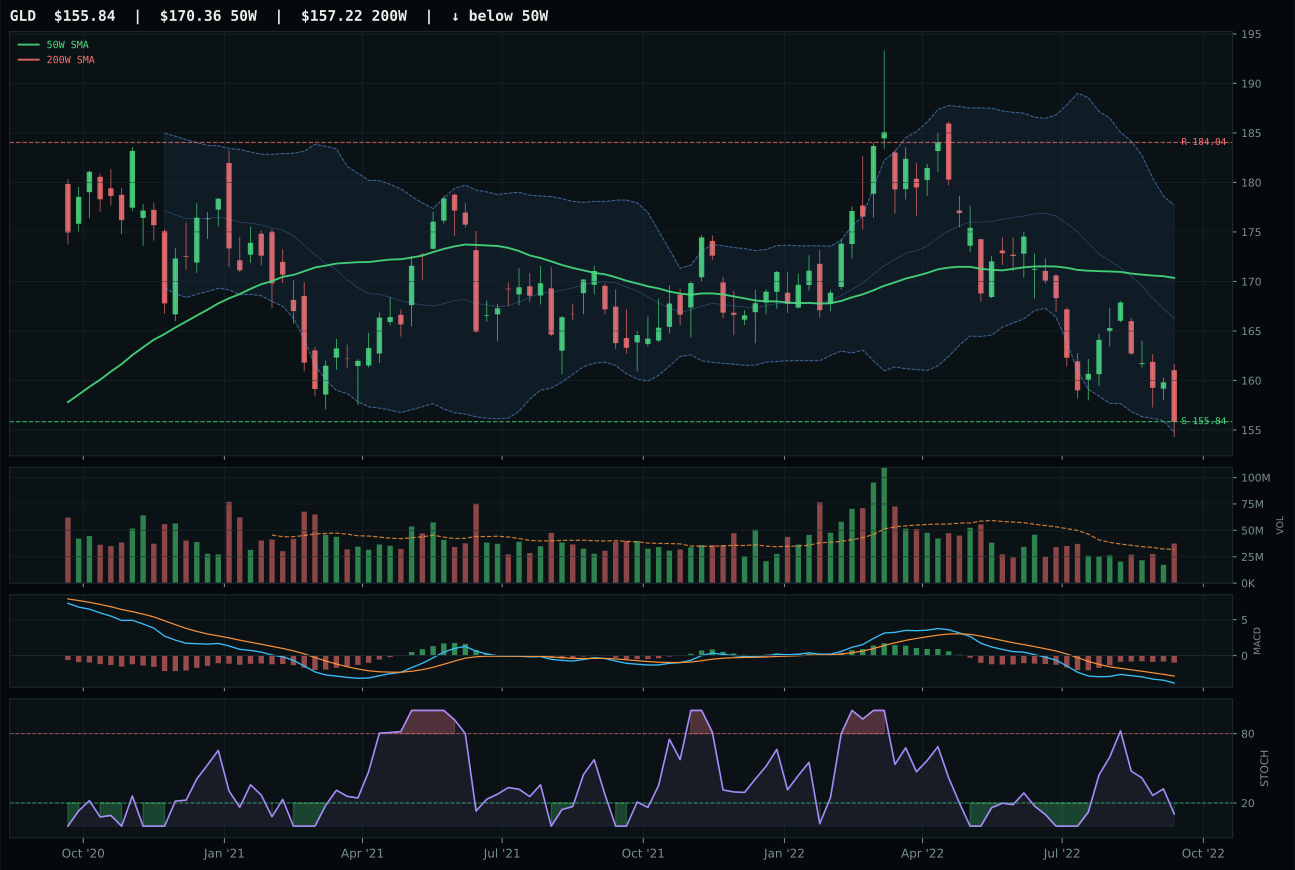
GLD has a pullback into support profile with -14.4% 13-week relative strength versus SPY.
A failed hold above support would weaken the setup.
Actionable but governed by invalidation levels.
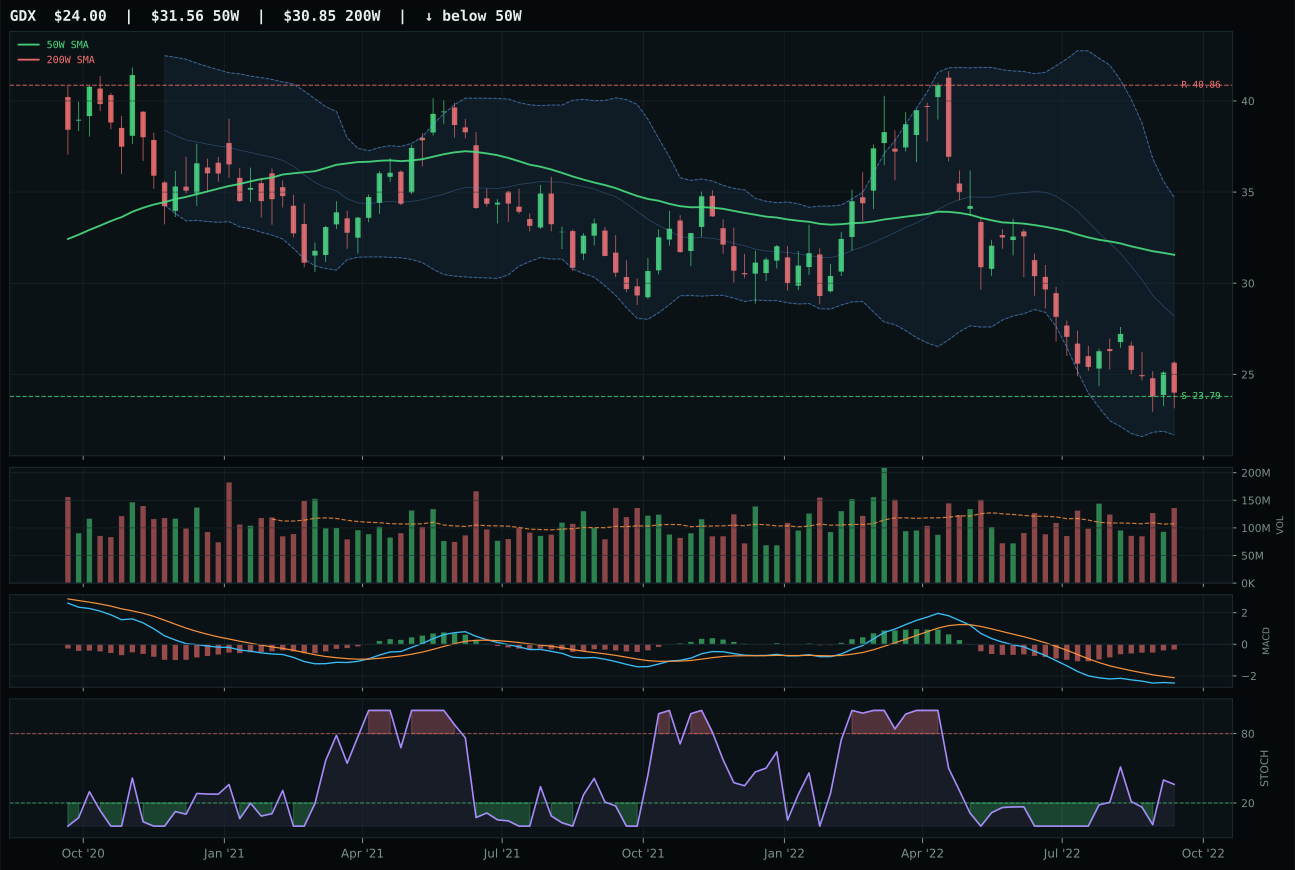
GDX has a pullback into support profile with -26.4% 13-week relative strength versus SPY.
A failed hold above support would weaken the setup.
Actionable but governed by invalidation levels.
GLD won Precious Metals despite carrying the worst technical score (21.7/100) in the category, a stark reminder that macro sponsorship can override clean setups in defensive regimes. The gold ETF is 8.5% underwater from the 50W with price in the 52W low repair zone, MACD bearish/weakening, and stochastic RSI deeply oversold at 0.11. The advantage over SLV is the above-average volume participation (1.17x 20W): even though momentum is dead, real money is defending this level. The structure is tight (73.1/100 compression) and support is defined at 155.84, but the primary edge is macro: monetary hedge bid is active (+14) and defensive rotation is in play (+6). This is not a technical bounce; it is a macro protection trade.
Precious Metals earned 5% allocation in tier-2, supported by a 36.7 category score but driven almost entirely by macro fit at 74.0/100. The category-level macro picture is clear: monetary hedge sponsorship (+14), defensive rotation (+7), and dollar pressure (+3) are creating a safety bid in gold even as the technical picture remains weak. Late-Cycle Reflation does not help this category directly, but credit stress and liquidity uncertainty do. GLD's above-average volume is the key tell—it suggests institutions are using gold as a ballast, not traders chasing bounces. The allocation is small and defensive; it serves as chaos insurance, not growth. SLV, the runner-up at 48.9 reasoned score, offers hybrid industrial leverage but lacks GLD's pure monetary hedge credential.
Industrial Metals — COPX
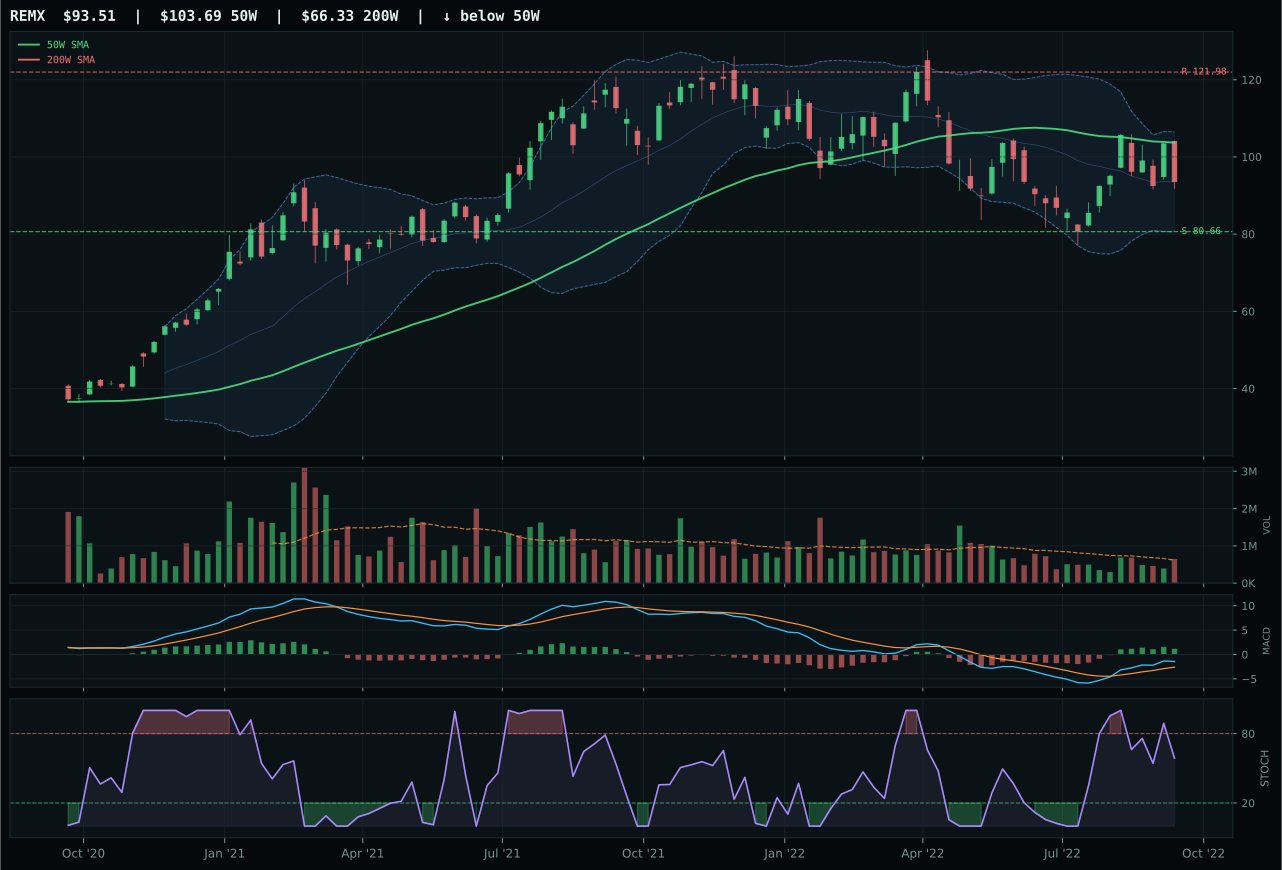
REMX has a neutral structure profile with -1.9% 13-week relative strength versus SPY.
A failed hold above support would weaken the setup.
Actionable but governed by invalidation levels.
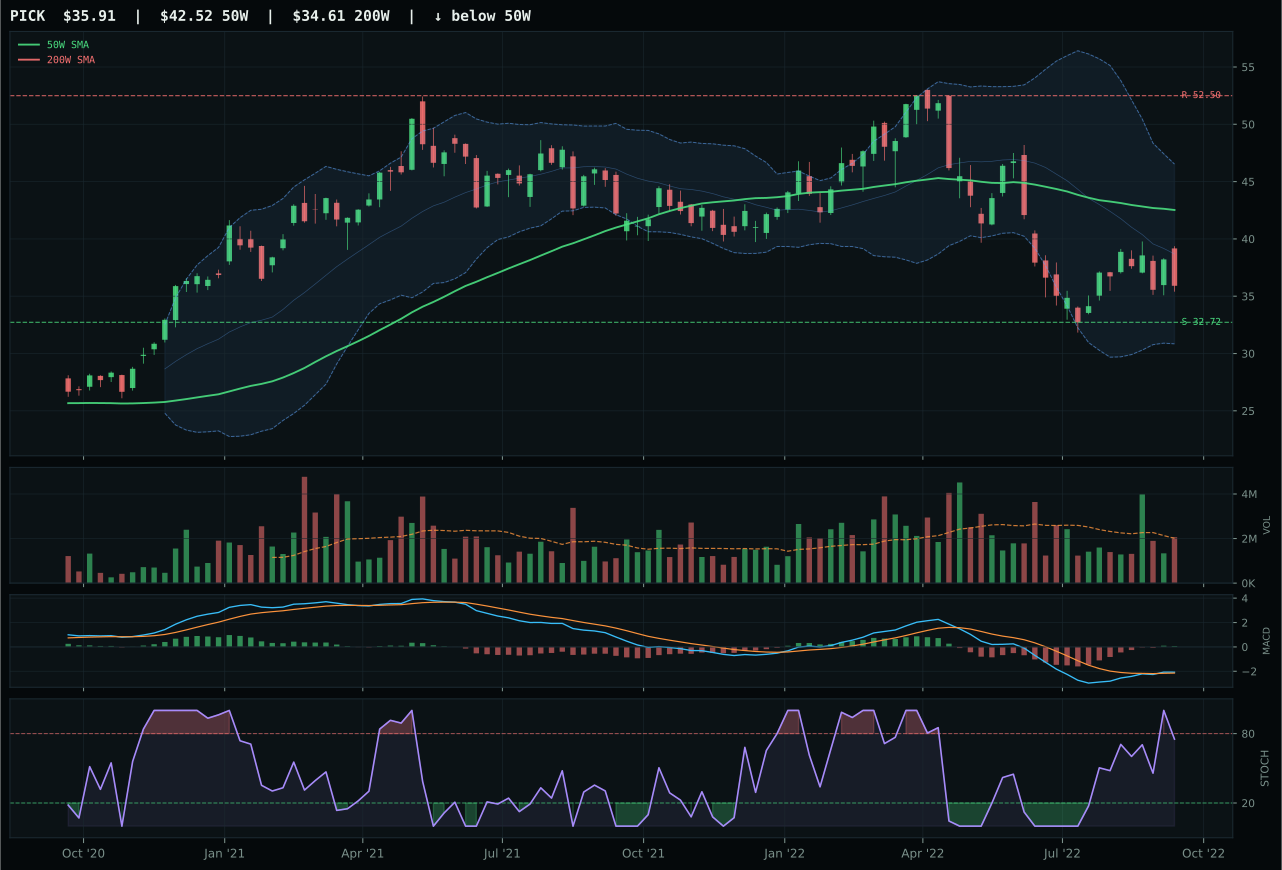
PICK has a neutral structure profile with -10.7% 13-week relative strength versus SPY.
A failed hold above support would weaken the setup.
Actionable but governed by invalidation levels.
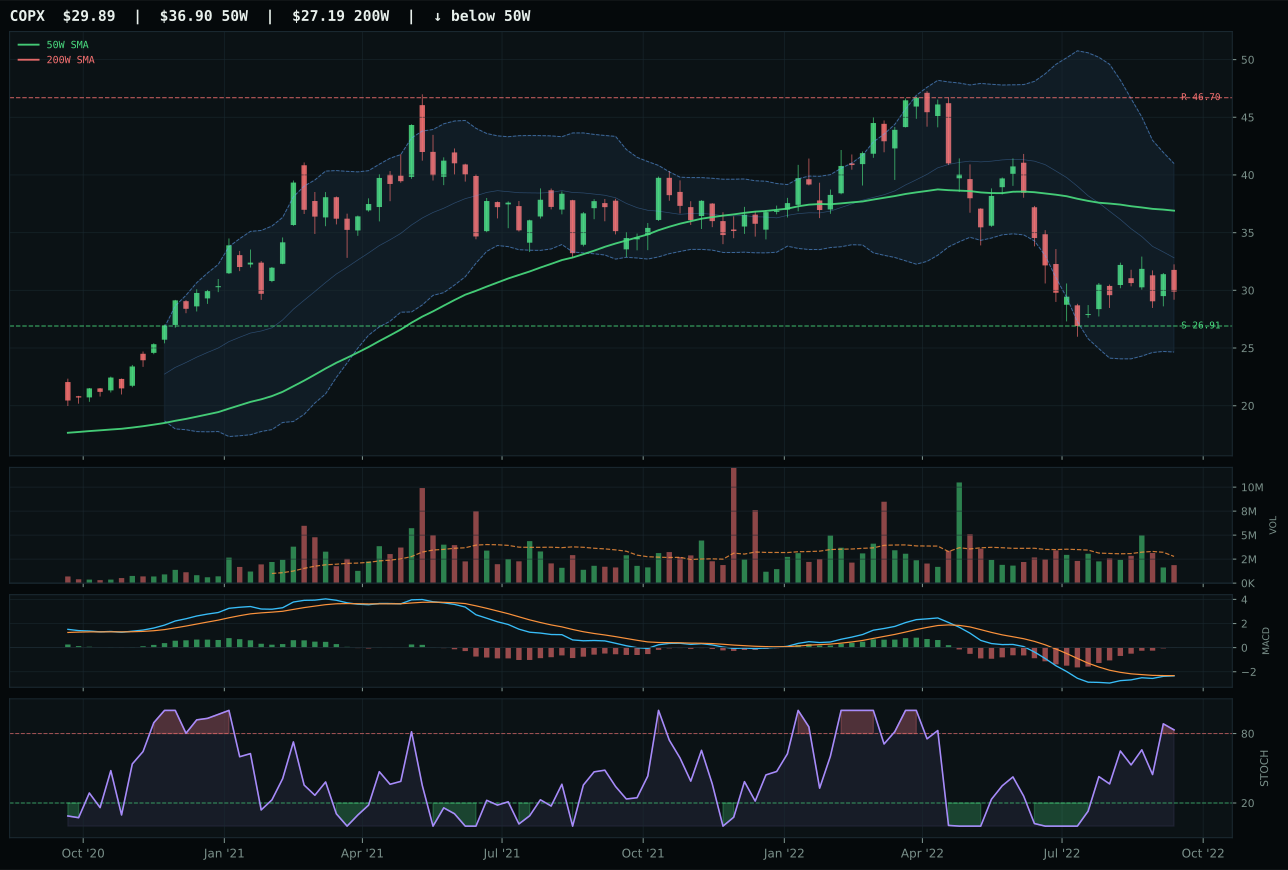
COPX has a neutral structure profile with -18.8% 13-week relative strength versus SPY.
A failed hold above support would weaken the setup.
Actionable but governed by invalidation levels.
COPX won Industrial Metals by virtue of being the least broken representative in a thoroughly broken category. The copper-miner ETF trades 19.0% below the 50W with negative 13.4% 13W return and negative 18.8% SPY-relative performance. Structure is neutral, momentum confirmation is zero at 0.0/100, and MACD is bearish but improving. The only technical edge is stochastic RSI at overbought momentum (0.83), which tells you the chart is bouncing off a dislocation rather than accumulating on strength. Versus runner-up REMX (which trades near new highs with bullish MACD), COPX looks worse on every technical measure, but REMX suffered worse risk/reward (64.4 vs 75.0) and sits further from support (9.8% vs 19.0%). This is not a setup; it is damage control.
Industrial Metals earned 5% allocation in tier-2 with a 35.2 category score, the lowest among allocated categories. The macro fit is 44.0/100, penalized by liquidity stress (-8), credit stress (-7), and dollar pressure (-7), only partially offset by Late-Cycle Reflation (+10) and real-asset sponsorship (+6). COPX represents a directional bet that copper scarcity will eventually matter more than near-term demand destruction, but the technical setup offers no near-term confirmation. REMX, the reasoned-score leader at 63.3, trades with much better technicals (bullish MACD, neutral stochastic, off support) and stronger 13W momentum at positive 3.5%. The allocation to COPX is a hedge against dollar weakness and supply tightness, not a conviction long into strength.
Technology — CIBR
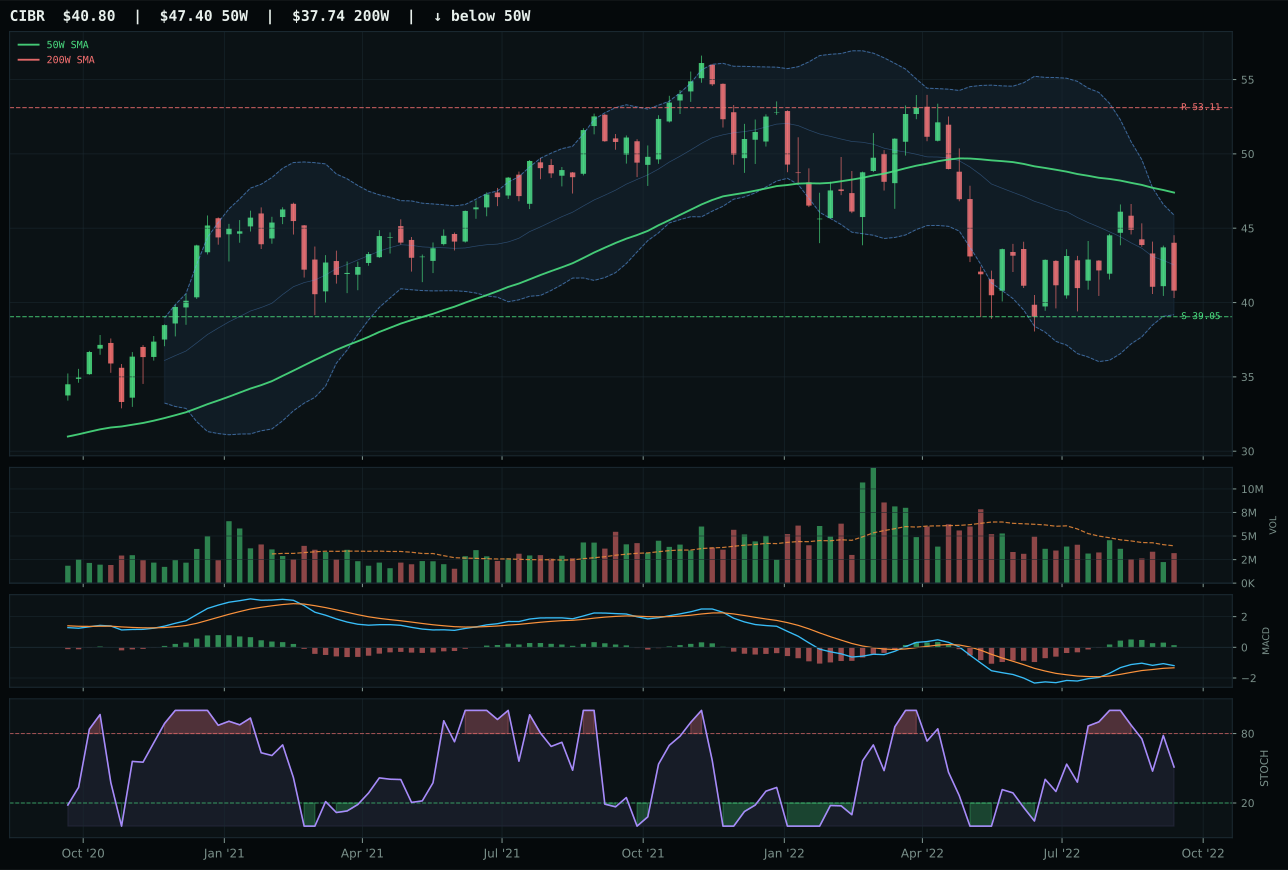
CIBR has a pullback into support profile with -0.9% 13-week relative strength versus SPY.
A failed hold above support would weaken the setup.
Actionable but governed by invalidation levels.
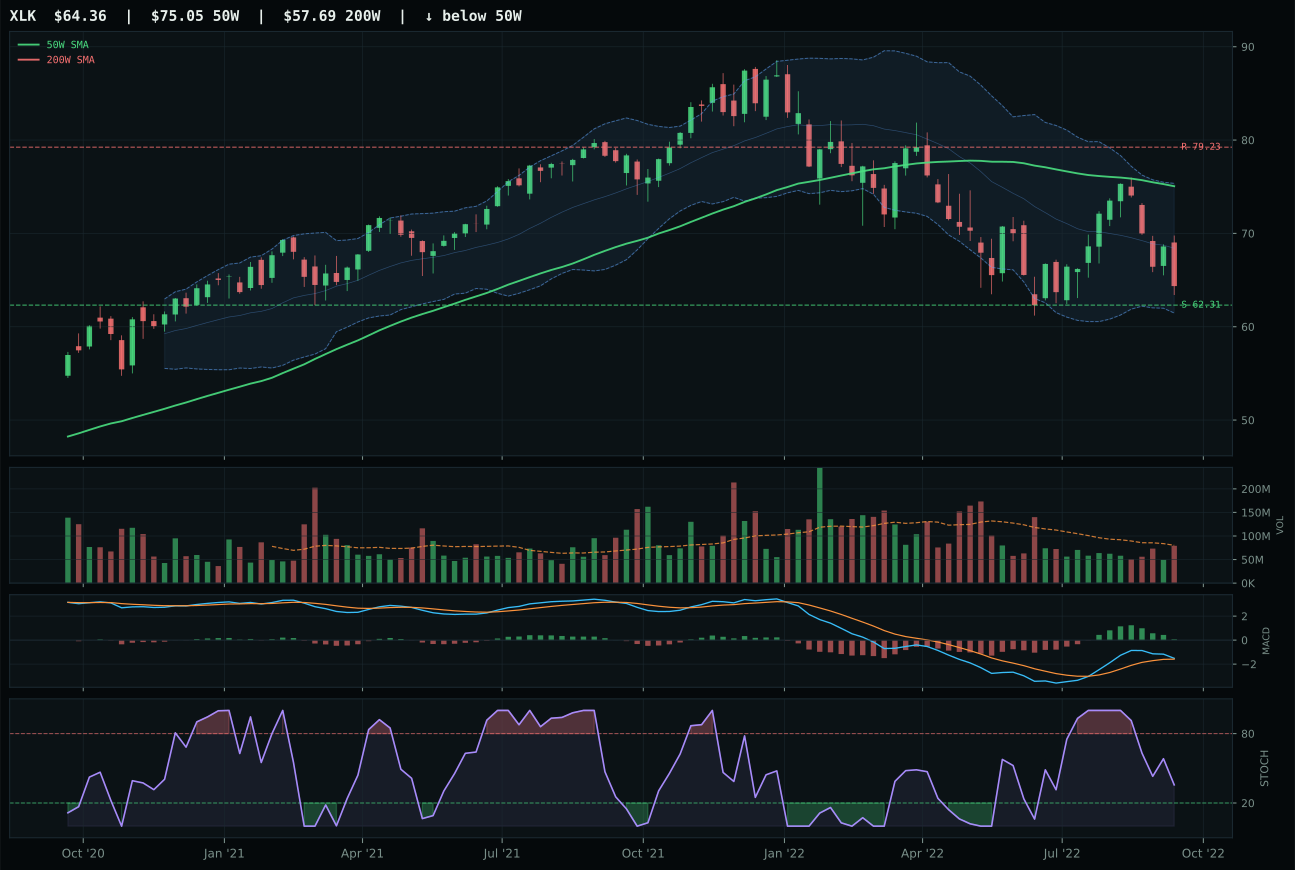
XLK has a pullback into support profile with -2.1% 13-week relative strength versus SPY.
A failed hold above support would weaken the setup.
Actionable but governed by invalidation levels.
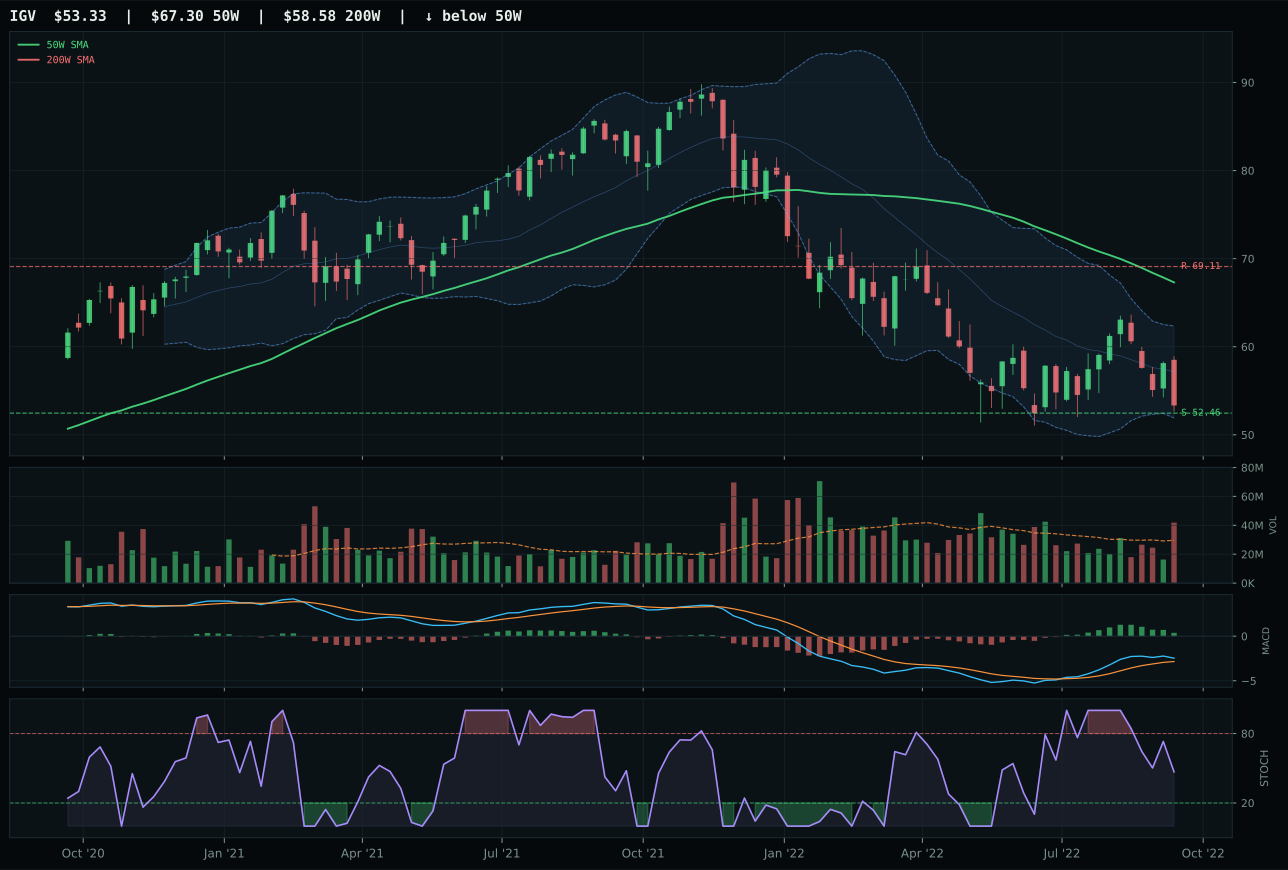
IGV has a pullback into support profile with -3.7% 13-week relative strength versus SPY.
A failed hold above support would weaken the setup.
Actionable but governed by invalidation levels.
CIBR edged out XLK by 1.7 points on the strength of superior category-relative strength: 1.2% versus 0.0%, a critical differentiator in a defensive rotation regime where relative positioning inside the basket matters more than absolute momentum. The cybersecurity ETF is pulling into support at 39.05 with price 13.9% below the 50W, creating a defined reset with clean compression (62.4/100) and risk/reward tilted toward the downside at only 4.5% to support versus 23.2% penalty to resistance. MACD is bullish but flattening and stochastic RSI is neutral—not confirming strength, but signaling no fresh deterioration. Volume is sitting at 0.80x the 20W average, which means the pullback is happening on thin air rather than panic selling, a prerequisite for a tradable coil.
Technology landed at 5% allocation in tier-2, below the two overweight categories but above the zero line. The category's 26.8 final score reflects a macro environment actively hostile to growth: liquidity stress, credit stress, and dollar pressure are all active, each dragging down the 24.0/100 category-level macro fit. Late-Cycle Reflation does not help technology, and the broad market bear is already in progress. CIBR's narrow edge over XLK cannot overcome the structural headwind, and until either credit conditions ease or the dollar rollover becomes real, this category serves as a defensive placeholder rather than a conviction play. The setup is clean and the risk/reward is acceptable, but the real allocation capital will flow to real assets and rate hedges first.
AI — BOTZ
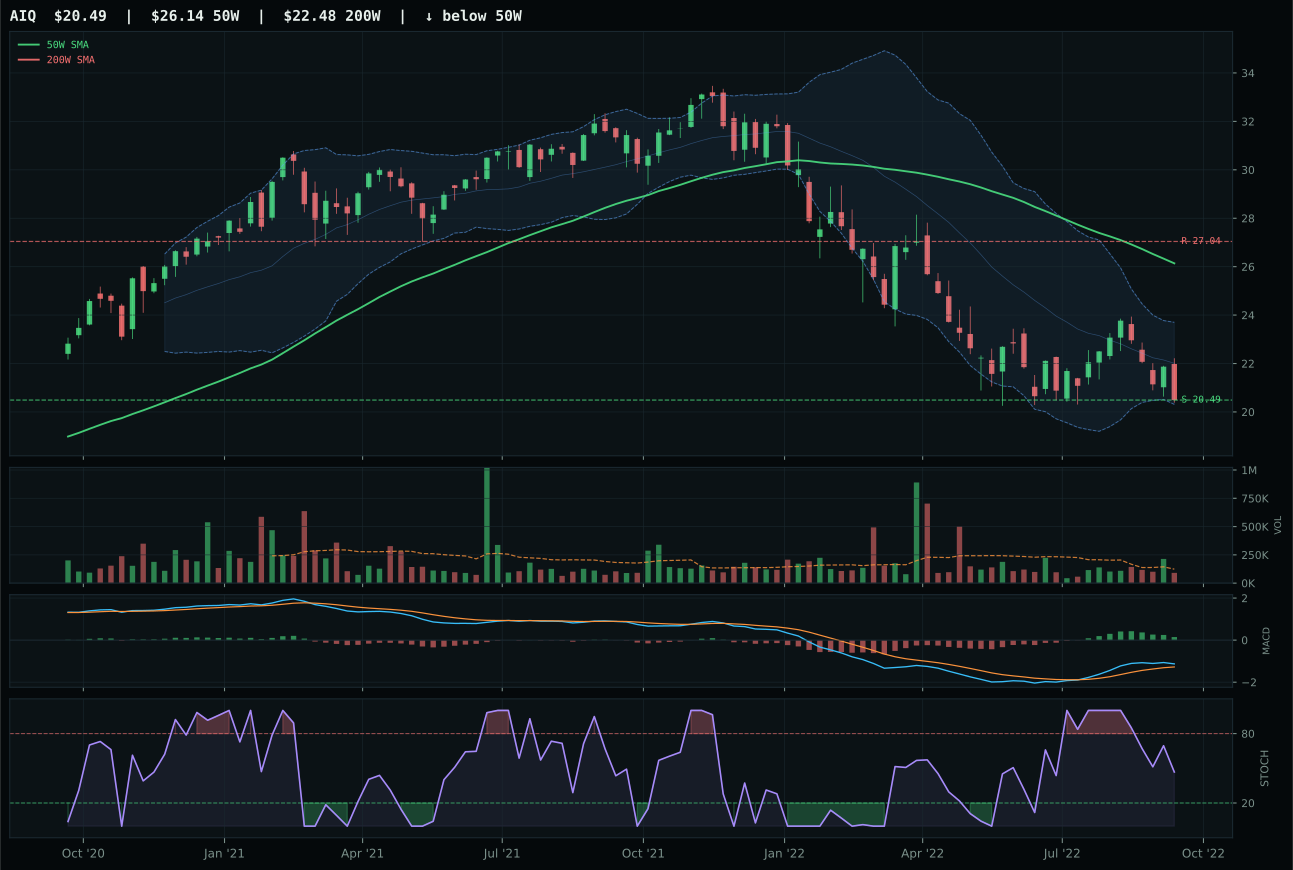
AIQ has a pullback into support profile with -6.2% 13-week relative strength versus SPY.
A failed hold above support would weaken the setup.
Tracked, but not top-2 eligible because: .
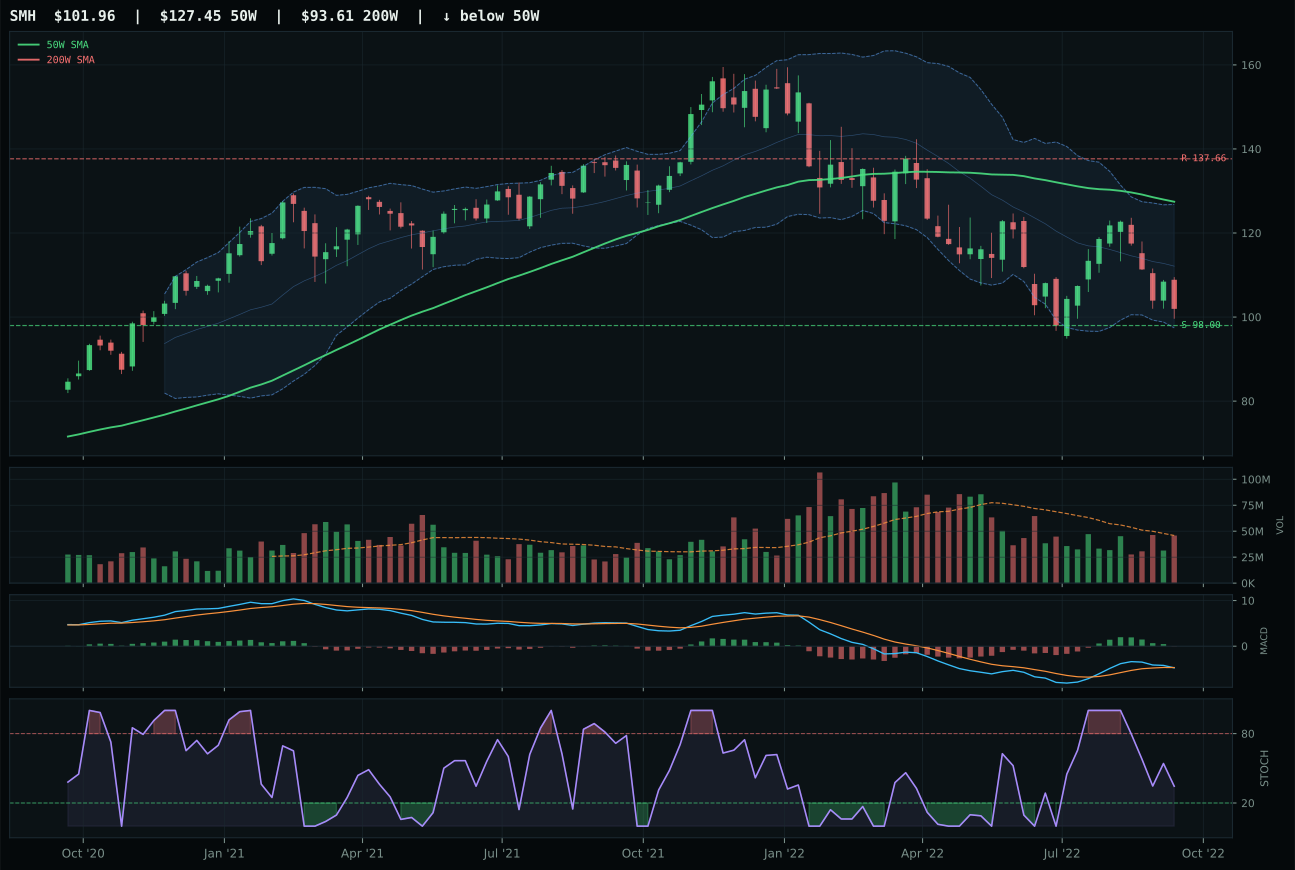
SMH has a pullback into support profile with -6.2% 13-week relative strength versus SPY.
A failed hold above support would weaken the setup.
Actionable but governed by invalidation levels.
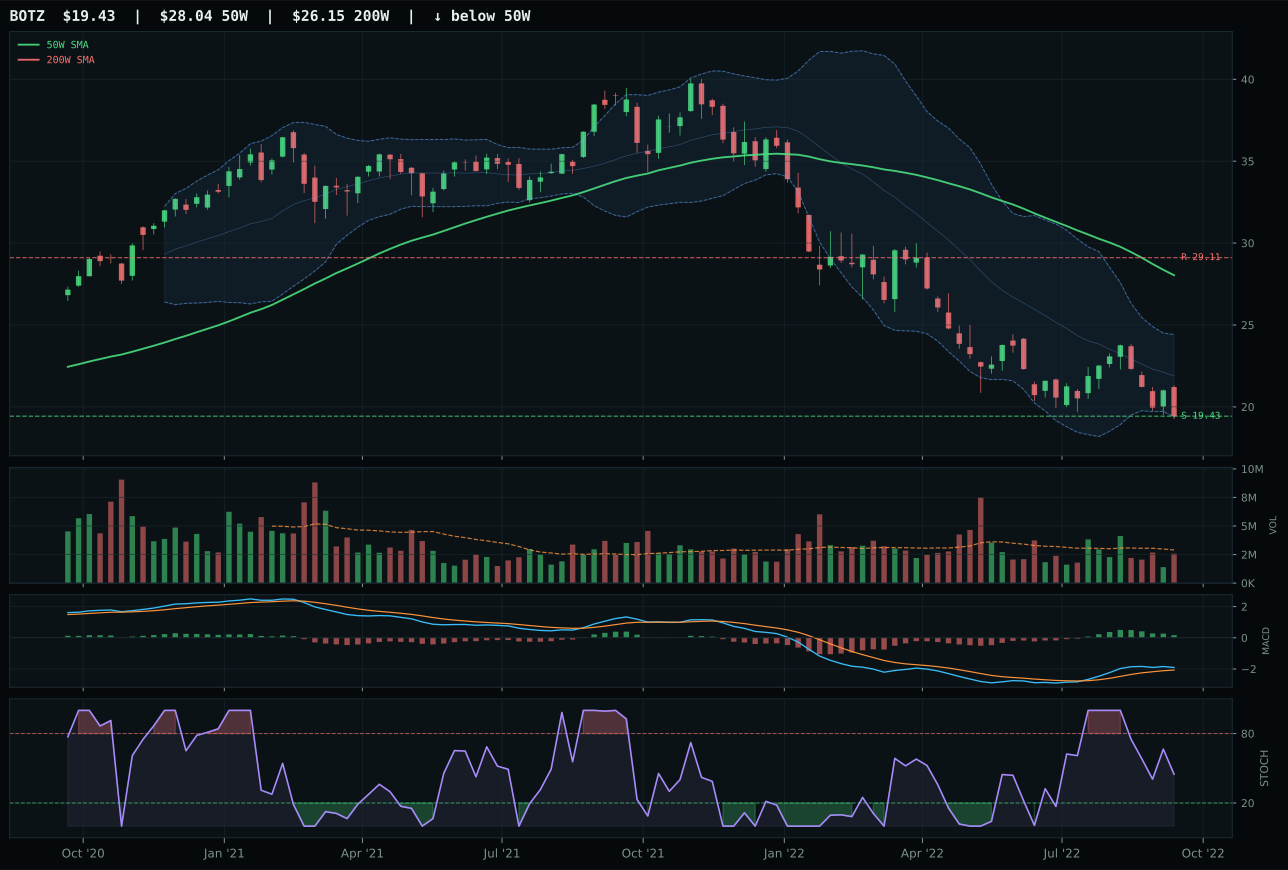
BOTZ has a pullback into support profile with -11.6% 13-week relative strength versus SPY.
A failed hold above support would weaken the setup.
Actionable but governed by invalidation levels.
BOTZ won a category that did not deserve winning by anyone. All three ETFs in the AI basket are broken—BOTZ simply broke less visibly than the others. The winner trades 11.6% below SPY on a 13W return of negative 6.2%, with price 30.7% underwater from the 50W and sitting directly on support at 19.43 near the 52W low. Structure scored 67.6/100 only because the chart is bottoming; momentum confirmation is essentially zero at 0.3/100, dragged down by negative 12.9% 4W return and negative 5.4% category-relative weakness. MACD is bullish but flattening—a warning flag, not a confirmation. The 90.0/100 risk/reward score is misleading: it reflects only that downside risk is contained, not that upside is probable.
AI received 0% allocation this week, ranked outside the top-eight categories eligible for capital. The category scored 6.2, making it the second-weakest in the portfolio behind only Emerging Markets at 3.2. Liquidity stress, credit stress, and broad market bear are each penalizing this space, and the macro fit is 18.0/100—nearly half the energy category. Every AI representative (BOTZ, AIQ, SMH) is trading below both its 50W and 200W, stalling on rising rates and margin compression. The setup is not broken enough to be a screaming buy, and the macro is not supportive enough to justify patience. Until either the Fed signals pivot or credit spreads tighten materially, AI remains a forced seller's category.
Emerging Markets — INDA
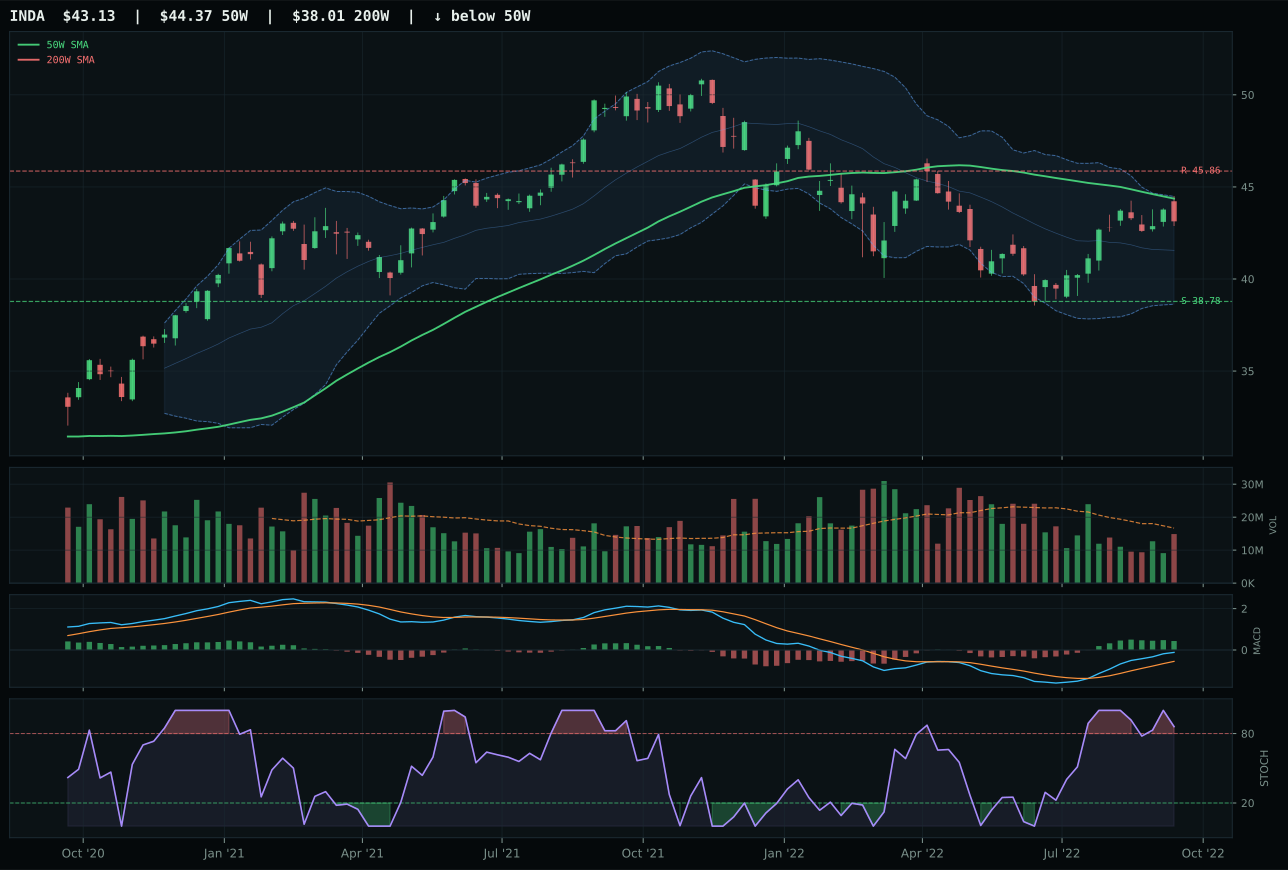
INDA has a compression near 50W profile with 5.8% 13-week relative strength versus SPY.
A failed hold above support would weaken the setup.
Actionable but governed by invalidation levels.
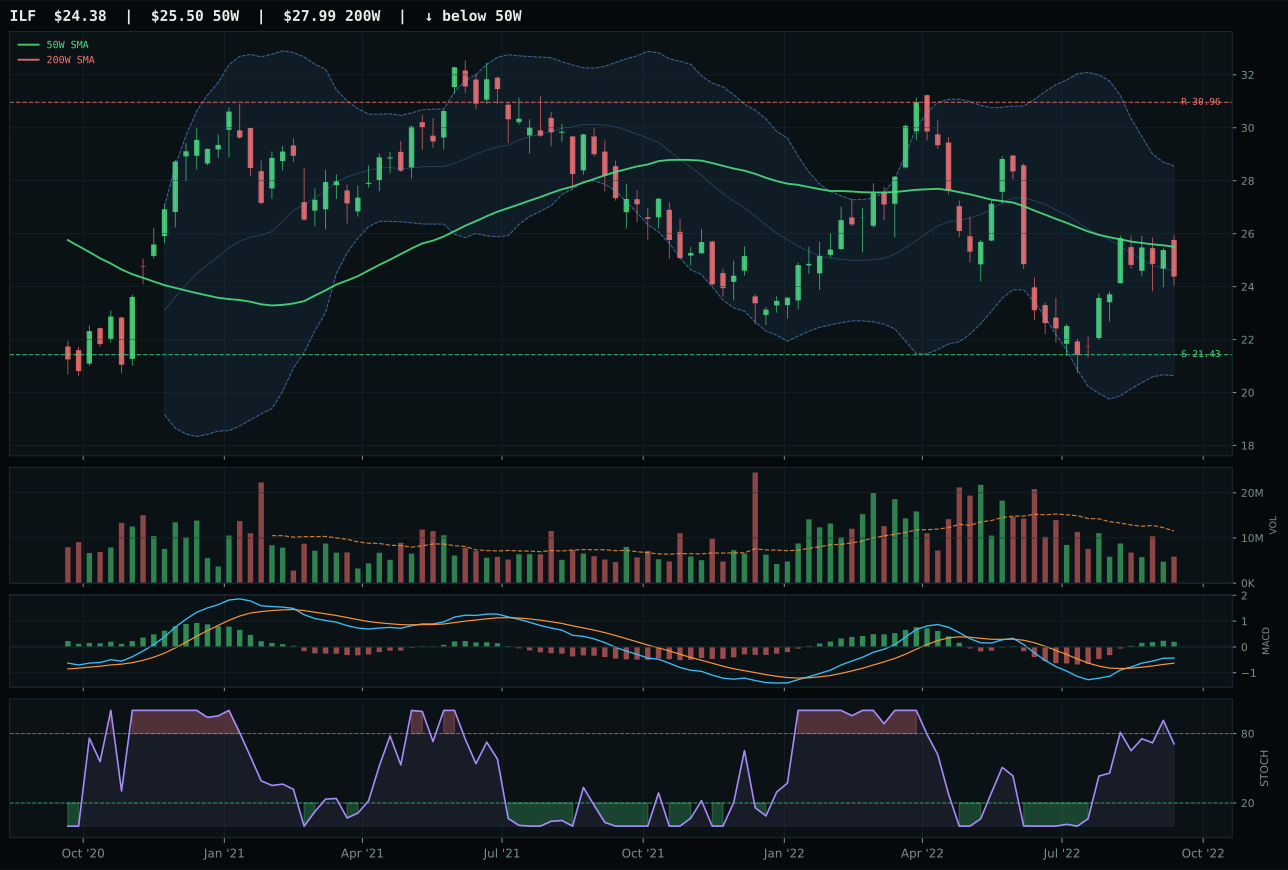
ILF has a neutral structure profile with 0.1% 13-week relative strength versus SPY.
Extension and support failure are the main tactical risks.
Tracked, but not top-2 eligible because: structurally broken.
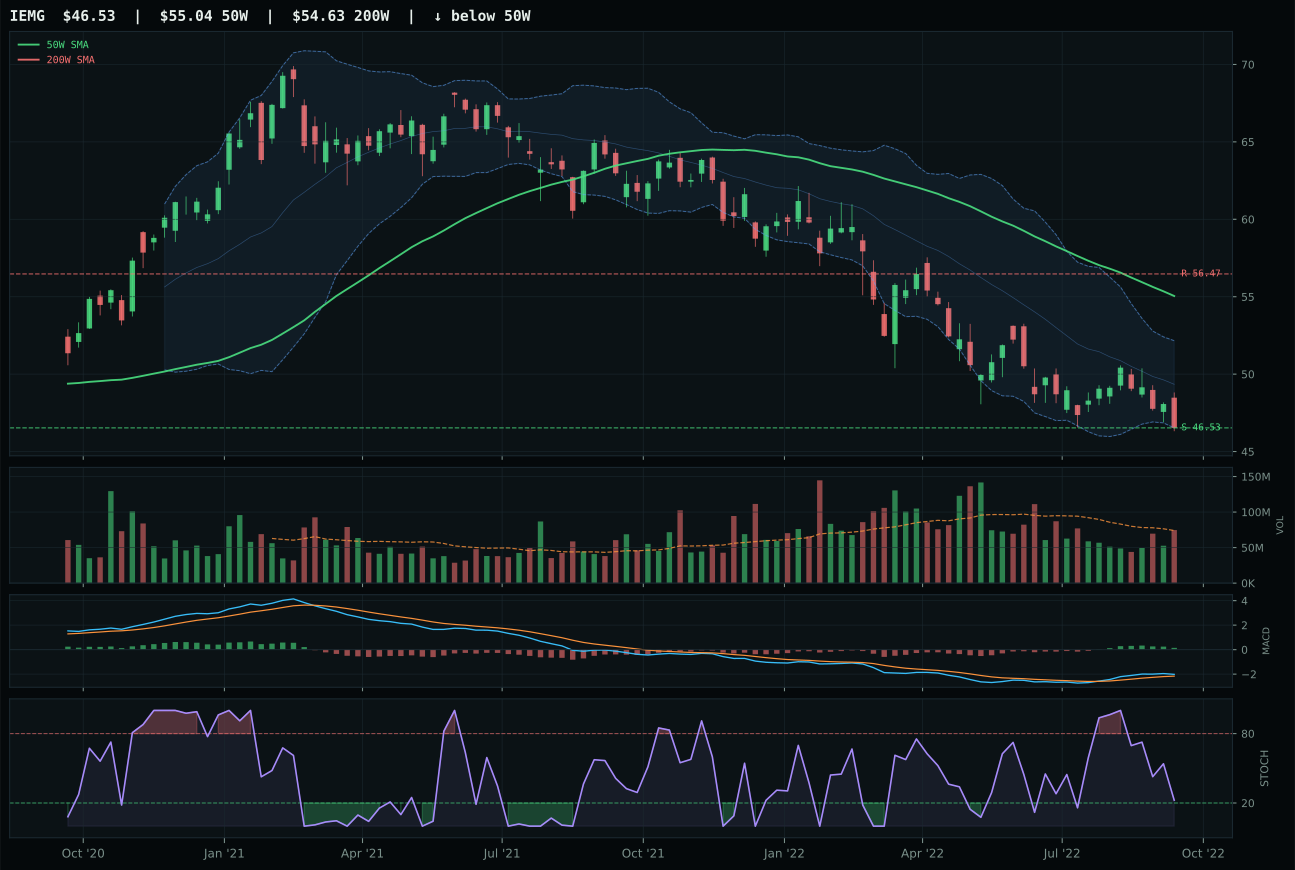
IEMG has a pullback into support profile with -9.8% 13-week relative strength versus SPY.
A failed hold above support would weaken the setup.
Actionable but governed by invalidation levels.
INDA won Emerging Markets with a technically dominant setup—80.0 composite score, perfect 100.0 timing, strong 85.0 momentum—but faced a 7.0/100 category-level macro fit so toxic that the entire category earned zero allocation. The India ETF compresses within 2.8% of the 50W with MACD bullish but flattening and stochastic RSI overbought, capturing a clean technical coil. The 13W return is positive 11.2% and category-relative strength is positive 5.7%, meaning India is outperforming its EM peers. Volume-price confirmation is 68.5/100, indicating real participation. Versus runner-up ILF, INDA's timing is superior (100.0 vs 90.0), structure is cleaner (77.8 vs 39.6), and category-relative strength dominates (5.7% vs 0.0%). Despite these technical virtues, macro conditions are overwhelming.
Emerging Markets received 0% allocation this week, ranked outside the funded categories due to a 3.2 final score and a catastrophic 7.0/100 macro fit. Dollar pressure is active (-14), credit stress is active (-10), liquidity stress is active (-10), and broad market bear is in effect (-9). INDA's positive 5.8% SPY-relative return and tight technical coil cannot overcome a regime where EM currencies are collapsing, capital flows are reversing, and dollar strength is the dominant macro driver. The category is not broken—INDA's setup is excellent—but the macro environment is explicitly punitive to anything exposed to dollar strength and credit tightening. ILF and IEMG are in even worse positions. The allocation to zero is correct: INDA would need either dollar weakness confirmation or a significant rally in UST yields to break the negative macro spell.