
2022-09-09
Informational purposes only. The content in this report, including allocations, analysis, and commentary, is provided solely for informational and educational purposes. It does not constitute financial advice, investment advice, trading advice, or any other type of advice. Past performance does not guarantee future results. Always conduct your own research and consult a qualified financial professional before making investment decisions.
GLD defensive overlay excluded: price is below its 8W SMA. Cause selector will use cash alternative.
Macro risk engine requires the 50% Defensive overlay for this run; payload selected by cause: Transition Defense.
Weekly Allocation
| Ticker | Category | Weight | Role |
|---|---|---|---|
| SGOV | 20% | Overlay | |
| GLD | Precious Metals | 20% | Overlay |
| XLU | Utilities & Infrastructure | 25% | Overlay |
| URNM | Nuclear Energy | 10% | Top-2 (10%) |
| ITA | Defense & Aerospace | 5% | Tier-2 (5%) |
| PICK | Industrial Metals | 5% | Tier-2 (5%) |
| CIBR | Technology | 5% | Tier-2 (5%) |
| WEAT | Agriculture & Livestock | 5% | Tier-2 (5%) |
| XLE | Traditional Energy | 5% | Tier-2 (5%) |
Trade Instructions — Monday Open
Sell the tranche from 2022-08-12 (completing its 4-week hold). Buy the new tranche. Instructions show net portfolio changes — same-asset positions cancel, weight changes show the delta.
| Action | Ticker | Instruction |
|---|---|---|
| SELL | PAVE | Sell entire PAVE position (5.00% of portfolio) |
| SELL | XAR | Sell 80% of XAR position (reduce 6.25% → 1.25%) |
| SELL | IGV | Sell entire IGV position (2.50% of portfolio) |
| SELL | SLV | Sell entire SLV position (2.50% of portfolio) |
| SELL | REMX | Sell 67% of REMX position (reduce 3.75% → 1.25%) |
| SELL | BOTZ | Sell entire BOTZ position (2.50% of portfolio) |
| SELL | MOO | Sell 50% of MOO position (reduce 5.00% → 2.50%) |
| BUY | SGOV | Buy SGOV — 22.22% of freed cash (adds 5.00% to portfolio) |
| BUY | GLD | Buy GLD — 22.22% of freed cash (adds 5.00% to portfolio) |
| BUY | XLU | Buy XLU — 27.78% of freed cash (adds 6.25% to portfolio) |
| BUY | ITA | Buy ITA — 5.56% of freed cash (adds 1.25% to portfolio) |
| BUY | CIBR | Buy CIBR — 5.56% of freed cash (adds 1.25% to portfolio) |
| BUY | XLE | Buy XLE — 5.56% of freed cash (adds 1.25% to portfolio) |
| BUY | PICK | Buy PICK — 5.56% of freed cash (adds 1.25% to portfolio) |
| BUY | WEAT | Buy WEAT — 5.56% of freed cash (adds 1.25% to portfolio) |
Current Portfolio After Trade
Combined holdings across all 4 active tranches. Each tranche is 25% of the portfolio.
| Ticker | % of Portfolio | Weight Bar |
|---|---|---|
| XLU | 25.00% | |
| GLD | 21.25% | |
| SGOV | 20.00% | |
| URNM | 5.00% | |
| ITA | 3.75% | |
| CIBR | 3.75% | |
| MOO | 2.50% | |
| SMH | 2.50% | |
| COPX | 2.50% | |
| GDX | 2.50% | |
| XLE | 2.50% | |
| REMX | 1.25% | |
| XLK | 1.25% | |
| URA | 1.25% | |
| XOP | 1.25% | |
| PICK | 1.25% | |
| WEAT | 1.25% | |
| XAR | 1.25% |
Macro Regime — Disinflation
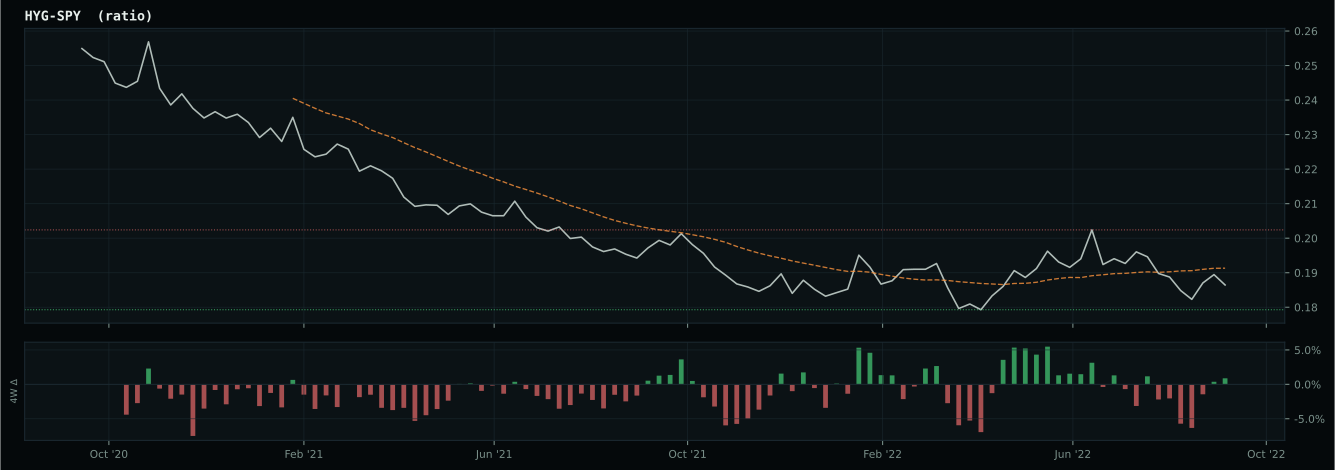
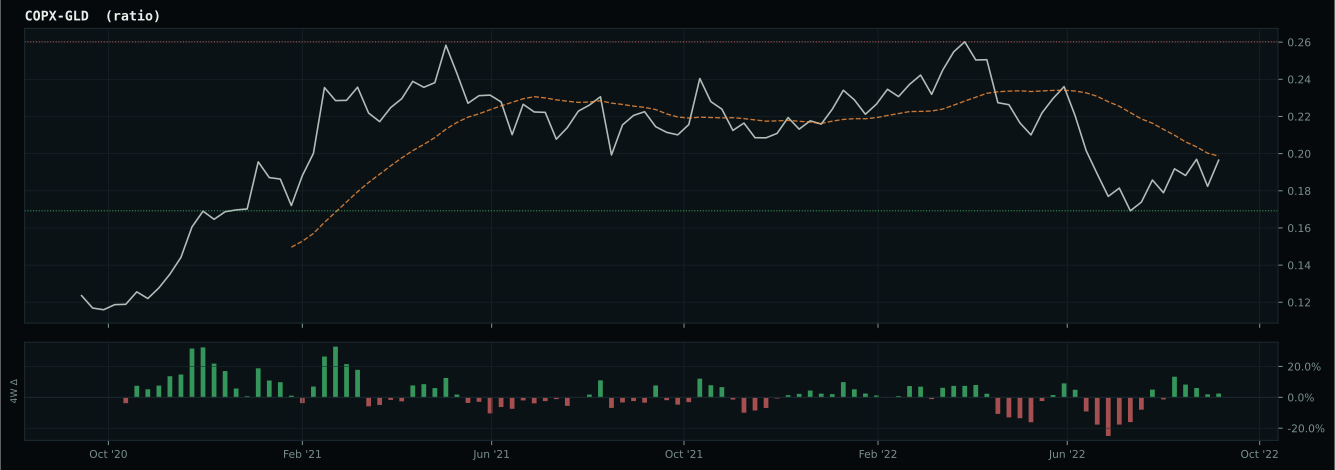
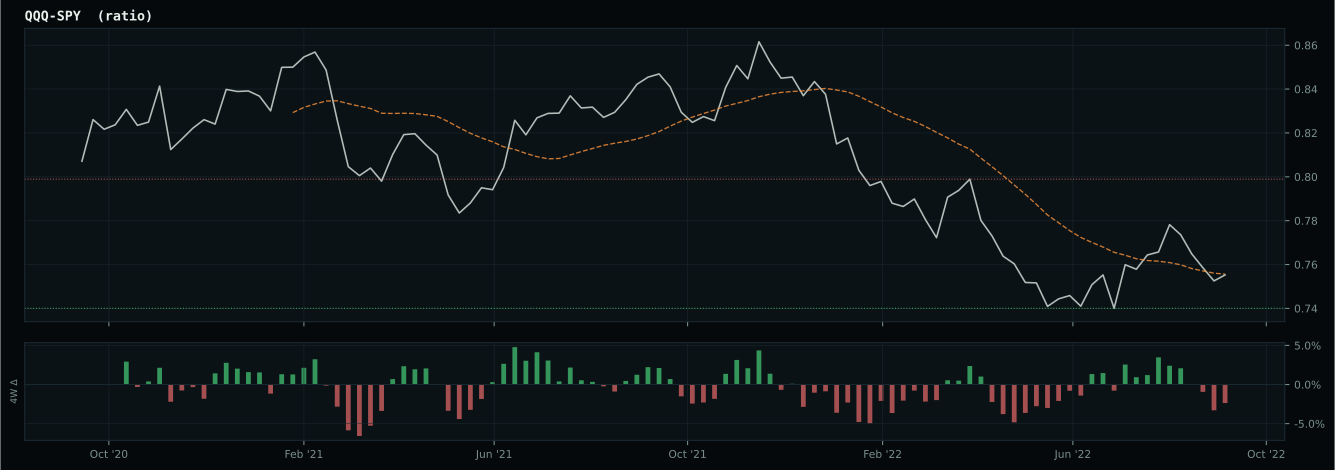
growth data is not confirming the weak market-implied risk appetite signal
Defensive overlay cause is not singular enough to concentrate: the sleeve diversifies across liquidity, monetary defense, and defensive equity exposure while the market resolves the next regime.
Macro Evidence Charts
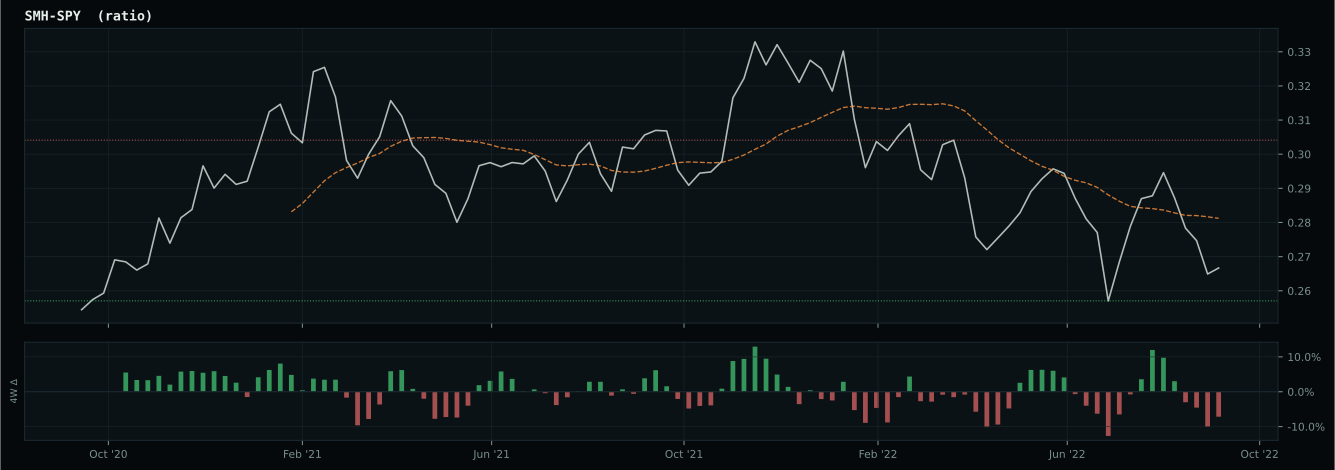
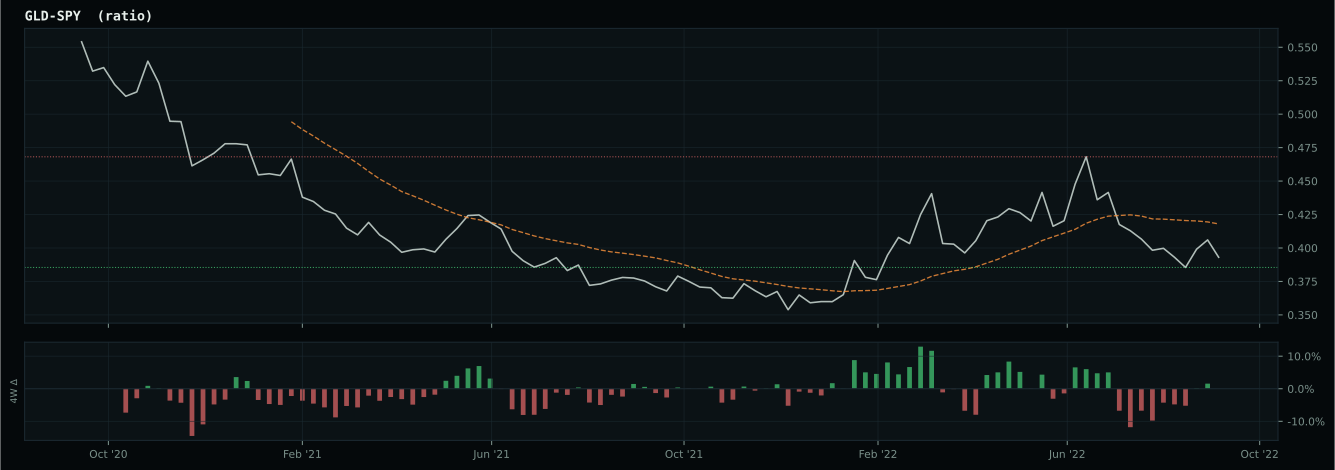
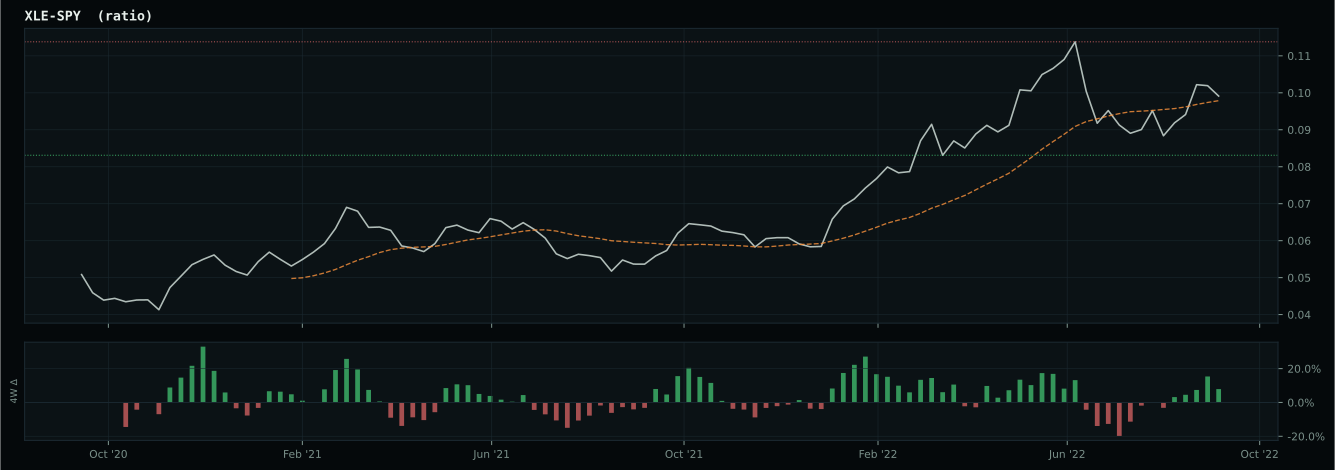
Market-implied signals behind the macro regime scores. Each ratio compares two assets; the direction and slope of the ratio is what the macro engine reads.
Crypto Regime — NoCrypto
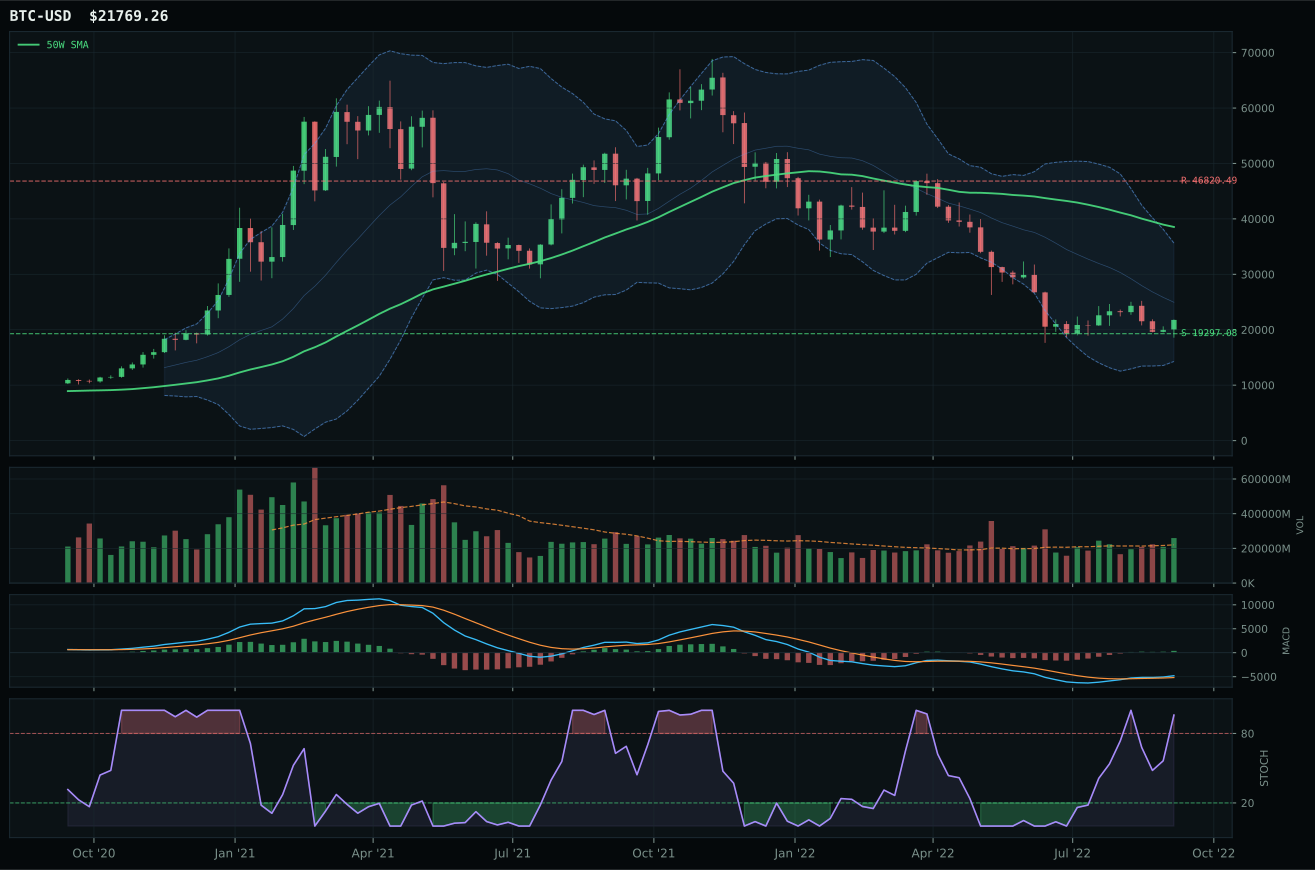
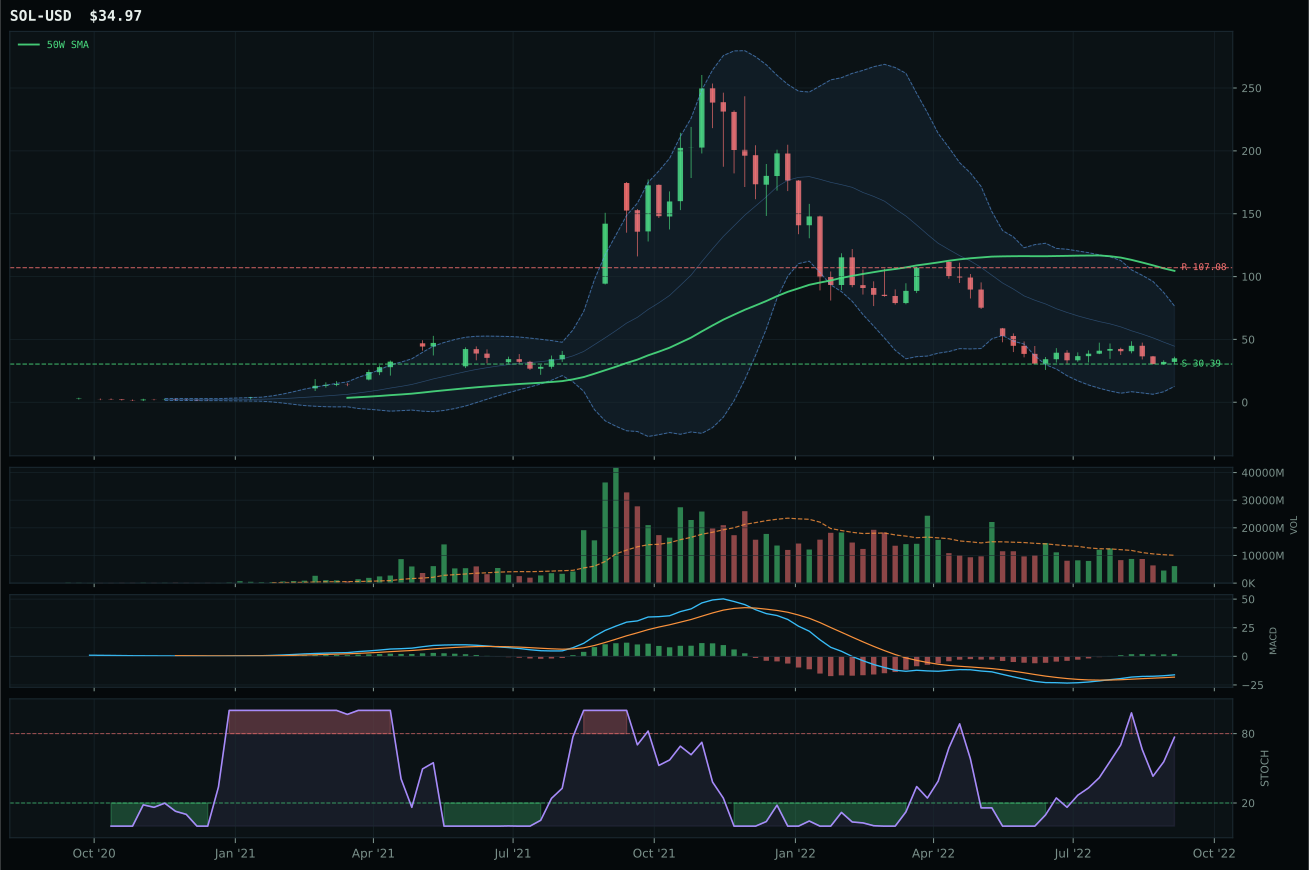
ValueBTC armed; waiting for 50W reclaim, decisive close above post-touch range resistance by 3%, close above 200W
TrendBTC not confirmed
one or more available conditions failed
Category Rankings
| Rank | Category | Winner | Score | Alloc | 4W Ret | Peers (4W) |
|---|---|---|---|---|---|---|
| 1 | Utilities & Infrastructure | XLU | 69.4 | 20% | -17.66% | PAVE -10.3% · IGF -14.2% |
| 2 | Nuclear Energy | URNM | 54.9 | 20% | -18.52% | URA -15.2% · NLR -9.3% |
| 3 | Precious Metals | GLD | 48.6 | 10% | -3.17% | SLV +0.2% · GDX -6.5% |
| 4 | Defense & Aerospace | ITA | 47.8 | 10% | -7.22% | XAR -9.8% · ROKT -7.9% |
| 5 | Industrial Metals | PICK | 42.5 | 10% | -8.73% | REMX -19.9% · COPX -8.6% |
| 6 | Technology | CIBR | 36.3 | 10% | -10.59% | IGV -12.3% · XLK -12.5% |
| 7 | Agriculture & Livestock | WEAT | 32.7 | 10% | +4.32% | MOO -10.2% · VEGI -7.4% |
| 8 | Traditional Energy | XLE | 13.8 | 10% | +0.42% | FCG -2.7% · XOP -1.7% |
| 9 | AI | SMH | 12.0 | 0% | -13.54% | AIQ -11.6% · BOTZ -12.5% |
| 10 | Emerging Markets | INDA | 2.5 | 0% | -7.28% | IEMG -9.9% · ILF -0.3% |
Utilities & Infrastructure — XLU
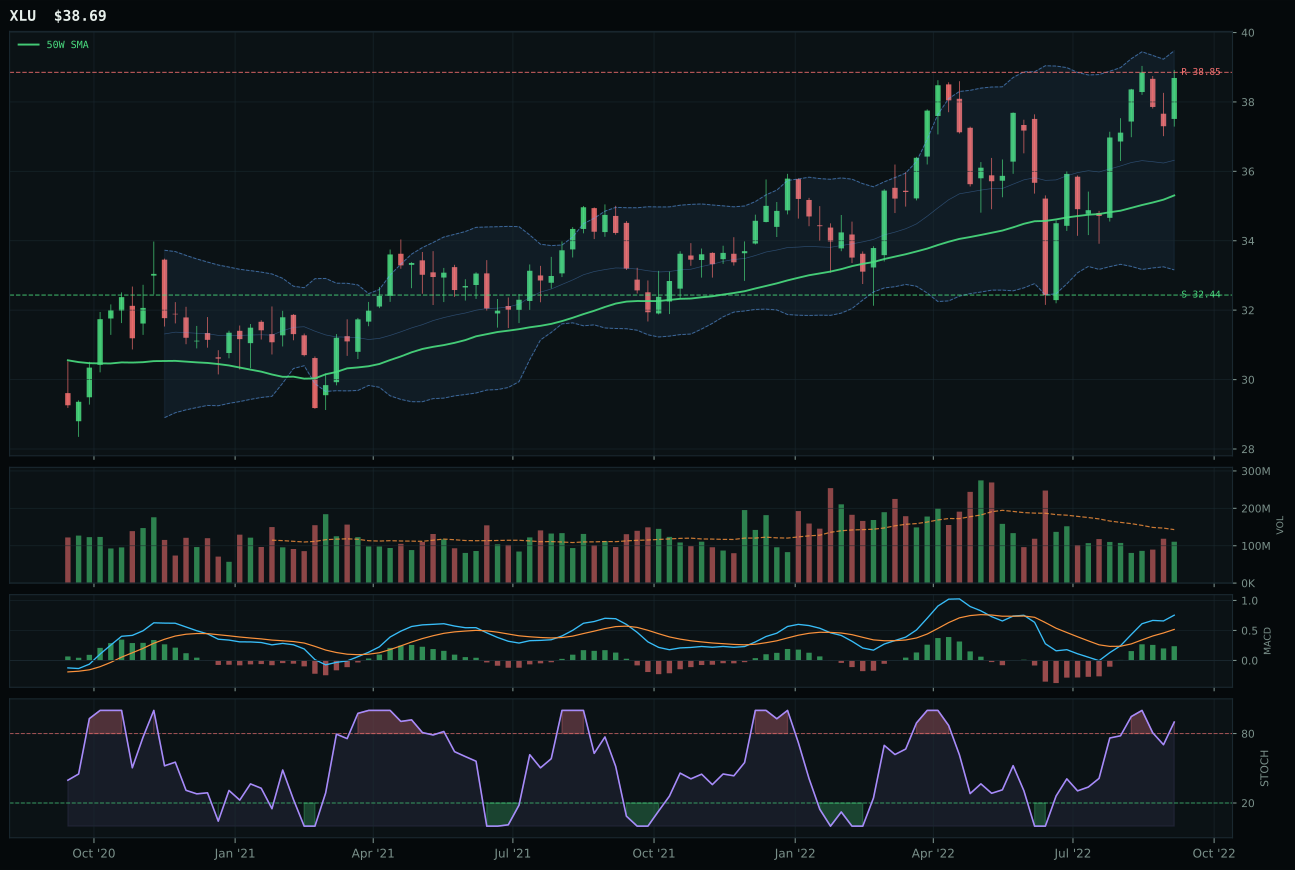
XLU has a neutral structure profile with 4.2% 13-week relative strength versus SPY.
A failed hold above support would weaken the setup.
Actionable but governed by invalidation levels.
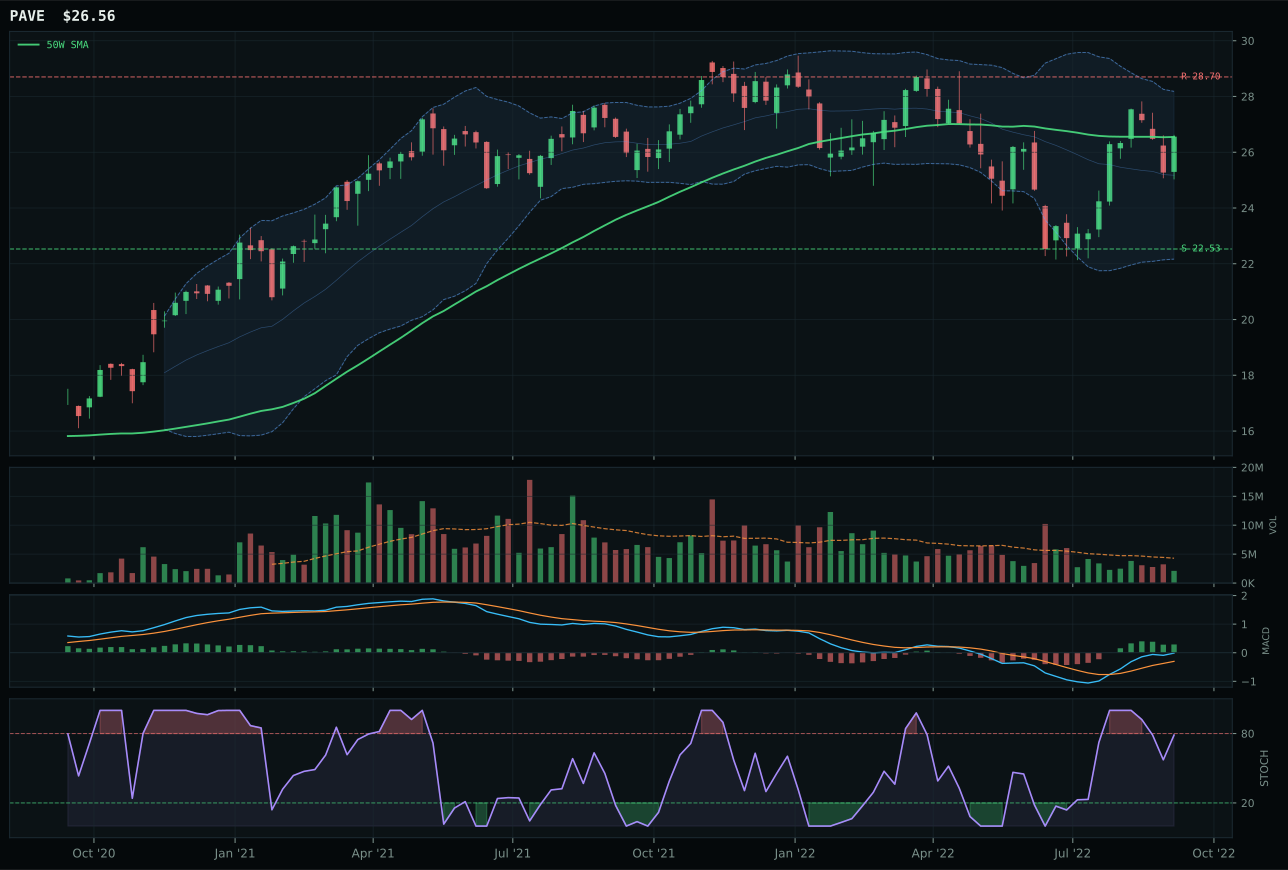
PAVE has a compression near 50W profile with 3.4% 13-week relative strength versus SPY.
A failed hold above support would weaken the setup.
Actionable but governed by invalidation levels.
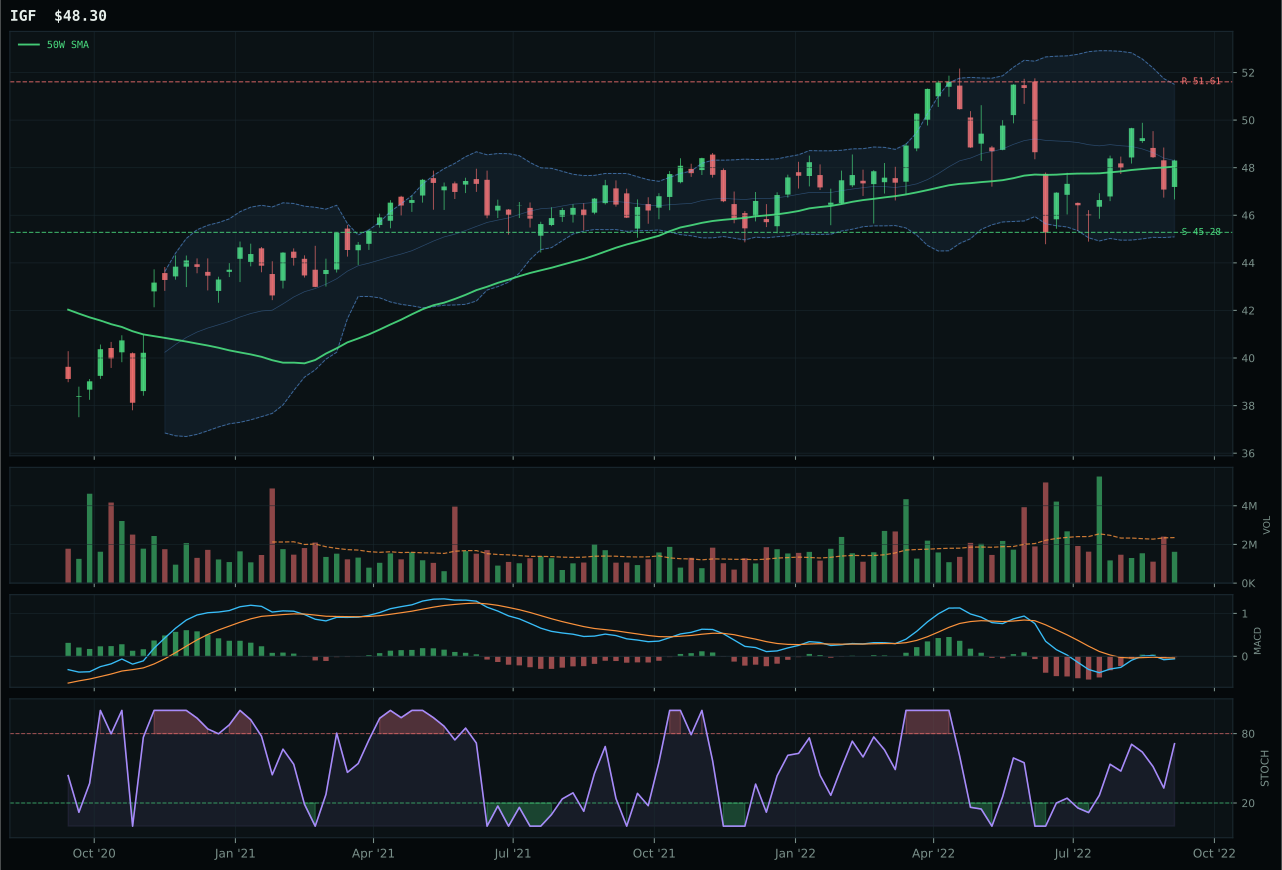
IGF has a compression near 50W profile with -5.0% 13-week relative strength versus SPY.
A failed hold above support would weaken the setup.
Actionable but governed by invalidation levels.
XLU claimed the top-2 slot with a dominant 69.4 final score by posting a perfect 100.0 trend score—price above both moving averages with a non-deteriorating 50W slope and 4.2% RS versus SPY—and by assembling superior MACD and momentum confirmation relative to PAVE. XLU's 71.4 momentum confirmation reflects 8.5% 13-week return and 0.8% category relative strength, confirming that regulated utility demand is real and broad. The runner-up PAVE, while posting a superior 100.0 timing score and compression near the 50W, stumbled on MACD confirmation (bullish but flattening vs bullish and improving), volume (thin participation vs neutral), and category relative strength (0.0% vs 0.8%). XLU is extended 9.6% above the 50W, which would normally penalize entry, but the neutral structure and 37.4/100 risk/reward suggest the extension is gradual rather than parabolic—this is a category where the move is sustainable because it is being accumulated at scale, not chased on gap moves.
Utilities & Infrastructure earned 10% allocation as the first top-2 category, ranked highest at 69.4 final score by a significant margin. Macro fit is exceptional at 80.0/100 because disinflation helps this exposure (+7), defensive rotation is active (+12), and broad market bear is active (+4). The regime itself—low inflation, negative real rates, and equity stress—is the native habitat for regulated utilities. XLU's 65.1 technical evidence combined with 72.0 macro fit creates the most resilient top-2 allocation in the portfolio. Volume is neutral rather than thin, suggesting broad participation rather than specialist accumulation, and the 8.5% 13-week return is real price appreciation, not technical rebound. The 10% allocation reflects that utilities are the best-risk-adjusted opportunity in the portfolio right now: buyers are accumulating at scale, the macro regime is supportive, and the entry is not severely extended. Expect this position to hold at 10% for at least two more weeks unless either disinflation reverses or risk appetite suddenly stabilizes.
Nuclear Energy — URNM
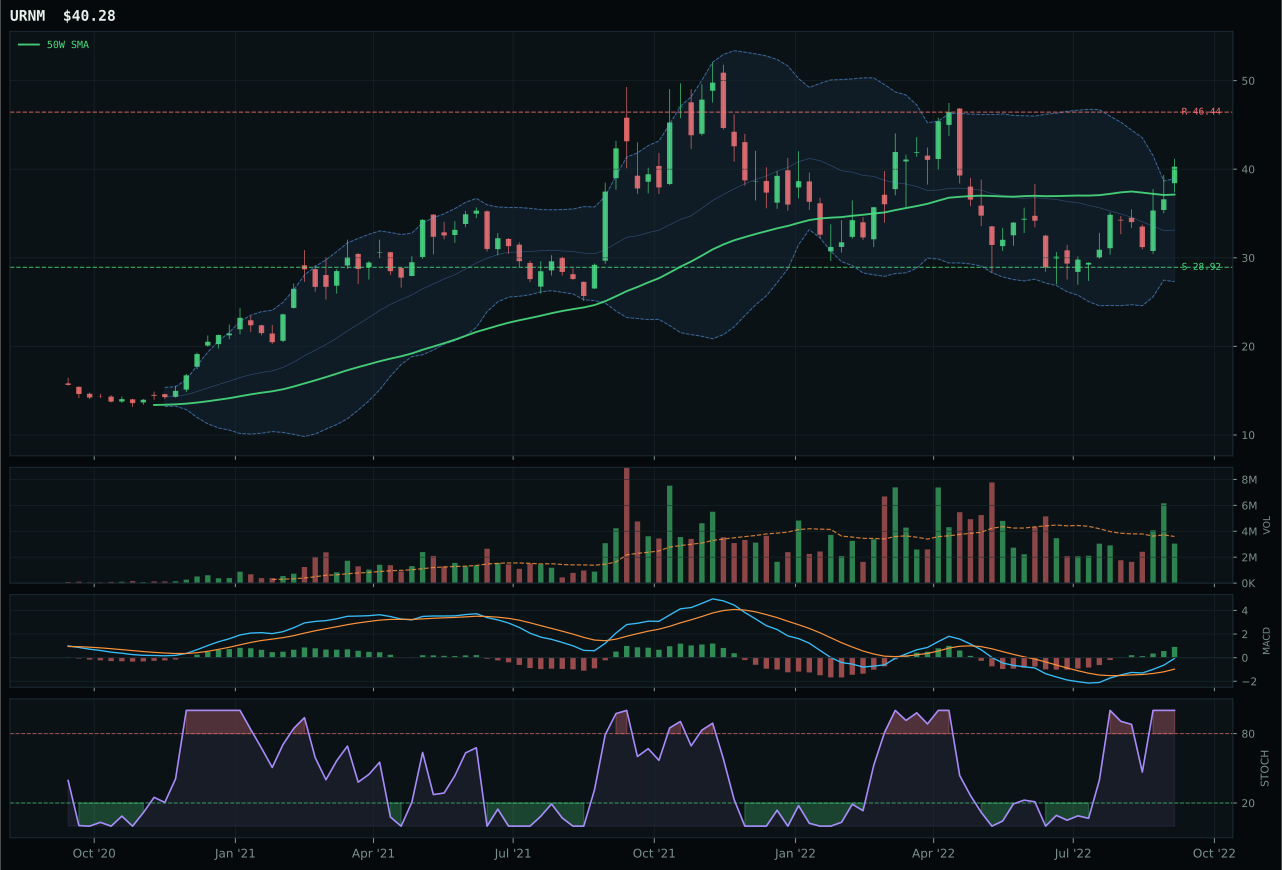
URNM has a neutral structure profile with 13.5% 13-week relative strength versus SPY.
A failed hold above support would weaken the setup.
Actionable but governed by invalidation levels.
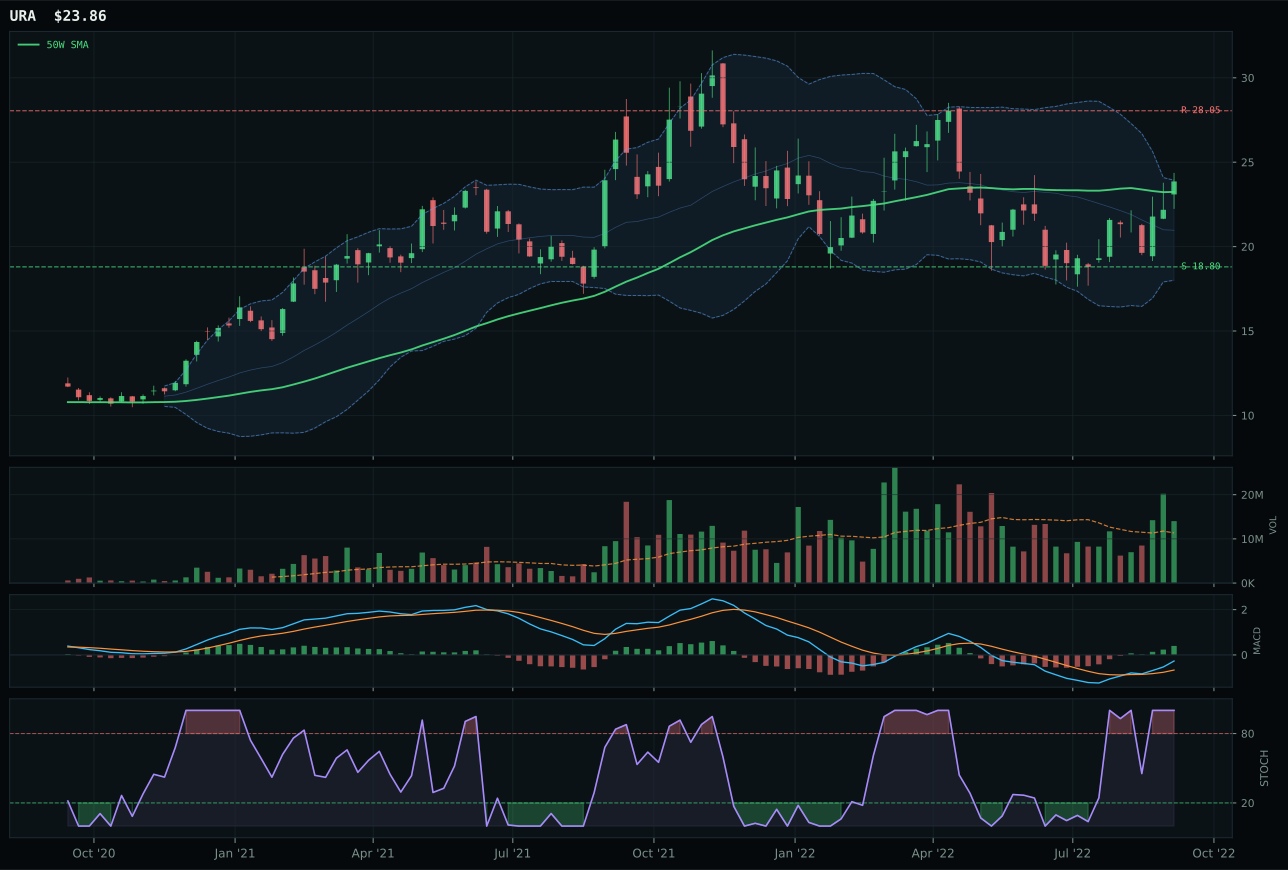
URA has a compression near 50W profile with 4.4% 13-week relative strength versus SPY.
A failed hold above support would weaken the setup.
Actionable but governed by invalidation levels.
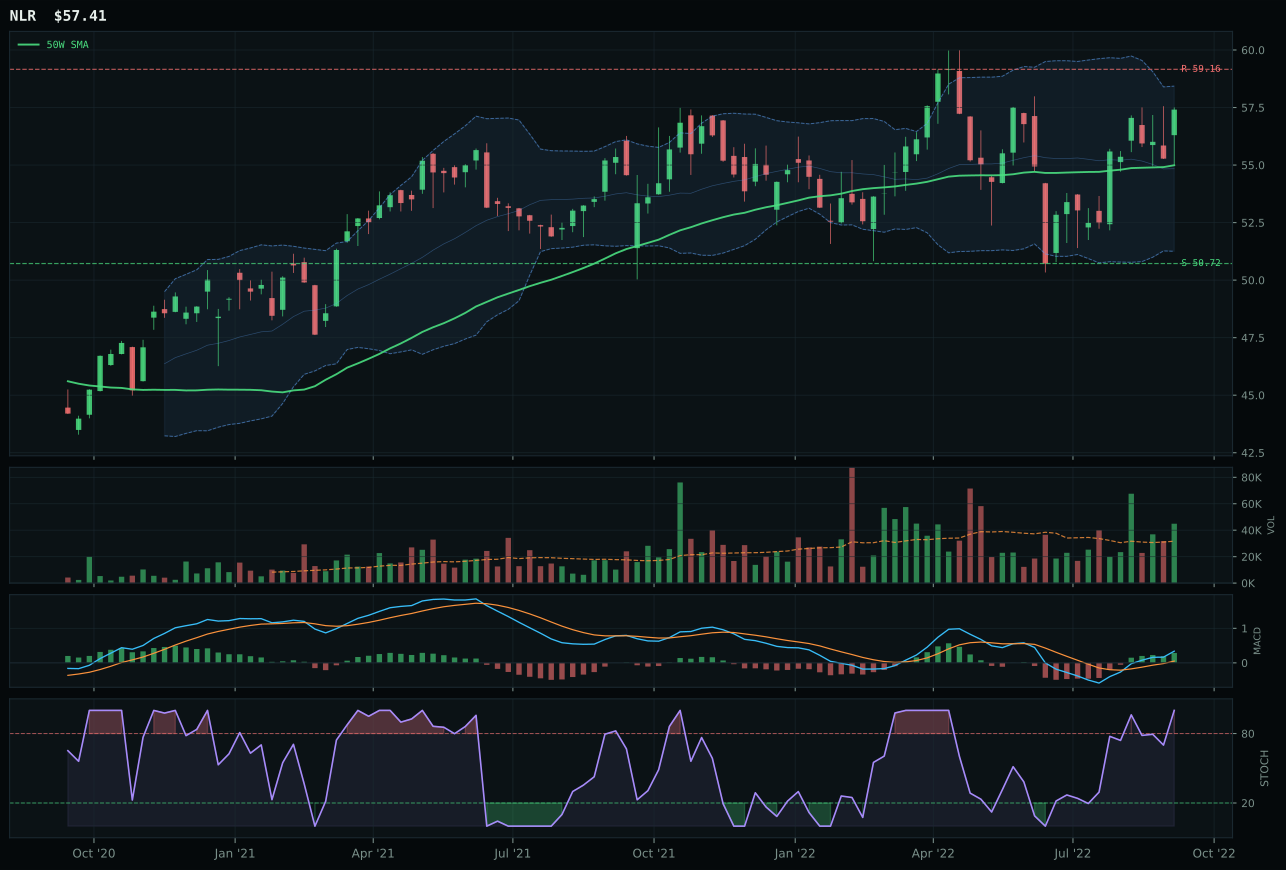
NLR has a neutral structure profile with 0.2% 13-week relative strength versus SPY.
A failed hold above support would weaken the setup.
Tracked, but not top-2 eligible because: .
URNM claimed the top-2 slot with a 54.9 final score by posting the highest momentum confirmation in the entire portfolio at 100.0—a 4-week return of 18.4% and 13-week return of 17.8% with RS versus SPY at 13.5% created undeniable proof of accumulation. The runner-up URA, while posting superior technical evidence at 89.1 versus URNM's 86.6 and a perfect timing score of 100.0, lagged on category relative strength at 0.0% versus URNM's 9.1%. URA is compression near the 50W with every indicator overbought, while URNM sits 8.5% from the 50W in the middle Fibonacci decision zone with neutral volume at 0.85x the 20W average—the latter provides breathing room for continuation. This is a category where the score benefited enormously from momentum confirmation, but the structural setup (neutral structure with MACD bullish and improving) suggests the move has more runway.
Nuclear Energy earned 10% allocation as the second top-2 category, selected because it scored 54.9 and ranked among the two highest in the field. Macro fit is 41.0/100, driven by real asset sponsorship (+7) and offset by liquidity stress (-7) and credit stress (-5). The allocation decision turns on momentum confirmation and volume-price sponsorship: URNM's 100.0 momentum confirmation score is the highest in the entire portfolio, and its 79.8 volume-price confirmation demonstrates buyers are accumulating at scale, not chasing. The 13-week return of 17.8% versus XLU's 8.5% reveals that uranium miners have already led the rotation into defensive real assets. The 10% allocation is appropriate, but watch the risk/reward score next week (currently only 44.1) because URNM is extended from support at 28.92 by 39.3%—if buyers lose conviction or if stochastic RSI rolls over from overbought, this could revert to 5% quickly. The category's rank depends entirely on sustained momentum confirmation.
Precious Metals — GLD
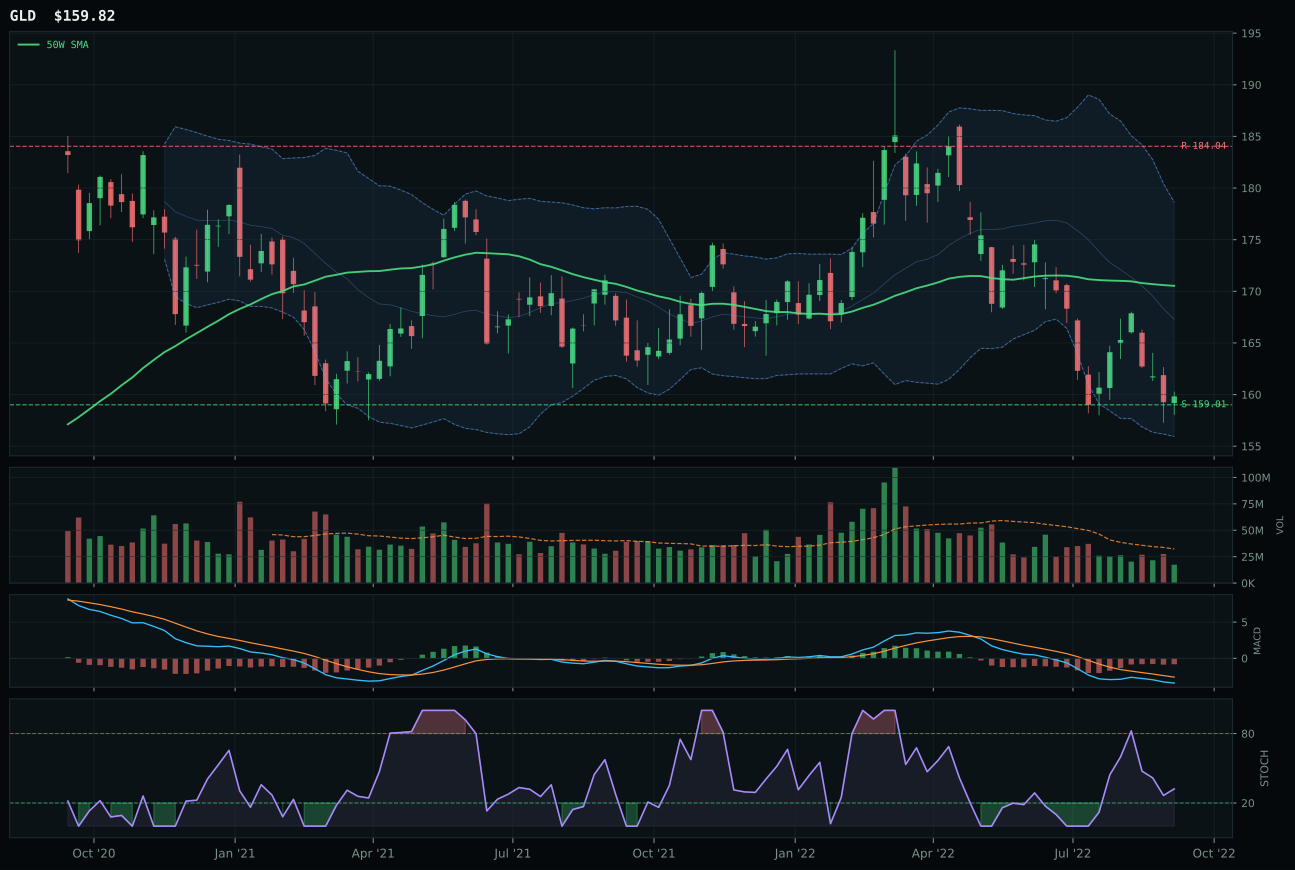
GLD has a pullback into support profile with -12.7% 13-week relative strength versus SPY.
A failed hold above support would weaken the setup.
Actionable but governed by invalidation levels.
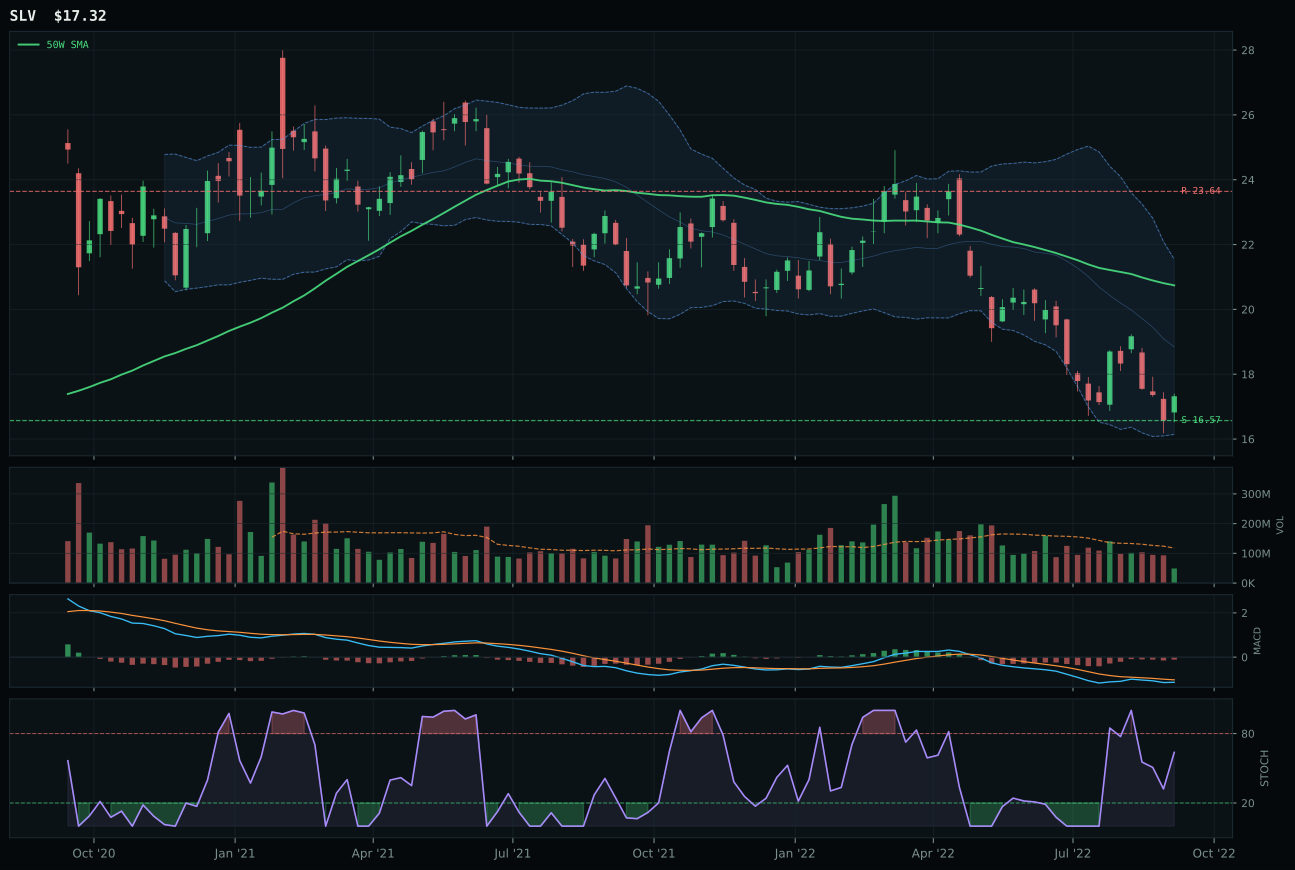
SLV has a pullback into support profile with -18.5% 13-week relative strength versus SPY.
A failed hold above support would weaken the setup.
Actionable but governed by invalidation levels.
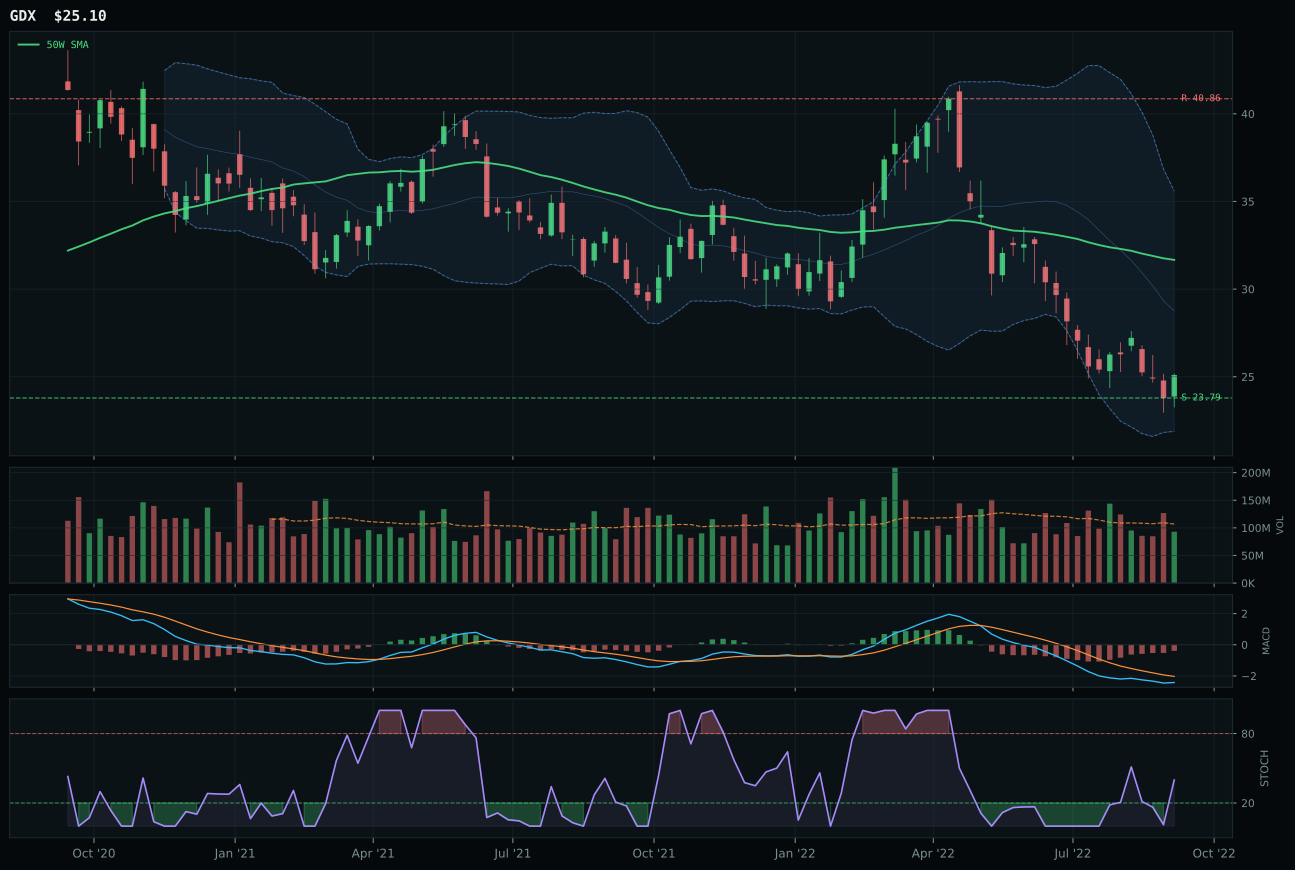
GDX has a neutral structure profile with -27.2% 13-week relative strength versus SPY.
A failed hold above support would weaken the setup.
Actionable but governed by invalidation levels.
GLD won the category with a commanding 23.6-point margin over SLV because its setup combines a defined support level (159.01, just 0.5% below current price) with a superior timing score of 85.0 versus SLV's 68.0—a 17-point gap that reflects GLD's proximity to support and improving MACD backdrop. The precious metals complex is catching a monetary hedge bid (+14 macro descriptor), but GLD's cleaner structure (68.8 vs 59.8) and superior category relative strength (5.8% vs 0.0%) reveal which ETF is capturing the accumulation. SLV's -18.5% RS versus SPY and bearish/weakening MACD signal industrial beta unwind; GLD's -12.7% RS versus SPY and bearish but improving MACD suggest pure monetary demand is driving the gold narrative. Risk/reward is exceptional on GLD at 90.0 because upside to resistance is -13.2% while downside to support is just 0.5%—buyers have defined risk, which is critical in a portfolio this defensive.
Precious Metals earned 5% allocation with a final score of 48.6, placing it in tier-2 but with some of the portfolio's strongest macro support at 88.0/100. Disinflation helps this exposure (+8), monetary hedge bid is active (+14), and defensive rotation is running strong (+7). This is the cleanest macro fit in the tier-2 band, explaining why the allocation system tolerates a 48.6 score here whereas it excluded categories with scores in the 35–42 range. GLD's 47.8 technical evidence combined with 80.0 macro fit creates a resilient position that justifies holding through modest technical weakness. The 5% allocation is appropriate because the portfolio already holds 10% in XLU and 10% in URNM for defensive rotation; GLD serves as a monetary hedge against the outcomes where even defensive equities underperform—expect this to remain stable week-to-week until either liquidity stress eases (which would reduce monetary hedge demand) or credit stress worsens (which would reinforce it).
Defense & Aerospace — ITA
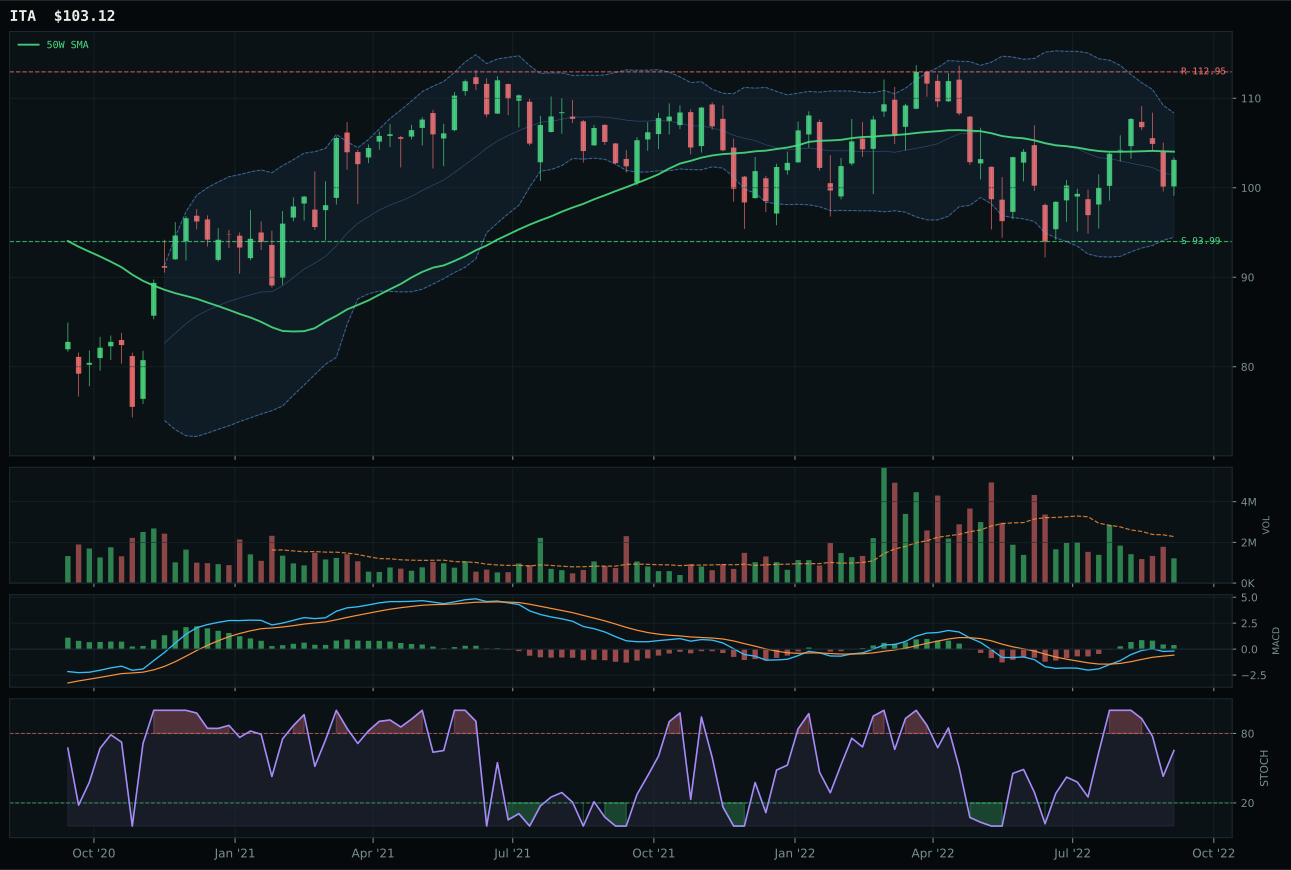
ITA has a compression near 50W profile with -1.4% 13-week relative strength versus SPY.
A failed hold above support would weaken the setup.
Actionable but governed by invalidation levels.
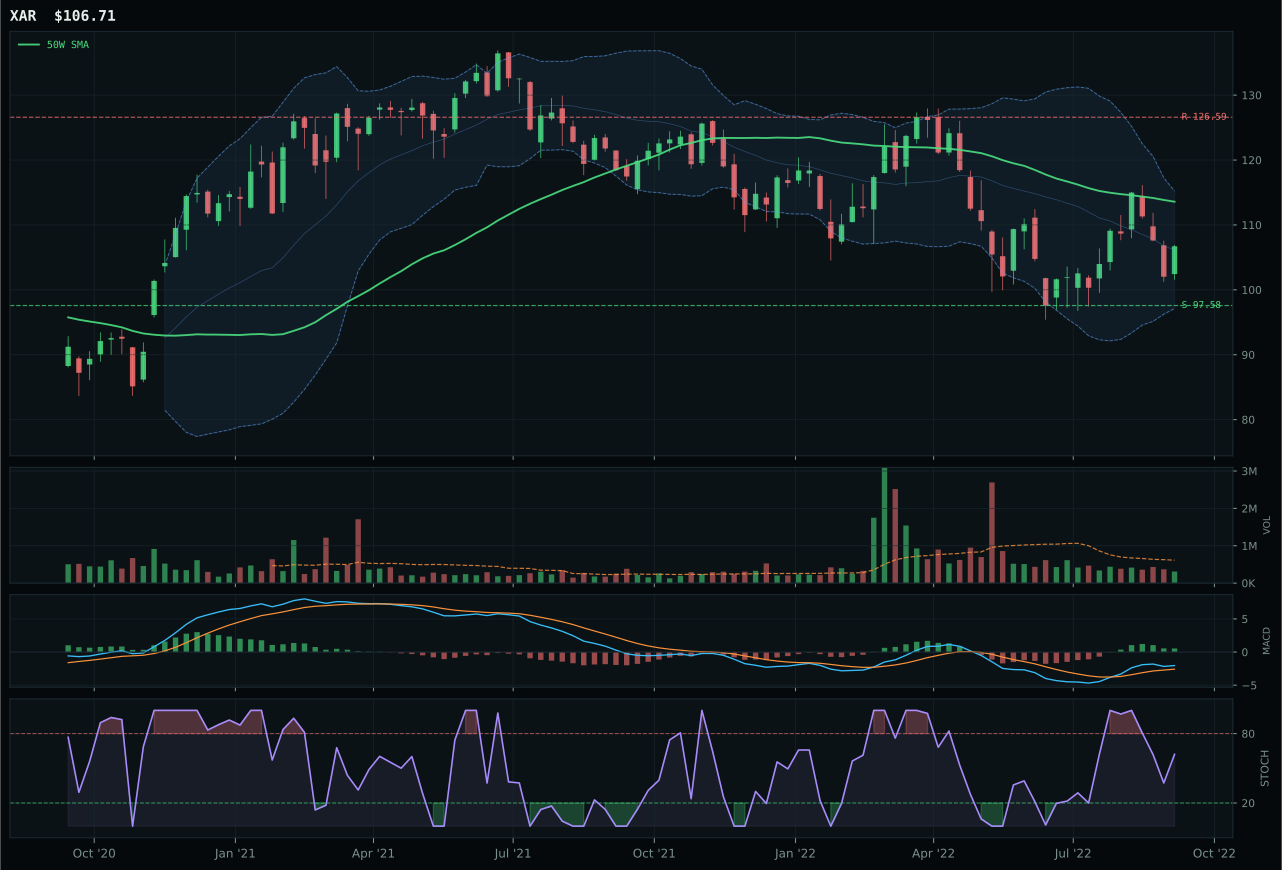
XAR has a neutral structure profile with -2.4% 13-week relative strength versus SPY.
A failed hold above support would weaken the setup.
Actionable but governed by invalidation levels.
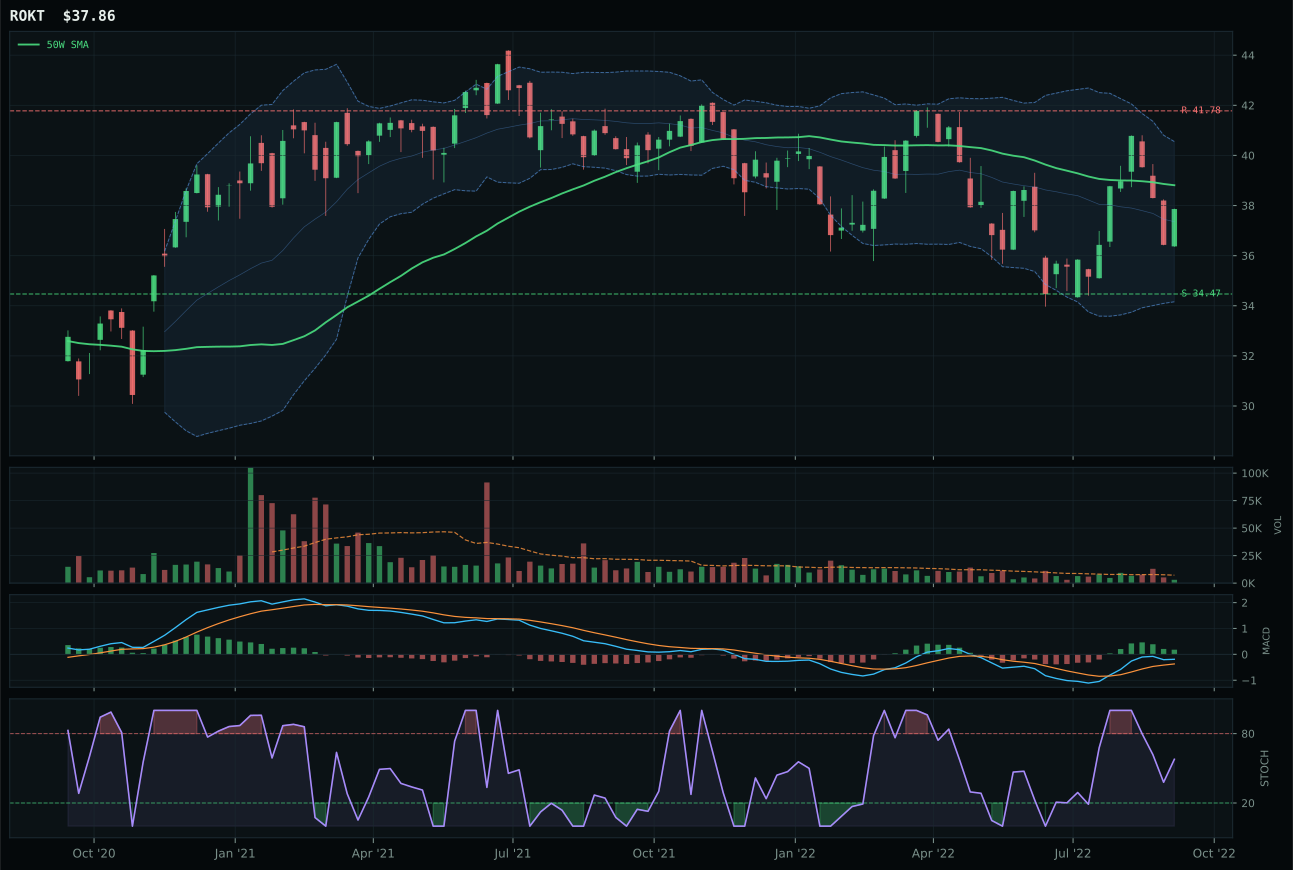
ROKT has a compression near 50W profile with -2.0% 13-week relative strength versus SPY.
A failed hold above support would weaken the setup.
Tracked, but not top-2 eligible because: .
ITA dominated this category with a perfect 100.0 timing score—the decisive advantage—because price sits at -0.9% from the 50-week moving average in the middle Fibonacci retracement zone, creating a high-probability setup where buyers can defend a key support level. The runner-up XAR, despite posting competitive trend and structure scores, retreated to 77.0 on timing because it sits deeper into the pullback at -5.2% on the 4-week return and lacks the immediate support architecture. ITA's compression near the 50-week moving average (76.1 compression score) provides defined risk; if the 50W breaks, the 39.99 support awaits just 9.7% below, making this a controlled entry setup. RS versus SPY at -1.4% suggests defense is not outrunning equities, but 0.6% relative strength within the category and 2.9% 13-week return confirm that the defense narrative is working—this is a category rotating into defensive durability as broad market stress persists.
Defense & Aerospace earned 5% allocation at a 47.8 final score, sitting in the tier-2 band below XLU and URNM but above the excluded categories. Macro fit is strong at 66.0/100 because defensive rotation is active (+8), broad market bear is active (+6), and dollar pressure provides a secondary tailwind (+3). The category is benefiting from regime rotation even though liquidity stress drags it down (-3). ITA's technical evidence score of 65.1 combined with macro fit of 63.0 creates a resilient case that transcends pure momentum—this is how defensive rotations look in the early innings, with lower volume but higher conviction. The 5% slot is appropriate given that two categories earned top-2 status and eight others claimed tier-2; if the bear market intensifies next week and liquidity stress metrics worsen, expect this category to compete harder for a top-2 slot by moving the allocation from 5% to 10%.
Industrial Metals — PICK
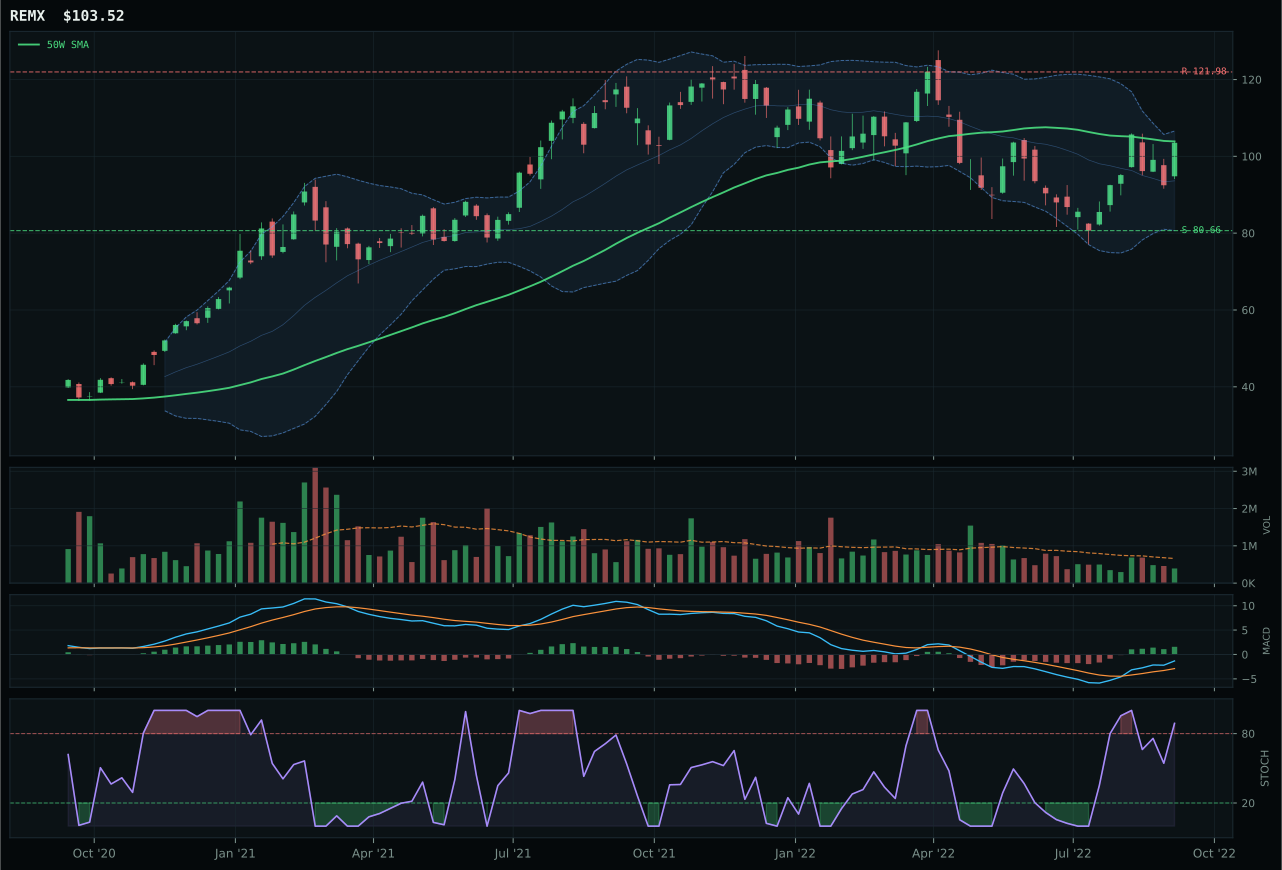
REMX has a compression near 50W profile with 6.4% 13-week relative strength versus SPY.
A failed hold above support would weaken the setup.
Actionable but governed by invalidation levels.
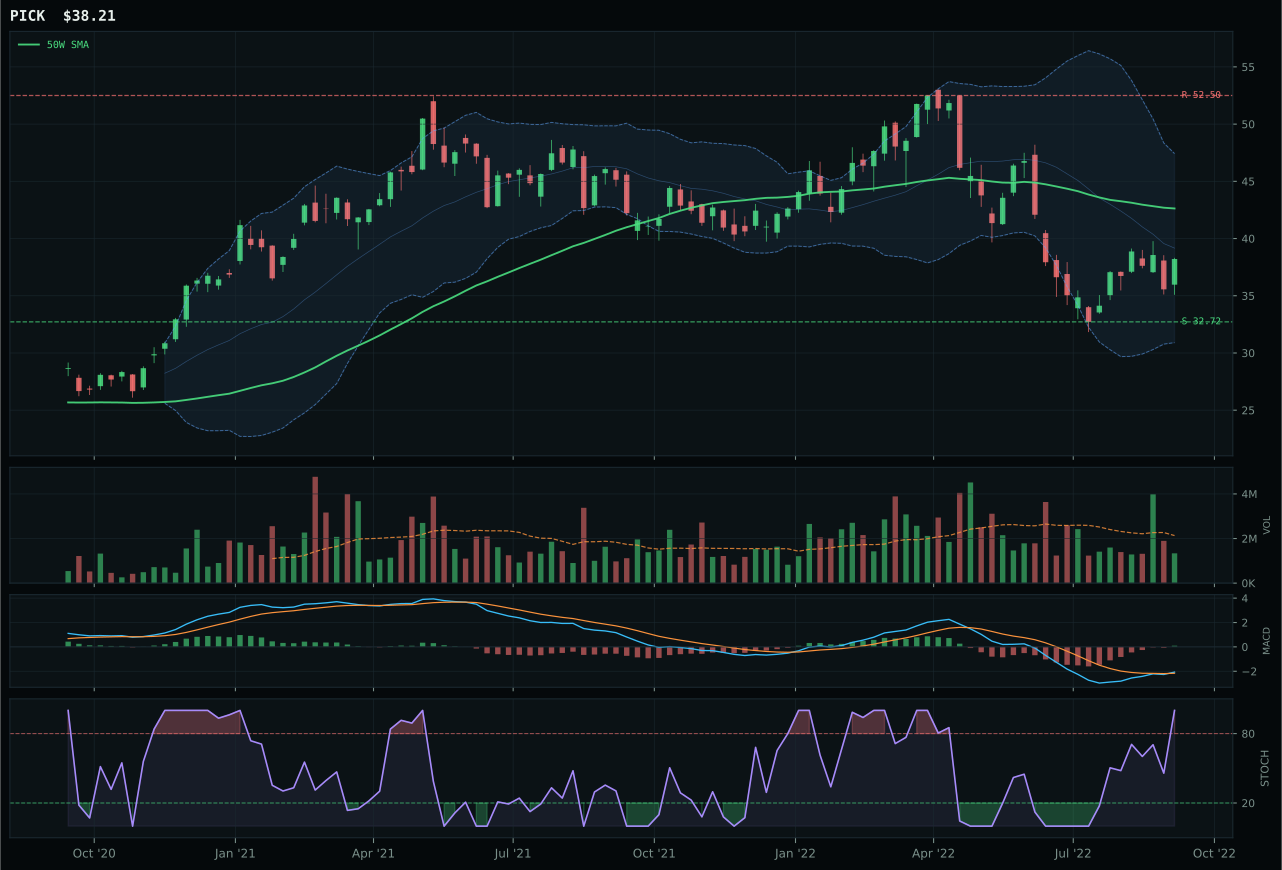
PICK has a neutral structure profile with -13.5% 13-week relative strength versus SPY.
A failed hold above support would weaken the setup.
Actionable but governed by invalidation levels.
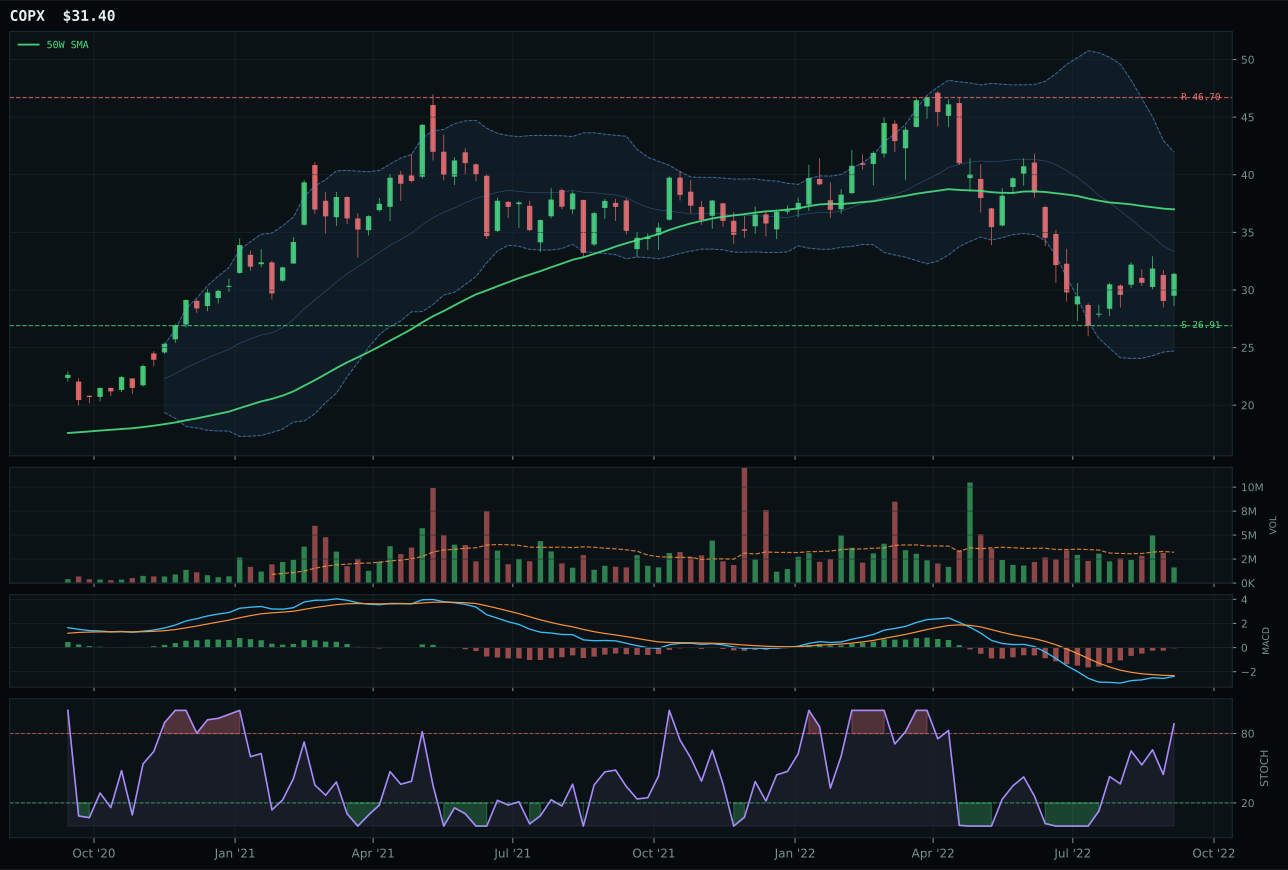
COPX has a neutral structure profile with -22.7% 13-week relative strength versus SPY.
A failed hold above support would weaken the setup.
Actionable but governed by invalidation levels.
PICK won the category selection despite scoring 42.5 overall because REMX, while posting a blistering 96.2 technical evidence score with RS versus SPY at +6.4%, was too stretched from its 50-week moving average at -0.3% versus PICK's -10.4%. The allocator prioritized structural safety over momentum—REMX is compression near the 50W with overbought stochastic RSI, while PICK sits in a deeper retracement zone where support is more defined at 32.72. PICK's 0.0 momentum confirmation reflects brutal 13-week returns of -9.2%, but the structure is neutral and the MACD is improving, suggesting this is where capitulation meets value. The runner-up REMX caught a rare earth scarcity bid and delivered category relative strength of 19.9%, but that leadership came with execution risk—rare earth supply constraints are real, but rare earth demand is cyclical and credit-sensitive. PICK's diversified mining breadth is a less exciting narrative but a more defensible one in disinflation.
Industrial Metals earned 5% allocation with a final score of 42.5, sitting among the tier-2 categories. Macro fit is 58.0/100, fueled by metals scarcity (+14) and commodity breadth positive (+10), but liquidity stress (-8) and credit stress (-7) create headwinds. The category reasoning layer ranked REMX highest at 81.9 technical evidence, yet the final allocation chose PICK because the category score penalized REMX's extended structure and over-overbought conditions. This is a critical signal: next week, if REMX's momentum persists and rare earth supply constraints tighten further, the algorithm may flip to REMX as the category representative, potentially boosting the allocation from 5% to 10% if other tier-2 categories weaken. For now, PICK's safer structure and improved MACD are preferred, but this is the tier-2 position most likely to rotate if commodity breadth accelerates or if rare earth supply chain stress becomes a portfolio-level concern.
Technology — CIBR
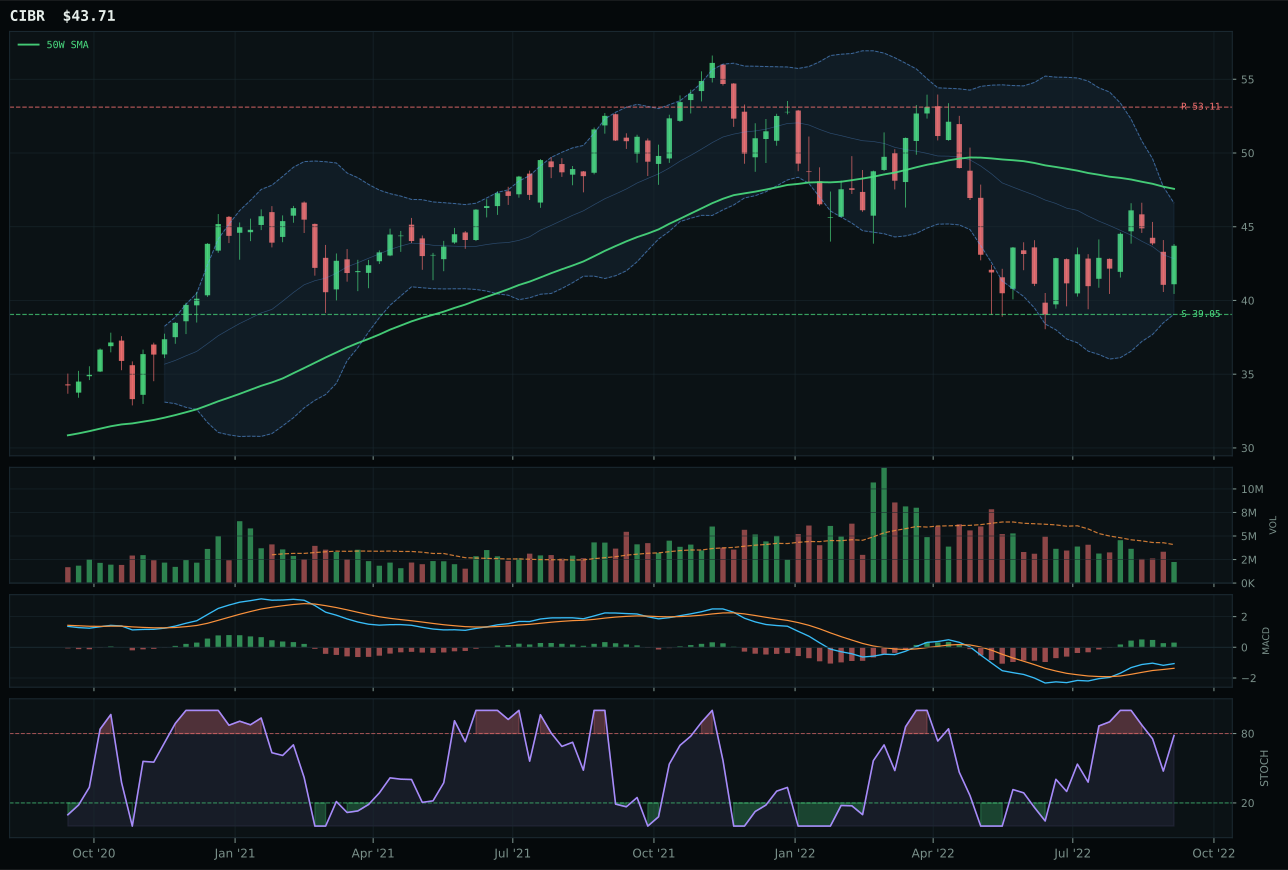
CIBR has a neutral structure profile with 2.0% 13-week relative strength versus SPY.
A failed hold above support would weaken the setup.
Actionable but governed by invalidation levels.
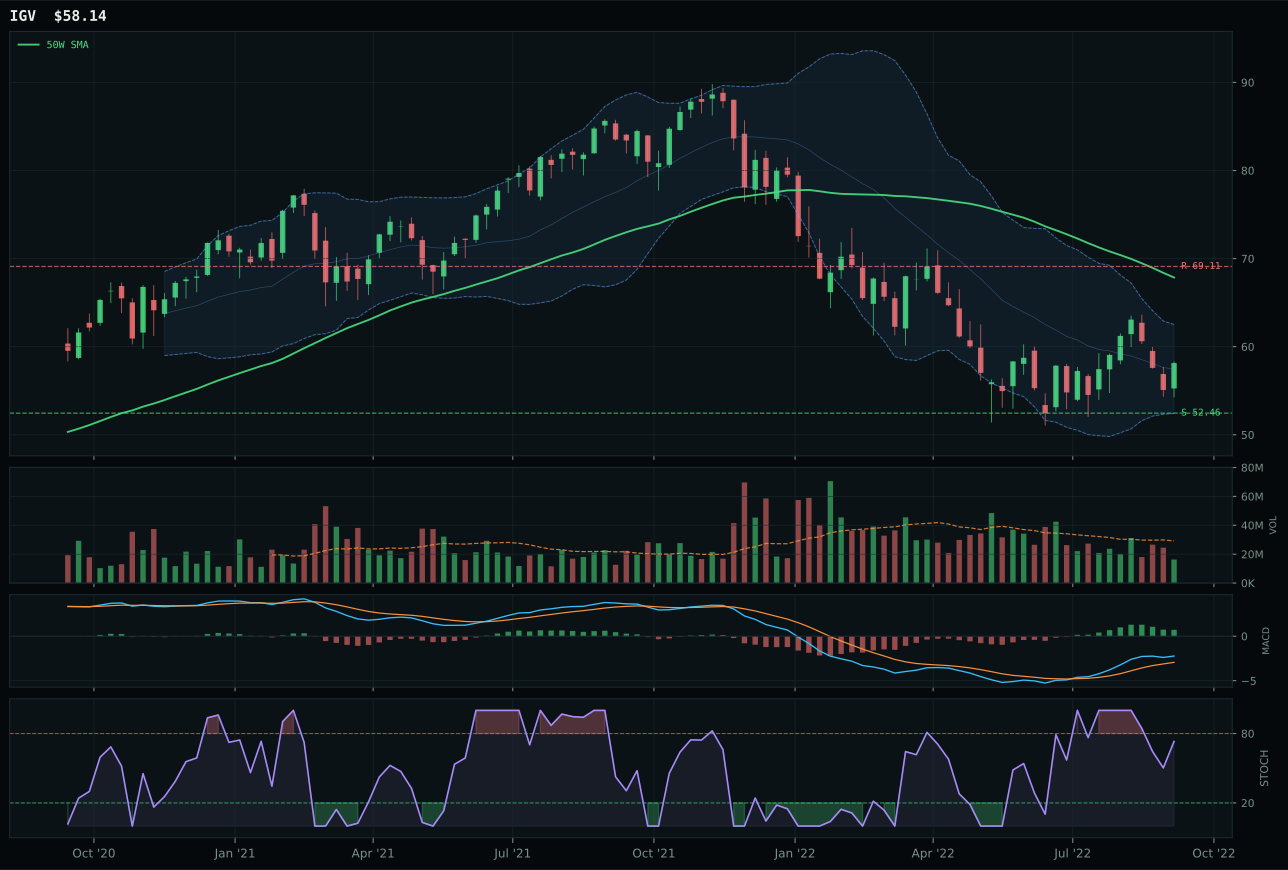
IGV has a neutral structure profile with 0.8% 13-week relative strength versus SPY.
A failed hold above support would weaken the setup.
Actionable but governed by invalidation levels.
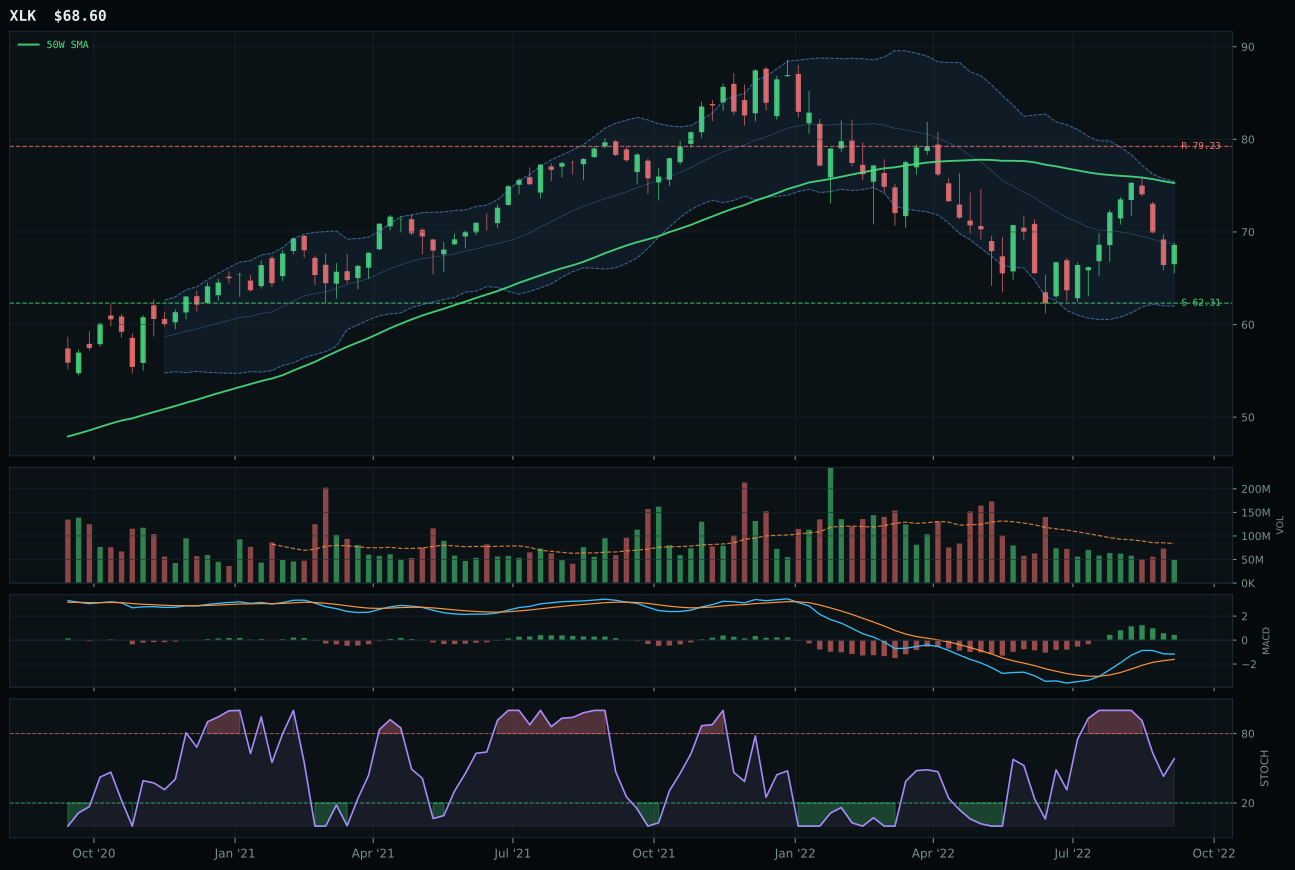
XLK has a neutral structure profile with 0.4% 13-week relative strength versus SPY.
A failed hold above support would weaken the setup.
Actionable but governed by invalidation levels.
CIBR claimed the category by assembling a cleaner technical setup than IGV, posting a 77.0 timing score versus 50.0 for the runner-up—the difference lies in CIBR's proximity to the 50-week moving average at -8.1% versus IGV's deeper pullback, which places CIBR in a more actionable reset zone near the 0.618 Fibonacci retracement. Relative strength against the category basket tells the real story: CIBR's 1.1% edge over median peers combined with its 2.0% edge over SPY suggests accumulation into cybersecurity as a defensive technology subtheme, even as momentum confirmation sits at just 53.3. Volume participation at 0.55x the 20-week average is thin, and that matters—it means conviction is real but not yet broad. IGV stumbled because its SPY-relative strength flatlined at 0.8% and category leadership scored at parity (0.0%), forcing the algorithm to choose the cleaner price action. When structure is neutral on both ETFs, timing and relative strength become the tiebreaker.
Technology earned 5% despite scoring 36.3, placing it firmly in tier-2 alongside Defense, Agriculture, Precious Metals, Industrial Metals, and Energy. The macro regime—disinflation with active liquidity stress and broken risk appetite—penalizes growth-heavy exposures, and technology's 40.0/100 category-level macro fit reflects that constraint. Two higher-ranked categories (XLU and URNM) commanded the top-2 slots at 10% each, and the portfolio manager's overlay at 50% compression means CIBR's 5% allocation represents genuine conviction in the setup rather than a default hold. The question for next week is whether volume participation can expand above 0.55x and whether the MACD's flattening trend reverses to a genuine bullish divergence; without those confirmations, this category risks sliding further down the priority list as the bear market penalizes any growth narrative.
Agriculture & Livestock — WEAT
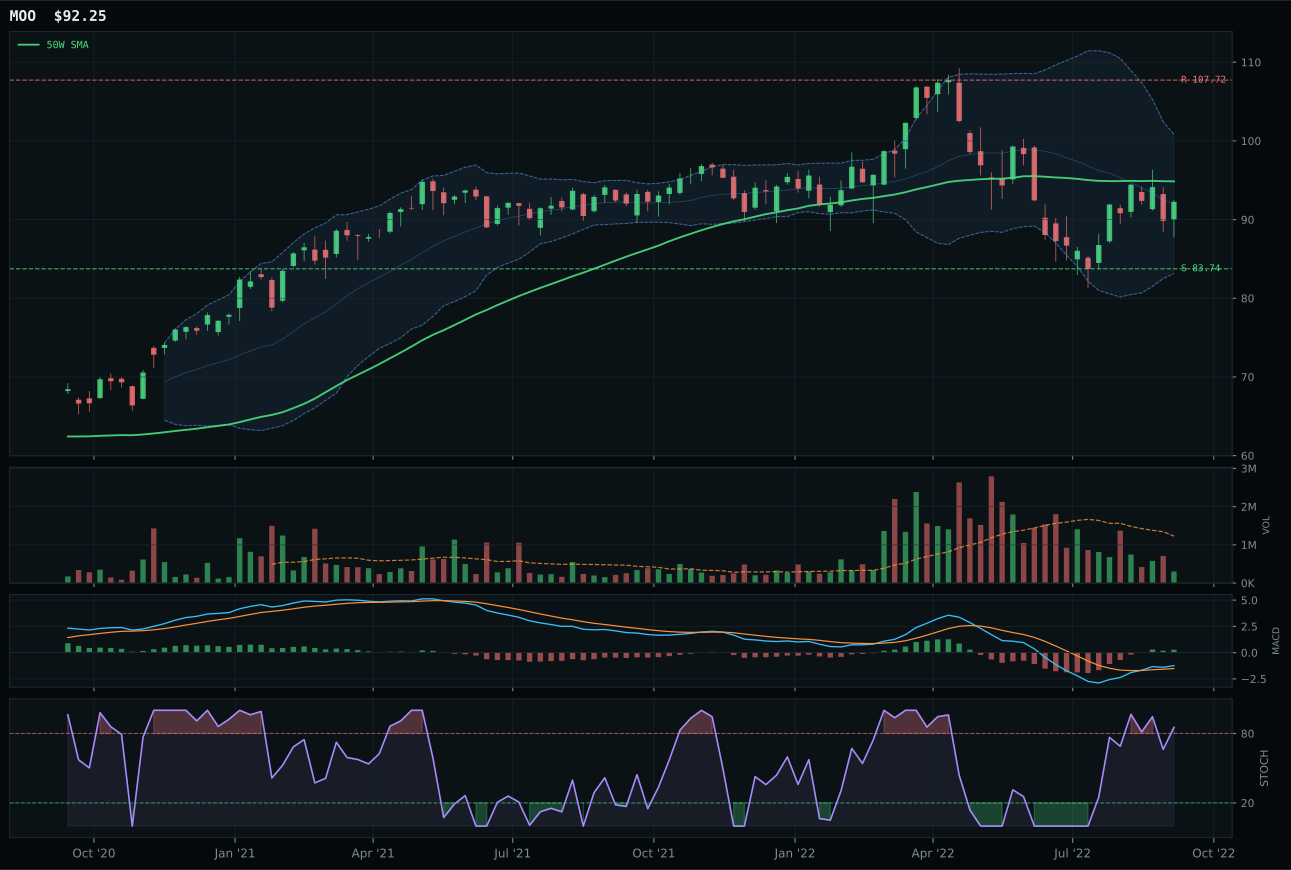
MOO has a compression near 50W profile with -4.5% 13-week relative strength versus SPY.
A failed hold above support would weaken the setup.
Actionable but governed by invalidation levels.
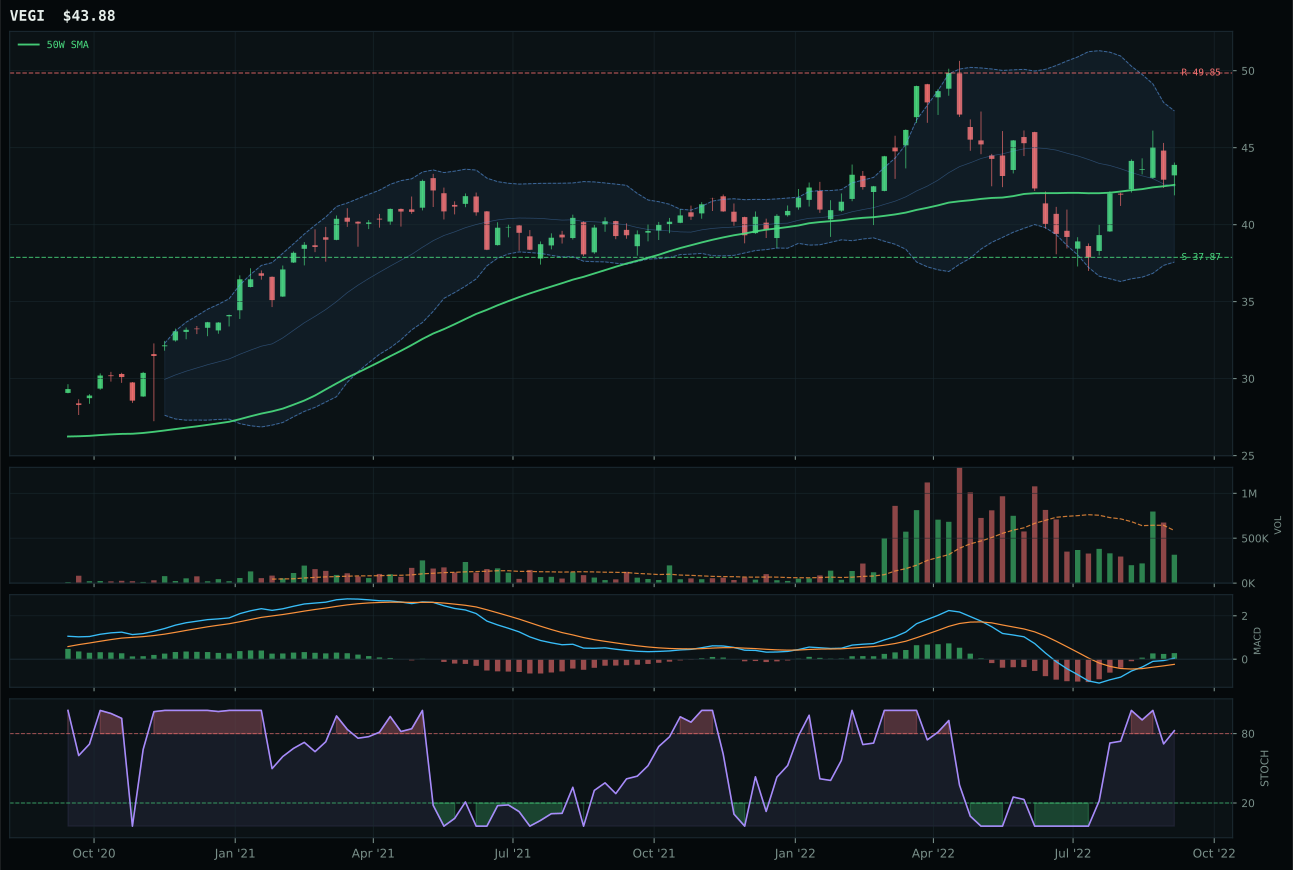
VEGI has a neutral structure profile with -0.7% 13-week relative strength versus SPY.
A failed hold above support would weaken the setup.
Actionable but governed by invalidation levels.
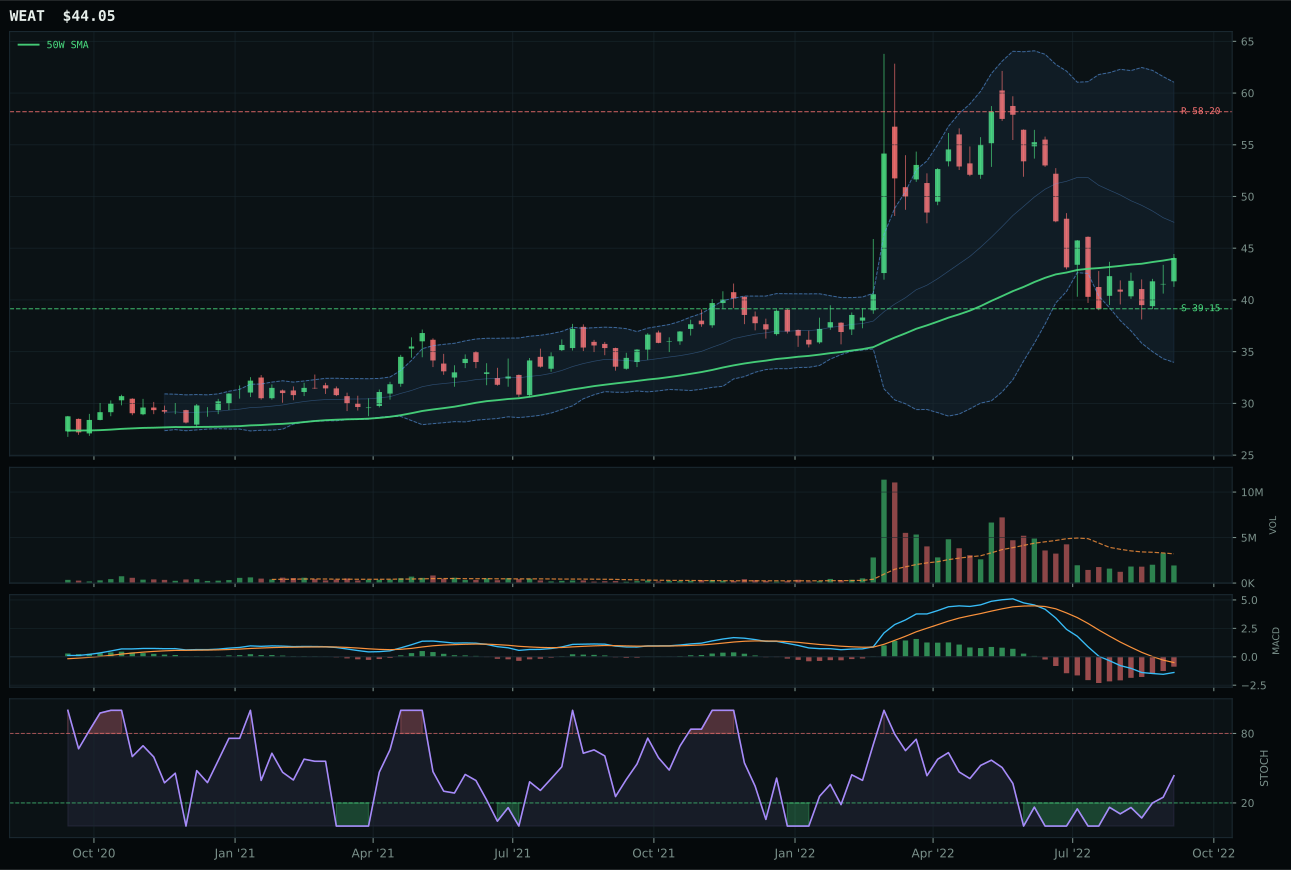
WEAT has a compression near 50W profile with -24.6% 13-week relative strength versus SPY.
A failed hold above support would weaken the setup.
Actionable but governed by invalidation levels.
WEAT won the category selection despite registering 0.0 momentum confirmation—a counterintuitive victory explained entirely by its superior timing score of 100.0 and structural position. Price sits essentially flat against the 50-week moving average (0.2% distance) in deep Fibonacci retracement near 0.618, providing a defined invalidation point if buyers fail to defend. The runner-up MOO, by contrast, sports overbought stochastic RSI and a bullish but flattening MACD, suggesting momentum exhaustion rather than accumulation. WEAT's bearish but improving MACD combined with rising mid-zone stochastic RSI tells a mean-reversion narrative—the 13-week return of -20.3% and -24.6% RS versus SPY are so brutal that any stabilization attracts value buyers. Volume at 0.60x the 20-week average is thin, confirming this is a capitulation setup rather than a conviction setup, but MOO's overbought condition makes it a higher-risk entry when the goal is to catch exhaustion.
Agriculture & Livestock earned 5% allocation despite a final score of just 32.7, indicating this is a residual tier-2 position in a portfolio already tilted defensively. Macro fit sits at 45.0/100, essentially neutral, with commodity breadth positive (+5) and real asset sponsorship (+8) offset by disinflation pressure (-8) and liquidity stress (-4). The category lost a critical battle when the 3/2/1 weighted basket revealed that MOO (61.0 technical evidence) and VEGI (58.8) ranked higher than WEAT (37.4), meaning the allocator selected a lower-confidence ETF as the representative. This is a warning signal: next week, if commodity breadth positive fades or disinflation pressure intensifies, this 5% could shift to zero. WEAT's 0.0 momentum confirmation score is not sustainable as a holding—the position works only if agricultural prices stabilize and the pace of deflation slows; without that, this becomes a small tactical hedge rather than a conviction allocation.
Traditional Energy — XLE
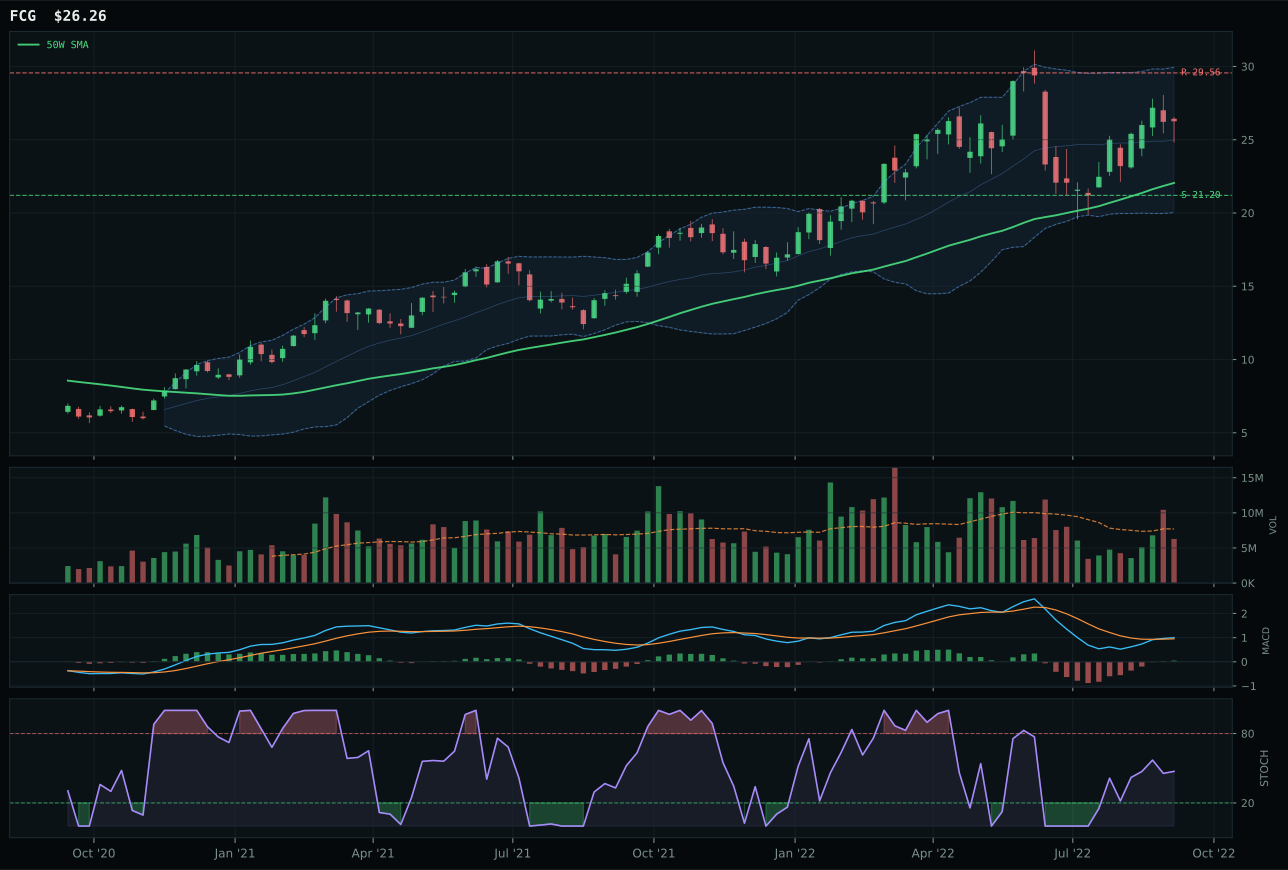
FCG has a vertical extension profile with -15.0% 13-week relative strength versus SPY.
A failed hold above support would weaken the setup.
Actionable but governed by invalidation levels.
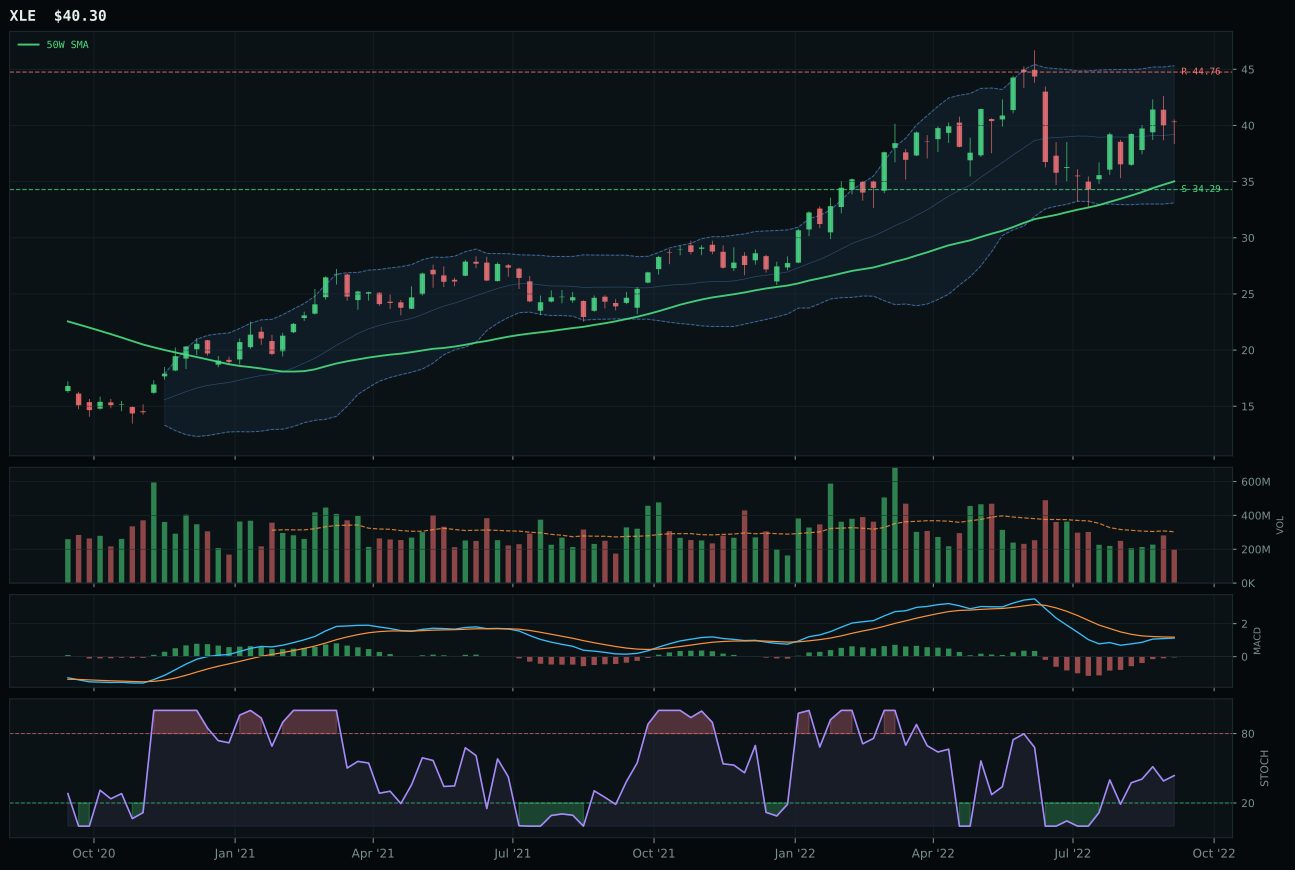
XLE has a vertical extension profile with -13.5% 13-week relative strength versus SPY.
A failed hold above support would weaken the setup.
Actionable but governed by invalidation levels.
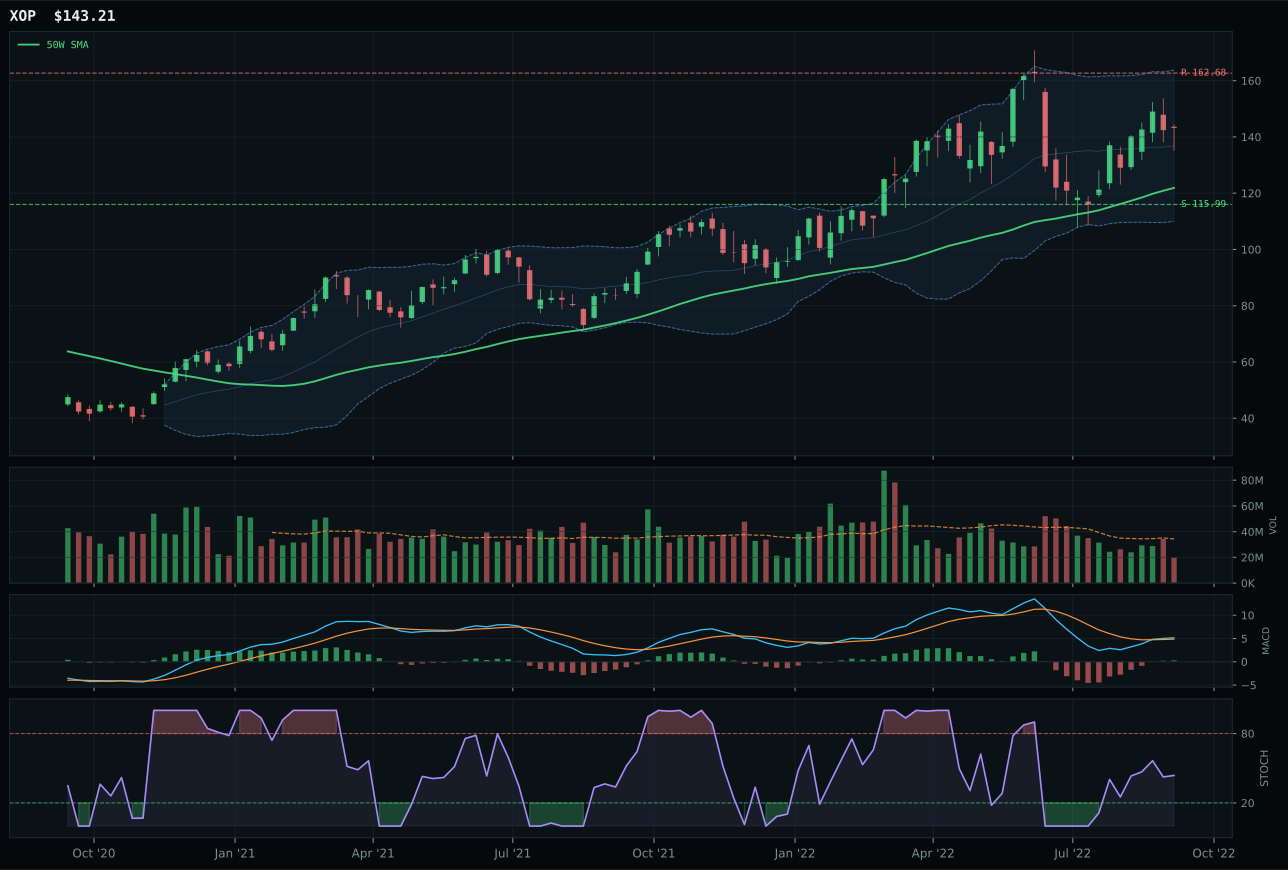
XOP has a vertical extension profile with -16.3% 13-week relative strength versus SPY.
A failed hold above support would weaken the setup.
Actionable but governed by invalidation levels.
XLE won a tight three-way matchup over FCG and XOP despite registering only a 44.2 technical evidence score and 47.0 macro fit—the lowest scores in this category. XLE prevailed because FCG's risk/reward was weaker (38.4 vs 40.2) and XLE maintained category-relative strength at 1.5% while FCG and XOP both scored 0.0%. The real issue is that energy is extended 15.1% above the 50-week moving average, sitting in the upper Fibonacci zone where every new buyer is late to the party. MACD is bearish but improving on XLE, and stochastic RSI is rising mid-zone, suggesting the move is slowing but not yet rolling over. This is a category where the best choice is still a cautious choice—the integrated energy cash-flow narrative works in a real asset sponsorship environment, but the price action suggests the bulk of the move has been captured.
Traditional Energy earned 5% allocation despite a catastrophic final score of just 13.8, ranking it in tier-2 only by virtue of the portfolio's 50% overlay compression (which ensures eight categories still receive 5% each). Macro fit is terrible at 23.0/100 because disinflation hurts energy exposure (-10 to the regime), disinflation pressure is active (-10), and credit stress is active (-7). Real asset sponsorship (+7) provides the only meaningful tailwind. This is the most fragile tier-2 position in the portfolio—it exists only because the overlay system requires it, not because the opportunity justifies it. XLE's 5% slot will disappear immediately if disinflation accelerates, if credit stress metrics worsen, or if the price extension breaks and resumes lower. The position is a placeholder, not a conviction allocation; treat it accordingly and prepare to reallocate those five percentage points to a higher-conviction category if macro conditions shift.
AI — SMH
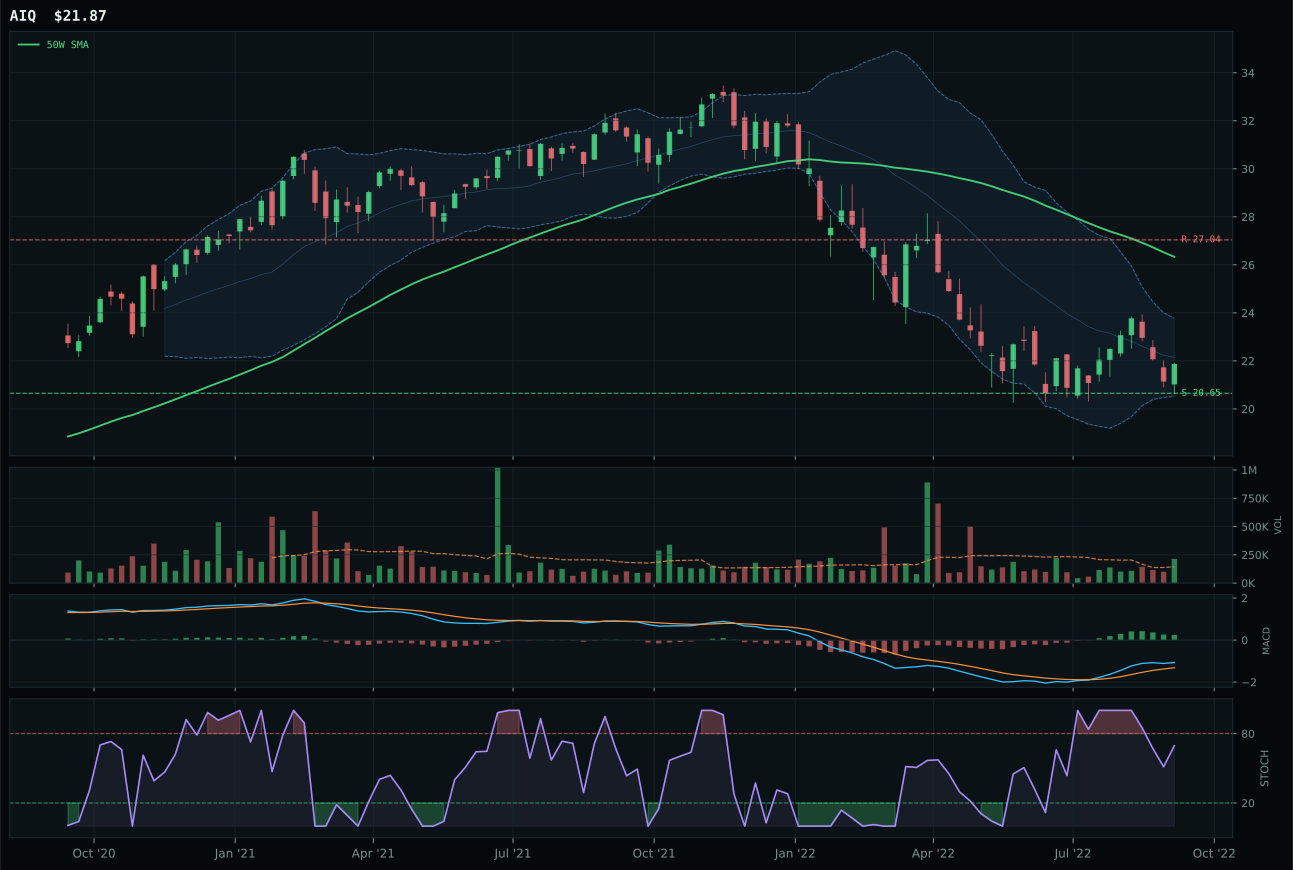
AIQ has a neutral structure profile with -4.2% 13-week relative strength versus SPY.
A failed hold above support would weaken the setup.
Tracked, but not top-2 eligible because: .
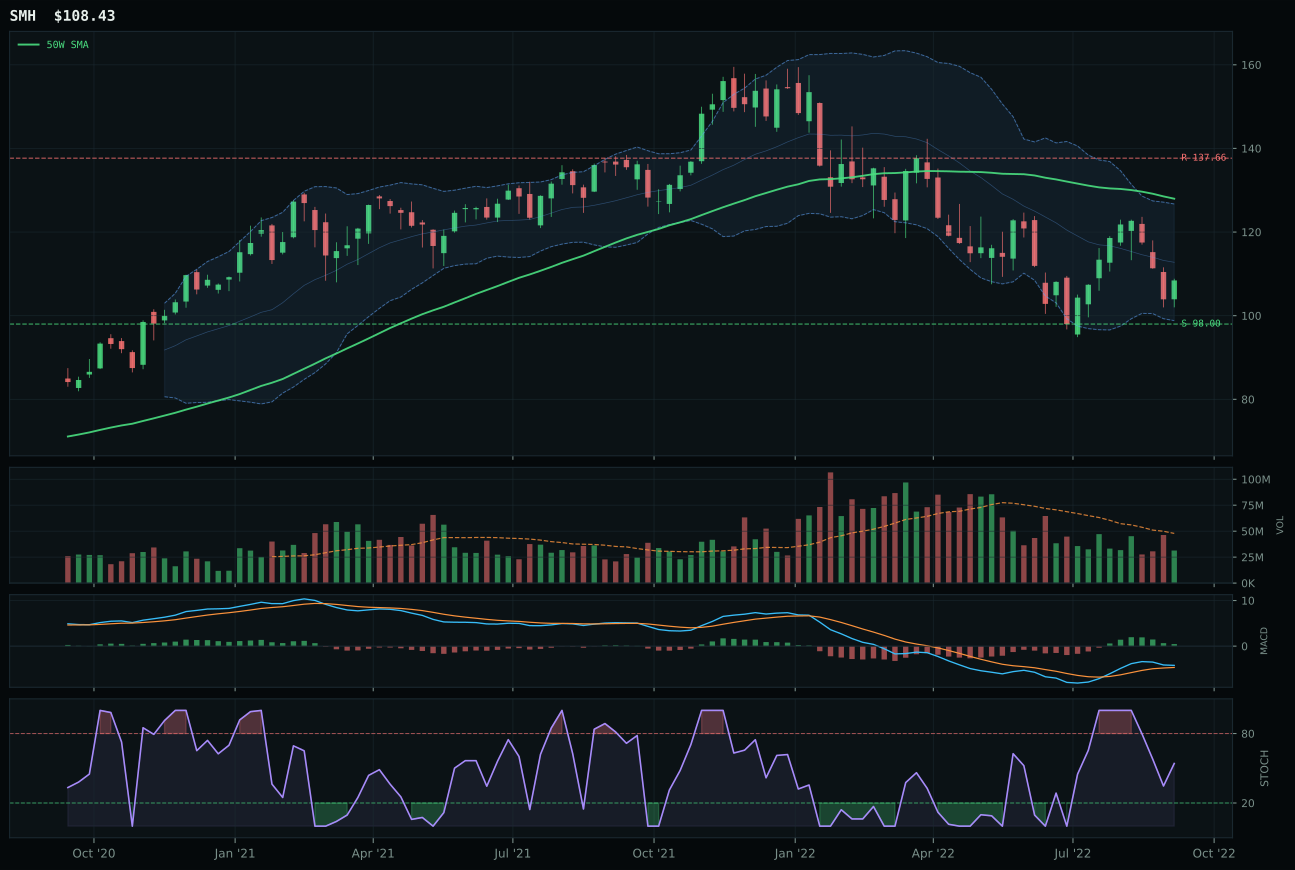
SMH has a neutral structure profile with -7.4% 13-week relative strength versus SPY.
A failed hold above support would weaken the setup.
Actionable but governed by invalidation levels.
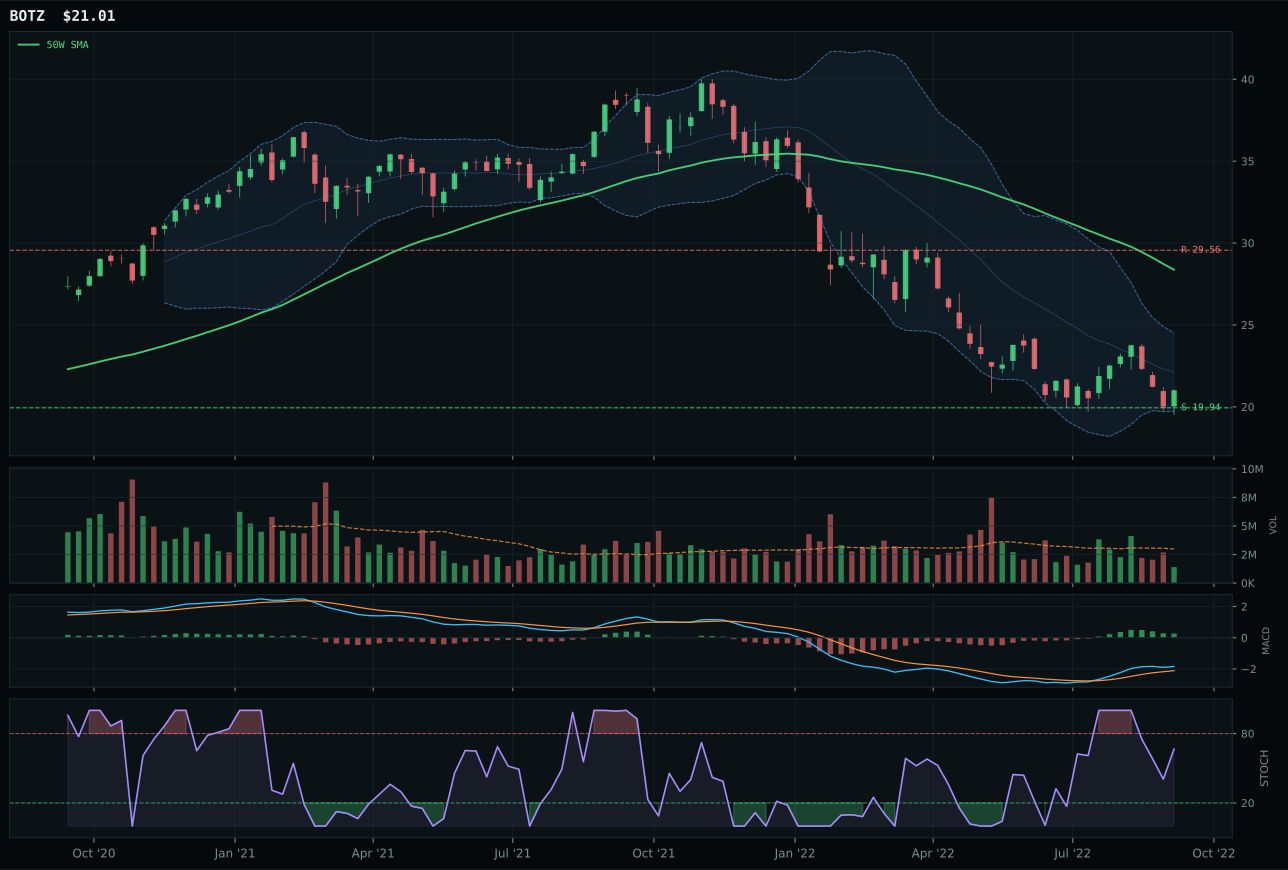
BOTZ has a neutral structure profile with -10.1% 13-week relative strength versus SPY.
A failed hold above support would weaken the setup.
Actionable but governed by invalidation levels.
SMH won the category by a narrow 6.0-point margin over AIQ, but the victory masks a deeper technical malaise: both nominees are heavily underwater, with SMH posting a 13-week return of -3.1% and RS versus SPY at -7.4%. What pushed SMH ahead was a marginally better ensemble of trend (49.9 vs 45.0), structure (70.3 vs neutral), and compression (59.6) that suggested less deterioration than the alternatives, though the 15.7 momentum confirmation score reveals almost no accumulation momentum. AIQ's above-average volume participation (versus SMH's thin participation) offered a glimmer of sponsorship, but it came too late in a deep pullback where conviction matters less than clean invalidation points. The semiconductor and AI compute complex sits near the 52-week low in a repair zone, MACD is merely bullish but flattening on both candidates, and stochastic RSI is falling neutral—this is a category in compression waiting for a catalyst, not a category showing signs of reversal.
AI earned 0% allocation this week, ranked 9th or 10th among the ten categories, and that exclusion reflects both its technical weakness and catastrophic macro fit at 23.0/100. The disinflation regime harms growth narratives, but AI is getting hit harder by liquidity stress (-12), credit stress (-8), and broad market bear pressure (-8) because it is the most crowded and rate-sensitive cohort. The category's final score of 12.0 collapsed from an initial 3/2/1 weighted basket of 36.3 because persistence and volume-price confirmation both failed to sustain the narrative. For AI to earn even a tier-3 position (5%), SMH would need to close above its 50-week moving average with volume expanding and a confirmed MACD bullish cross; neither condition exists. The allocation system is telling you to wait for an accumulation cycle, not chase a rebound.
Emerging Markets — INDA
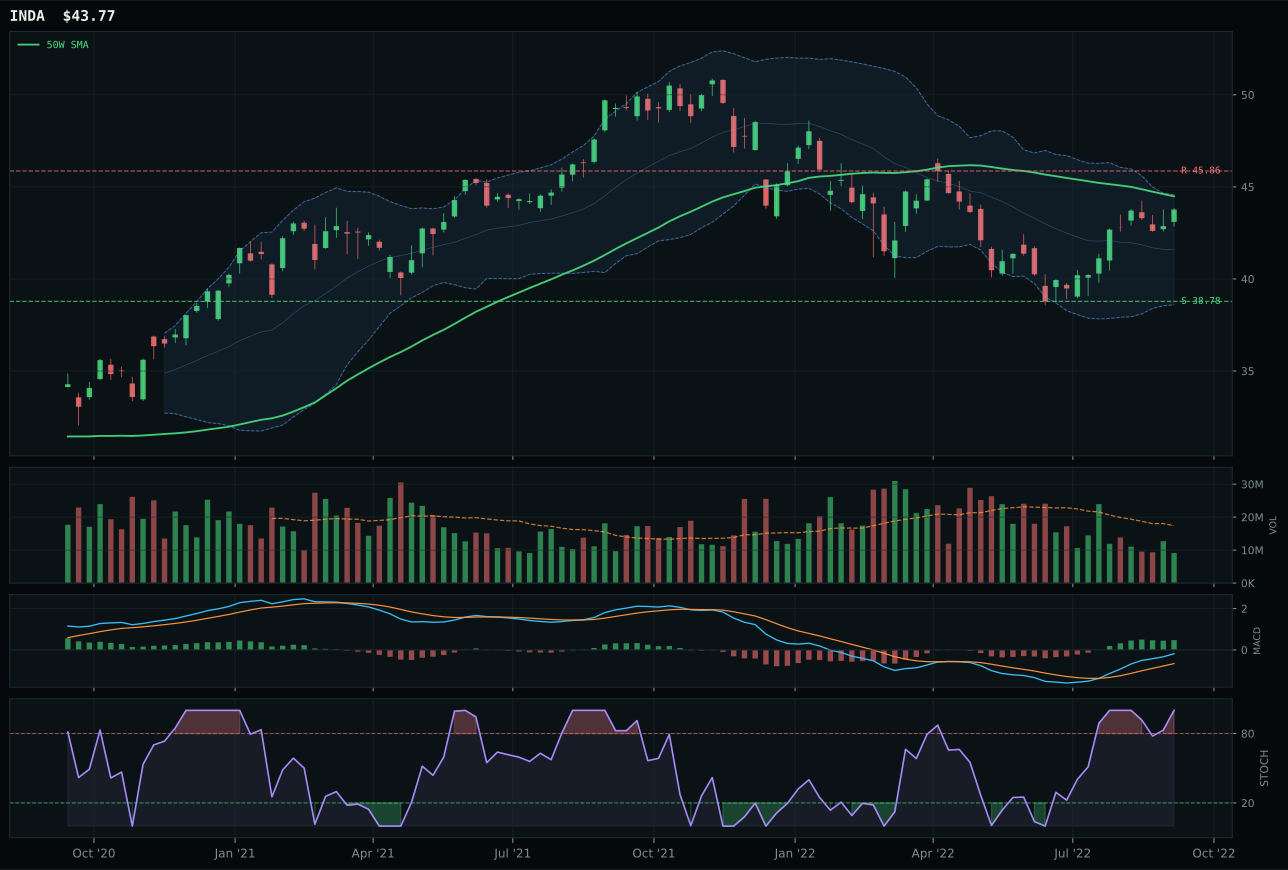
INDA has a compression near 50W profile with 4.4% 13-week relative strength versus SPY.
A failed hold above support would weaken the setup.
Actionable but governed by invalidation levels.
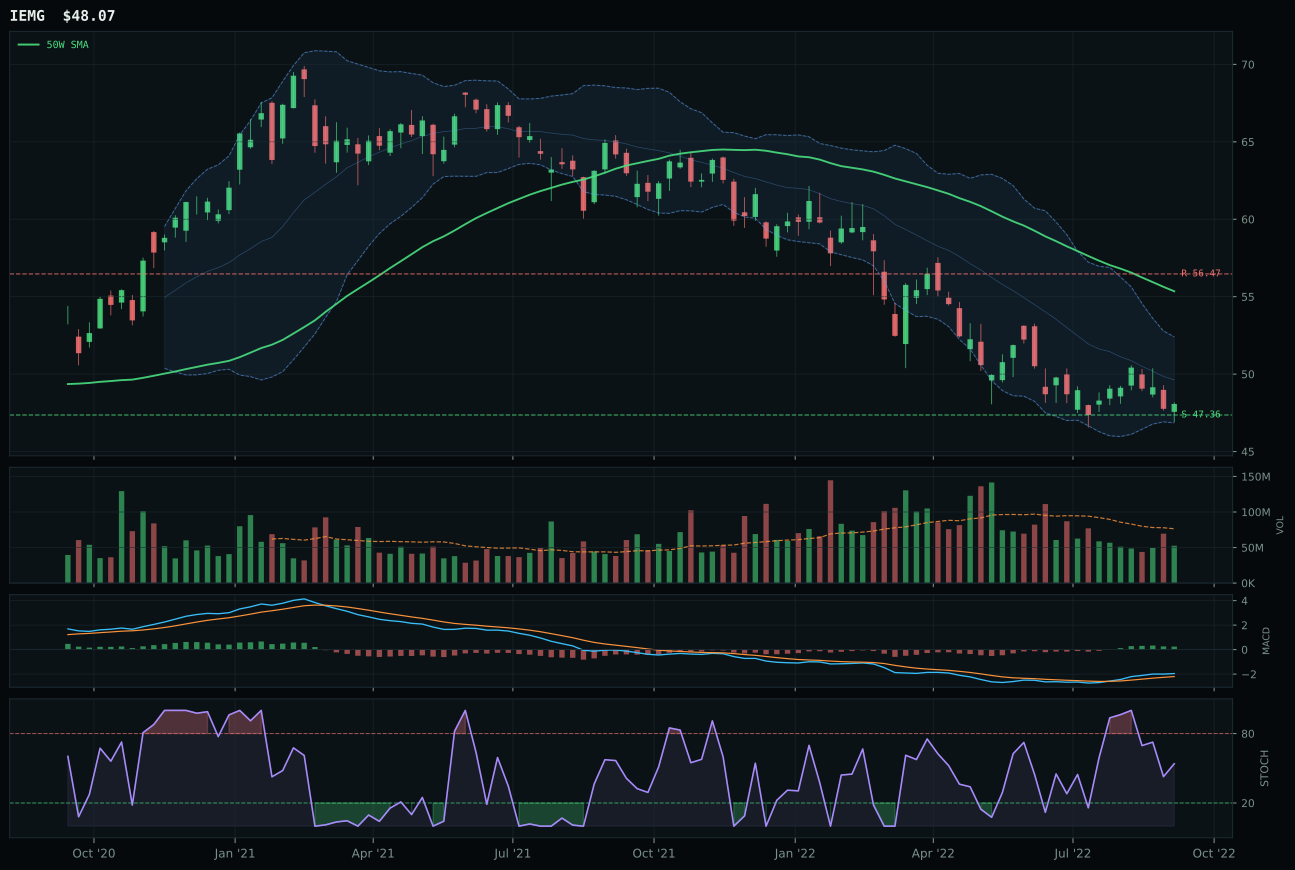
IEMG has a pullback into support profile with -9.1% 13-week relative strength versus SPY.
A failed hold above support would weaken the setup.
Actionable but governed by invalidation levels.
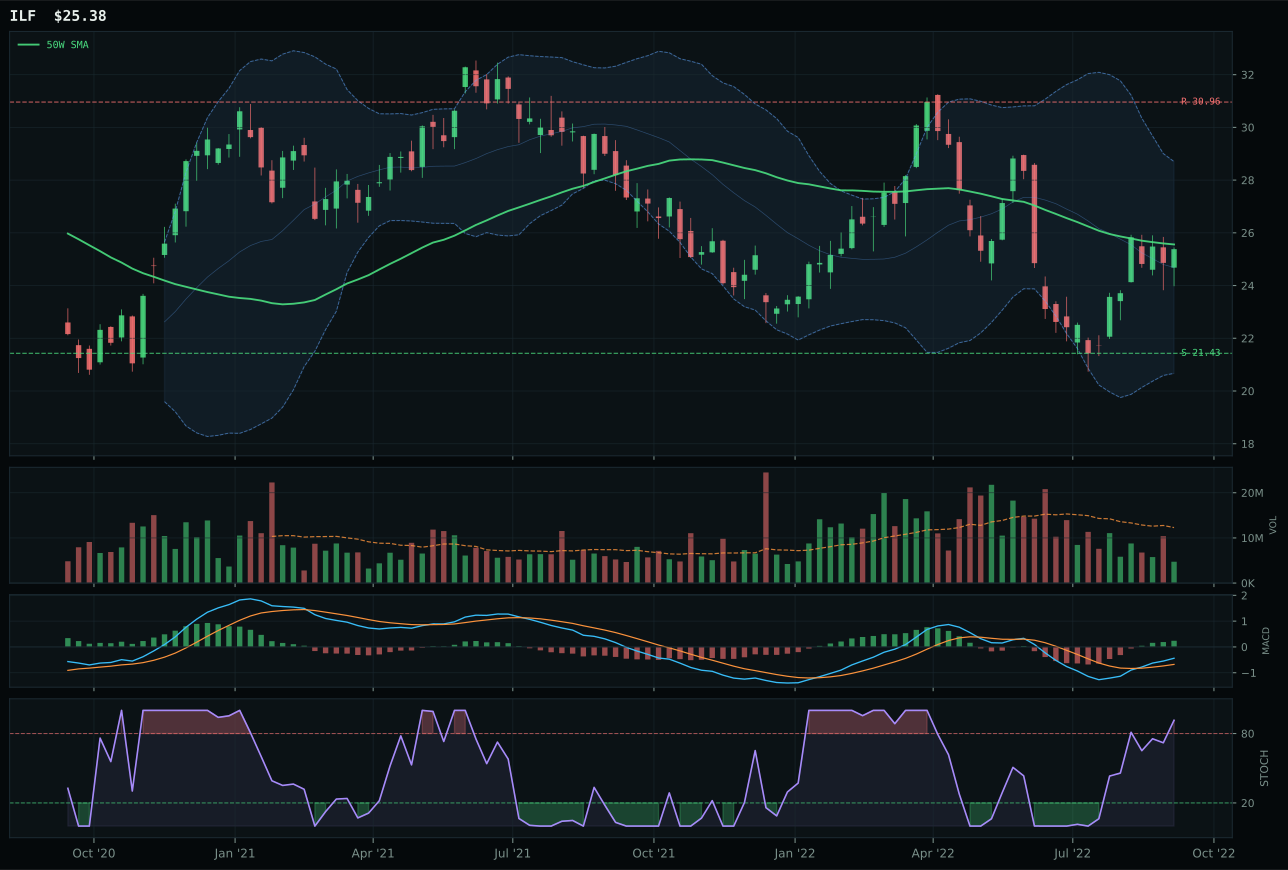
ILF has a compression near 50W profile with -2.2% 13-week relative strength versus SPY.
Extension and support failure are the main tactical risks.
Tracked, but not top-2 eligible because: structurally broken.
INDA won the category with a 44.6-point blowout margin over IEMG, posting an 86.7 technical evidence score and 100.0 timing precision because price sits just -1.6% from the 50-week moving average in the middle Fibonacci decision zone with compression near the 50W at 85.6. The chart is clean (cleanliness 75.0), MACD is bullish and improving, stochastic RSI is overbought momentum, and volume is thin participation at 0.52x the 20W average. IEMG, by contrast, sits in a pullback into support with MACD bullish but flattening, stochastic RSI falling neutral, and -9.1% RS versus SPY—it is the broad emerging-market beta play that captures macro stress, not selective strength. INDA's 4.4% RS versus SPY and 6.6% relative strength within the category prove this is about India quality-growth rotation, not broad-based emerging-market recovery. The technical setup is pristine, but the macro headwinds are severe.
Emerging Markets earned 0% allocation this week, ranked 9th or 10th, despite INDA's pristine 86.7 technical evidence score. The final category score collapsed to 2.5 because macro fit is atrocious at 7.0/100: dollar pressure is active (-14), credit stress is active (-10), liquidity stress is active (-10), and broad market bear is active (-9). No amount of technical excellence survives a macro regime this hostile to emerging-market capital flows. INDA's India quality-growth narrative is compelling on a standalone basis, but it is fighting dollar strength, credit stress, and forced unwind of carry trades. For this category to earn even a tier-3 allocation (5%), one of three things must happen: the dollar must roll over, credit stress metrics must improve, or risk appetite must genuinely stabilize. None of those preconditions exist this week. The allocation system is directing you to avoid emerging markets entirely, even where the technical setup is attractive, because the macro regime is more important than the setup.