
2022-09-02
Informational purposes only. The content in this report, including allocations, analysis, and commentary, is provided solely for informational and educational purposes. It does not constitute financial advice, investment advice, trading advice, or any other type of advice. Past performance does not guarantee future results. Always conduct your own research and consult a qualified financial professional before making investment decisions.
GLD defensive overlay excluded: price is below its 8W SMA. Cause selector will use cash alternative.
Fast-crash circuit breaker triggered: SPY dropped more than 8% from its 4-week high this week. Defensive overlay activated immediately.
Macro risk engine requires the 50% Defensive overlay for this run; payload selected by cause: Transition Defense.
Weekly Allocation
| Ticker | Category | Weight | Role |
|---|---|---|---|
| SGOV | 20% | Overlay | |
| GLD | 15% | Overlay | |
| XLU | Utilities & Infrastructure | 25% | Overlay |
| GDX | Precious Metals | 10% | Top-2 (10%) |
| URNM | Nuclear Energy | 5% | Tier-2 (5%) |
| ITA | Defense & Aerospace | 5% | Tier-2 (5%) |
| CIBR | Technology | 5% | Tier-2 (5%) |
| XLE | Traditional Energy | 5% | Tier-2 (5%) |
| MOO | Agriculture & Livestock | 5% | Tier-2 (5%) |
| COPX | Industrial Metals | 5% | Tier-2 (5%) |
Trade Instructions — Monday Open
Sell the tranche from 2022-08-05 (completing its 4-week hold). Buy the new tranche. Instructions show net portfolio changes — same-asset positions cancel, weight changes show the delta.
| Action | Ticker | Instruction |
|---|---|---|
| SELL | XLK | Sell 80% of XLK position (reduce 6.25% → 1.25%) |
| SELL | XAR | Sell 29% of XAR position (reduce 8.75% → 6.25%) |
| SELL | SMH | Sell 50% of SMH position (reduce 5.00% → 2.50%) |
| SELL | URNM | Sell 20% of URNM position (reduce 6.25% → 5.00%) |
| SELL | COPX | Sell 33% of COPX position (reduce 3.75% → 2.50%) |
| SELL | INDA | Sell entire INDA position (2.50% of portfolio) |
| BUY | XLU | Buy XLU — 8.33% of freed cash (adds 1.25% to portfolio) |
| BUY | MOO | Buy MOO — 8.33% of freed cash (adds 1.25% to portfolio) |
| BUY | SGOV | Buy SGOV — 33.33% of freed cash (adds 5.00% to portfolio) |
| BUY | GLD | Buy GLD — 25.00% of freed cash (adds 3.75% to portfolio) |
| BUY | ITA | Buy ITA — 8.33% of freed cash (adds 1.25% to portfolio) |
| BUY | CIBR | Buy CIBR — 8.33% of freed cash (adds 1.25% to portfolio) |
| BUY | XLE | Buy XLE — 8.33% of freed cash (adds 1.25% to portfolio) |
Current Portfolio After Trade
Combined holdings across all 4 active tranches. Each tranche is 25% of the portfolio.
| Ticker | % of Portfolio | Weight Bar |
|---|---|---|
| XLU | 18.75% | |
| GLD | 16.25% | |
| SGOV | 15.00% | |
| XAR | 6.25% | |
| URNM | 5.00% | |
| PAVE | 5.00% | |
| MOO | 5.00% | |
| REMX | 3.75% | |
| COPX | 2.50% | |
| SMH | 2.50% | |
| IGV | 2.50% | |
| SLV | 2.50% | |
| BOTZ | 2.50% | |
| ITA | 2.50% | |
| CIBR | 2.50% | |
| GDX | 2.50% | |
| URA | 1.25% | |
| XOP | 1.25% | |
| XLE | 1.25% | |
| XLK | 1.25% |
Macro Regime — Disinflation
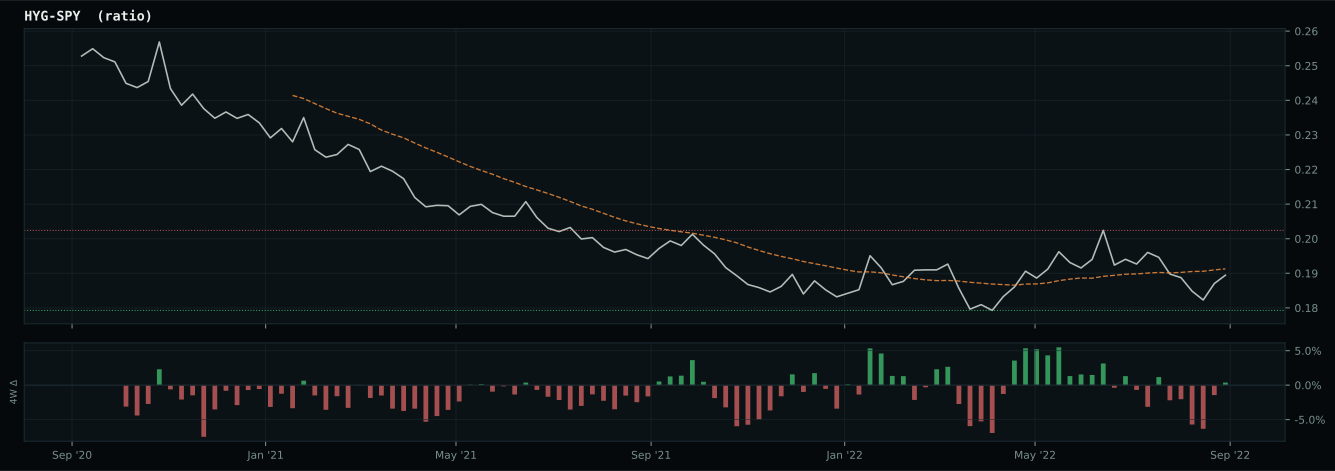
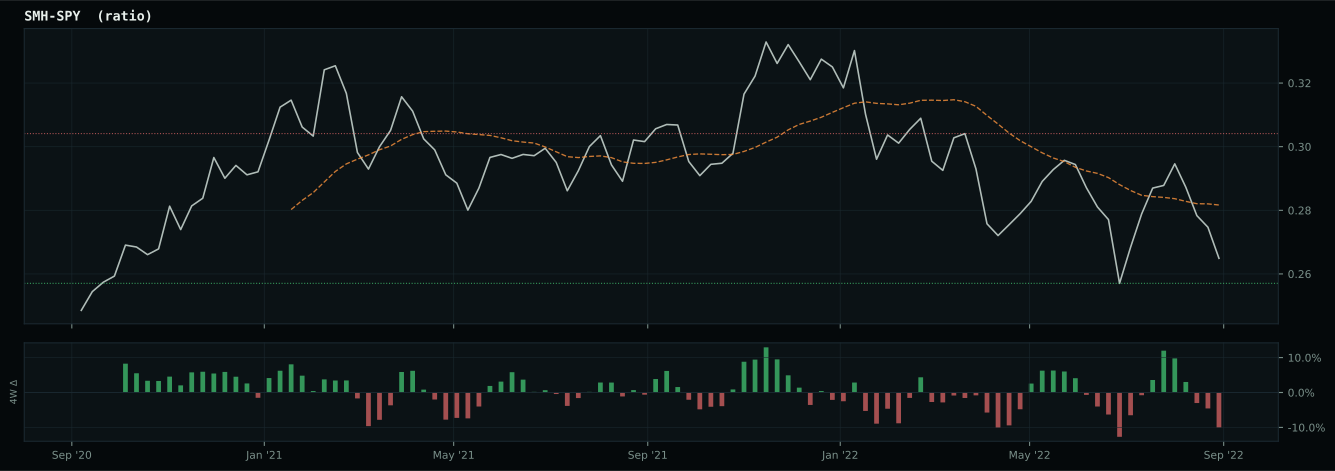
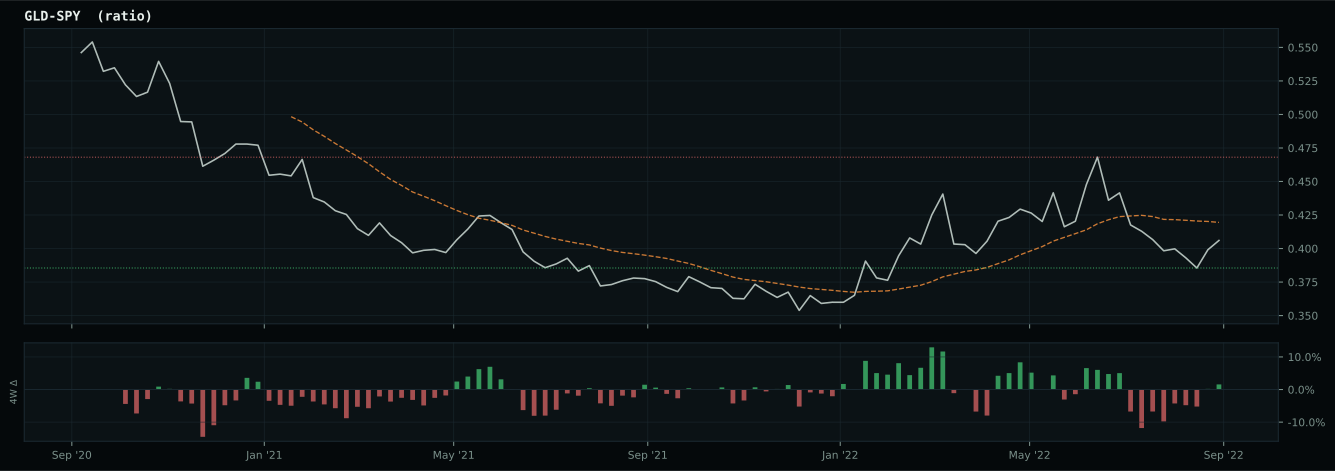
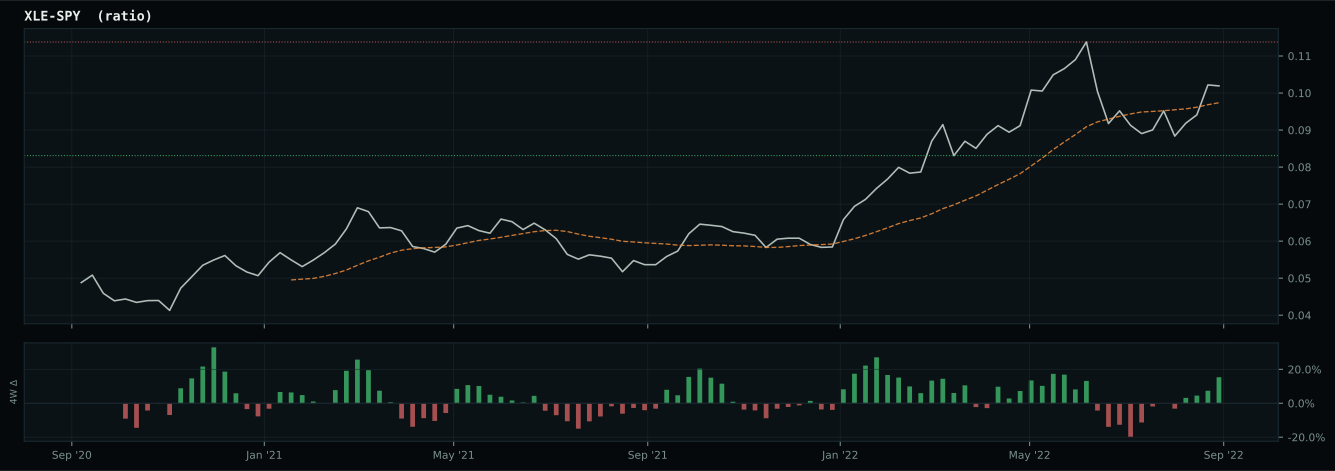
growth data is not confirming the weak market-implied risk appetite signal
Defensive overlay cause is not singular enough to concentrate: the sleeve diversifies across liquidity, monetary defense, and defensive equity exposure while the market resolves the next regime.
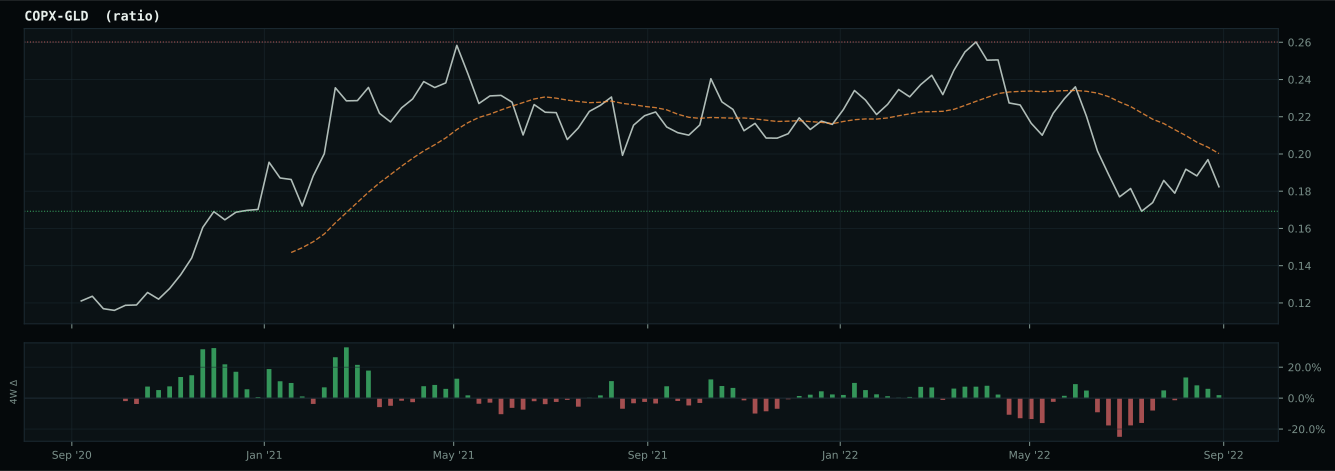
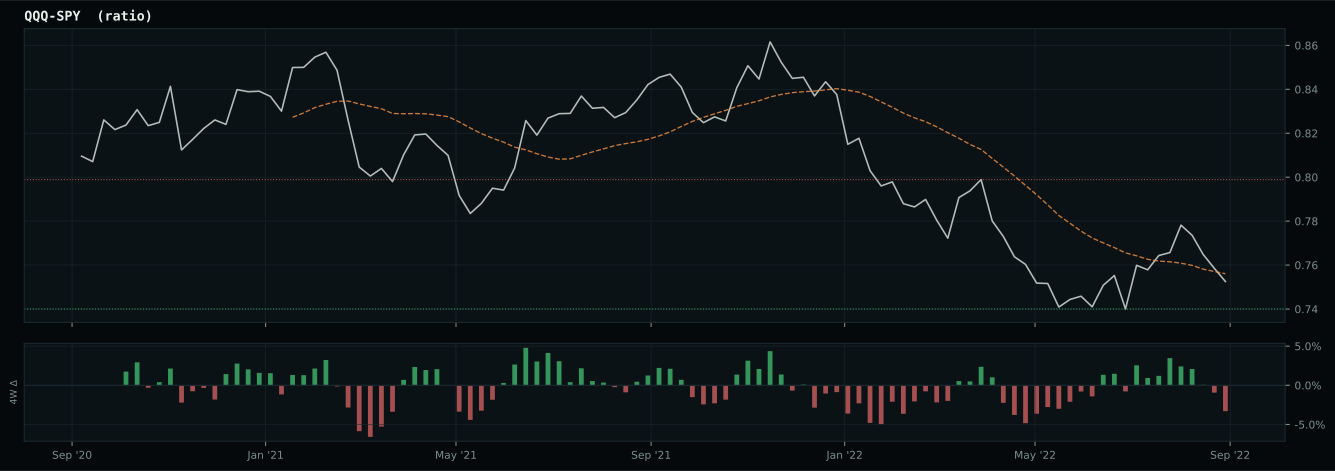
Macro Evidence Charts
Market-implied signals behind the macro regime scores. Each ratio compares two assets; the direction and slope of the ratio is what the macro engine reads.
Crypto Regime — NoCrypto
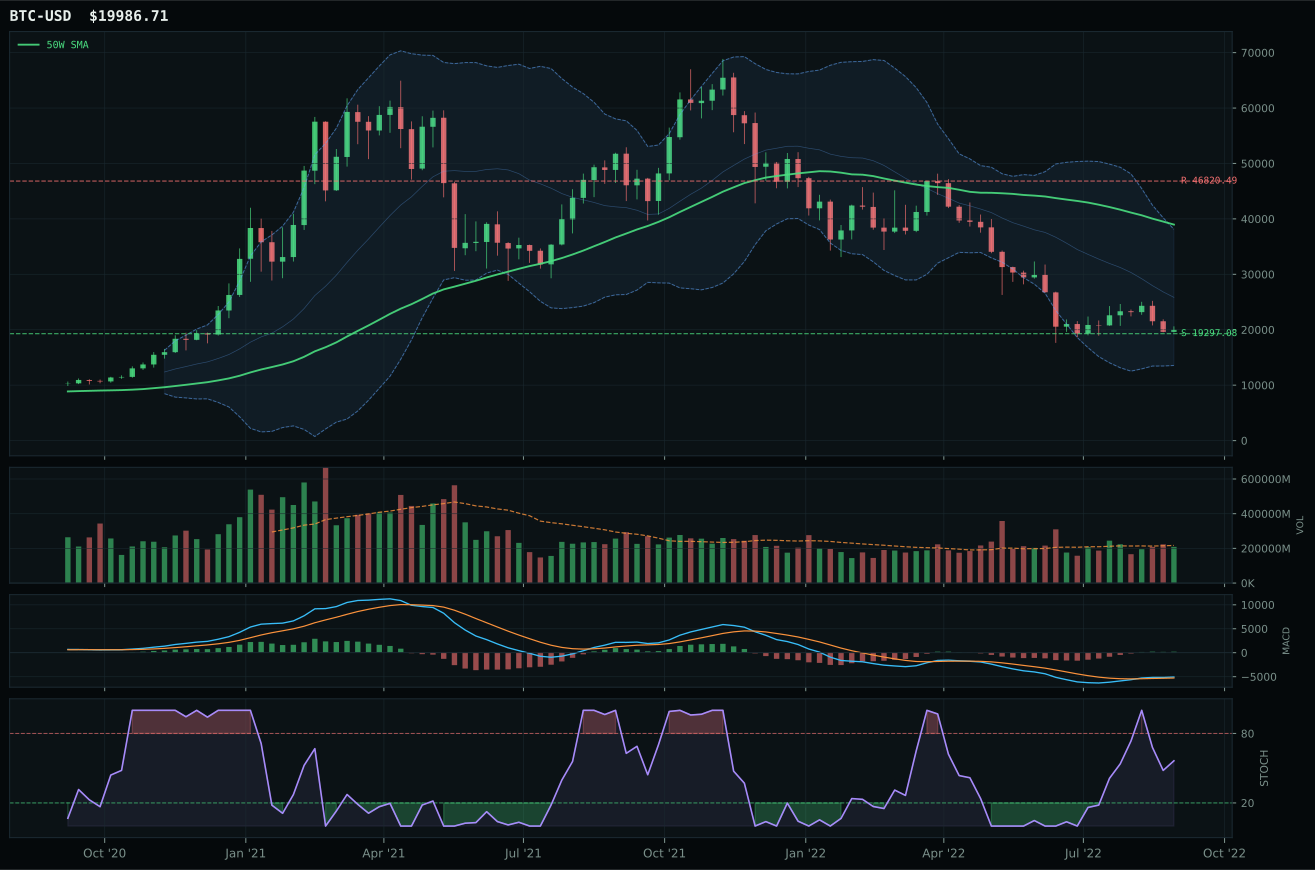
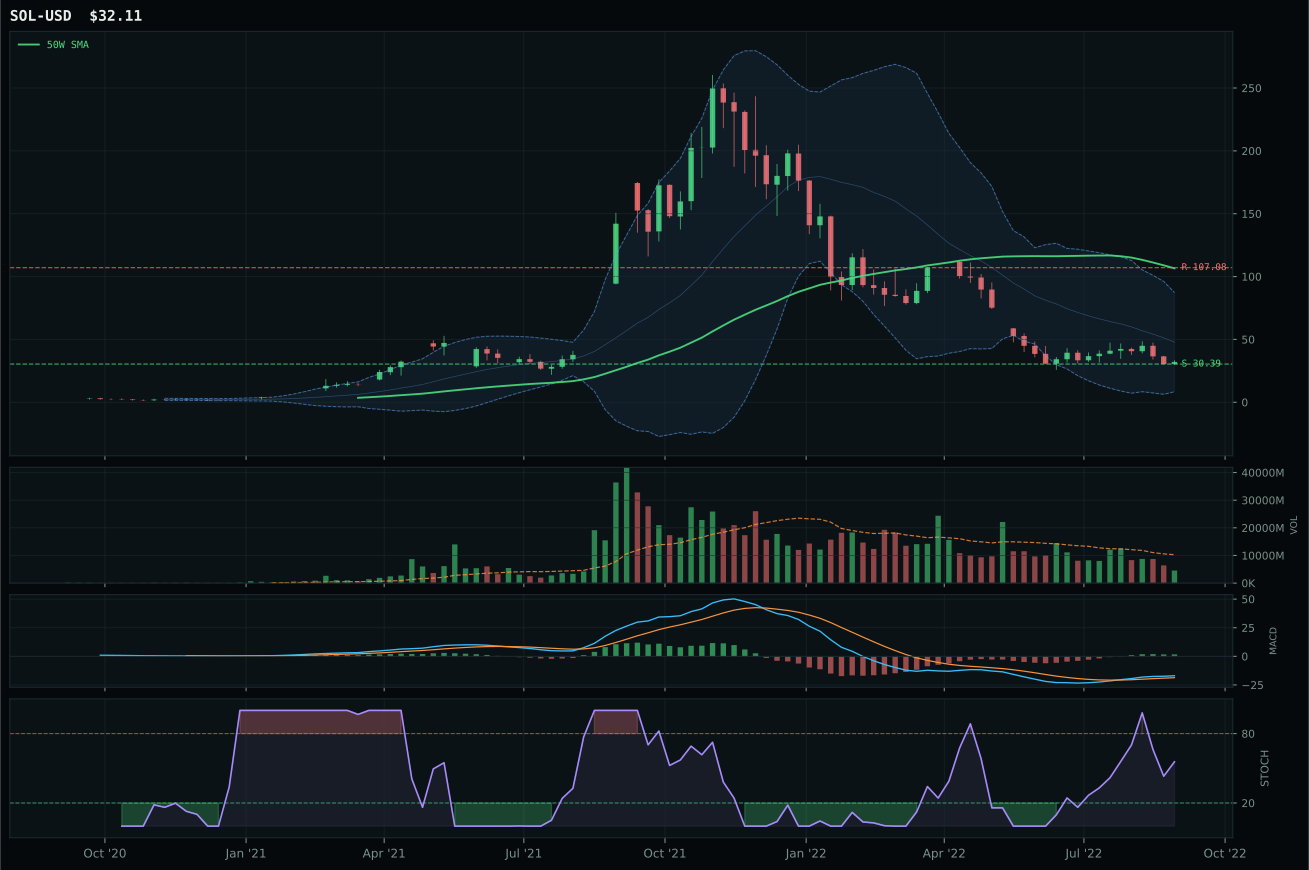
ValueBTC armed by first 200W buy-zone touch, but post-touch range age is 11 weeks; minimum is 12
TrendBTC not confirmed
one or more available conditions failed
Category Rankings
| Rank | Category | Winner | Score | Alloc | 4W Ret | Peers (4W) |
|---|---|---|---|---|---|---|
| 1 | Utilities & Infrastructure | XLU | 62.6 | 20% | -11.25% | PAVE -7.8% · IGF -10.3% |
| 2 | Precious Metals | GDX | 52.4 | 20% | +2.64% | GLD -2.3% · SLV +9.8% |
| 3 | Nuclear Energy | URNM | 50.8 | 10% | -13.94% | URA -12.8% · NLR -6.4% |
| 4 | Defense & Aerospace | ITA | 44.7 | 10% | -7.80% | XAR -9.6% · ROKT -5.6% |
| 5 | Technology | CIBR | 33.4 | 10% | -5.45% | XLK -10.0% · IGV -8.9% |
| 6 | Traditional Energy | XLE | 16.7 | 10% | -7.56% | FCG -10.0% · XOP -9.2% |
| 7 | Agriculture & Livestock | MOO | 16.7 | 10% | -8.80% | VEGI -7.9% · WEAT +11.1% |
| 8 | Industrial Metals | COPX | 11.3 | 10% | -2.92% | REMX -11.3% · PICK -3.8% |
| 9 | AI | SMH | 10.7 | 0% | -9.90% | AIQ -8.2% · BOTZ -8.3% |
| 10 | Emerging Markets | INDA | 8.1 | 0% | -5.48% | IEMG -8.9% · ILF -0.3% |
Utilities & Infrastructure — XLU
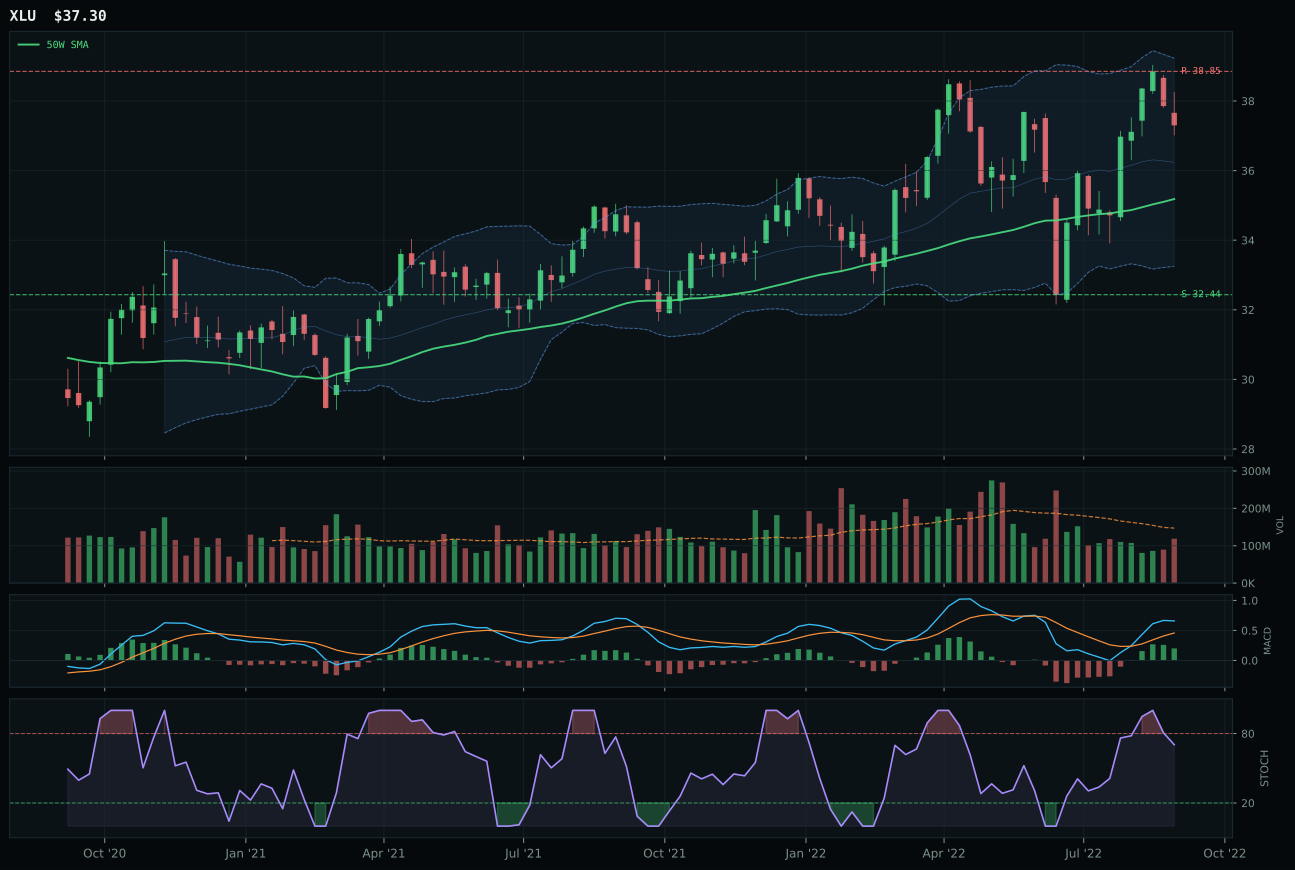
XLU has a neutral structure profile with 4.8% 13-week relative strength versus SPY.
A failed hold above support would weaken the setup.
Actionable but governed by invalidation levels.
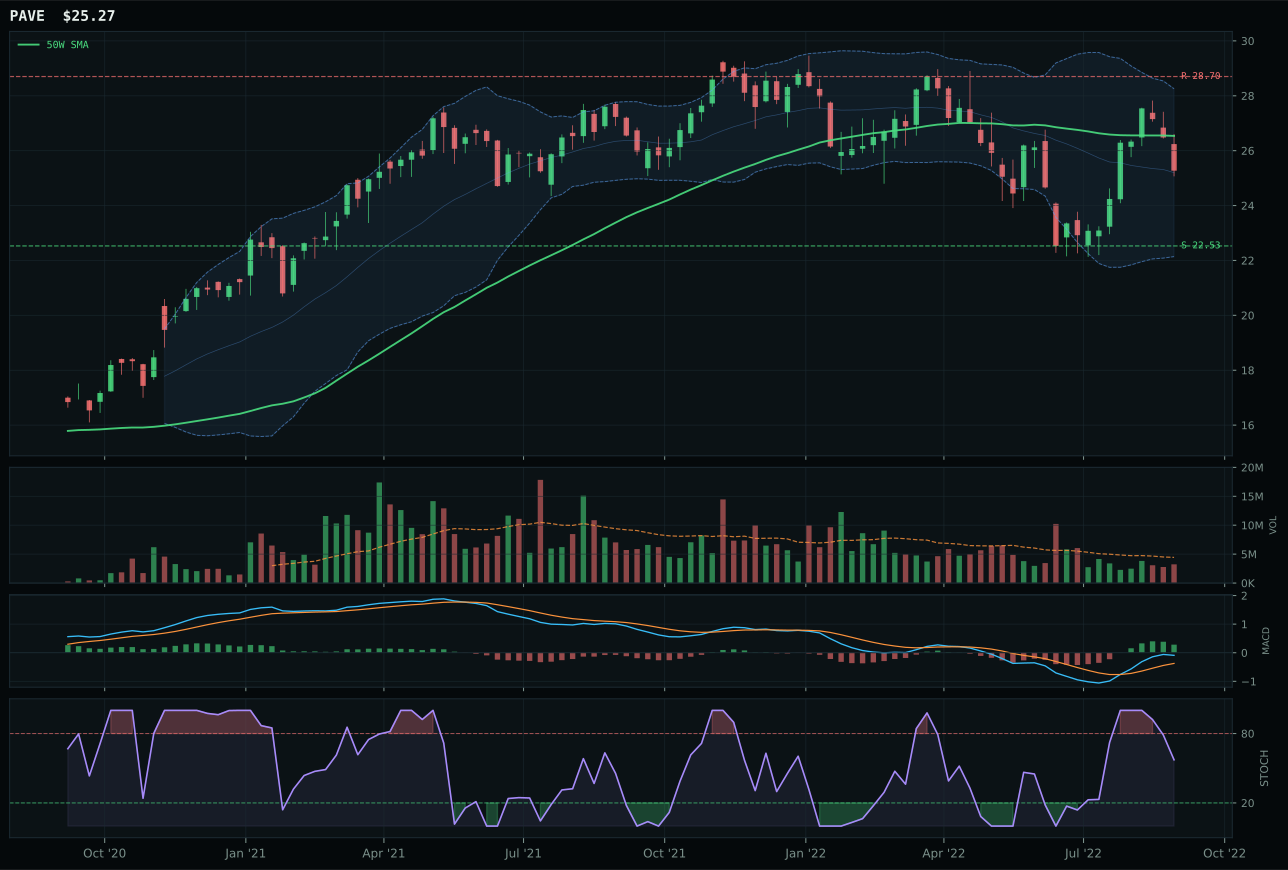
PAVE has a neutral structure profile with 1.2% 13-week relative strength versus SPY.
A failed hold above support would weaken the setup.
Actionable but governed by invalidation levels.
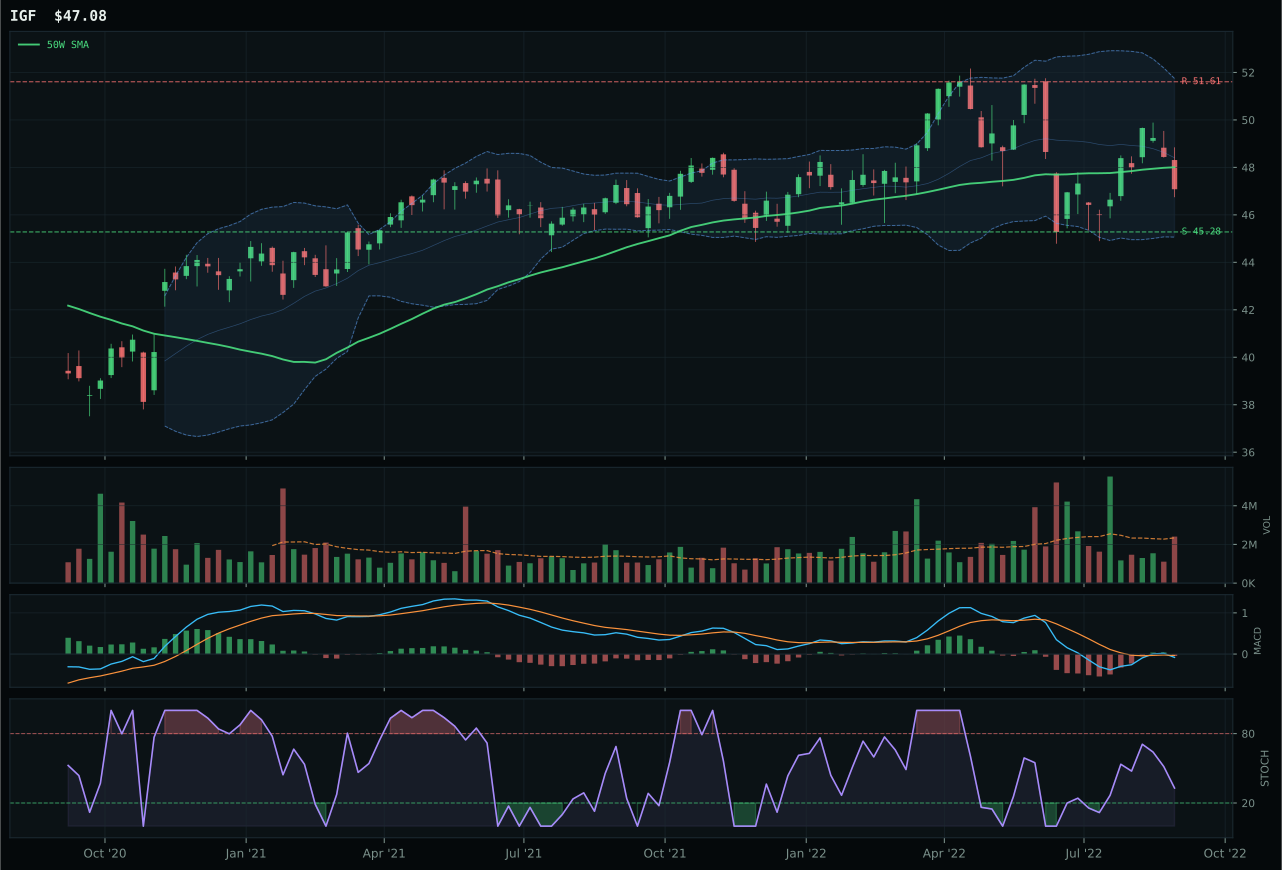
IGF has a pullback into support profile with -3.9% 13-week relative strength versus SPY.
A failed hold above support would weaken the setup.
Actionable but governed by invalidation levels.
XLU dominated the category with a perfect trend score of 100.0, driven by price 6.0% above the 50W paired with a stable 50W slope of 0.2% and positive relative strength of 4.8% versus SPY. PAVE, the runner-up, shows trend of just 77 despite a 13W return of -3.3%, unable to overcome XLU's outperformance during the period when defensive positioning mattered most. XLU's structure is neutral rather than compressed, giving it room to extend without immediately rolling over into overhead resistance—the 38.85 resistance is only 4.0% above current price, but the 32.44 support is 15.0% below, a risk-reward asymmetry (49.8/100) that in a bear market prioritizes downside cushion over upside potential. Volume-price confirmation of 71.8/100 on XLU signals that the move is being accumulated with neutral participation rather than panicky volume, and the persistence score of 66.9 indicates that the defense theme has legs. PAVE's thin participation (0.70x 20W average) during its setup signals weak buyer engagement, a timing disadvantage that MACD improvement cannot overcome.
Utilities & Infrastructure earned 10% top-2 overweight allocation at 62.6 final score, ranking first among all categories and securing the premier defensive slot in the portfolio. The macro fit is exceptional at 80.0/100: defensive rotation is active and powerful (+12), disinflation pressure is a positive tailwind (+6), broad market bear adds +4, and the category benefits from the transition-mixed regime classification (+4). XLU's 80.2/100 technical evidence combined with 72.0/100 macro fit creates the cleanest setup in the allocation: the utility sector's bond-like yield characteristics become attractive when equity risk appetite breaks, regulated cash flows become valued when credit stress is rising, and the 0.3% 13W return demonstrates actual resilience during a period when most growth assets collapsed. The top-2 allocation reflects a portfolio structure prioritized around financial stability during disinflation: XLU provides income, downside cushion, and macro alignment simultaneously. This is not a tactical trade but a strategic reallocation of capital from cyclical growth (technology, industrials) to inflation-hedging income (utilities), a shift that will persist unless either risk appetite snaps back decisively or disinflation proves transient.
Precious Metals — GDX
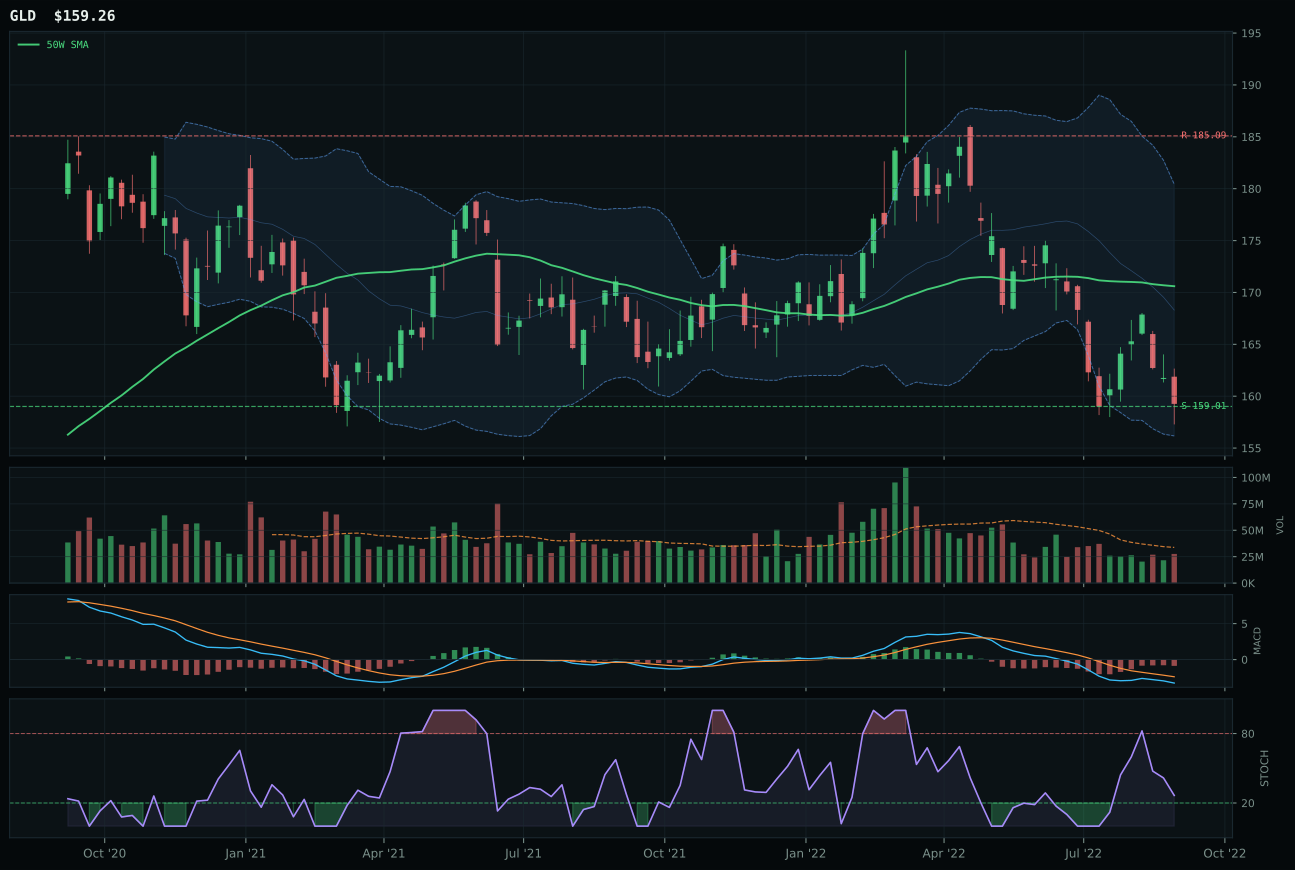
GLD has a pullback into support profile with -3.3% 13-week relative strength versus SPY.
A failed hold above support would weaken the setup.
Actionable but governed by invalidation levels.
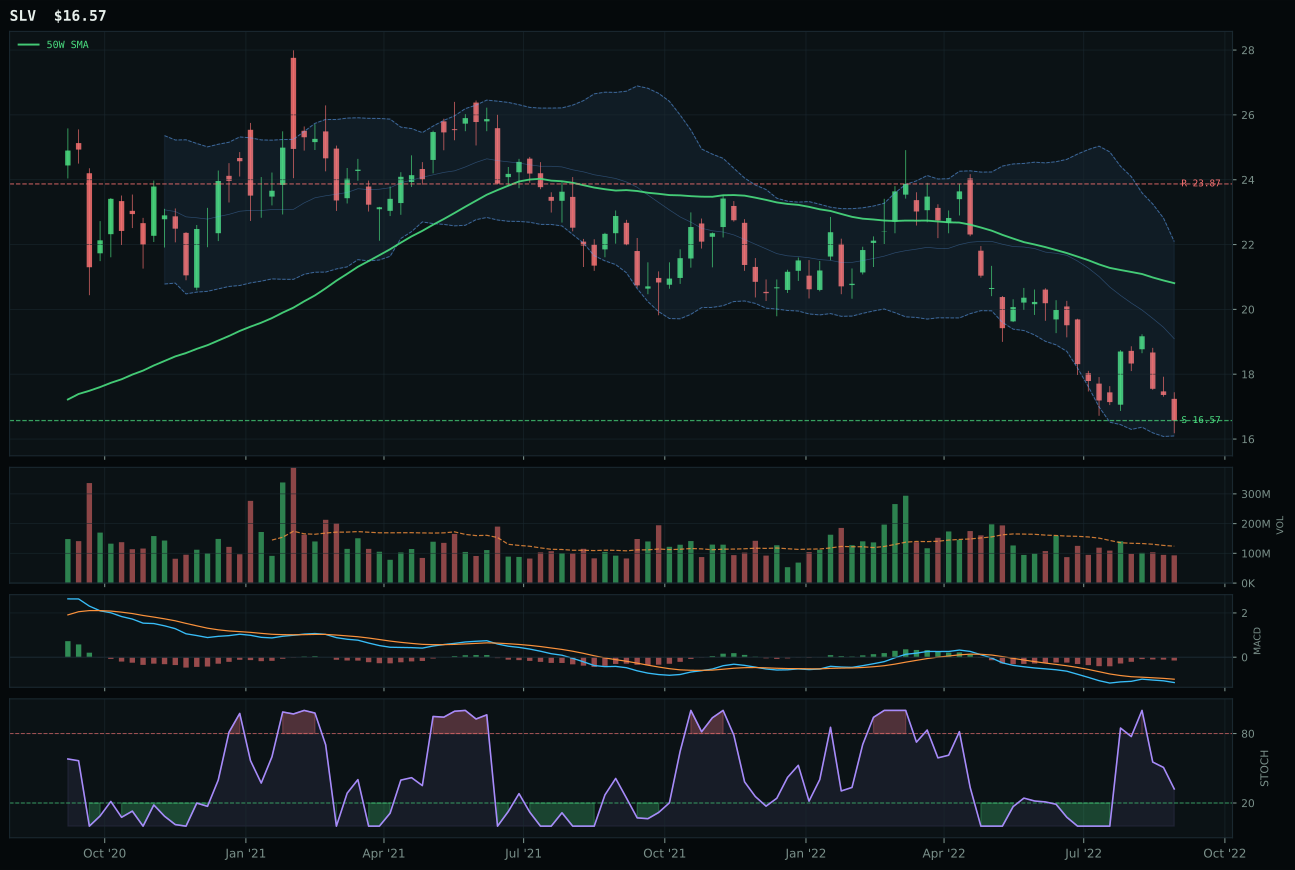
SLV has a pullback into support profile with -13.6% 13-week relative strength versus SPY.
A failed hold above support would weaken the setup.
Actionable but governed by invalidation levels.
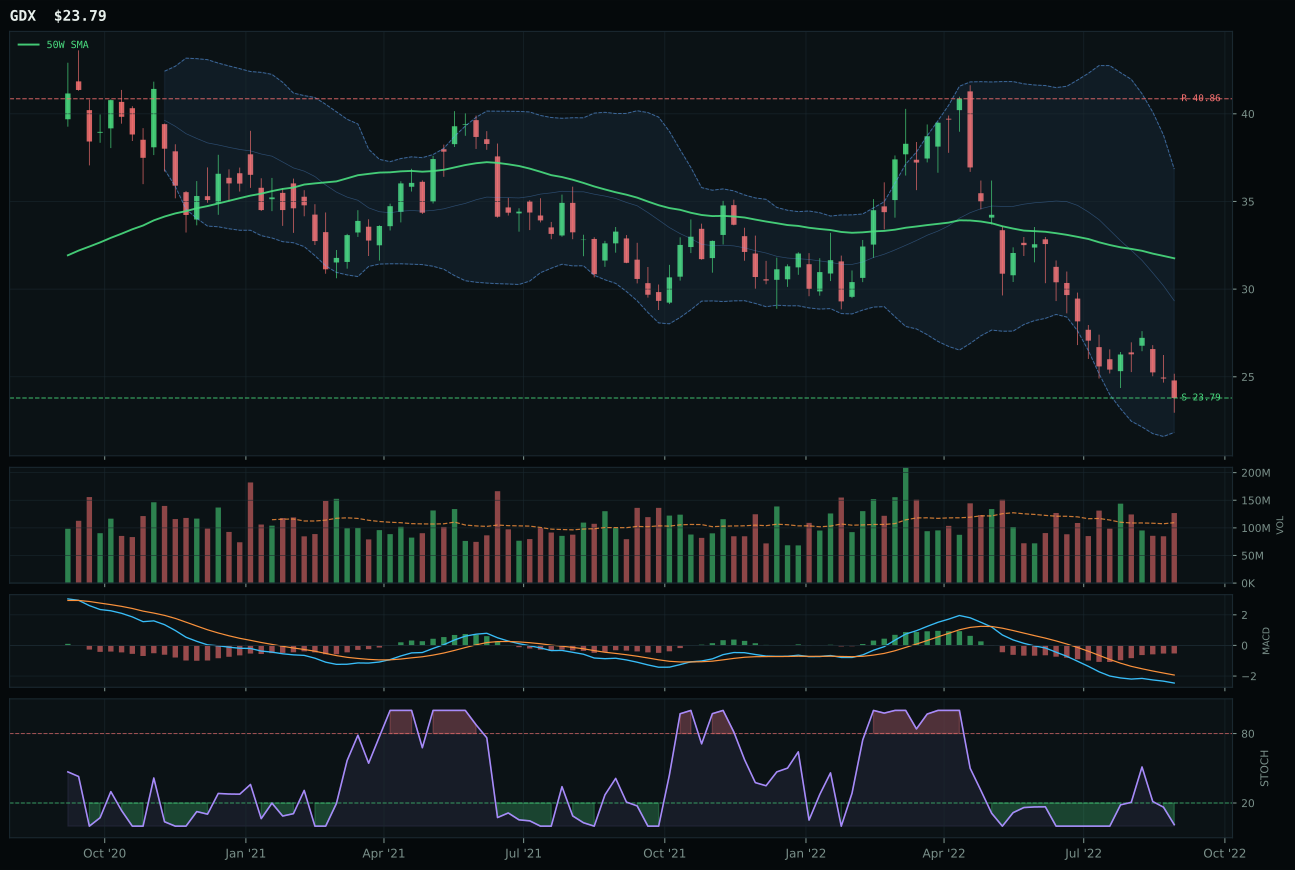
GDX has a pullback into support profile with -22.5% 13-week relative strength versus SPY.
A failed hold above support would weaken the setup.
Actionable but governed by invalidation levels.
GDX claimed top-2 status by offering above-average volume (1.16x 20W average) into an oversold stochastic RSI at 0.01, a combination that signals forced liquidation rather than rational selling. GLD, the technical superior at 59.9/100 evidence and 80.0/100 macro fit, remains the cleaner long-term thesis but sits only -6.6% below its 50W and carries neutral volume—the setup lacks urgency and conviction. GDX's 25.1% drawdown below the 50W, paired with MACD that is bearish but improving and volume that exceeds normal participation, creates a capitulation pattern where weak hands have likely exited and support buyers can establish position. The category-relative strength gap is stark: GLD shows 10.4% category outperformance while GDX shows -8.8%, meaning GDX is the recovery play if the sellers finally exhaust themselves. Timing score of 65.0 on GDX reflects exactly this setup—worst technicals but best tactical entry window given the oversold indicators and volume confirmation.
Precious Metals earned 10% top-2 overweight allocation at 52.4 final score, ranking second in the portfolio behind XLU's 62.6. The macro fit is exceptional at 88.0/100: monetary hedge bid is active and strong (+14), disinflation helps precious metals (+8), defensive rotation is active (+7), and disinflation pressure itself is a tailwind (+6). GDX was selected as the representative despite lower technical composite because its momentum and volume-price confirmation scores (100.0 and 8.9, respectively) capture the near-term forced-liquidation washout that opens a window for accumulation before the long-dated monetary hedge thesis begins to compound. GLD remains undisputed as the cleaner macro thesis with its 72/100 composite and superior 80.0 macro fit, but GDX's positioning at the capitulation nadir and above-average volume into oversold readings justifies the category's top-2 weight. This allocation assumes the Fed's disinflation priority remains credible and dollar strength continues to flatten, conditions that are currently met.
Nuclear Energy — URNM
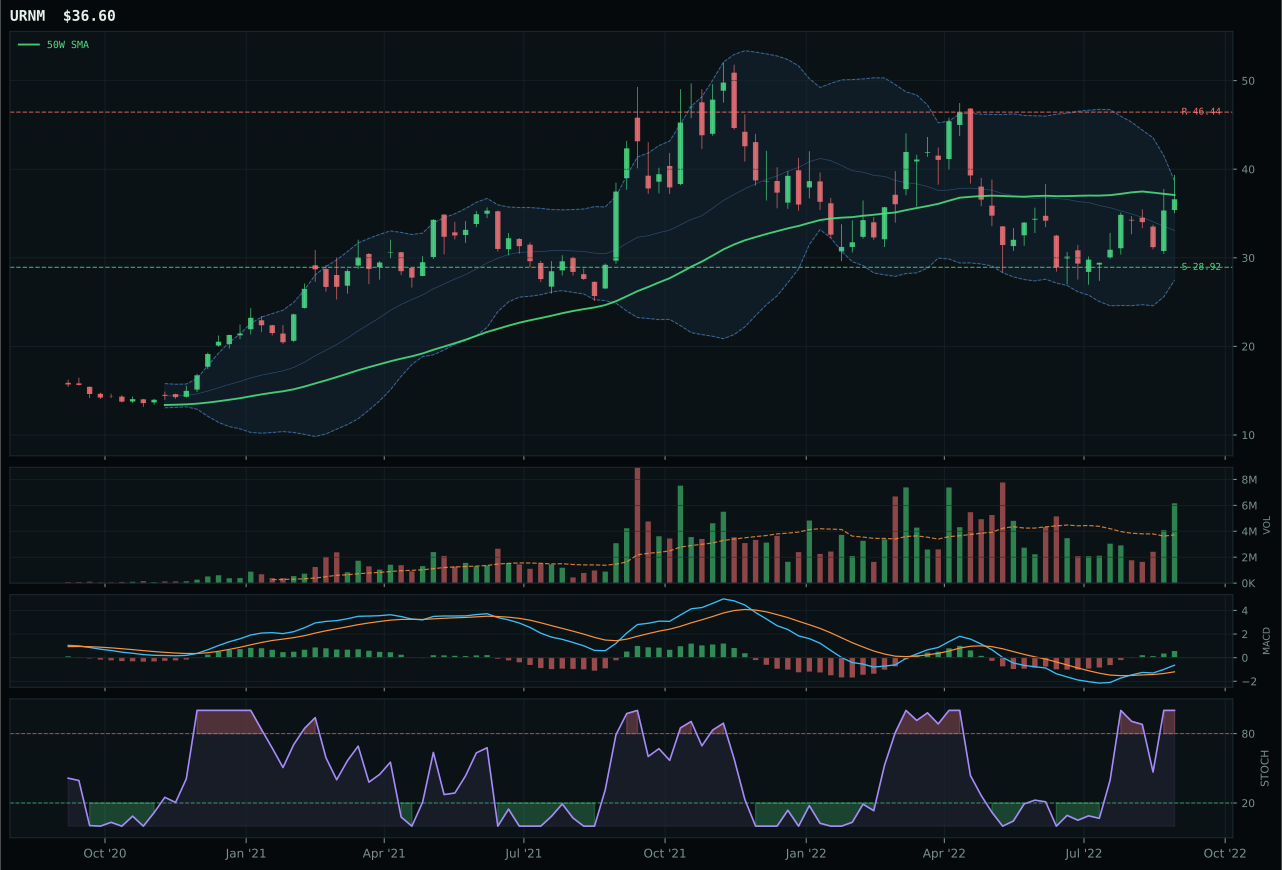
URNM has a compression near 50W profile with 10.9% 13-week relative strength versus SPY.
A failed hold above support would weaken the setup.
Actionable but governed by invalidation levels.
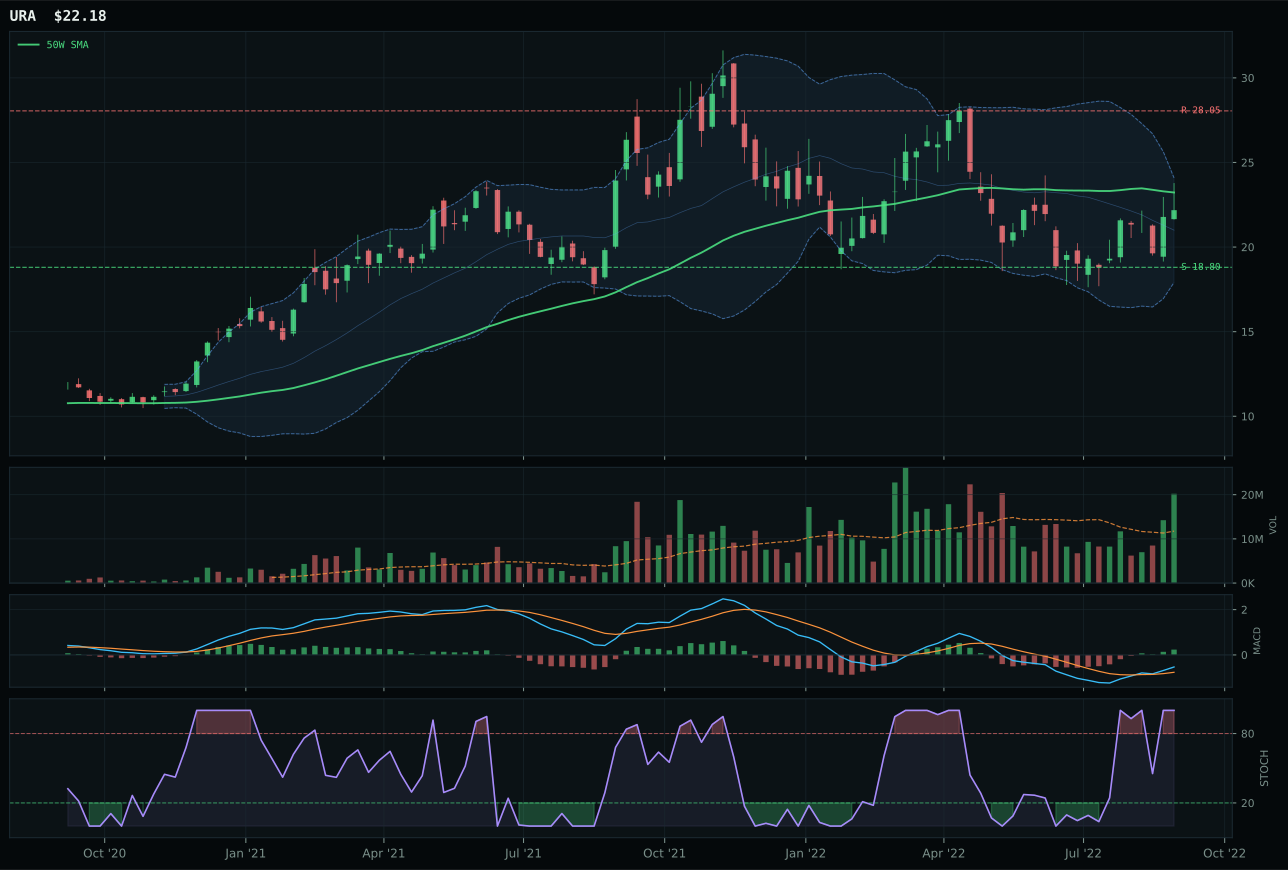
URA has a neutral structure profile with 4.6% 13-week relative strength versus SPY.
A failed hold above support would weaken the setup.
Actionable but governed by invalidation levels.
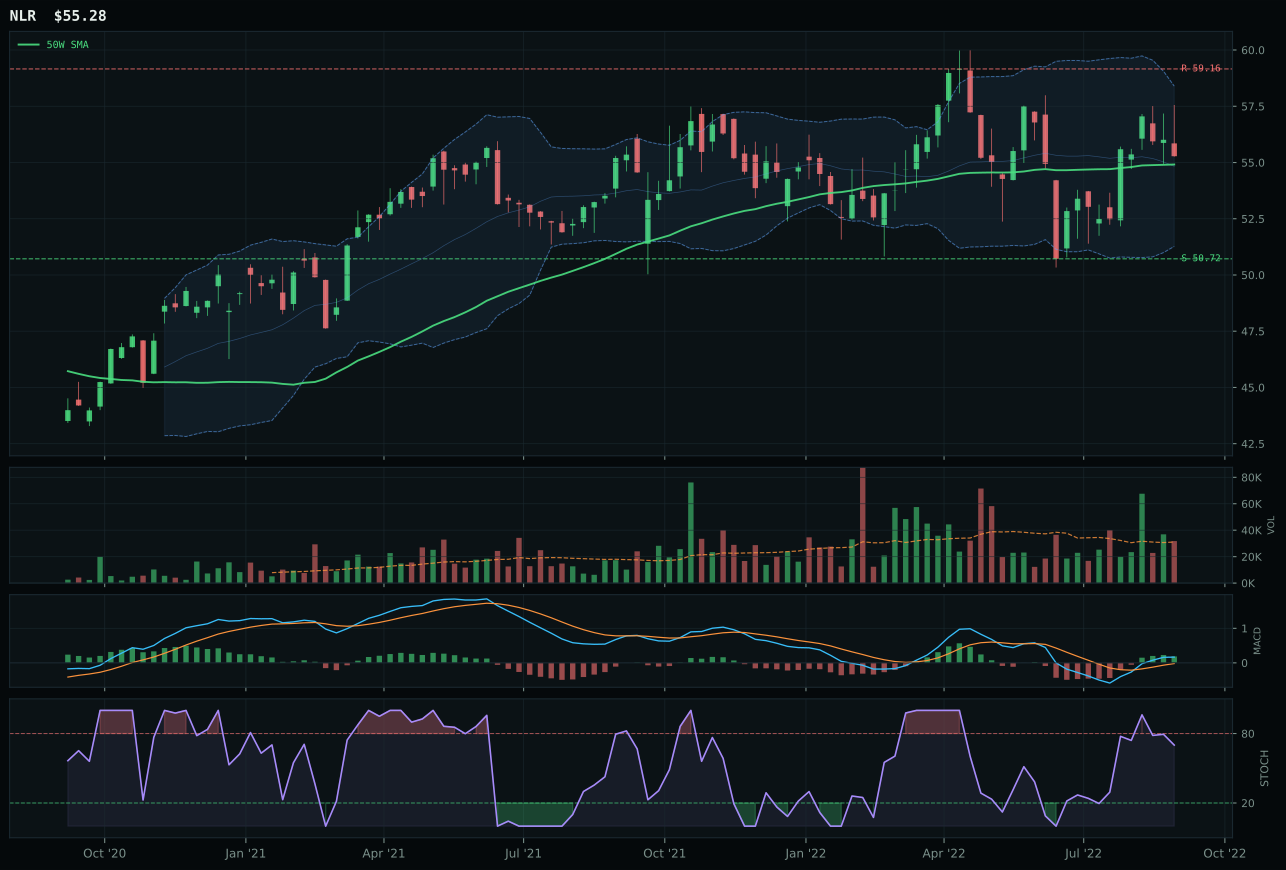
NLR has a compression near 50W profile with 1.8% 13-week relative strength versus SPY.
A failed hold above support would weaken the setup.
Tracked, but not top-2 eligible because: .
URNM won by 0.9 points over URA—the tightest margin in the category suite—by delivering a timing score of 100.0 that perfectly captured compression near the 50W with overbought-momentum stochastics and bullish-improving MACD all aligned. URA's timing of 97.0 is nearly indistinguishable, but URNM's category-relative strength advantage of 6.2% versus 0.0% reflects uranium miners outperforming the broader uranium complex, signaling sector breadth. Both show 13W positive returns (6.4% for URNM, 0.2% for URA), both carry accumulation volume (1.66x and 1.66x 20W average), and both display overbought stochastics rolling over—the setup is momentum extending into exhaustion territory, where URNM's compression near the 50W and category leadership justify the marginal nod. Volume-price confirmation of 86.2/100 on URNM is exceptional, indicating that buyers are stepping in front of overbought conditions rather than selling into them, a quality that URA's 82 score does not replicate at the same conviction level.
Nuclear Energy earned 5% allocation as a tier-2 category at 50.8 final score, narrowly missing top-2 status despite strong technical evidence (86.2/100) and positive 13W momentum. The macro fit is modest at 34.0/100, with liquidity stress (-7), credit stress (-5), and broken risk appetite (-4) creating headwinds that offset the thematic appeal of uranium as a decarbonization play. URNM's selection reflects conviction that the uranium-supply scarcity narrative and nuclear energy's role in a carbon-constrained world remain intact even in a disinflation-bear regime; the positioning near the 50W with overbought technicals suggests the theme has attracted early-cycle money ahead of broader energy recovery. The 5% allocation persists because uranium is structurally under-supplied, because the nuclear energy narrative is not cyclical-demand dependent like copper or oil, and because URNM's technical setup with accumulation volume into overbought conditions indicates sponsorship from informed players. This category would jump to 10% if the macro fit improved or if evidence of demand destruction in uranium futures failed to materialize.
Defense & Aerospace — ITA
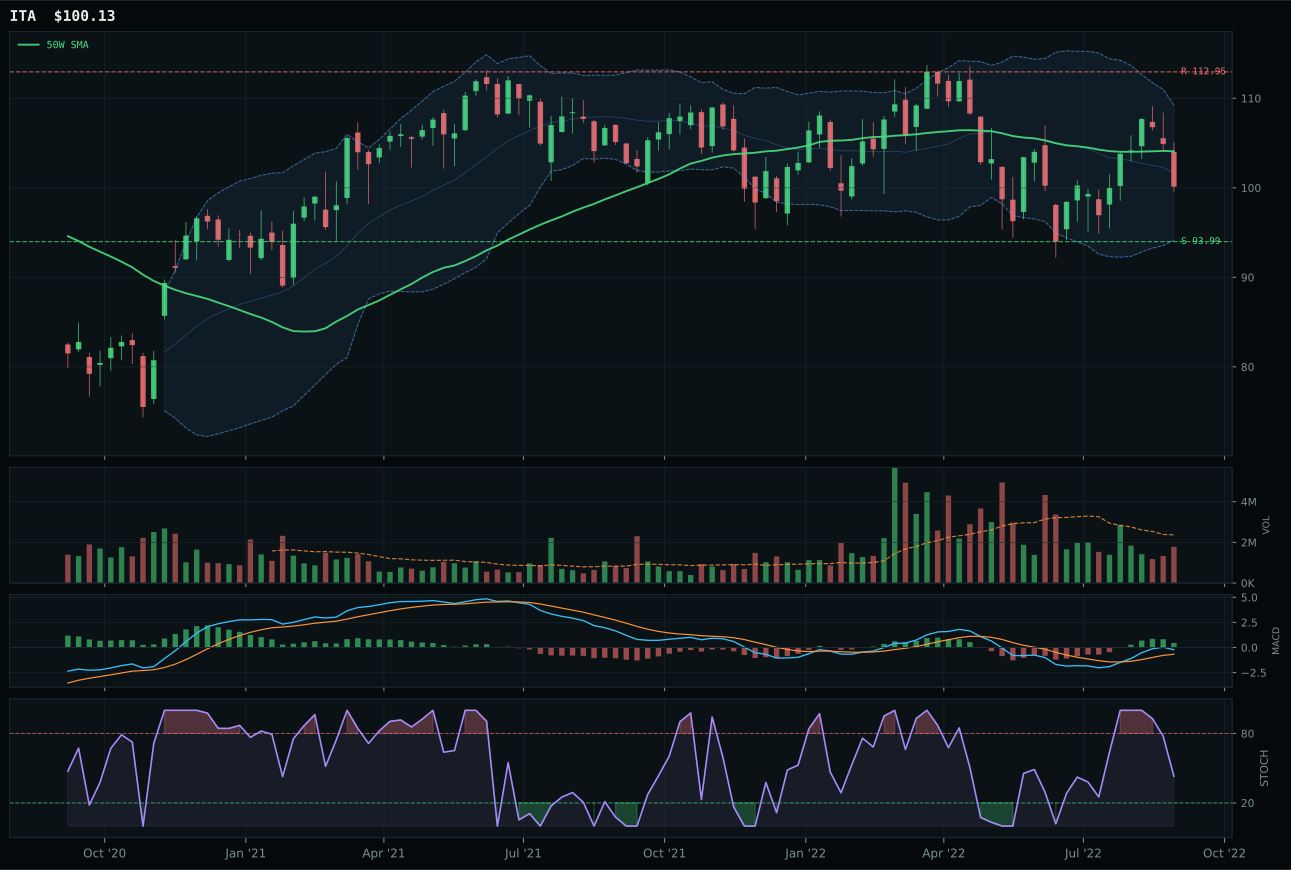
ITA has a neutral structure profile with 0.7% 13-week relative strength versus SPY.
A failed hold above support would weaken the setup.
Actionable but governed by invalidation levels.
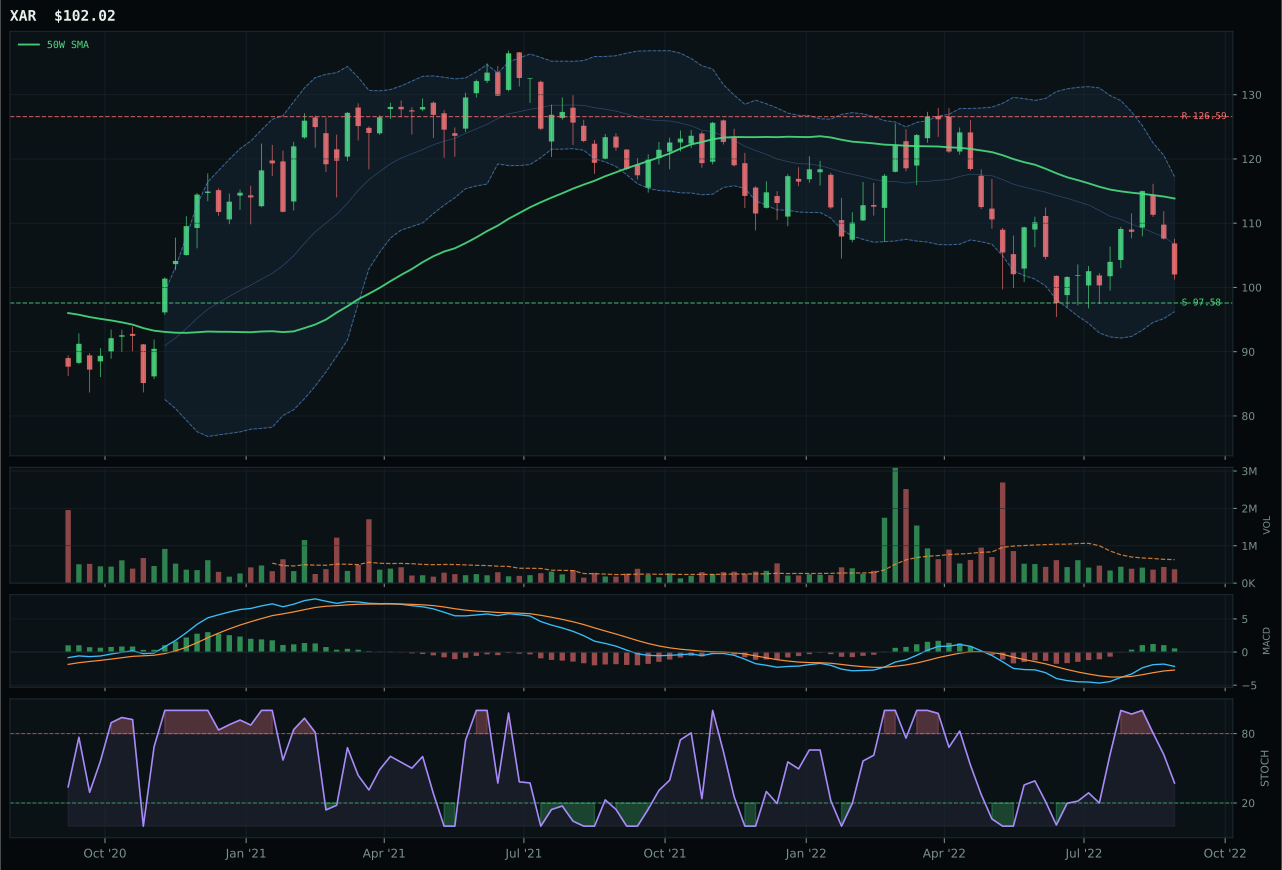
XAR has a pullback into support profile with -2.9% 13-week relative strength versus SPY.
A failed hold above support would weaken the setup.
Actionable but governed by invalidation levels.
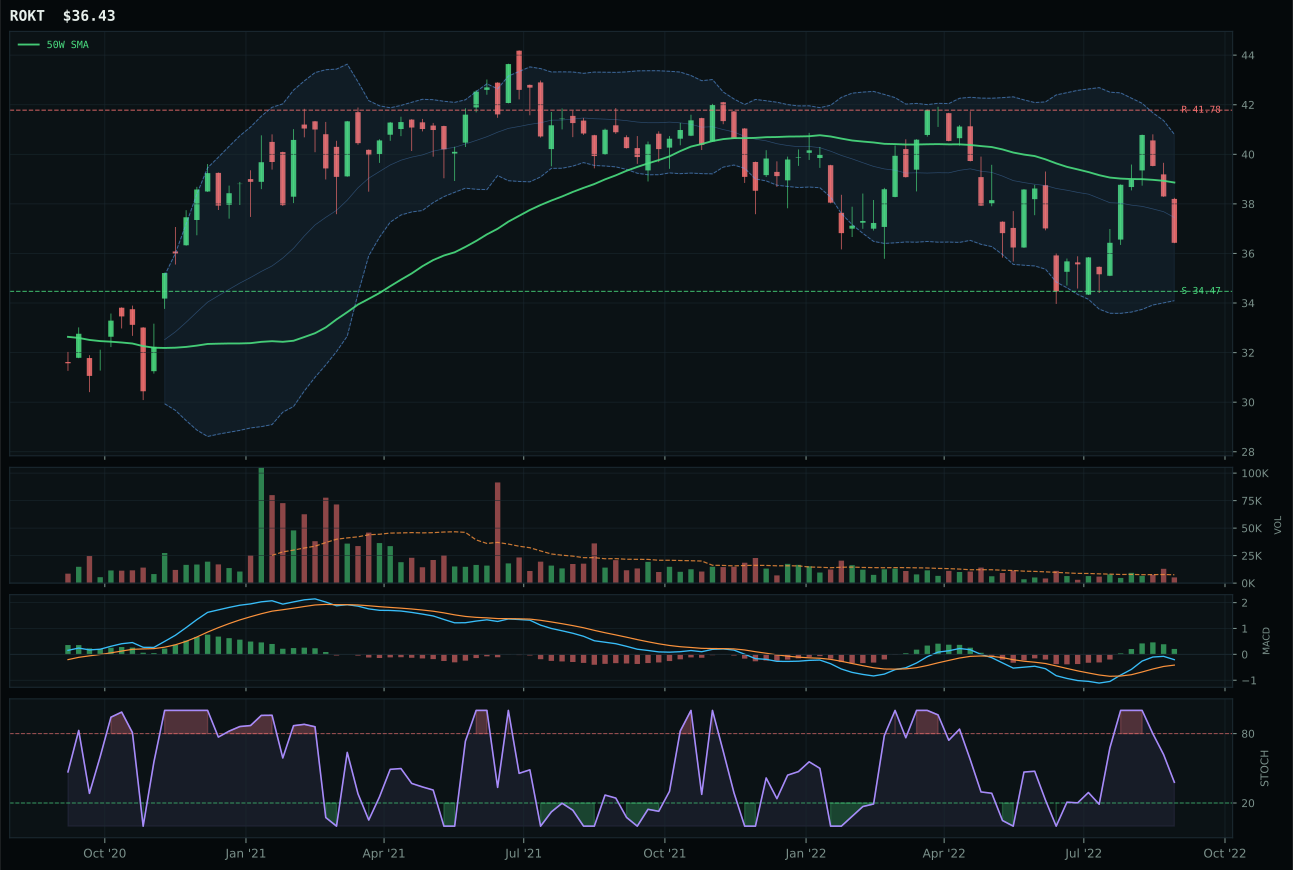
ROKT has a neutral structure profile with -1.2% 13-week relative strength versus SPY.
A failed hold above support would weaken the setup.
Tracked, but not top-2 eligible because: .
ITA dominated its category by posting a timing score of 97.0—the highest in the entire allocation suite—derived from being only -3.8% below its 50W average and sitting squarely in the deep retracement/value Fibonacci zone at 0.618. XAR, the runner-up, managed just 65.0 on timing because it sits deeper in drawdown territory and lacks the same volume sponsorship; its thin participation at entry compounds the timing disadvantage. ITA's 0.7% relative strength versus SPY and 1.9% advantage within the category basket signal that defense primes are holding up better than the broad market, and the bullish-and-improving MACD confirmation gives tactical cover for the thesis. Momentum confirmation of 55.7 reflects modest recent gains, but the real story is risk/reward: 84.3/100 because the pullback has created asymmetry between a 6.5% downside buffer and only 11.4% upside to resistance—ideal geometry for conviction entry in a uncertain environment.
Defense & Aerospace earned 5% allocation as a tier-2 holding, ranking third overall at 44.7 despite superior technical evidence (69.9/100) that would justify higher status in a normal regime. The macro fit is robust at 66.0/100—defensive rotation is active and strong (+8), broad market bear adds another +6, and dollar pressure provides +3—which means this category belongs in the portfolio as a hedge expression rather than a cyclical bet. ITA's neutral structure and compression near support created room for moderate conviction, and the category's 38% macro weighting ensures that defensive flows remain honored even when the technical setup is not perfect. The allocation would be 10% in a true bear market framework, but with two higher-ranked categories already commanding that 10% slot (XLU and GDX), Defense remains a 5% tactical dampener that will outperform if volatility spikes.
Technology — CIBR
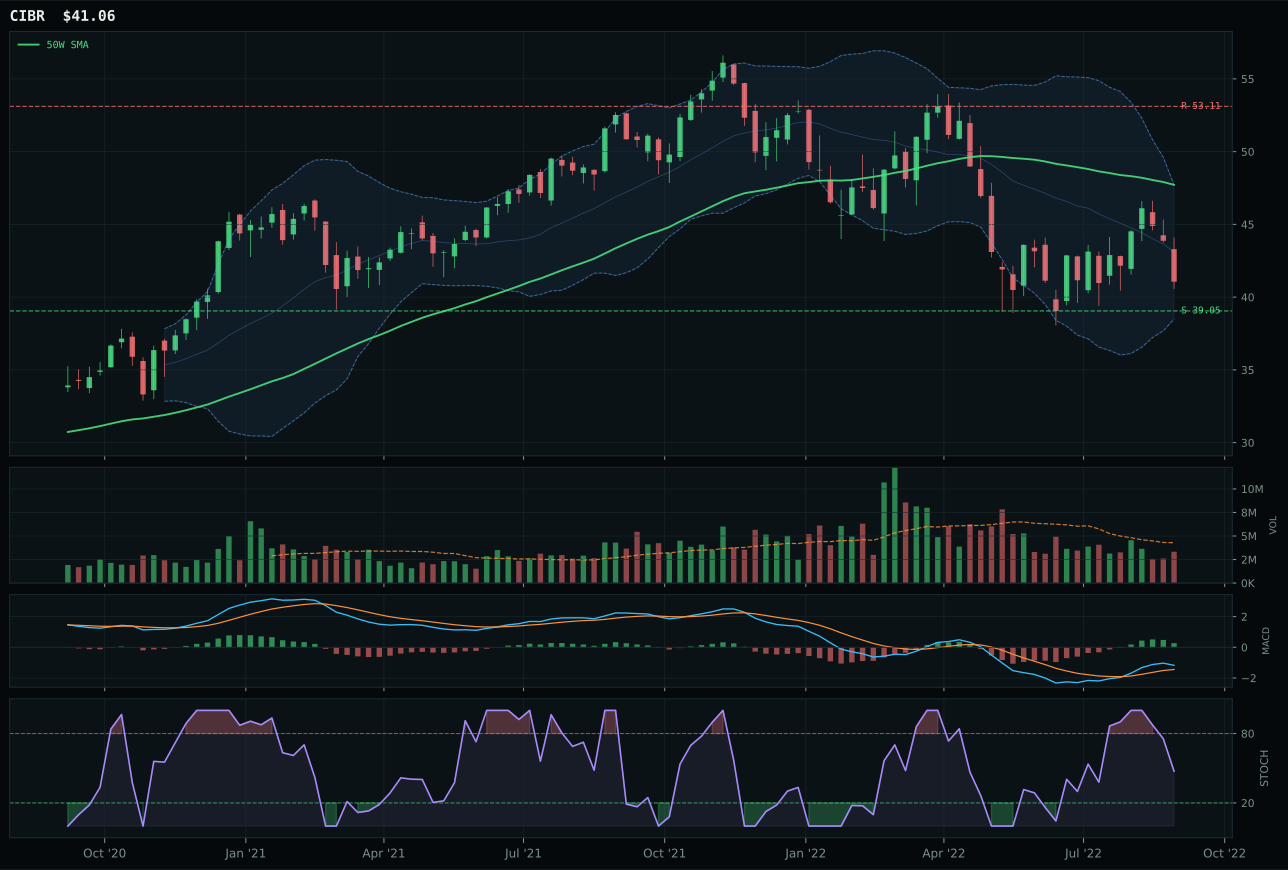
CIBR has a neutral structure profile with -0.4% 13-week relative strength versus SPY.
A failed hold above support would weaken the setup.
Actionable but governed by invalidation levels.
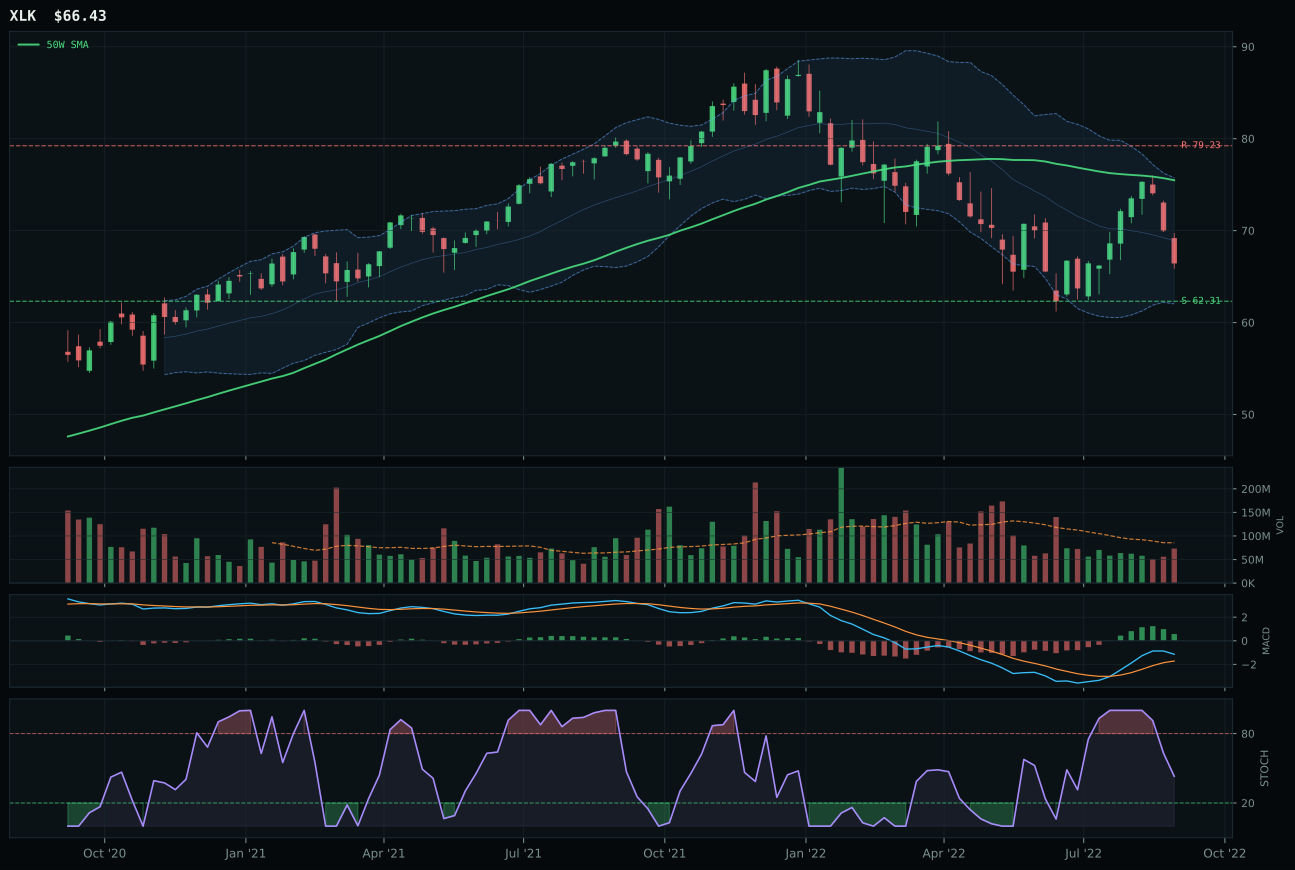
XLK has a neutral structure profile with -0.6% 13-week relative strength versus SPY.
A failed hold above support would weaken the setup.
Actionable but governed by invalidation levels.
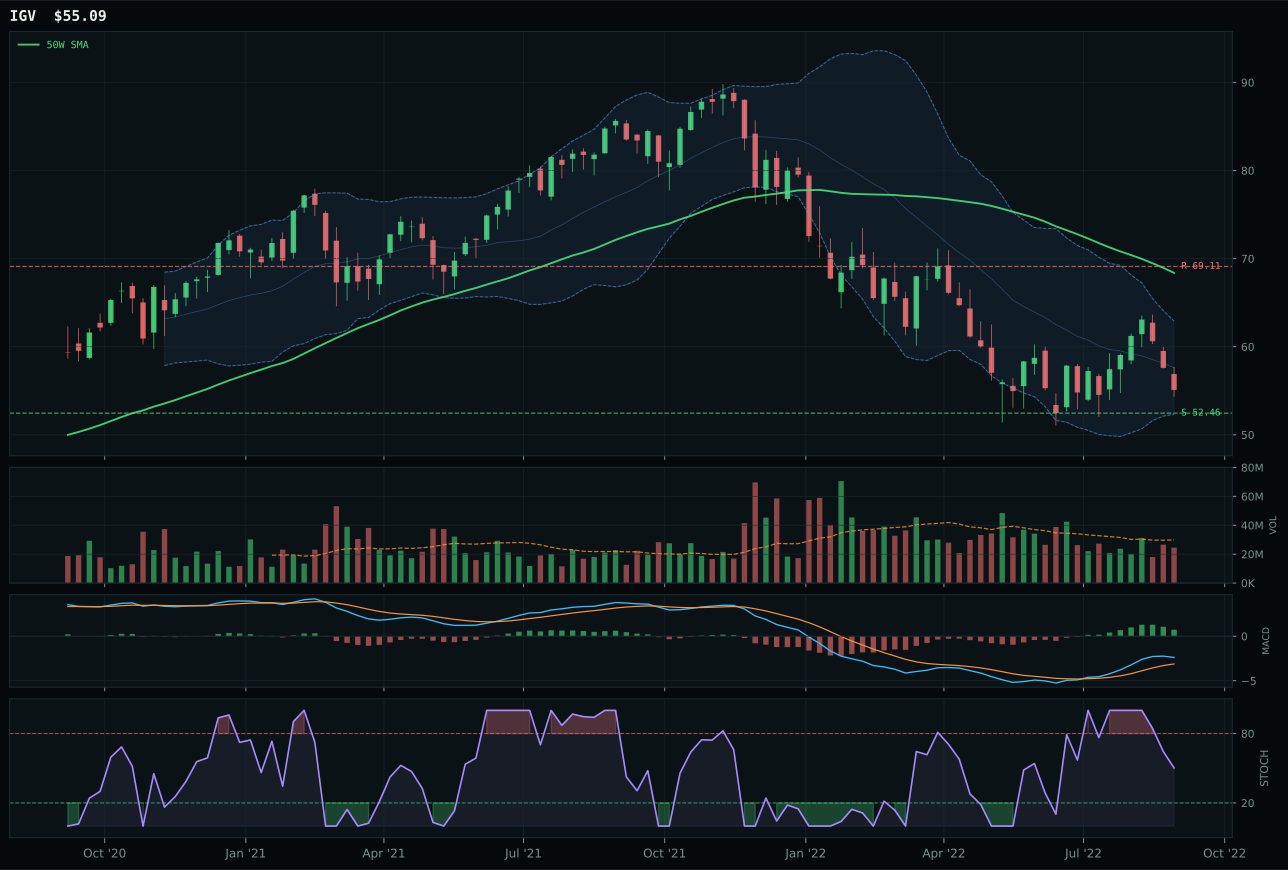
IGV has a neutral structure profile with -1.8% 13-week relative strength versus SPY.
A failed hold above support would weaken the setup.
Actionable but governed by invalidation levels.
CIBR claimed the category over XLK by delivering superior timing—a 55.0 score versus 50.0—anchored on MACD that is bullish and improving rather than merely bullish and flattening. The cybersecurity thesis sits -13.9% below its 50W average, placing it in the repair zone where mean reversion mechanics favor patient entry; category-relative strength of 0.3% gives it the narrowest edge but enough to matter when everything else is neutral. XLK's momentum confirmation scored only 34.0 to CIBR's 43.4, reflecting a five-week return of -5.1% versus -4.8%—a small gap, but in a market where every buyer at current prices is late to the party, XLK's slightly worse momentum became disqualifying. Volume is neutral in both, structure is neutral in both, but CIBR's improving MACD and lower SPY-relative weakness combine to form the only legitimate near-term accumulation candidate in this basket.
Technology earned 5% allocation as a tier-2 category, denied the top-2 overweight despite a respectable 33.4 final score. The macro regime is actively hostile: liquidity stress costs the category 10 points, credit stress another 7, and the broad bear narrative another 4, leaving technical evidence at just 62.7/100 to carry the load. In a disinflation regime with broken risk appetite, cyclical profit growth is structurally out of favor, and neither a reset in cybersecurity nor any other tech subsector can offset the headwind. XLU and GDX ranked higher because they align with the defensive turn and monetary hedge bid; technology's 40.0/100 macro fit score ensures it remains relegated until either liquidity improves or broad market risk appetite snaps back into focus.
Traditional Energy — XLE
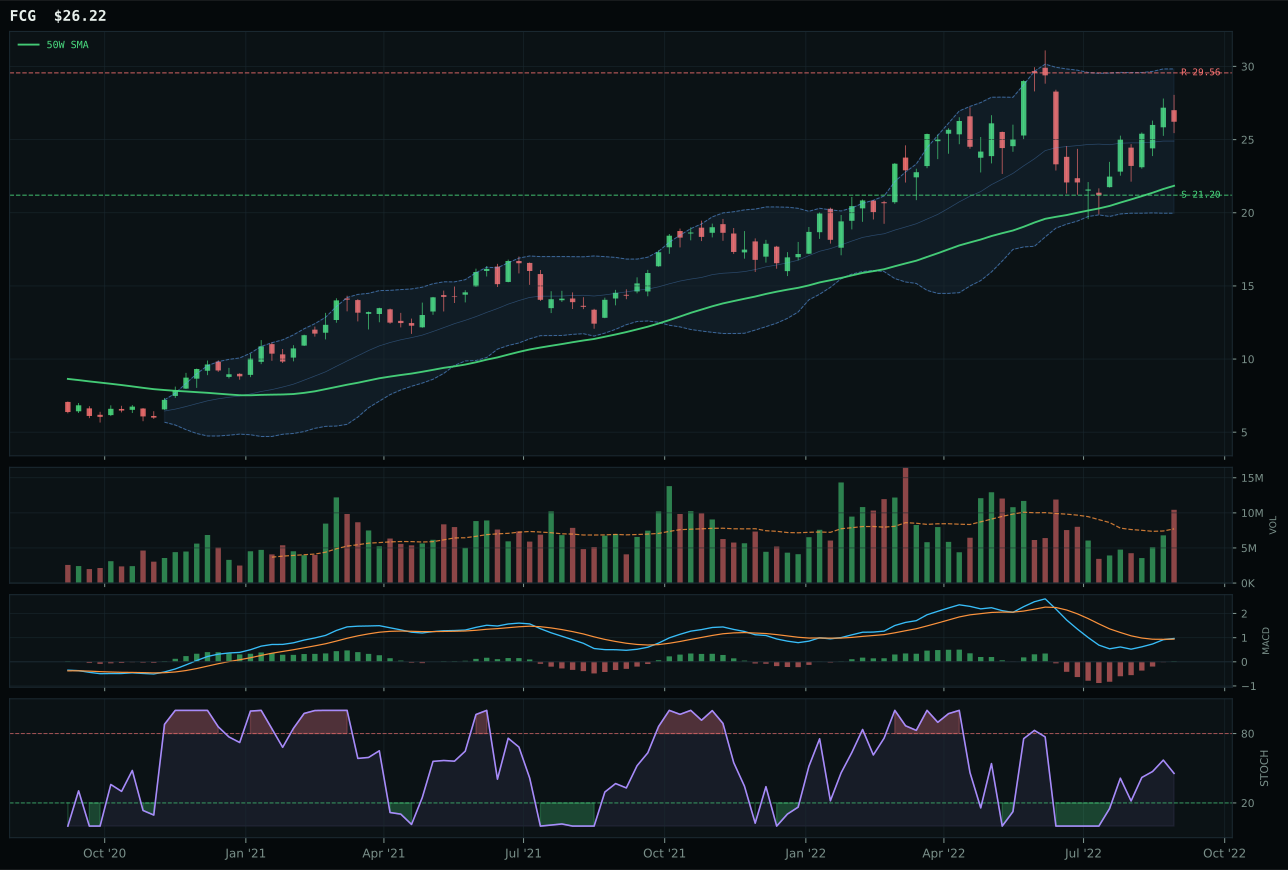
FCG has a vertical extension profile with -6.8% 13-week relative strength versus SPY.
A failed hold above support would weaken the setup.
Actionable but governed by invalidation levels.
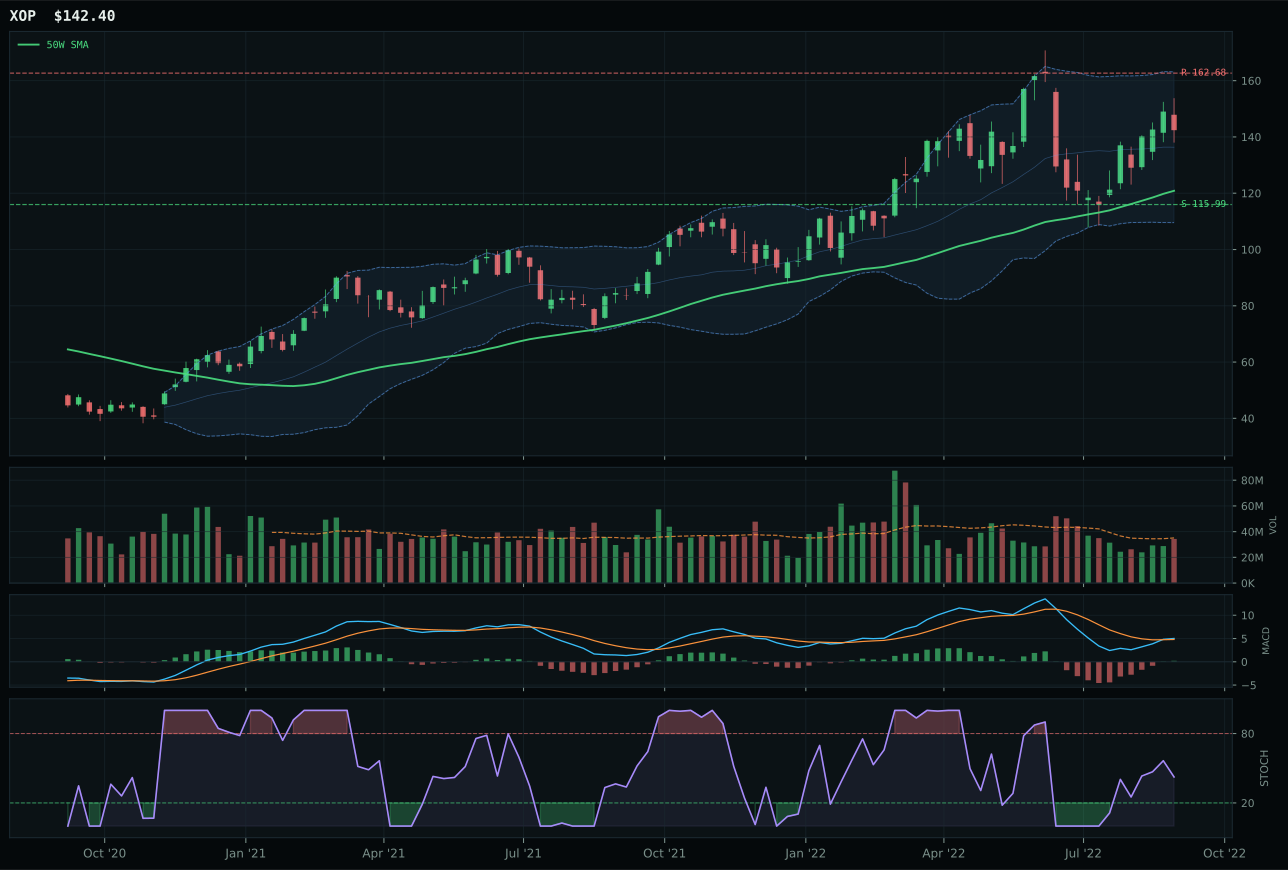
XOP has a vertical extension profile with -7.4% 13-week relative strength versus SPY.
A failed hold above support would weaken the setup.
Actionable but governed by invalidation levels.
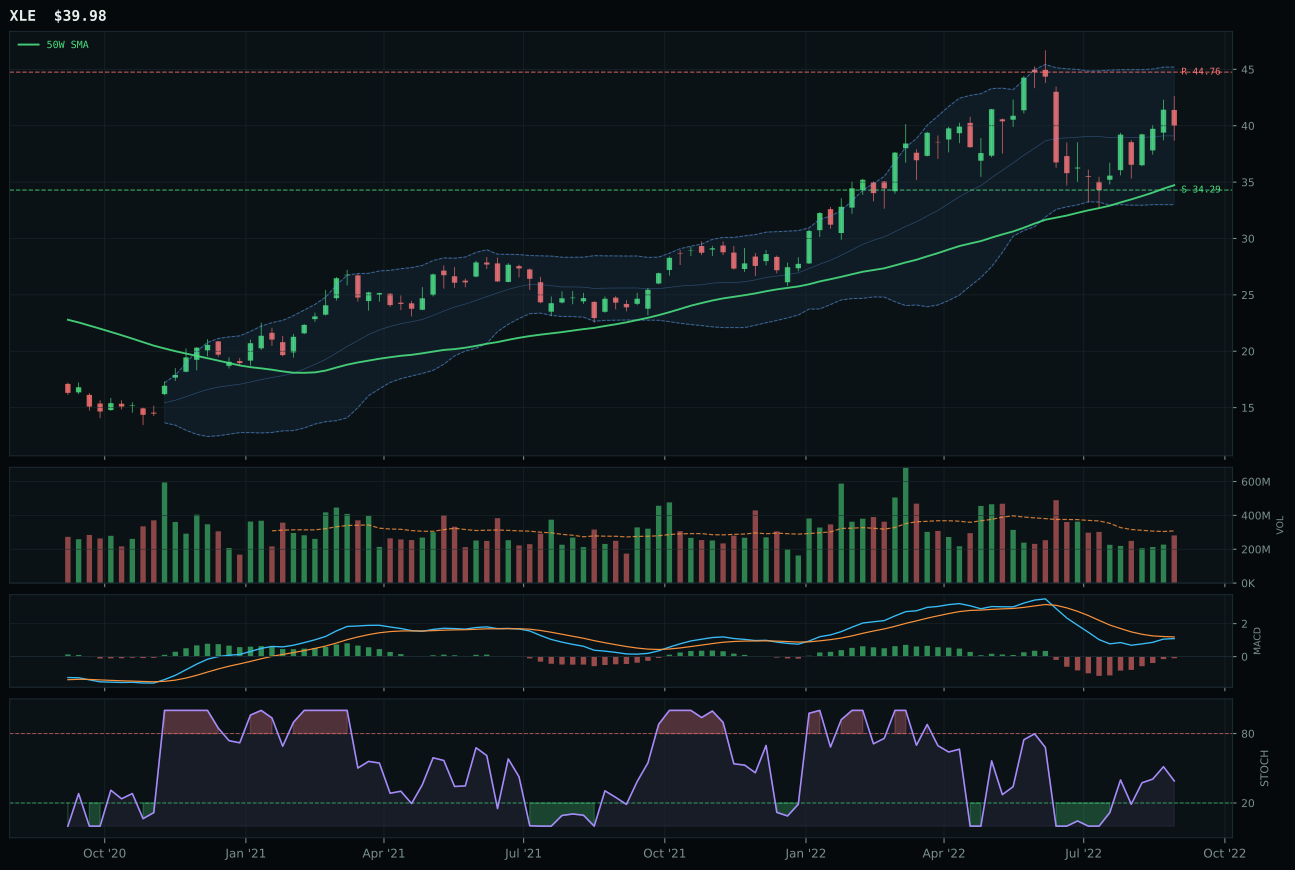
XLE has a vertical extension profile with -6.2% 13-week relative strength versus SPY.
A failed hold above support would weaken the setup.
Actionable but governed by invalidation levels.
XLE won by the narrowest margin—just 4.3 points versus FCG—by delivering category-relative strength of 0.6% and slightly better risk/reward at 41.6 versus 39 on FCG. The real story is that neither deserves meaningful allocation: both are extended from their 50W averages (XLE at 15.1%, FCG at 11.3%), both show bearish-or-flattening MACD, and both sit in upper momentum zones that penalize entry timing. XLE's slight edge comes from its neutral volume (0.91x) versus FCG's above-average participation (1.16x), which suggests that XLE's rally is less compressed by forced accumulation and thus has room to extend if the disinflation narrative reverses. FCG's bullish-and-improving MACD and higher momentum confirmation (68 versus 50) signal continued strength, but that strength is not translating into category leadership when both charts are extended and neither has convincing technical proof of demand. The timing score difference is minimal (61 versus 61), indicating that entry risk is symmetric in both—XLE's win reflects simplicity and neutrality over conviction.
Traditional Energy earned 5% allocation as a tier-2 category at 16.7 final score, the lowest-ranked hold in the portfolio, sustained primarily as a macro hedge rather than a technical trade. Disinflation is actively hostile to energy: the category macro fit is only 16.0/100 with disinflation pressure (-10), credit stress (-7), and liquidity stress (-7) all dragging on the thesis. XLE's 51.6/100 technical evidence would justify allocation in a normal regime, but the energy category's -10 macro hit for disinflation pressure reflects authentic structural headwinds—falling demand, falling oil prices, and falling refining margins all compound in a disinflationary backdrop. The 5% persists because energy remains a long-dated inflation-hedge position and because XLE's integrated cash-flow model provides dividend income that can sustain the position through commodity downturns. This allocation should be understood as a tail-hedge buy-and-hold rather than a tactical trade; reversal would require visible signs of Chinese demand recovery or geopolitical supply disruption forcing the price higher despite the macro regime.
Agriculture & Livestock — MOO
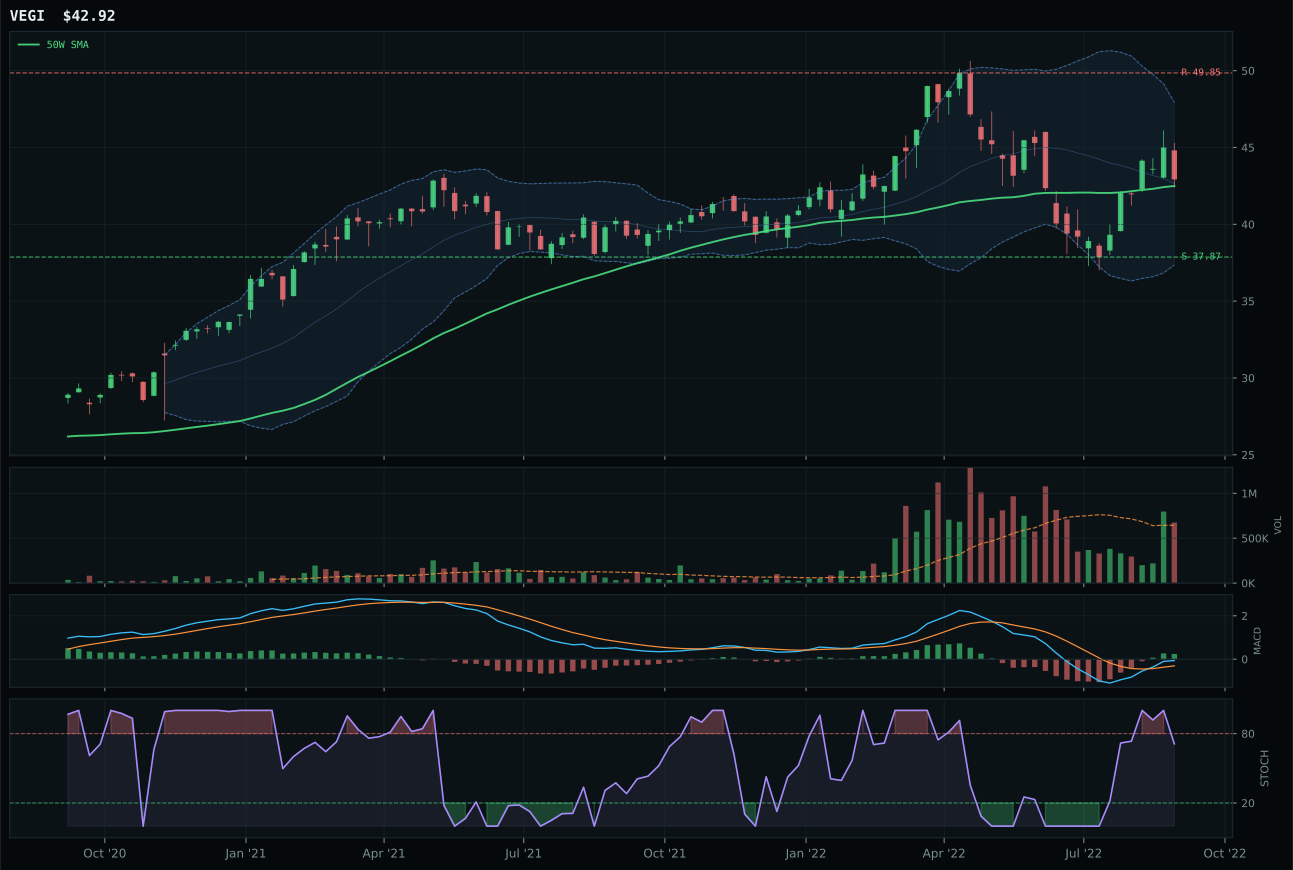
VEGI has a compression near 50W profile with -0.8% 13-week relative strength versus SPY.
A failed hold above support would weaken the setup.
Actionable but governed by invalidation levels.
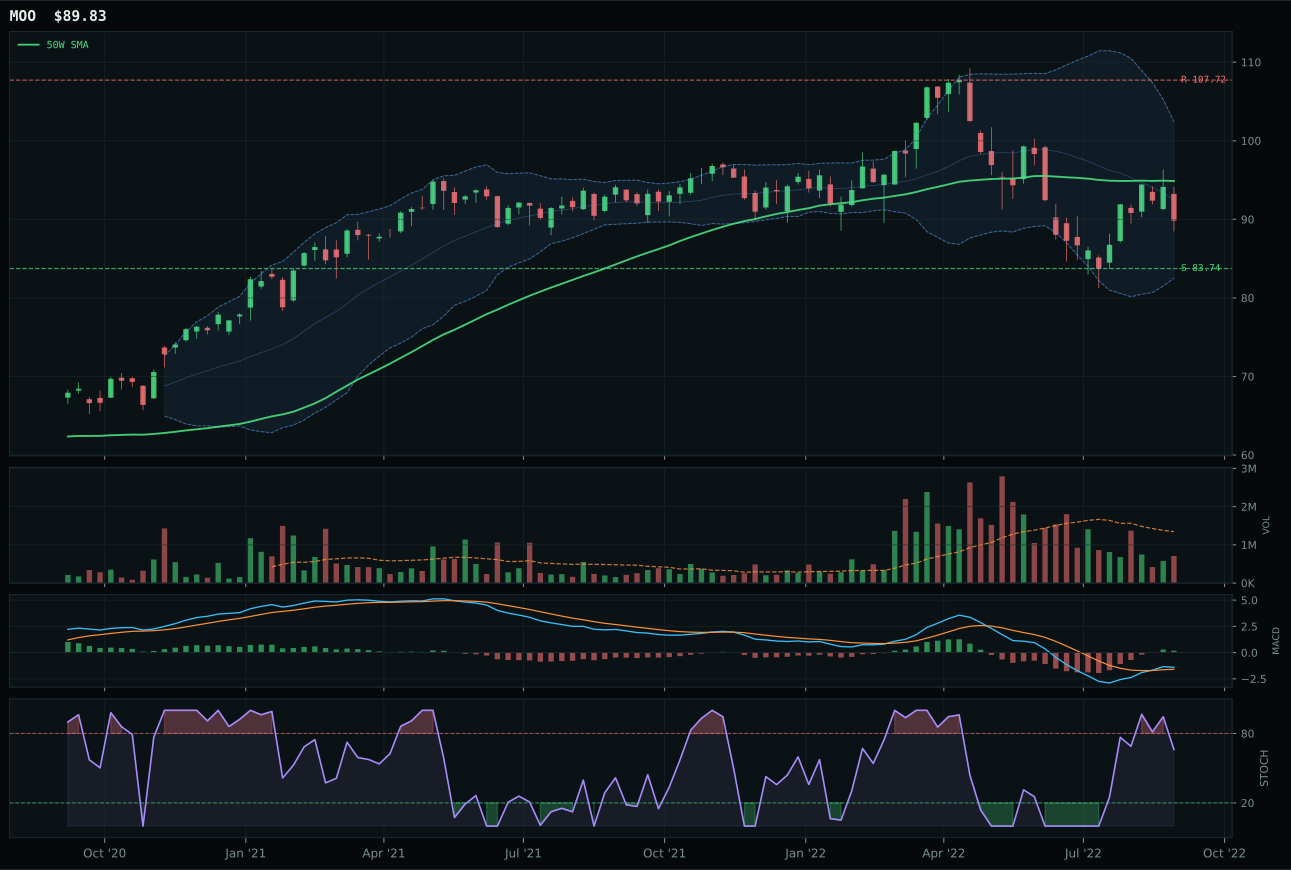
MOO has a neutral structure profile with -4.2% 13-week relative strength versus SPY.
A failed hold above support would weaken the setup.
Actionable but governed by invalidation levels.
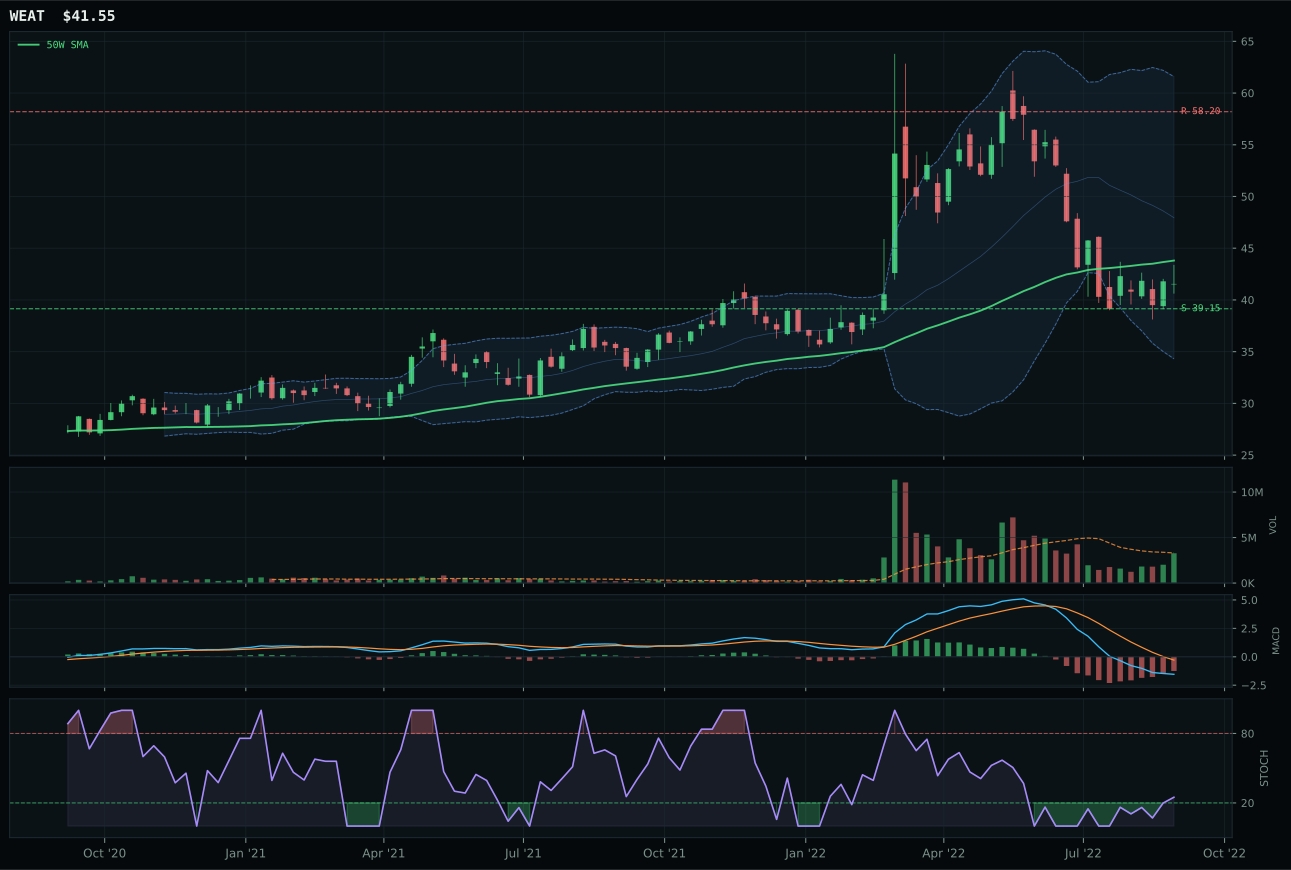
WEAT has a neutral structure profile with -17.7% 13-week relative strength versus SPY.
A failed hold above support would weaken the setup.
Actionable but governed by invalidation levels.
MOO won the category despite ranking lower than VEGI in technical evidence (62.7/100 versus 83.8/100) because VEGI's superior technicals are offset by worse risk/reward (71.8 versus 94.1) and price proximity to the 50W. VEGI sits at compression near the 50W, meaning the chart has already retraced most of the downside and new buyers are paying market prices with limited margin of safety; MOO, having fallen -5.3% below its 50W, offers 7.3% downside cushion before true support breaks. Both show bullish-and-improving MACD and neutral-to-falling stochastics, but MOO's deep retracement zone near Fib 0.618 and 94.1% risk/reward score make it the only entry with defined asymmetry. Thin participation at 0.53x average volume in MOO is a caution, but in a category where macro headwinds are structural, volume at least reflects honest price discovery rather than the false compression apparent in VEGI.
Agriculture earned 5% allocation as a tier-2 holding despite macro conditions that actively punish the category. Disinflation pressure costs it 8 points, liquidity stress another 4, and the category-level macro fit of 32.0/100 reflects genuine structural headwinds: falling commodity prices, falling food inflation, and falling risk appetite all hurt agribusiness. MOO's 16.7 final score comes not from bullish conviction but from being the least-damaged option in a distressed basket; its 55.2 reasoned ETF score trails VEGI's 69.6 significantly. The allocation persists because MOO's thin volume and deep pullback make it a genuine value candidate if the deflation scare eventually passes and growth investors re-engage with real assets. Until then, this 5% functions as a deflation hedge and long-dated value accumulation zone rather than a near-term tactical trade.
Industrial Metals — COPX
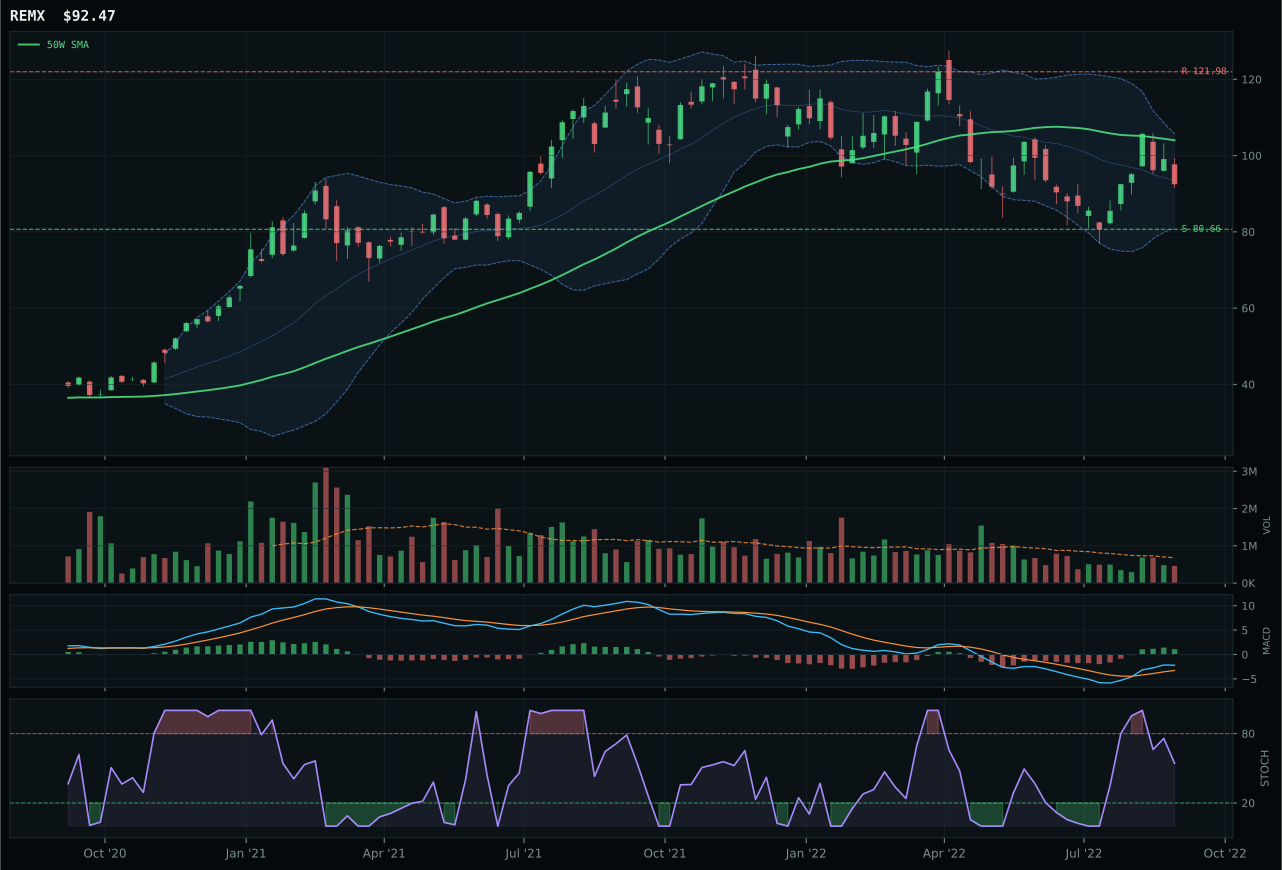
REMX has a neutral structure profile with -2.5% 13-week relative strength versus SPY.
A failed hold above support would weaken the setup.
Actionable but governed by invalidation levels.
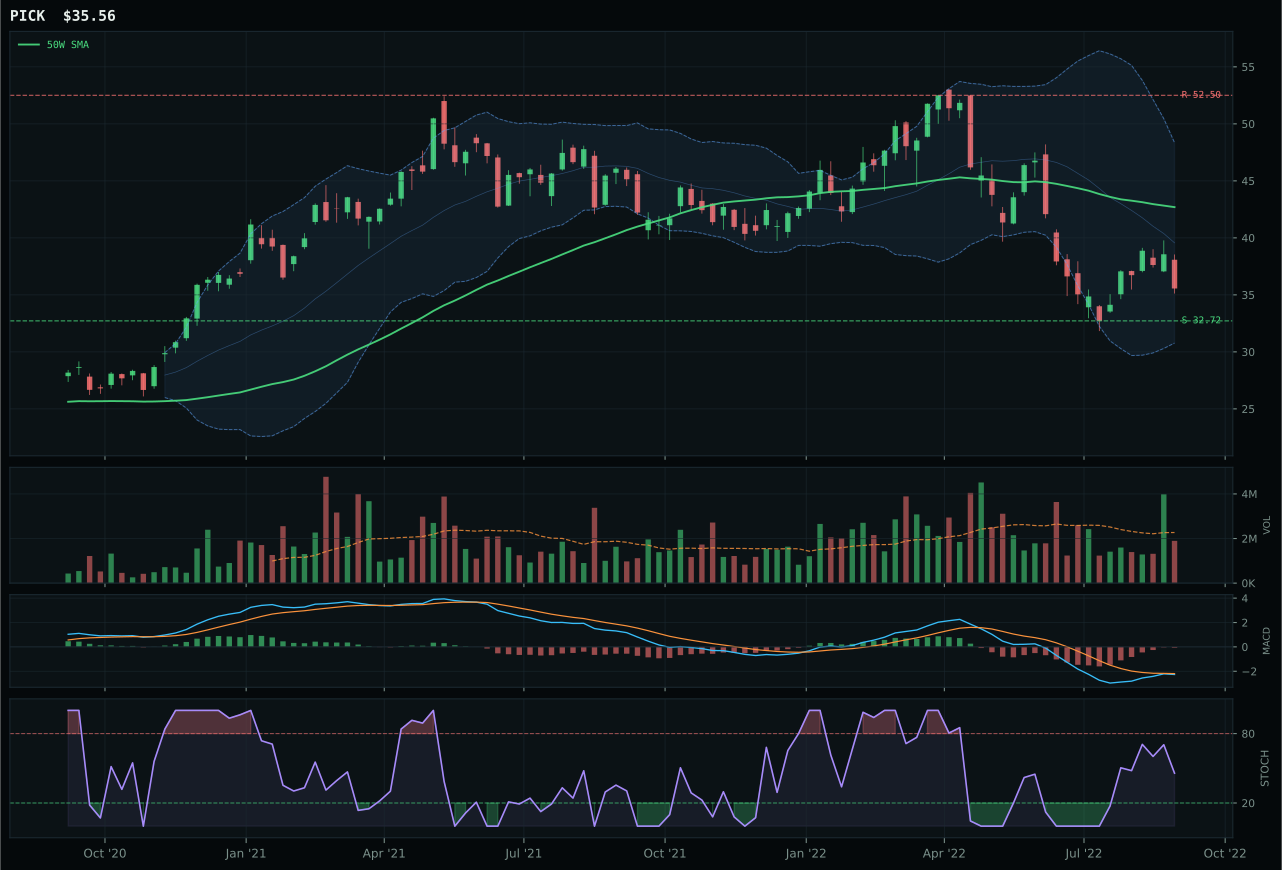
PICK has a neutral structure profile with -19.5% 13-week relative strength versus SPY.
A failed hold above support would weaken the setup.
Actionable but governed by invalidation levels.
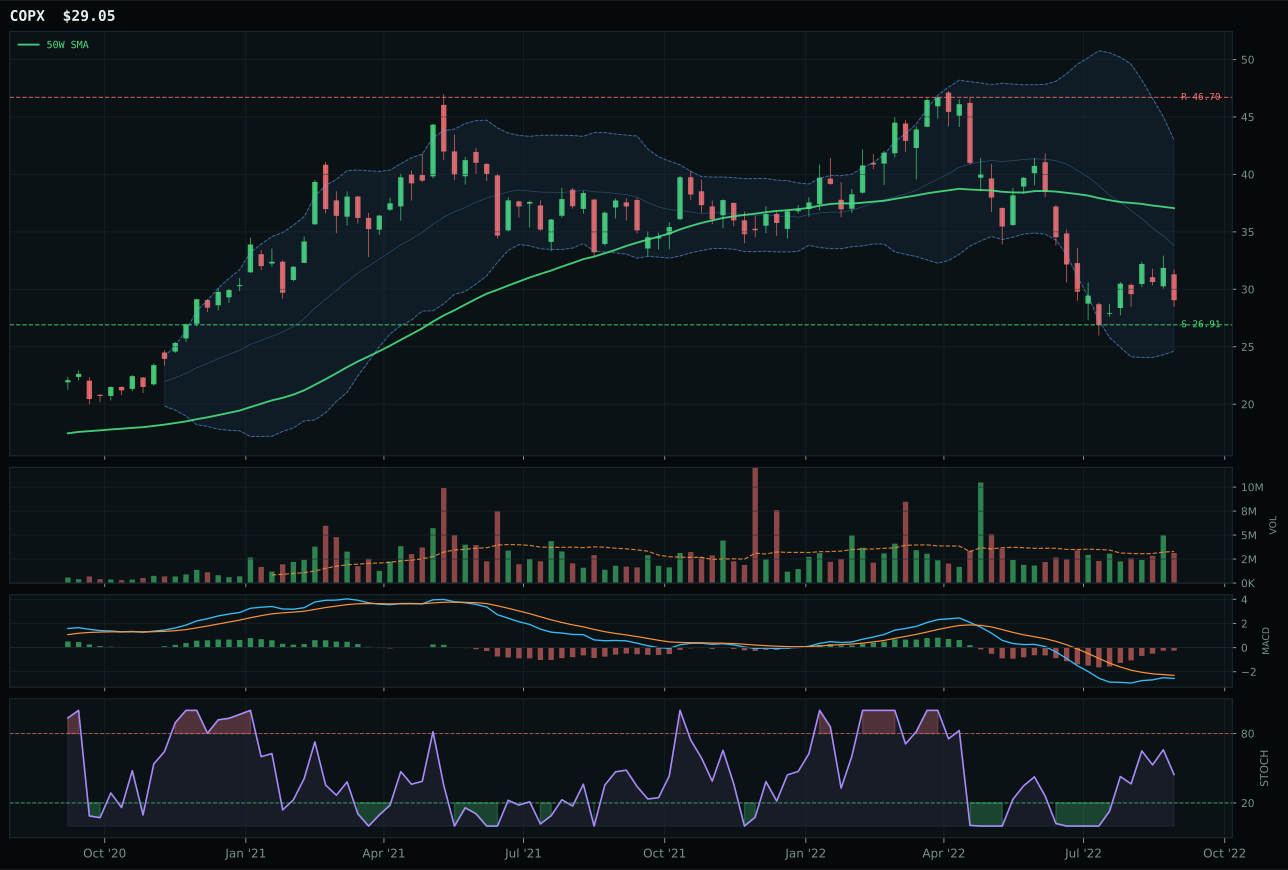
COPX has a neutral structure profile with -24.2% 13-week relative strength versus SPY.
A failed hold above support would weaken the setup.
Actionable but governed by invalidation levels.
COPX won the category over REMX despite inferior technical evidence (4.2/100 versus 73.8/100) because REMX's rare earth supply-scarcity narrative crashes into a structurally weak macro fit (28.0/100) and macro weighting that punishes both liquidity stress (-9) and credit stress (-7). COPX's copper thesis is equally damaged by disinflation—the category-level macro fit of 28.0 reflects authentic weakness in industrial demand—but COPX's risk/reward of 75.0 edges REMX's 59.7 by offering defined downside at support (26.91) while REMX overstates the deep retracement value at 80.66. Both show bearish-but-improving MACD, but COPX's neutral volume at 0.95x average and slightly better distance-to-support (-21.6% versus -11.1%) make it the only candidate for mean reversion accumulation if cyclical demand eventually stabilizes. The 28.3-point score gap between COPX and REMX reflects a harsh truth: neither is investable at the macro level right now, but COPX at least offers defensible entry geometry.
Industrial Metals earned 5% allocation as a tier-2 holding despite ranking third among the three-ETF basket and carrying an 11.3 final score that barely clears the viability threshold. The macro fit is just 28.0/100, with liquidity stress (-8), credit stress (-7), and dollar pressure (-7) all active drains on a category that depends on construction, manufacturing, and capex demand—all of which are contracting in a disinflation regime. COPX's selection reflects tactical rather than strategic conviction: its 75.0/100 risk/reward makes it a long-dated scale-in candidate if industrial commodities eventually bottom, but current allocation should be treated as a deflation-phase parking spot rather than a growth position. The 5% persists in the portfolio because copper and rare earths are genuine structural-scarcity plays if global supply chains resettle post-pandemic; until that thesis gains traction, this allocation should be expected to underperform and tolerate volatility as a hedge against commodity revaluation.
AI — SMH
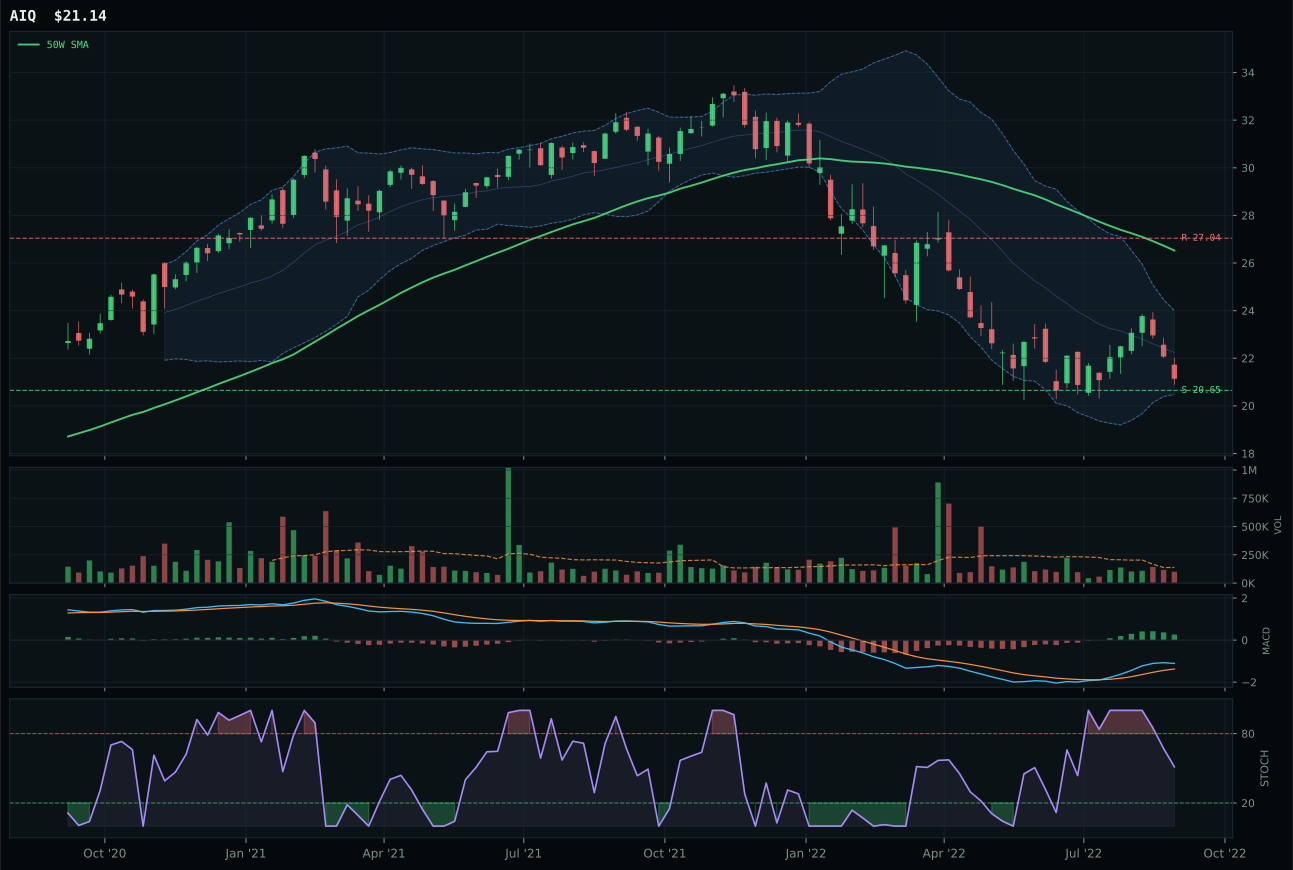
AIQ has a pullback into support profile with -2.9% 13-week relative strength versus SPY.
A failed hold above support would weaken the setup.
Tracked, but not top-2 eligible because: .
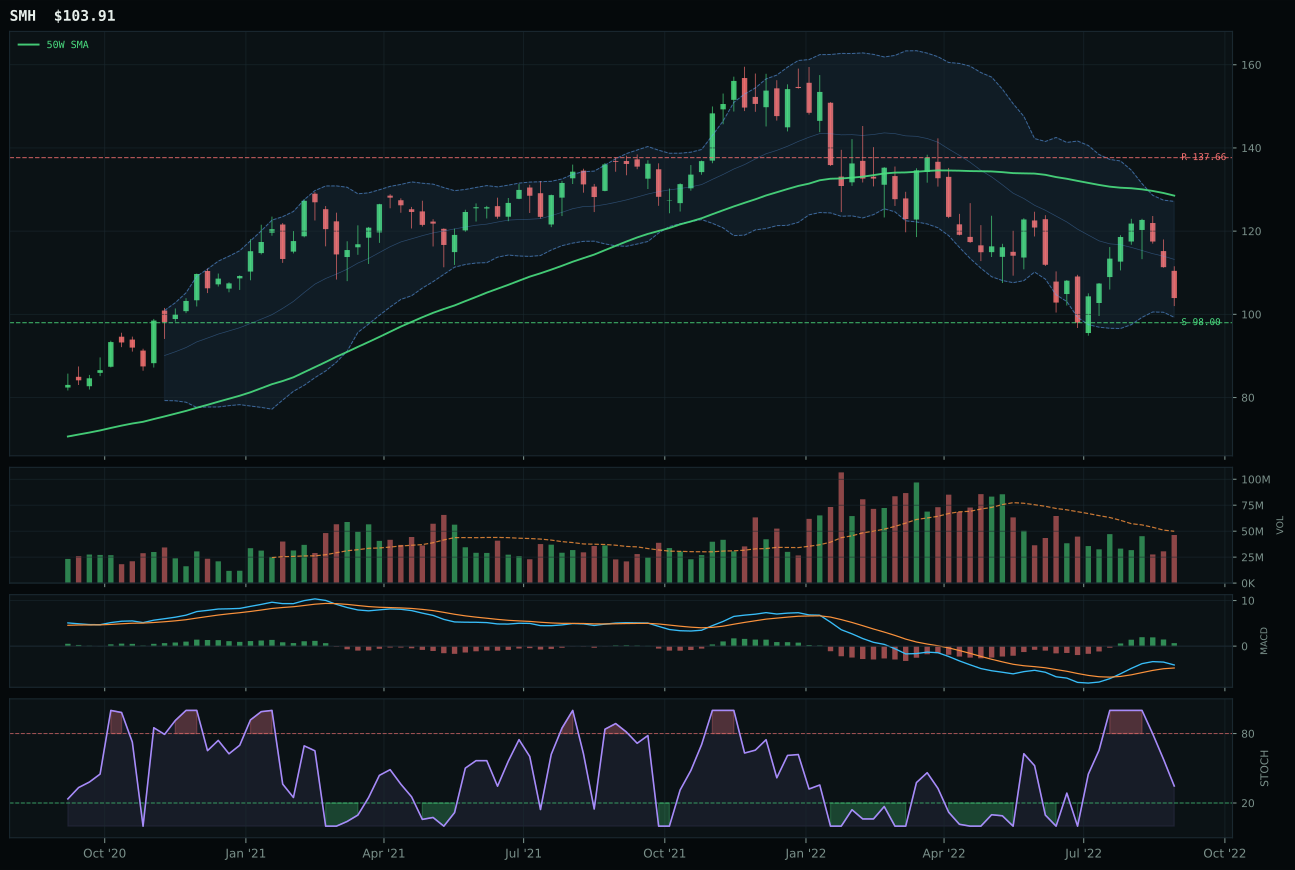
SMH has a neutral structure profile with -9.6% 13-week relative strength versus SPY.
A failed hold above support would weaken the setup.
Actionable but governed by invalidation levels.
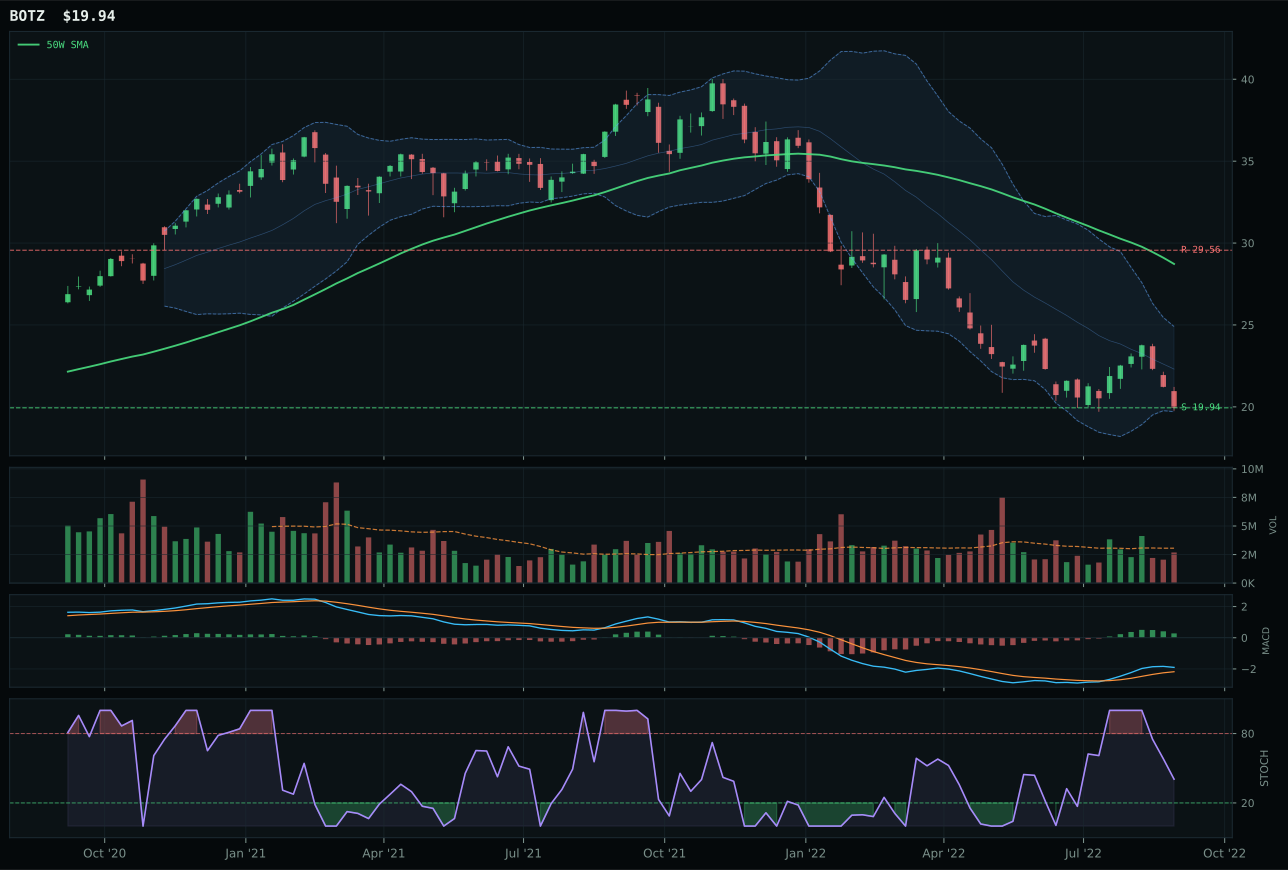
BOTZ has a pullback into support profile with -11.5% 13-week relative strength versus SPY.
A failed hold above support would weaken the setup.
Actionable but governed by invalidation levels.
SMH won by default in a deeply damaged category, edging AIQ on structure cleanliness (69.3 versus 67.4) and volume quality (neutral versus thin participation). Both semiconductors and AI software are underwater -14% and -7.4% over thirteen weeks, but SMH's position at the intersection of compute demand and cyclical collapse gives it at least a defined support level at 98.00 where buyers could accumulate if the broad market stabilizes. AIQ shows pullback-into-support setup, which sounds constructive until you realize support exists because selling has exhausted itself temporarily, not because buyers are defending a thesis. Momentum confirmation is near-zero in both (1.7 for SMH, 35 for AIQ), stochastic RSI is oversold in both, and MACD is flattening in both—this is not a category split by conviction, but rather a choice between two broken charts where slightly better structure in SMH justifies the nod.
AI earned 0% allocation this week, ranked 9th or 10th among the ten categories, its 10.7 final score obliterated by macro headwinds that are historically rare. Liquidity stress alone penalizes the category 12 points; credit stress another 8; broad market bear another 8. Technical evidence for the category reasoner was 40.5/100 on SMH, which would be salvageable in a neutral regime, but the macro fit landed at only 23.0/100 globally. Dollar pressure, broken risk appetite, and the absence of any monetary hedge bid narrative mean that even strong technician setups in semiconductors cannot overcome the regime. For AI to earn portfolio weight again, either liquidity conditions must stabilize or the broad market must show evidence that cyclical risk assets are being accumulated despite the macro backdrop—neither condition exists today.
Emerging Markets — INDA
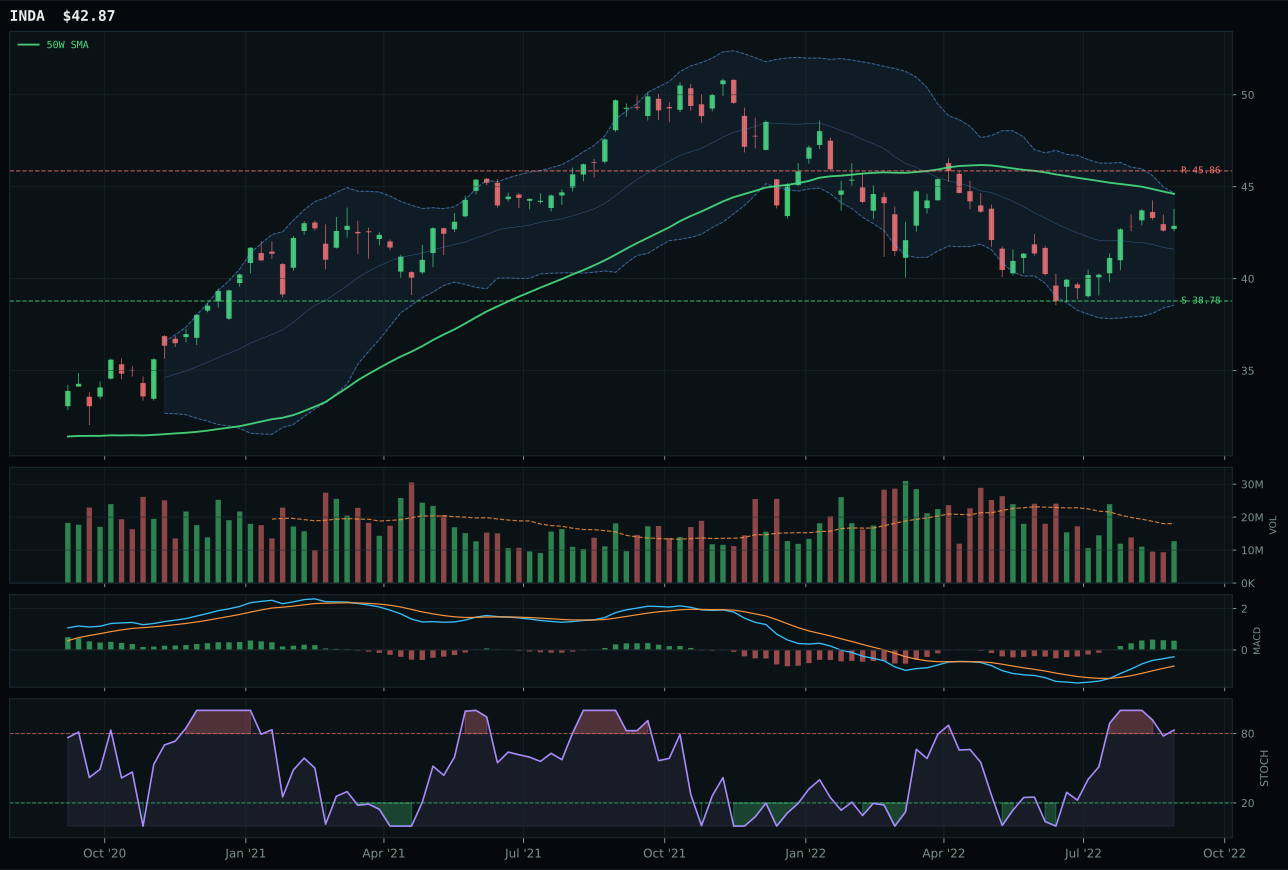
INDA has a neutral structure profile with 8.1% 13-week relative strength versus SPY.
A failed hold above support would weaken the setup.
Actionable but governed by invalidation levels.
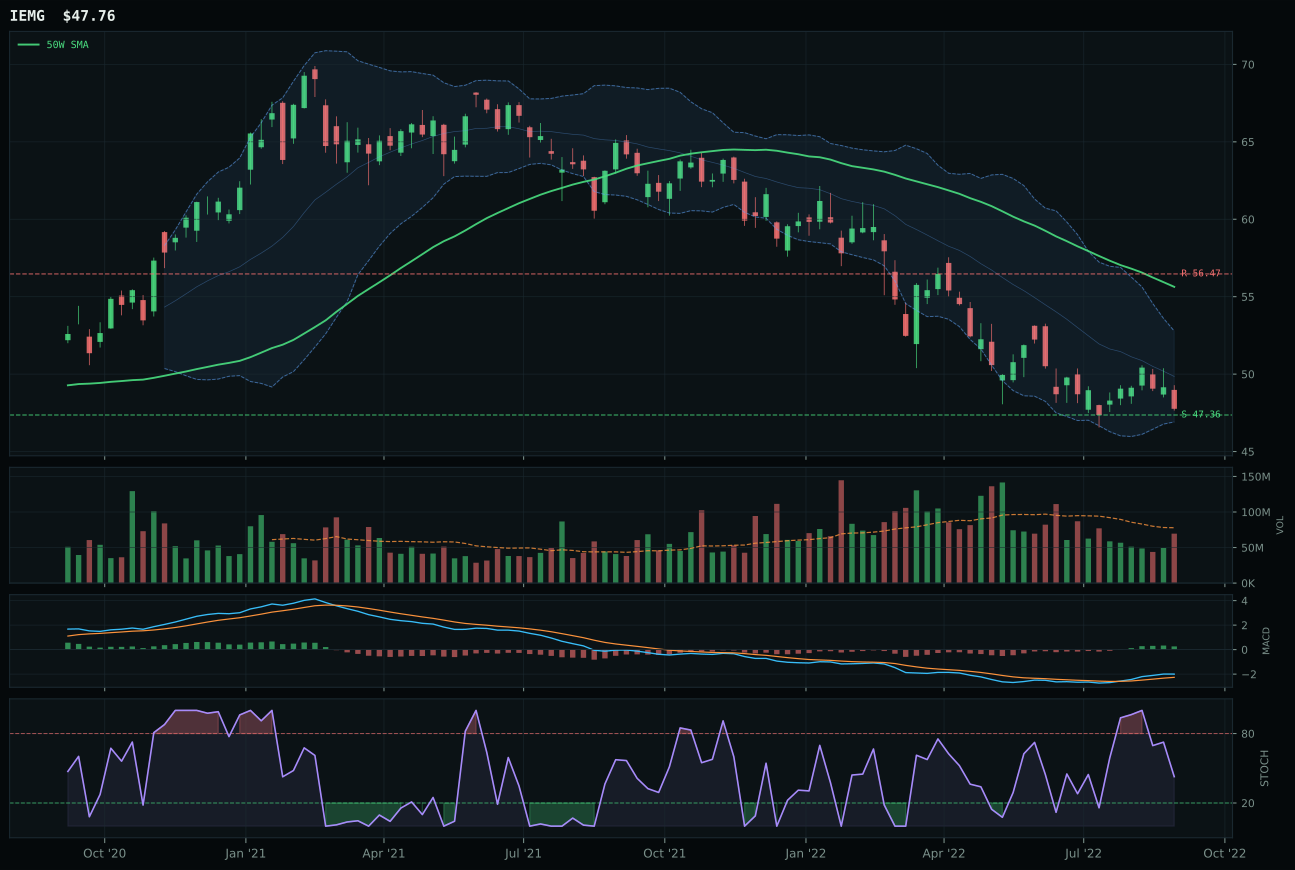
IEMG has a pullback into support profile with -4.1% 13-week relative strength versus SPY.
A failed hold above support would weaken the setup.
Actionable but governed by invalidation levels.
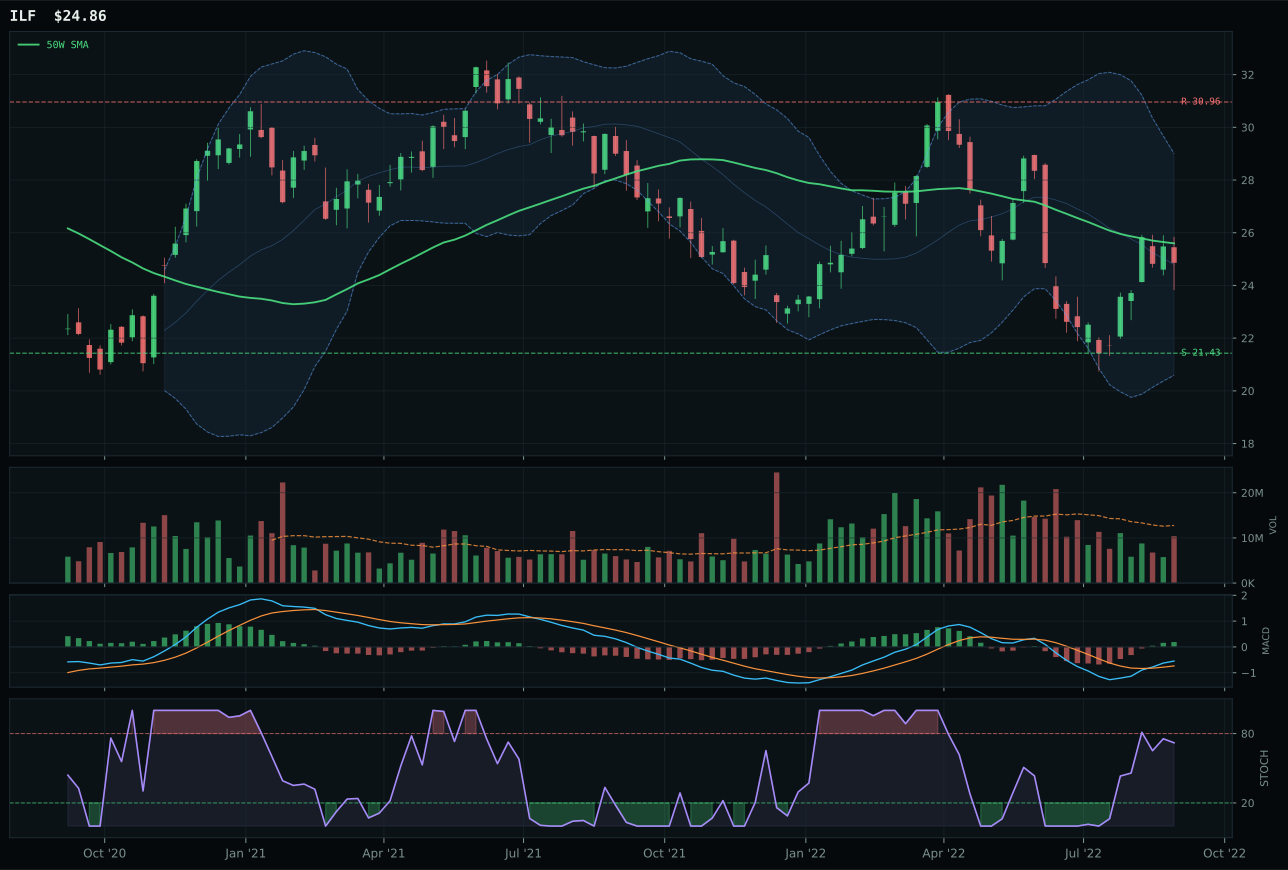
ILF has a compression near 50W profile with -7.9% 13-week relative strength versus SPY.
Extension and support failure are the main tactical risks.
Tracked, but not top-2 eligible because: structurally broken.
INDA won a deeply underwater category by posting 13W positive returns of 3.6% and relative strength of 8.1% versus SPY while the broad emerging market complex is collapsing—IEMG shows -8.6% in the same period. The India thesis benefits from structural drivers (capex, demographics, tech services) that are less dependent on global cyclical demand, and INDA's setup at -3.9% below the 50W with stochastic RSI rolling over from overbought readings creates a valid mean-reversion entry. IEMG's broader emerging-market beta exposed it fully to dollar pressure (-10 macro penalty), credit stress (-8), and liquidity stress (-8), conditions that India's quality tilt sidesteps. INDA's timing of 79.0 reflects the combination of deep-retracement zone, bullish-improving MACD, and overbought-rolling-over stochastics—a setup where prior momentum has exhausted and buyers defending support create entry opportunity. The 12.4-point score gap versus IEMG is the widest in this category session, signaling that India's relative isolation from U.S. dollar-driven liquidity is the only defensible emerging-market trade available.
Emerging Markets earned 0% allocation this week, ranked 9th or 10th, its 8.1 final score reflecting macro conditions that are structurally hostile to any emerging-market exposure. Dollar pressure is active and severe (-14 point category penalty), credit stress another -10, liquidity stress another -10, and broad market bear another -9, combining to generate a 7.0/100 macro fit that renders even strong technical setups (INDA shows 75.0 trend composite and 70.5 technical evidence) economically unviable. The disinflation regime and dollar strength create a mechanical headwind: dollar-denominated debt in emerging markets becomes more expensive to service, foreign direct investment redirects toward U.S. assets, and volatility spikes in currencies. INDA's 3.6% positive return cannot overcome the structural macro drag when the 10 basis cases are simultaneously signaling capital flight. For emerging markets to earn portfolio weight again, either dollar strength must stabilize and reverse or global liquidity conditions must meaningfully improve—neither is evident in the current regime, and no amount of India's relative outperformance can overcome a category that is receiving negative macro weighting at the system level.