
2022-08-26
Informational purposes only. The content in this report, including allocations, analysis, and commentary, is provided solely for informational and educational purposes. It does not constitute financial advice, investment advice, trading advice, or any other type of advice. Past performance does not guarantee future results. Always conduct your own research and consult a qualified financial professional before making investment decisions.
GLD defensive overlay excluded: price is below its 8W SMA. Cause selector will use cash alternative.
Macro risk engine requires the 50% Defensive overlay for this run; payload selected by cause: Transition Defense.
Weekly Allocation
| Ticker | Category | Weight | Role |
|---|---|---|---|
| SGOV | 20% | Overlay | |
| GLD | Precious Metals | 25% | Overlay |
| XLU | Utilities & Infrastructure | 25% | Overlay |
| ITA | Defense & Aerospace | 5% | Tier-2 (5%) |
| URNM | Nuclear Energy | 5% | Tier-2 (5%) |
| CIBR | Technology | 5% | Tier-2 (5%) |
| MOO | Agriculture & Livestock | 5% | Tier-2 (5%) |
| COPX | Industrial Metals | 5% | Tier-2 (5%) |
| SMH | AI | 5% | Tier-2 (5%) |
Trade Instructions — Monday Open
Sell the tranche from 2022-07-29 (completing its 4-week hold). Buy the new tranche. Instructions show net portfolio changes — same-asset positions cancel, weight changes show the delta.
| Action | Ticker | Instruction |
|---|---|---|
| SELL | PAVE | Sell 50% of PAVE position (reduce 10.00% → 5.00%) |
| SELL | XLK | Sell 44% of XLK position (reduce 11.25% → 6.25%) |
| SELL | XAR | Sell 22% of XAR position (reduce 11.25% → 8.75%) |
| SELL | FCG | Sell entire FCG position (2.50% of portfolio) |
| SELL | URNM | Sell 17% of URNM position (reduce 7.50% → 6.25%) |
| SELL | GDX | Sell 50% of GDX position (reduce 5.00% → 2.50%) |
| SELL | SMH | Sell 20% of SMH position (reduce 6.25% → 5.00%) |
| SELL | MOO | Sell 25% of MOO position (reduce 5.00% → 3.75%) |
| BUY | XLU | Buy XLU — 29.41% of freed cash (adds 6.25% to portfolio) |
| BUY | COPX | Buy COPX — 5.88% of freed cash (adds 1.25% to portfolio) |
| BUY | SGOV | Buy SGOV — 23.53% of freed cash (adds 5.00% to portfolio) |
| BUY | GLD | Buy GLD — 29.41% of freed cash (adds 6.25% to portfolio) |
| BUY | ITA | Buy ITA — 5.88% of freed cash (adds 1.25% to portfolio) |
| BUY | CIBR | Buy CIBR — 5.88% of freed cash (adds 1.25% to portfolio) |
Current Portfolio After Trade
Combined holdings across all 4 active tranches. Each tranche is 25% of the portfolio.
| Ticker | % of Portfolio | Weight Bar |
|---|---|---|
| XLU | 17.50% | |
| GLD | 12.50% | |
| SGOV | 10.00% | |
| XAR | 8.75% | |
| URNM | 6.25% | |
| XLK | 6.25% | |
| PAVE | 5.00% | |
| SMH | 5.00% | |
| MOO | 3.75% | |
| COPX | 3.75% | |
| REMX | 3.75% | |
| GDX | 2.50% | |
| INDA | 2.50% | |
| IGV | 2.50% | |
| SLV | 2.50% | |
| BOTZ | 2.50% | |
| URA | 1.25% | |
| XOP | 1.25% | |
| ITA | 1.25% | |
| CIBR | 1.25% |
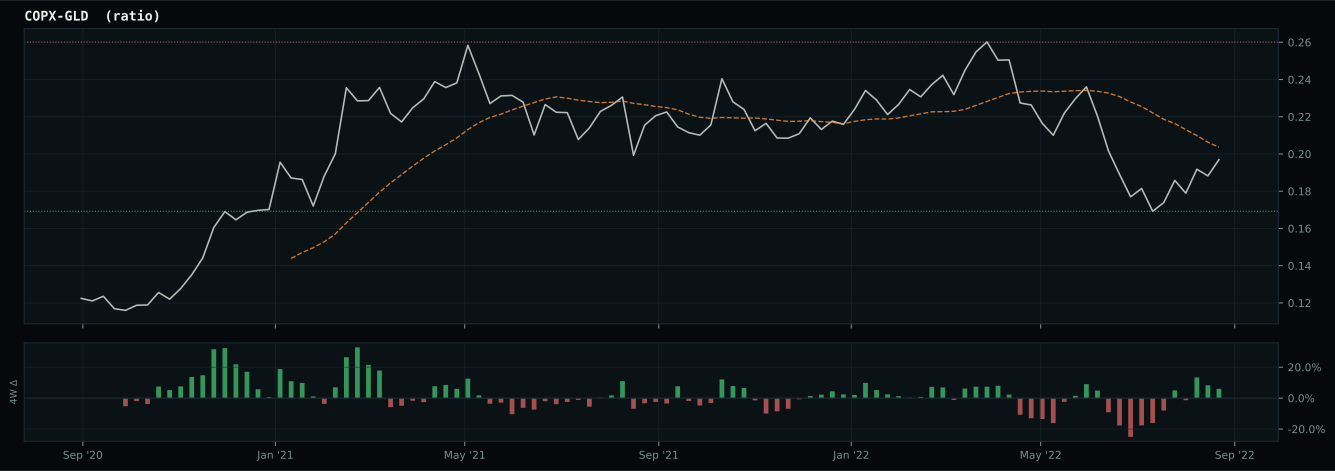
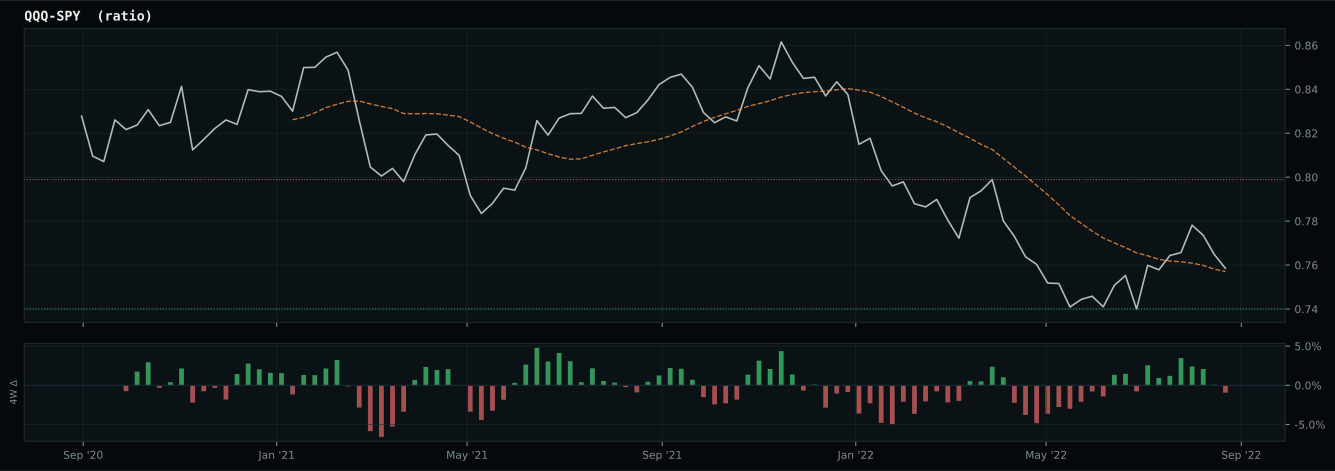
Macro Regime — Disinflation
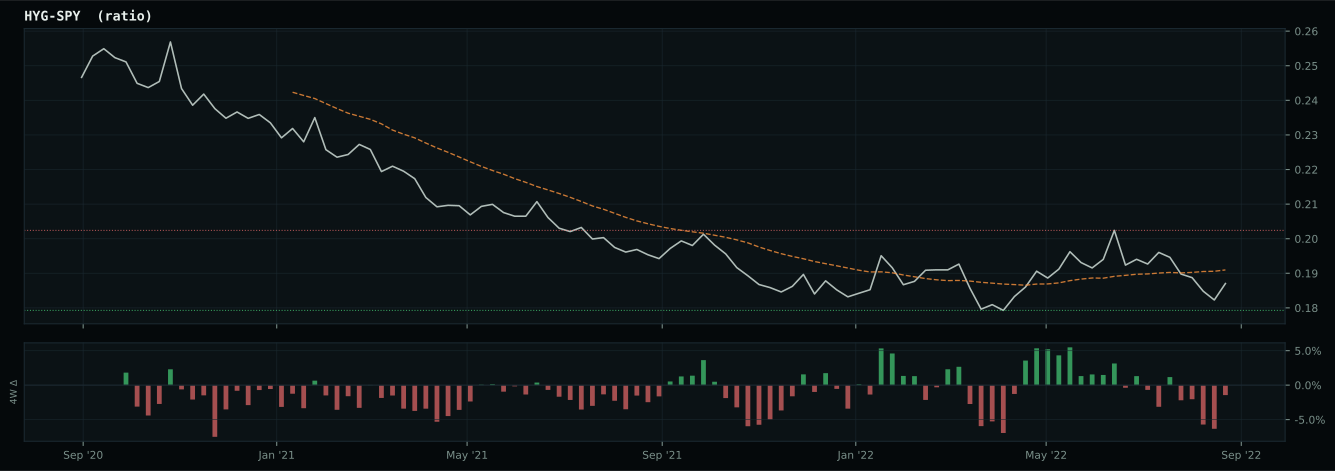
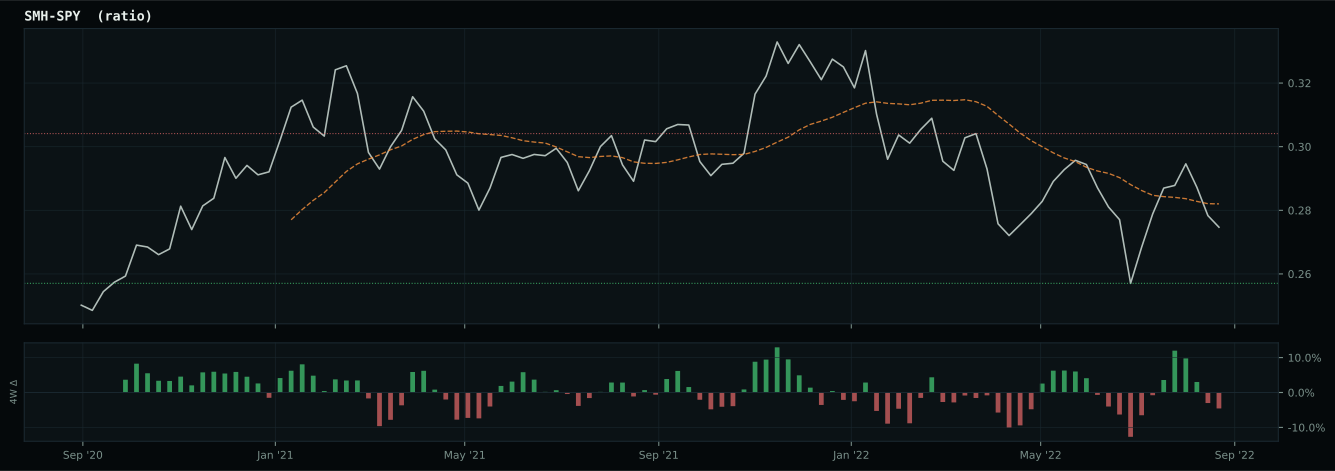
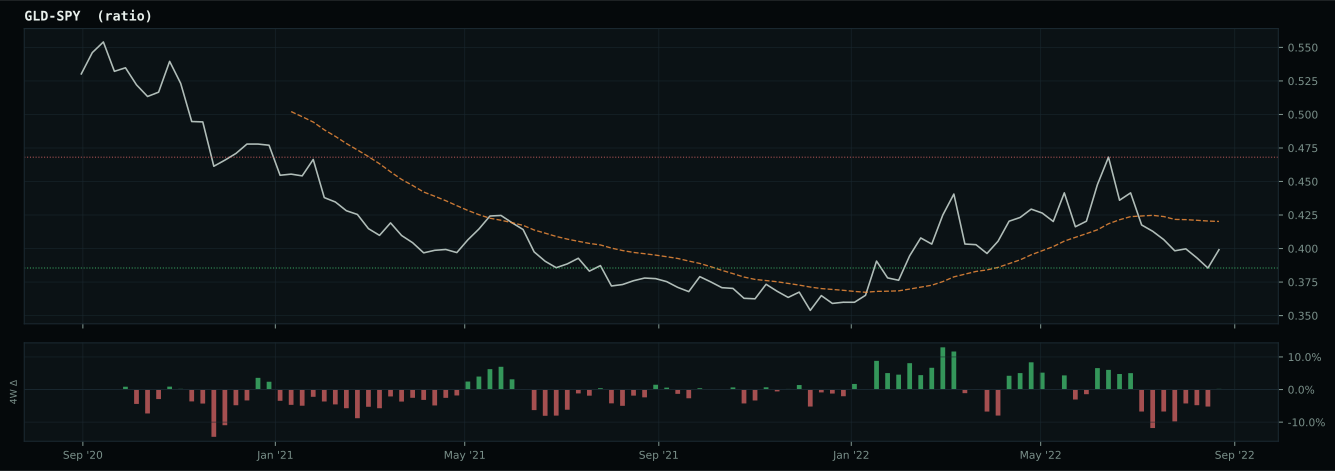
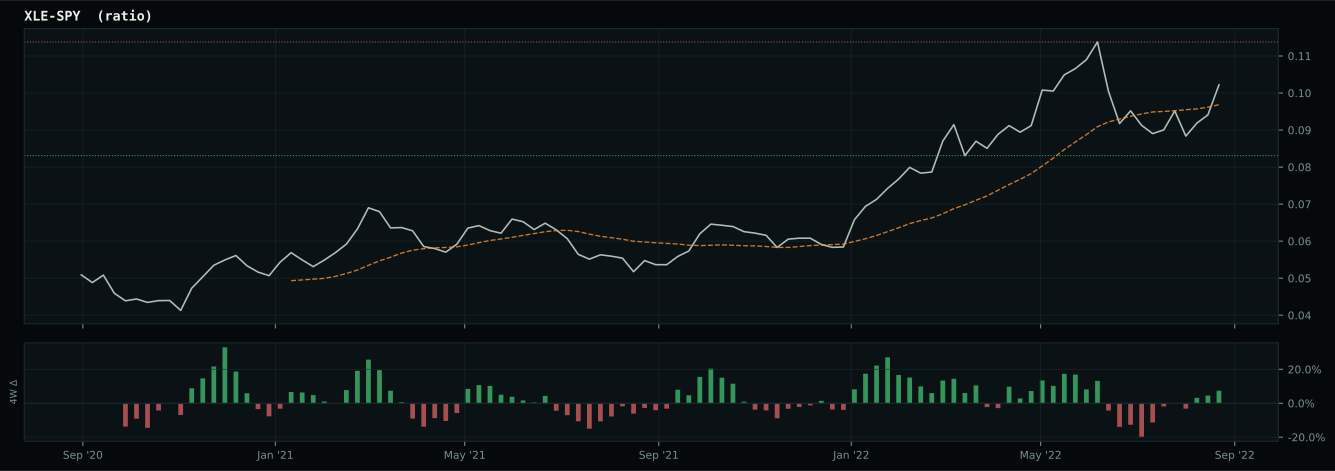
growth data is not confirming the weak market-implied risk appetite signal
Defensive overlay cause is not singular enough to concentrate: the sleeve diversifies across liquidity, monetary defense, and defensive equity exposure while the market resolves the next regime.
Macro Evidence Charts
Market-implied signals behind the macro regime scores. Each ratio compares two assets; the direction and slope of the ratio is what the macro engine reads.
Crypto Regime — NoCrypto
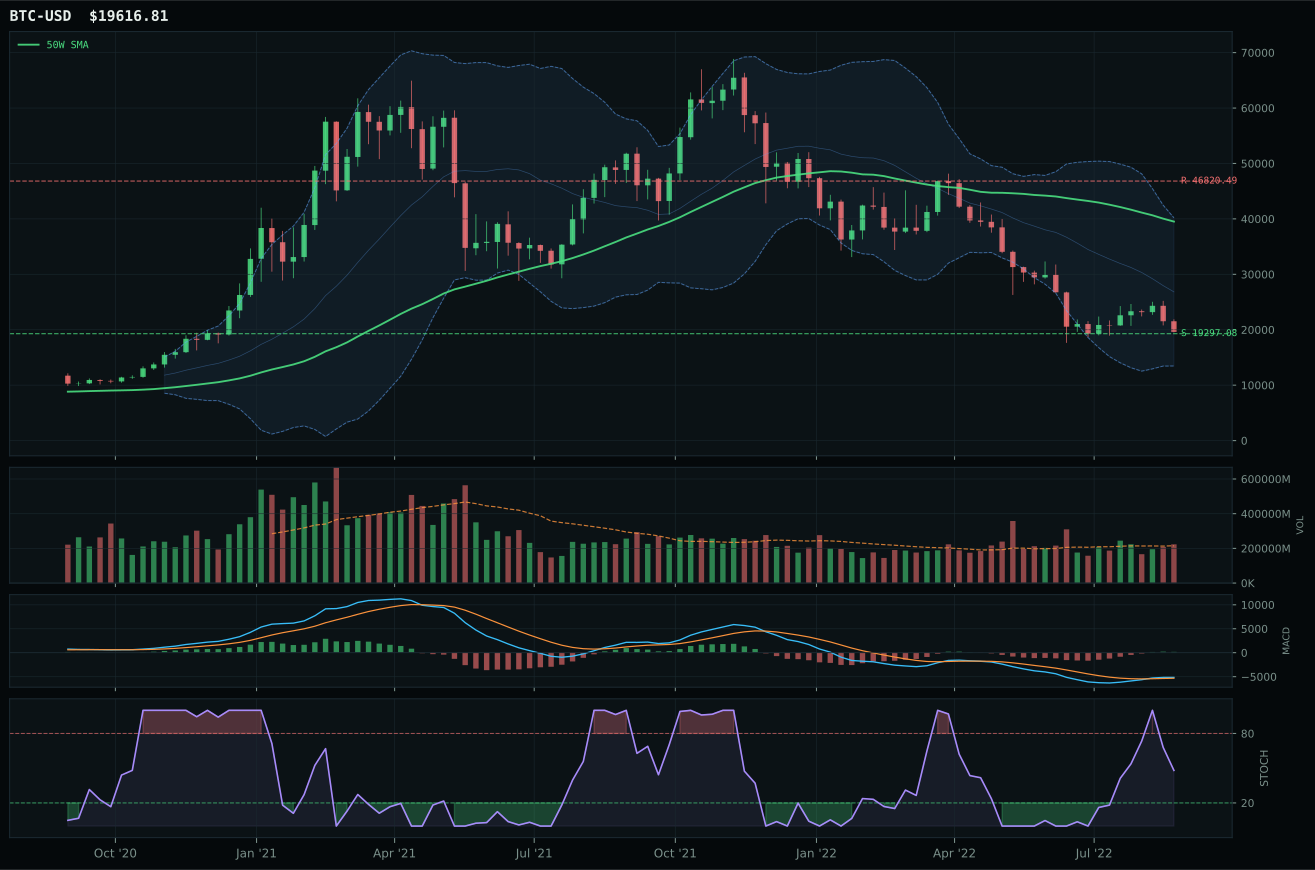
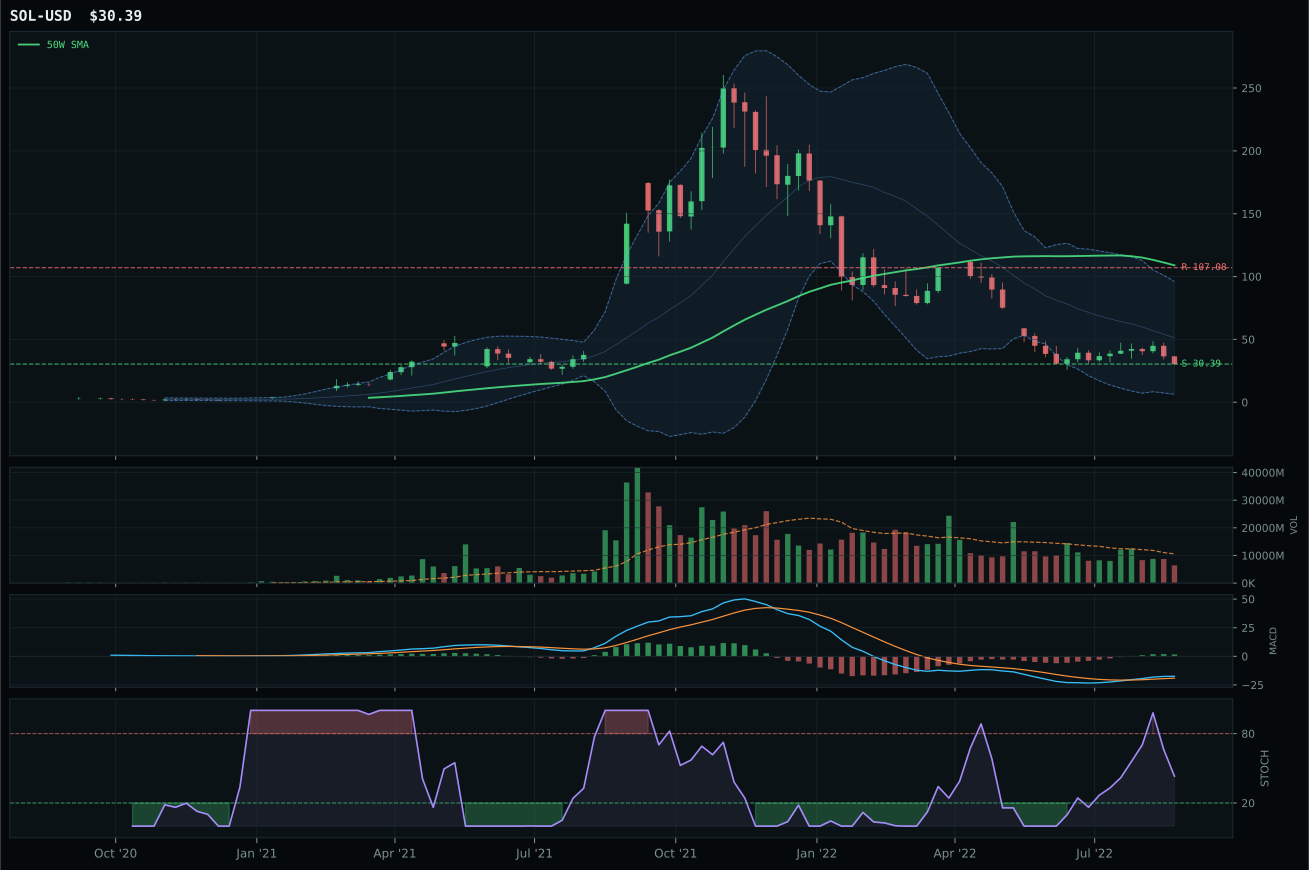
ValueBTC armed by first 200W buy-zone touch, but post-touch range age is 10 weeks; minimum is 12
TrendBTC not confirmed
one or more available conditions failed
Category Rankings
| Rank | Category | Winner | Score | Alloc | 4W Ret | Peers (4W) |
|---|---|---|---|---|---|---|
| 1 | Utilities & Infrastructure | XLU | 72.6 | 20% | -4.97% | PAVE -11.9% · IGF -9.5% |
| 2 | Precious Metals | GLD | 53.0 | 20% | -5.35% | SLV +0.8% · GDX -9.6% |
| 3 | Defense & Aerospace | ITA | 46.2 | 10% | -10.02% | XAR -12.0% · ROKT -11.0% |
| 4 | Nuclear Energy | URNM | 45.5 | 10% | -12.39% | URA -12.2% · NLR -5.1% |
| 5 | Technology | CIBR | 38.6 | 10% | -10.73% | XLK -10.8% · IGV -11.3% |
| 6 | Agriculture & Livestock | MOO | 28.4 | 10% | -12.14% | VEGI -12.7% · WEAT +6.0% |
| 7 | Industrial Metals | COPX | 19.8 | 10% | -13.51% | REMX -12.0% · PICK -13.0% |
| 8 | AI | SMH | 19.1 | 10% | -12.90% | BOTZ -12.7% · AIQ -10.5% |
| 9 | Traditional Energy | XLE | 14.9 | 0% | -15.41% | XOP -20.6% · FCG -19.1% |
| 10 | Emerging Markets | INDA | 8.7 | 0% | -3.72% | IEMG -10.1% · ILF -6.1% |
Utilities & Infrastructure — XLU
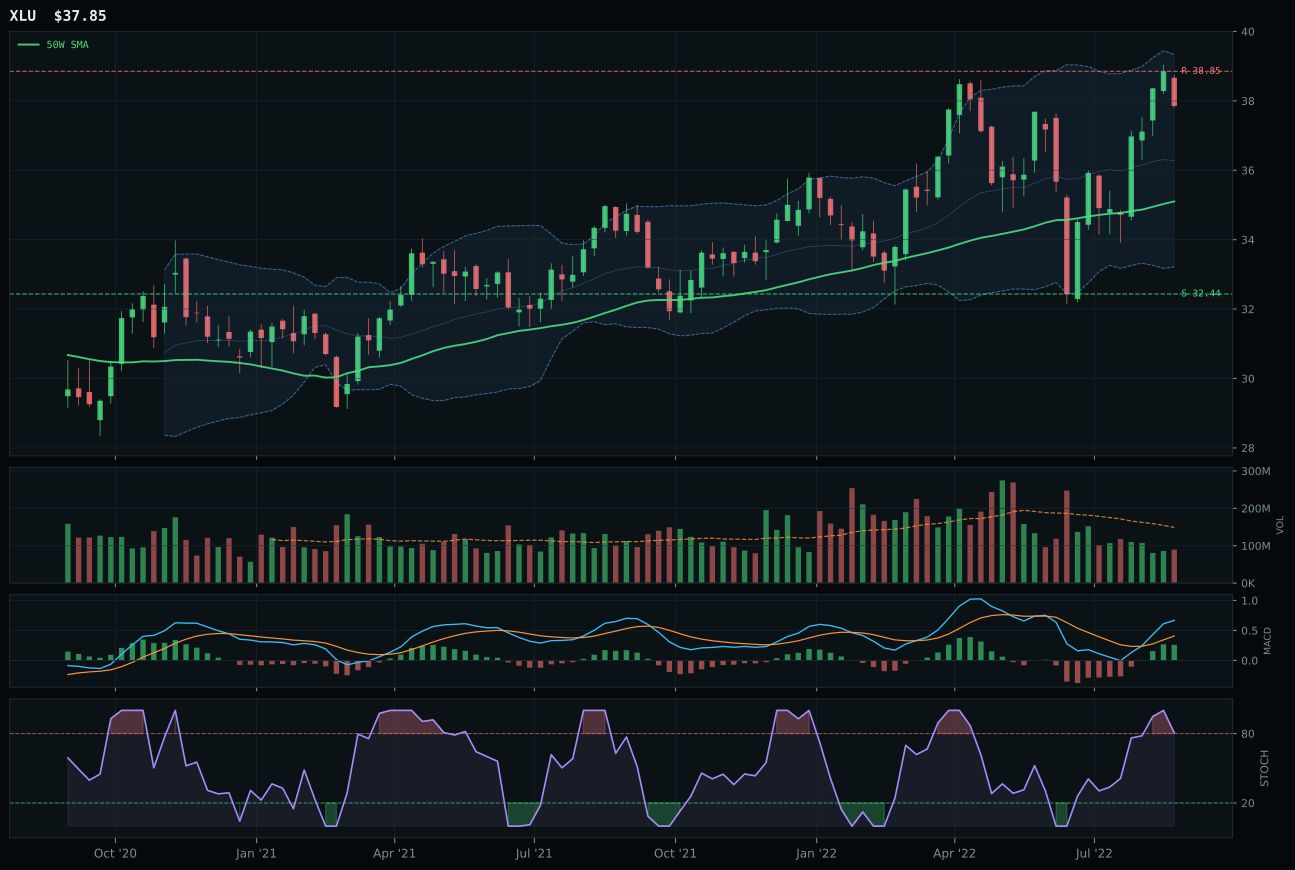
XLU has a neutral structure profile with 2.8% 13-week relative strength versus SPY.
A failed hold above support would weaken the setup.
Actionable but governed by invalidation levels.
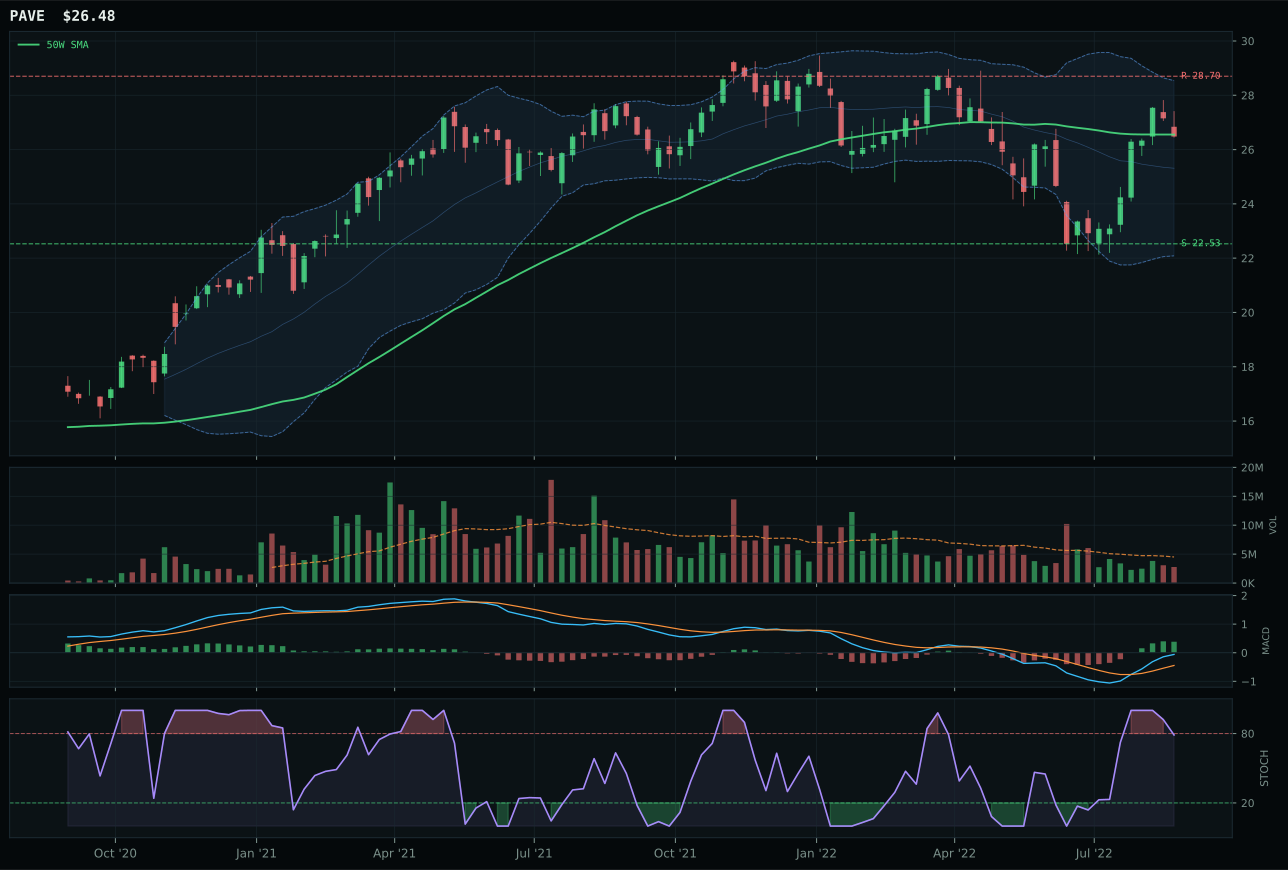
PAVE has a compression near 50W profile with 3.5% 13-week relative strength versus SPY.
A failed hold above support would weaken the setup.
Actionable but governed by invalidation levels.
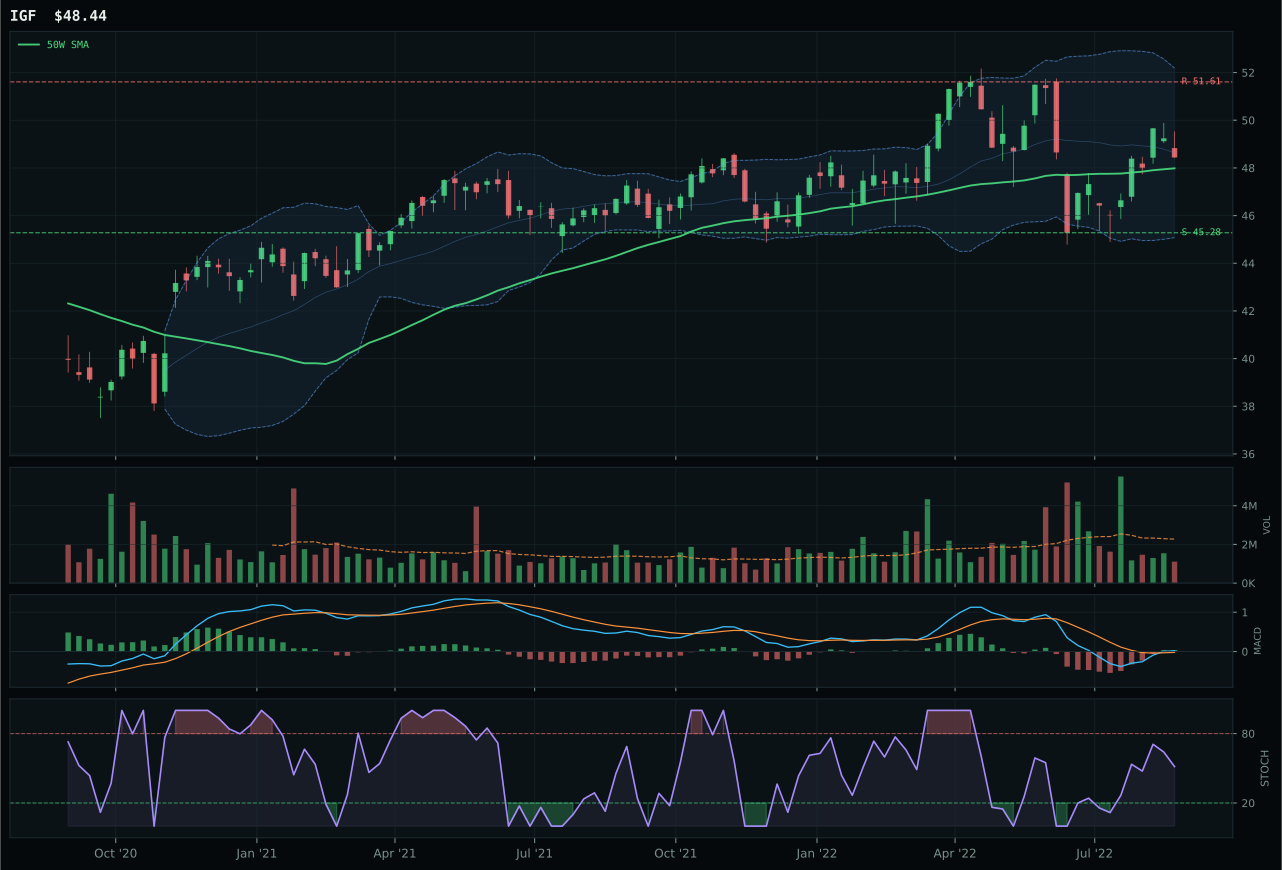
IGF has a compression near 50W profile with -3.5% 13-week relative strength versus SPY.
A failed hold above support would weaken the setup.
Actionable but governed by invalidation levels.
XLU captures Utilities & Infrastructure for top-2 allocation with a near-perfect 100.0 trend score (price above both moving averages, 50W slope 0.2%, 2.8% SPY-relative strength) paired with a 75.0 timing score that reflects overbought-momentum positioning at Fib 0.236 upper retracement zone. PAVE's competitive 80.0 trend and superior 100.0 timing setup (compression near 50W vs neutral structure) are offset by XLU's cleaner category relative strength (0.0% vs 0.7%) and stronger macro/narrative fit (72.0 vs 39.0). Both sit on thin volume (0.60x for XLU), but XLU's momentum confirmation (66.5) and persistence (64.0) confirm this is held, not abandoned. The 69.3 structure score and 64.6 volume-price confirmation show XLU is the category leader by consensus, not by breakdown.
Utilities & Infrastructure earns 10% allocation as a top-2 category, justified by a 72.6 final score and 80.0 macro fit—second only to Precious Metals in defensive positioning. The category reasoning layer produced the highest reasoned ETF proof order (XLU 75.9, PAVE 74.0, IGF 70.7), showing no clear separation; XLU wins the tiebreaker on technical grounds rather than dominance. Defensive rotation (+12), disinflation pressure (+6), and broad market bear (+4) all reinforce the narrative that utilities and infrastructure are the portfolio's core defensive holds alongside gold. XLU's 75.7 technical evidence paired with 72.0 macro/narrative fit creates a balanced, conviction-weighted thesis: the chart is strong and the macro case is overwhelming. This 10% weighting is correct for a regime where capital is fleeing growth (tech, EM, energy) and rotating into predictable cash flows (utilities, regulated returns). This allocation will persist until either risk appetite sharply recovers (forcing a rotation back to growth) or central banks pivot aggressively toward easing (removing the disinflation narrative). For now, XLU at 10% is the portfolio's core defensive anchor alongside 10% gold.
Precious Metals — GLD
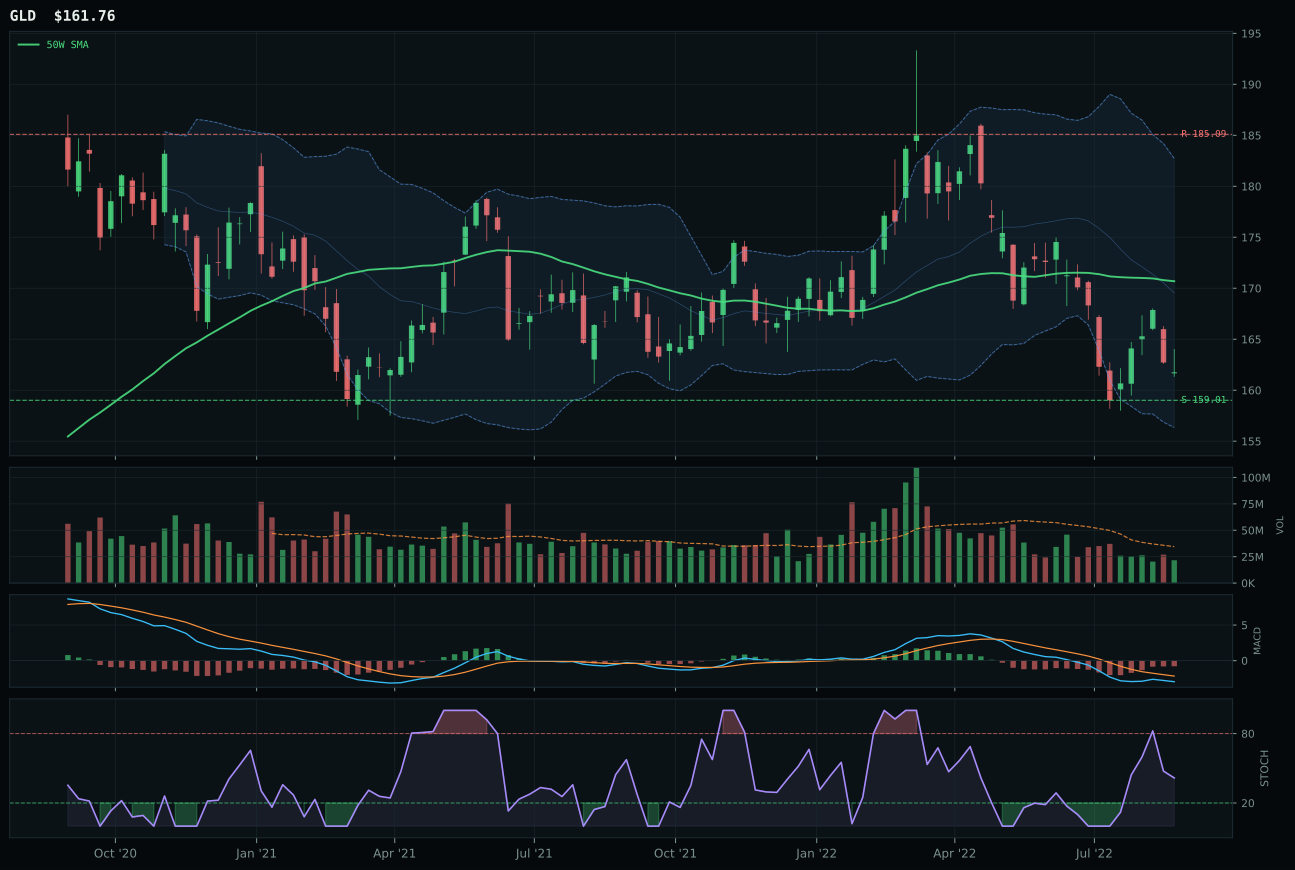
GLD has a pullback into support profile with -4.0% 13-week relative strength versus SPY.
A failed hold above support would weaken the setup.
Actionable but governed by invalidation levels.
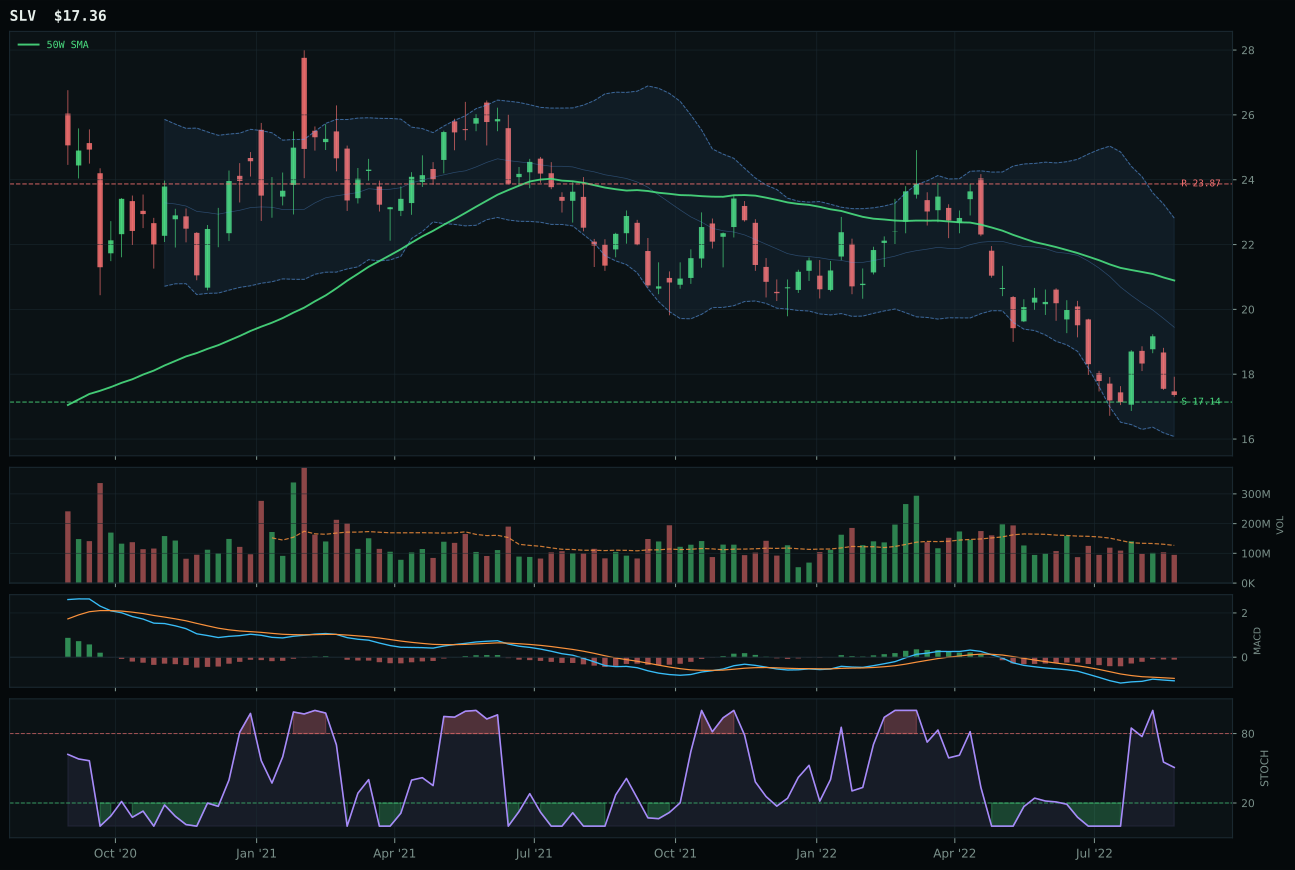
SLV has a pullback into support profile with -12.3% 13-week relative strength versus SPY.
A failed hold above support would weaken the setup.
Actionable but governed by invalidation levels.
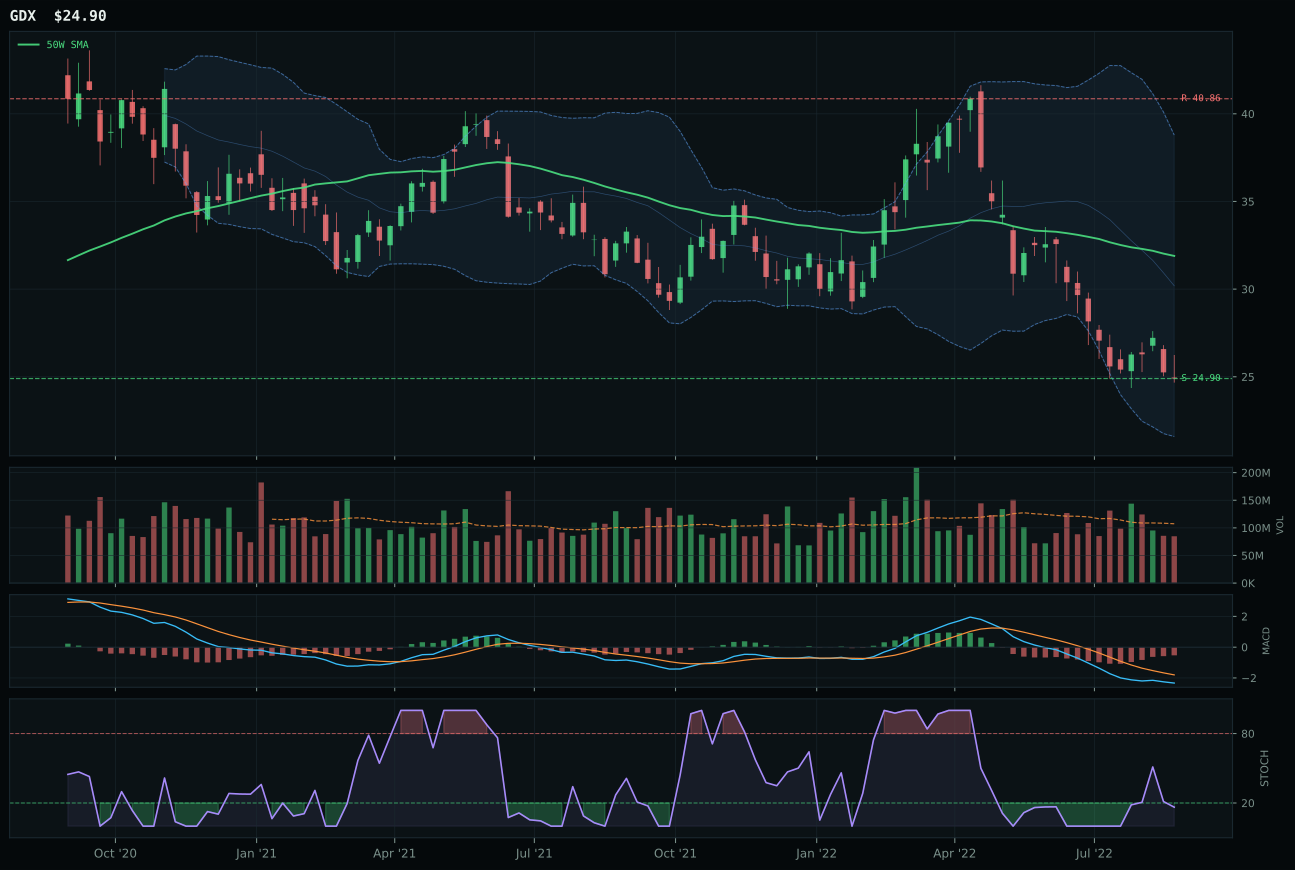
GDX has a pullback into support profile with -21.0% 13-week relative strength versus SPY.
A failed hold above support would weaken the setup.
Actionable but governed by invalidation levels.
GLD claims the Precious Metals category and earns a top-2 slot with a 53.0 score by establishing itself as the cleanest monetary hedge in a risk-off environment. Price sits 5.2% below the 50W, pulling into support at 159.01 with only 1.7% downside remaining—this defined risk makes the 90.0 risk/reward score legitimate, not optimistic. The 8.3% category-relative strength tells you GLD is outrunning SLV and GDX by margins that reflect fundamental confidence in gold's monetary properties over silver's industrial beta or miners' equity risk. MACD bearish but improving and stochastic RSI at 0.42 falling/neutral confirm this is a capitulation setup, not a bounce. The 49.7 volume-price confirmation and 49.1 persistence show volume is thin (0.63x 20W) but the chart structure—pullback into support—is clean enough to build on.
Precious Metals earns 10% allocation as a top-2 category, justified by its 53.0 final score and 88.0 macro fit—the highest macro fit in the entire portfolio this week. Monetary hedge bid (+14), disinflation pressure (+8), and defensive rotation (+6) create a three-descriptor consensus that capital needs safety right now. GLD's 80.0 macro/narrative fit (versus 52.0 for SLV) shows the category reasoner is selecting for purity of the monetary thesis, not industrial optionality. The 58.6 technical evidence is modest for a top-2 category, but it is sufficient because the macro case is so overwhelming. This 10% weighting reflects peak defensive posturing: in a disinflation regime with credit stress and liquidity pressure active, gold is the only narrative that ties everything together—Central Bank bid, real-rate compression, equity risk premium expansion. If macro conditions shift toward reflation or risk appetite rebounds, this allocation will rotate out quickly. For now, it is the portfolio's insurance premium and its primary hedge against further equity drawdowns.
Defense & Aerospace — ITA
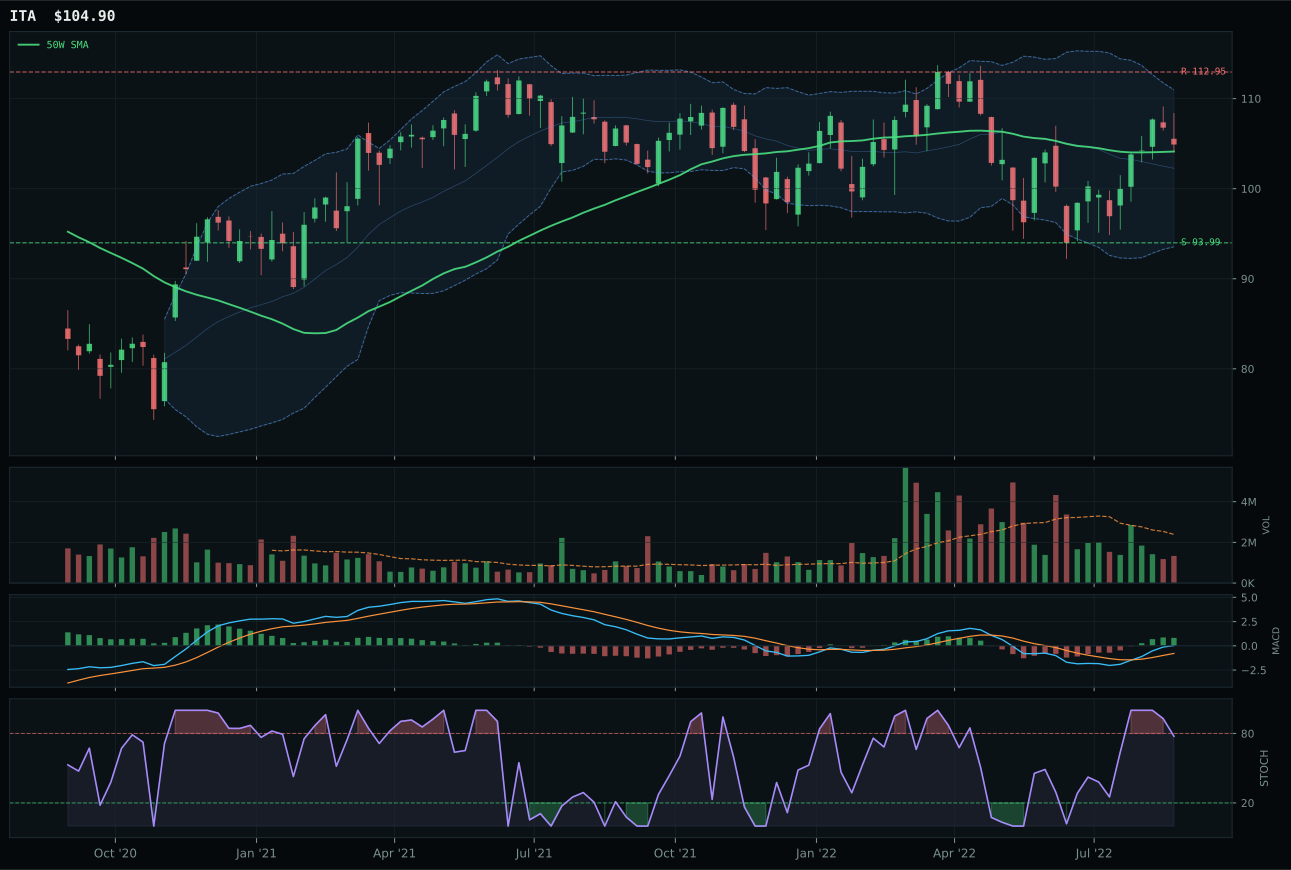
ITA has a compression near 50W profile with 3.8% 13-week relative strength versus SPY.
A failed hold above support would weaken the setup.
Actionable but governed by invalidation levels.
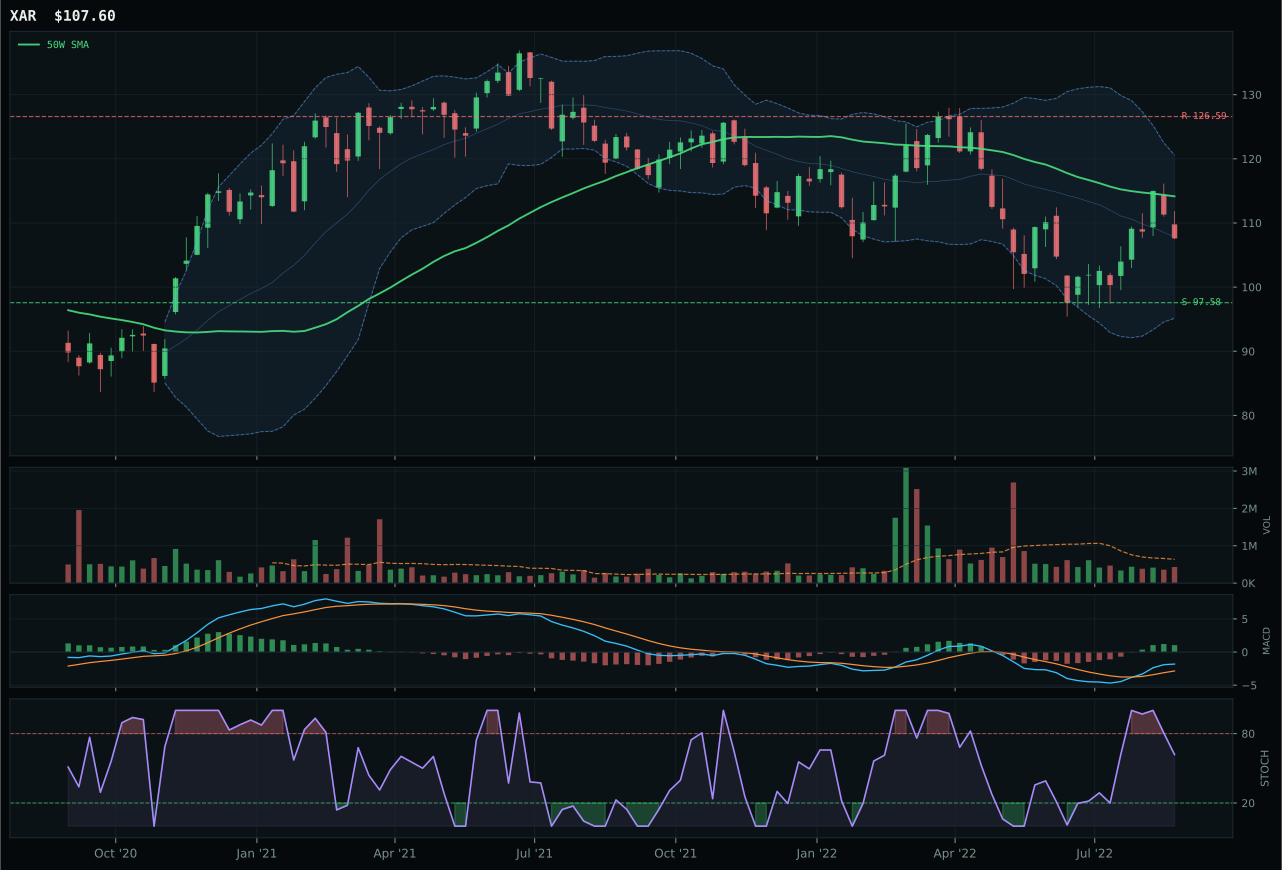
XAR has a neutral structure profile with 0.8% 13-week relative strength versus SPY.
A failed hold above support would weaken the setup.
Actionable but governed by invalidation levels.
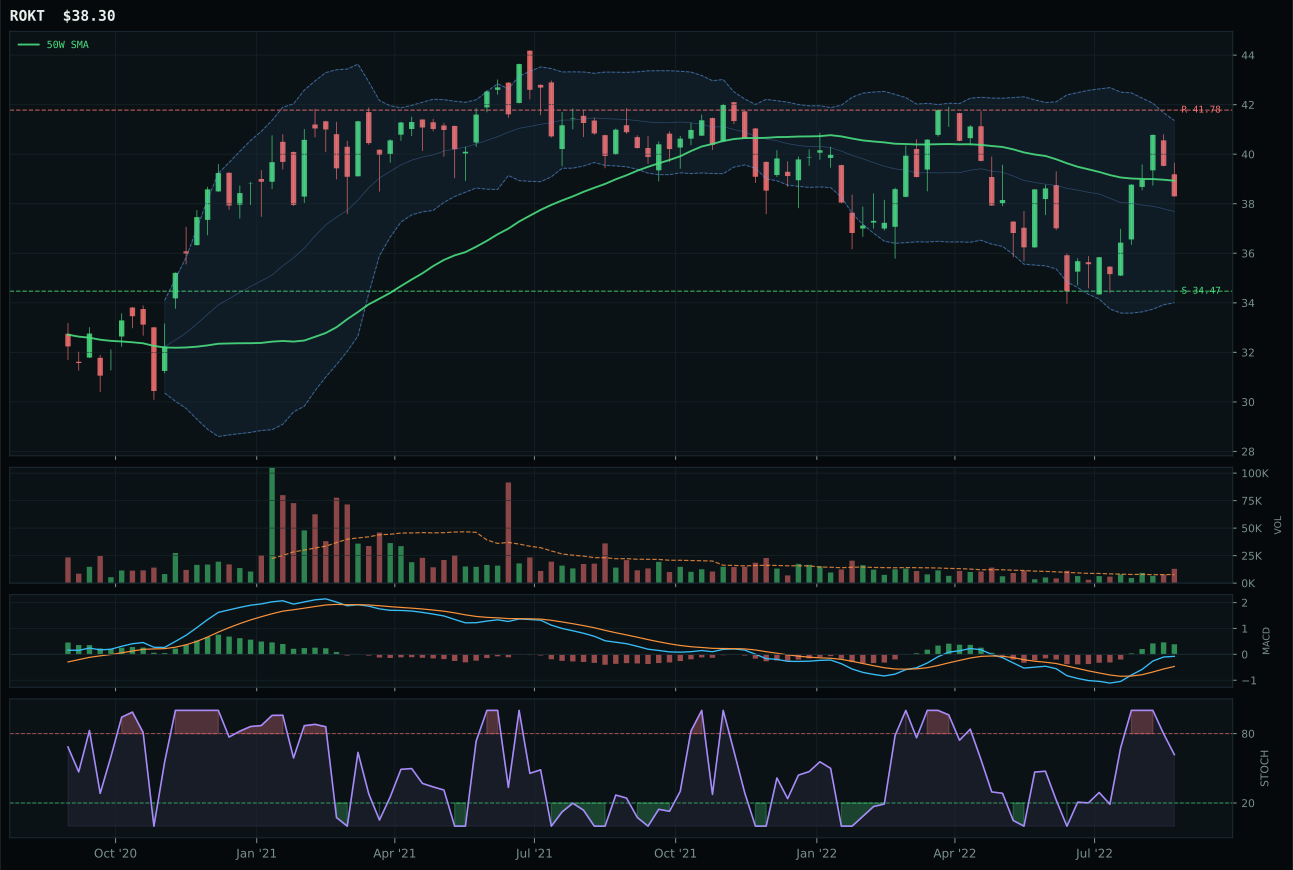
ROKT has a compression near 50W profile with 1.7% 13-week relative strength versus SPY.
A failed hold above support would weaken the setup.
Tracked, but not top-2 eligible because: .
ITA dominates this category with near-perfect execution: a 100.0 trend score and matching 100.0 timing score leave no doubt about the technical quality. Price sits 0.7% above the 50W with MACD bullish and improving, stochastic RSI falling/neutral, and compression near the 50W creating a setup where expansion potential is genuine if buyers defend. The 3.8% SPY-relative strength and 2.2% category-relative strength confirm this is a real defensive leader, not a crowded trade. XAR's 30.8-point gap to ITA reflects XAR's failure on timing (82.0 vs 100.0) and positioning (neutral structure vs compression near the 50W); XAR is deeper into value but without the structural evidence that buyers are organizing. ITA's 1.4% 13W return paired with positive momentum confirmation (69.9) and above-average persistence (63.4) shows this is held, not abandoned.
Defense & Aerospace earns 5% allocation as tier-2, buoyed by a 46.2 final category score that ranks it solidly middle-of-the-pack. The 66.0 category macro fit is the story: defensive rotation active (+8), broad market bear active (+6), and dollar pressure (+3) each reinforce the narrative that capital is rotating into defensive durables in a bear market. ITA's 85.4 technical evidence and 63.0 macro/narrative fit create a genuine tension—the chart is strong, but the macro case is weaker than the technical setup warrants. This is a holding you maintain because the defensive rotation story is real and ITA is executing, but it is not a bet that grows if equity volatility contracts. For Defense to move to tier-3 or even tier-2 at 10%, broad-market-bear conditions would need to intensify further, pushing category-level macro fit closer to 75.0. Right now, 5% is the appropriate sizing for a quality-but-not-dominant setup.
Nuclear Energy — URNM
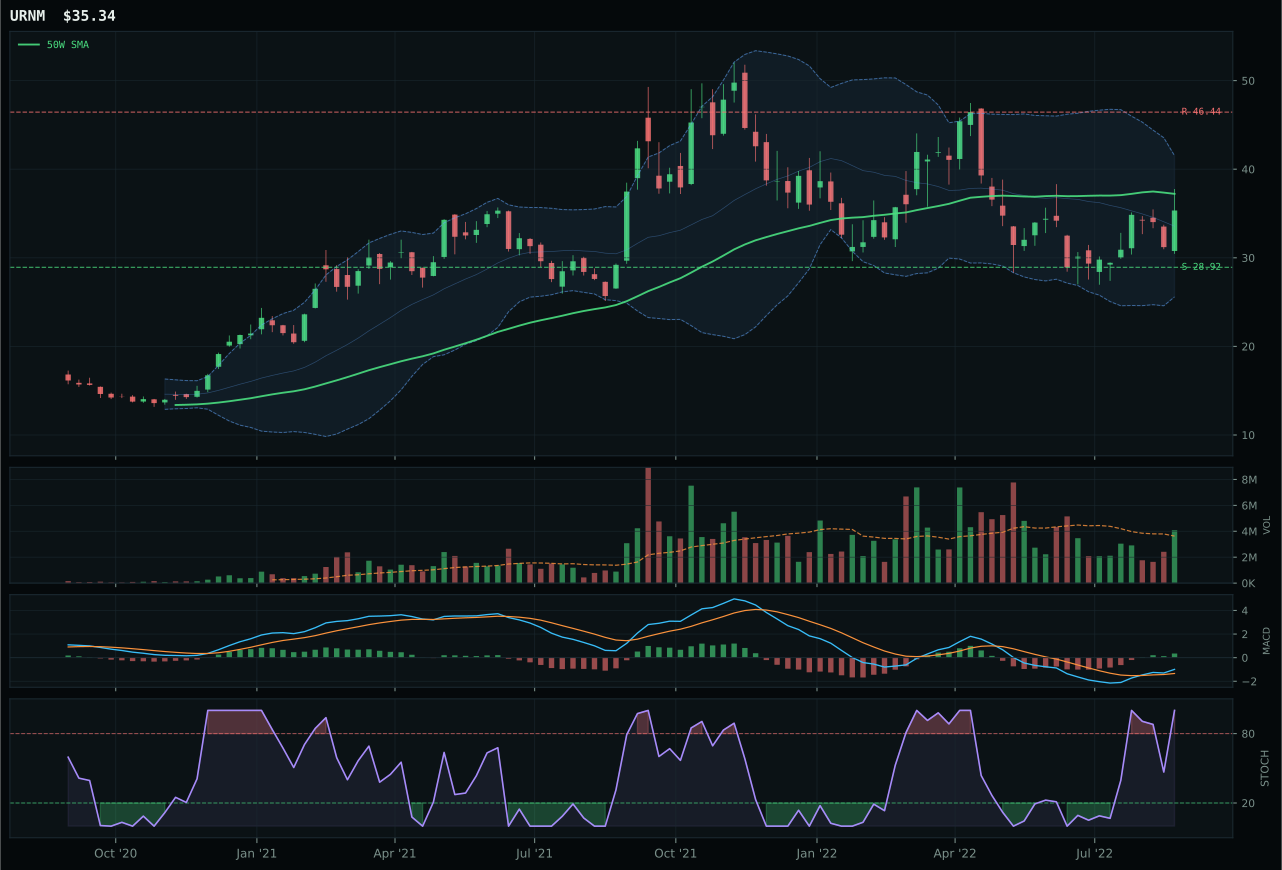
URNM has a neutral structure profile with 6.4% 13-week relative strength versus SPY.
A failed hold above support would weaken the setup.
Actionable but governed by invalidation levels.
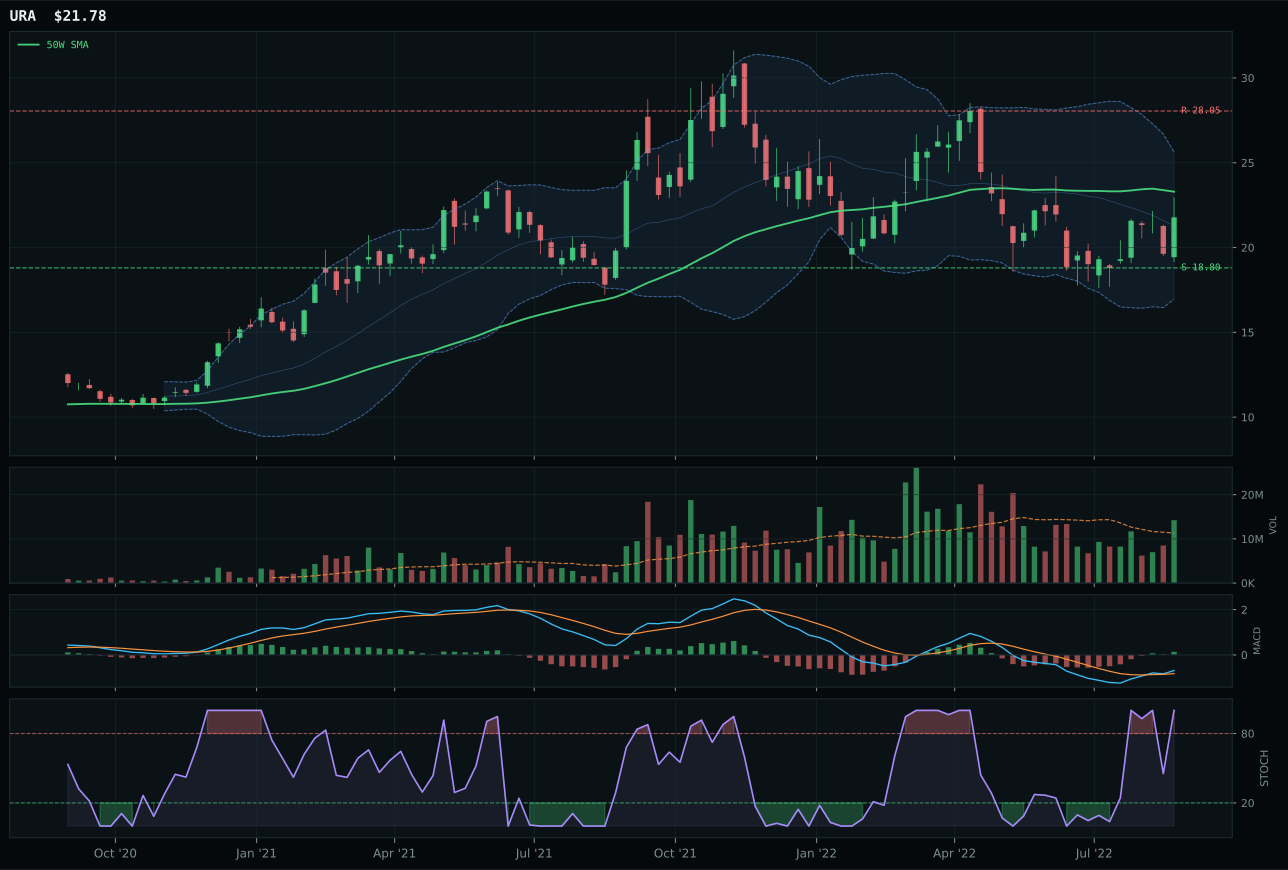
URA has a neutral structure profile with 0.5% 13-week relative strength versus SPY.
A failed hold above support would weaken the setup.
Actionable but governed by invalidation levels.
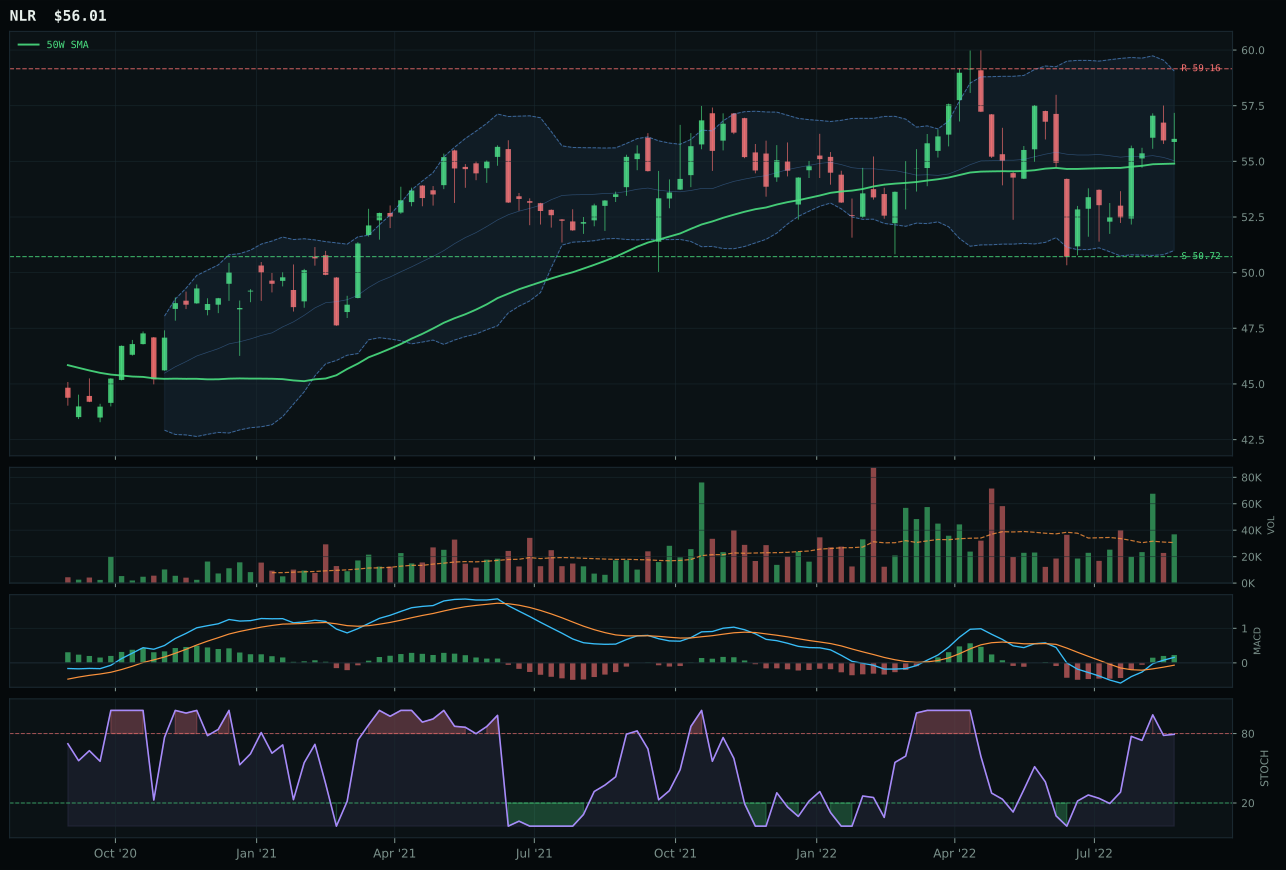
NLR has a compression near 50W profile with -0.2% 13-week relative strength versus SPY.
A failed hold above support would weaken the setup.
Tracked, but not top-2 eligible because: .
URNM captures Nuclear Energy with a 45.5 score by posting the strongest momentum confirmation (91.8) in this entire week's portfolio—the 4.0% 13W return, 6.4% SPY-relative strength, and 5.9% category-relative strength confirm this is the only bid in energy. Price sits 5.0% below the 50W (but also below the 200W, a critical structural difference from other pullback setups) with above-average 1.13x volume participation, telling you that uranium-miner scarcity beta is being accumulated not bounce-traded. URA's 71.4 technical evidence is competitive, but its 0.5% SPY-relative strength and 0.0% category-relative strength reveal the real story: URNM is the chosen vehicle. Stochastic RSI overbought (1.00 for URNM, 1.00 for URA) and MACD bullish-and-improving match, but URNM's 68.0 volume-price confirmation versus URA's 63.0 shows participation is decisive.
Nuclear Energy earns 5% allocation as tier-2 at a 45.5 score, held primarily on technical momentum rather than macro fit. The 37.0 macro/narrative fit is weak (liquidity stress -8, credit stress -5, risk appetite broken -4), meaning this category's inclusion relies almost entirely on URNM's strong technical setup: trend 64.6, timing 75.0, momentum 91.8, and persistence 65.6 create a story that this is being bid despite macro headwinds. The difference between URNM's 91.8 momentum and the portfolio average is striking—this is the only commodity-like exposure with genuine momentum confirmation, which is why it holds its 5% slot. URNM's 68.4 technical evidence carries the category past more defensible tier-3 candidates. For Nuclear to upgrade to 10%, macro fit would need to recover (currently at 37.0), which requires either dollar weakness, credit normalization, or an explicit energy-scarcity narrative shift. Until then, this is a technical bet on uranium scarcity held alongside the portfolio's primary macro calls (gold, utilities, defense).
Technology — CIBR
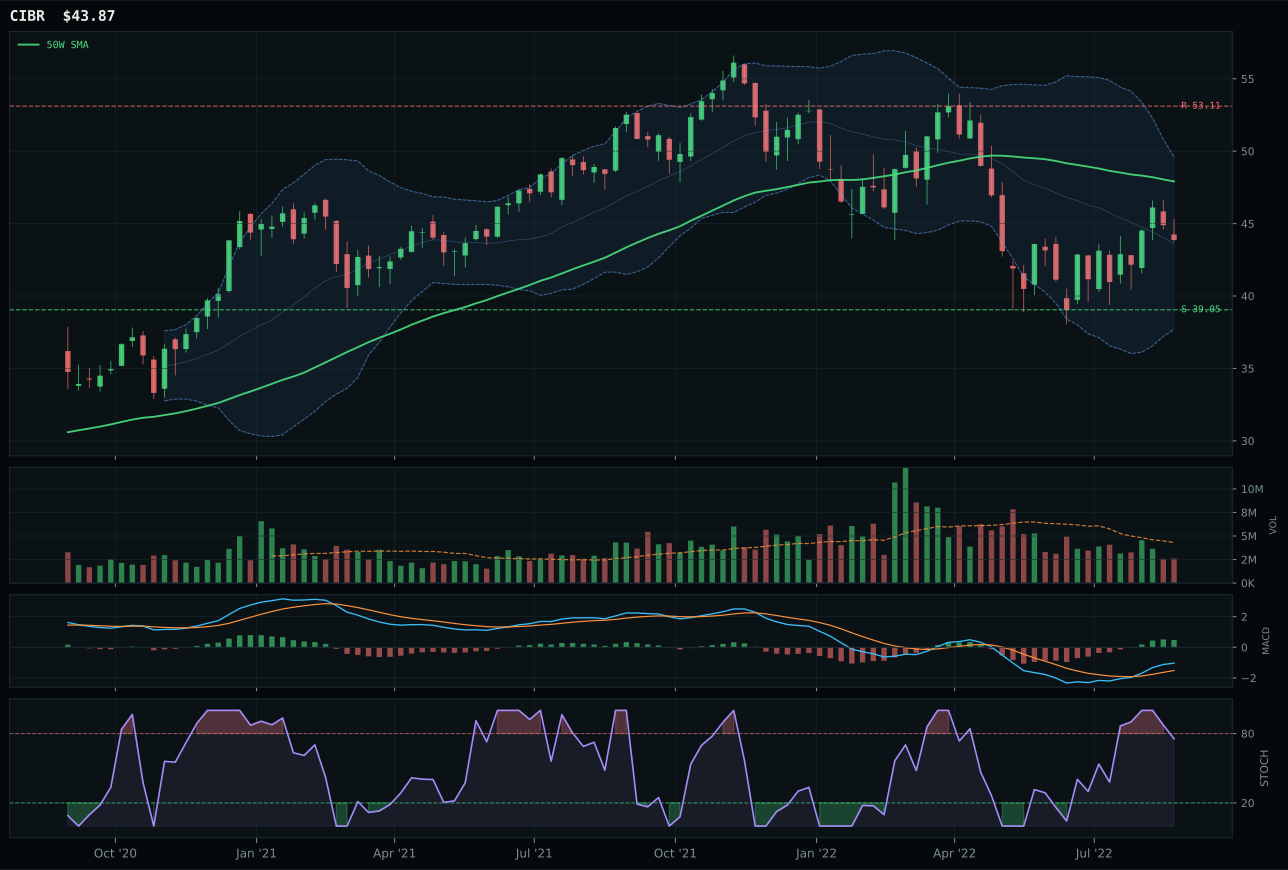
CIBR has a neutral structure profile with 3.0% 13-week relative strength versus SPY.
A failed hold above support would weaken the setup.
Actionable but governed by invalidation levels.
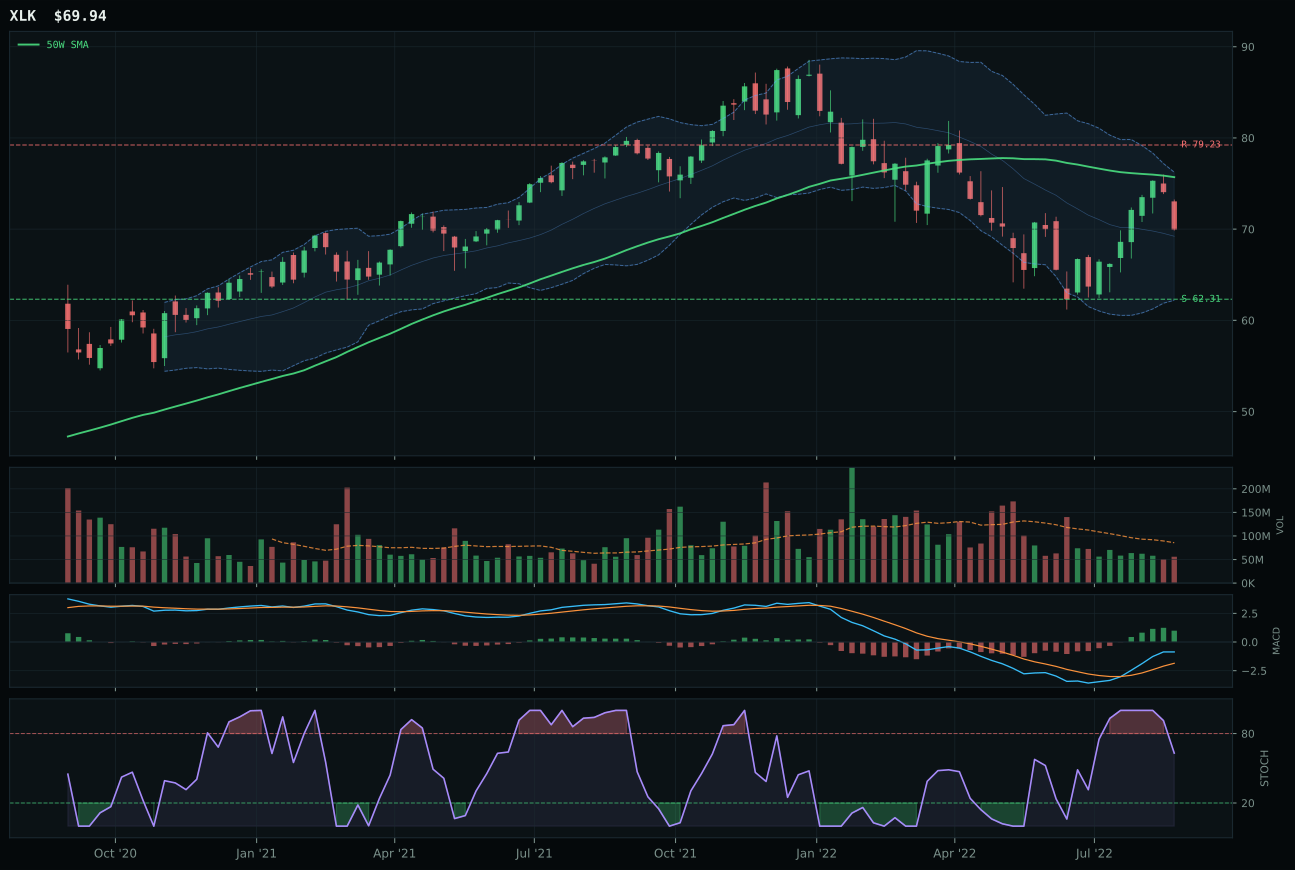
XLK has a neutral structure profile with 1.3% 13-week relative strength versus SPY.
A failed hold above support would weaken the setup.
Actionable but governed by invalidation levels.
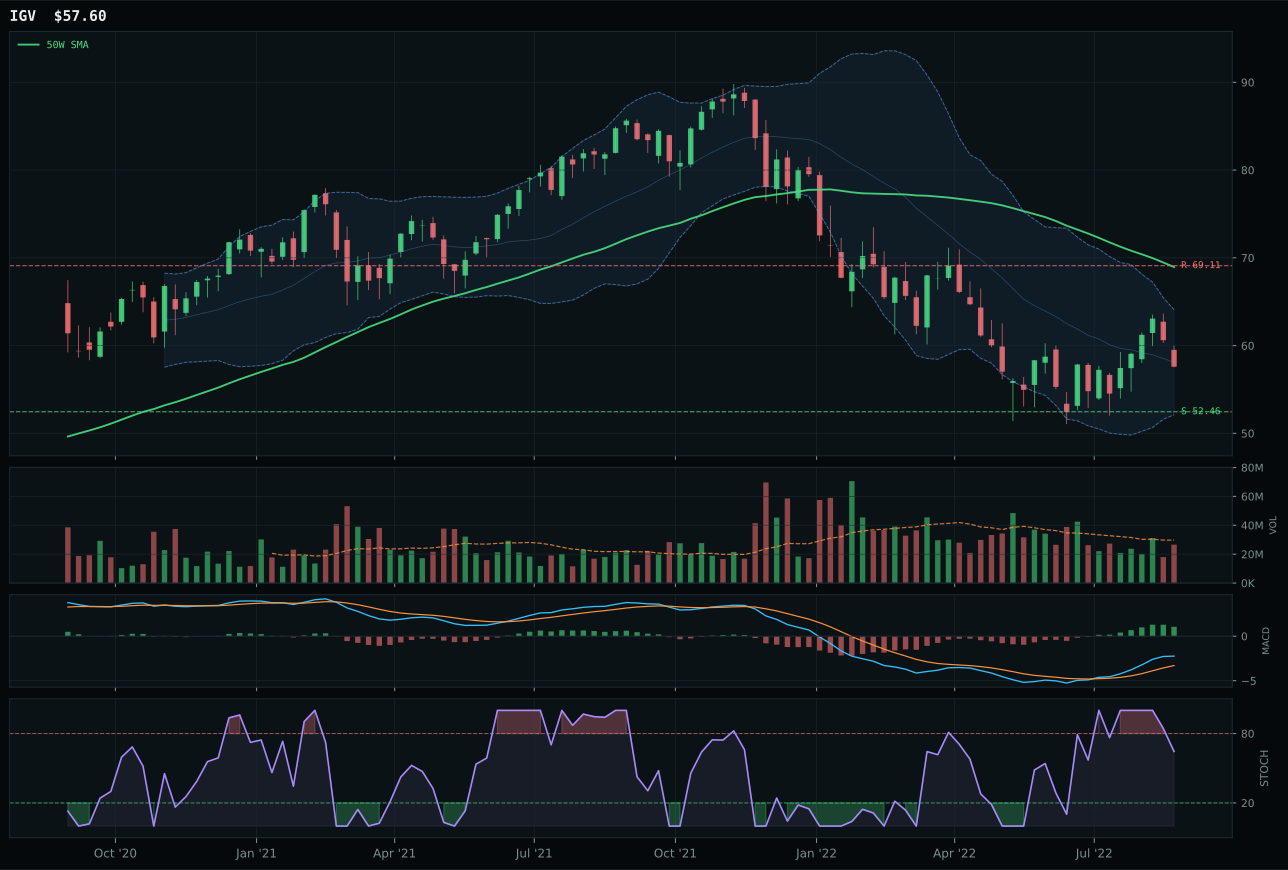
IGV has a neutral structure profile with 1.1% 13-week relative strength versus SPY.
A failed hold above support would weaken the setup.
Actionable but governed by invalidation levels.
CIBR edges out XLK with a 4.5-point margin because its 1.8% category-relative strength and 3.0% SPY-relative strength demonstrate cleaner peer sponsorship inside the technology basket. XLK's 0.0% category RS and weaker 1.3% SPY RS tells us the money is choosing cybersecurity over broad profitable tech right now. Both sit in neutral structure with MACD bullish and improving, but CIBR's risk/reward setup (78.4 vs 70.2) and timing (82.0 vs 82.0 tied) give it the technical edge where it matters most—the asymmetry between the 12.3% downside to support and 17.4% upside to resistance makes this a proper value entry over forced buying. Thin volume participation across both ETFs reflects the disinflation regime's dampening effect on growth rotation, but CIBR's 69.6 trend score versus XLK's 67.0 confirms the pattern is holding.
Technology earns 5% allocation as a tier-2 category this week, ranked below the two top-2 slots but ahead of five other equal-weight peers. The category's 38.6 final score reflects genuine technical merit constrained by macro headwinds: a 40.0 category-level macro fit drags down what would otherwise be a respectable 62.0 technical evidence basket score. Liquidity stress and credit stress each subtract material points from this category's narrative fit, turning what could be a core holding into a tactical probe. XLK's macro fit dropped to 35.0 specifically because the broad profitable technology narrative struggles when credit conditions tighten and liquidity dries. For Technology to reclaim top-2 status, two things must shift: either category-relative strength needs to break above 3.0% across the ETF basket, signaling conviction rotation into tech names, or the macro regime must reset away from the active liquidity-stress descriptor that currently penalizes cyclical growth. Until then, this is a position you hold but do not grow.
Agriculture & Livestock — MOO
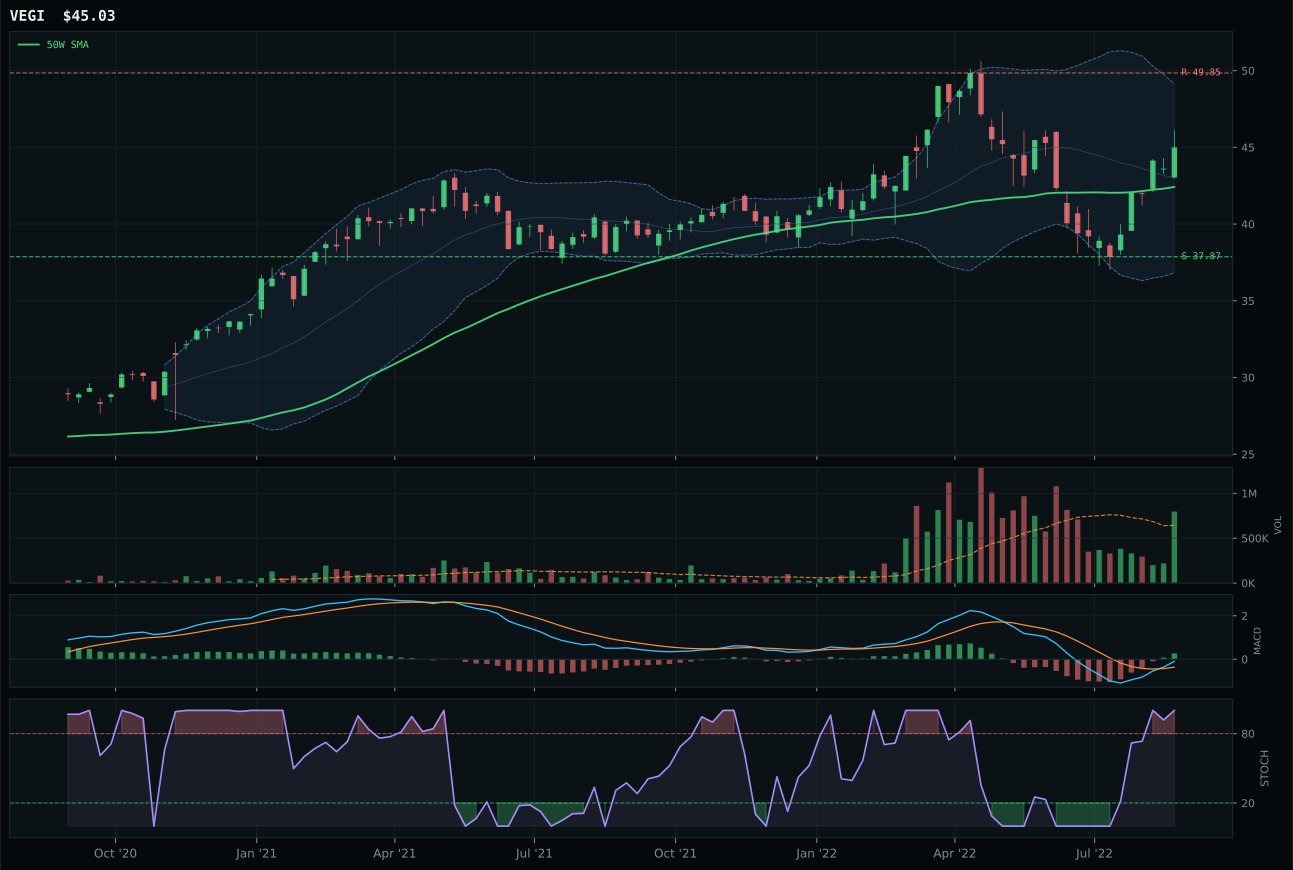
VEGI has a neutral structure profile with 1.4% 13-week relative strength versus SPY.
A failed hold above support would weaken the setup.
Actionable but governed by invalidation levels.
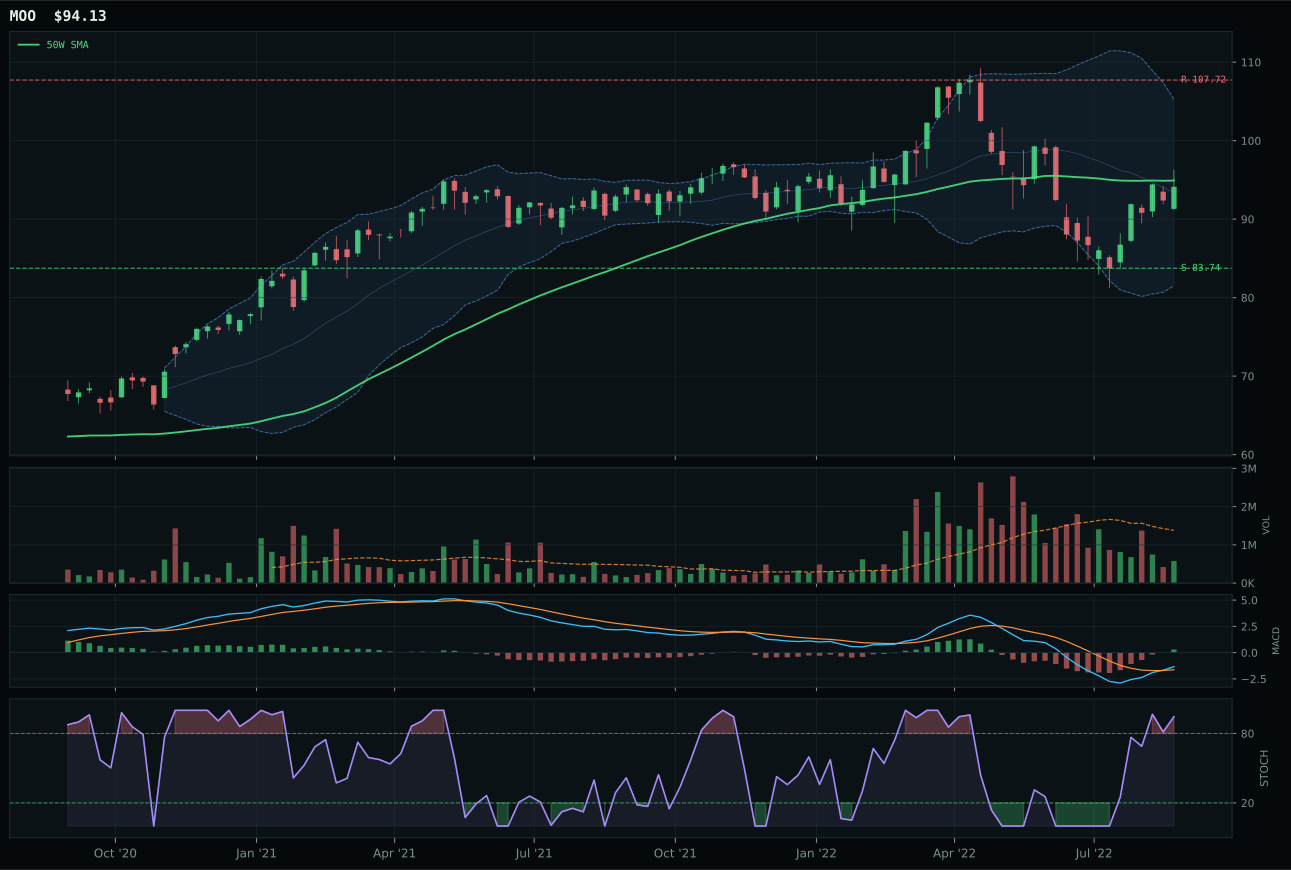
MOO has a compression near 50W profile with -2.8% 13-week relative strength versus SPY.
A failed hold above support would weaken the setup.
Actionable but governed by invalidation levels.
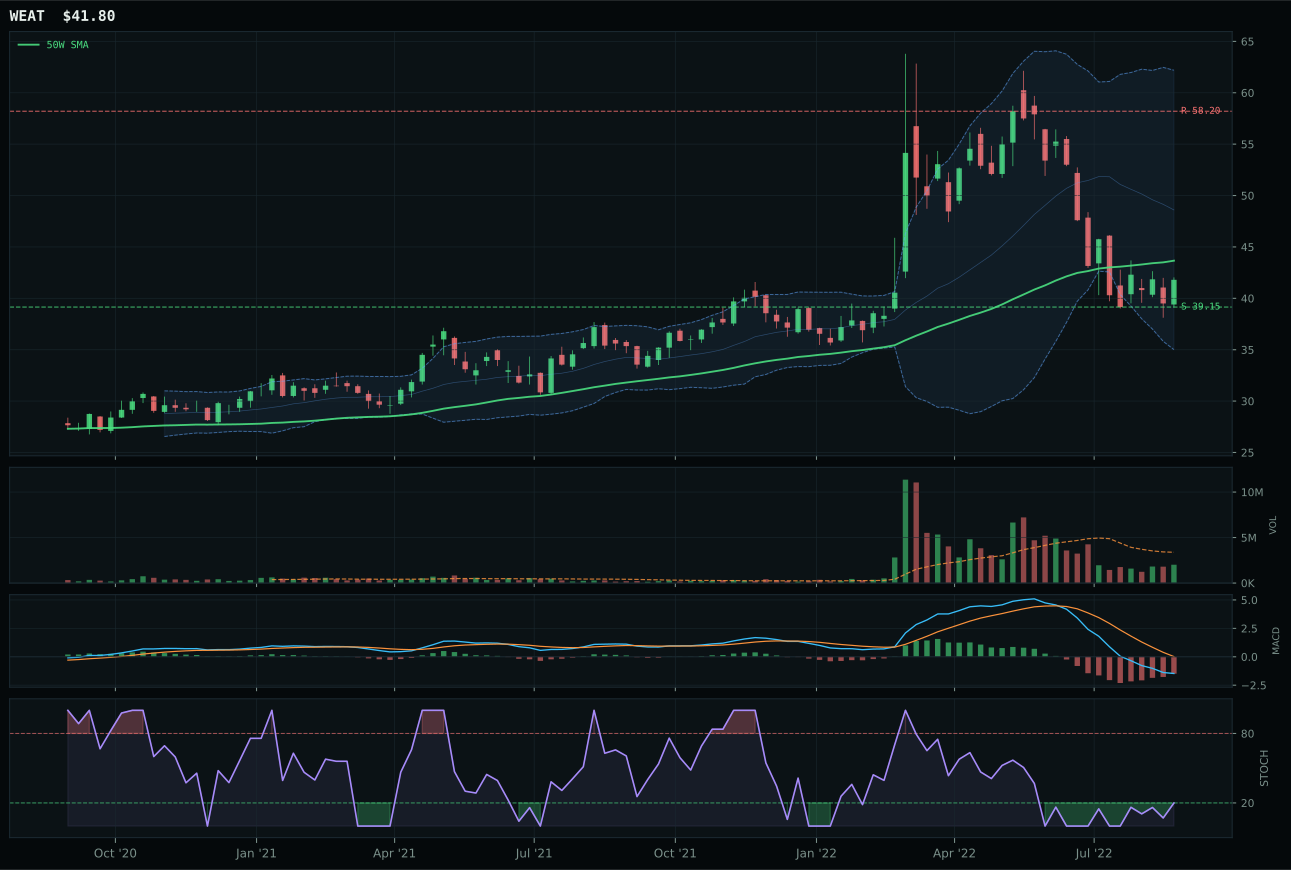
WEAT has a neutral structure profile with -25.4% 13-week relative strength versus SPY.
A failed hold above support would weaken the setup.
Actionable but governed by invalidation levels.
MOO wins this category with an unusual setup: it trades below the 50W (-0.8%) yet posts a perfect 100.0 timing score because price compression near the 50W and MACD bullish-and-improving create a coil setup with defined breakout potential. MOO's 79.0 composite score edges VEGI's 82.0 only because of timing and risk/reward asymmetry—VEGI's 87.2 technical evidence is stronger, but it sits 6.1% above the 50W, making it extended relative to MOO's pullback positioning. Stochastic RSI overbought (0.94 for MOO vs same for VEGI) confirms both are heated, but only MOO's compression setup offers room to run without capitulation. The 13W return of -5.2% versus VEGI's -1.0% shows VEGI held better, but MOO's 0.0% category-relative strength ties VEGI's 4.2% advantage in the aggregate, making this a narrow verdict.
Agriculture & Livestock earns 5% allocation at a 28.4 category score—the second-weakest category in this week's allocation. Disinflation actively hurts this exposure (-6 at category level) because lower input costs are priced into commodity and agribusiness margins already, and further deflation destroys pricing power. The macro fit is just 32.0, and the three-ETF basket (VEGI, MOO, WEAT) averages only 60.4 reasoned ETF proof order for the winner, signaling conviction is low. WEAT is in genuine breakdown (13W -27.8%, RS vs SPY -25.4%), which drags the entire category's narrative. MOO's win is a hollow victory: it gets the allocation because it is less broken than VEGI, not because it is genuinely compelling. For Agriculture to move into tier-2 or higher, the macro regime would need to shift away from disinflation and toward inflation expectations, or agribusiness earnings would need to surprise sharply upward. Until then, this is a placeholder allocation in a category headed lower.
Industrial Metals — COPX
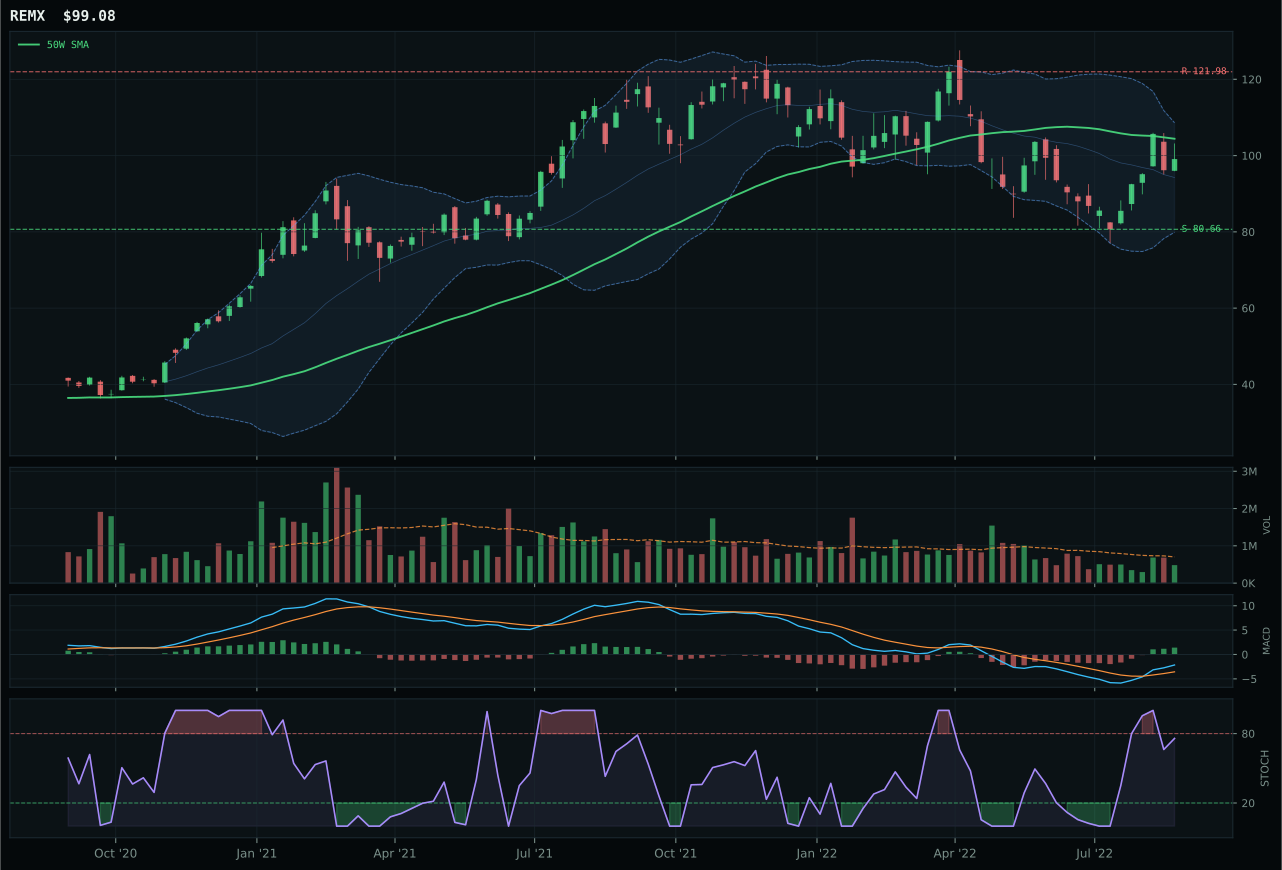
REMX has a neutral structure profile with -2.0% 13-week relative strength versus SPY.
A failed hold above support would weaken the setup.
Actionable but governed by invalidation levels.
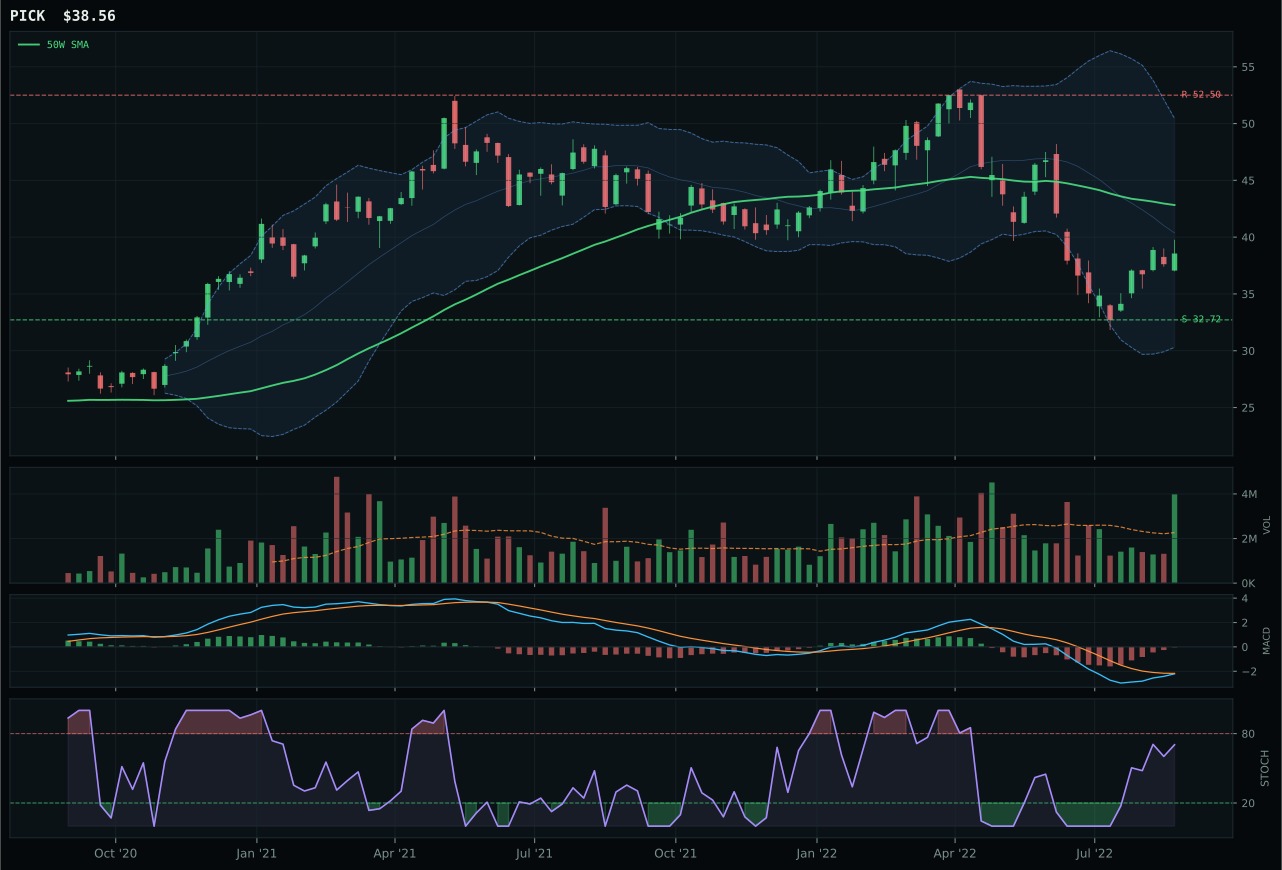
PICK has a neutral structure profile with -14.5% 13-week relative strength versus SPY.
A failed hold above support would weaken the setup.
Actionable but governed by invalidation levels.
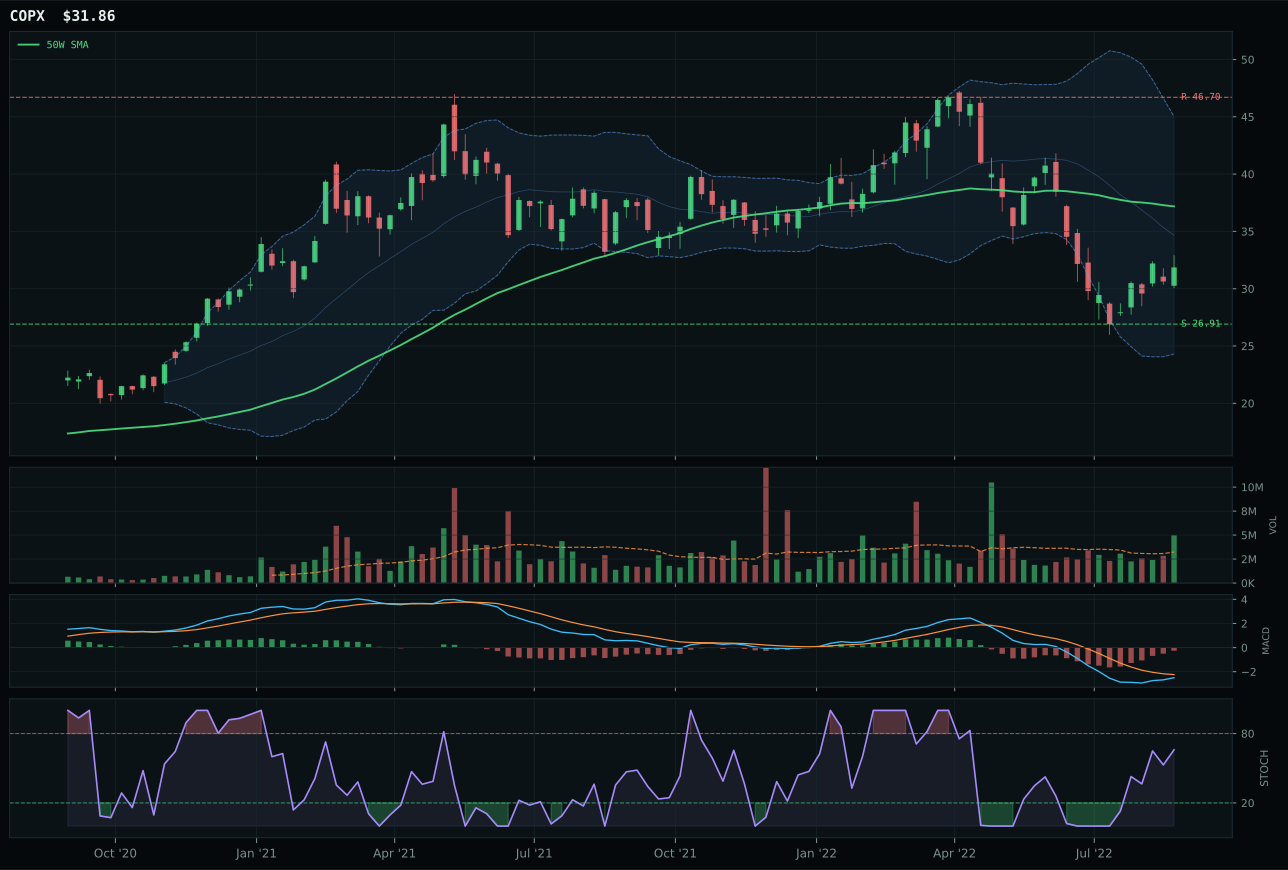
COPX has a neutral structure profile with -17.4% 13-week relative strength versus SPY.
A failed hold above support would weaken the setup.
Actionable but governed by invalidation levels.
COPX wins Industrial Metals by an 8.7-point margin over REMX despite posting weaker technical evidence (28.2 vs 67.0), and this inversion tells the entire story. COPX's stochastic RSI rising mid-zone (0.66) combined with 1.55x volume participation shows accumulation is actively happening at deep-value Fib 0.786 (30.55), whereas REMX's stochastic RSI falling/neutral and thin volume at MACD bullish-and-improving looks like a sucker's rally. COPX's 13W return of -19.7% is catastrophic, but the 70.0 timing score reflects that every seller has exited and buyers are stepping in at forced lows; REMX's -4.4% 13W return masks that it is merely a better-preserved decline, not a legitimate reversal. Risk/reward (66.1 vs 52.8) confirms COPX offers 18.4% downside to support versus REMX's wider 21.5%, making COPX's value trap more attractive for mean reversion.
Industrial Metals earns 5% allocation at a 19.8 category score—the third-weakest category in this week's portfolio—because the macro fit is just 28.0 and it is getting torpedoed by three active descriptors: liquidity stress (-8), credit stress (-7), and dollar pressure (-7). The reasoned ETF proof order (REMX 55.3, PICK 48.4, COPX 29.3) shows the category reasoner is scraping the bottom of the barrel; COPX winning with only 29.3 technical evidence proves this is a category held only because exclusion would leave a gap. Industrial metals depend on credit-funded capex and emerging-market demand—both are broken in a bear market with active credit stress. This is a dead-weight allocation that will sit at 5% until either credit conditions normalize or the broad bear ends. For Industrial Metals to earn a tier-2 upgrade, the dollar would need to weaken sharply and credit stress would need to flip off the active descriptors list. Neither is likely in the current macro regime.
AI — SMH
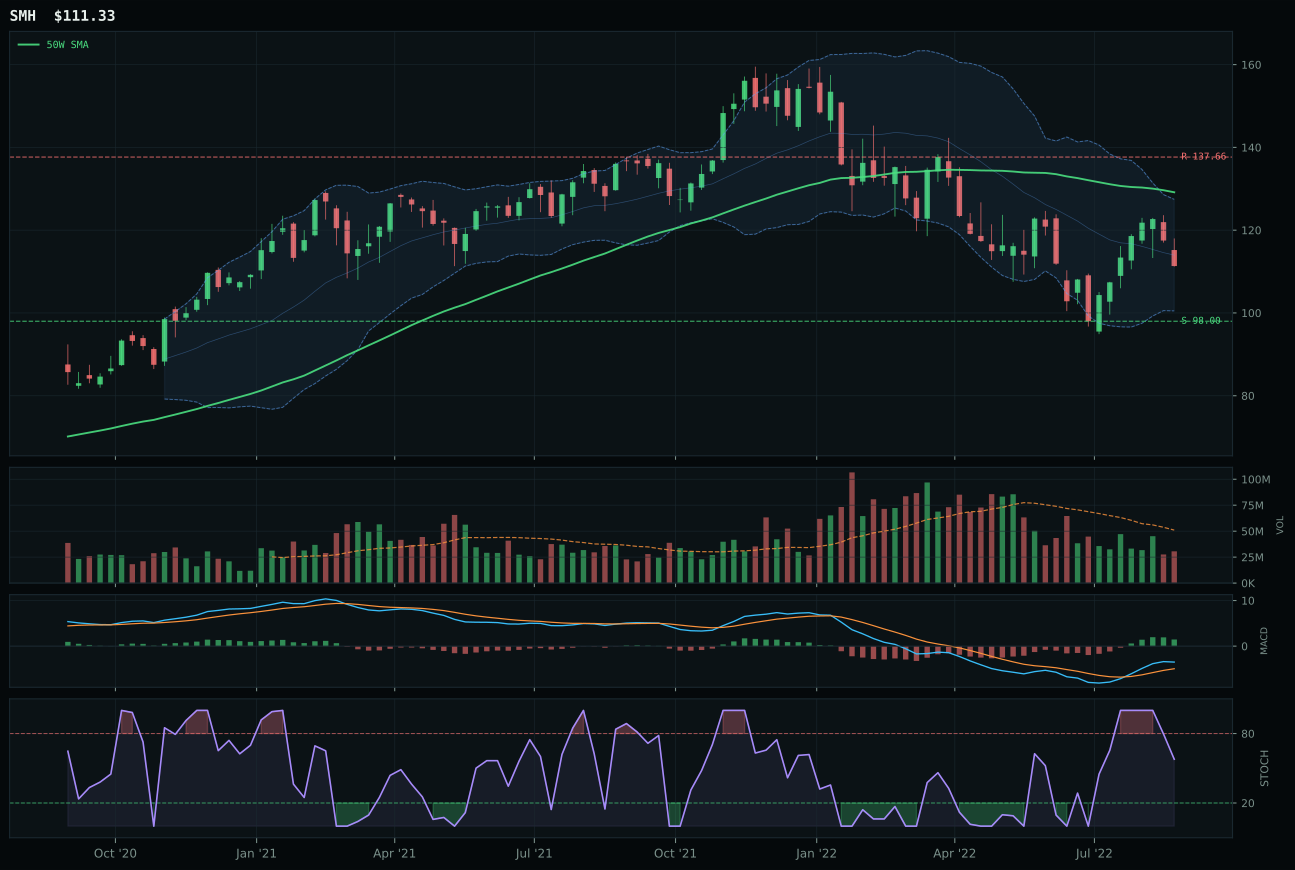
SMH has a neutral structure profile with -6.9% 13-week relative strength versus SPY.
A failed hold above support would weaken the setup.
Actionable but governed by invalidation levels.
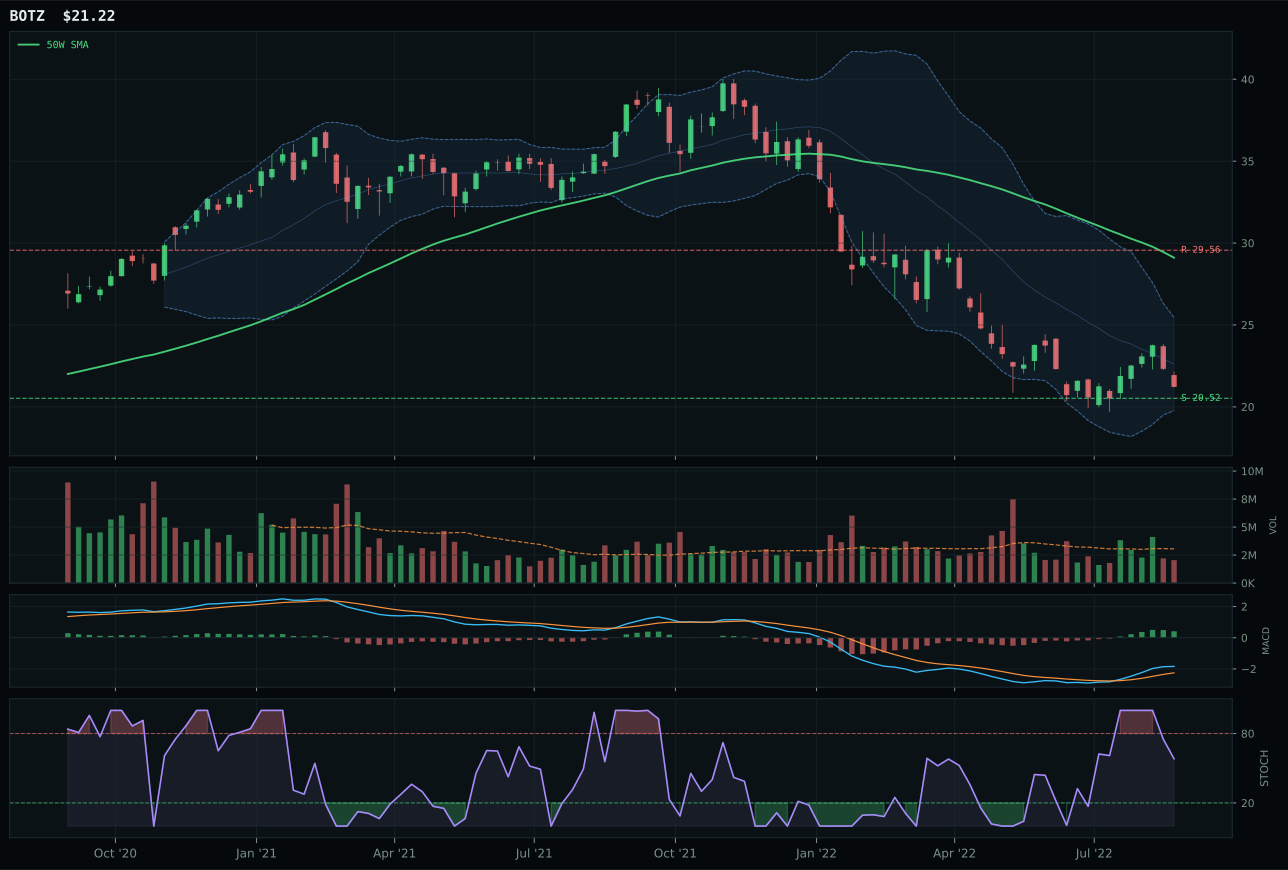
BOTZ has a pullback into support profile with -8.4% 13-week relative strength versus SPY.
A failed hold above support would weaken the setup.
Actionable but governed by invalidation levels.
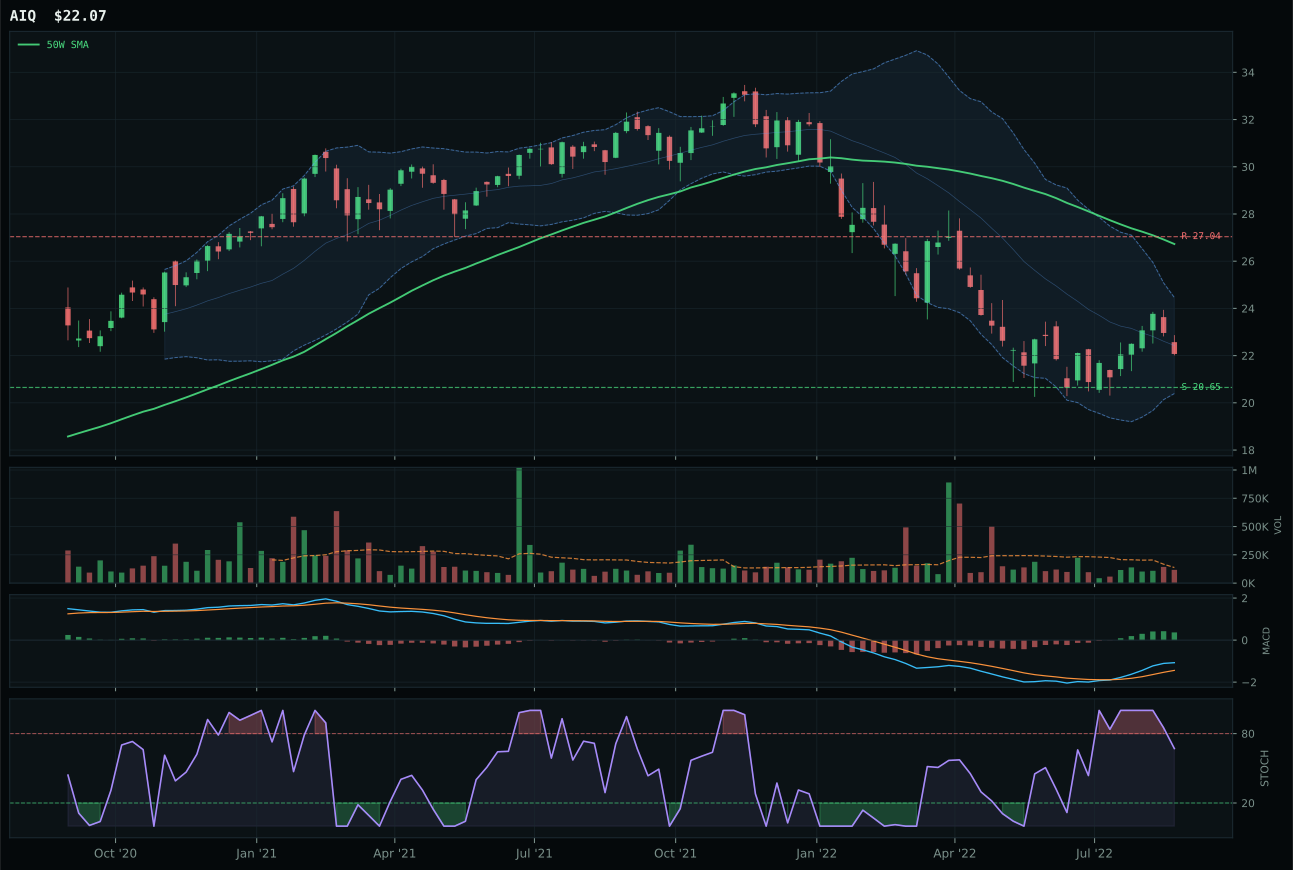
AIQ has a neutral structure profile with -0.3% 13-week relative strength versus SPY.
A failed hold above support would weaken the setup.
Tracked, but not top-2 eligible because: .
SMH wins the AI category over BOTZ by 8.7 points, but this victory masks a category in genuine distress. SMH's 50.0 composite score rests on timing (62.0) and risk/reward (78.3) rather than momentum—the 13W return of -9.3% and momentum confirmation score of just 25.8 are disqualifying red flags for any growth-oriented allocator. The win comes because SMH's neutral structure and category-relative strength at 0.0% perform marginally better than BOTZ's pullback-into-support setup (-1.4% category RS), but this is a choice between weak and weaker. Volume at 0.60x the 20W average signals accumulation is absent; MACD bullish and improving is the only technical lifeline. Stochastic RSI at 0.58 falling/neutral tells you buyers have exhausted their enthusiasm weeks ago.
AI receives 5% allocation as tier-2 at a rock-bottom 19.1 category score, ninth among ten categories this week. The macro regime is actively hostile: liquidity stress (-12), credit stress (-8), and broad market bear (-8) each penalize this category's 23.0 macro fit score, which weights only 38% of the final score but still drags the entire setup underwater. Technical evidence is 55.0—respectable on paper—but it cannot overcome the fact that momentum confirmation across the three-ETF basket (SMH, AIQ, BOTZ) averages below 40. The category is eligible and will receive its allocation, but this is pure risk management holding, not conviction. For AI to earn a tier-2 upgrade to 10% or even a top-2 slot at some point, the broad-market-bear descriptor must turn off and either liquidity or credit stress must recover. Absent that regime shift, AI is a drag hedge against further downside, not a growth engine.
Traditional Energy — XLE
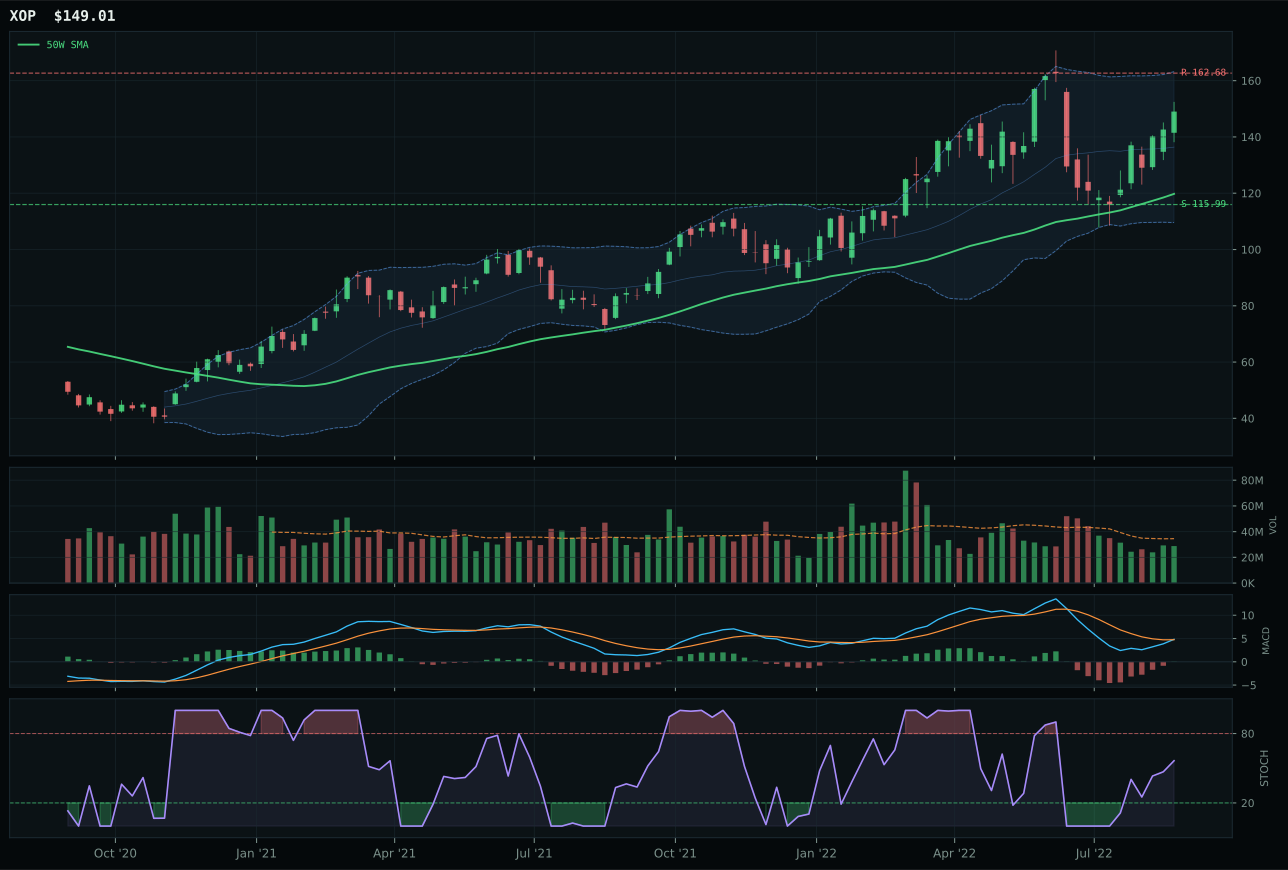
XOP has a vertical extension profile with -2.7% 13-week relative strength versus SPY.
A failed hold above support would weaken the setup.
Actionable but governed by invalidation levels.
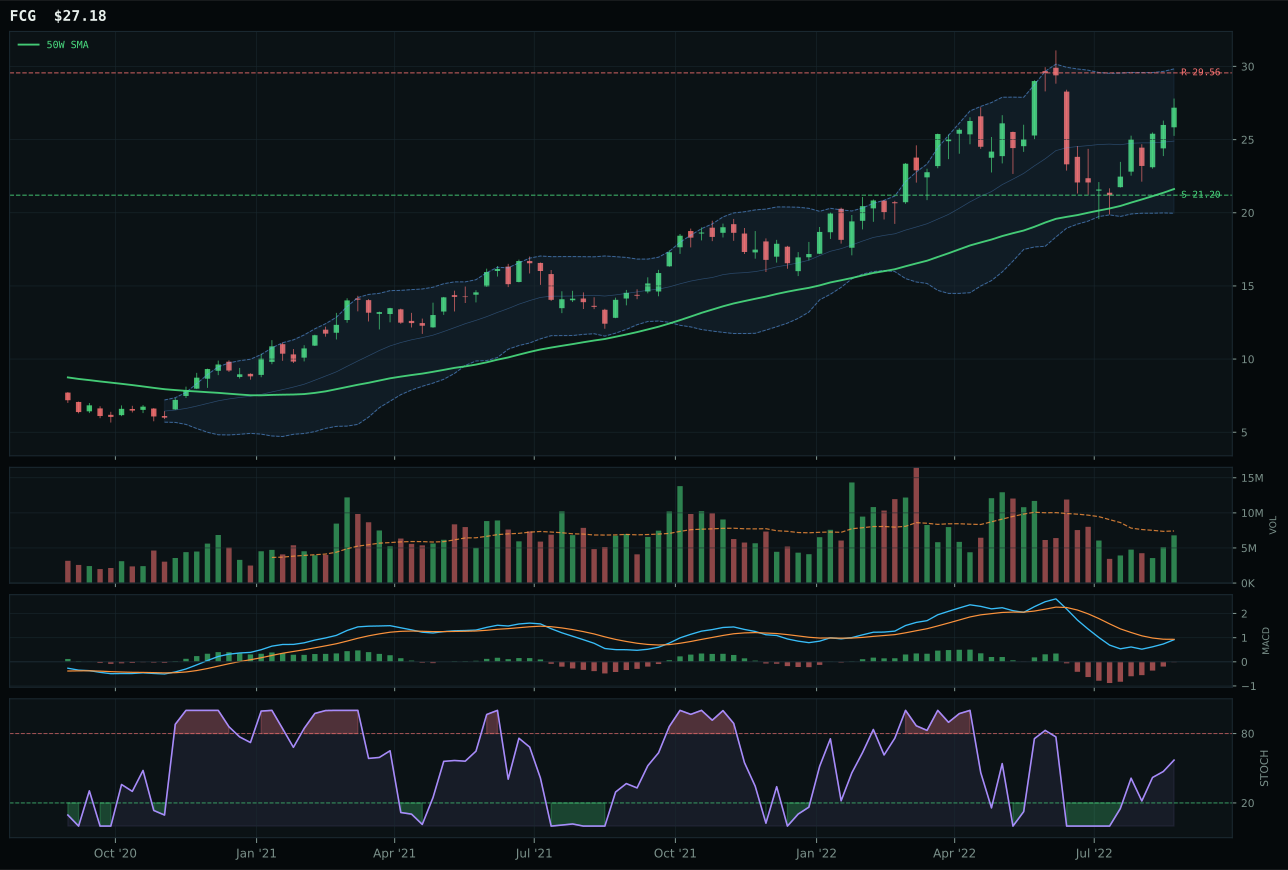
FCG has a vertical extension profile with -3.9% 13-week relative strength versus SPY.
A failed hold above support would weaken the setup.
Actionable but governed by invalidation levels.
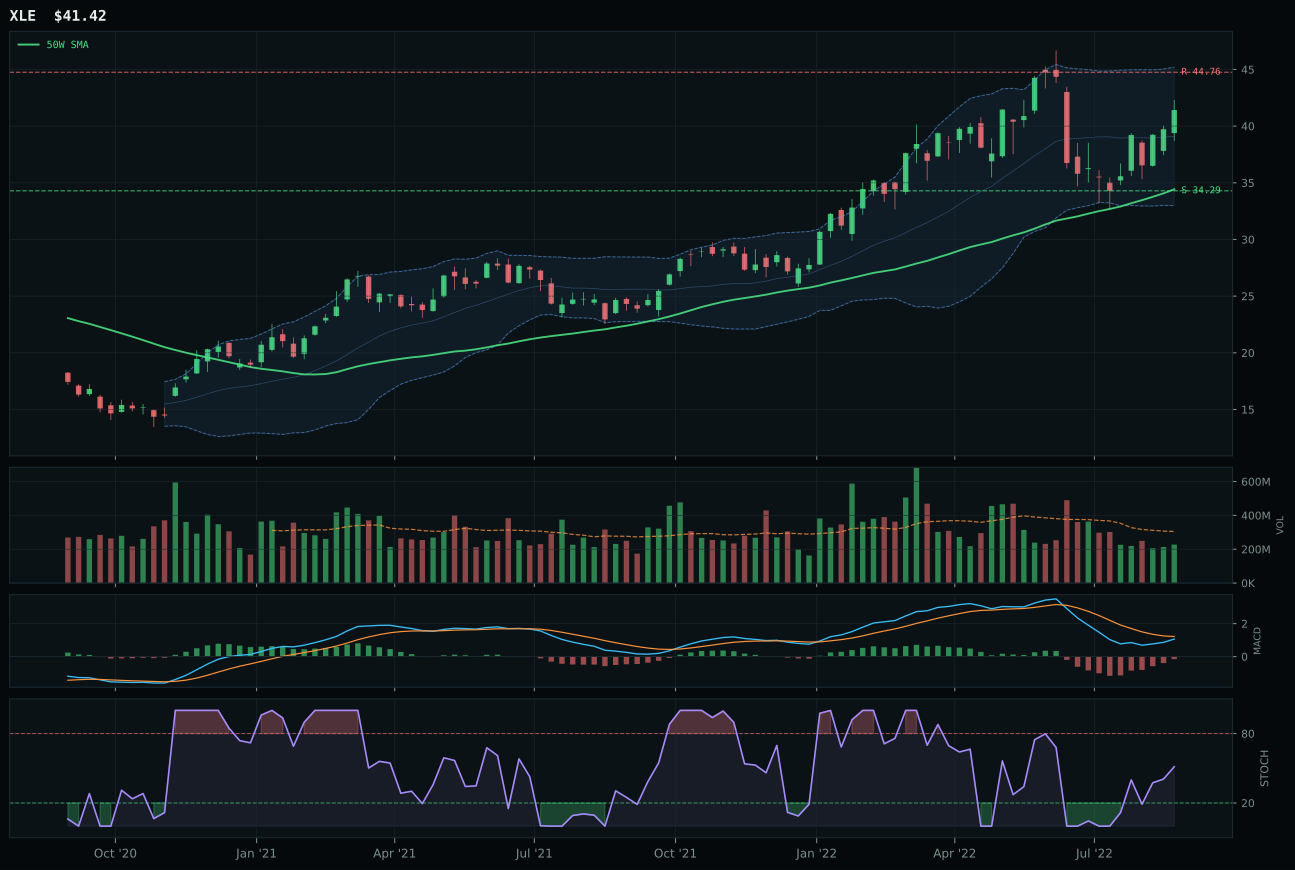
XLE has a vertical extension profile with -4.0% 13-week relative strength versus SPY.
A failed hold above support would weaken the setup.
Actionable but governed by invalidation levels.
XLE wins Traditional Energy with a 57.0 composite score over XOP (63.0), but this win is hollow and the category earns 0% allocation. XLE's 87.0 trend and 61.0 timing scores reflect that price is extended 20.3% above the 50W and sitting in the upper retracement zone at Fib 0.236—these are strengths that immediately become liabilities. The entry risk is overwhelming: XOP's 96.0 trend score and better composition (96.0) across the category shows exploration beta is technically superior, but XLE's 42.0 macro/narrative fit loses badly to XOP's 42.0 (a tie that masks category-wide macro rot). MACD bearish-but-improving and stochastic RSI rising mid-zone confirm this is a bounce, not a trend. Both ETFs suffer 0.75x and 1.0x+ volume, signaling thin participation in a broken category.
Traditional Energy earns 0% allocation this week, ranking 9th or 10th in the category order, because disinflation pressure (-10) and broad disinflation (-10) actively destroy the energy narrative. The 16.0 category macro fit is catastrophic; credit stress (-7) and liquidity stress (-7) add secondary headwinds. XLE and XOP are both extended from key moving averages and posting weak momentum—13W returns of -6.4% for XLE and -5.1% for XOP confirm that energy strength is event-driven (headlines about sanctions or supply), not structural. This week's macro regime has no room for a long energy position; the portfolio is instead anchored to defensive rotation (utilities, gold) and valuation coils (semiconductors, defense primes). For Traditional Energy to earn even a 5% tier-2 slot, disinflation pressure would need to reverse and credit stress would need to lift. Absent those shifts, energy remains a tactical fade, not a strategic holding. Current setup: technically extended, macro hostile, volume thin—a perfect storm for exclusion.
Emerging Markets — INDA
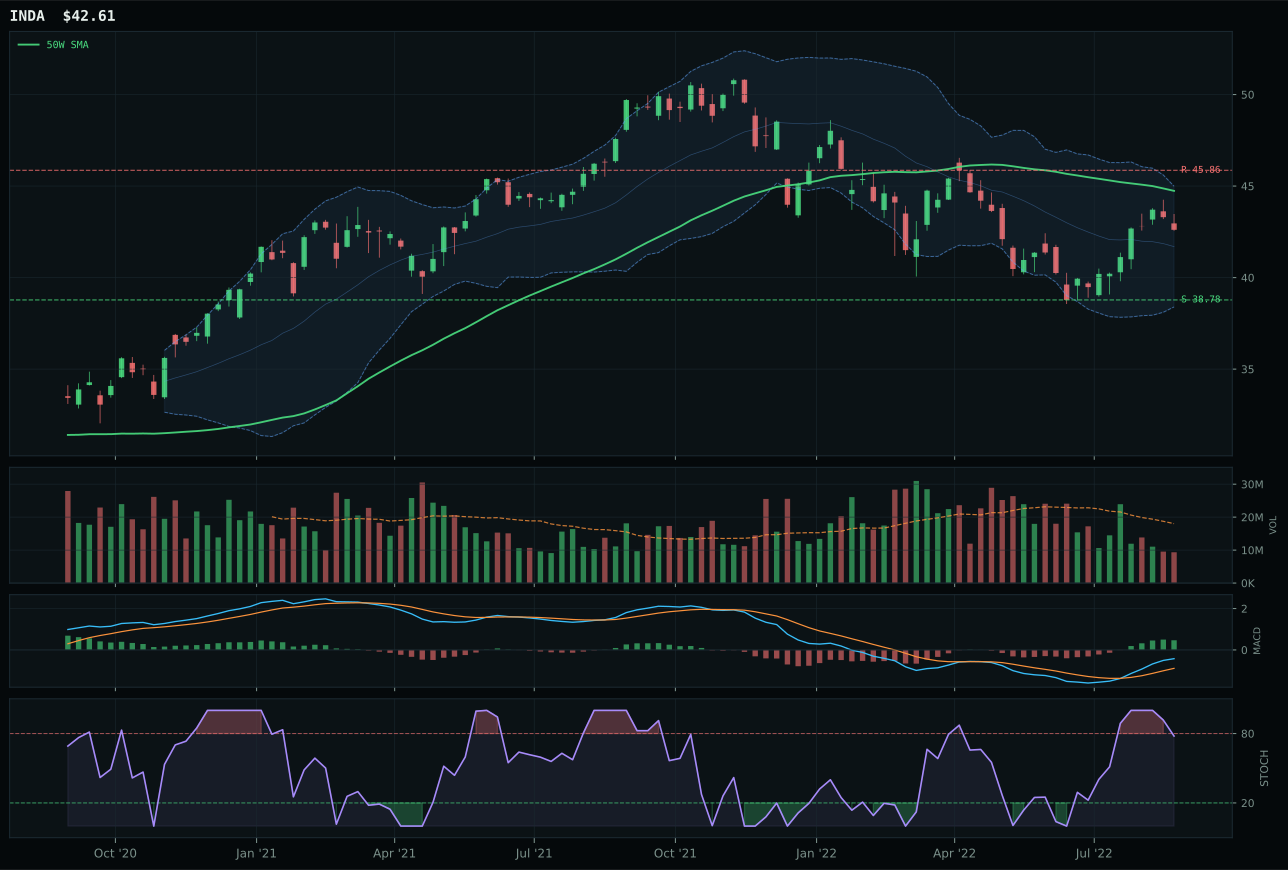
INDA has a neutral structure profile with 5.4% 13-week relative strength versus SPY.
A failed hold above support would weaken the setup.
Actionable but governed by invalidation levels.
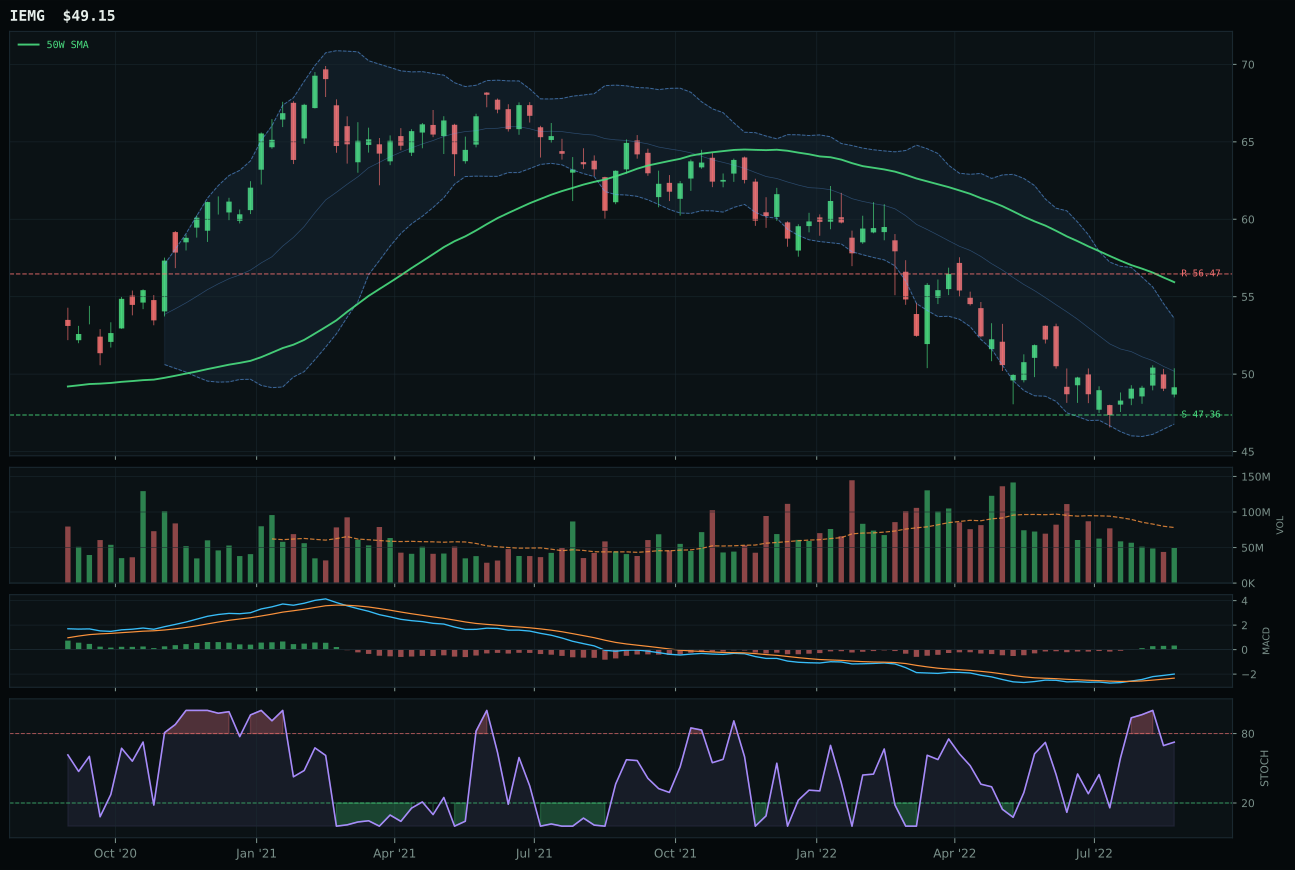
IEMG has a pullback into support profile with -2.8% 13-week relative strength versus SPY.
A failed hold above support would weaken the setup.
Actionable but governed by invalidation levels.
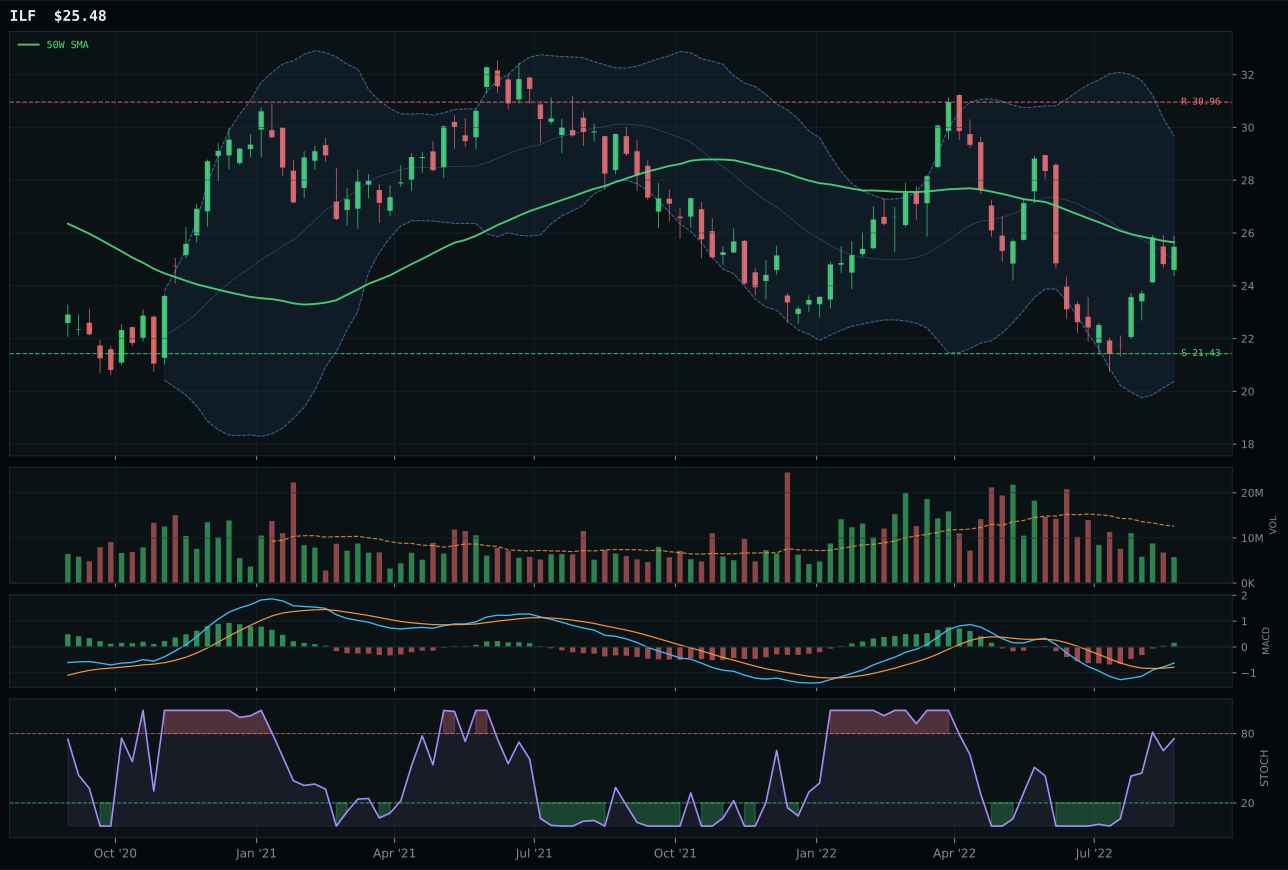
ILF has a compression near 50W profile with -9.2% 13-week relative strength versus SPY.
Extension and support failure are the main tactical risks.
Tracked, but not top-2 eligible because: structurally broken.
INDA wins Emerging Markets with a 76.0 composite over IEMG's 66.0 by combining superior timing (97.0 vs 65.0), better structure (73.4 vs 72.7 neutral), and category-relative strength that stands out (8.3% vs 0.0%). Price compression at 85.1 and pullback into support near 38.78 set up a coil, but the real story is INDA's 5.4% SPY-relative strength and MACD bullish-and-improving in a category that is drowning in macro headwinds. IEMG's -2.8% SPY-relative strength confirms broad emerging-market weakness; INDA's India quality-growth thesis separates it as a geographic alpha story. Stochastic RSI falling/neutral (0.78 for INDA) versus falling/neutral (same for IEMG) matches, but INDA's 81.0 momentum confirmation versus IEMG's 48.0 shows only INDA has real institutional sponsorship.
Emerging Markets earns 0% allocation this week, ranking 9th or 10th, because the macro fit is just 7.0—the lowest category-level macro fit in this week's entire portfolio. Dollar pressure (-14), credit stress (-10), liquidity stress (-10), and broad market bear (-9) form a perfect storm that excludes all emerging-market exposure. INDA's 79.7 technical evidence is genuinely strong and its 35.0 macro/narrative fit is respectable for an EM name, but the category-level macro fit of 7.0 overrides individual ETF strength. In a disinflation regime with dollar strength and credit stress active, capital flows out of emerging markets and into safe havens—the opposite of what this category needs. INDA would need to post a 40+ category score on its own technical merit (it is 8.7), or the macro regime would need to decisively turn (dollar weakness, credit recovery, risk appetite restoration). For now, Emerging Markets is the portfolio's exclusion: technically interesting (INDA's timing is excellent), but macro hostile (currency headwinds, risk-off rotation). This allocation will reset to 5% or higher only when dollar pressure lifts or credit stress reverses—neither is happening this week.