
2022-08-19
Informational purposes only. The content in this report, including allocations, analysis, and commentary, is provided solely for informational and educational purposes. It does not constitute financial advice, investment advice, trading advice, or any other type of advice. Past performance does not guarantee future results. Always conduct your own research and consult a qualified financial professional before making investment decisions.
GLD defensive overlay excluded: price is below its 8W SMA. Cause selector will use cash alternative.
Macro risk engine requires the 50% Defensive overlay for this run; payload selected by cause: Transition Defense.
Weekly Allocation
| Ticker | Category | Weight | Role |
|---|---|---|---|
| SGOV | 20% | Overlay | |
| GLD | Precious Metals | 25% | Overlay |
| XLU | Utilities & Infrastructure | 25% | Overlay |
| XAR | Defense & Aerospace | 5% | Tier-2 (5%) |
| XLK | Technology | 5% | Tier-2 (5%) |
| URA | Nuclear Energy | 5% | Tier-2 (5%) |
| SMH | AI | 5% | Tier-2 (5%) |
| XOP | Traditional Energy | 5% | Tier-2 (5%) |
| REMX | Industrial Metals | 5% | Tier-2 (5%) |
Trade Instructions — Monday Open
Sell the tranche from 2022-07-22 (completing its 4-week hold). Buy the new tranche. Instructions show net portfolio changes — same-asset positions cancel, weight changes show the delta.
| Action | Ticker | Instruction |
|---|---|---|
| SELL | PAVE | Sell 33% of PAVE position (reduce 15.00% → 10.00%) |
| SELL | XLK | Sell 25% of XLK position (reduce 15.00% → 11.25%) |
| SELL | XAR | Sell 10% of XAR position (reduce 12.50% → 11.25%) |
| SELL | SMH | Sell 17% of SMH position (reduce 7.50% → 6.25%) |
| SELL | URNM | Sell 25% of URNM position (reduce 10.00% → 7.50%) |
| SELL | XLE | Sell entire XLE position (2.50% of portfolio) |
| SELL | MOO | Sell 33% of MOO position (reduce 7.50% → 5.00%) |
| BUY | GLD | Buy GLD — 20.00% of freed cash (adds 3.75% to portfolio) |
| BUY | XLU | Buy XLU — 33.33% of freed cash (adds 6.25% to portfolio) |
| BUY | REMX | Buy REMX — 6.67% of freed cash (adds 1.25% to portfolio) |
| BUY | SGOV | Buy SGOV — 26.67% of freed cash (adds 5.00% to portfolio) |
| BUY | URA | Buy URA — 6.67% of freed cash (adds 1.25% to portfolio) |
| BUY | XOP | Buy XOP — 6.67% of freed cash (adds 1.25% to portfolio) |
Current Portfolio After Trade
Combined holdings across all 4 active tranches. Each tranche is 25% of the portfolio.
| Ticker | % of Portfolio | Weight Bar |
|---|---|---|
| XLK | 11.25% | |
| XAR | 11.25% | |
| XLU | 11.25% | |
| PAVE | 10.00% | |
| URNM | 7.50% | |
| SMH | 6.25% | |
| GLD | 6.25% | |
| MOO | 5.00% | |
| GDX | 5.00% | |
| SGOV | 5.00% | |
| REMX | 3.75% | |
| FCG | 2.50% | |
| COPX | 2.50% | |
| INDA | 2.50% | |
| IGV | 2.50% | |
| SLV | 2.50% | |
| BOTZ | 2.50% | |
| URA | 1.25% | |
| XOP | 1.25% |
Macro Regime — Disinflation
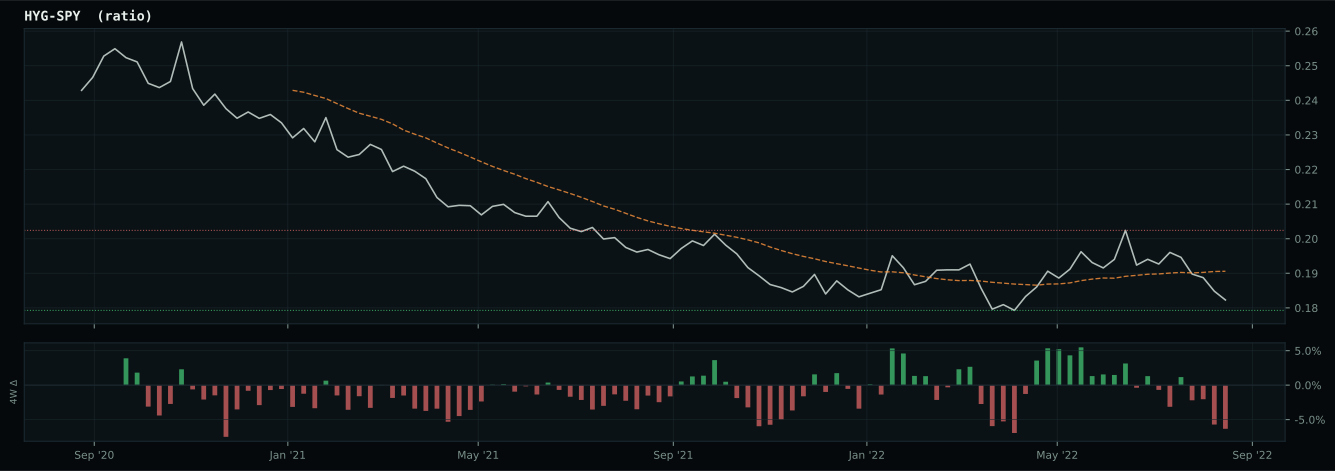
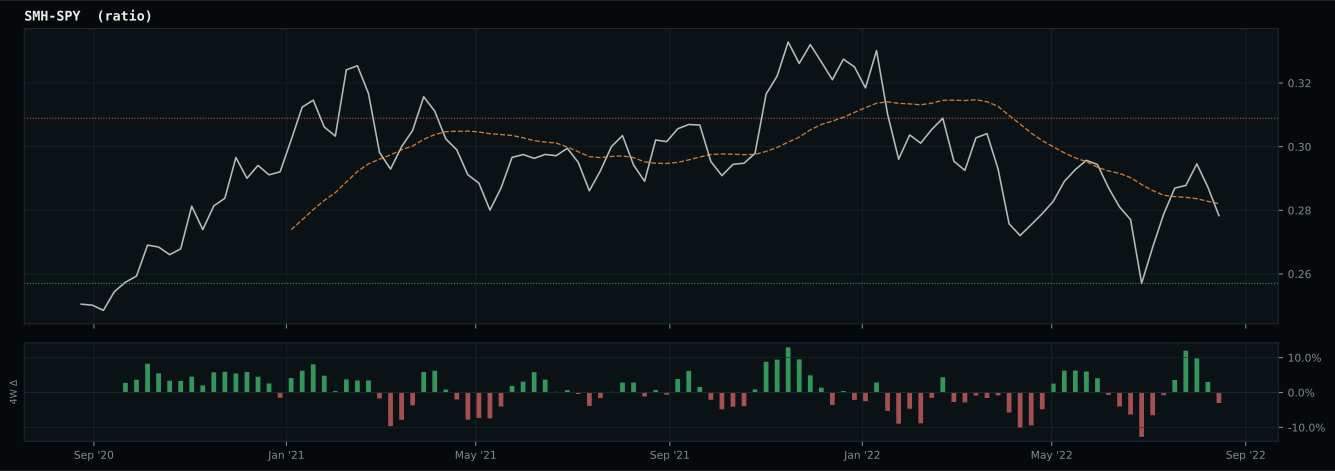
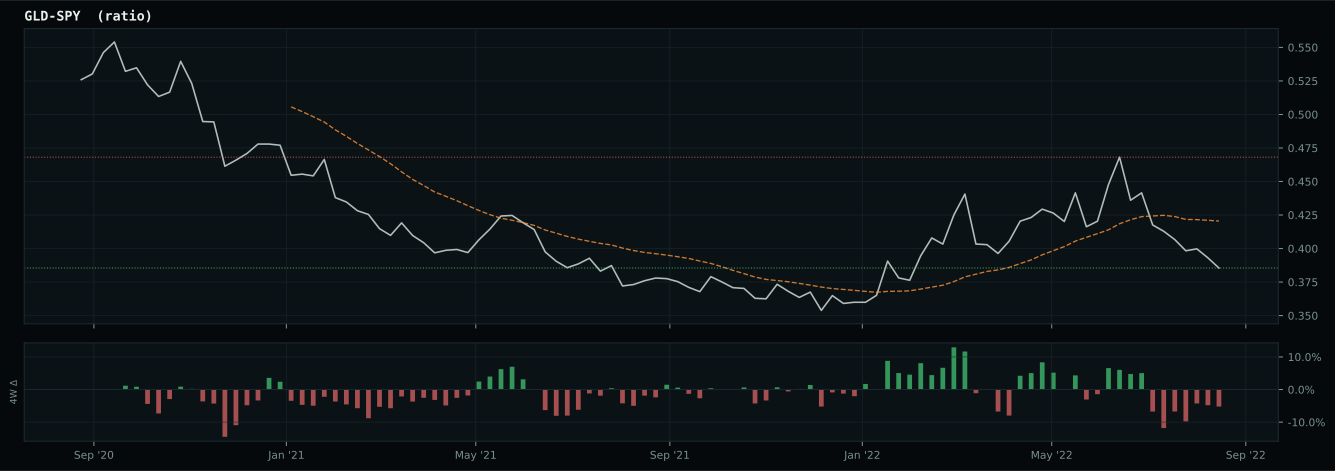
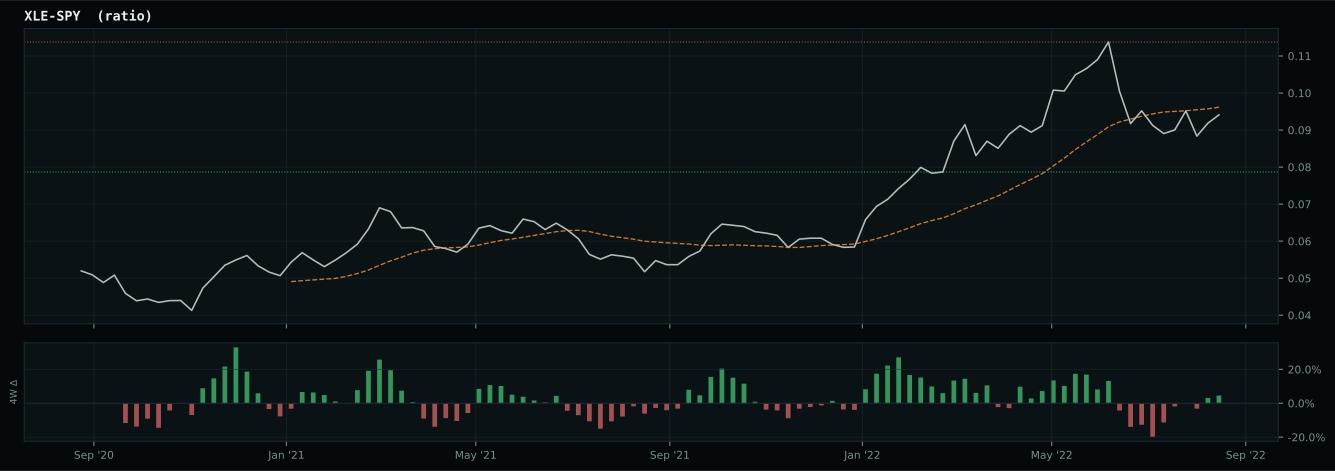
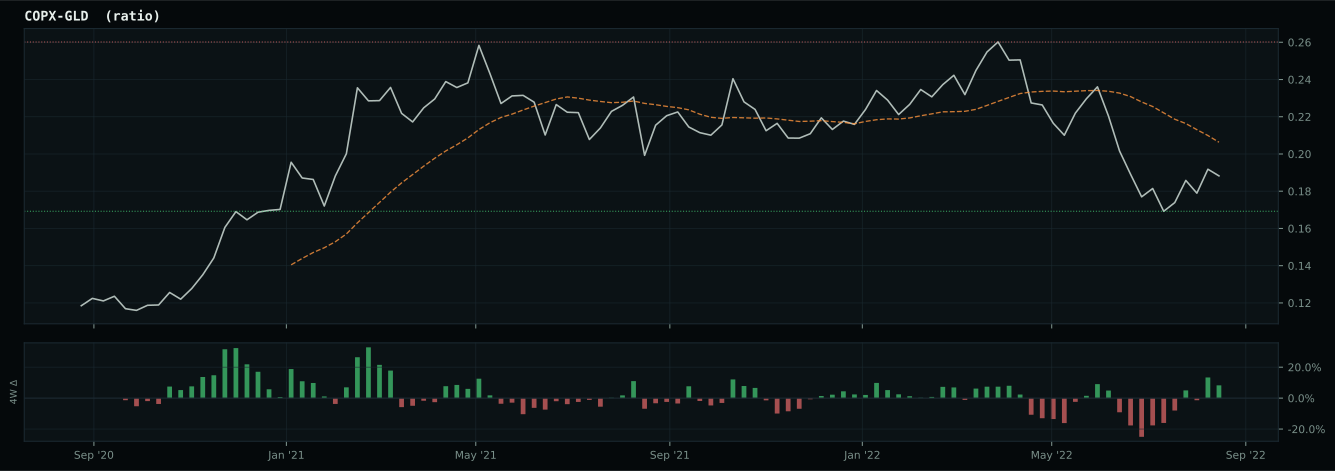
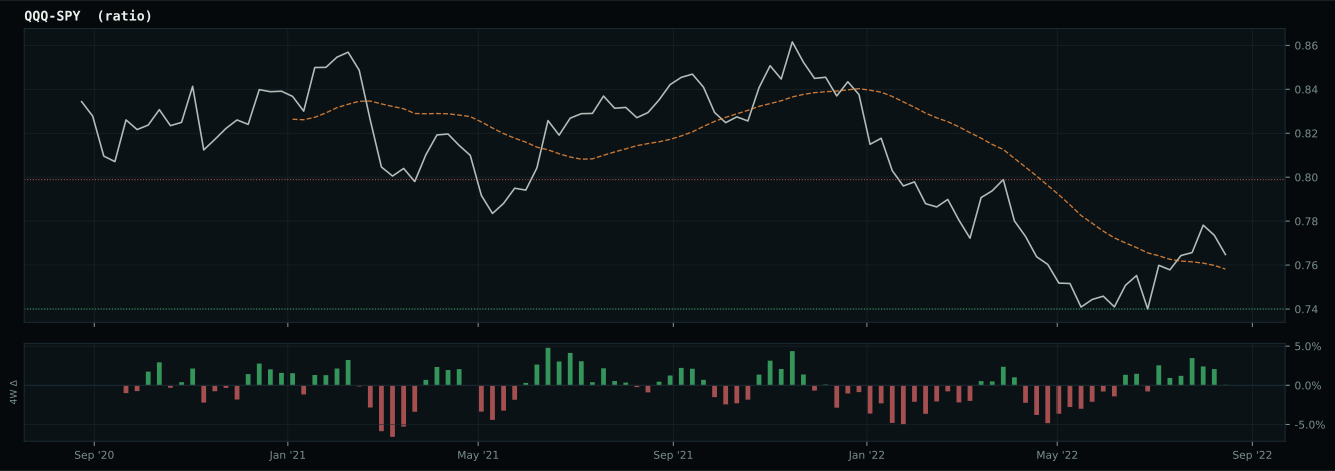
growth data is not confirming the weak market-implied risk appetite signal
Defensive overlay cause is not singular enough to concentrate: the sleeve diversifies across liquidity, monetary defense, and defensive equity exposure while the market resolves the next regime.
Macro Evidence Charts
Market-implied signals behind the macro regime scores. Each ratio compares two assets; the direction and slope of the ratio is what the macro engine reads.
Crypto Regime — NoCrypto
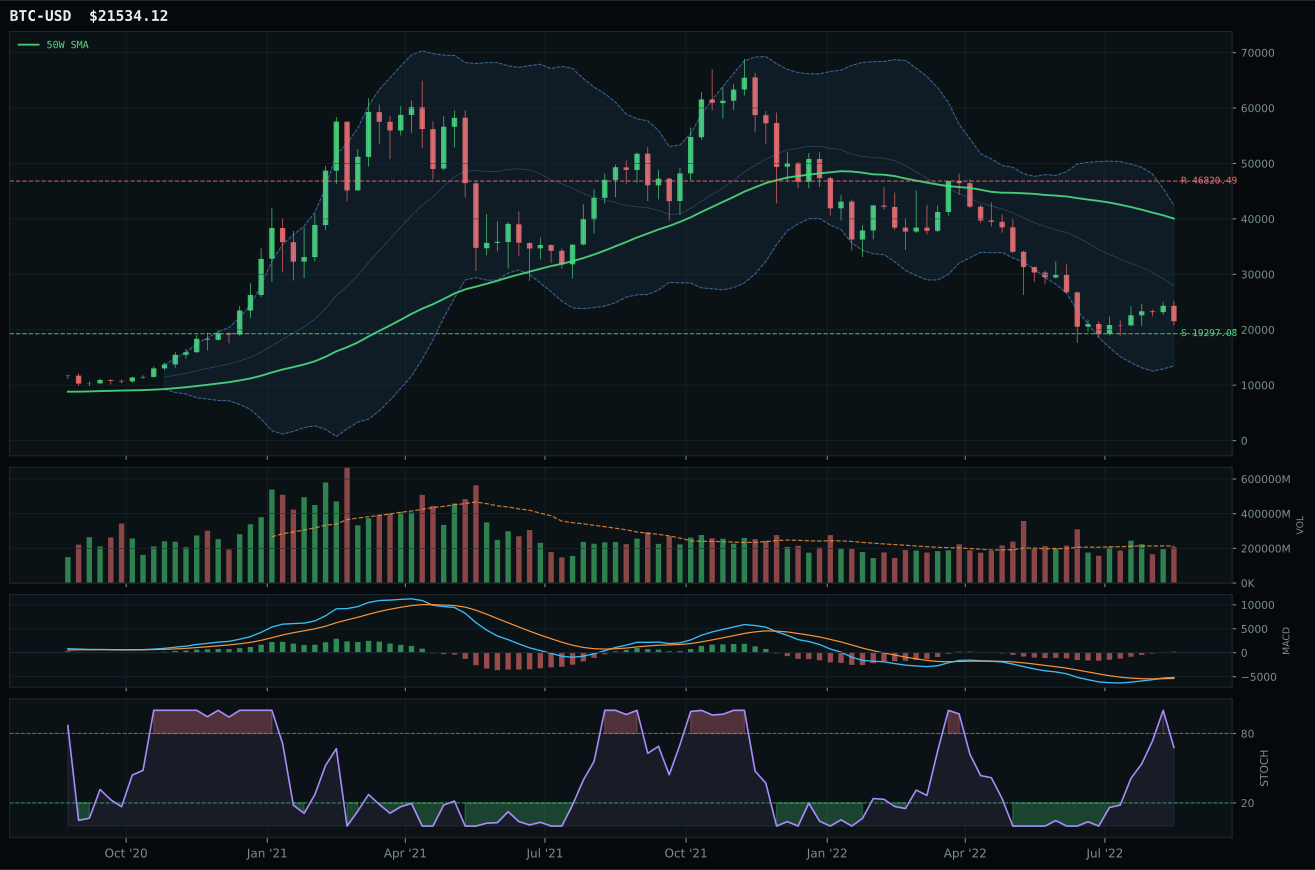
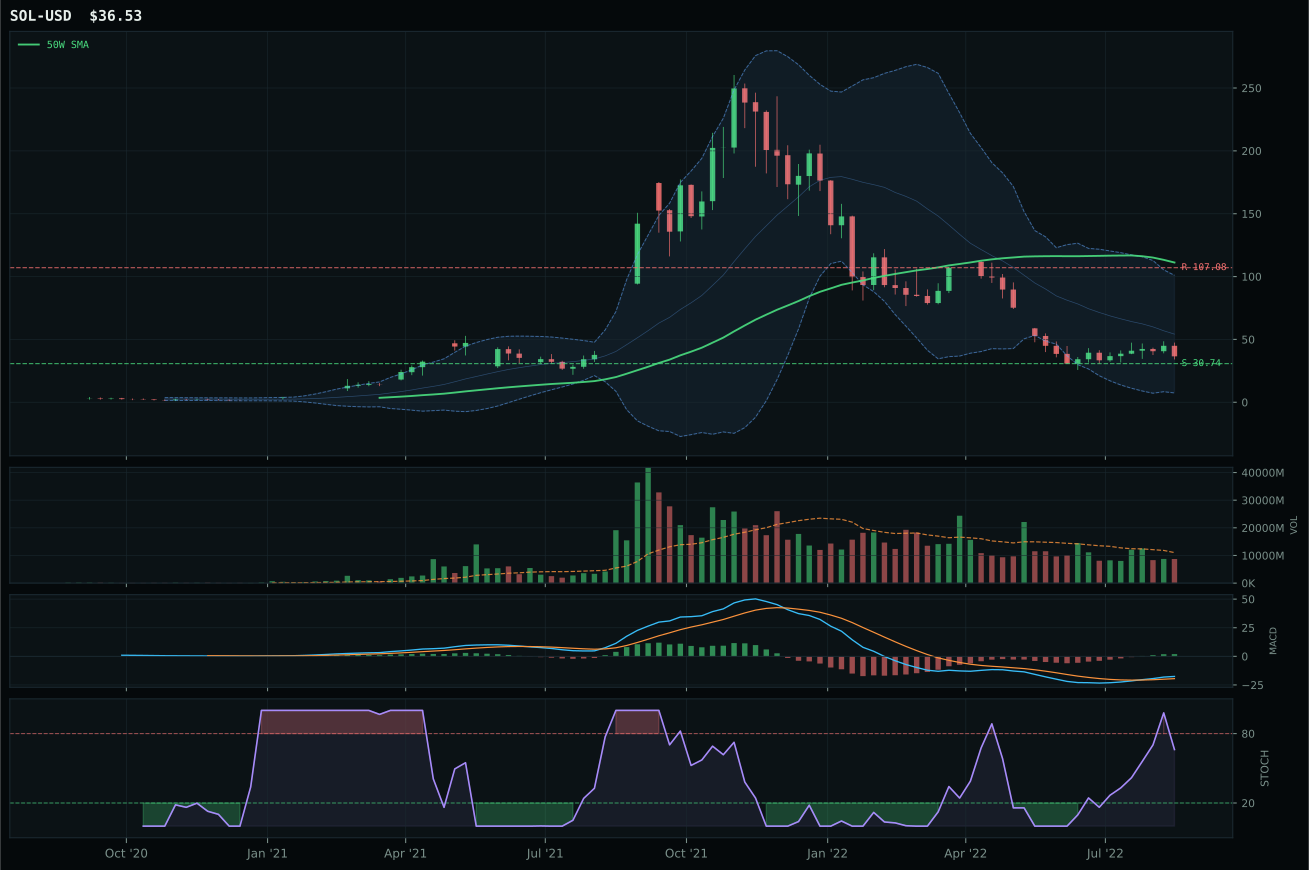
ValueBTC armed by first 200W buy-zone touch, but post-touch range age is 9 weeks; minimum is 12
TrendBTC not confirmed
one or more available conditions failed
Category Rankings
| Rank | Category | Winner | Score | Alloc | 4W Ret | Peers (4W) |
|---|---|---|---|---|---|---|
| 1 | Utilities & Infrastructure | XLU | 69.0 | 20% | -4.64% | PAVE -9.1% · IGF -5.3% |
| 2 | Precious Metals | GLD | 53.4 | 20% | -4.20% | SLV +1.4% · GDX -5.4% |
| 3 | Defense & Aerospace | XAR | 49.8 | 10% | -9.53% | ITA -7.5% · ROKT -7.3% |
| 4 | Technology | XLK | 37.1 | 10% | -12.99% | IGV -11.4% · CIBR -8.5% |
| 5 | Nuclear Energy | URA | 33.4 | 10% | +9.37% | URNM +15.3% · NLR -0.7% |
| 6 | AI | SMH | 20.6 | 10% | -12.63% | BOTZ -12.4% · AIQ -9.3% |
| 7 | Traditional Energy | XOP | 20.4 | 10% | -7.05% | FCG -4.0% · XLE -4.2% |
| 8 | Industrial Metals | REMX | 12.0 | 10% | -4.09% | PICK -5.0% · COPX -2.8% |
| 9 | Agriculture & Livestock | MOO | 11.3 | 0% | -4.97% | VEGI -4.5% · WEAT +8.4% |
| 10 | Emerging Markets | INDA | 4.1 | 0% | +0.74% | IEMG -5.2% · ILF -1.5% |
Utilities & Infrastructure — XLU
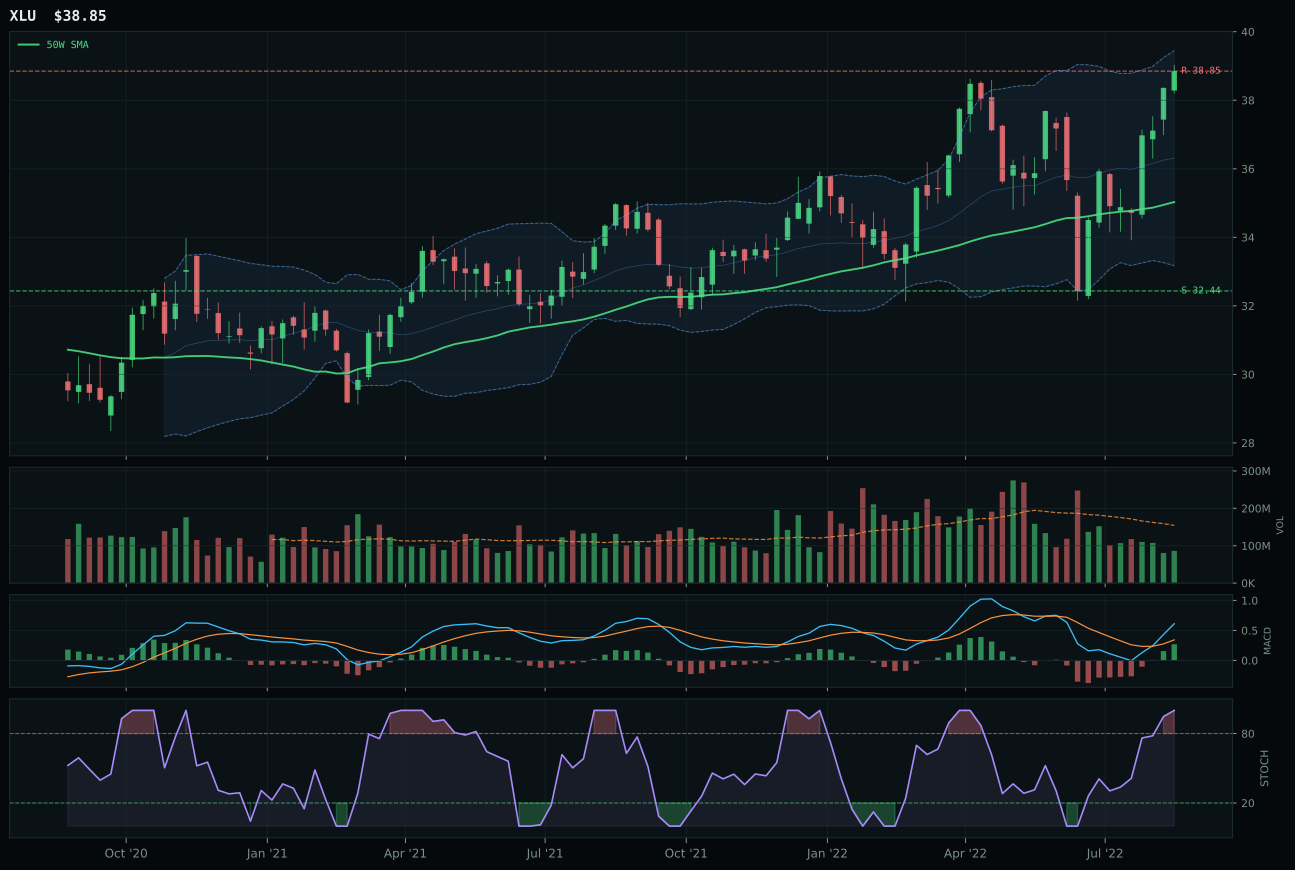
XLU has a neutral structure profile with -0.0% 13-week relative strength versus SPY.
A failed hold above support would weaken the setup.
Actionable but governed by invalidation levels.
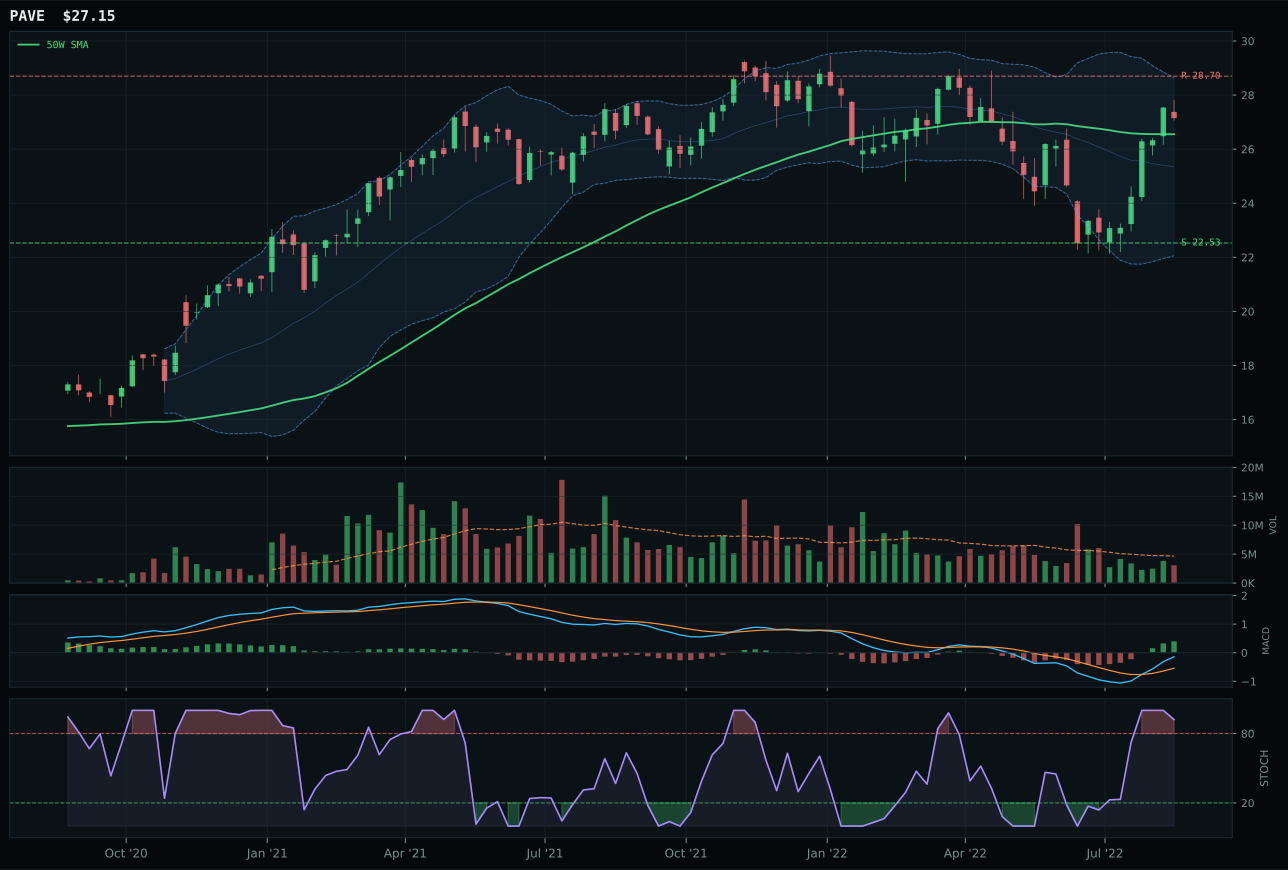
PAVE has a compression near 50W profile with 2.7% 13-week relative strength versus SPY.
A failed hold above support would weaken the setup.
Actionable but governed by invalidation levels.
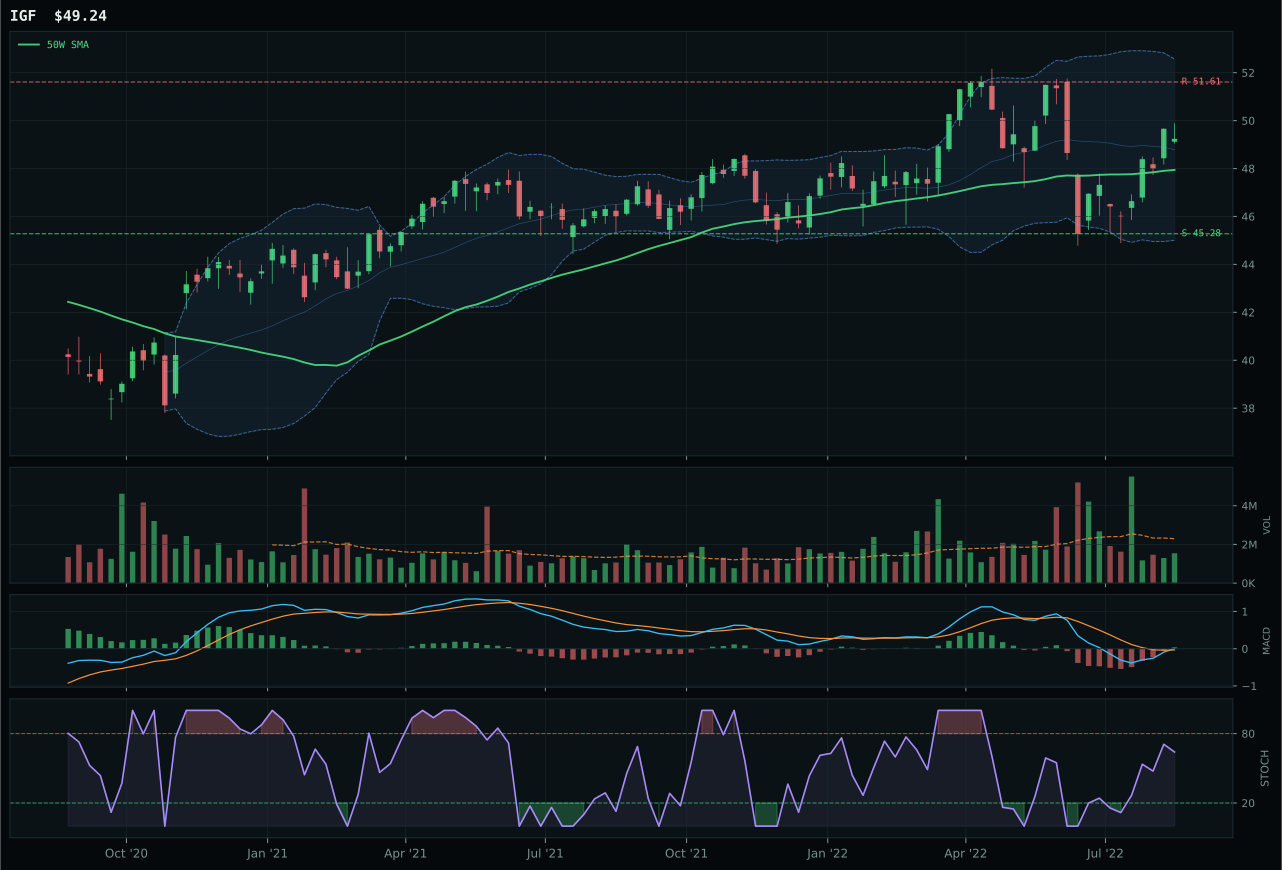
IGF has a compression near 50W profile with -9.4% 13-week relative strength versus SPY.
A failed hold above support would weaken the setup.
Actionable but governed by invalidation levels.
XLU wins Utilities & Infrastructure decisively on a 7.2-point margin over PAVE by owning the perfect defensive positioning in a bear market: a 100.0 trend score from price above the 50-week and 200-week with non-deteriorating slope, and category-relative strength at dead 0.0% (meaning it is tied for category leadership, not lagging). XLU sits 10.9% above the 50-week in the near 52-week high extension zone, MACD is bullish and improving, and stochastic RSI is overbought momentum at 1.00—this is a leader, not a laggard. Structure is neutral at 69.4/100; risk/reward is weak at 44.3/100 because upside to resistance is 0.0% (XLU is already at all-time highs in the compression zone). PAVE has better absolute momentum at 11.1% thirteen-week return versus XLU's 8.3%, and better structure at compression near the 50-week, but XLU's pure trend score dominates because price is above the moving average and slope is clean. Regulated utilities own the defensive narrative better than infrastructure capex.
Utilities & Infrastructure earns 10% as a top-2 overweight because the category scored 69.0, placing it among the two highest-ranked exposures. Macro fit is strong at 80.0/100: defensive rotation is active at plus-12, disinflation helps at plus-7, disinflation pressure is active at plus-6, and broad market bear is active at plus-4. This is the regime where utilities work—disinflation lowers discount rates, risk appetite is broken so capital migrates to stability, and defensive yield is the only game in town. XLU's 68.6 technical evidence and 72.0 macro fit produce a 70.9 reasoned ETF score. The 10% allocation reflects conviction that in disinflation with broken risk appetite, regulated utility dividend yield and duration protection are the most rational capital allocation. Yes, XLU is already extended at the 52-week high with zero upside to resistance and thin volume participation at 0.56x the 20-week; that is the bear market premium. Hold this 10% as the second pillar of portfolio defense alongside GLD's monetary hedge.
Precious Metals — GLD
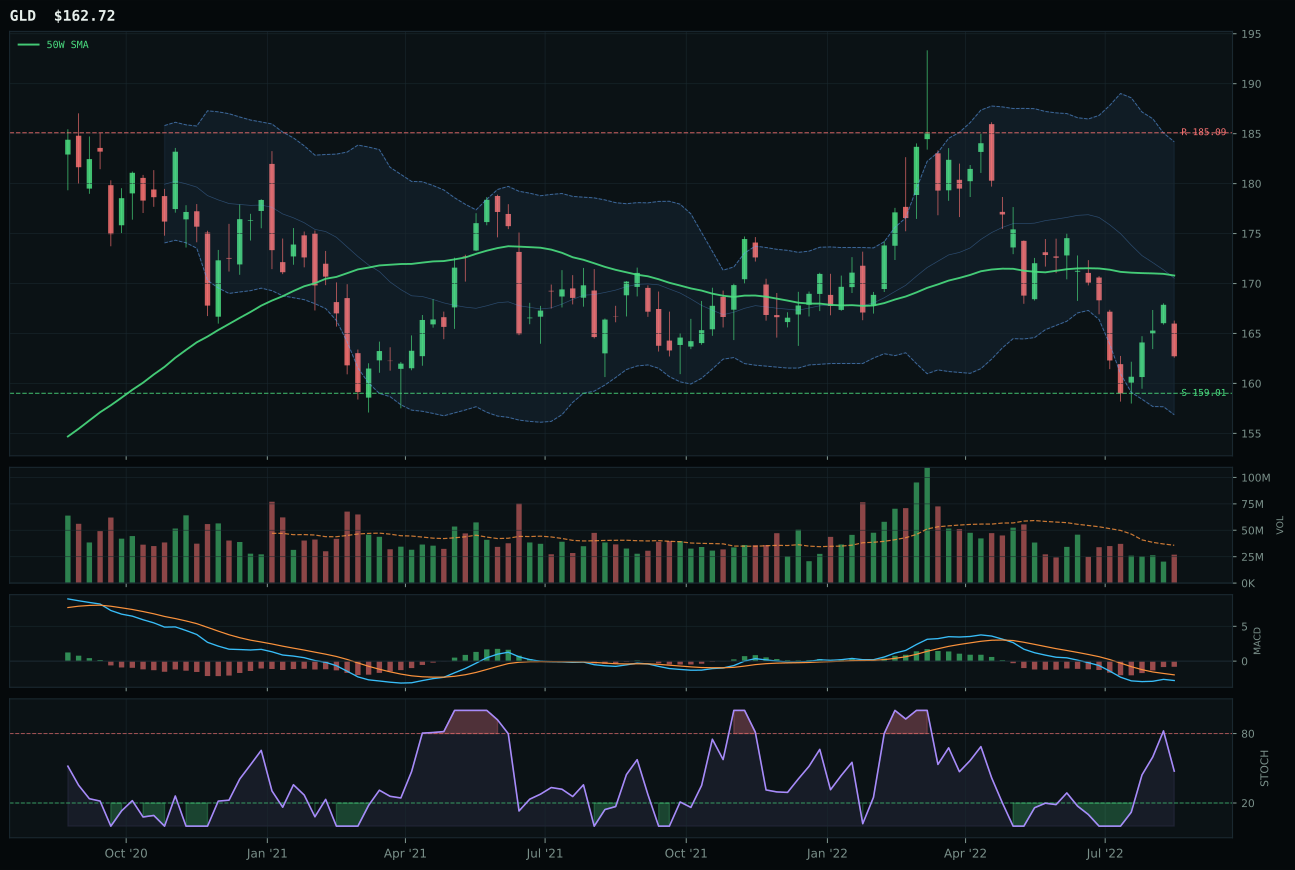
GLD has a pullback into support profile with -13.8% 13-week relative strength versus SPY.
A failed hold above support would weaken the setup.
Actionable but governed by invalidation levels.
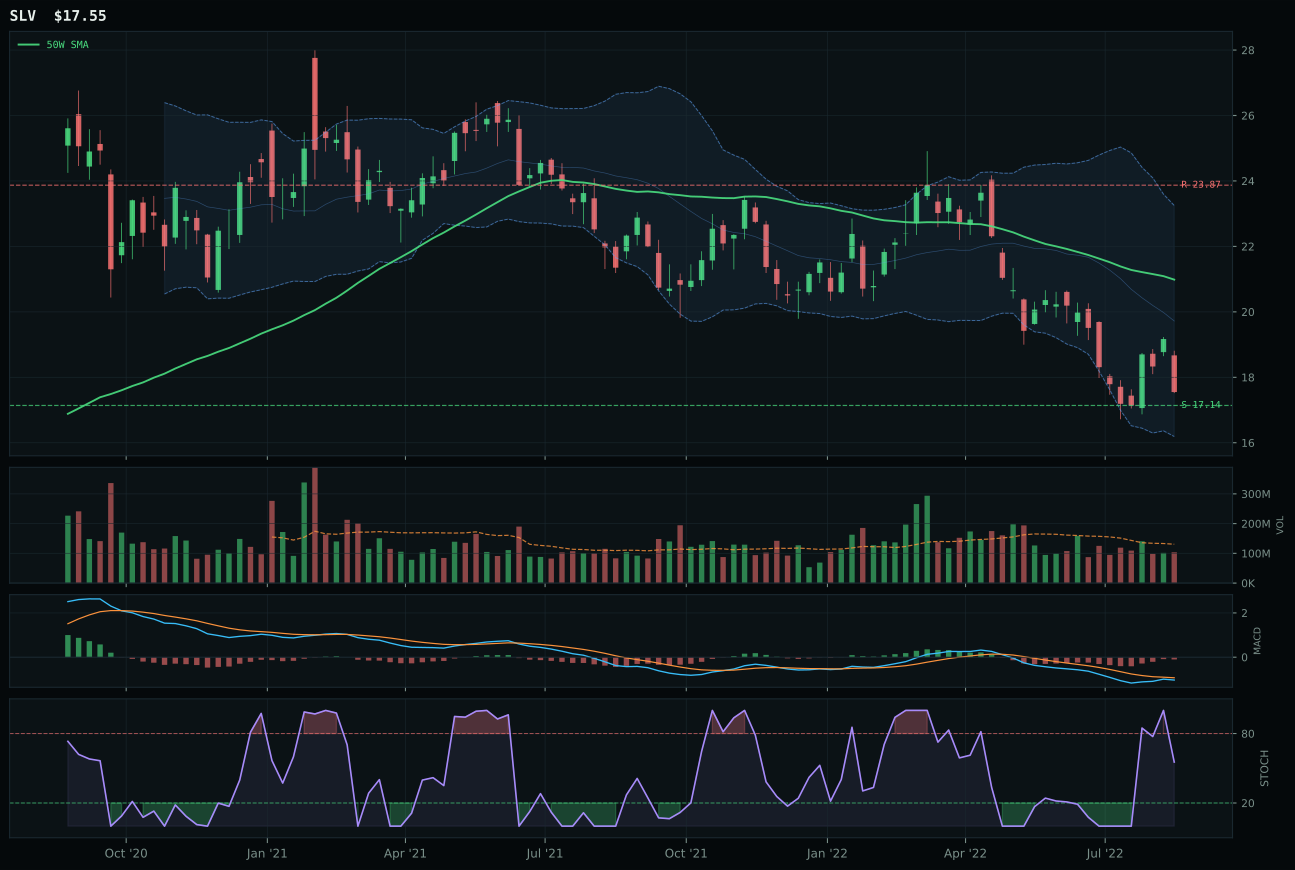
SLV has a pullback into support profile with -20.9% 13-week relative strength versus SPY.
A failed hold above support would weaken the setup.
Actionable but governed by invalidation levels.
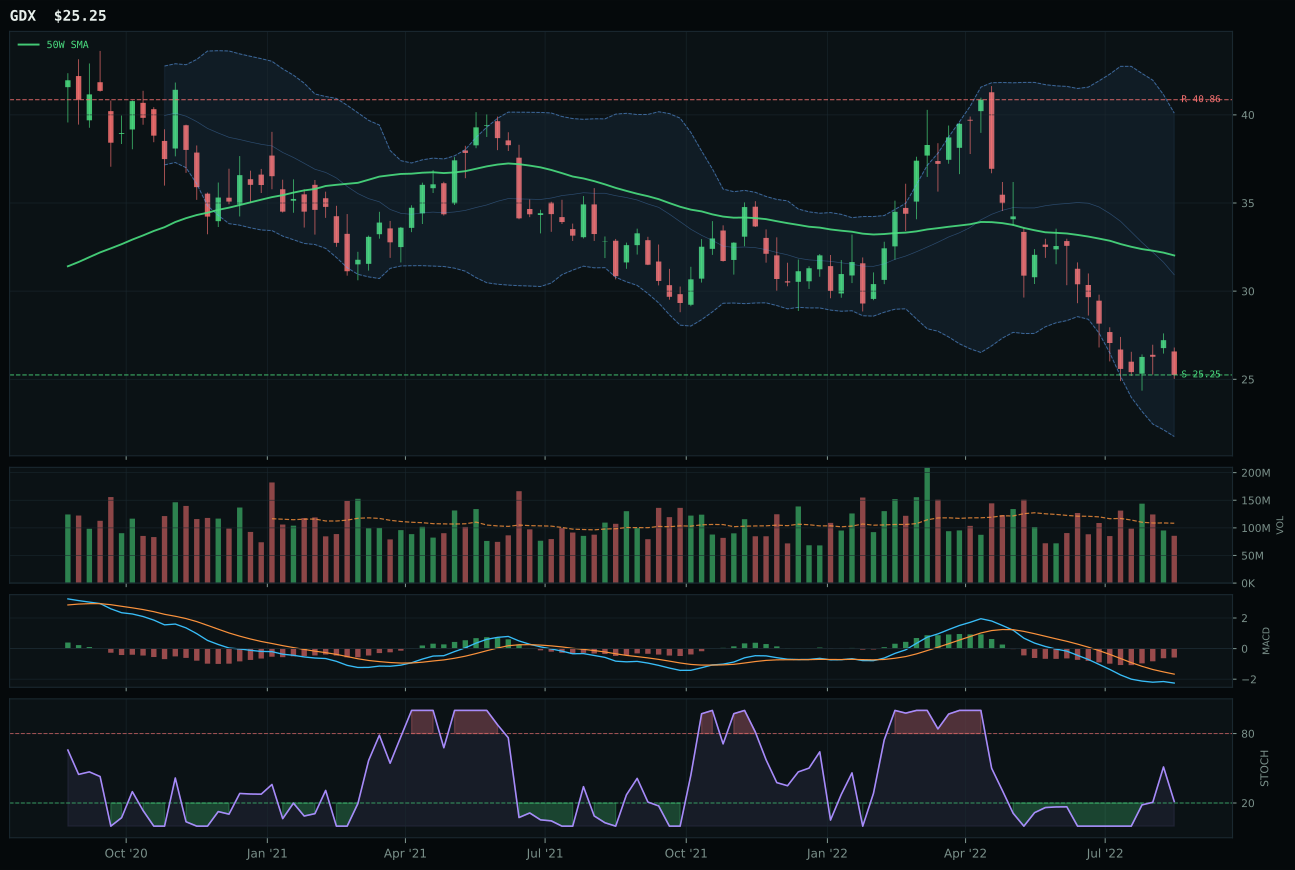
GDX has a pullback into support profile with -29.6% 13-week relative strength versus SPY.
A failed hold above support would weaken the setup.
Actionable but governed by invalidation levels.
GLD wins Precious Metals with a commanding 15.8-point lead over SLV because gold owns the timing and risk/reward architecture that favors defensive accumulation in a disinflation bear. GLD sits 4.7% below the 50-week moving average pulling into defined support at 159.01, MACD is bearish but improving (the critical setup signal), and stochastic RSI is rising mid-zone at 0.48—this is the chart of something being accumulated before the turn. The 100.0 timing score is earned on perfect distance, MACD trajectory, and Fibonacci position near the 52-week low repair zone. SLV's timing is only 65.0 because stochastic RSI is falling/neutral, meaning silver momentum is fading while gold momentum is building. The 90.0 risk/reward score on GLD reflects a 2.3% cushion to support with 12.1% upside to resistance—asymmetry favors the downside-protected position. SLV lacks that discipline with falling stochastic; it's a technical coin flip where GLD is a structured accumulation.
Precious Metals earns 10% as a top-2 overweight because the category scored 53.4, placing it among the two highest-ranked exposures in the portfolio. The macro case is crushing: category-level macro fit is 88.0/100, driven by the monetary hedge bid at plus-14, defensive rotation at plus-7, disinflation pressure at plus-6, and disinflation helping at plus-8. This is the regime where gold works—liquidity stress and credit stress are real, risk appetite is broken, and central banks are stepping back from rate hikes. GLD's 80.0 macro fit and 58.8 technical evidence combine to 66.4 reasoned ETF score, making it the clear category winner. The 10% allocation reflects conviction that gold is the cleanest monetary hedge in a disinflation bear, and GLD's pullback into support with rising stochastic is the entry point to that thesis. Every dollar earned by the portfolio's other positions is best hedged here.
Defense & Aerospace — XAR
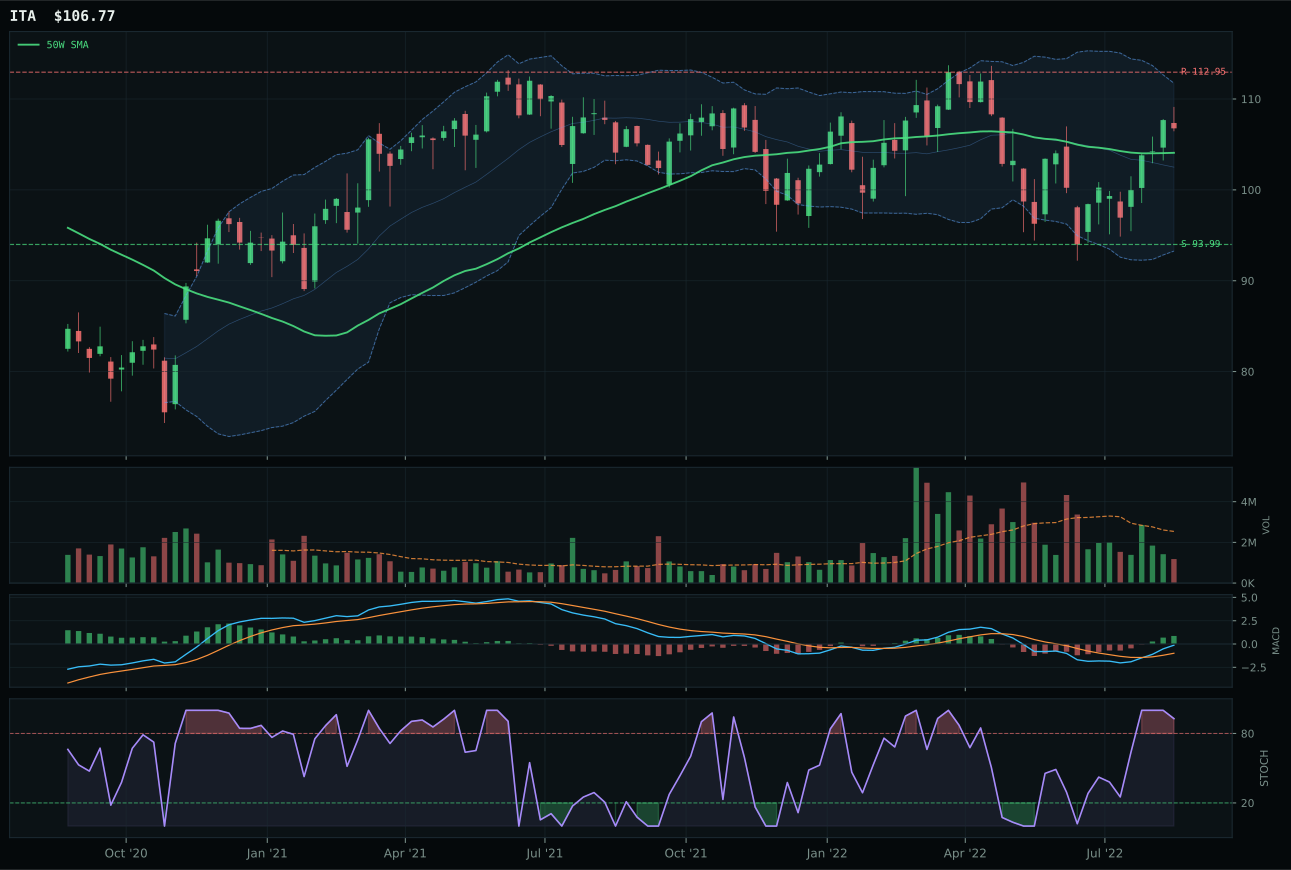
ITA has a compression near 50W profile with 2.6% 13-week relative strength versus SPY.
A failed hold above support would weaken the setup.
Actionable but governed by invalidation levels.
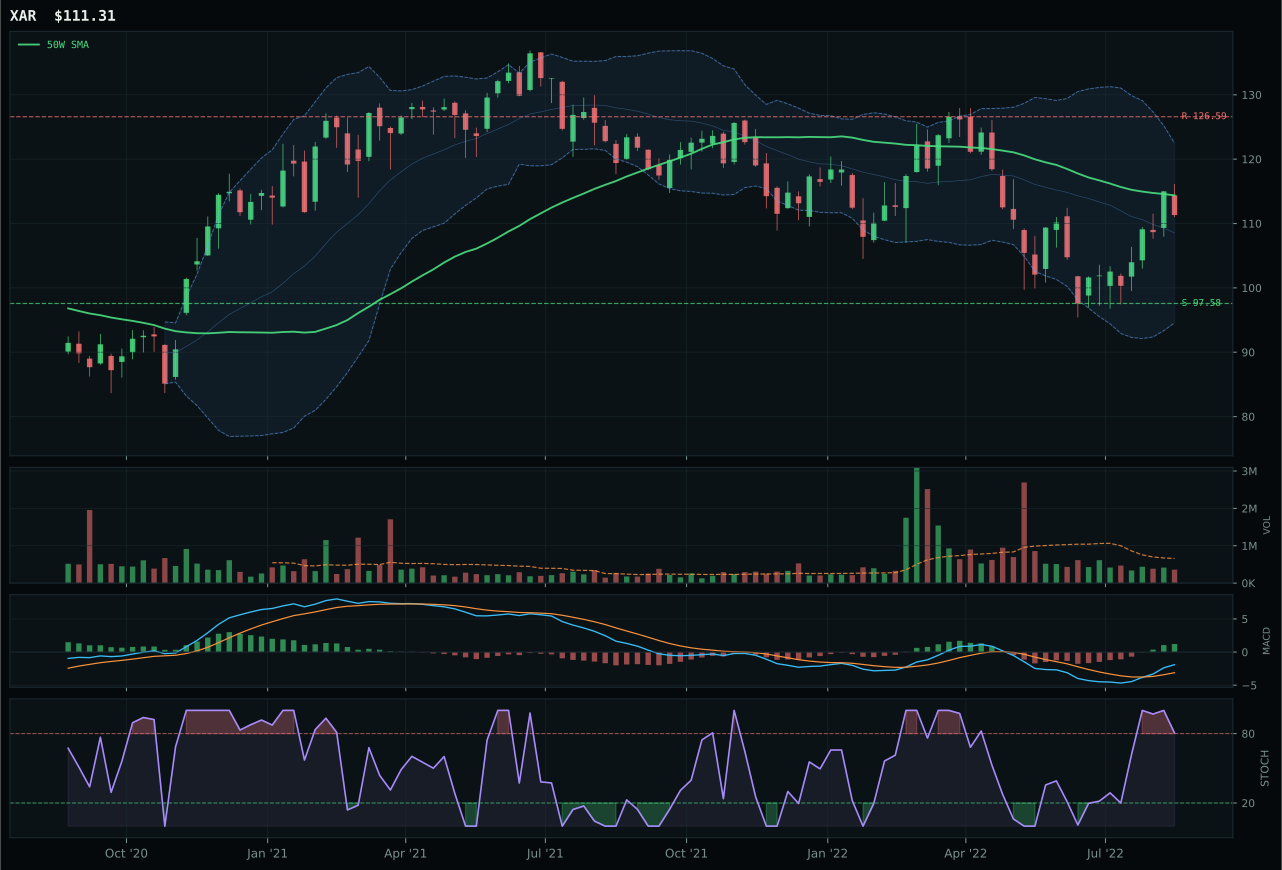
XAR has a compression near 50W profile with 0.7% 13-week relative strength versus SPY.
A failed hold above support would weaken the setup.
Actionable but governed by invalidation levels.
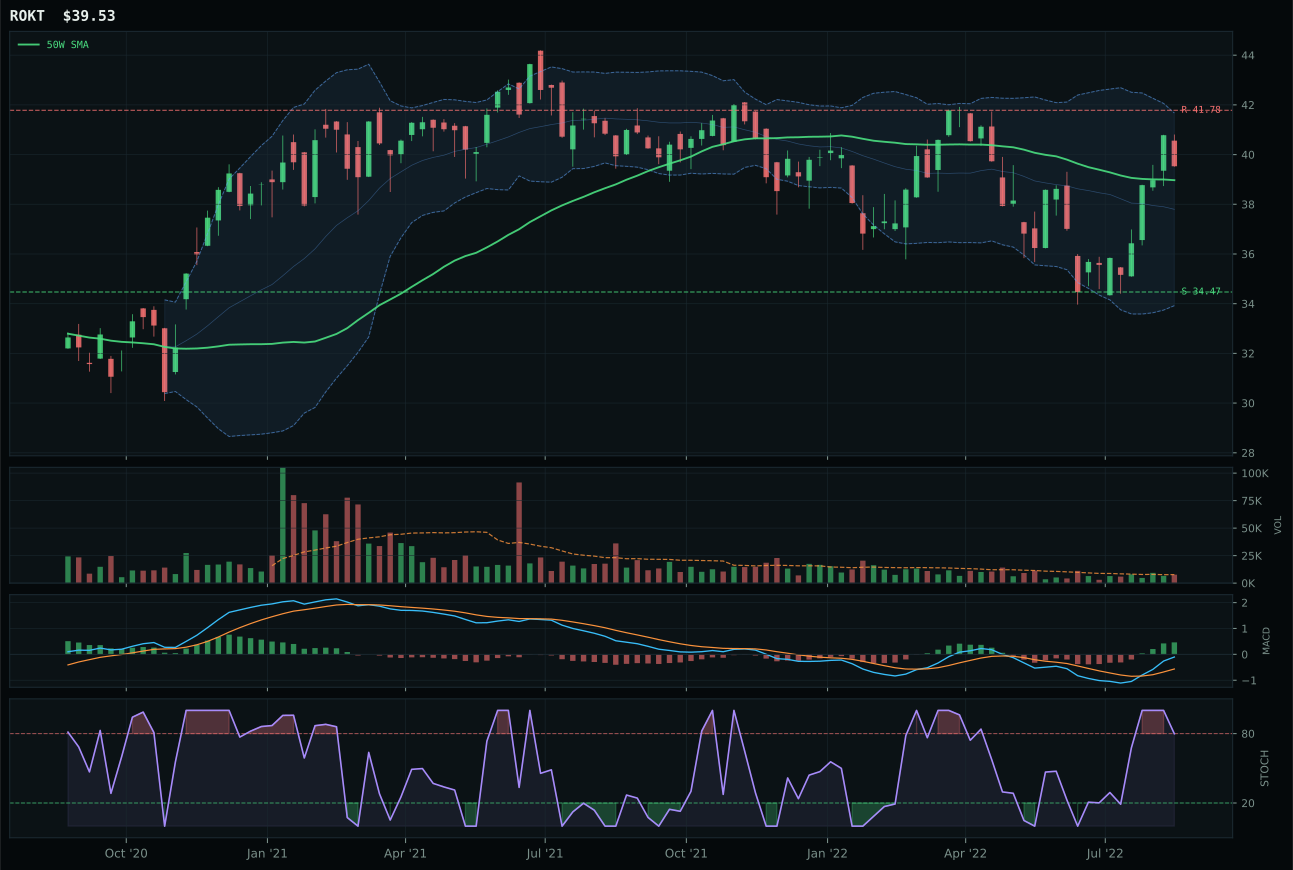
ROKT has a compression near 50W profile with 0.7% 13-week relative strength versus SPY.
A failed hold above support would weaken the setup.
Tracked, but not top-2 eligible because: .
XAR wins with a 19.8-point edge over ITA despite ITA's superior 100.0 trend score because XAR owns the better timing geometry at the technical inflection point. ITA is stretched 2.6% above the 50-week moving average in the upper retracement zone, which penalizes its risk/reward to 52.2; XAR is positioned exactly where a reset should hold, 2.7% below the 50-week, with MACD bullish and improving and stochastic RSI overbought rolling over at 0.80. That one-click separation in distance from moving average drives XAR's timing to 89.0 versus ITA's 82.0, and the risk/reward explodes in XAR's favor at 68.4 versus ITA's 52.2. Both have compression near the 50-week and identical 9.1% and 10.9% thirteen-week returns respectively, but XAR's pullback setup with defined support at 97.58 gives buyers a clear invalidation level that ITA, already extended, cannot offer.
Defense & Aerospace earns 5% allocation at tier-2 because the category scored 49.8, just outside top-2 territory. What's remarkable is the macro fit at 66.0/100—defensive rotation is active at plus-8, broad market bear is active at plus-6, and disinflation is helping at plus-3. This is the only category where macro is actually favorable, yet it didn't make top-2 because technical ETF evidence is only 49.5/100 at the representative level. XAR's volume-price confirmation is weak at 35.8, meaning the setup looks good on the chart but actual accumulation is not being sponsored by participation. Defensive equities are in favor tactically, but the category needs to see ITA and XAR both migrate above their 50-week moving averages with volume expansion to genuinely compete for top-2 capital. For now, hold this 5% position as tactical defense into disinflation.
Technology — XLK
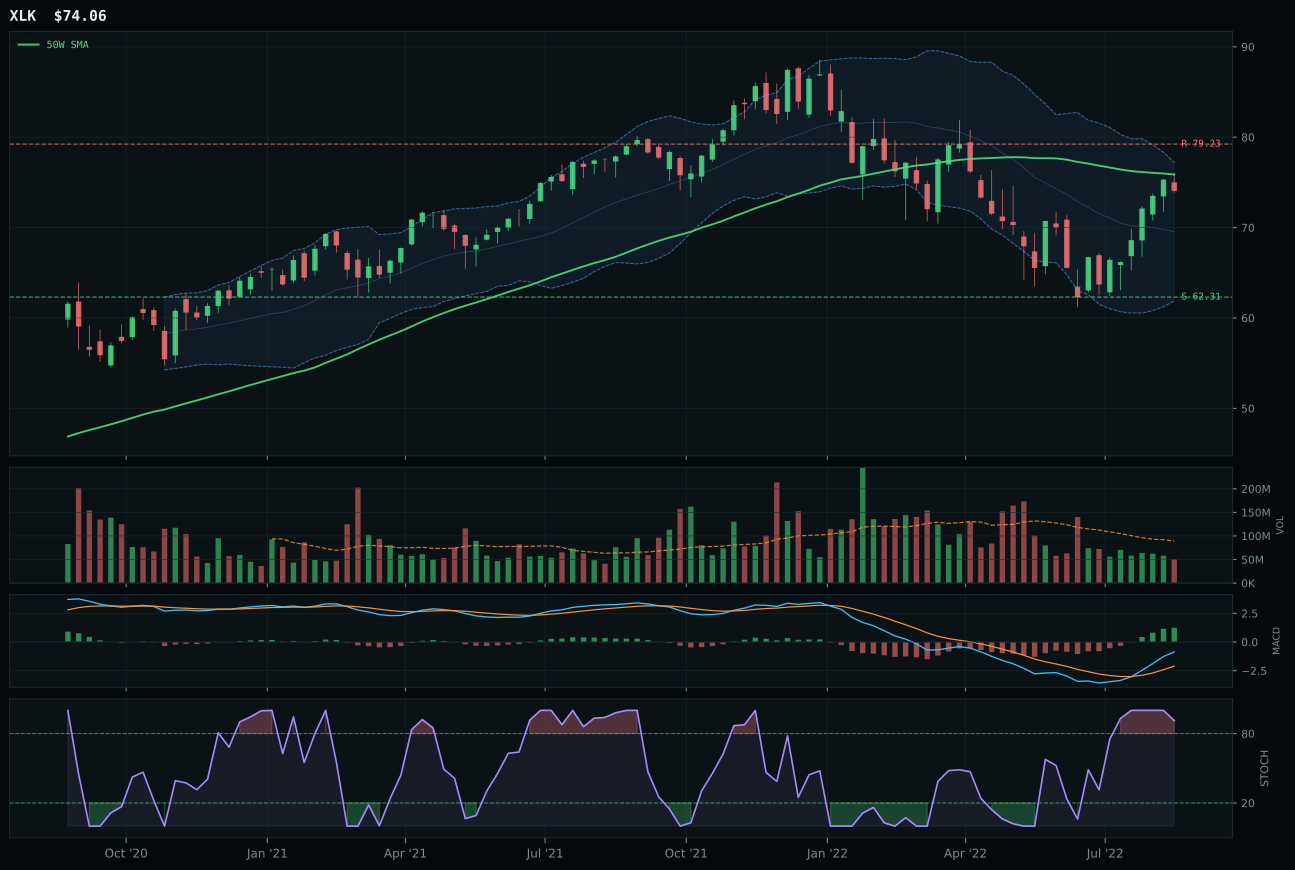
XLK has a compression near 50W profile with 4.7% 13-week relative strength versus SPY.
A failed hold above support would weaken the setup.
Actionable but governed by invalidation levels.
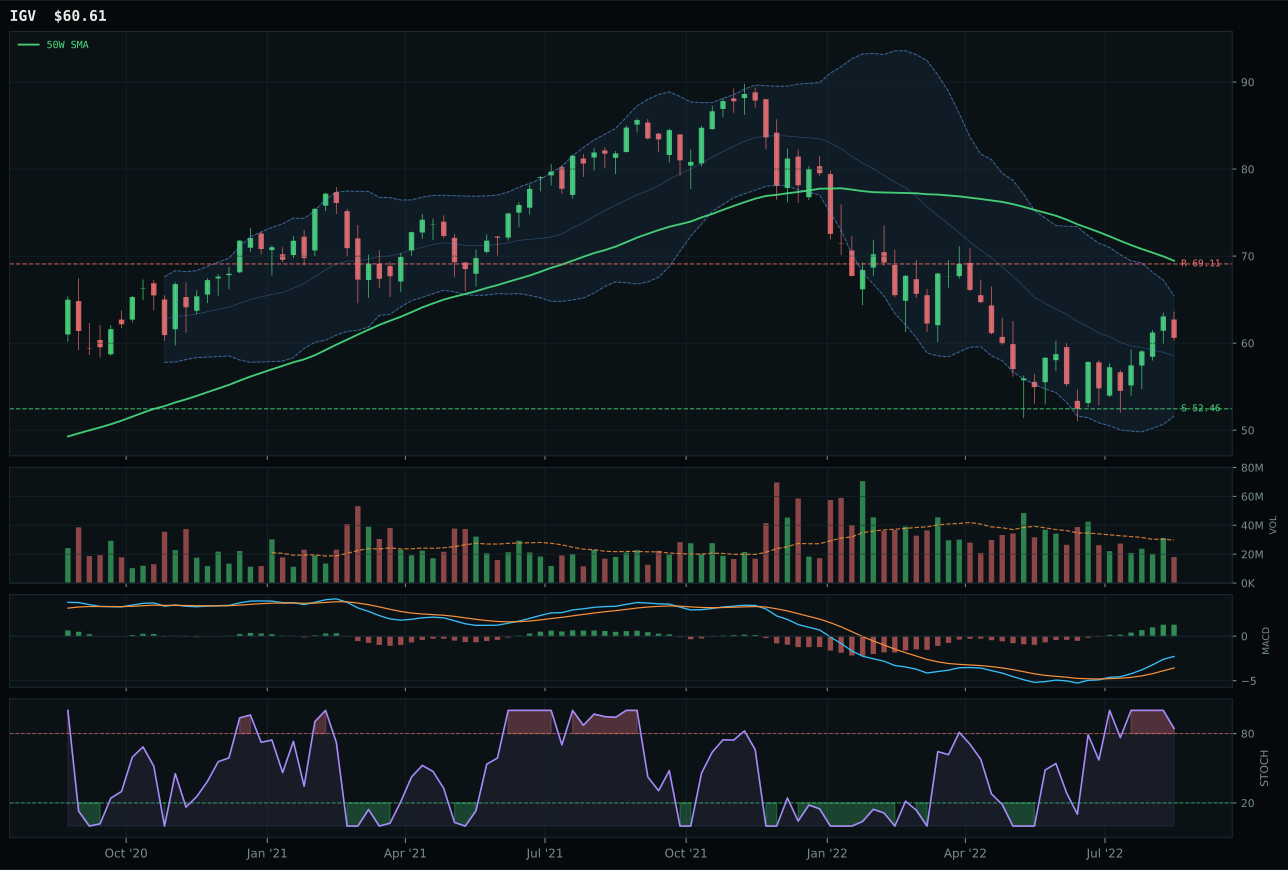
IGV has a neutral structure profile with 1.9% 13-week relative strength versus SPY.
A failed hold above support would weaken the setup.
Actionable but governed by invalidation levels.
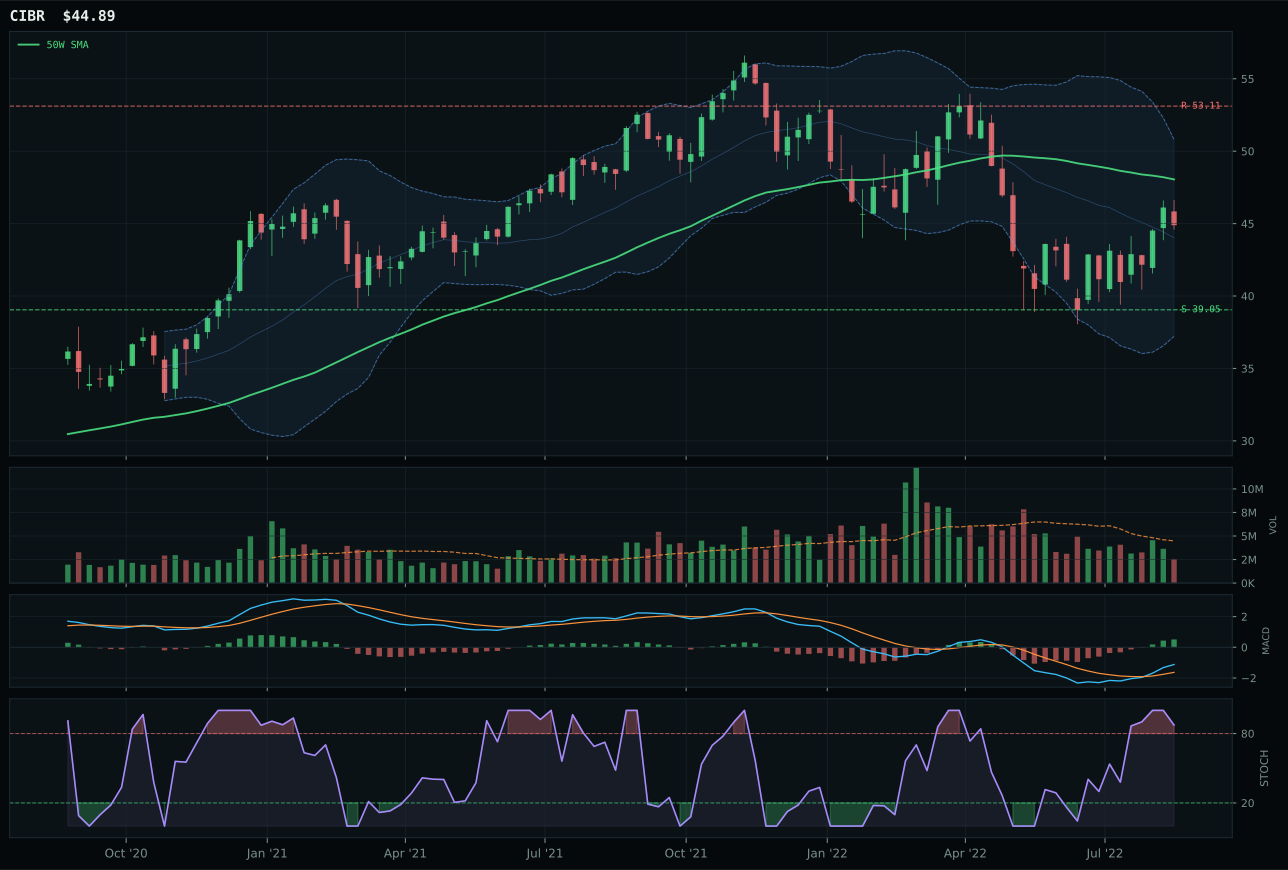
CIBR has a neutral structure profile with 2.5% 13-week relative strength versus SPY.
A failed hold above support would weaken the setup.
Actionable but governed by invalidation levels.
XLK wins on a decisive 26.2-point margin over IGV because it owns the timing setup that matters most in a reset market. The chart sits just 2.4% below the 50-week moving average with MACD bullish and improving, stochastic RSI overbought but rolling over—the perfect compression coil for buyers to defend and expand from. What separates XLK from IGV is category-relative strength of 2.1% versus IGV's negative 0.6%, meaning profitable tech leadership is being accumulated while enterprise software lags. Volume is thin at 0.57x the 20-week average, but that's discipline, not weakness; it tells you the move is selective, not panic-driven. The 89.0 timing score versus IGV's 44.0 reflects price proximity to the 50W and stochastic positioning—IGV is deep in oversold territory with rising stochastic, which creates false hope rather than structural setup.
Technology earns 5% allocation as a tier-2 holding in a disinflation regime where liquidity stress and credit stress are both active headwinds. The category scored 37.1 overall, well below the top-2 cutoff, because macro fit is only 40.0/100—disinflation helps at plus-7, but active liquidity stress at minus-10 and credit stress at minus-7 are drowning out any growth narrative. XLK's 82.0 trend score and 13.0% thirteen-week return give it the defensive margin to justify holding despite macro resistance. What would elevate this category: either liquidity conditions need to stabilize or the portfolio needs to see risk appetite return to favor growth rotation. For now, this is a technical hold in a macro bear, not a conviction position.
Nuclear Energy — URA
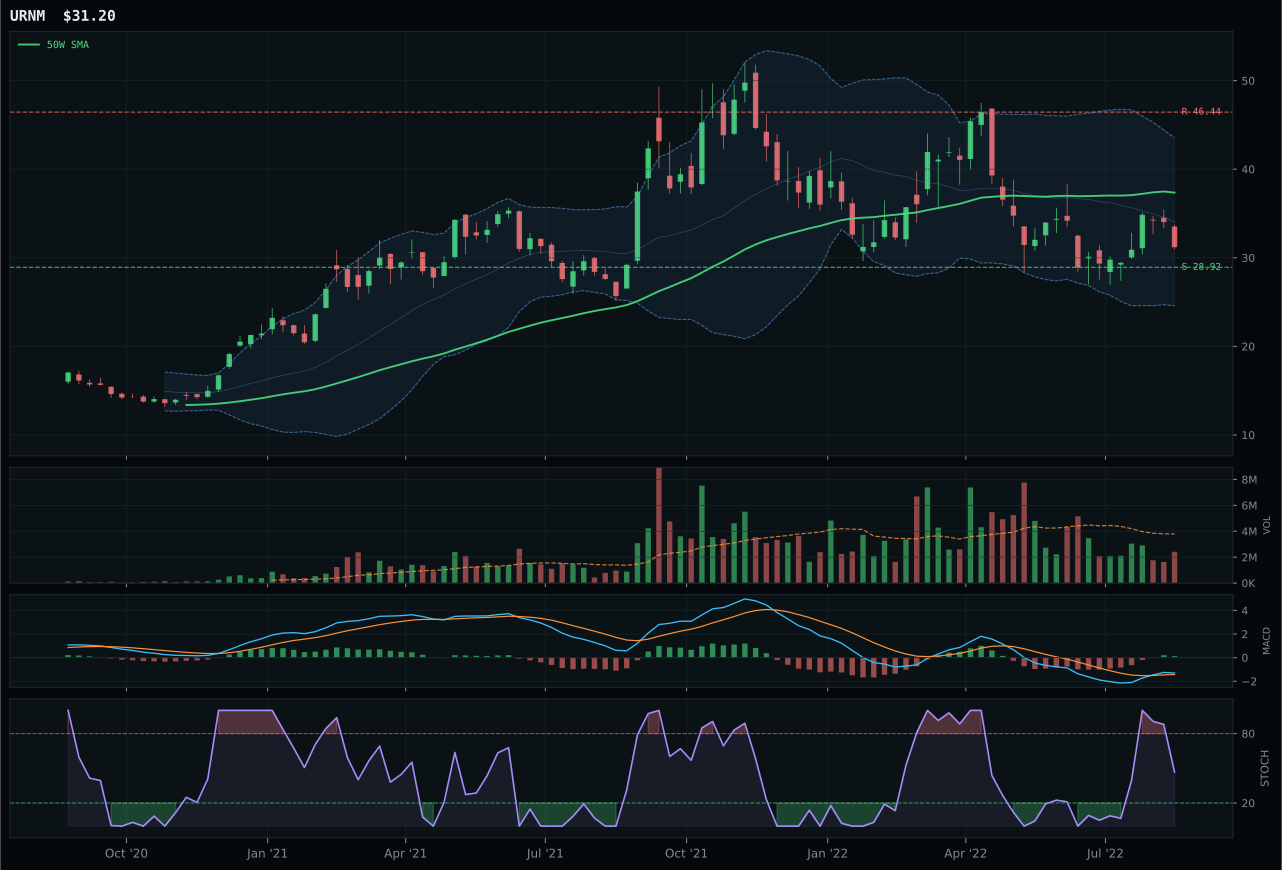
URNM has a neutral structure profile with -10.9% 13-week relative strength versus SPY.
A failed hold above support would weaken the setup.
Actionable but governed by invalidation levels.
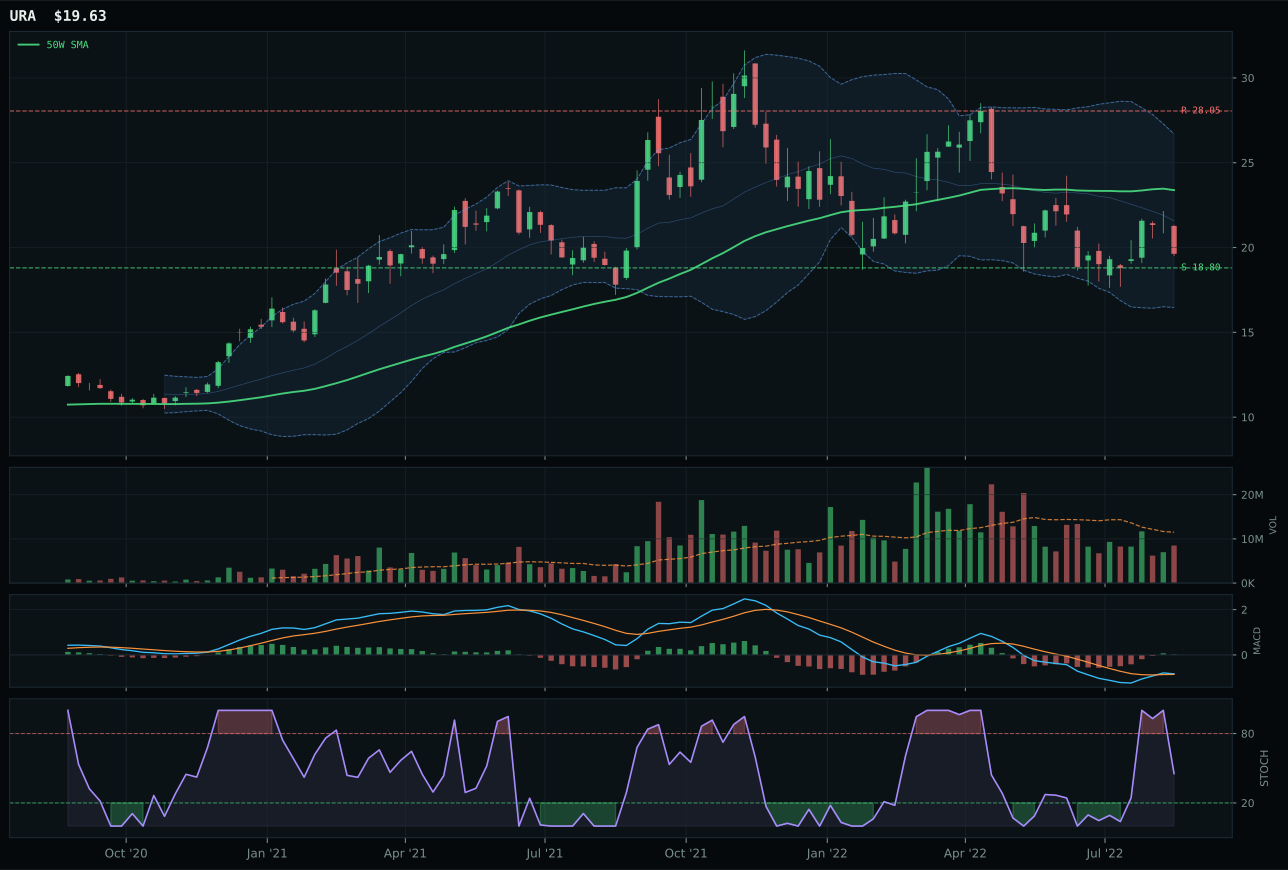
URA has a pullback into support profile with -14.3% 13-week relative strength versus SPY.
A failed hold above support would weaken the setup.
Actionable but governed by invalidation levels.
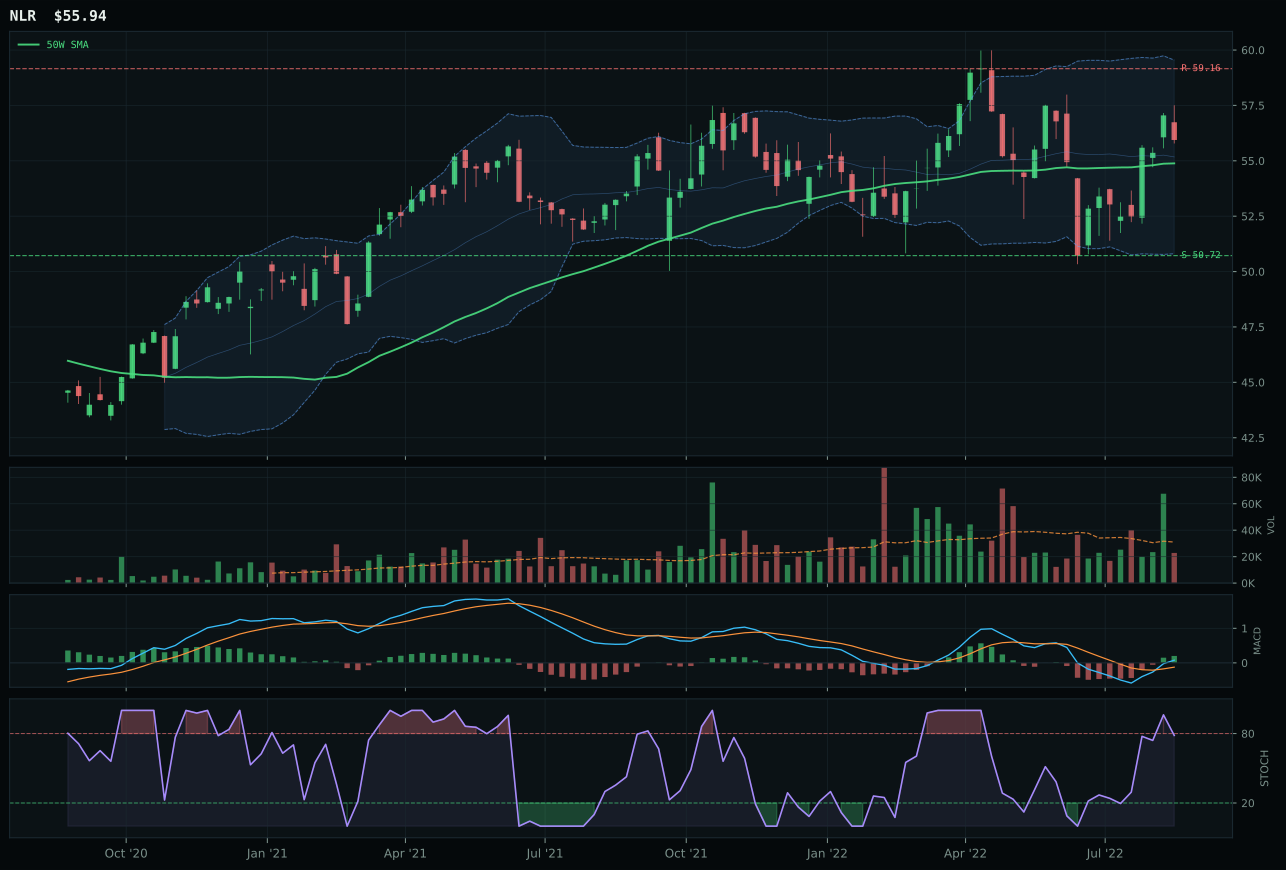
NLR has a compression near 50W profile with -7.6% 13-week relative strength versus SPY.
A failed hold above support would weaken the setup.
Tracked, but not top-2 eligible because: .
URA wins Nuclear Energy on just 0.2 points over URNM—a statistical tie that reveals the category's internal weakness. URA owns the better timing setup at 65.0 versus URNM's 55.0 because URA is positioned exactly where a reset should hold, 16.1% below the 50-week in the 52-week low repair zone with clean support at 18.80. URNM is neutral structure deeper in the repair zone with less defined invalidation. Both have bullish-and-improving MACD and falling/neutral stochastic RSI; the separation is pure geometry. Structure is marginally cleaner at URA's 61.0 versus URNM's 60.0. Risk/reward is identical at 75.0 for both. URA's 25.3 momentum confirmation is catastrophic versus URNM's 38.0, reflecting URA's minus-5.9% thirteen-week return versus URNM's minus-2.6%. The reason URA wins is timing setup, not momentum—a chart-setup edge in a category where both exposures are severely damaged by macro.
Nuclear Energy receives 5% allocation as tier-2 because the category scored 33.4, placing it in the middle tier by technical merit. However, the macro case is nearly neutral at 43.0/100 macro fit: energy scarcity is active at plus-9 supporting the narrative, but liquidity stress at minus-7, credit stress at minus-5, and risk appetite broken at minus-4 offset that bid. URA has 32.1 technical evidence and 50.0 macro fit (neutral because no category-specific descriptor profile exists), which is respectable but not compelling. The portfolio holds this 5% position because energy scarcity is real and nuclear is the zero-carbon supply narrative, but URA's minus-5.9% thirteen-week return and weak momentum confirmation mean this is a turnaround play, not a current strength play. To elevate Nuclear to tier-1, either energy scarcity needs to spike further or risk appetite needs to return to favor long-duration energy transition thesis. For now, treat this as a macro hedge, not a momentum trade.
AI — SMH
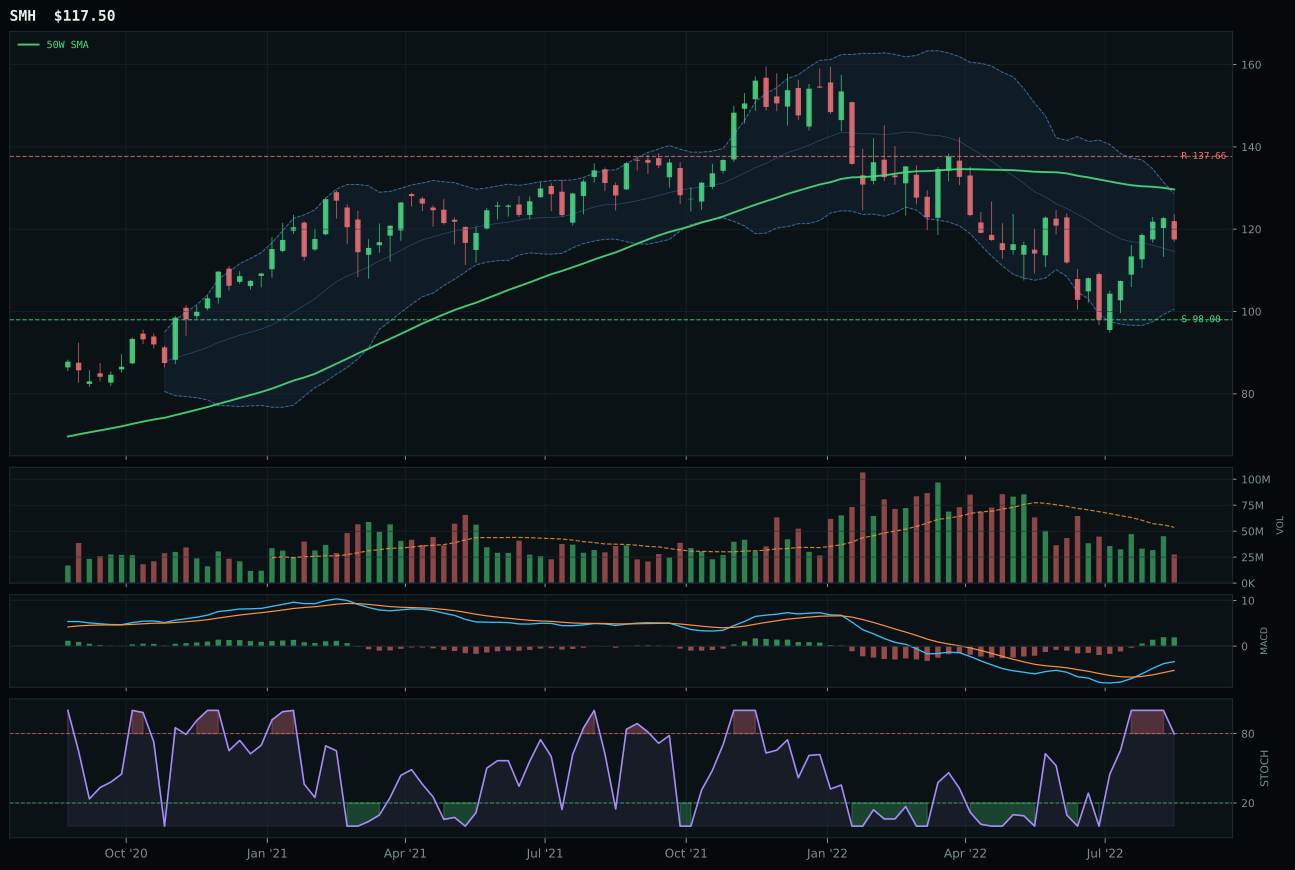
SMH has a neutral structure profile with -5.4% 13-week relative strength versus SPY.
A failed hold above support would weaken the setup.
Actionable but governed by invalidation levels.
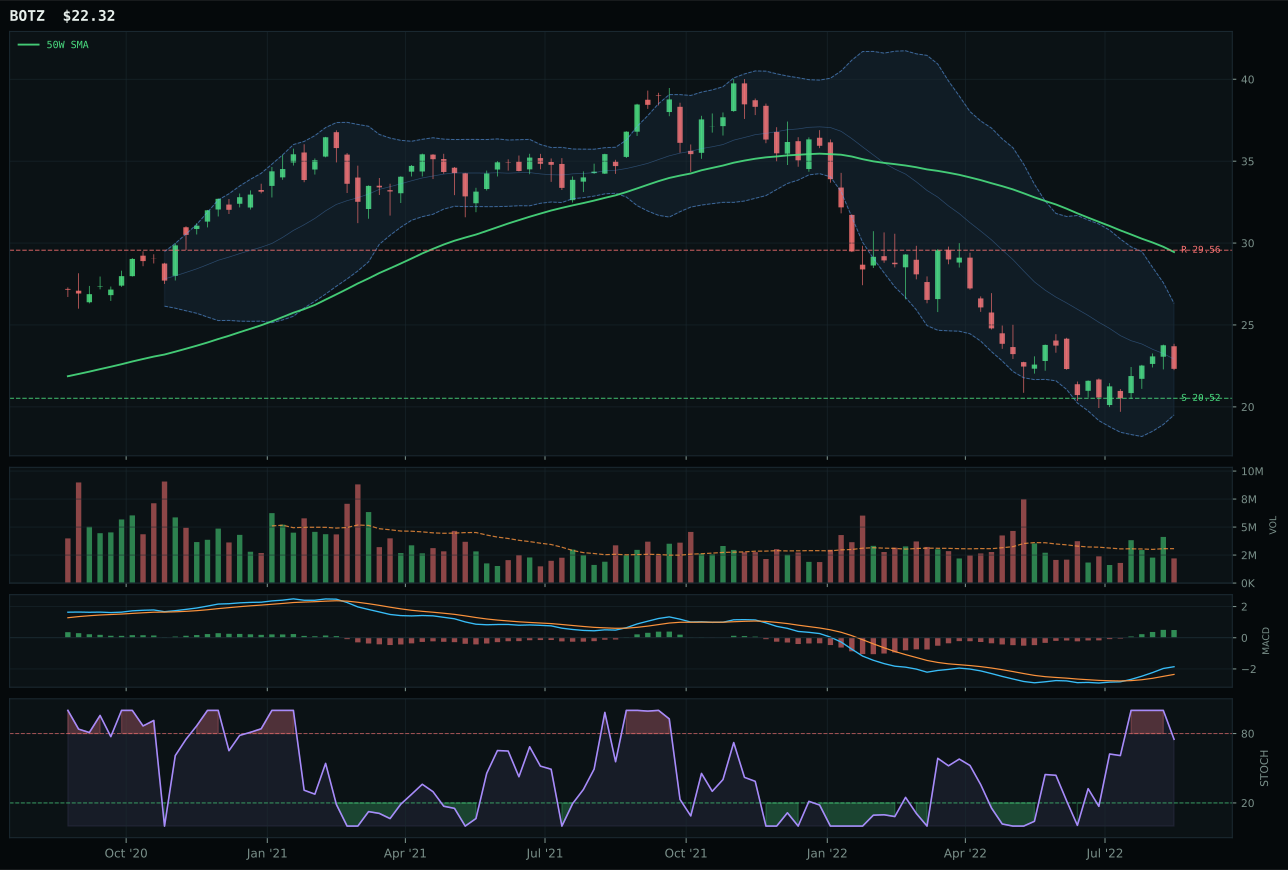
BOTZ has a neutral structure profile with -9.5% 13-week relative strength versus SPY.
A failed hold above support would weaken the setup.
Actionable but governed by invalidation levels.
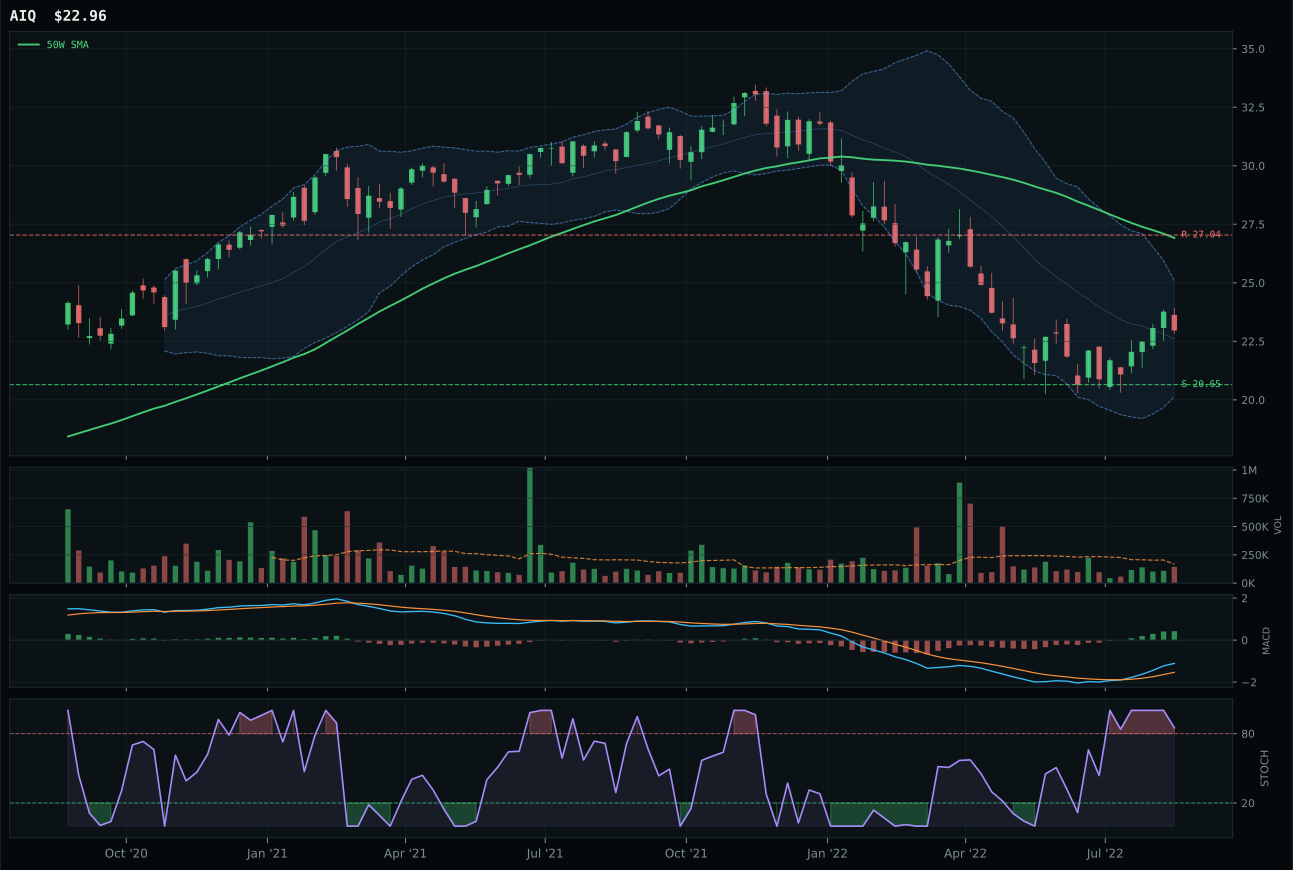
AIQ has a neutral structure profile with -1.9% 13-week relative strength versus SPY.
A failed hold above support would weaken the setup.
Tracked, but not top-2 eligible because: .
SMH wins the AI category on an 18.8-point spread over BOTZ because semiconductor compute has the timing edge that matters when breadth is thin. Price is 9.4% below the 50-week moving average sitting in deep value near Fib 0.618, MACD is bullish and improving, and stochastic RSI is falling/neutral at 0.80—this is the chart of something being accumulated into, not something bouncing. The 82.0 timing score reflects the gap to the moving average and the stochastic position; BOTZ's 55.0 timing is weaker because it's sitting at the 52-week low repair zone with less structural room to invalidate cleanly. Category-relative strength is dead even at 0.0%, but SMH's neutral structure scores higher at 68.1 versus BOTZ's 67.0 because the cleanliness is better. Volume is thin participation at 0.51x the 20-week average across both, so the technical win is driven by setup geometry, not sponsorship.
AI receives 5% as tier-2 despite winning its category because the category itself scored only 20.6, far below leadership. Macro fit is a weak 23.0/100 because liquidity stress at minus-12, credit stress at minus-8, and broad market bear at minus-8 are suffocating any cyclical momentum narrative. SMH has just 64.2/100 technical evidence and 27.0/100 macro fit—the technical setup is cleaner than BOTZ, but neither ETF is being favored by the regime. Risk appetite is broken and liquidity is draining; growth-exposed semiconductors are a chart play, not a conviction trade. To earn top-2 status, AI would need either a reversal in risk appetite or a clear break of key support accompanied by volume confirmation—neither is present yet.
Traditional Energy — XOP
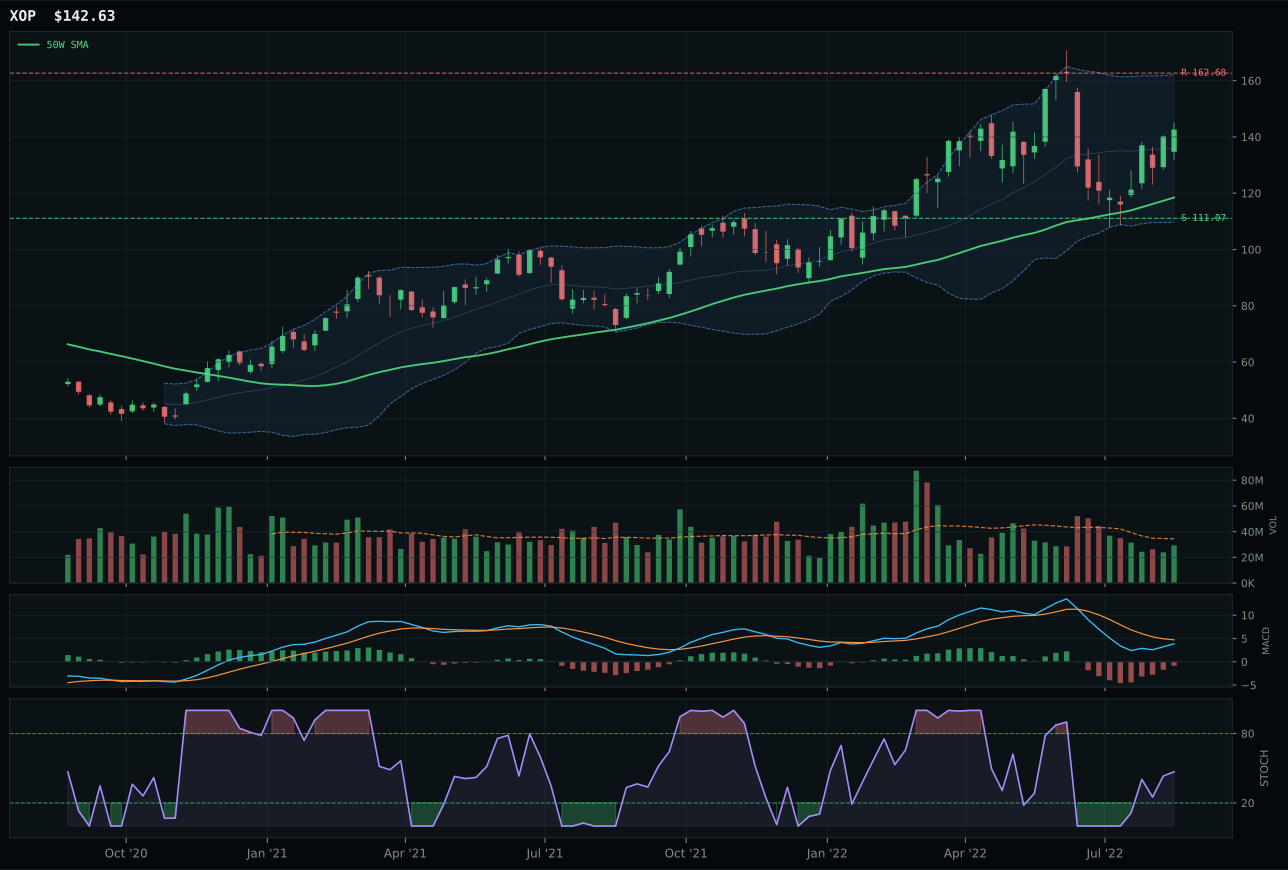
XOP has a vertical extension profile with -4.1% 13-week relative strength versus SPY.
A failed hold above support would weaken the setup.
Actionable but governed by invalidation levels.
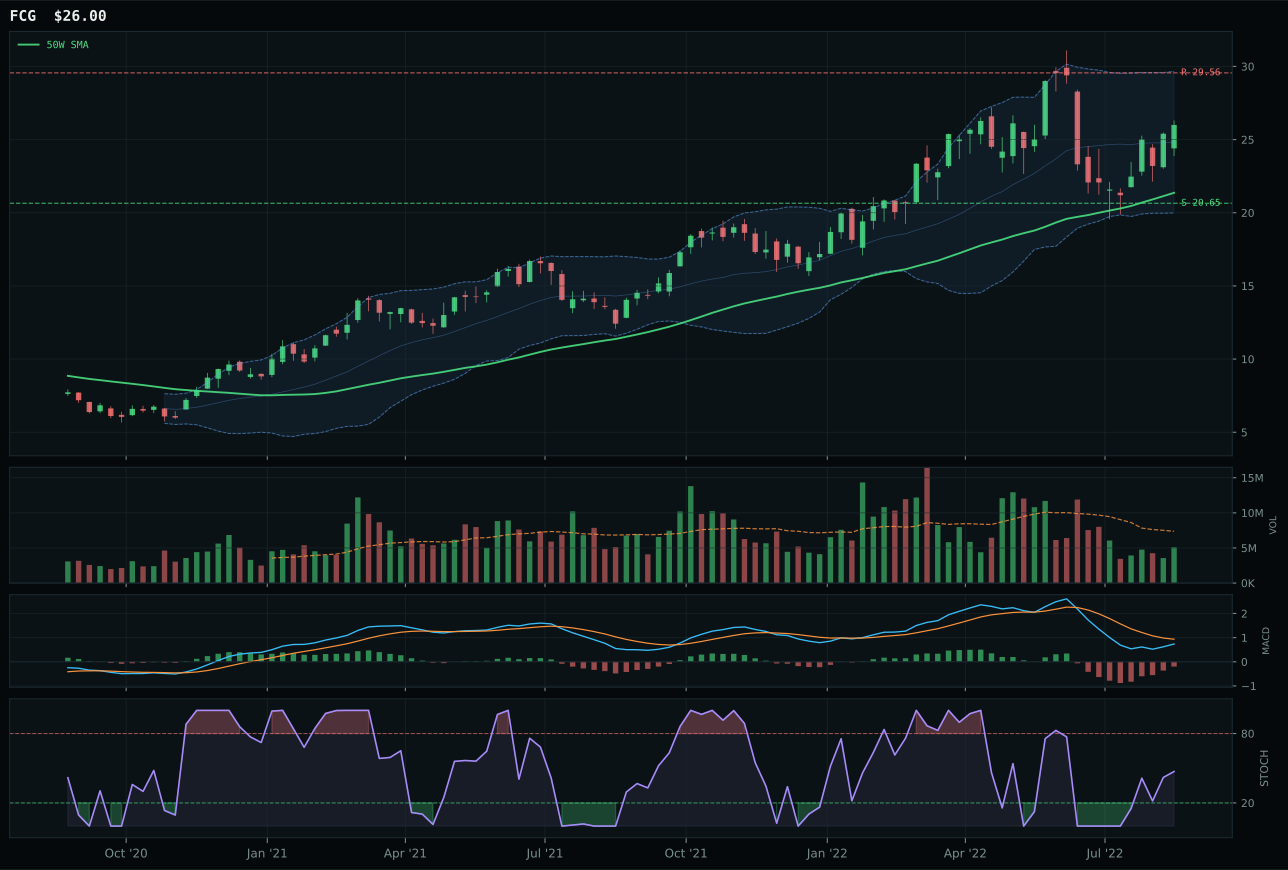
FCG has a vertical extension profile with -4.5% 13-week relative strength versus SPY.
A failed hold above support would weaken the setup.
Actionable but governed by invalidation levels.
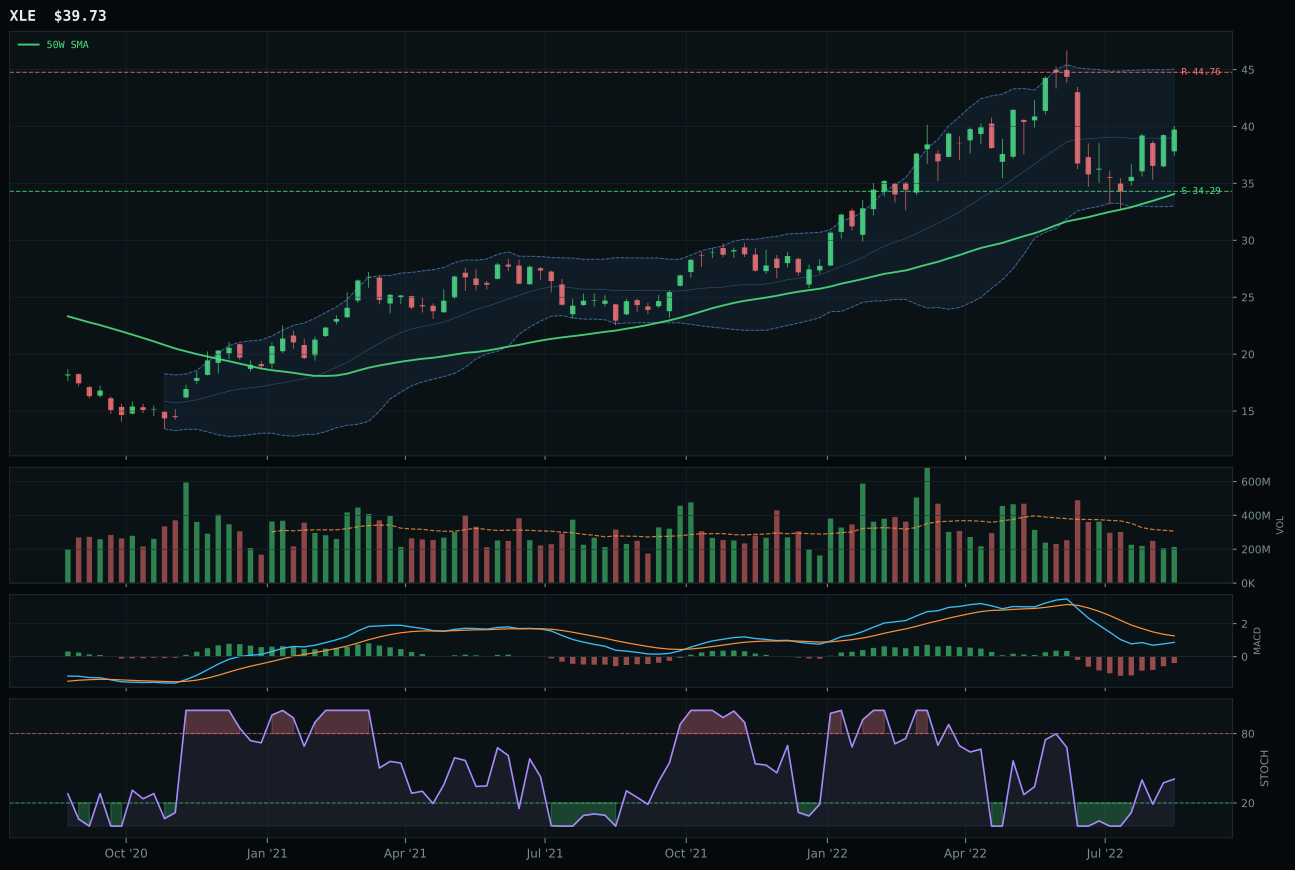
XLE has a vertical extension profile with -11.2% 13-week relative strength versus SPY.
A failed hold above support would weaken the setup.
Actionable but governed by invalidation levels.
XOP wins a close fight with FCG—just 1.2 points separated them—because XOP owns the marginally superior structure and volume sponsorship in a setup that neither ETF truly commands. XOP is extended 20.4% above the 50-week moving average in the upper retracement momentum zone, which should kill it, but its structure score is 64.3 versus FCG's 62.3, giving it a structural edge. Volume confirmation is 57.6 for XOP versus 49 for FCG; XOP trades at 0.85x the 20-week average (neutral participation) while FCG is thin at participation levels. Both have vertical extension setups and bearish-but-improving MACD with rising mid-zone stochastic, so the decision comes down to breadth and liquidity: XOP has marginally better. The 13-week returns are nearly identical at 4.3% and 3.8%, but XOP's 0.4% category-relative strength edges FCG's 0.0%. This is a toss-up, not a conviction call.
Traditional Energy earns 5% allocation as tier-2 despite XOP's weak relative ranking because energy scarcity is active at plus-16 in the macro descriptor matrix—the strongest single-factor bid in any category. The problem is that disinflation hurts this exposure at minus-10, which overwhelms the scarcity premium; category-level macro fit is only 32.0/100. XOP's technical evidence is 48.3/100, barely passing the threshold for inclusion, and the setup itself is dangerous: extended 20.4% above the 50-week with downside risk at 28.4% to support. The risk/reward is 37.8/100, meaning upside to resistance is tight at minus-12.3%. This is a hold for portfolio balance and energy scarcity hedge, but not a conviction position. To justify expansion, Traditional Energy needs either energy prices to spike on new supply shock (unlikely in disinflation) or risk appetite to return and lift cyclical valuations despite falling commodities. Neither is probable.
Industrial Metals — REMX
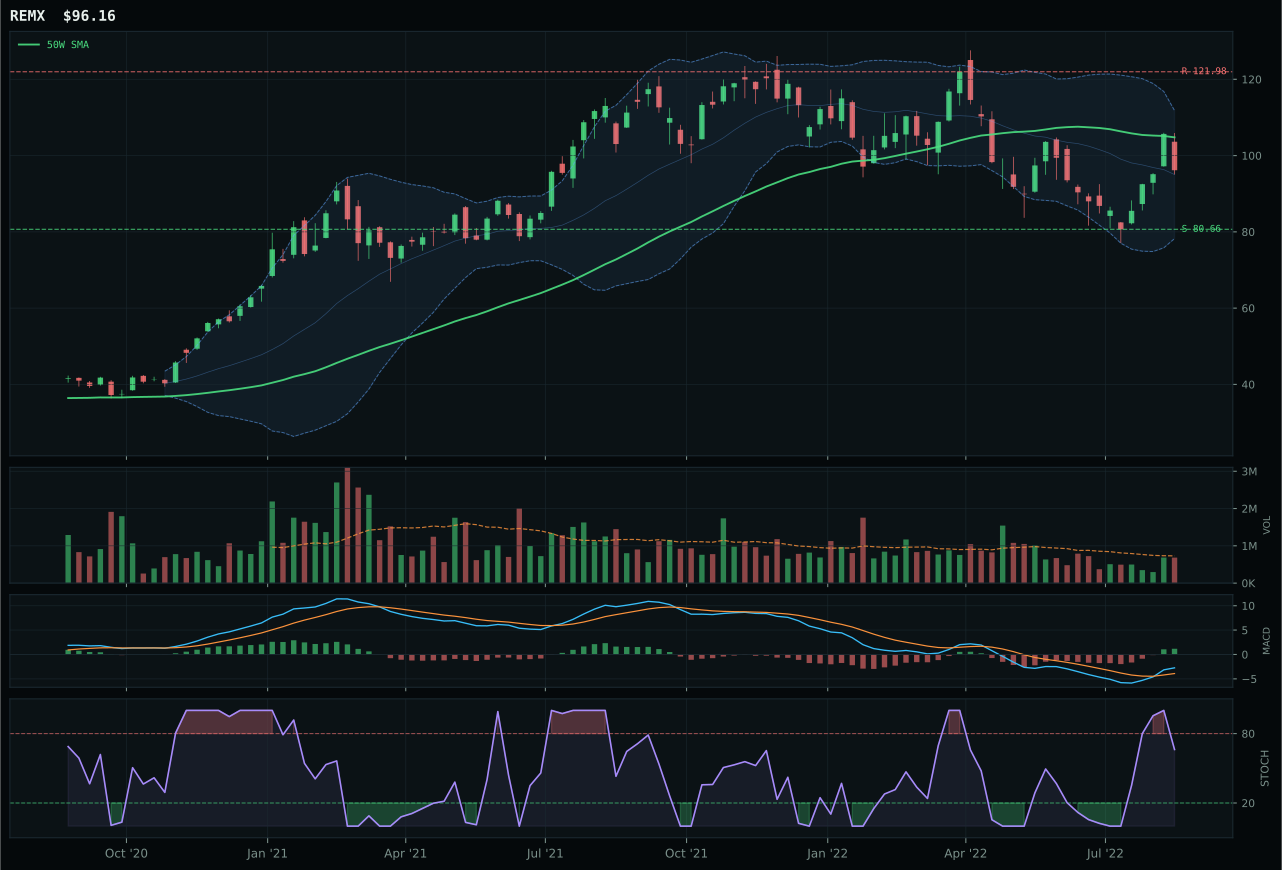
REMX has a neutral structure profile with -9.6% 13-week relative strength versus SPY.
A failed hold above support would weaken the setup.
Actionable but governed by invalidation levels.
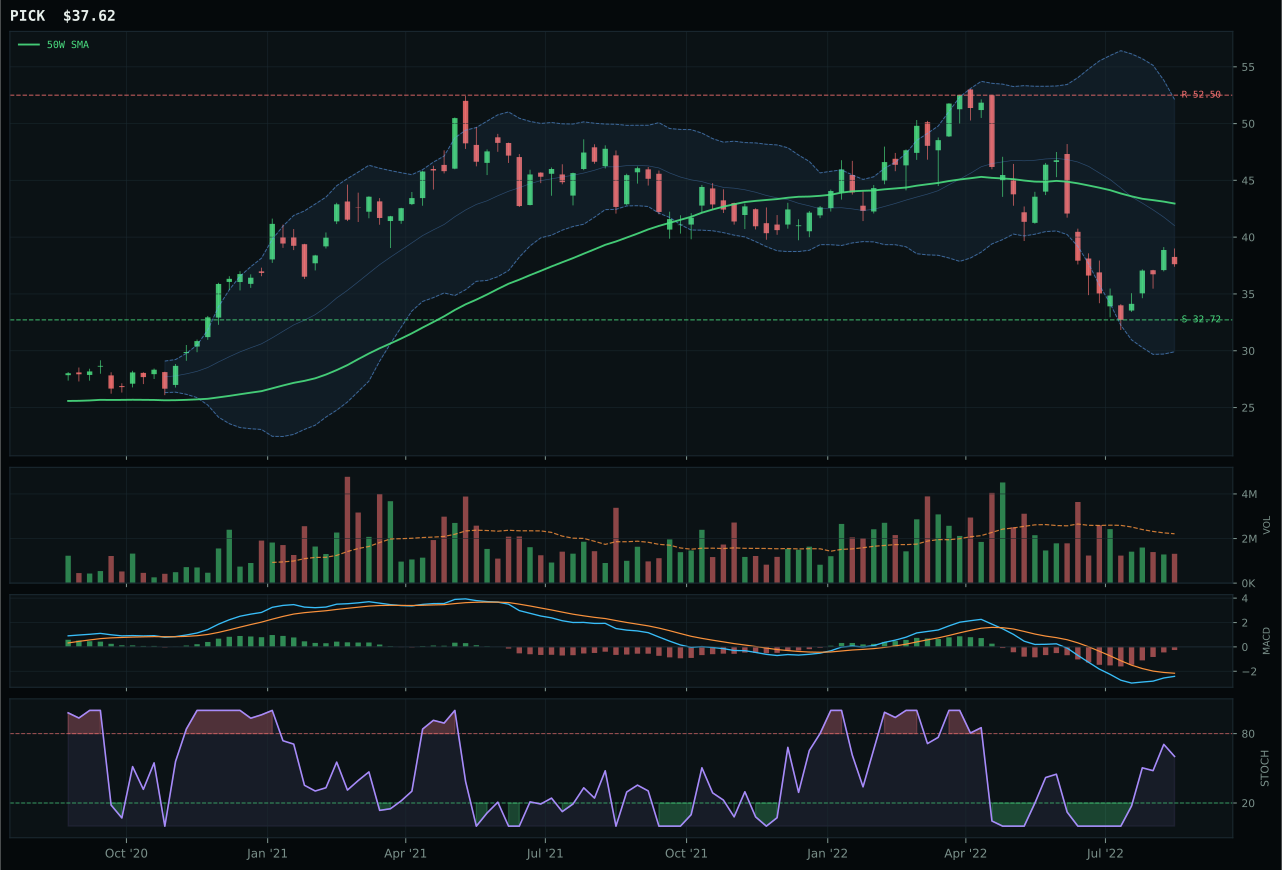
PICK has a neutral structure profile with -22.0% 13-week relative strength versus SPY.
A failed hold above support would weaken the setup.
Actionable but governed by invalidation levels.
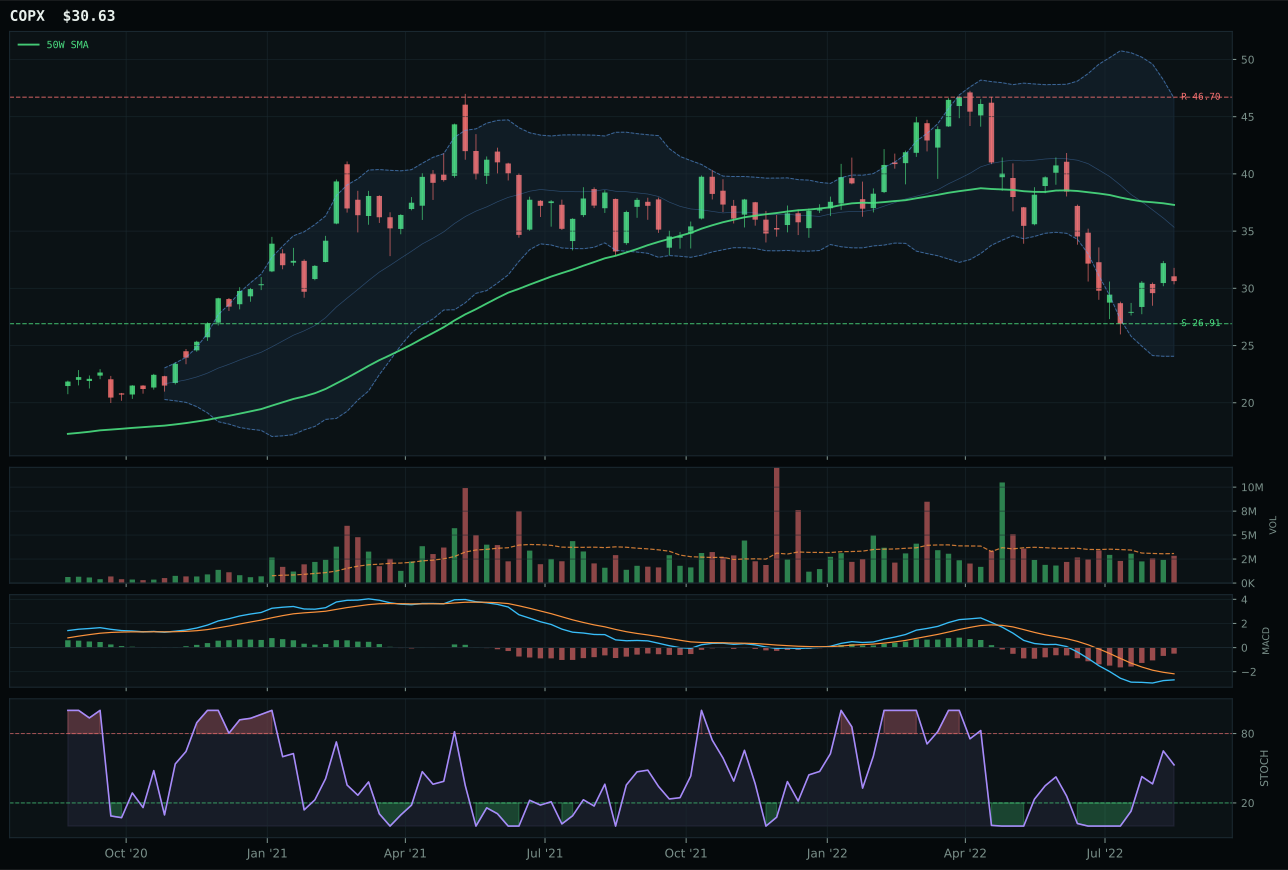
COPX has a neutral structure profile with -28.1% 13-week relative strength versus SPY.
A failed hold above support would weaken the setup.
Actionable but governed by invalidation levels.
REMX wins Industrial Metals on a 17.1-point spread over PICK because rare earth supply-scarcity narrative is paired with the cleaner technical setup. REMX is 8.2% below the 50-week moving average in deep value near Fib 0.618, MACD is bullish and improving, and stochastic RSI is falling/neutral at 0.66—this is accumulation into oversold, not a bounce from a bounce. PICK's timing is weaker at 70.0 versus 82.0 because structure is neutral and MACD is only bearish-but-improving; PICK is at the 52-week low repair zone but without the technical sponsorship momentum. Category-relative strength tells the story: REMX has plus-12.4% relative strength versus the median while PICK sits at 0.0%, meaning rare earths are being selected out of the mining complex as buyers differentiate between scarcity (rare earths) and cyclical crowding (broad mining). Volume confirmation is 67.8/100 for REMX versus 30.0 for PICK, reflecting that neutral volume at 0.94x the 20-week average is superior to thin participation at PICK's levels.
Industrial Metals earns 5% allocation as tier-2, but only because the portfolio needs some tactical mining exposure; the category scored 12.0, well below conviction levels. Macro fit is a weak 28.0/100 because liquidity stress at minus-8, credit stress at minus-7, and dollar pressure at minus-7 are all active—industrial metals get hurt when money is tight and the dollar is strong. REMX's 73.6 technical evidence is strong relative to the category, but that strength is rare-earth-specific, not broadly industrial. The plus-12.4% category-relative strength is the only reason to hold this rather than cash; it suggests supply-chain differentiation is real. To elevate Industrial Metals to tier-1, the portfolio would need either a credit impulse to ease liquidity stress or central bank reflation talk to reduce dollar pressure. Until then, REMX's technical strength is real but its macro headwinds are real too; hold it as a chart play, not a conviction allocation.
Agriculture & Livestock — MOO
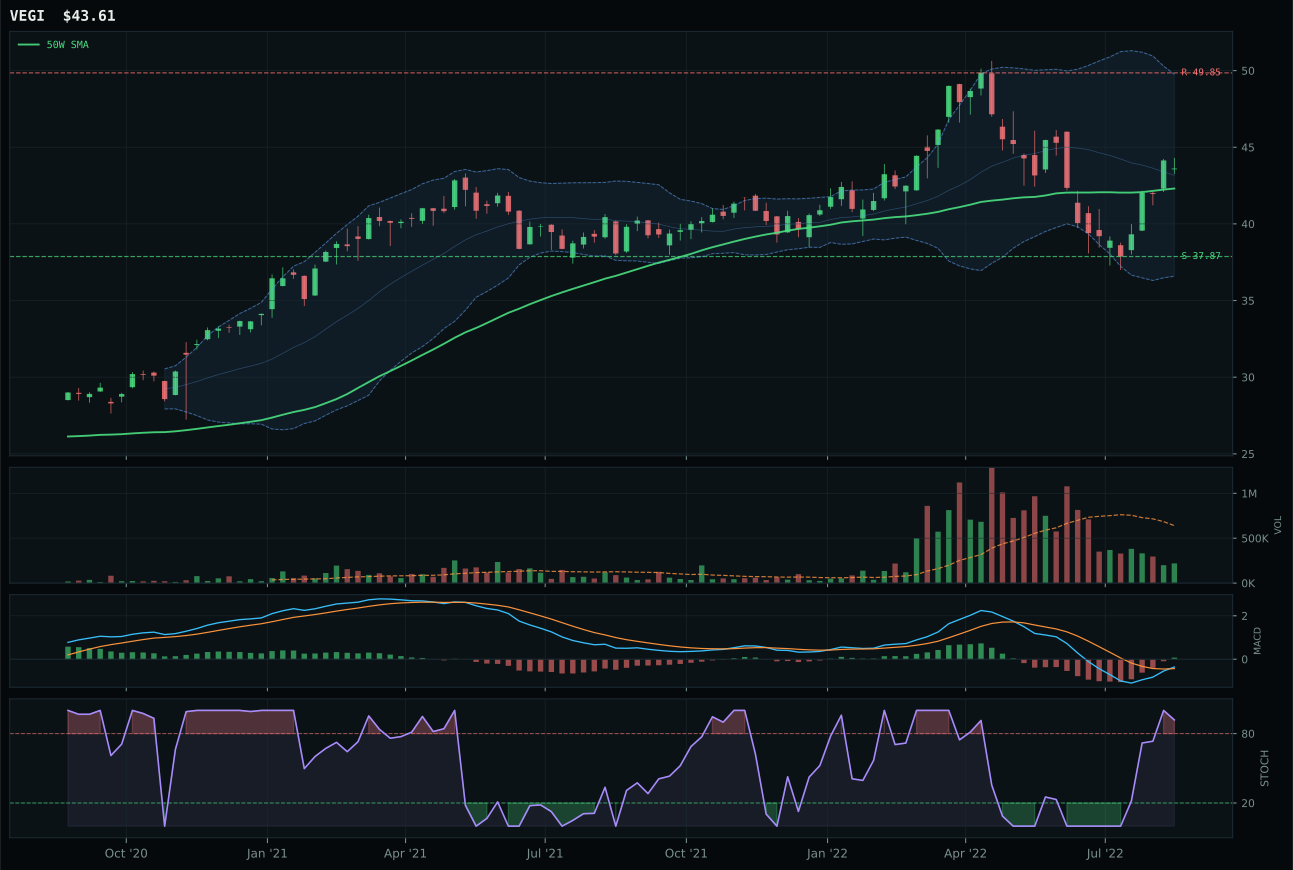
VEGI has a neutral structure profile with -7.3% 13-week relative strength versus SPY.
A failed hold above support would weaken the setup.
Actionable but governed by invalidation levels.
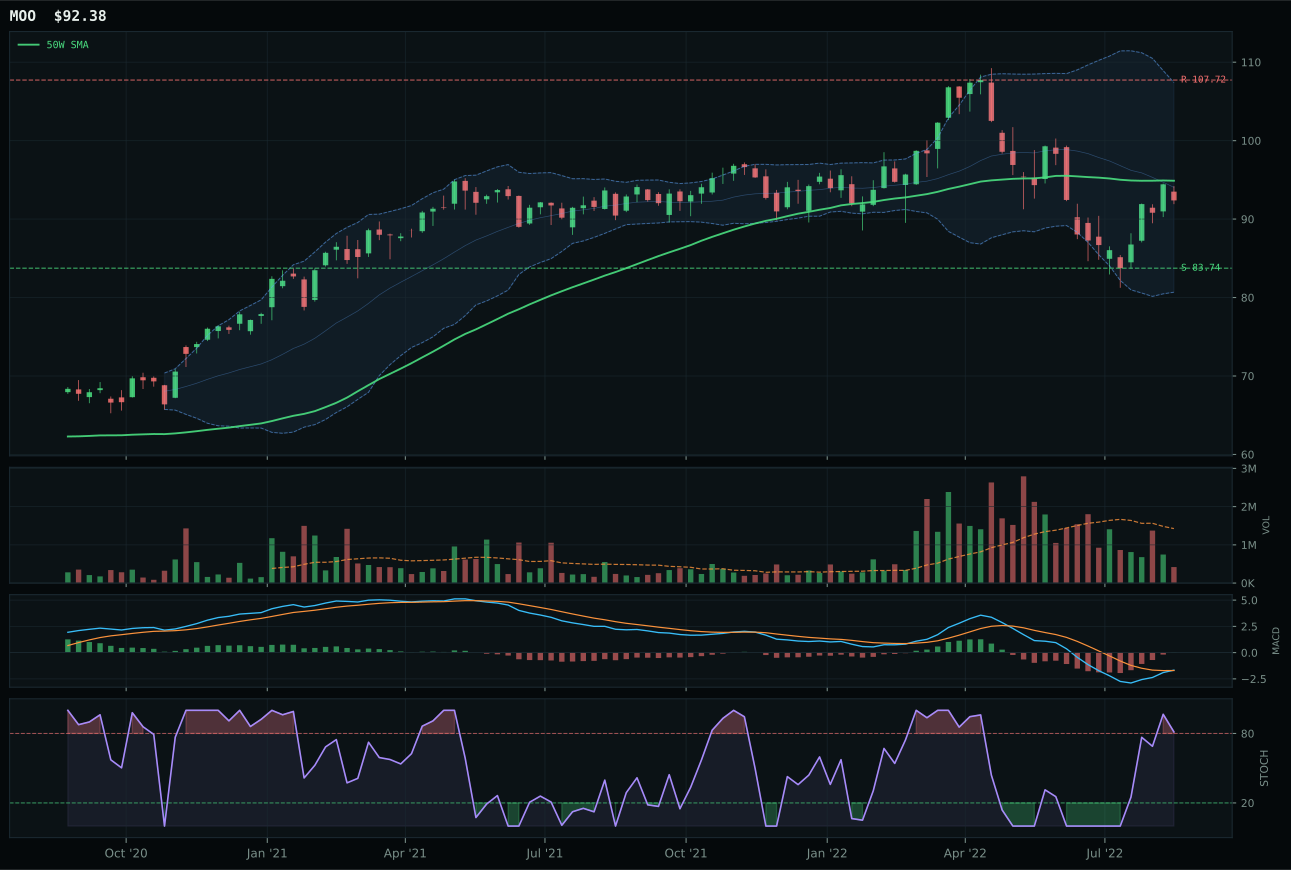
MOO has a compression near 50W profile with -10.4% 13-week relative strength versus SPY.
A failed hold above support would weaken the setup.
Actionable but governed by invalidation levels.
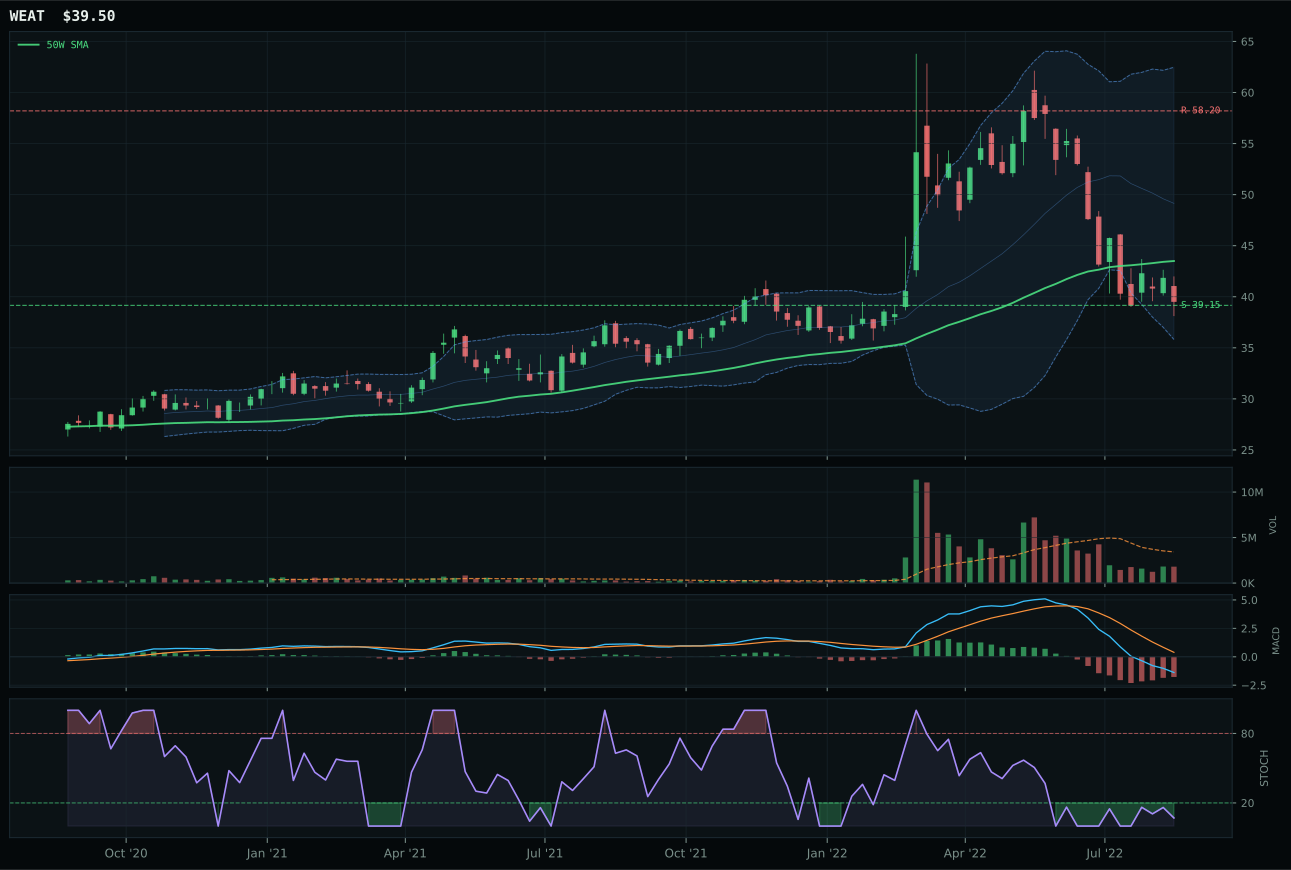
WEAT has a pullback into support profile with -39.6% 13-week relative strength versus SPY.
A failed hold above support would weaken the setup.
Actionable but governed by invalidation levels.
MOO wins the Agriculture category with a perfect 100.0 timing score despite carrying weak momentum confirmation at 49.1, because chart geometry is everything in a macro bear. Price is just 2.6% below the 50-week moving average in the middle retracement decision zone near Fib 0.618, MACD is bullish and improving, and stochastic RSI is overbought momentum at 0.81—this is textbook coil compression. MOO beats VEGI's 97.0 timing by owning superior structure at 61.2 versus 60.9 and better risk/reward at 77.8 versus 67.9. The 5.3-point category victory over VEGI is clean: MOO has compression near the 50-week while VEGI is neutral structure pulled 3.1% above moving average, and MOO's volume-price confirmation at 44.6 is slightly less weak than VEGI's implied weakness. Neither has real buying pressure, but MOO's setup invalidates cleanly if support at 83.74 breaks.
Agriculture & Livestock receives 0% allocation this week because the category scored 11.2, ranking it outside the portfolio entirely—this is a macro rejection, not a technical one. Disinflation pressure is active at minus-8, which directly crushes commodity producers, and liquidity stress at minus-4 adds friction. The category-level macro fit is a dire 32.0/100, and even the winner MOO has macro fit of only 45.0/100. MOO's technical evidence at 55.1/100 cannot overcome the headwind of a disinflation regime where input costs are normalizing and farmer margins are compressing. To earn a 5% slot, this category needs either a macro pivot toward inflation, commodity scarcity to become acute, or disinflation pressure to reverse to neutral. Until then, agricultural exposure is a crowded hedge for a problem that is already solved.
Emerging Markets — INDA
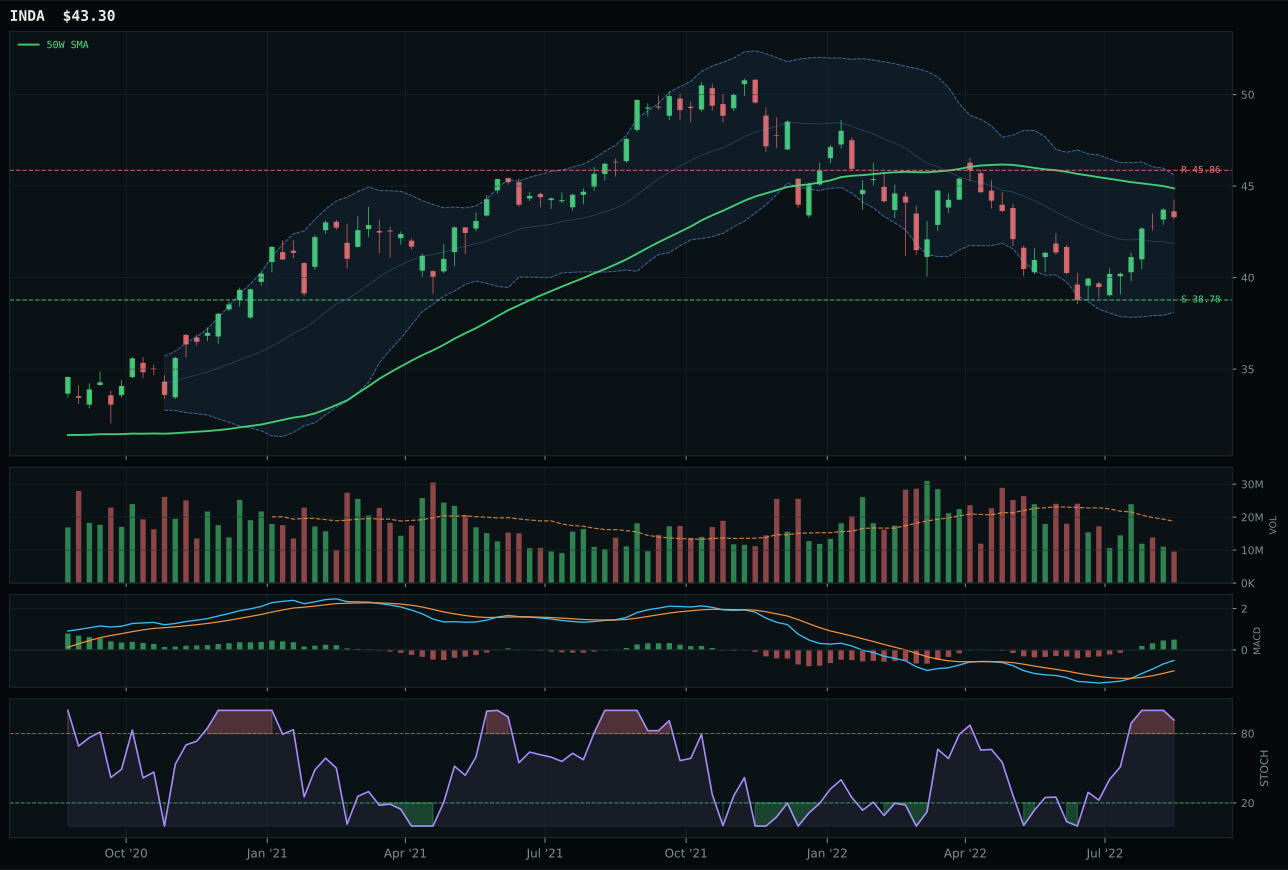
INDA has a neutral structure profile with -2.6% 13-week relative strength versus SPY.
A failed hold above support would weaken the setup.
Actionable but governed by invalidation levels.
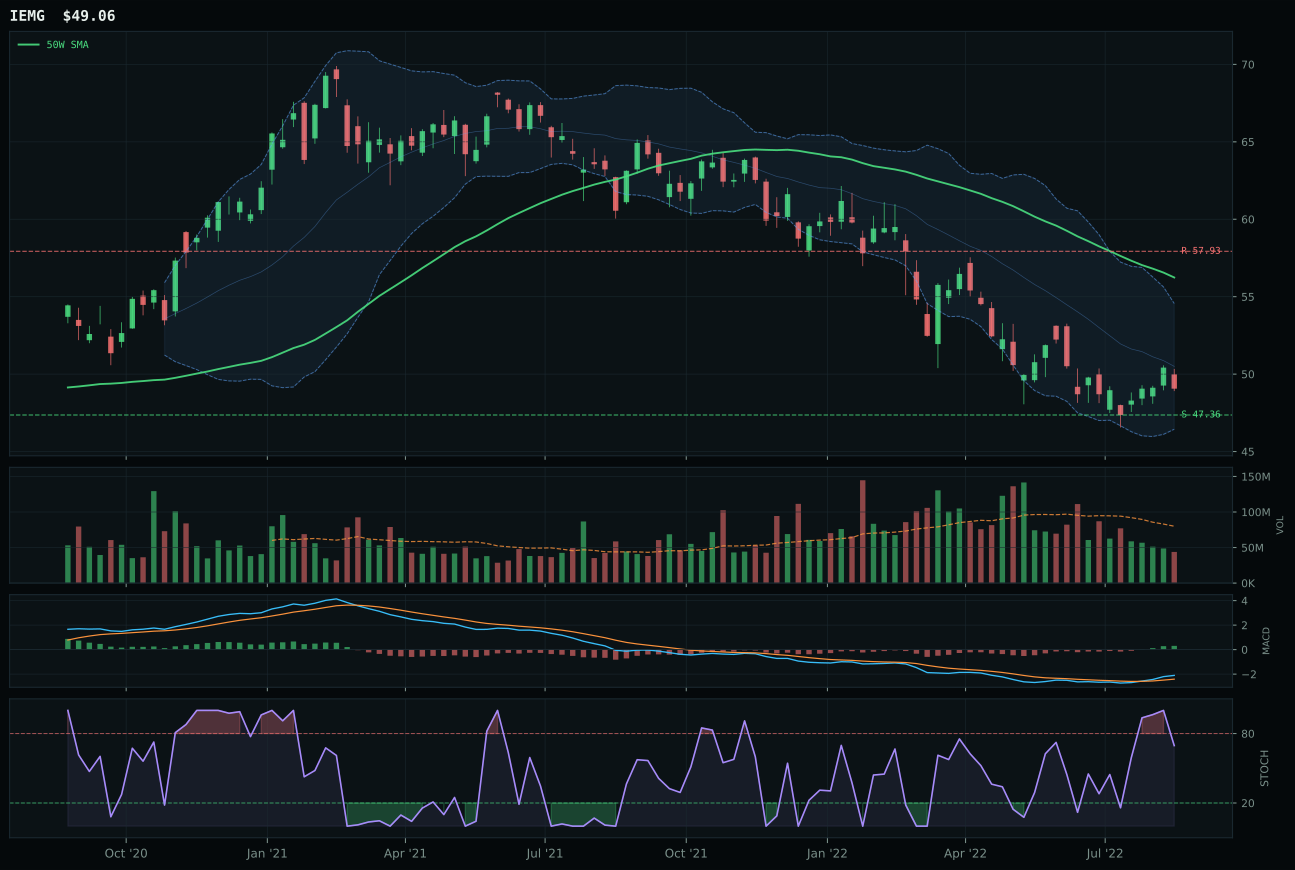
IEMG has a pullback into support profile with -11.7% 13-week relative strength versus SPY.
A failed hold above support would weaken the setup.
Actionable but governed by invalidation levels.
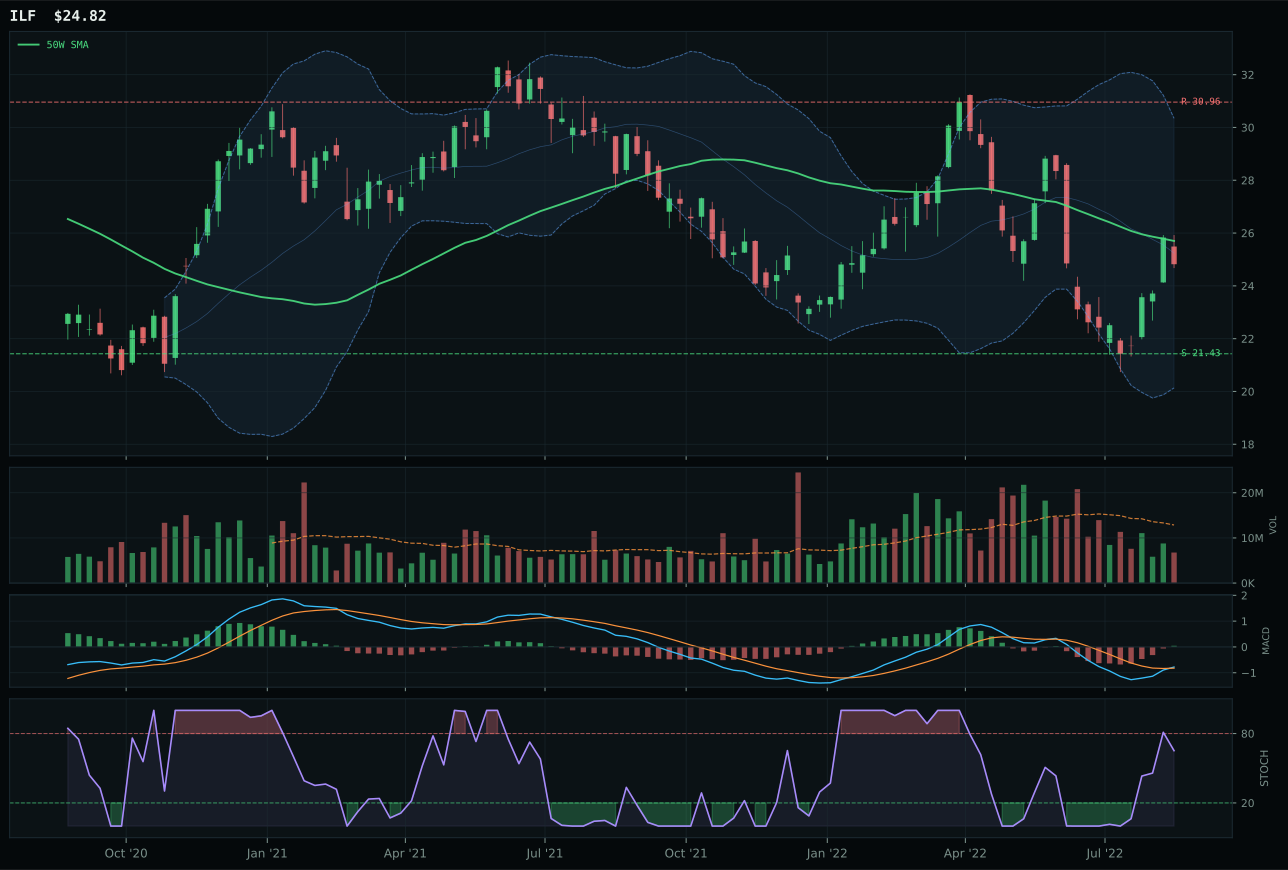
ILF has a neutral structure profile with -16.9% 13-week relative strength versus SPY.
Extension and support failure are the main tactical risks.
Tracked, but not top-2 eligible because: structurally broken.
INDA wins Emerging Markets on a 9.7-point spread over IEMG by owning the combination of category-relative strength and cleaner structure in an otherwise broken asset class. INDA is 3.5% below the 50-week moving average in the middle retracement decision zone, structure is 75.9/100 (neutral but clean), and category-relative strength is plus-9.1% versus IEMG's 0.0%. INDA's 13-week return is 5.7%, giving it positive momentum in a bear market; IEMG's is minus-3.4%, which means broad emerging markets are down while India is up. Timing is 79.0 for INDA versus IEMG's 65.0 because INDA's stochastic RSI is overbought rolling over at 0.92 (momentum topping in a healthy way) while IEMG's is falling/neutral (losing momentum). Volume is thin for both, but INDA's 56.2 volume-price confirmation edges IEMG's 42.0. This is India quality outperforming emerging-market commodity and credit beta.
Emerging Markets receives 0% allocation despite INDA's relative strength within category because the category scored 4.1, ranking it in the bottom tier entirely—this is a macro exclusion. Dollar pressure is active at minus-14, credit stress at minus-10, liquidity stress at minus-10, and broad market bear at minus-9; emerging markets are being destroyed by the macro backdrop. Category-level macro fit is only 7.0/100, a tier below Agriculture. INDA's plus-5.7% thirteen-week return and India-specific outperformance do not matter when dollars are strong, credit is tight, liquidity is draining, and risk appetite is broken. INDA has 55.8 technical evidence and 35.0 macro fit, but that is not enough to offset a regime that is anti-risk. To earn portfolio exposure, Emerging Markets needs the dollar to weaken, credit spreads to tighten, or risk appetite to show clear reversal. Until then, this category is an orphan, regardless of India's relative shine.