
2022-08-12
Informational purposes only. The content in this report, including allocations, analysis, and commentary, is provided solely for informational and educational purposes. It does not constitute financial advice, investment advice, trading advice, or any other type of advice. Past performance does not guarantee future results. Always conduct your own research and consult a qualified financial professional before making investment decisions.
Weekly Allocation
| Ticker | Category | Weight | Role |
|---|---|---|---|
| PAVE | Utilities & Infrastructure | 20% | Top-2 (20%) |
| XAR | Defense & Aerospace | 20% | Top-2 (20%) |
| IGV | Technology | 10% | Tier-2 (10%) |
| SLV | Precious Metals | 10% | Tier-2 (10%) |
| URNM | Nuclear Energy | 10% | Tier-2 (10%) |
| REMX | Industrial Metals | 10% | Tier-2 (10%) |
| BOTZ | AI | 10% | Tier-2 (10%) |
| MOO | Agriculture & Livestock | 10% | Tier-2 (10%) |
Trade Instructions — Monday Open
Sell the tranche from 2022-07-15 (completing its 4-week hold). Buy the new tranche. Instructions show net portfolio changes — same-asset positions cancel, weight changes show the delta.
| Action | Ticker | Instruction |
|---|---|---|
| SELL | XLU | Sell 50% of XLU position (reduce 10.00% → 5.00%) |
| SELL | GLD | Sell 67% of GLD position (reduce 7.50% → 2.50%) |
| SELL | XLK | Sell 14% of XLK position (reduce 17.50% → 15.00%) |
| SELL | ITA | Sell entire ITA position (2.50% of portfolio) |
| SELL | SMH | Sell 25% of SMH position (reduce 10.00% → 7.50%) |
| SELL | IEMG | Sell entire IEMG position (2.50% of portfolio) |
| BUY | PAVE | Buy PAVE — 25.00% of freed cash (adds 5.00% to portfolio) |
| BUY | XAR | Buy XAR — 25.00% of freed cash (adds 5.00% to portfolio) |
| BUY | MOO | Buy MOO — 12.50% of freed cash (adds 2.50% to portfolio) |
| BUY | IGV | Buy IGV — 12.50% of freed cash (adds 2.50% to portfolio) |
| BUY | SLV | Buy SLV — 12.50% of freed cash (adds 2.50% to portfolio) |
| BUY | BOTZ | Buy BOTZ — 12.50% of freed cash (adds 2.50% to portfolio) |
Current Portfolio After Trade
Combined holdings across all 4 active tranches. Each tranche is 25% of the portfolio.
| Ticker | % of Portfolio | Weight Bar |
|---|---|---|
| PAVE | 15.00% | |
| XLK | 15.00% | |
| XAR | 12.50% | |
| URNM | 10.00% | |
| SMH | 7.50% | |
| MOO | 7.50% | |
| XLU | 5.00% | |
| GDX | 5.00% | |
| GLD | 2.50% | |
| XLE | 2.50% | |
| FCG | 2.50% | |
| COPX | 2.50% | |
| INDA | 2.50% | |
| IGV | 2.50% | |
| SLV | 2.50% | |
| REMX | 2.50% | |
| BOTZ | 2.50% |
Macro Regime — Disinflation
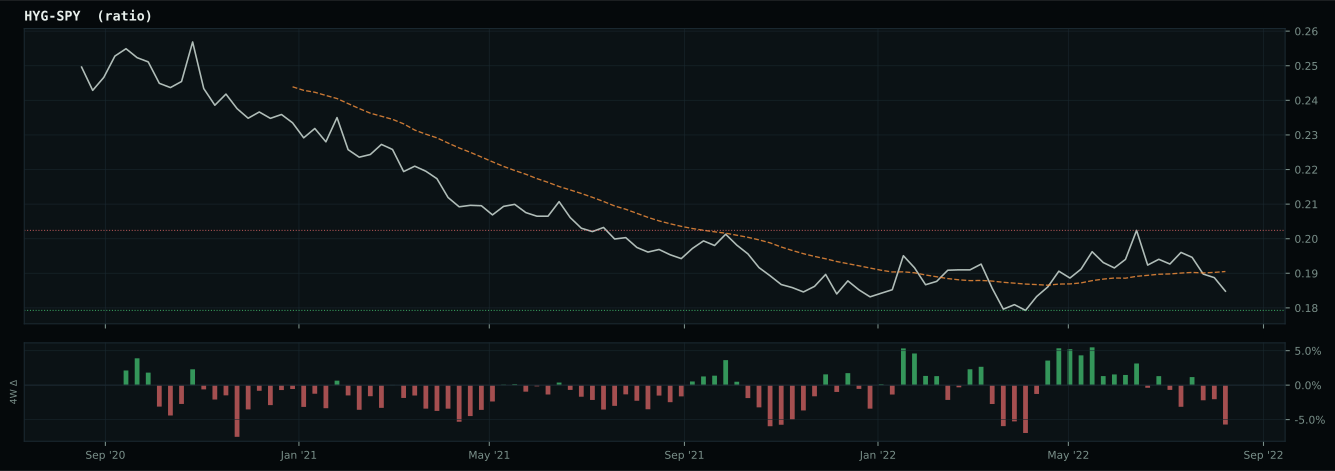
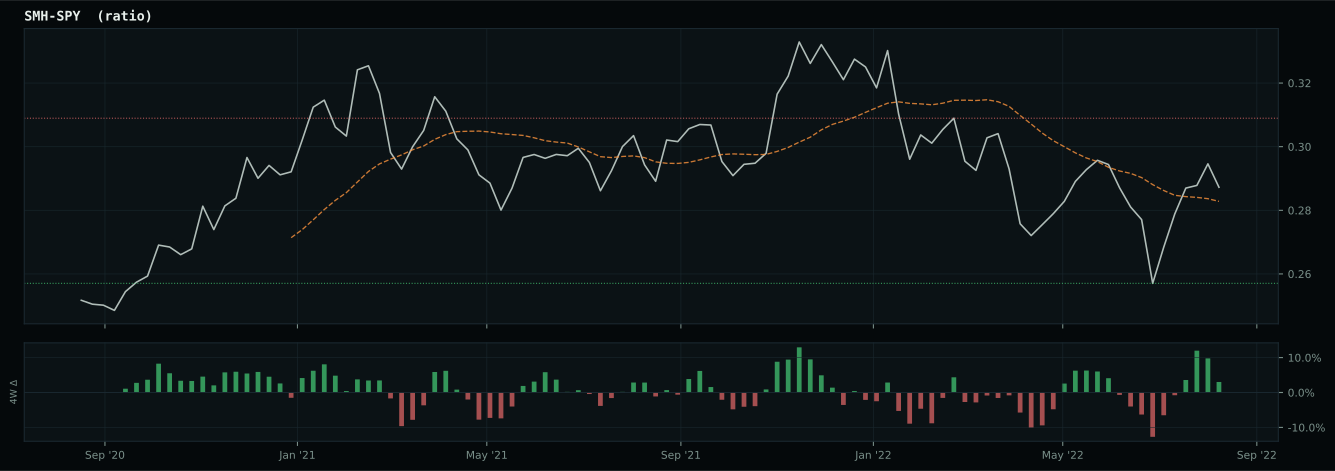
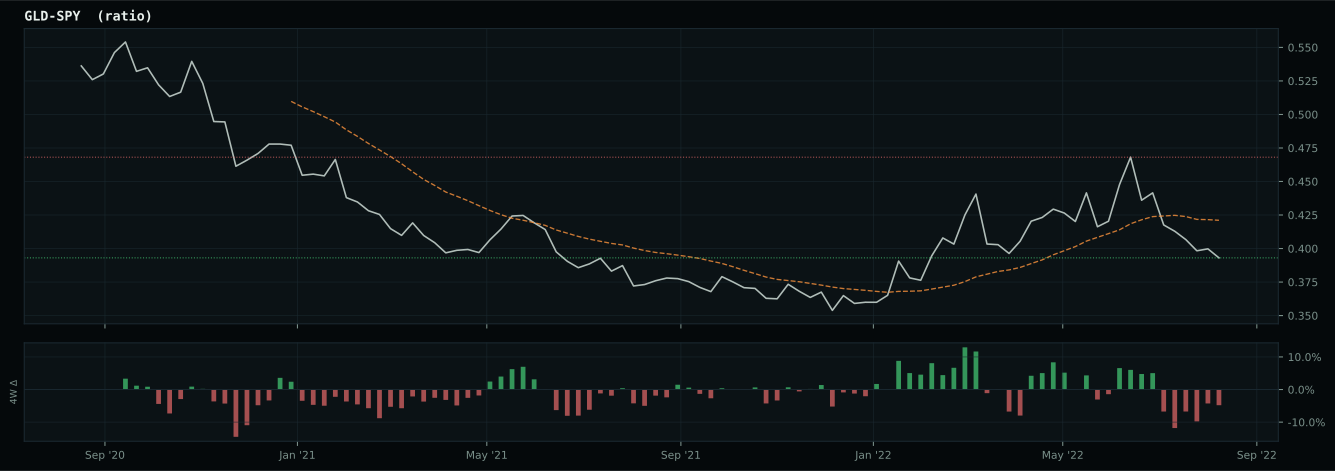
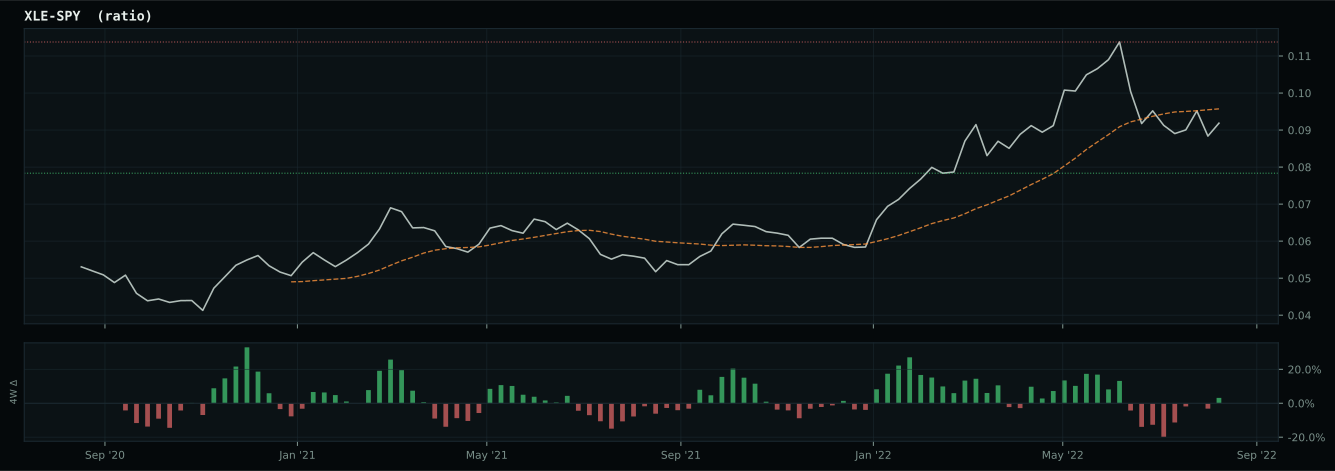
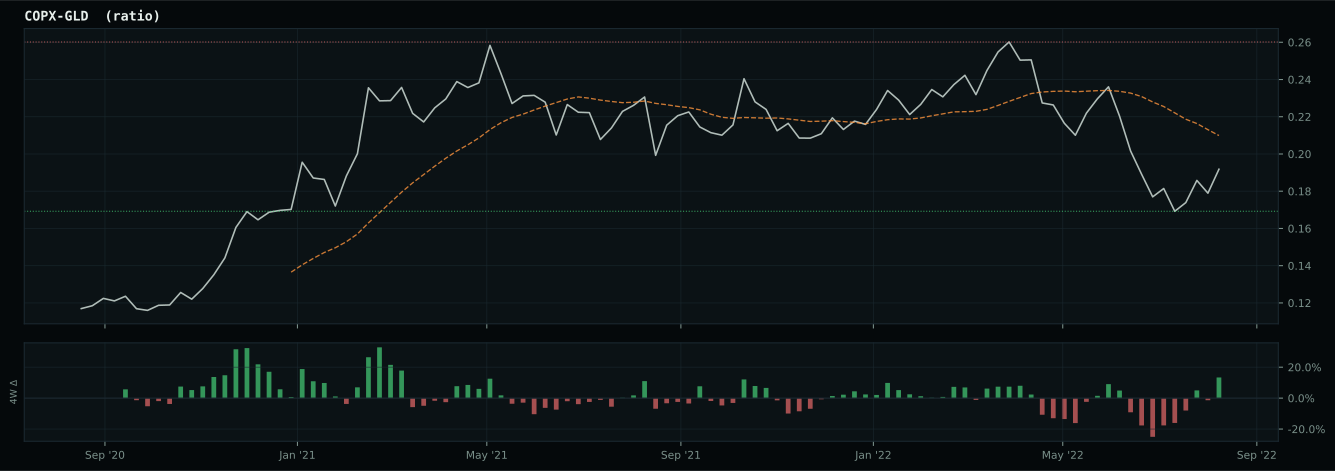
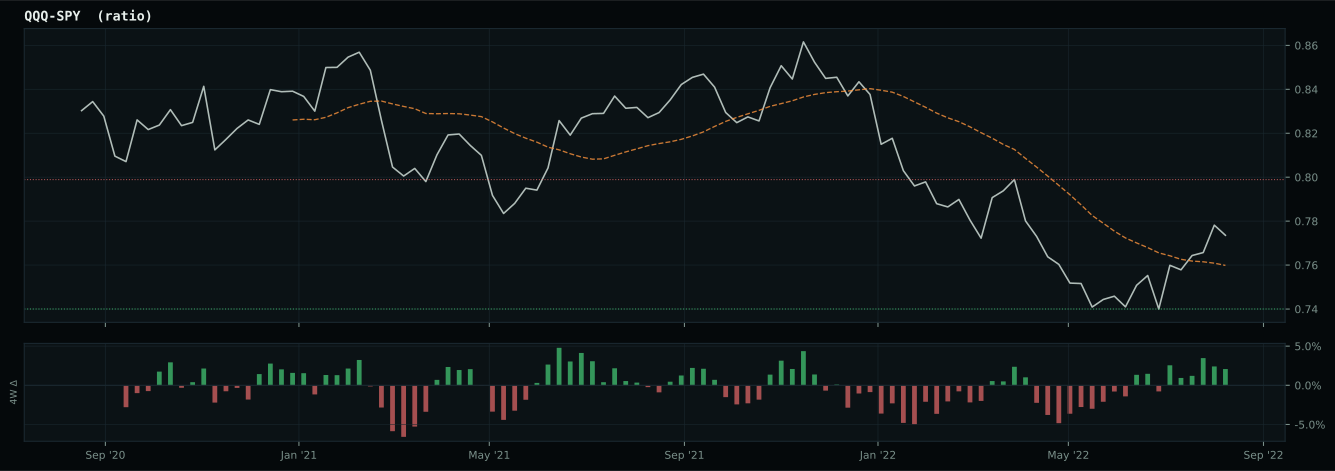
Macro Evidence Charts
Market-implied signals behind the macro regime scores. Each ratio compares two assets; the direction and slope of the ratio is what the macro engine reads.
Crypto Regime — NoCrypto
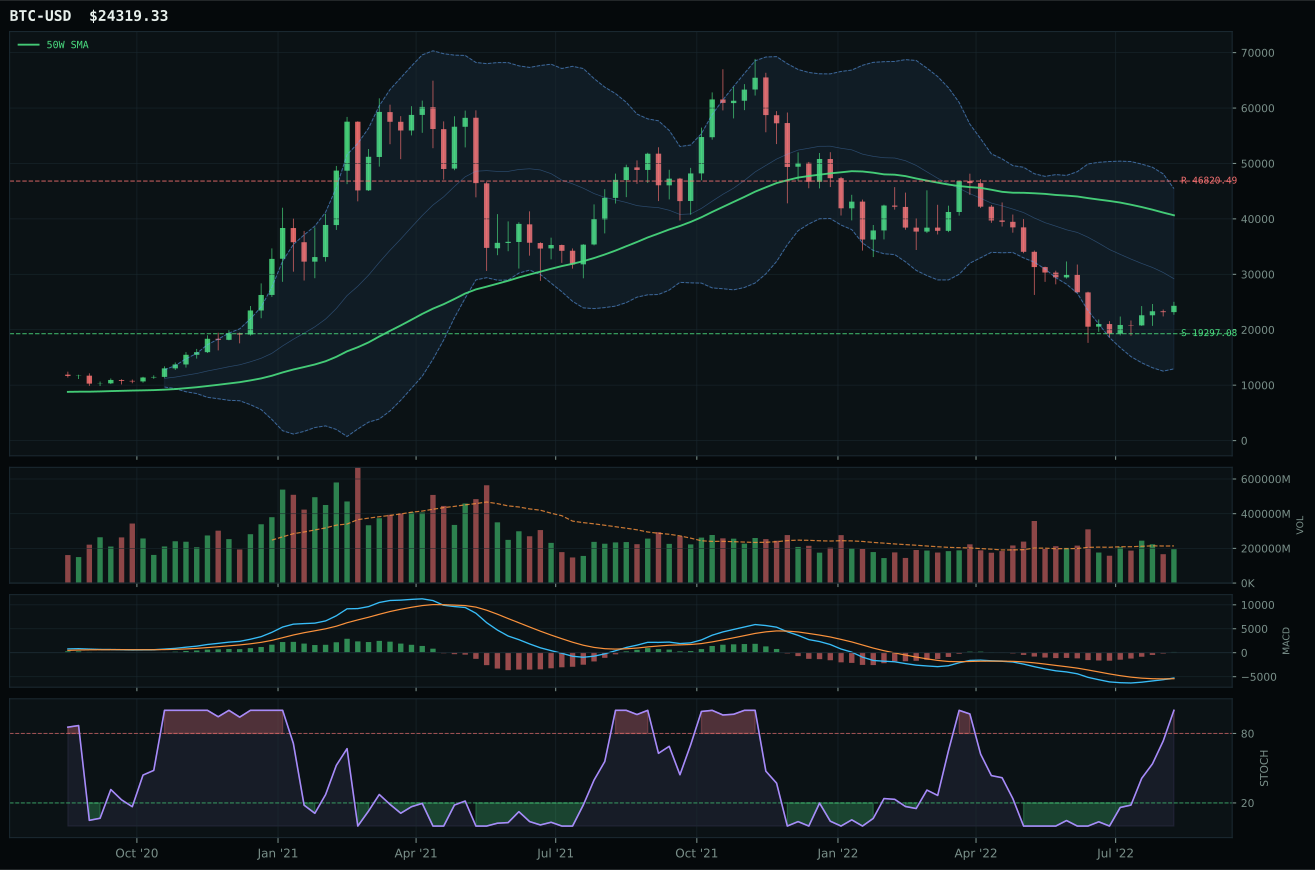
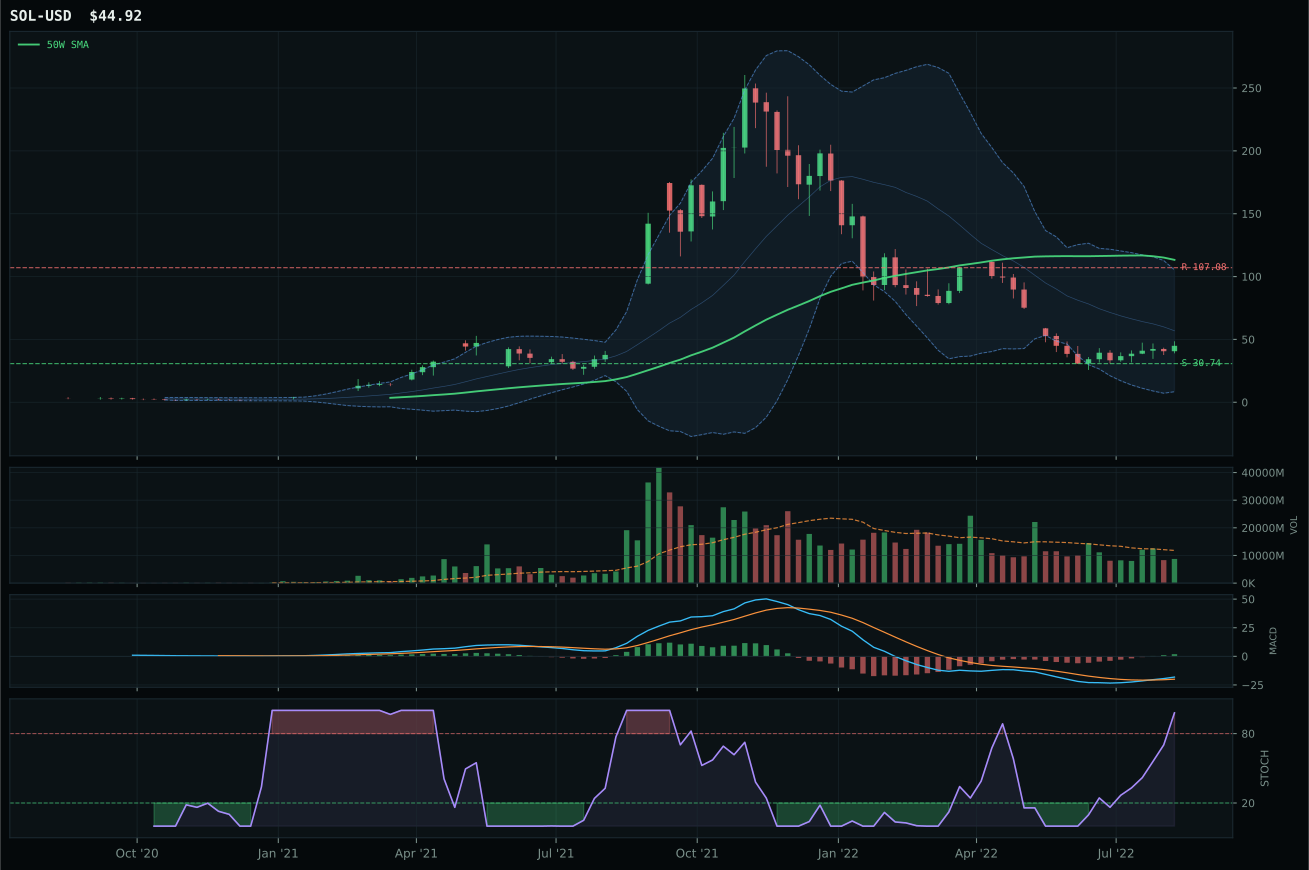
ValueBTC armed by first 200W buy-zone touch, but post-touch range age is 8 weeks; minimum is 12
TrendBTC not confirmed
one or more available conditions failed
Category Rankings
| Rank | Category | Winner | Score | Alloc | 4W Ret | Peers (4W) |
|---|---|---|---|---|---|---|
| 1 | Utilities & Infrastructure | PAVE | 71.8 | 20% | -2.41% | XLU +1.3% · IGF -1.1% |
| 2 | Defense & Aerospace | XAR | 60.0 | 20% | -6.31% | ITA -3.8% · ROKT -6.3% |
| 3 | Technology | IGV | 59.3 | 10% | -6.71% | CIBR -4.0% · XLK -8.0% |
| 4 | Precious Metals | SLV | 49.5 | 10% | -2.68% | GLD -3.0% · GDX -3.5% |
| 5 | Nuclear Energy | URNM | 48.4 | 10% | +21.69% | URA +13.4% · NLR +1.9% |
| 6 | Industrial Metals | REMX | 47.3 | 10% | +0.48% | PICK +2.4% · COPX +2.3% |
| 7 | AI | BOTZ | 41.5 | 10% | -10.51% | SMH -10.7% · AIQ -7.0% |
| 8 | Agriculture & Livestock | MOO | 26.3 | 10% | -0.47% | VEGI +1.6% · WEAT +7.2% |
| 9 | Emerging Markets | ILF | 21.5 | 0% | +1.06% | INDA +1.4% · IEMG -3.0% |
| 10 | Traditional Energy | XOP | 16.6 | 0% | +7.99% | FCG +9.2% · XLE +8.1% |
Utilities & Infrastructure — PAVE
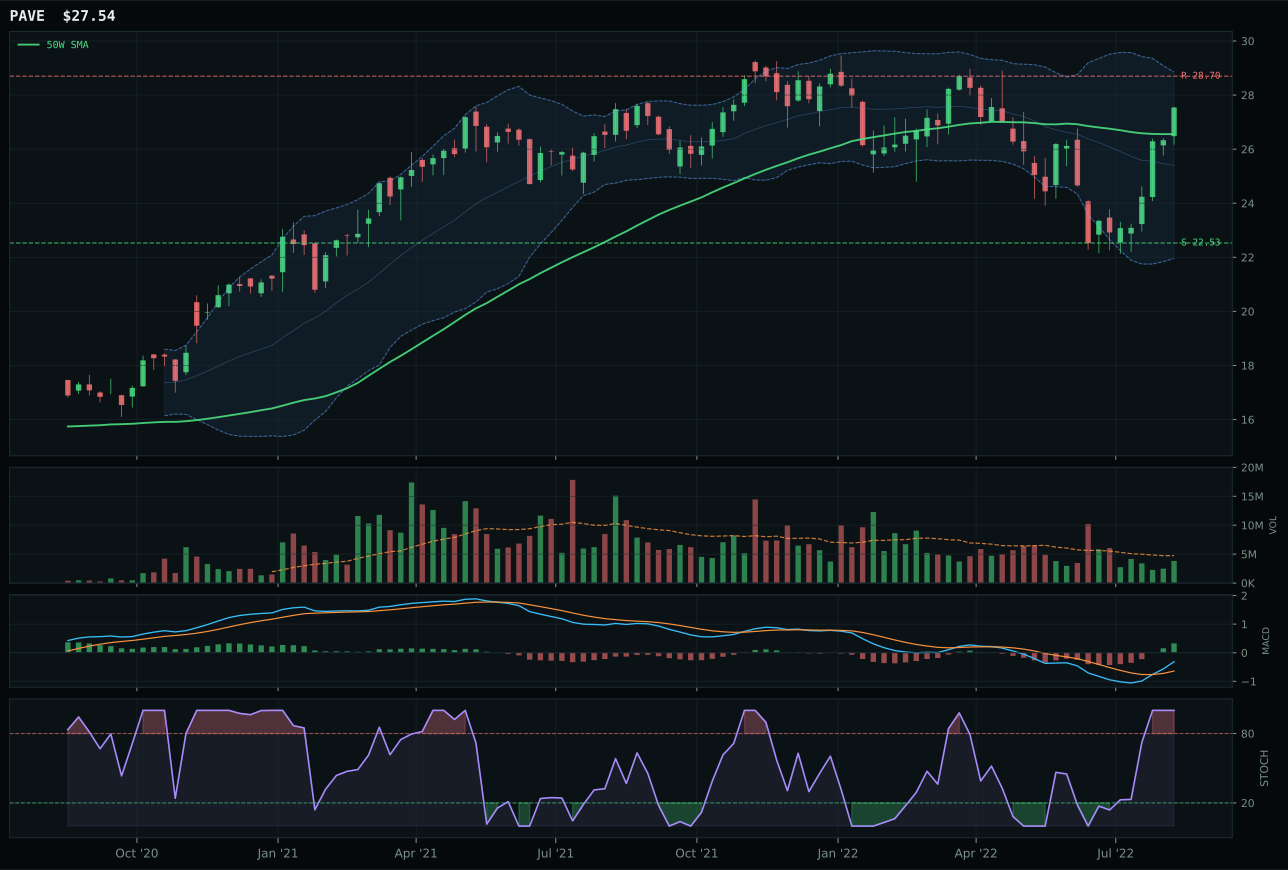
PAVE has a neutral structure profile with 3.6% 13-week relative strength versus SPY.
A failed hold above support would weaken the setup.
Actionable but governed by invalidation levels.
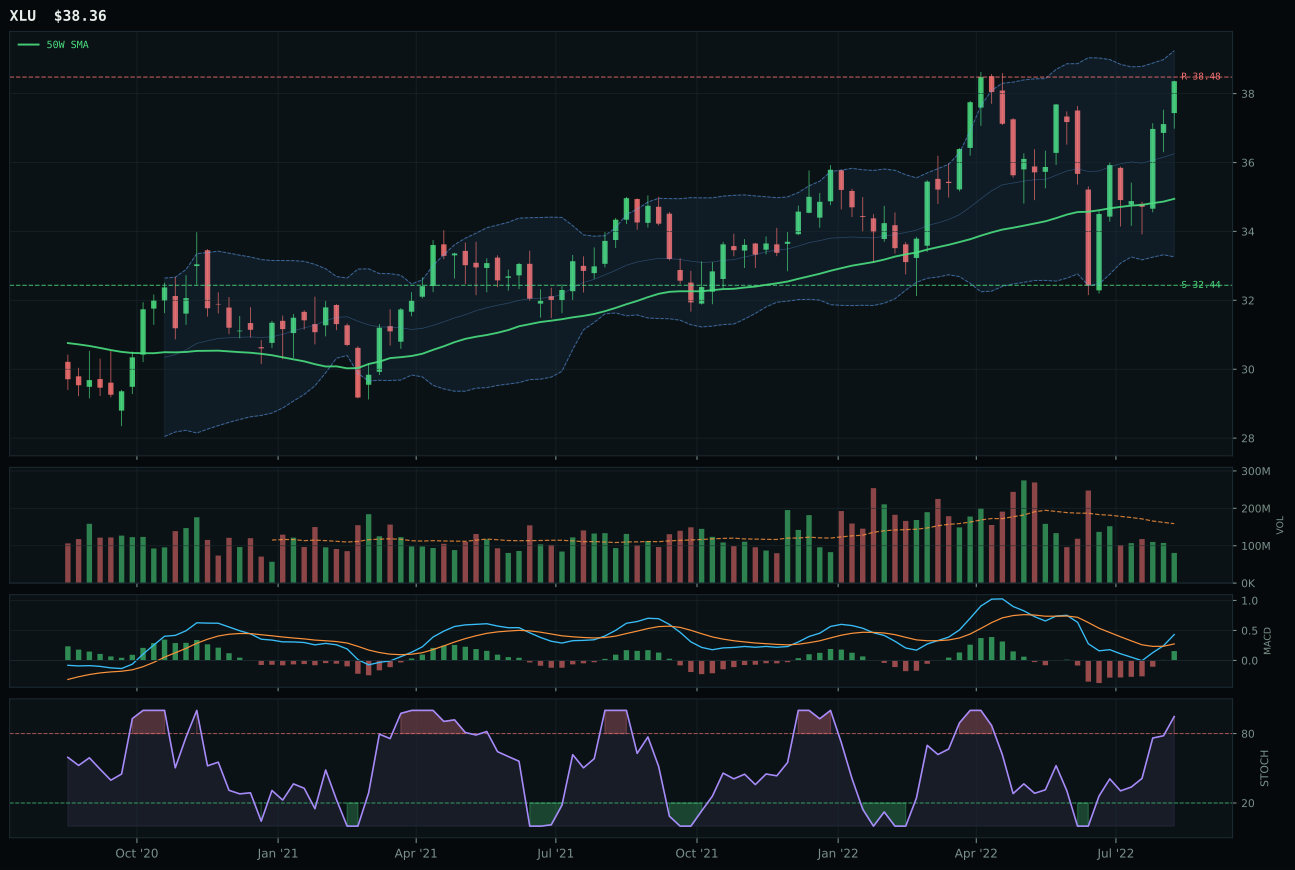
XLU has a neutral structure profile with 1.1% 13-week relative strength versus SPY.
A failed hold above support would weaken the setup.
Actionable but governed by invalidation levels.
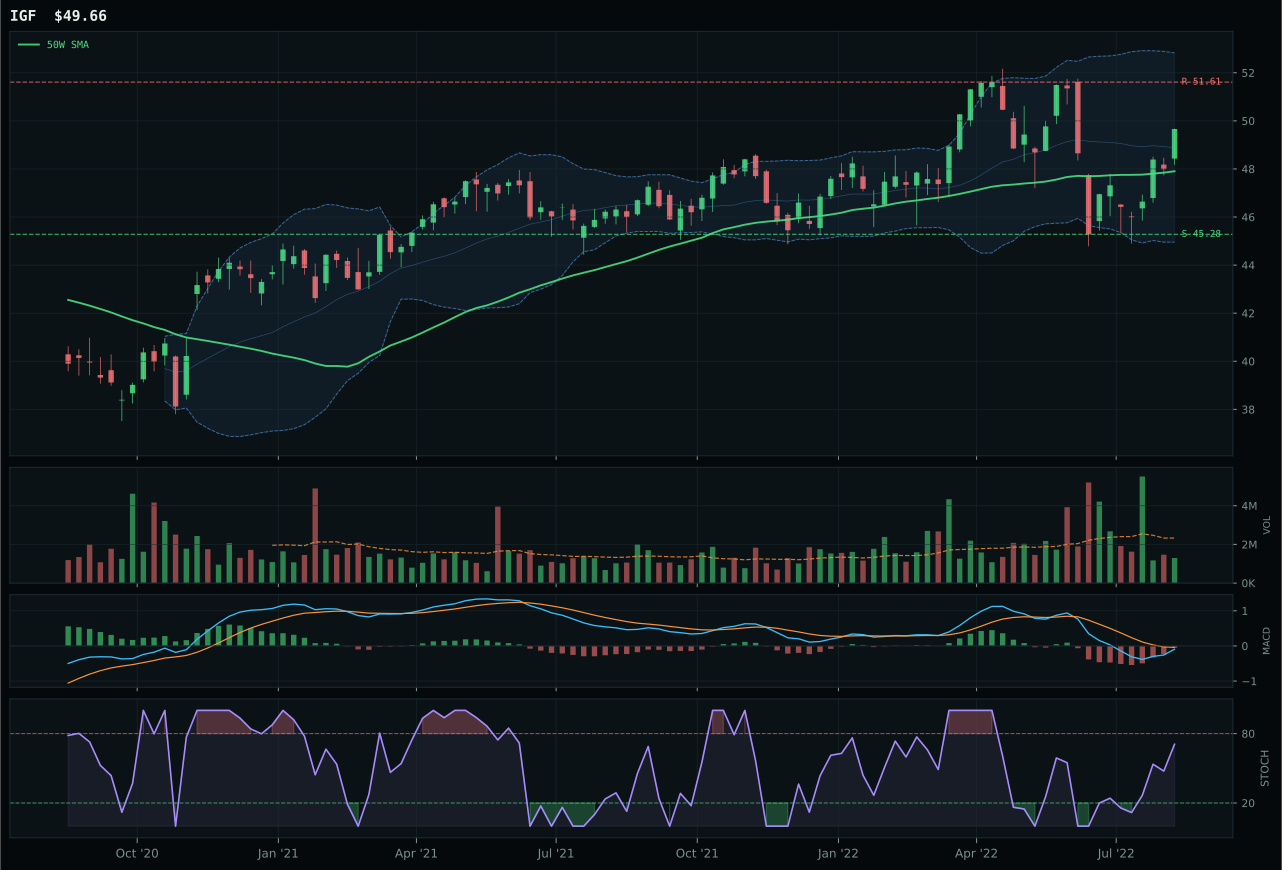
IGF has a neutral structure profile with -4.3% 13-week relative strength versus SPY.
A failed hold above support would weaken the setup.
Actionable but governed by invalidation levels.
PAVE seized the top-2 ranking by combining the strongest disinflation momentum (9.9% 13W return, 3.6% SPY-relative outperformance) with a technically controlled entry at 3.7% above the 50W in compressed structure. A perfect 100/100 momentum confirmation score and 90/100 timing reflect a fund in early-stage leadership without extended valuation stretch—price sits in the upper Fib zone but near enough to the 50W that support remains overhead at 22.53. The 95.4 trend score (above both MAs with flat slope) and 76.7 volume-price confirmation mark this as the cleanest technical setup in the entire portfolio: buyers are accumulating in compressed structure, MACD is bullish and improving, stochastic RSI overbought. XLU lost on three precise counts: timing fell to 75/100 (price 9.8% extended above 50W, out of prime entry), risk-reward collapsed to 37.3 versus PAVE's 48.3 (too much upside priced in), and volume turned thin instead of neutral—classic late-stage leadership weakness.
PAVE's 20% allocation caps the top-two alongside XAR because Utilities & Infrastructure scored 71.8, the highest final category score in the portfolio. The macro fit of 80/100 is exceptional: disinflation (+7), defensive rotation (+12), and disinflation pressure (+6) all flow toward rate-sensitive infrastructure and dividend-yielding utilities. Transition / Mixed macro also adds +4, making this the regime's most natural long—when duration peaks and real yields compress, infrastructure capex cycles accelerate and utility margins expand. PAVE's 84.3 technical evidence score and 9.9% 13W return prove this is not a defensive dead money hold but an active participant in the disinflationary rebalance. The portfolio is now anchored: 20% PAVE (growth within defensives), 20% XAR (geopolitical capex defense), leaving 60% distributed across six categories in a risk-off posture. This structure reflects the macro regime precisely: 40% committed to cyclical upside in infrastructure and defense, 60% distributed across commodity scarcity, precious metals, nuclear, AI, and tactical pockets in technology and energy. PAVE's allocation is the highest conviction play after XAR because its technical and macro arguments align perfectly with disinflation rate dynamics.
Defense & Aerospace — XAR
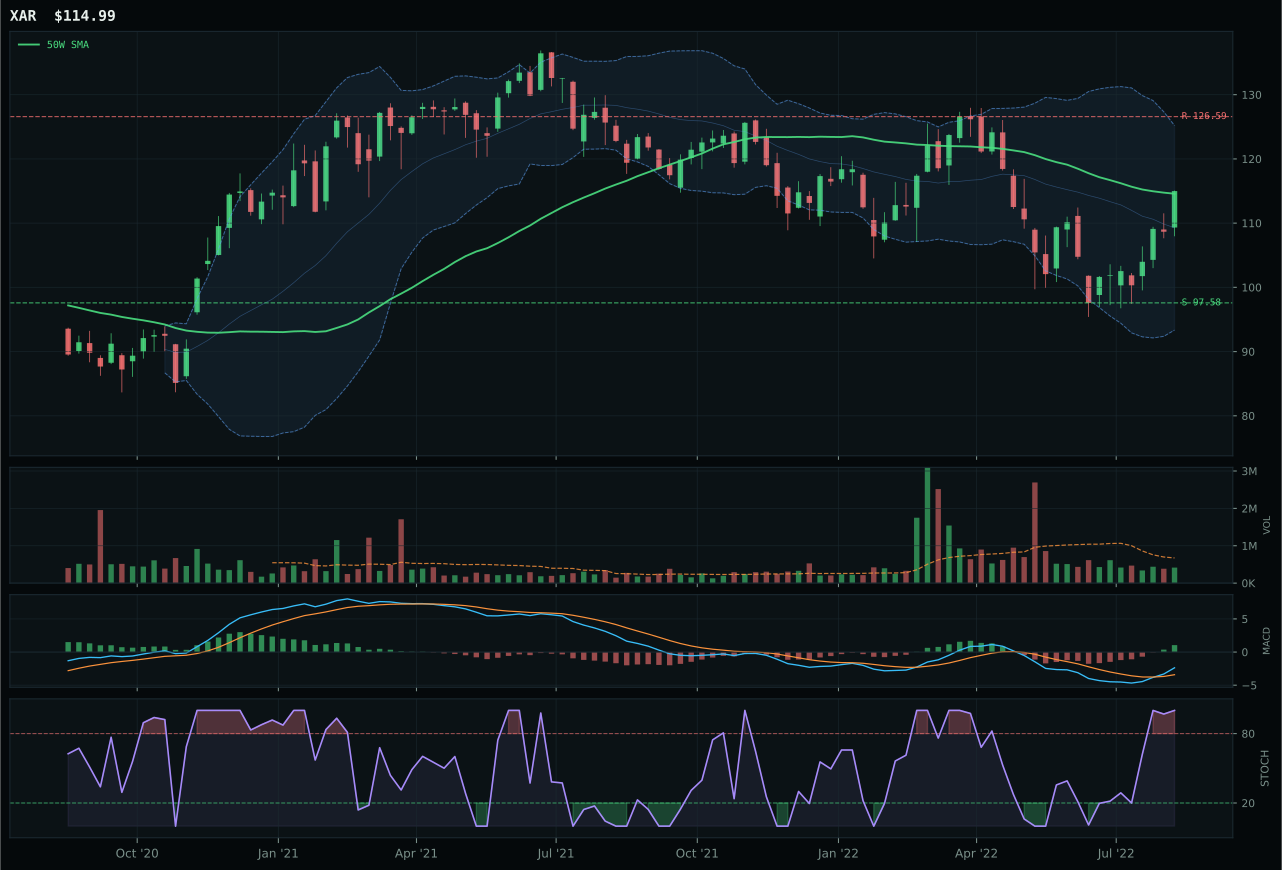
XAR has a compression near 50W profile with 2.7% 13-week relative strength versus SPY.
A failed hold above support would weaken the setup.
Actionable but governed by invalidation levels.
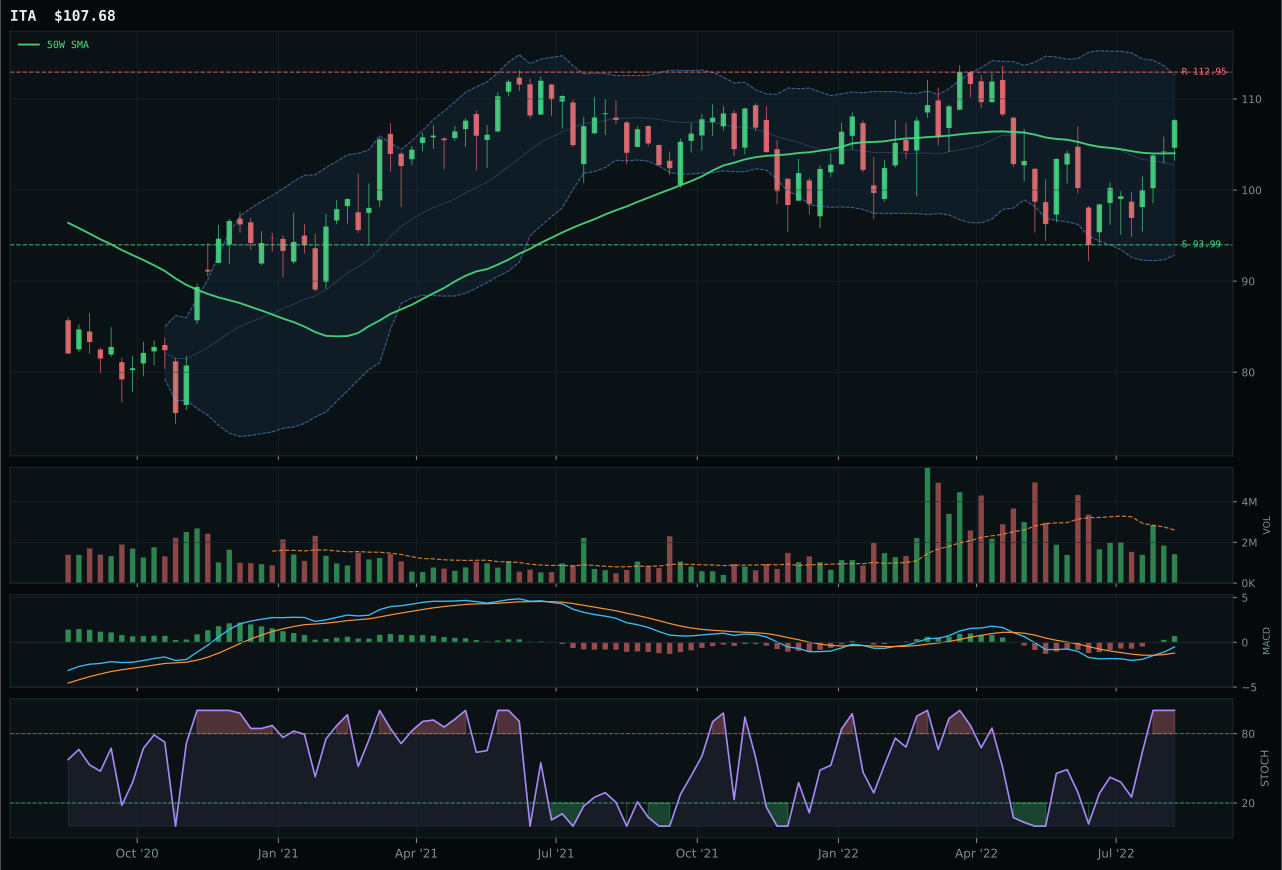
ITA has a neutral structure profile with 2.8% 13-week relative strength versus SPY.
A failed hold above support would weaken the setup.
Actionable but governed by invalidation levels.
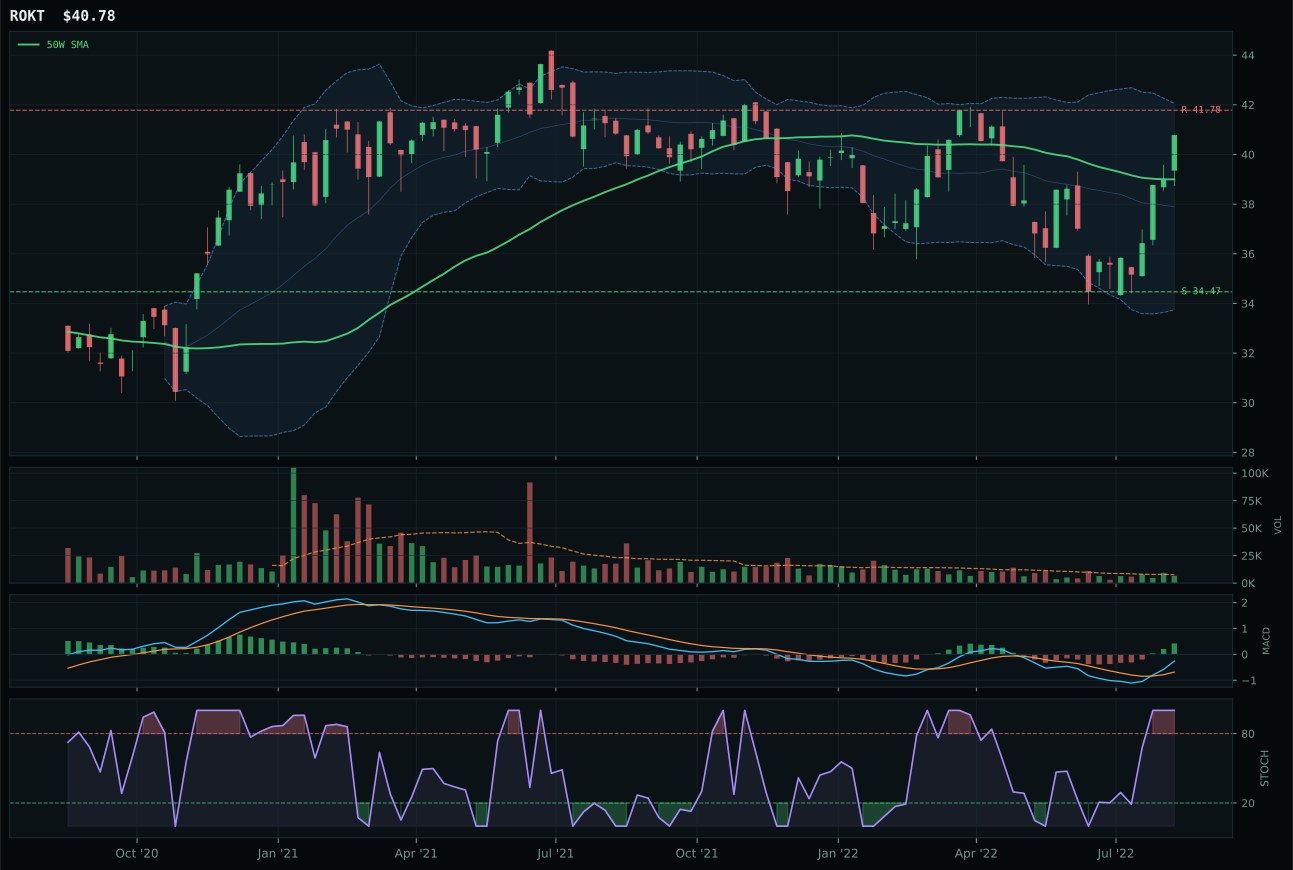
ROKT has a neutral structure profile with 4.4% 13-week relative strength versus SPY.
A failed hold above support would weaken the setup.
Tracked, but not top-2 eligible because: .
XAR earned top-2 status by nailing the timing game in a category that is inherently defensive. Its price sits nearly flat from the 50W (+0.4%) while compression near that level (70.4 cleanliness on compression) creates a coiled spring if buyers show up. The perfect storm: 100/100 timing score, 84.1 trend (above both key moving averages with tight slope), and a 96.1 momentum confirmation that includes a 9.1% 13-week return and category-relative strength held at exactly zero (no outperformance, no lag). ITA lost two critical points—its timing score topped at 90/100 because price sits 3.7% above the 50W, putting it in the upper decision zone rather than at peak value, and risk-reward lagged at 50.8 versus XAR's 62.2 (too much upside already priced in). Both exhibit thin volume participation, but XAR's neutral structure and precise 50W proximity give it better asymmetry: 17.8% downside cushion against just 9.2% upside to resistance.
XAR's 20% allocation reflects Defense & Aerospace' ranking as the second-highest eligible category score at 60.0, powered by macro fit of 65/100. Defensive rotation is active (+8), broad market bear is active (+6), and credit stress shows a mild +2 signal—all factors that support flight-to-quality into defense contractors and geopolitical capex. The category benefited from the 3/2/1 weighted basket logic: ITA ranked first technically (69.9), but XAR's better structure and timing pushed it to the top after macro adjustment. The allocation is appropriate because disinflation conditions favor steady-margin defense suppliers over cyclical aerospace, and XAR's compression near the 50W creates a lower-risk entry before the next macro catalyst. At 71.8 for Utilities and 60.0 for Defense, the portfolio is tilted toward late-cycle and defensive rotation; XAR's thin volume is not a weakness here, but rather proof that institutional rotation into defensives is still in the early innings, making the entry technically and strategically sound.
Technology — IGV
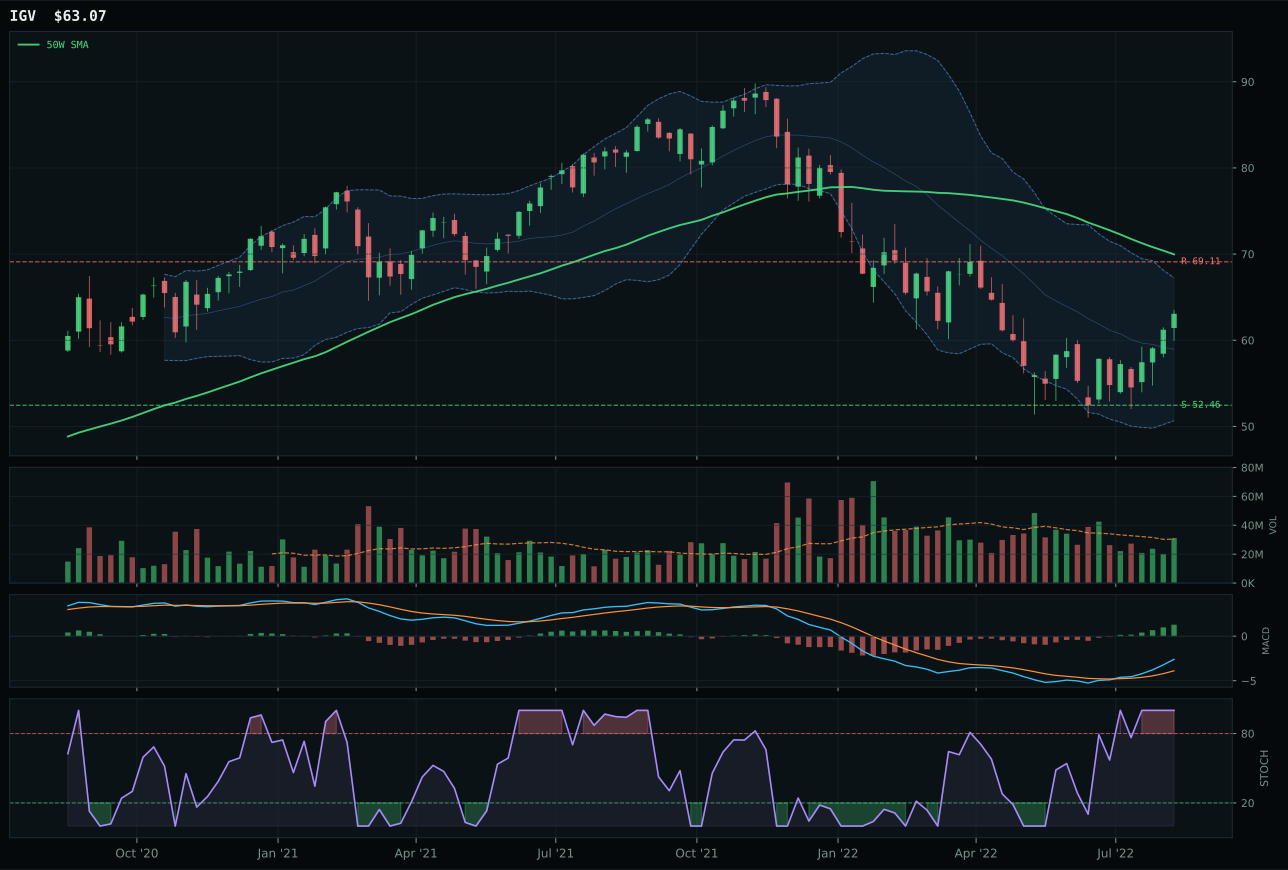
IGV has a neutral structure profile with 6.4% 13-week relative strength versus SPY.
A failed hold above support would weaken the setup.
Actionable but governed by invalidation levels.
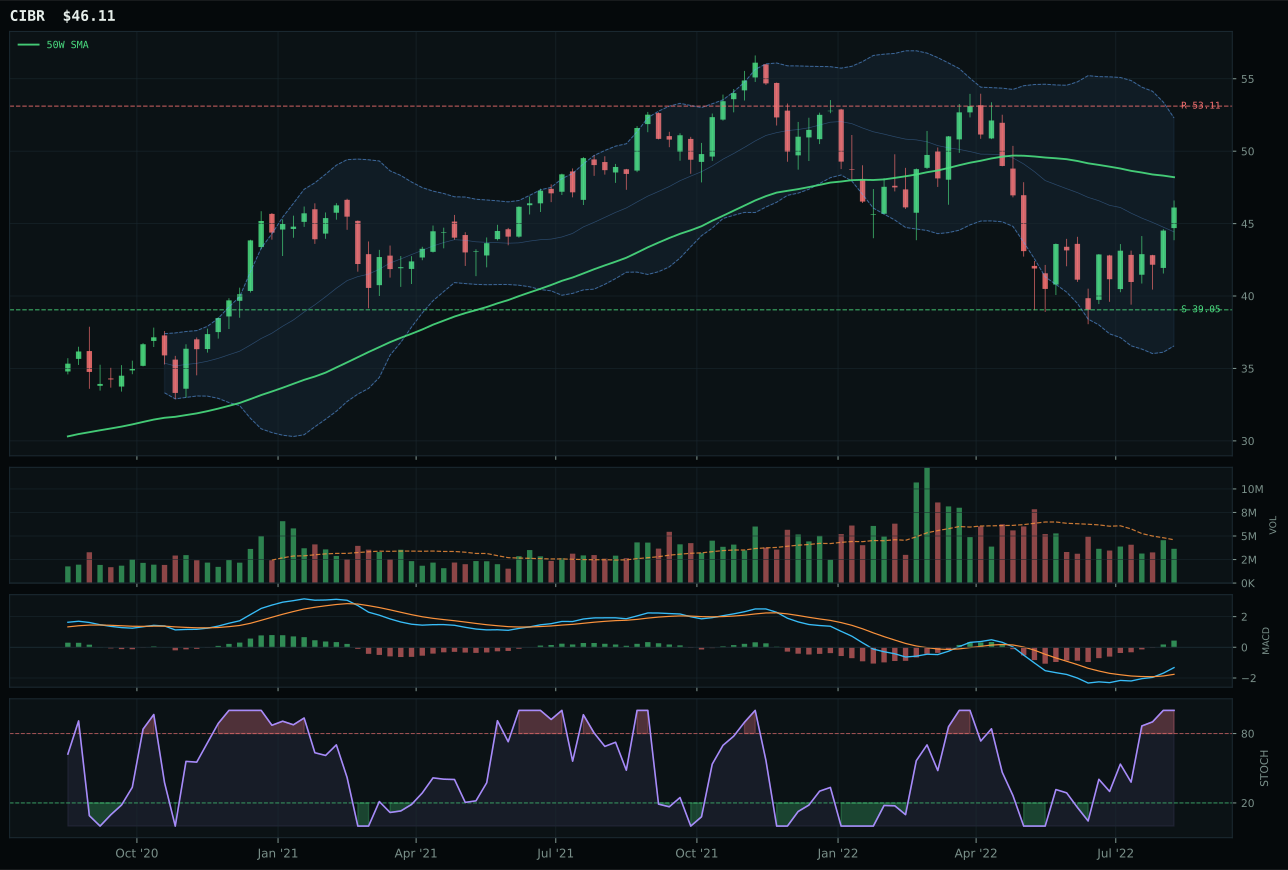
CIBR has a neutral structure profile with 3.7% 13-week relative strength versus SPY.
A failed hold above support would weaken the setup.
Actionable but governed by invalidation levels.
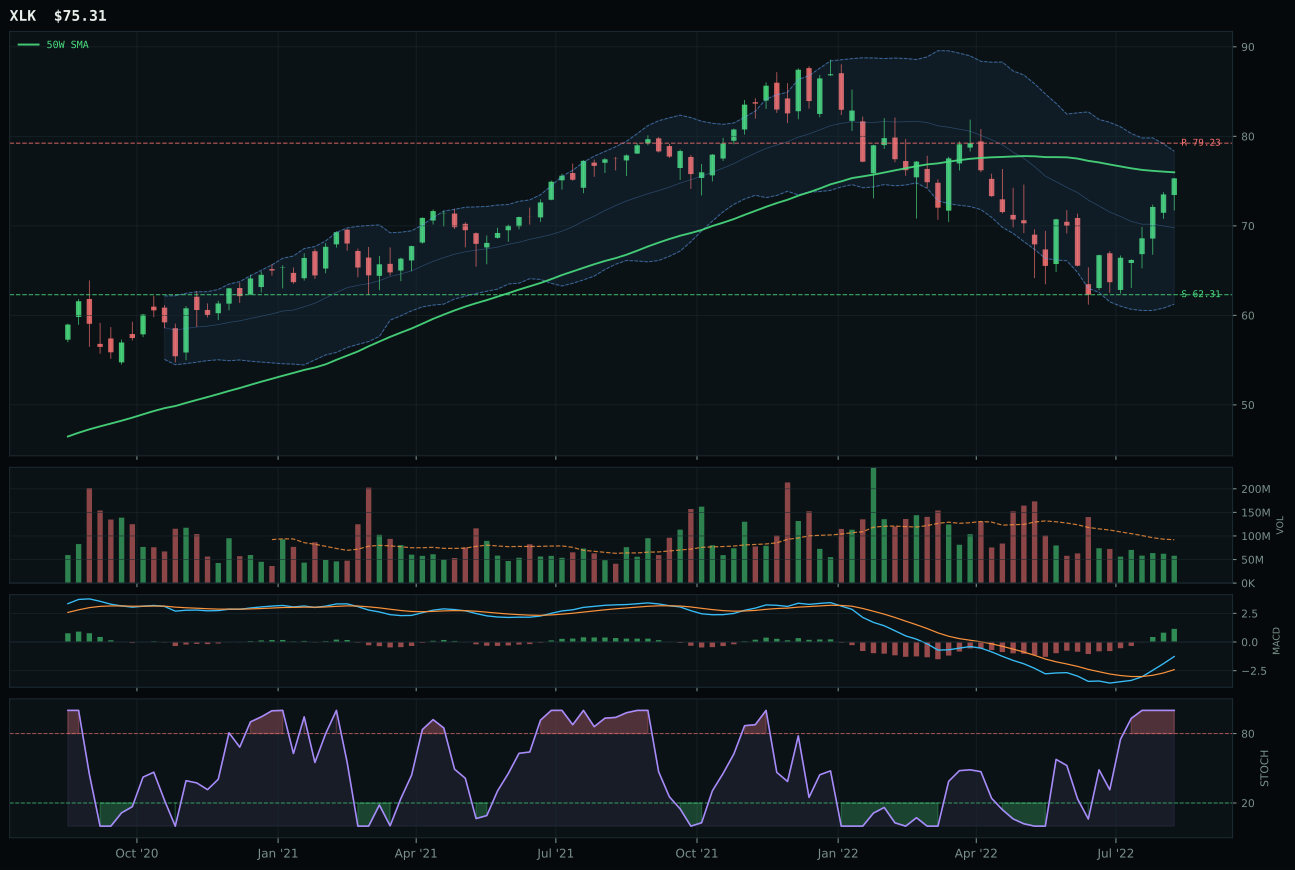
XLK has a compression near 50W profile with 4.5% 13-week relative strength versus SPY.
A failed hold above support would weaken the setup.
Actionable but governed by invalidation levels.
IGV claimed the Technology category by establishing clearer relative strength inside its three-ETF basket and timing its entry at maximum value. The fund sits 9.9% below its 50-week moving average—deep enough into the correction to matter, yet still above the 200-week anchor—creating a neutral-structure reset rather than a chase into extended territory. Its category-relative strength of 1.9% versus a 6.4% outperformance against SPY tells us buyers are rotating into software durability over cybersecurity breadth. CIBR lost ground on three technical counts: it compressed higher from the 50W (only 4.3% below versus IGV's 9.9%), its MACD improvement was present but its volume-price sponsorship weaker at 62/100, and its internal basket rank lagged at -0.8% category-relative. Both ETFs flash overbought stochastic RSI and improving MACD, but IGV's deeper pullback and superior persistence (64.9 vs 62.3) gave it the structural advantage when macro headwinds—liquidity stress at -10 and credit stress at -7—demand setup quality over narrative.
Technology earned a 10% slot not as a top-two category but as a hedge against duration compression in a disinflation regime. The macro fit of 45/100 reflects the tension: disinflation helps software valuations, yet liquidity and credit stress actively suppress cyclical hiring and capex spending. IGV's technical score of 79.5/100 carries more weight here because it is diversified software (not cybersecurity concentration) and the 74.6 trend score reflects a sturdy price structure above the 200W that is less hostile than categories ranked higher. The allocation holds because the risk-reward skews favorably—upside to resistance is only 8.7% capped, but downside cushion to support runs 20.2%, creating asymmetry in a bear market. To earn a top-2 promotion, Technology would need to clear 60+ in final score while maintaining volume-price confirmation; at 59.3, it sits just shy and ranks behind Defense (60.0) and Utilities (71.8), making it a tactical allocation that protects against a macro pivot to disinflation defense rather than growth acceleration.
Precious Metals — SLV
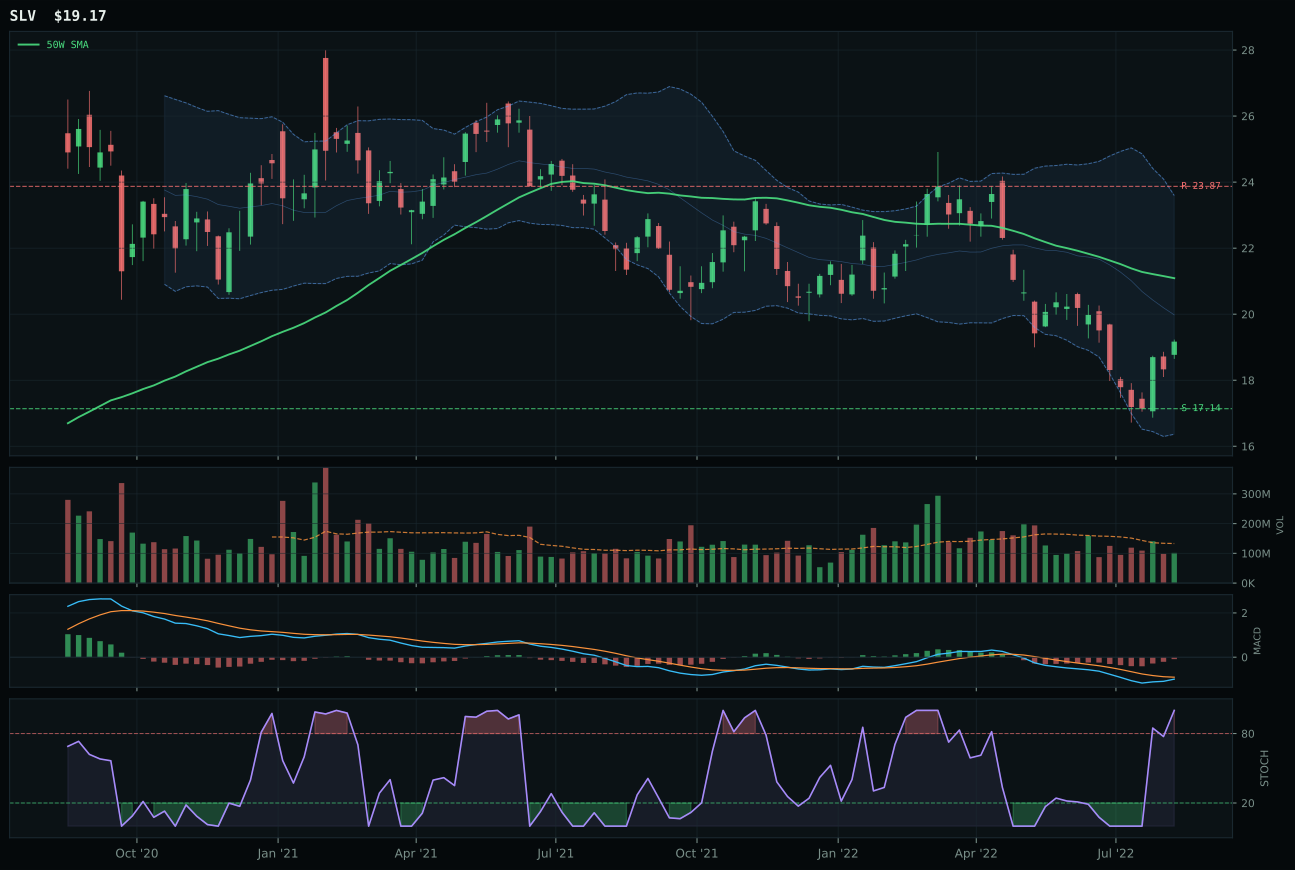
SLV has a neutral structure profile with -7.6% 13-week relative strength versus SPY.
A failed hold above support would weaken the setup.
Actionable but governed by invalidation levels.
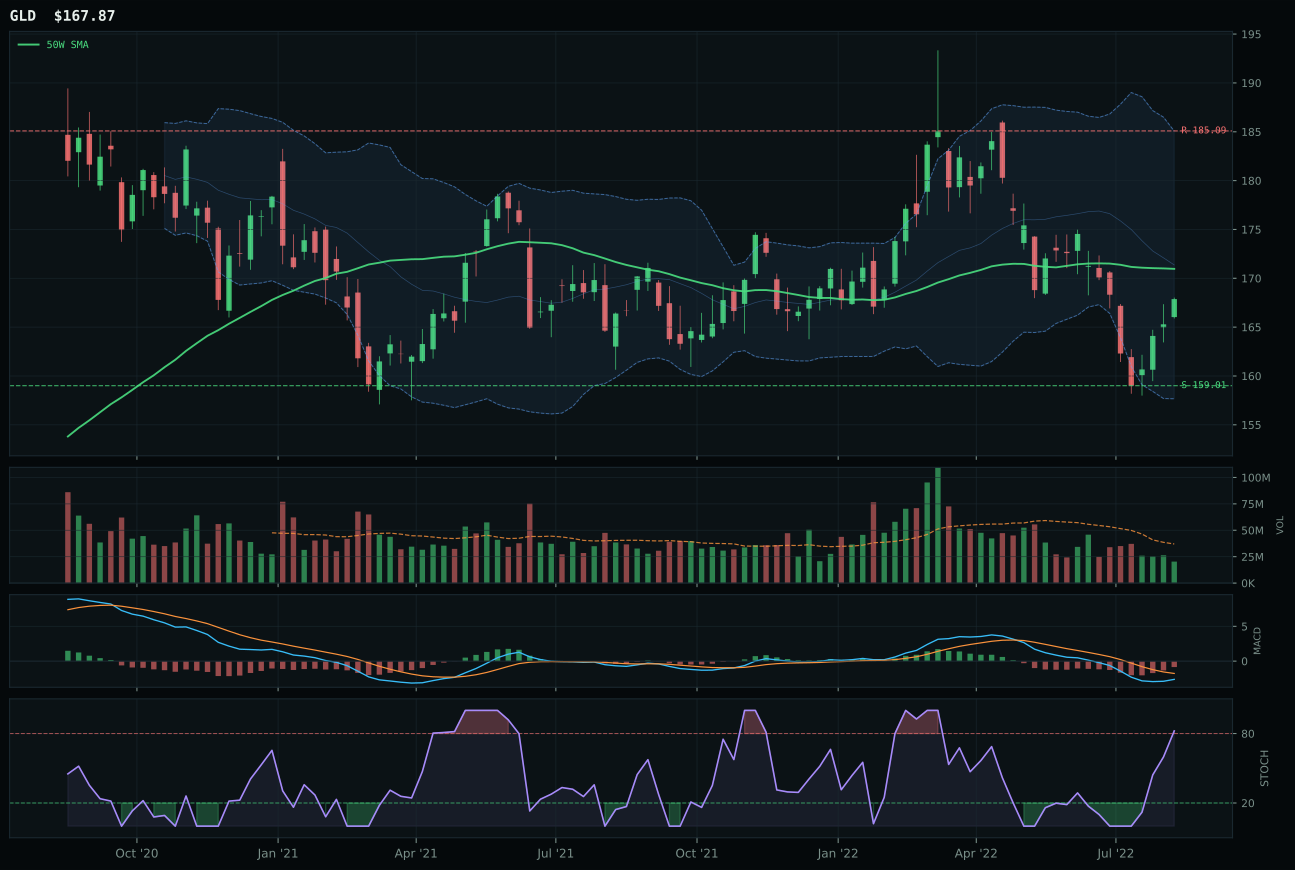
GLD has a compression near 50W profile with -6.9% 13-week relative strength versus SPY.
A failed hold above support would weaken the setup.
Actionable but governed by invalidation levels.
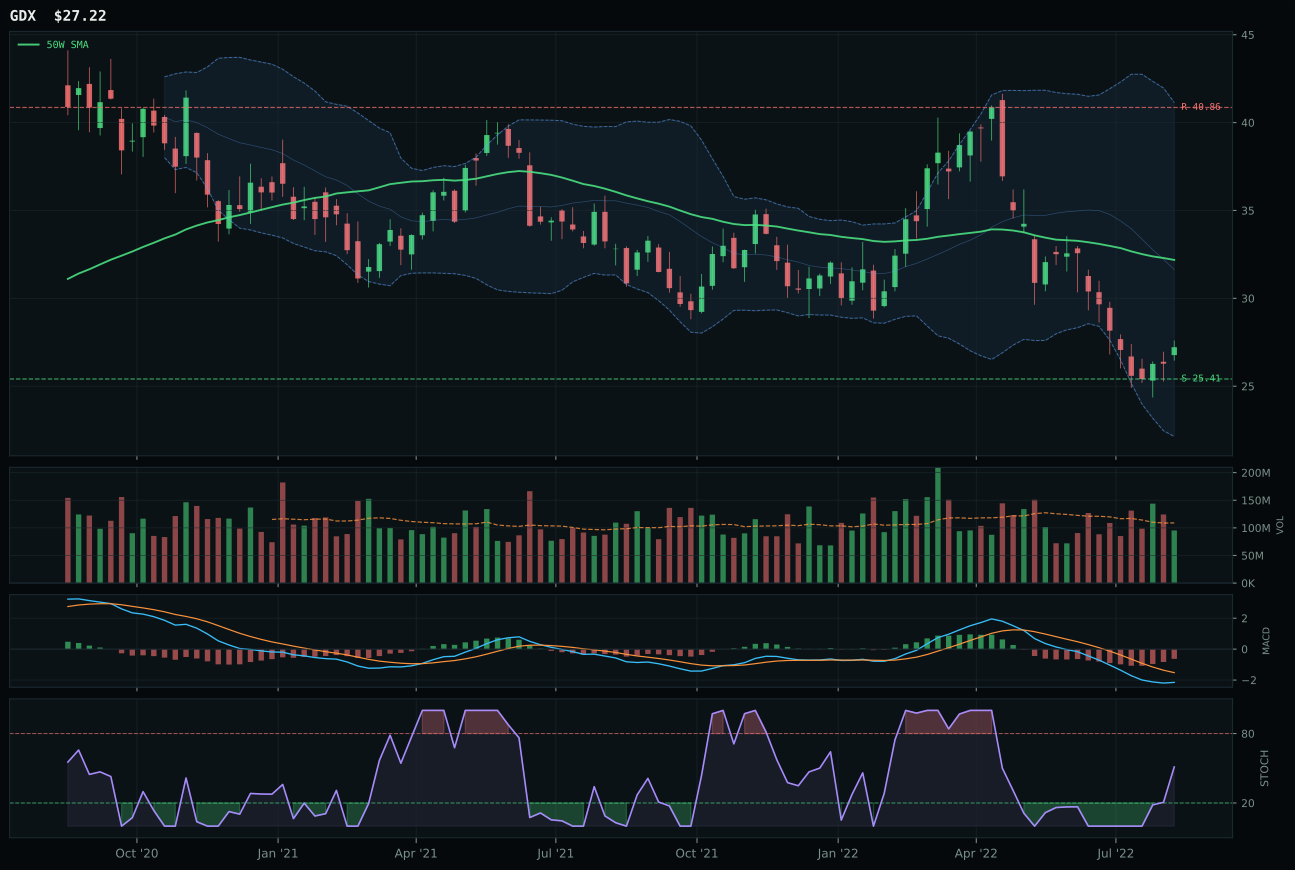
GDX has a neutral structure profile with -18.2% 13-week relative strength versus SPY.
A failed hold above support would weaken the setup.
Actionable but governed by invalidation levels.
SLV captured the Precious Metals slot by offering the cleanest volume-price sponsorship in a category screaming for accumulation confirmation. While GLD shows superior macro fit (64/100 vs 52/100) as the clean monetary hedge in disinflation, SLV's neutral volume (0.76x average) beats GLD's thin participation during a setup that demands bodies on the bid. SLV sits 9.1% below the 50W in the 0.618 Fibonacci retracement zone—deep value territory—while GLD compressed near the 50W (+1.8%), which means GLD is already in early buyers' hands whereas SLV still offers entry. The category-relative strength of zero (SLV tied at median) avoids the pitfall of chasing an isolated leader; both funds flash overbought stochastic momentum and improving MACD, but SLV's 82/100 timing score and 74.9 risk-reward (19.7% upside cap, 11.8% downside cushion) create better risk geometry for a fund where the bearish structure (-1.3% 13W return) demands structural patience.
Precious Metals earned 10% because the category's 71/100 macro fit—highest of all allocated categories—reflects a powerful tailwind from disinflation (+8), defensive rotation (+7), and metals scarcity (+7). Credit and liquidity stress are present, but the macro regime is explicitly supportive of monetary hedges and hard-asset hoarding. SLV's 49.5 final score ranks fifth overall, placing it below top-two and behind Technology, Defense, and Utilities, yet well above Agriculture and Traditional Energy. The allocation sticks because in disinflation, precious metals are the regime's natural hedge—investors rotate from growth duration into purchasing-power protection, and silver's hybrid role (monetary + industrial) gives it stickiness if demand stabilizes. The 10% holds SLV's structural weakness (bearish MACD, below 200W) in check; to earn a top-2 promotion, this category would need to close above 60, which would require volume-price acceleration and a clear break above the 50W. Until then, this is a tactical allocation with strong macro support but weak near-term price momentum—classic disinflation positioning.
Nuclear Energy — URNM
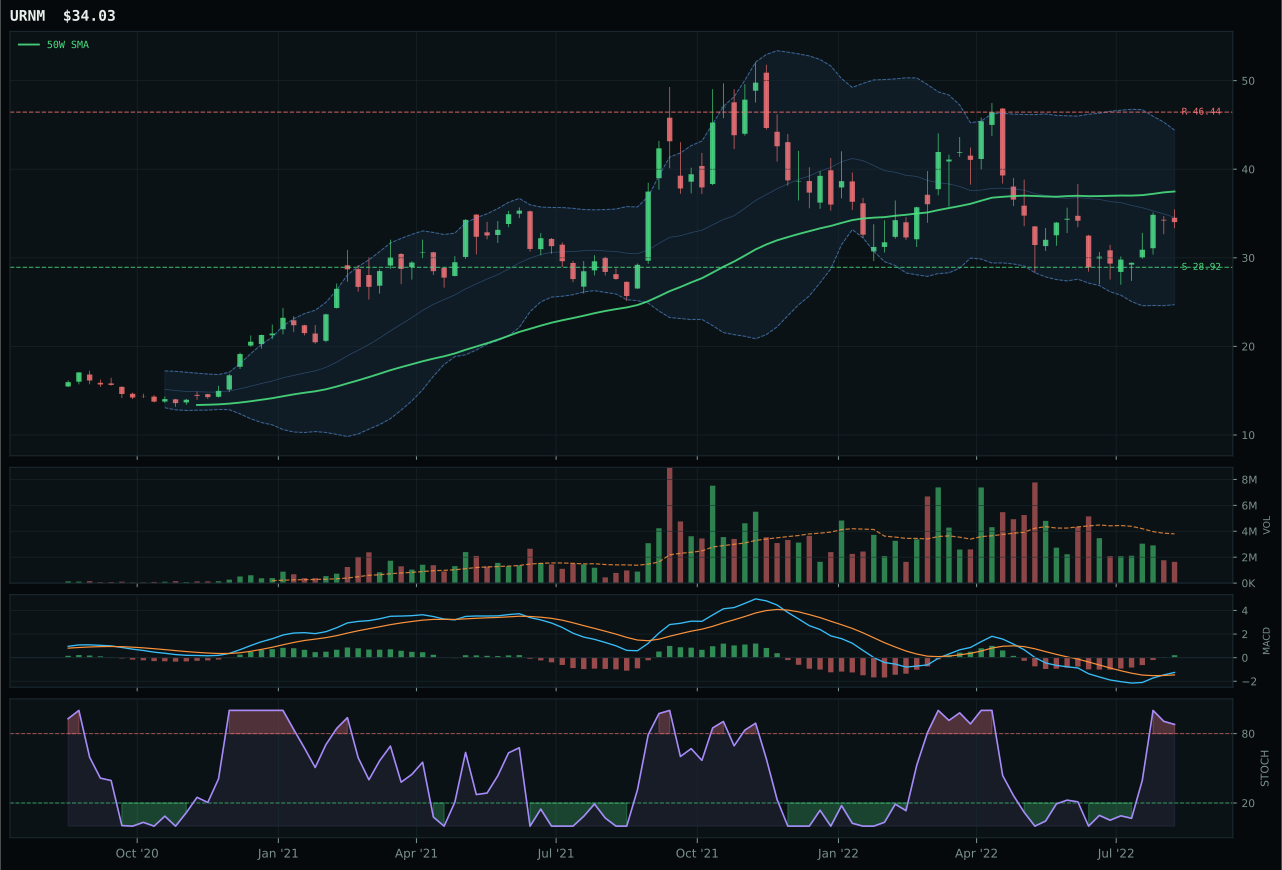
URNM has a neutral structure profile with 1.9% 13-week relative strength versus SPY.
A failed hold above support would weaken the setup.
Actionable but governed by invalidation levels.
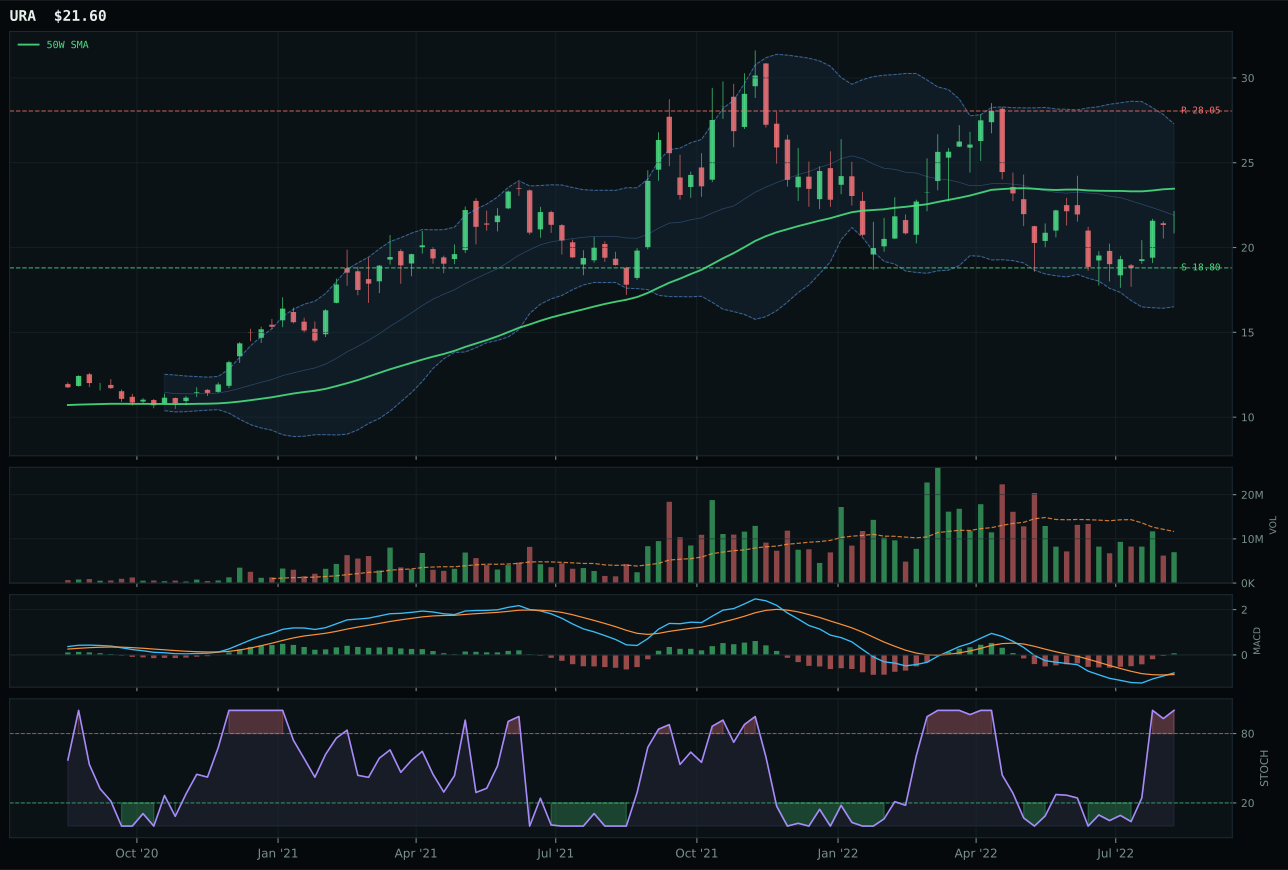
URA has a neutral structure profile with 0.2% 13-week relative strength versus SPY.
A failed hold above support would weaken the setup.
Actionable but governed by invalidation levels.
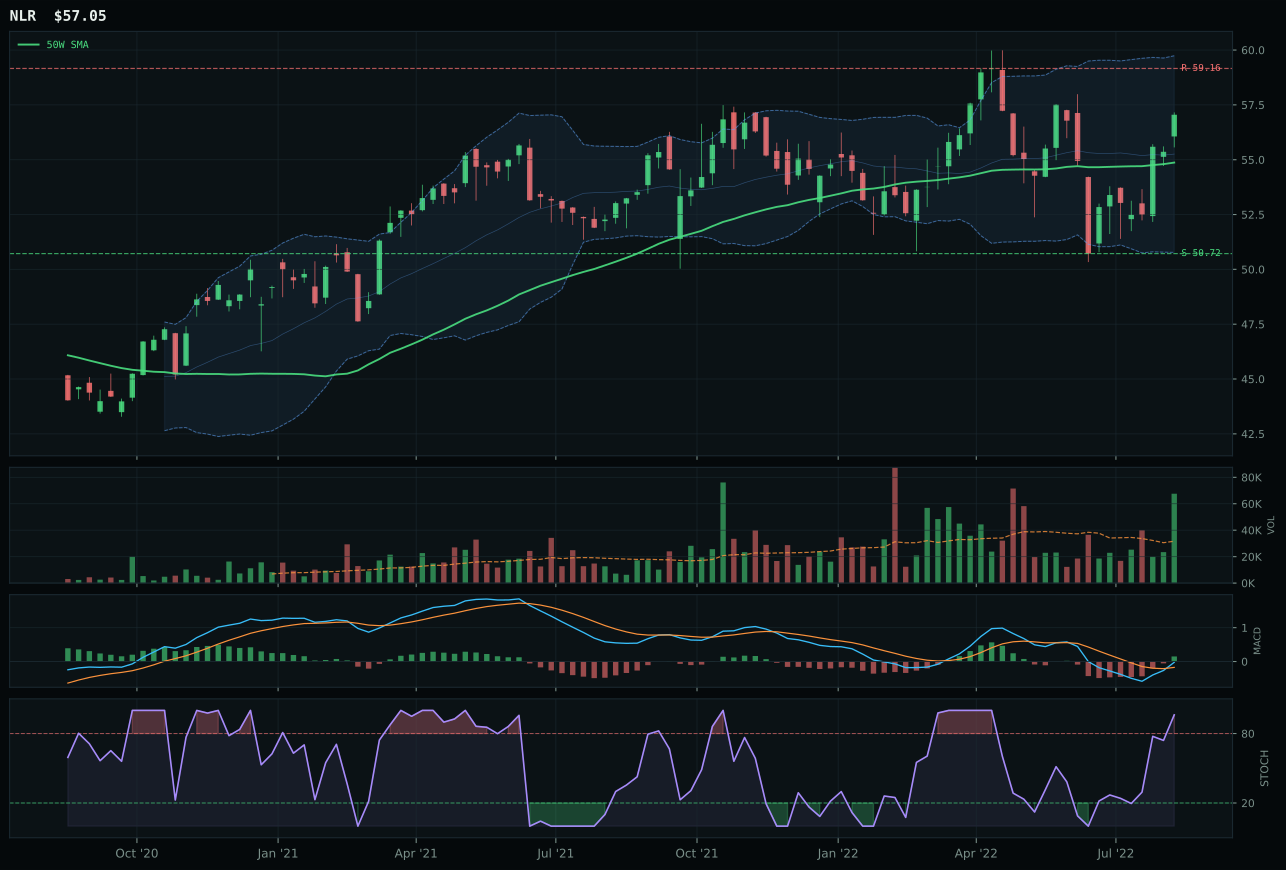
NLR has a neutral structure profile with -1.2% 13-week relative strength versus SPY.
A failed hold above support would weaken the setup.
Tracked, but not top-2 eligible because: .
URNM edged URA despite a weaker overall technical score (58/100 vs 67.9) because category-relative strength turned the vote: URNM holds 1.7% outperformance versus the category median, while URA ties at zero. Both sit in deep retracement value zones (Fib 0.618) after pulling 9.2% below the 50W; both show bullish MACD and overbought stochastic RSI; both carry thin participation. The statistical nod goes to URA—higher trend score (85 vs 68), better timing (82 vs 75), superior risk-reward (58 vs 57)—but URA's category-neutral behavior in a constructive category becomes a liability when the tiebreaker is momentum sponsorship. URNM's 15.6% 4-week return and internal basket leadership of 1.7% prove that uranium scarcity flows are flowing toward the miner-exposure fund, not the pure uranium play. Both trade thin, both show improving MACD in a setup begging for accumulation, but URNM's category edge is the deciding factor when macro winds are mixed.
Nuclear Energy claimed 10% at a 48.4 score, ranking seventh overall, because real asset sponsorship (+7) and metals scarcity (+5 implied through uranium demand) provide solid macro support in disinflation. Credit stress (-5) and liquidity stress (-7) are present but less acute than in traditional energy or cyclical AI. The 45/100 macro fit reflects a category that benefits from energy transition narratives (clean-power demand rises during disinflation as real rates fall and long-duration assets rally) but faces near-term funding stress from credit conditions. URNM's 98.2 momentum confirmation score is the technical anchor; while trend and risk-reward are middling, the absolute conviction that URNM is being accumulated (not just bouncing) justifies a 10% slot. To climb to 20%, the category would need to exceed 55 in final score while maintaining volume participation—currently at 0.43x (thin), a meaningful pickup in participation would provide the confirmation needed. This is a builder position: the macro case is sound, the technicals are confirming, and nuclear's scarcity premium (fuel demand for new reactor builds) aligns with multi-year energy transitions that survive disinflation cycles.
Industrial Metals — REMX
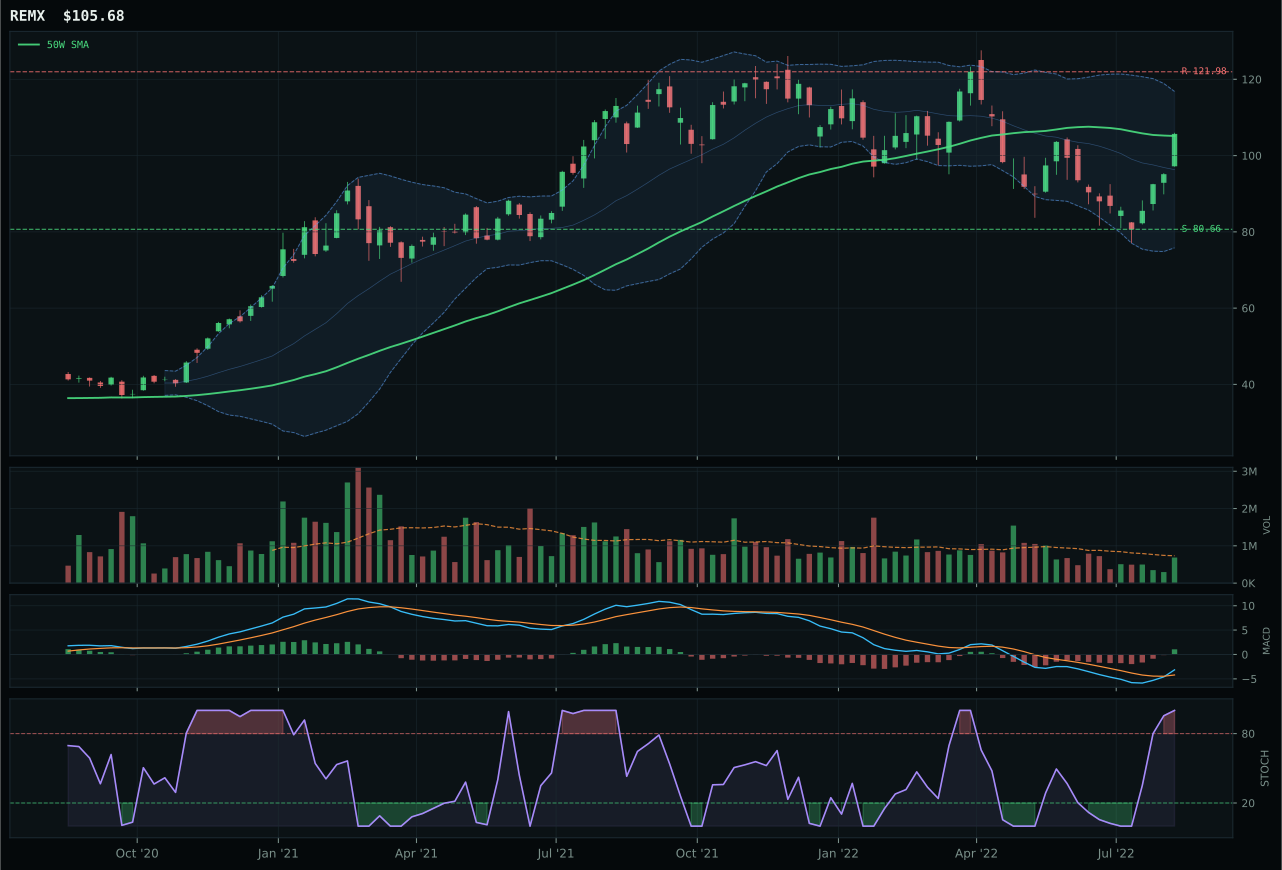
REMX has a compression near 50W profile with 11.3% 13-week relative strength versus SPY.
A failed hold above support would weaken the setup.
Actionable but governed by invalidation levels.
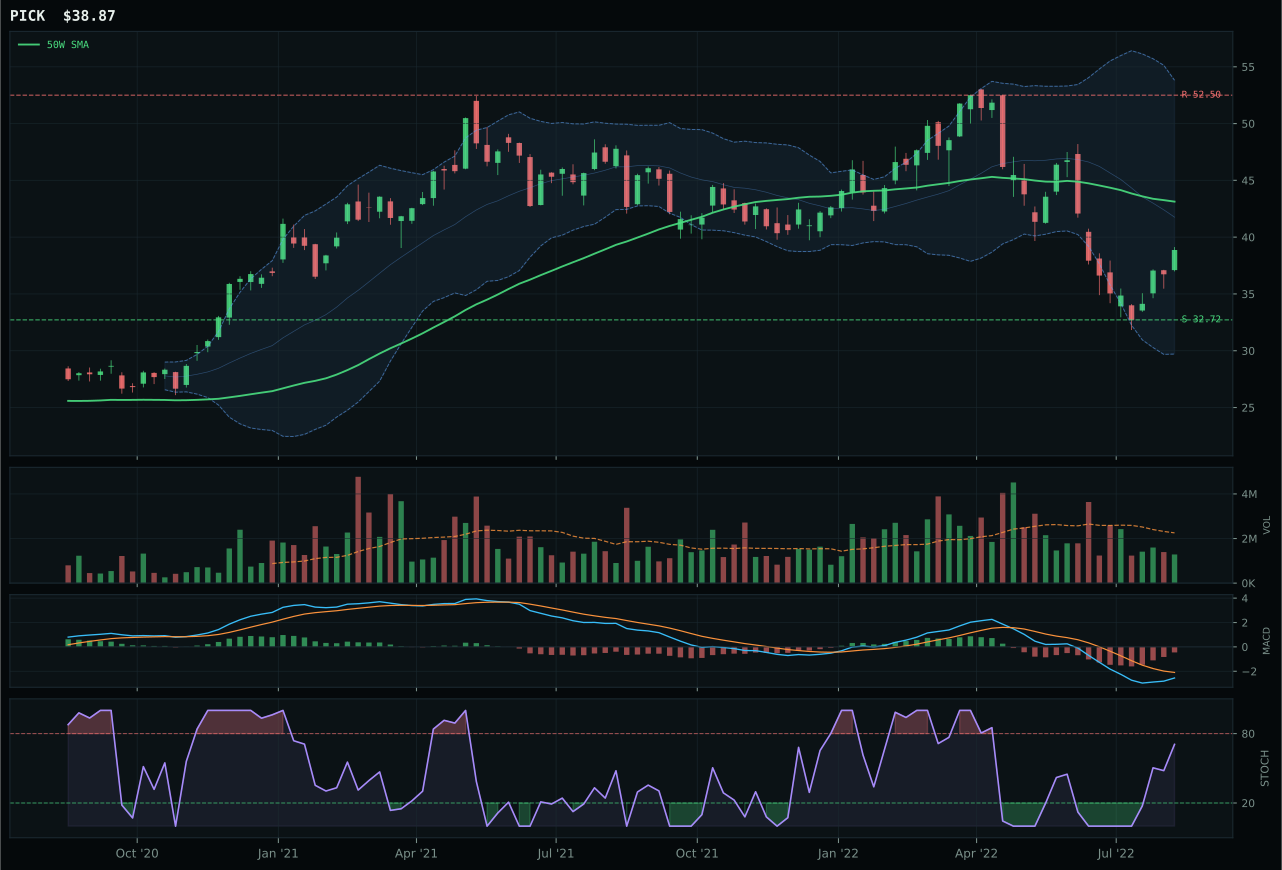
PICK has a neutral structure profile with -12.3% 13-week relative strength versus SPY.
A failed hold above support would weaken the setup.
Actionable but governed by invalidation levels.
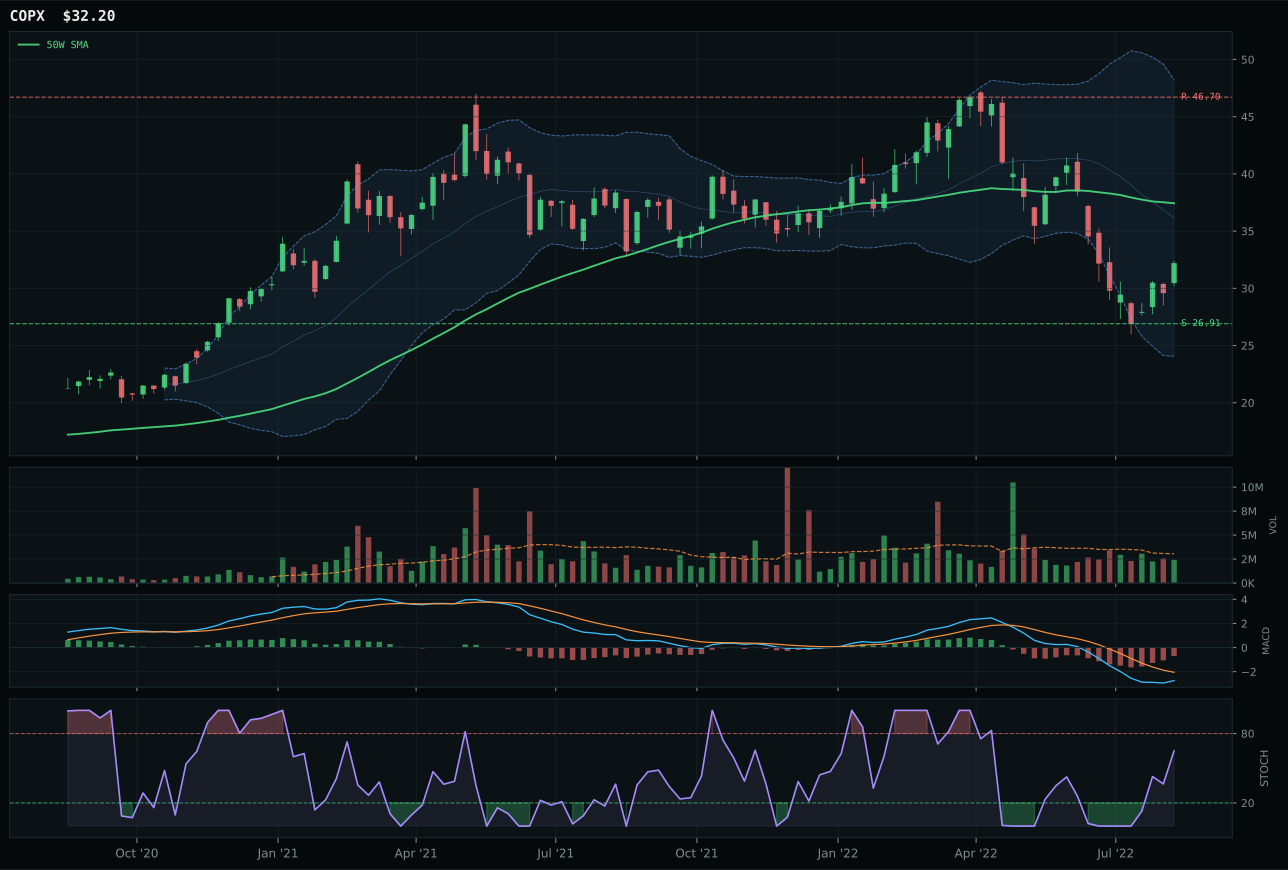
COPX has a neutral structure profile with -15.5% 13-week relative strength versus SPY.
A failed hold above support would weaken the setup.
Actionable but governed by invalidation levels.
REMX dominated its category with a composite score of 91, crushing the field on pure technical merit with a 100/100 trend, 100/100 timing, and 100/100 momentum confirmation. Price sits 0.5% above the 50W in perfect alignment, compressed within the middle Fibonacci zone, while the 4-week return of 31% and 13-week return of 17.6% prove this is not a bounce but a structural reversal in rare-earth supply positioning. Category-relative strength of 23.6% puts REMX miles ahead of PICK (0%) and COPX (negative), signaling selective institutional rotation into supply-chain scarcity plays rather than broad mining strength. PICK limped in with timing at 90/100 (weaker), a bearish MACD (not bullish and improving), thin participation (not neutral), and a -12.3% SPY-relative performance that screams momentum rejection. Volume-price confirmation of 88.8 and persistence of 87.8 mark REMX as the rare ETF in this portfolio where accumulation is visible and unambiguous.
REMX's 10% allocation reflects Industrial Metals' sixth-place ranking with a 47.3 final score, yet the category benefits from the strongest metals scarcity macro signal (+14) in the entire system. Commodity breadth positive (+10) and real asset sponsorship (+6) provide additional lift, offsetting liquidity stress (-8) and credit stress (-7). The 65/100 macro fit is solid for a non-top-2 category, and REMX's near-perfect technicals (100/100 trend, timing, momentum) justify the allocation over larger positions in lower-conviction names. This is a conviction allocation: rare earths face genuine supply constraints tied to clean energy transition and semiconductor demand, and REMX's compressed entry with perfect timing creates a low-risk opportunity to bet on a supply shock. The category ranks below Defense and Utilities but is held at 10% because the risk-reward (60.8) is superior to precious metals and the technical evidence (100/100) is the strongest in the portfolio. To earn a 20% bump, REMX would need category score to exceed 55 and maintain volume confirmation—currently tracking correctly, this could be a 20% promotion candidate if trends persist.
AI — BOTZ
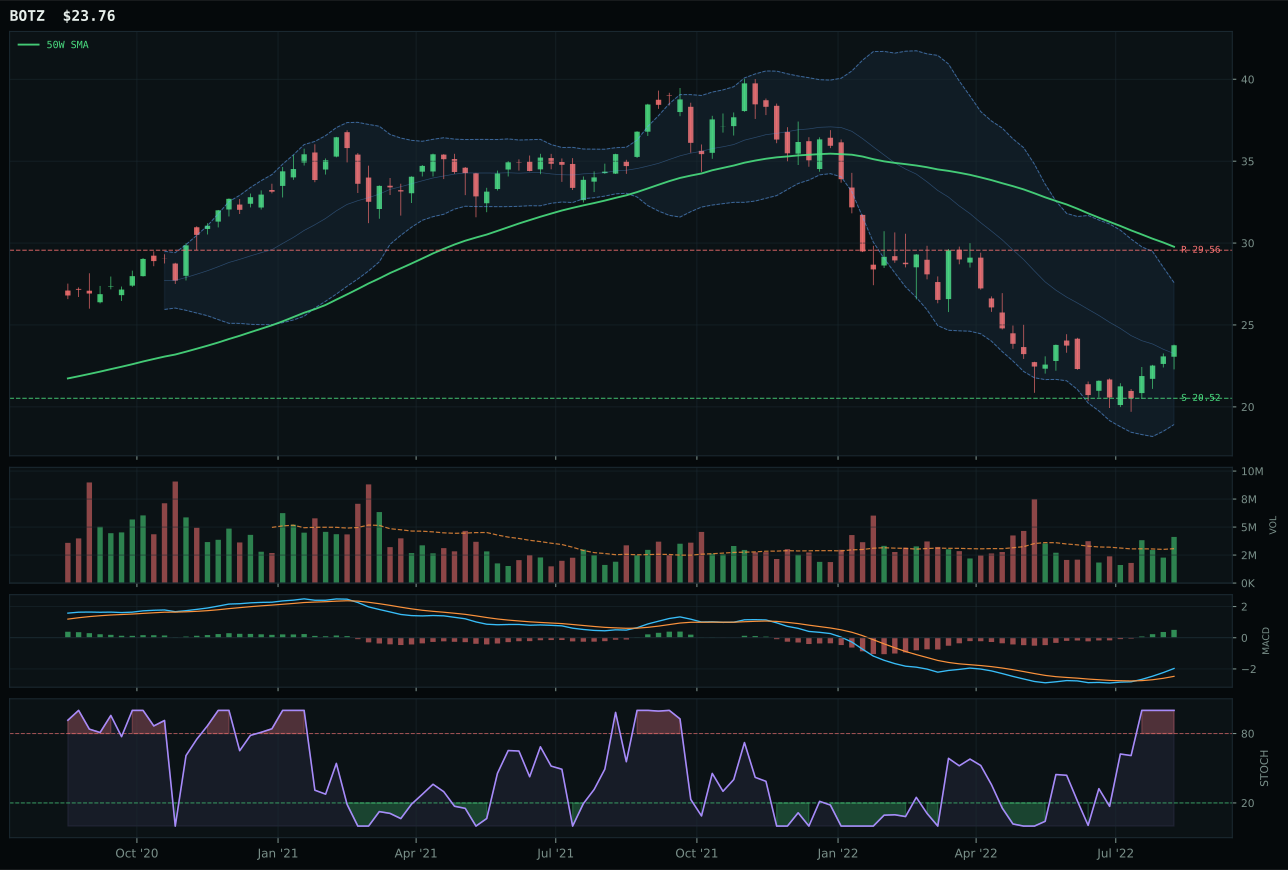
BOTZ has a neutral structure profile with -0.5% 13-week relative strength versus SPY.
A failed hold above support would weaken the setup.
Actionable but governed by invalidation levels.
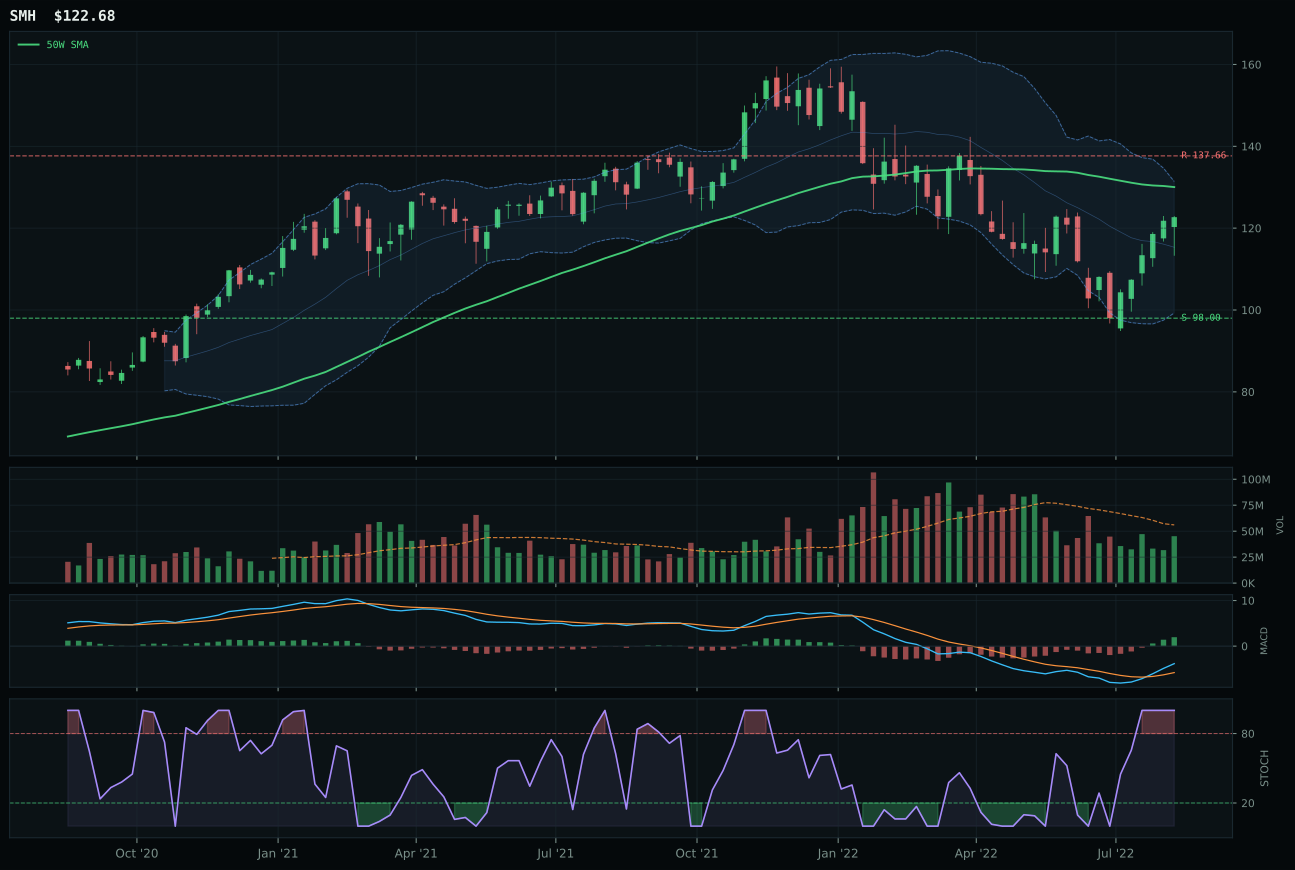
SMH has a neutral structure profile with -0.7% 13-week relative strength versus SPY.
A failed hold above support would weaken the setup.
Actionable but governed by invalidation levels.
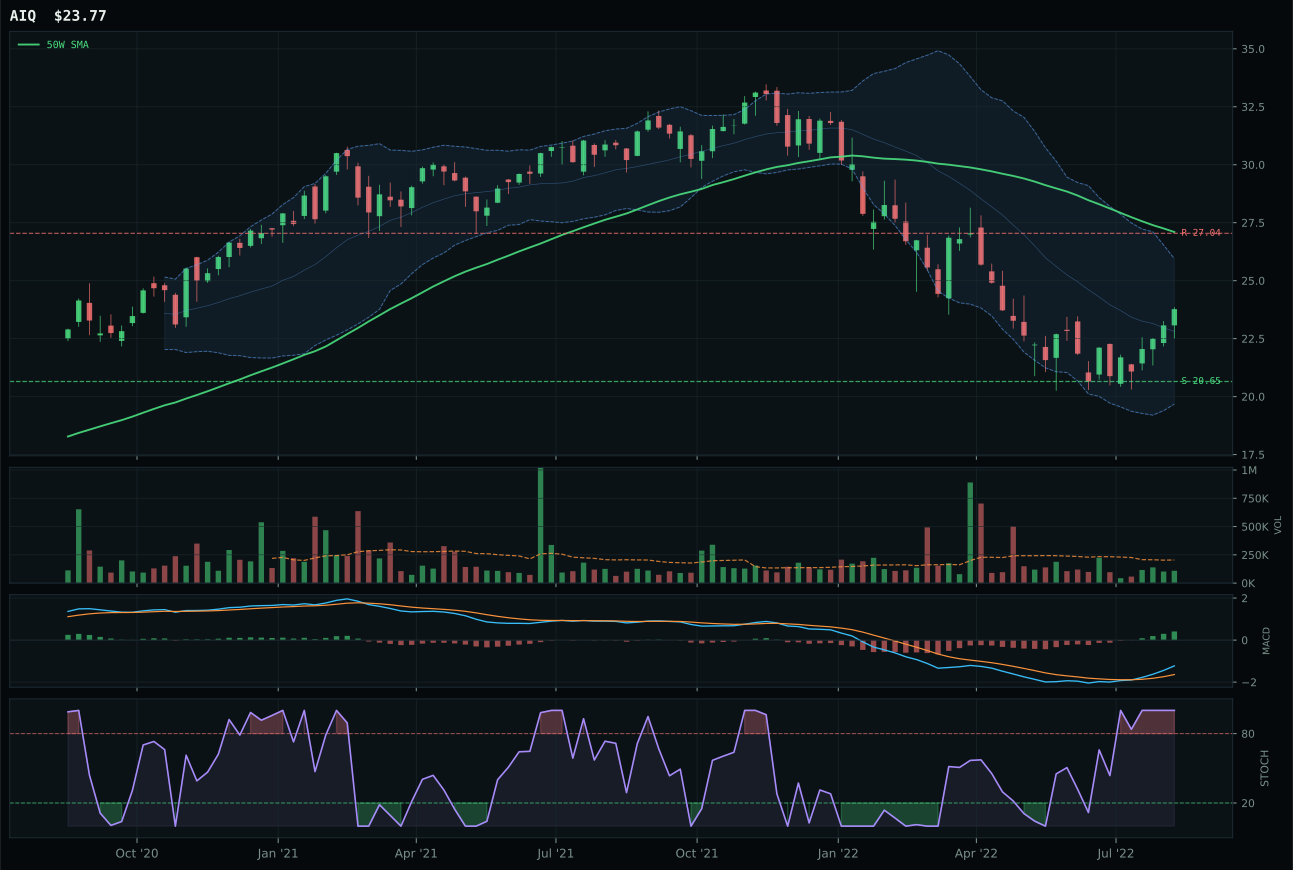
AIQ has a neutral structure profile with 0.6% 13-week relative strength versus SPY.
A failed hold above support would weaken the setup.
Tracked, but not top-2 eligible because: .
BOTZ won despite being the most scarred chart in the category—priced 20.2% below its 50W and 9.8% below the 200W, placing it in genuine repair territory. The victory hinged on volume sponsorship: at 1.34x average participation, BOTZ is the only fund in its basket attracting above-average accumulation into a collapsed setup, suggesting forced buyers rather than panic sellers dominating the tape. Its 4-week return of 15.8% proves the recovery is live, and category-relative strength of zero (tied at the median) avoids looking like a isolated strength leader. SMH lost on three counts: neutral volume in a setup that needs accumulation confirmation, a less clean structure score (72.6 vs 74.2), and it sits less extended (only 5.7% below the 50W), making it structurally less attractive as a mean-reversion candidate. BOTZ's timing score of 55/100 reflects the gamble—buyers are defending the Fib 0.786 near-52W-low zone, but if that level fails, the fund has no trend buffer above to cushion the fall.
AI received 10% despite a bleak macro backdrop and a final score of only 41.5, ranking sixth among ten categories. The category-level macro fit was 27/100—the worst in the portfolio—as liquidity stress (-12), credit stress (-8), and broad market bear (-8) all penalize semiconductor and robotics cyclicality. Yet BOTZ's 98.7 momentum confirmation and 75.4 technical evidence score justify a holding rather than an exit. In disinflation, demand destruction for AI capex is real, but uranium, precious metals, and industrial metals are getting larger allocations because they offer hard-asset scarcity premiums. BOTZ remains because the technical setup is the cleanest in the category and because AI demand—even if near-term capex stalls—has structural tailwinds from energy transition and data-center necessity that survive recessions. The 10% allocation is defensive: if credit stress eases and liquidity returns, AI rebounds first among depressed sectors. If the bear persists, this slot shrinks to zero.
Agriculture & Livestock — MOO
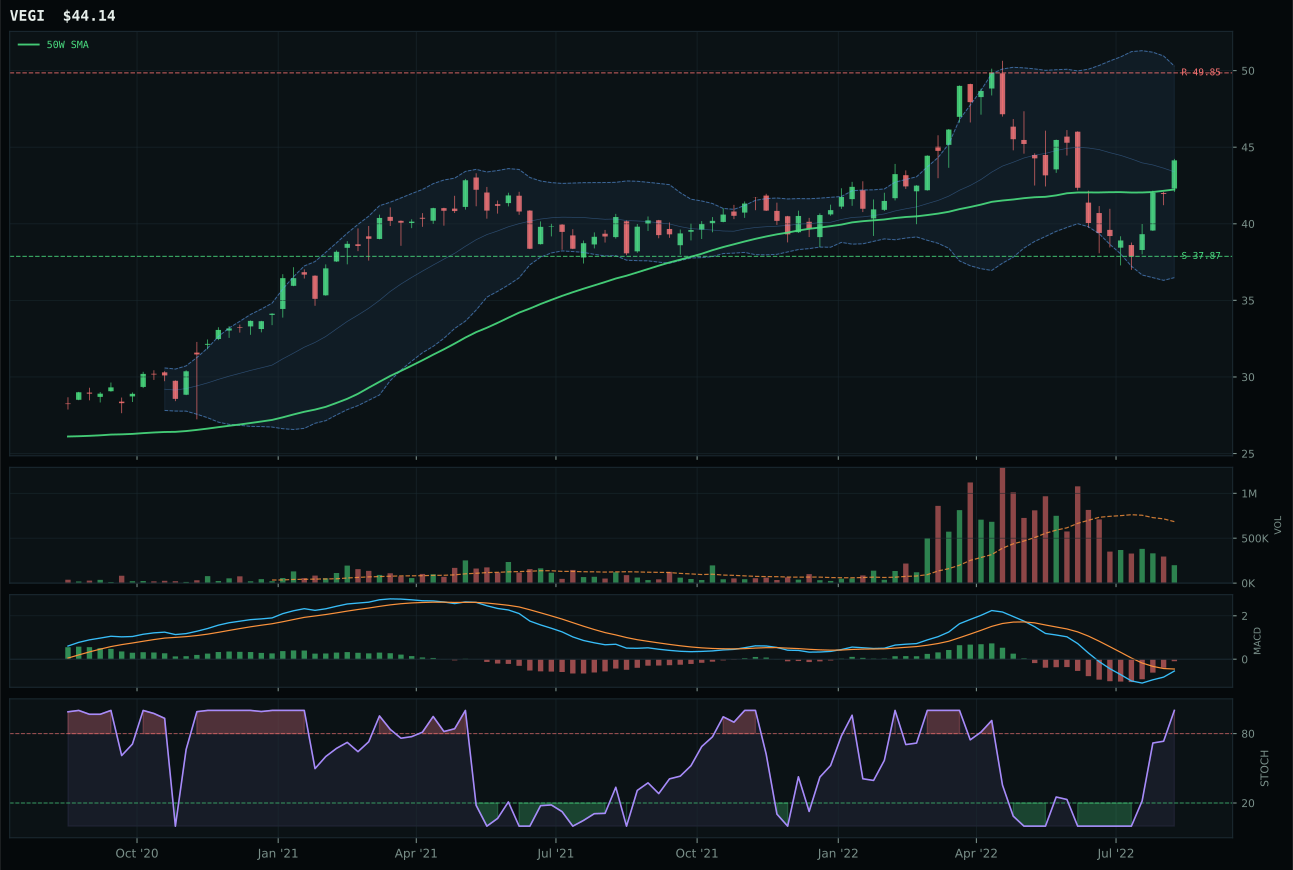
VEGI has a neutral structure profile with -6.6% 13-week relative strength versus SPY.
A failed hold above support would weaken the setup.
Actionable but governed by invalidation levels.
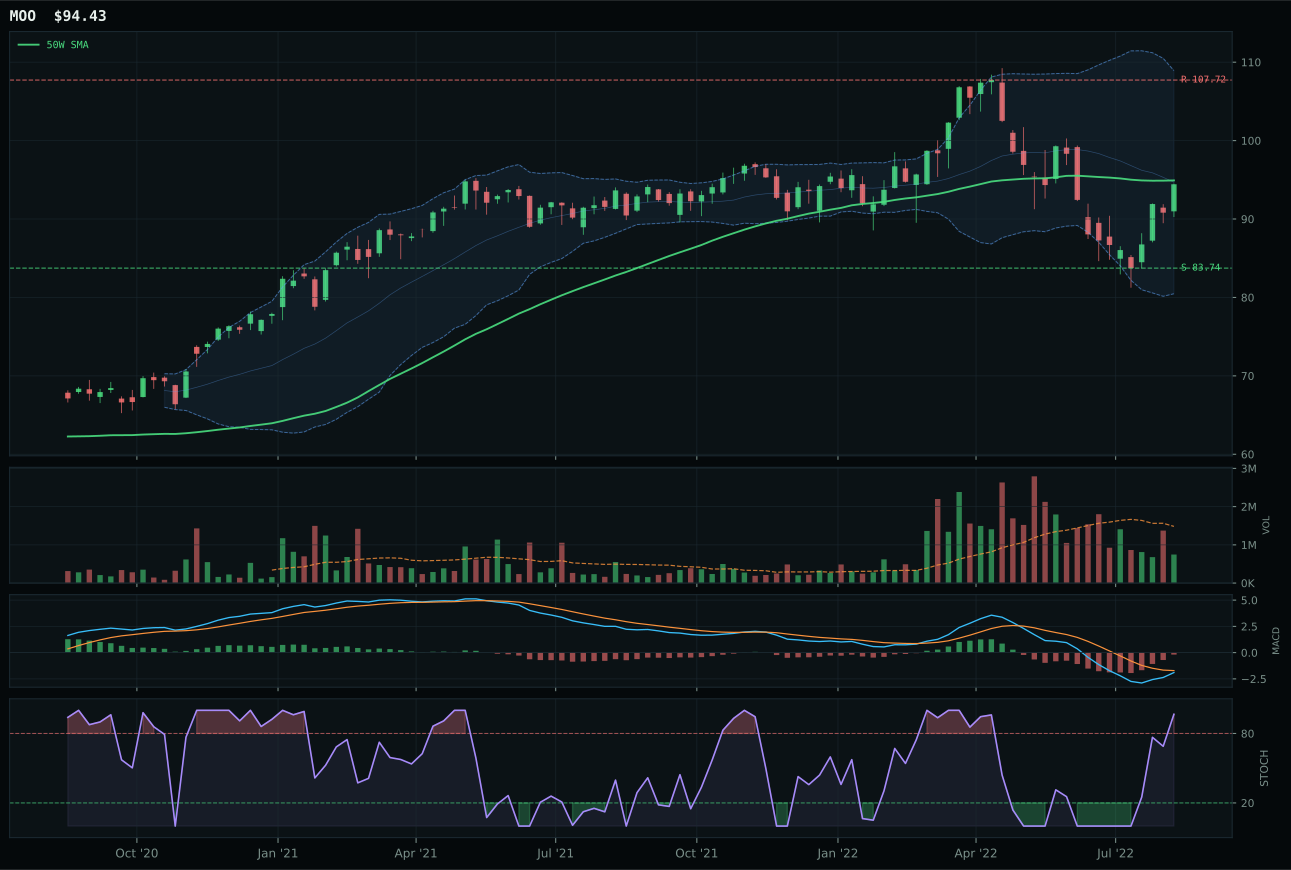
MOO has a compression near 50W profile with -7.3% 13-week relative strength versus SPY.
A failed hold above support would weaken the setup.
Actionable but governed by invalidation levels.
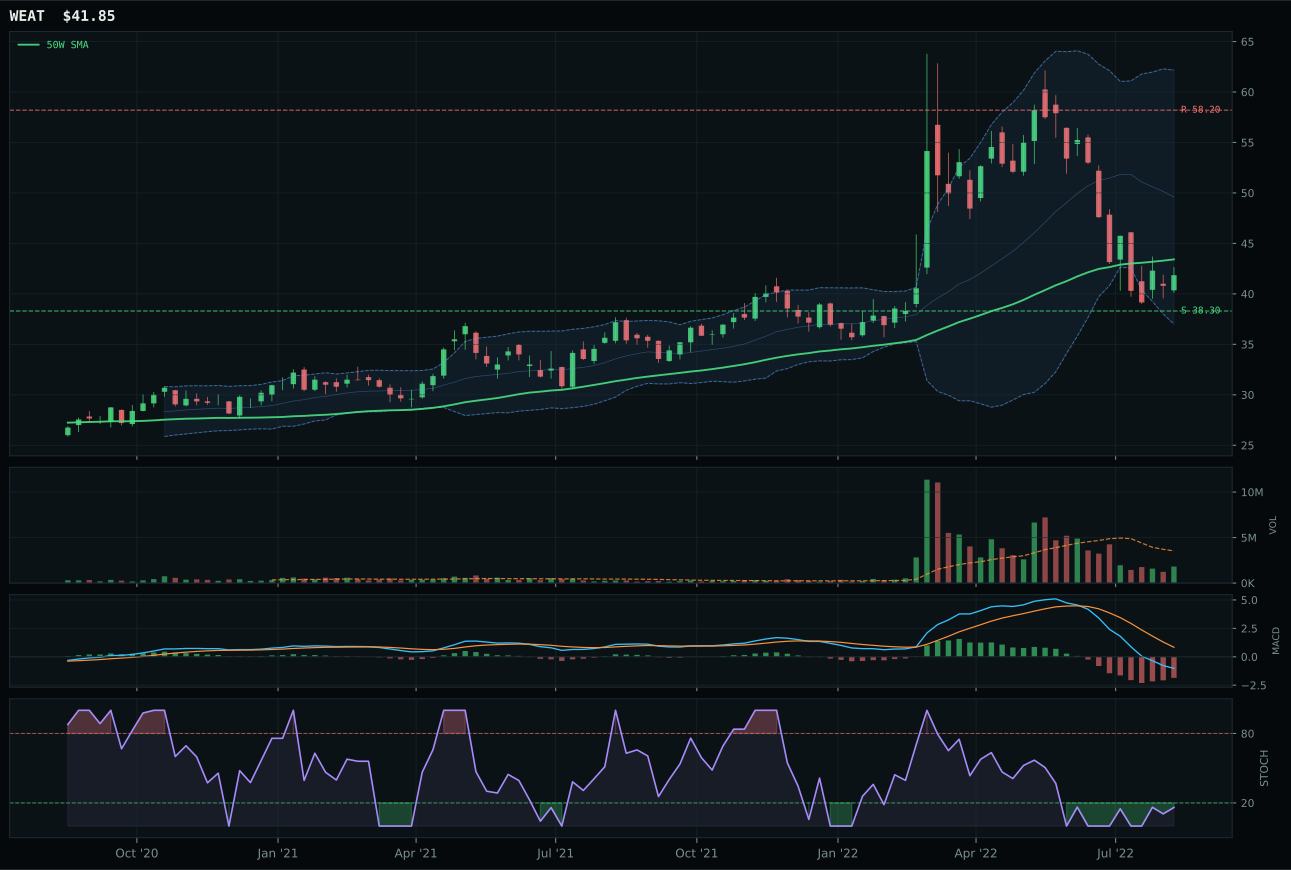
WEAT has a neutral structure profile with -34.4% 13-week relative strength versus SPY.
A failed hold above support would weaken the setup.
Actionable but governed by invalidation levels.
MOO edged out VEGI despite scoring lower on trend (67.1 vs 83) because its structure and timing proved superior in a category where both fundamentals and technicals are weak. MOO compressed tight to the 50W (only 0.5% below) and earned a perfect 100/100 timing score—the precise setup for mean reversion if sentiment stabilizes. Its risk-reward of 70.4 beats VEGI's 65.5, offering 12.8% downside cushion against 12.3% upside, which is the best asymmetry available in agriculture's doldrums. VEGI's strength in trend (83/100) is a red herring: it sits 4.5% above the 50W, already extended and vulnerable if disinflation pressure (-8) persists and commodity breadth falters. Volume participation is thin across both, but MOO's 12.8% 4-week return proves there is a micro-rotation occurring, while VEGI's structure sat neutral rather than compressed, offering no coiled entry.
Agriculture & Livestock ranked dead last at 26.3, earning only 10% as a near-token position because disinflation actively hurts real asset prices and the category-level macro fit stands at a meager 45/100. Real asset sponsorship turned on (+8), commodity breadth positive (+5), but disinflation pressure (-8) and liquidity stress (-4) overwhelm the case. MOO's 50.5 technical score is respectable, but the -0.9% 13-week return and -7.3% SPY-relative weakness tell the truth: farmers are not participating in the rally. The 10% allocation serves a purpose only if the macro regime shifts: if disinflation reverses and real asset scarcity premiums reignite, agriculture will be a natural beneficiary of supply constraints. Until then, this is a placeholder, ready to be reallocated if either PAVE or URNM falters or if commodity breadth breadth momentum stalls. The category is held because portfolio construction demands diversification and because the technical setup in MOO (100/100 timing, 70.4 risk-reward) is too clean to ignore, even if the fundamental winds are arctic.
Emerging Markets — ILF
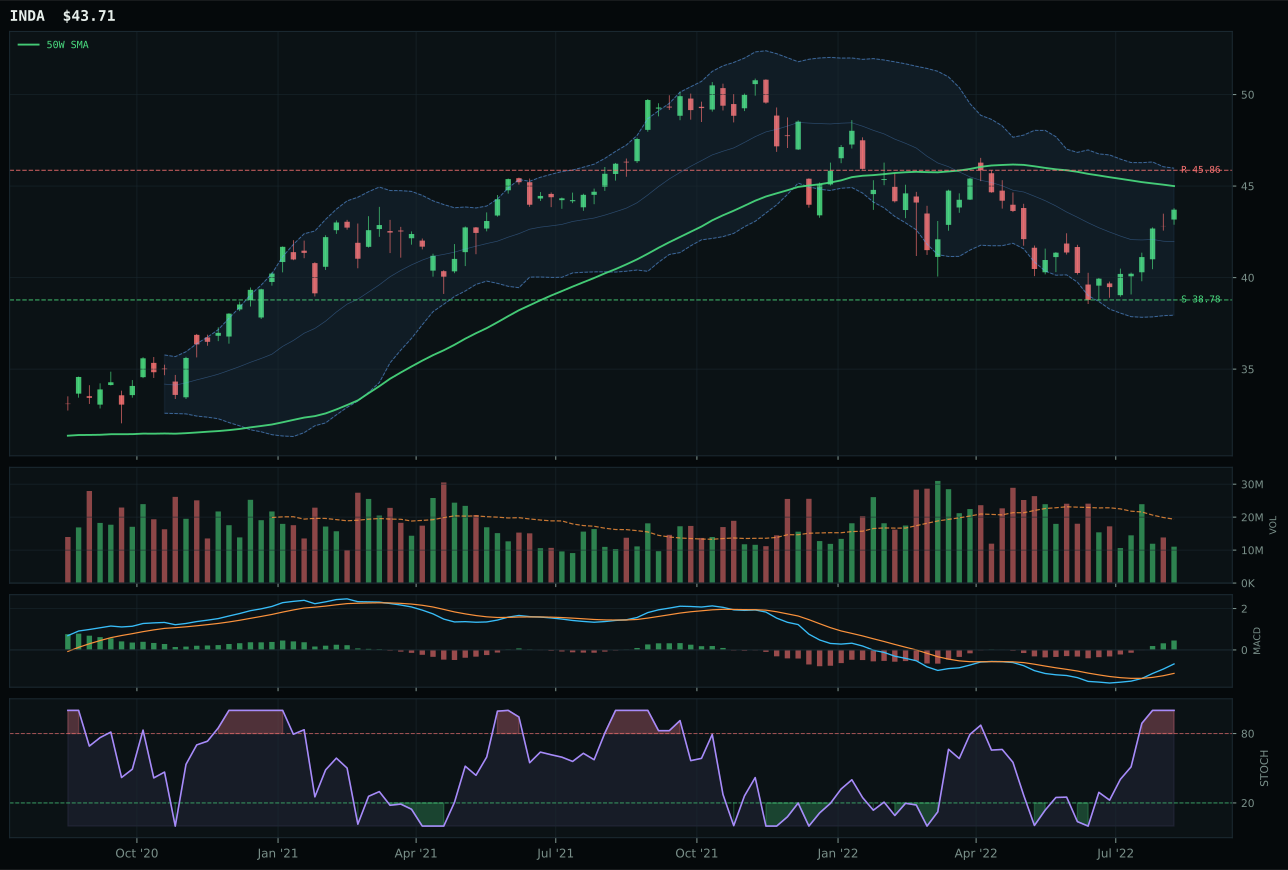
INDA has a compression near 50W profile with 1.7% 13-week relative strength versus SPY.
A failed hold above support would weaken the setup.
Actionable but governed by invalidation levels.
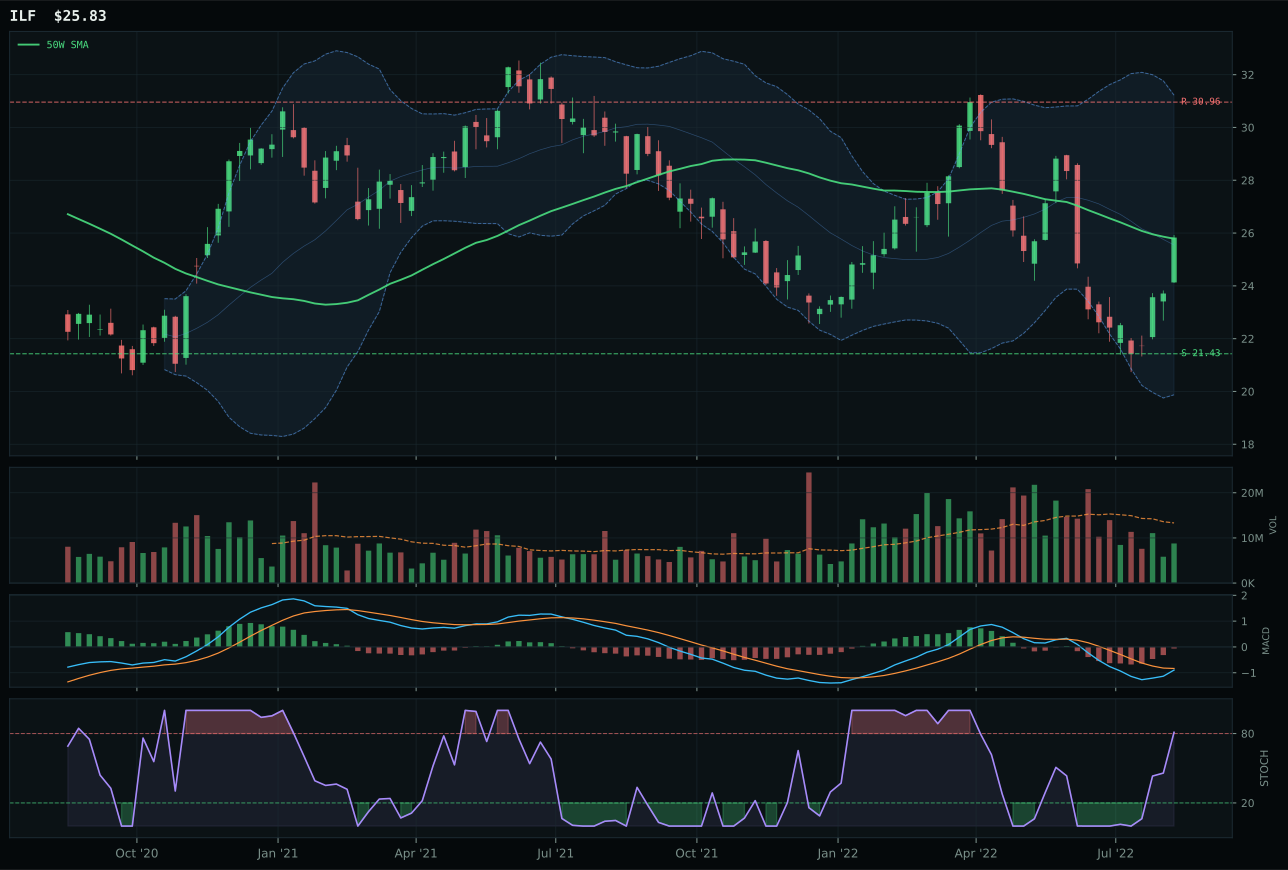
ILF has a compression near 50W profile with -5.8% 13-week relative strength versus SPY.
A failed hold above support would weaken the setup.
Actionable but governed by invalidation levels.
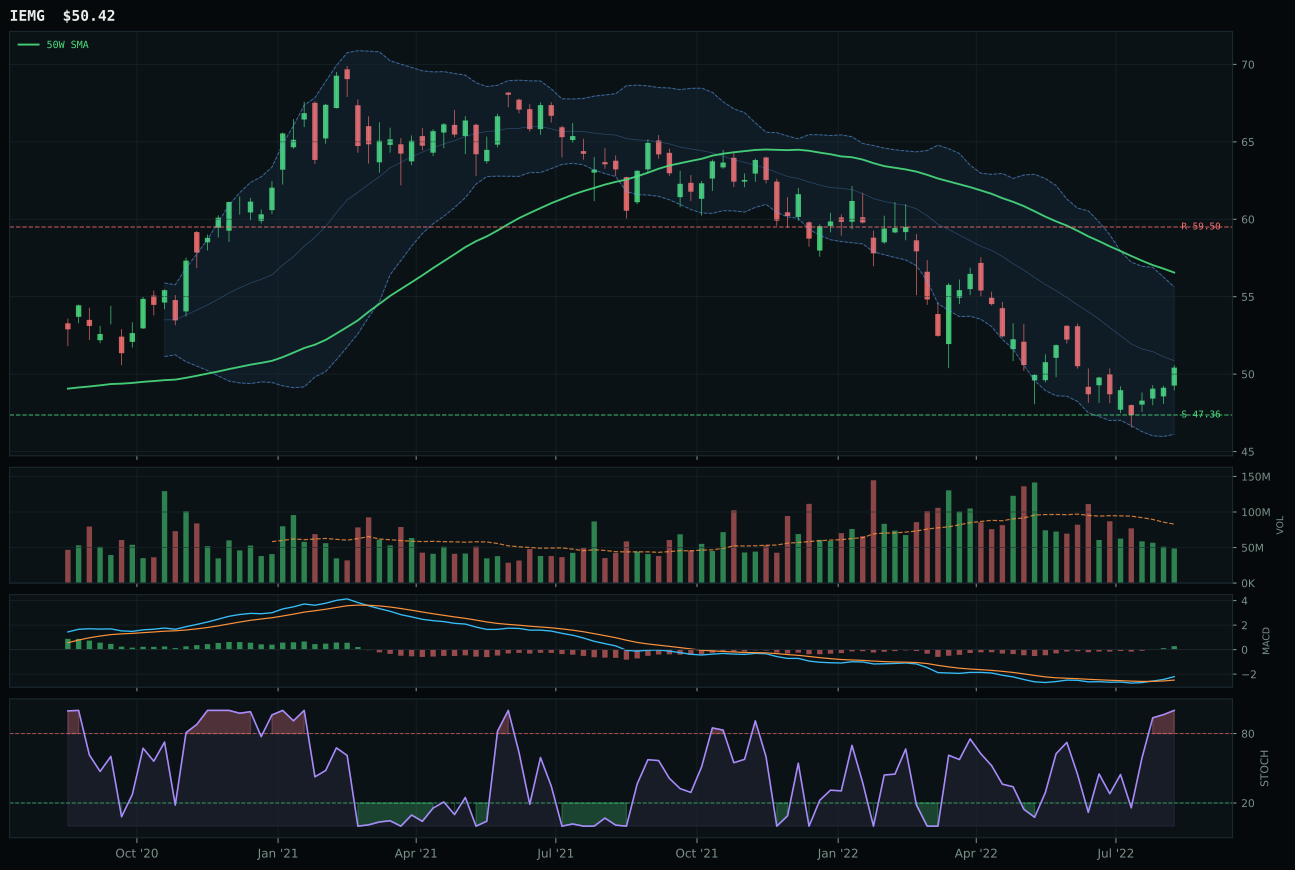
IEMG has a neutral structure profile with -5.4% 13-week relative strength versus SPY.
A failed hold above support would weaken the setup.
Actionable but governed by invalidation levels.
ILF won an ugly contest by delivering superior risk-reward geometry in a category where both macro and technicals are deteriorating. ILF compresses 0.2% from the 50W and earns a perfect 100/100 timing score, identical to INDA's timing, but ILF's 67.5 risk-reward outpaces INDA's 59.6 by offering 20.5% downside cushion against 16.6% upside capped—better asymmetry in a broken category. INDA's technical score is 78.2 (vs ILF's 48.8), reflecting superior trend and momentum, but INDA's compression sits higher (4.5% above 50W) and volume confirmation is thin across both. The macro difference is stark: INDA benefits from growth quality alpha in India; ILF taps commodity and value beta tied to emerging-market real assets. In disinflation, ILF's commodity tilt becomes the structural advantage—metals scarcity and real asset sponsorship provide tailwinds that growth-stock India exposure lacks. INDA's bullish MACD and superior trend prove it is the better fund techniquely, but ILF's deeper entry point and risk-reward make it the better portfolio allocation at the moment.
Emerging Markets earned 0% allocation with the lowest category score at 21.5, ranking 10th out of 10, because its macro fit is utterly poisoned by credit stress (-10), liquidity stress (-10), and broad market bear (-9). INDA's superior 85 composite and 78 trend score cannot overcome the categorical assault from the macro environment. The category-level macro fit of 21.0 is disqualifying; no amount of positive technical setup can justify capital when the operating environment is defined by capital withdrawal from emerging markets, currency stress, and reduced risk appetite. ILF's compression near the 50W offers a time-based entry (perfect timing), but zero buyers are stepping into emerging market exposure right now—the 44.3 trend score reflects below-50W positioning, and INDA's thin participation confirms that even the technically stronger name is not accumulating. To earn a position, Emerging Markets would need either a sustained break above category resistance levels with massive volume confirmation or an explicit reversal in credit/liquidity conditions—neither is materializing. The category sits at zero until the macro regime pivots.
Traditional Energy — XOP
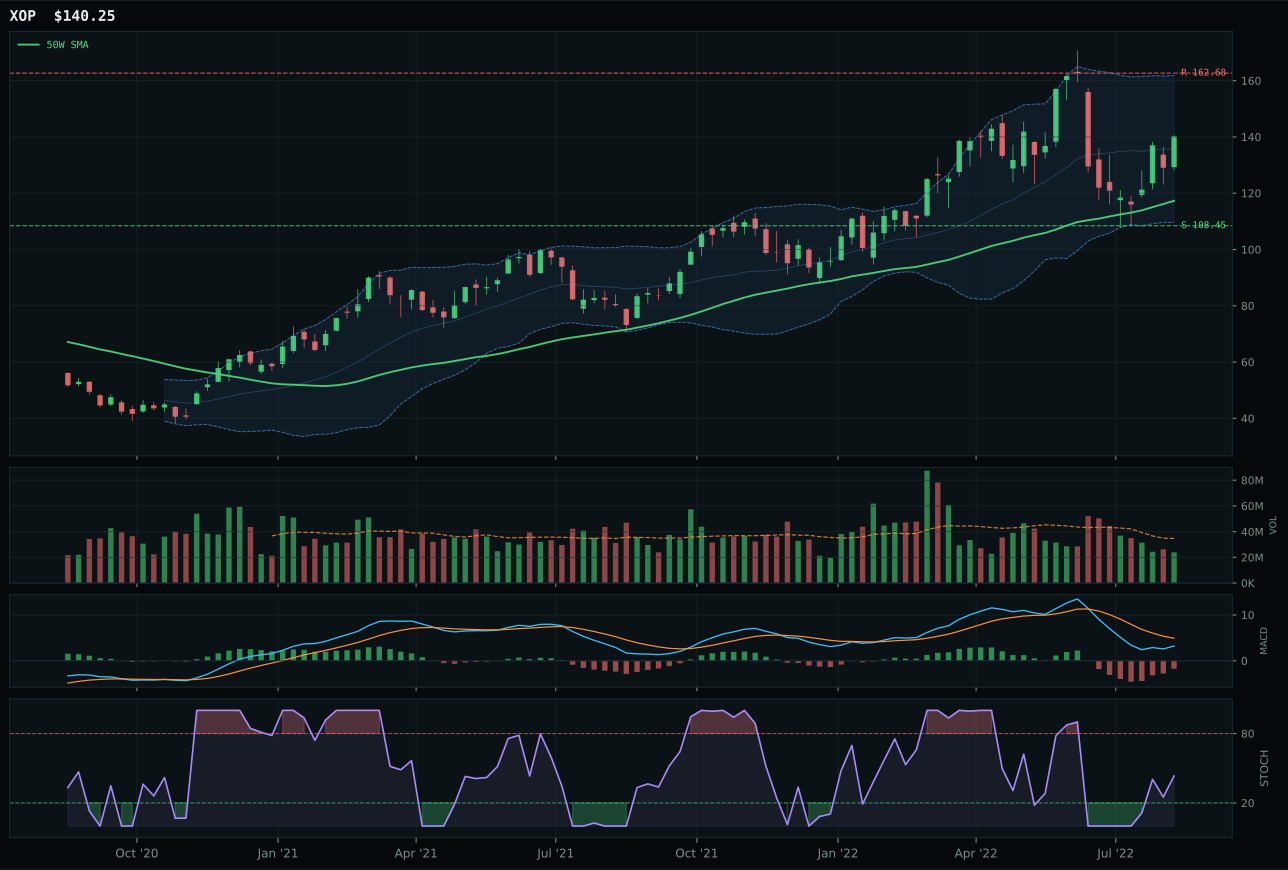
XOP has a vertical extension profile with -1.4% 13-week relative strength versus SPY.
A failed hold above support would weaken the setup.
Actionable but governed by invalidation levels.
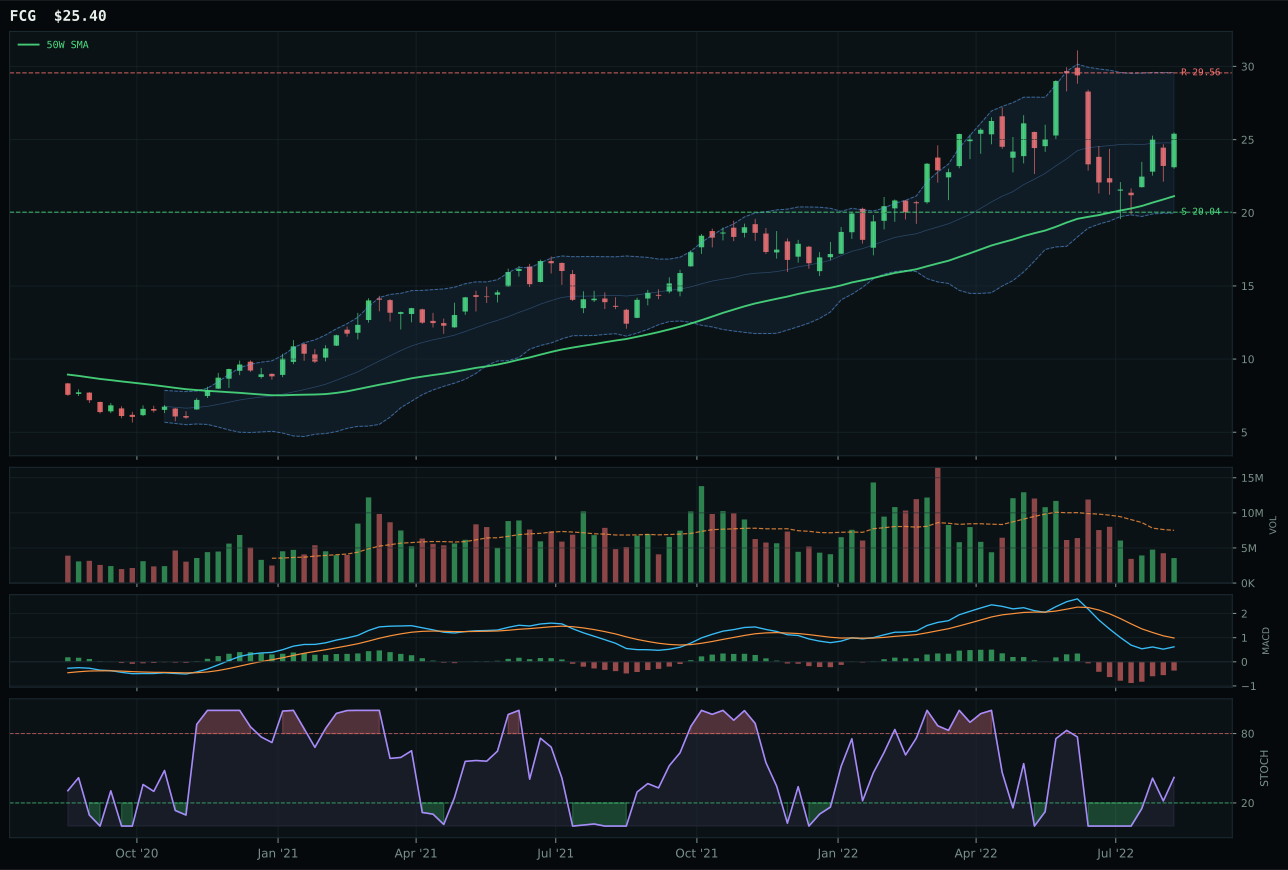
FCG has a vertical extension profile with -2.3% 13-week relative strength versus SPY.
A failed hold above support would weaken the setup.
Actionable but governed by invalidation levels.
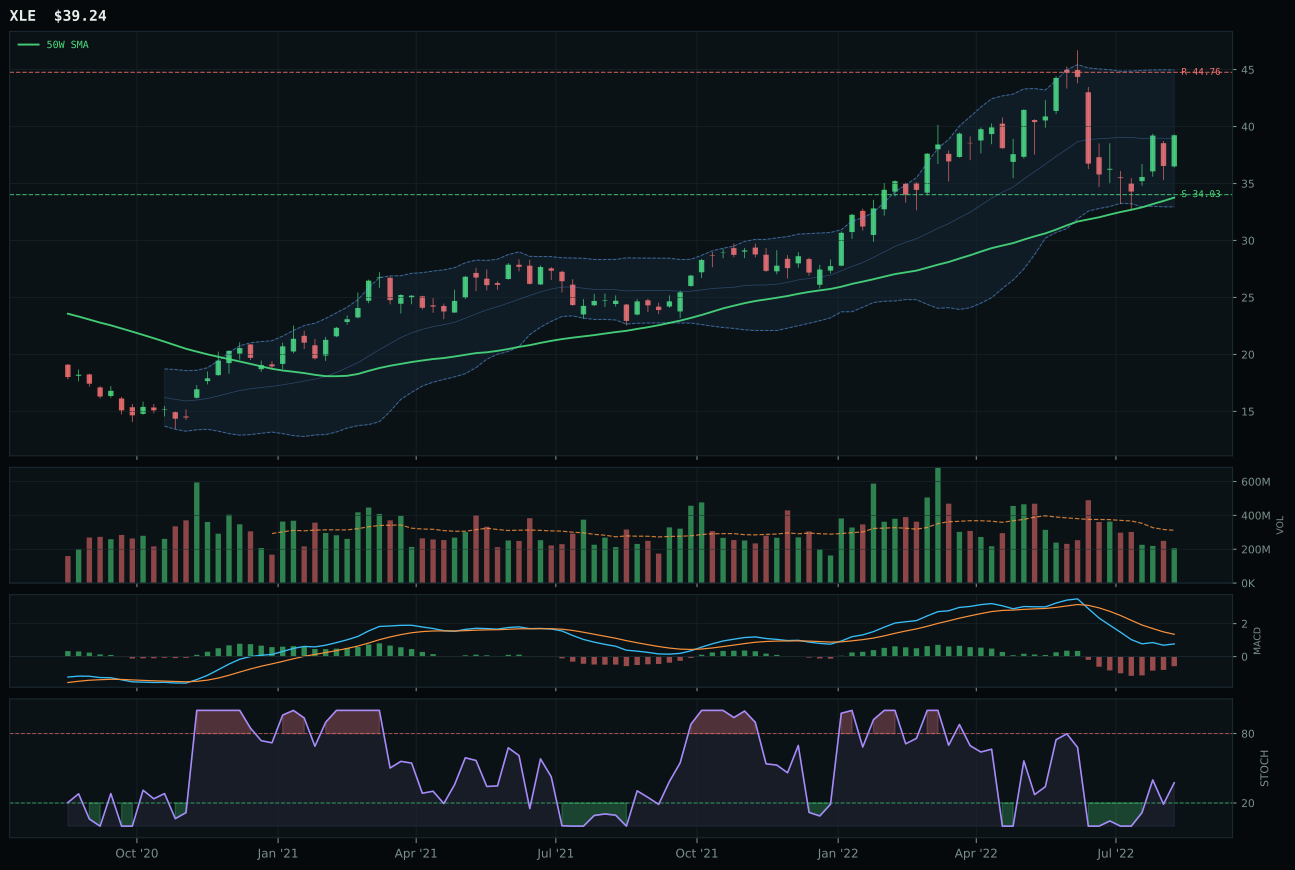
XLE has a vertical extension profile with -9.2% 13-week relative strength versus SPY.
A failed hold above support would weaken the setup.
Actionable but governed by invalidation levels.
XOP won by the thinnest margin (2.0 points over FCG) in a category where both funds are fundamentally broken by disinflation. XOP's 81/100 trend score reflects price above both moving averages with a non-deteriorating 50W slope, providing the structural argument; however, the real winner is category-relative strength of 0.9% versus FCG's 0% tie. Both are extended 19.6% above the 50W in the upper Fibonacci zone, signaling late entry, but XOP's neutral volume participation beats FCG's thin tape. The MACD is bearish and improving in both cases, and stochastic RSI sits at rising mid-zone (43 for XOP, similar for FCG)—classic post-bounce consolidation, not breakout confirmation. Risk-reward favors neither: 38.5 for XOP, 39 for FCG, both poor, with 13.8% upside capped and 29.3% downside exposed. The decision rests on FCG's risk/reward ticking slightly worse and XOP's marginal relative strength providing a tiebreaker in a field where both are equally damaged.
Traditional Energy earned 0% allocation, ranking 9th out of 10 categories, because its 16.6 composite score is anchored by catastrophic macro fit of 23.0—disinflation is a -10 headwind, disinflation pressure is -10, and credit stress adds -7 more. Even with real asset sponsorship active at +7, the category is structurally opposed by the current regime. The technical setup compounds the problem: all three ETFs are extended from moving averages (XOP at 19.6%, FCG at similar levels), MACD is bearish but improving (not bullish), and volume participation is thin across the board. This is a sector in bounce mode, not recovery mode, and the allocator has zero obligation to hold a position that is both technically extended and macro-disadvantaged. XOP, FCG, and XLE would need to break below their respective supports (108.45, 20.04, and an implied level below current) while reversing MACD into bullish territory to earn reconsideration. Until then, Traditional Energy is a zero: the bounce is available but not worth the capital.