
2022-08-05
Informational purposes only. The content in this report, including allocations, analysis, and commentary, is provided solely for informational and educational purposes. It does not constitute financial advice, investment advice, trading advice, or any other type of advice. Past performance does not guarantee future results. Always conduct your own research and consult a qualified financial professional before making investment decisions.
Weekly Allocation
| Ticker | Category | Weight | Role |
|---|---|---|---|
| XLU | Utilities & Infrastructure | 20% | Top-2 (20%) |
| XLK | Technology | 20% | Top-2 (20%) |
| GDX | Precious Metals | 10% | Tier-2 (10%) |
| XAR | Defense & Aerospace | 10% | Tier-2 (10%) |
| SMH | AI | 10% | Tier-2 (10%) |
| URNM | Nuclear Energy | 10% | Tier-2 (10%) |
| COPX | Industrial Metals | 10% | Tier-2 (10%) |
| INDA | Emerging Markets | 10% | Tier-2 (10%) |
Trade Instructions — Monday Open
Sell the tranche from 2022-07-08 (completing its 4-week hold). Buy the new tranche. Instructions show net portfolio changes — same-asset positions cancel, weight changes show the delta.
| Action | Ticker | Instruction |
|---|---|---|
| SELL | SGOV | Sell entire SGOV position (5.00% of portfolio) |
| SELL | GLD | Sell 45% of GLD position (reduce 13.75% → 7.50%) |
| SELL | XLU | Sell 11% of XLU position (reduce 11.25% → 10.00%) |
| SELL | CIBR | Sell entire CIBR position (1.25% of portfolio) |
| SELL | ITA | Sell 33% of ITA position (reduce 3.75% → 2.50%) |
| SELL | URA | Sell entire URA position (1.25% of portfolio) |
| SELL | BOTZ | Sell entire BOTZ position (1.25% of portfolio) |
| SELL | XLE | Sell 33% of XLE position (reduce 3.75% → 2.50%) |
| BUY | INDA | Buy INDA — 6.67% of freed cash (adds 1.25% to portfolio) |
| BUY | XLK | Buy XLK — 26.67% of freed cash (adds 5.00% to portfolio) |
| BUY | SMH | Buy SMH — 13.33% of freed cash (adds 2.50% to portfolio) |
| BUY | URNM | Buy URNM — 13.33% of freed cash (adds 2.50% to portfolio) |
| BUY | XAR | Buy XAR — 13.33% of freed cash (adds 2.50% to portfolio) |
| BUY | GDX | Buy GDX — 13.33% of freed cash (adds 2.50% to portfolio) |
| BUY | COPX | Buy COPX — 13.33% of freed cash (adds 2.50% to portfolio) |
Current Portfolio After Trade
Combined holdings across all 4 active tranches. Each tranche is 25% of the portfolio.
| Ticker | % of Portfolio | Weight Bar |
|---|---|---|
| XLK | 17.50% | |
| XLU | 10.00% | |
| SMH | 10.00% | |
| URNM | 10.00% | |
| PAVE | 10.00% | |
| GLD | 7.50% | |
| XAR | 7.50% | |
| MOO | 5.00% | |
| GDX | 5.00% | |
| ITA | 2.50% | |
| XLE | 2.50% | |
| IEMG | 2.50% | |
| REMX | 2.50% | |
| FCG | 2.50% | |
| COPX | 2.50% | |
| INDA | 2.50% |
Macro Regime — Disinflation
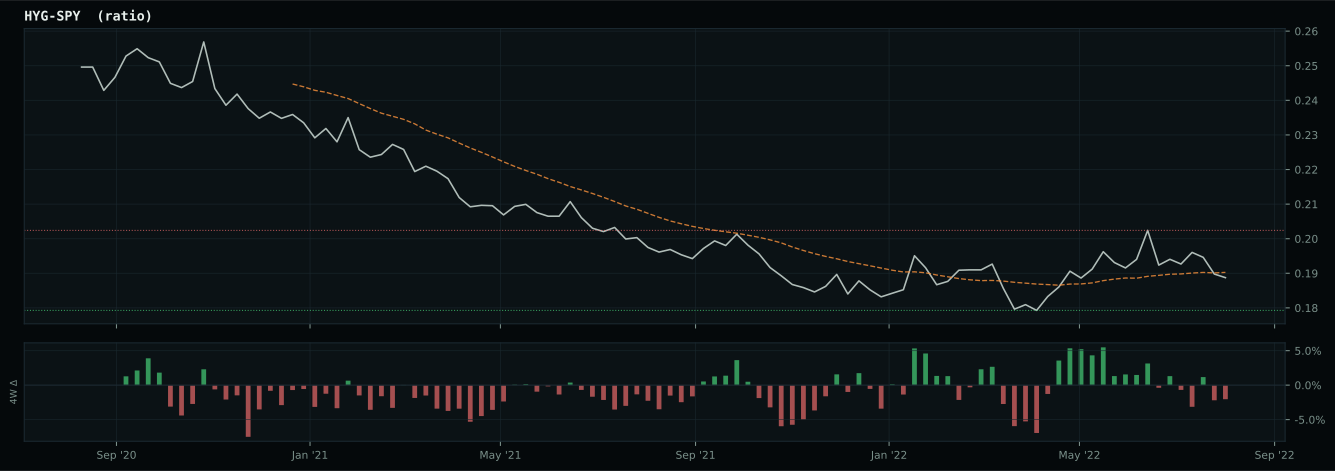
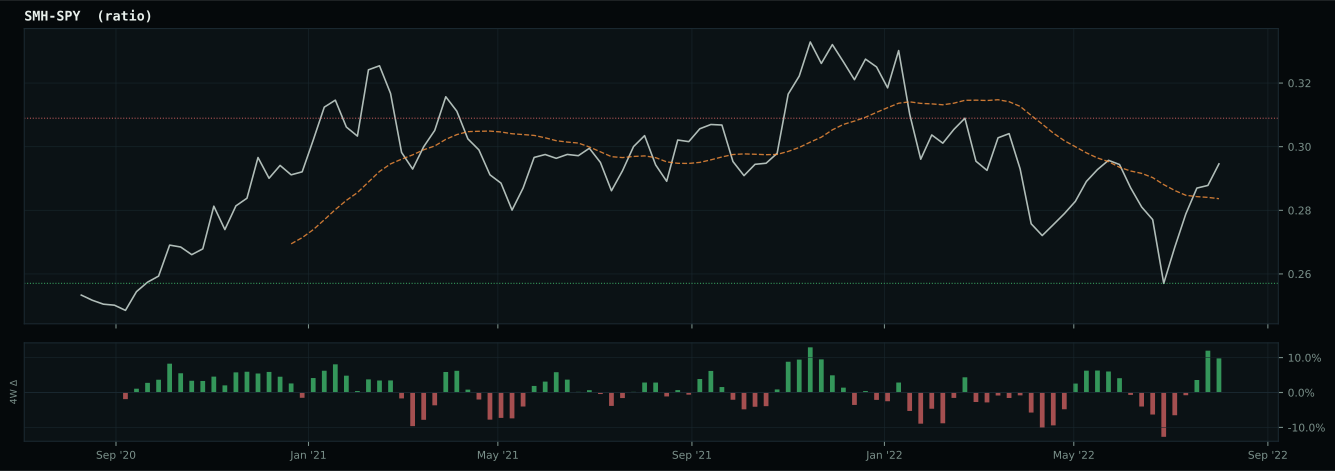
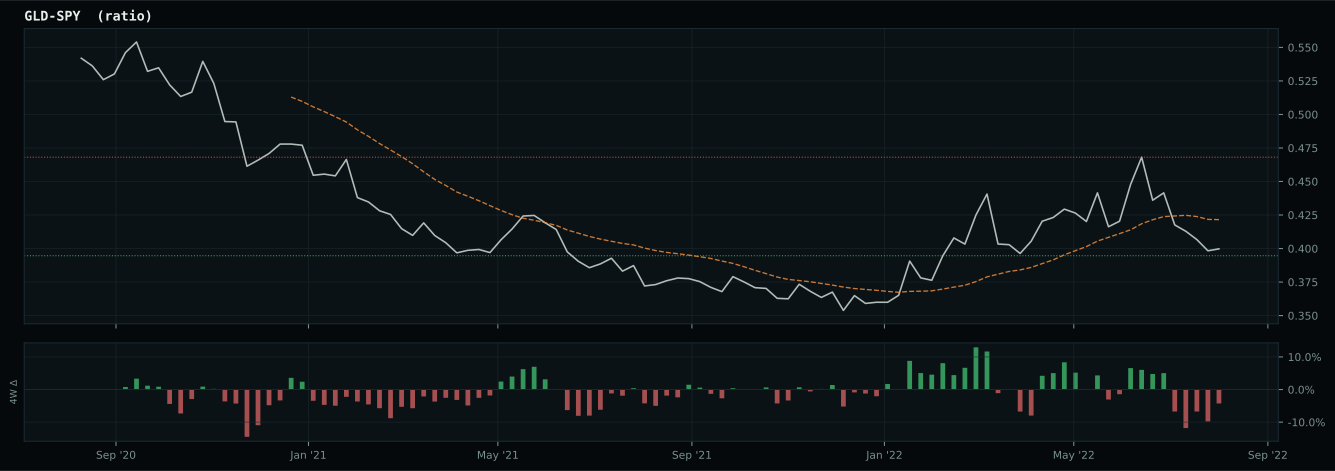
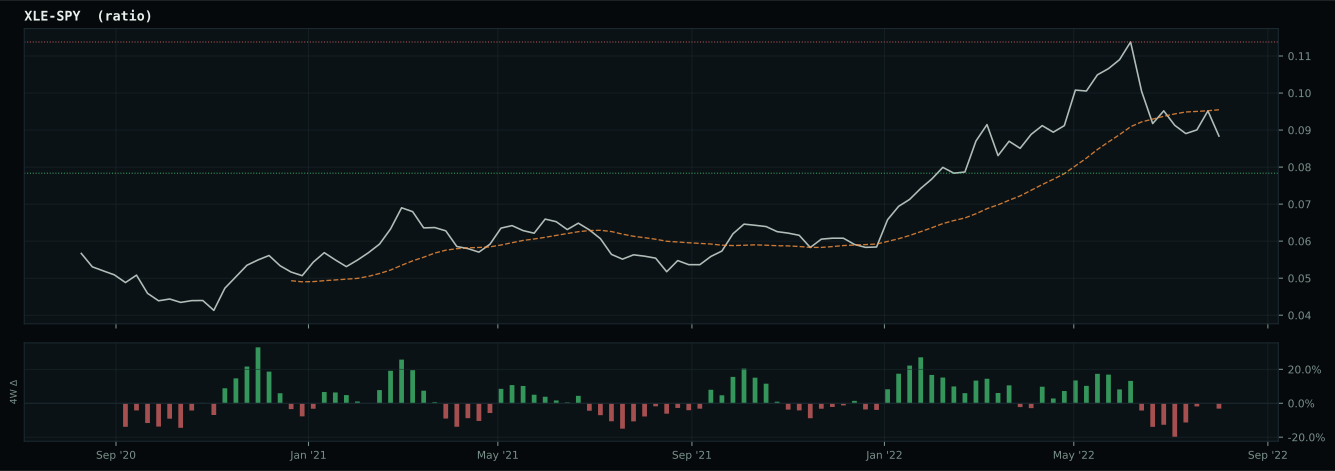
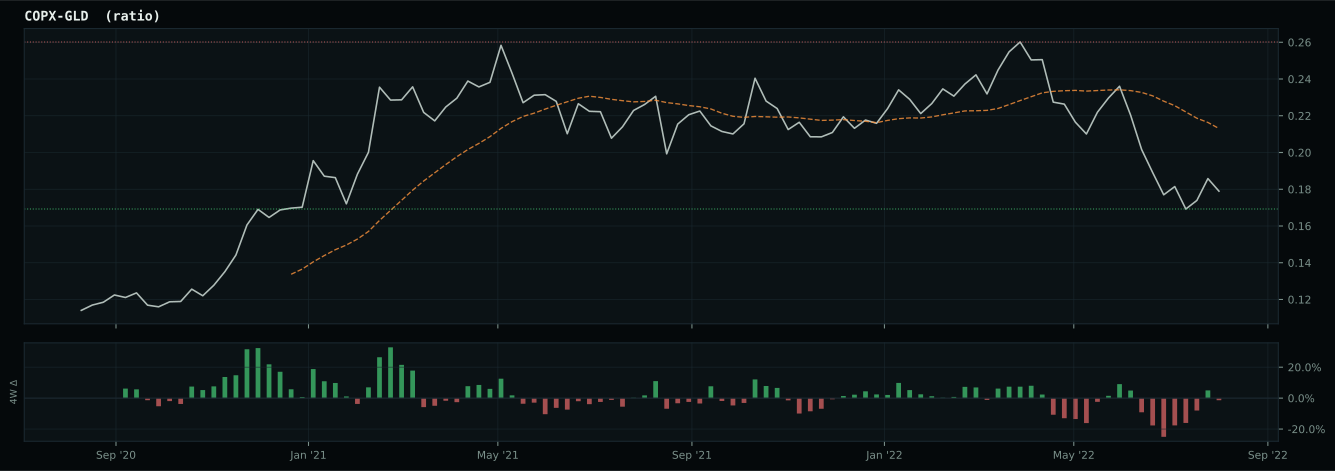
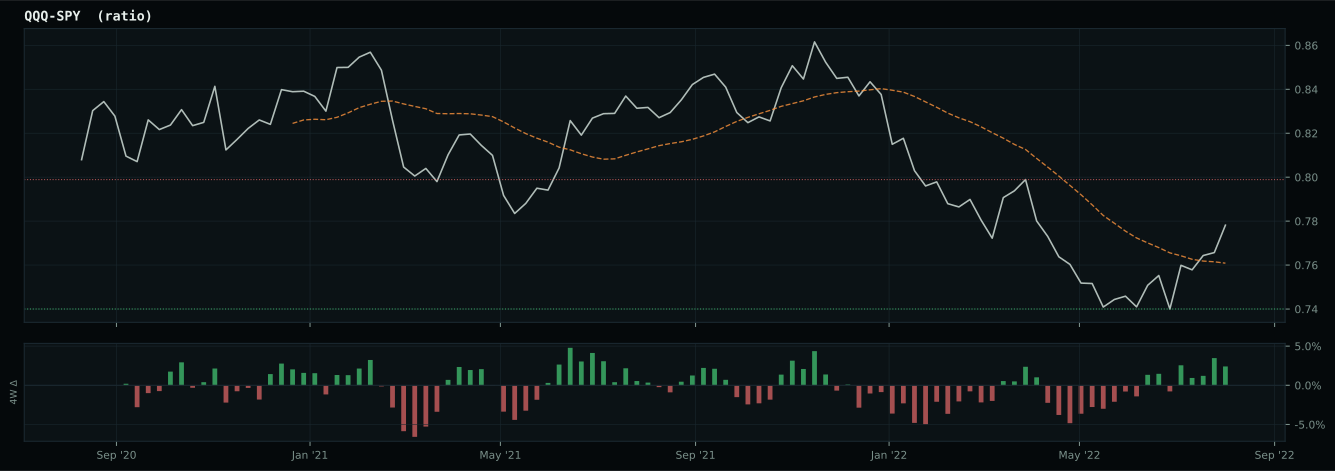
Macro Evidence Charts
Market-implied signals behind the macro regime scores. Each ratio compares two assets; the direction and slope of the ratio is what the macro engine reads.
Crypto Regime — NoCrypto
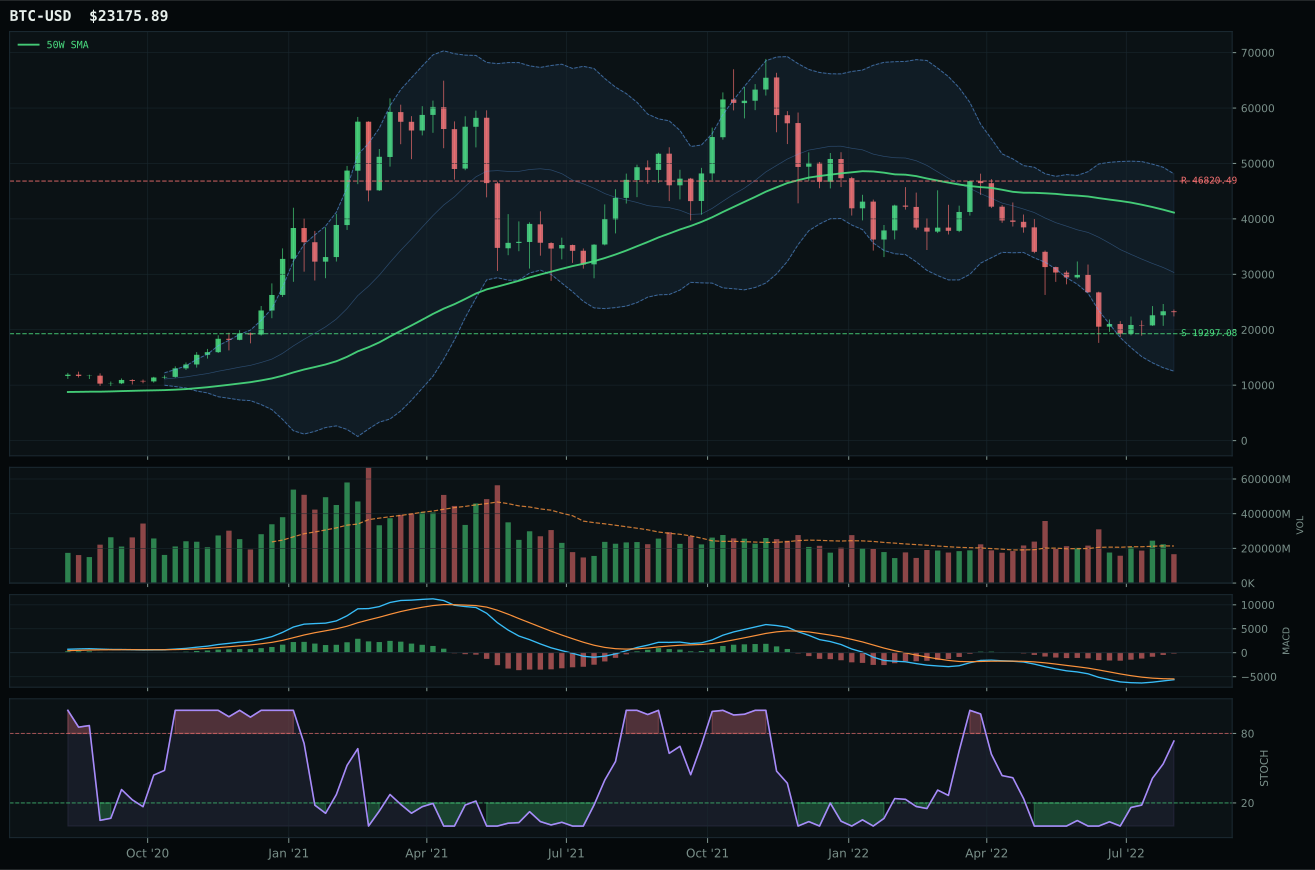
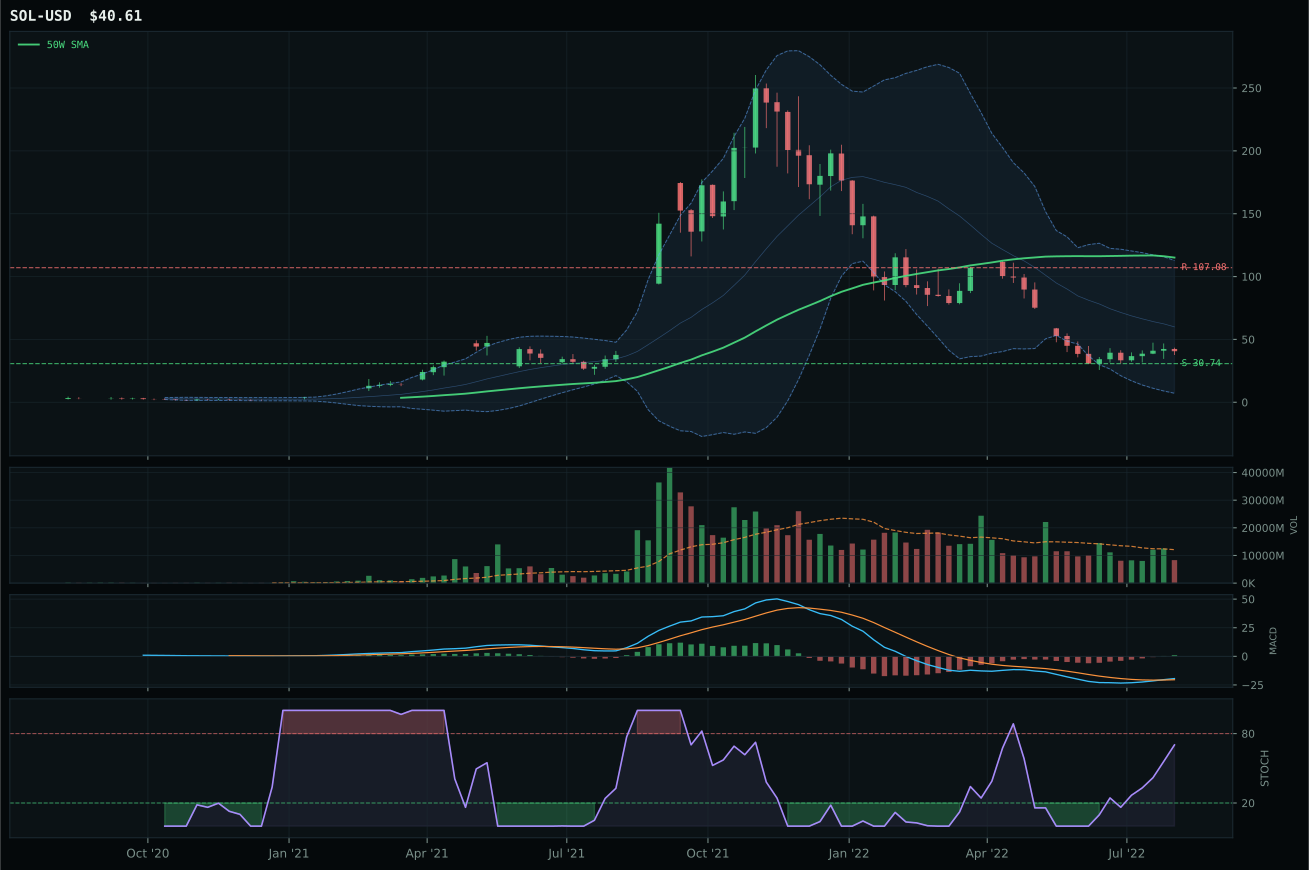
ValueBTC armed by first 200W buy-zone touch, but post-touch range age is 7 weeks; minimum is 12
TrendBTC not confirmed
one or more available conditions failed
Category Rankings
| Rank | Category | Winner | Score | Alloc | 4W Ret | Peers (4W) |
|---|---|---|---|---|---|---|
| 1 | Utilities & Infrastructure | XLU | 70.4 | 20% | +0.20% | PAVE -4.5% · IGF -2.6% |
| 2 | Technology | XLK | 59.2 | 20% | -9.44% | IGV -10.0% · CIBR -8.0% |
| 3 | Precious Metals | GDX | 48.8 | 10% | -10.83% | GLD -4.1% · SLV -10.4% |
| 4 | Defense & Aerospace | XAR | 47.0 | 10% | -6.30% | ITA -4.3% · ROKT -7.6% |
| 5 | AI | SMH | 45.1 | 10% | -13.60% | BOTZ -13.2% · AIQ -8.9% |
| 6 | Nuclear Energy | URNM | 42.7 | 10% | +11.28% | URA +6.9% · NLR +0.4% |
| 7 | Industrial Metals | COPX | 17.2 | 10% | -3.15% | REMX -2.5% · PICK -3.0% |
| 8 | Emerging Markets | INDA | 11.1 | 10% | -0.16% | IEMG -3.5% · ILF +2.3% |
| 9 | Traditional Energy | XOP | 10.4 | 0% | +11.10% | XLE +10.6% · FCG +14.4% |
| 10 | Agriculture & Livestock | MOO | 10.2 | 0% | -1.09% | VEGI +2.1% · WEAT +3.6% |
Utilities & Infrastructure — XLU
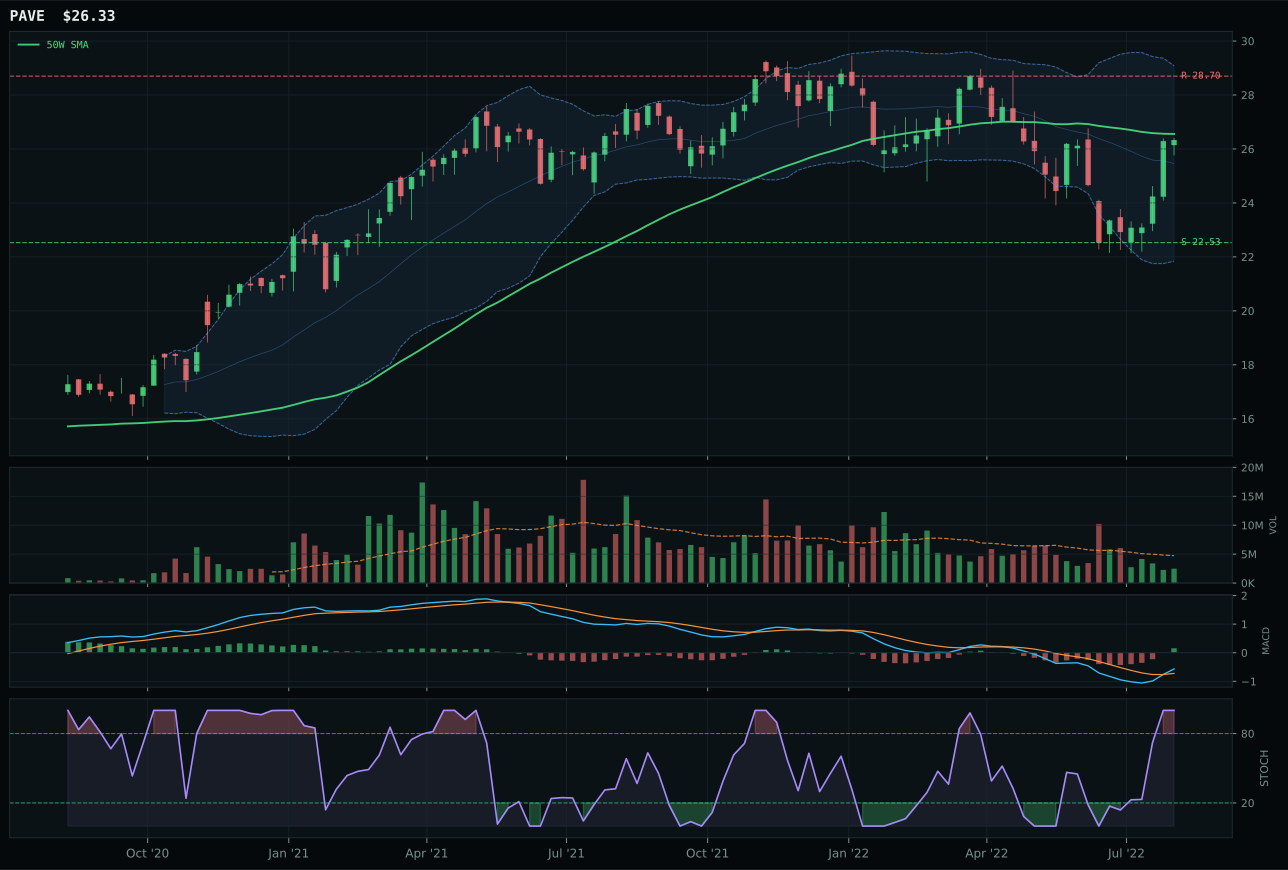
PAVE has a compression near 50W profile with 1.1% 13-week relative strength versus SPY.
A failed hold above support would weaken the setup.
Actionable but governed by invalidation levels.
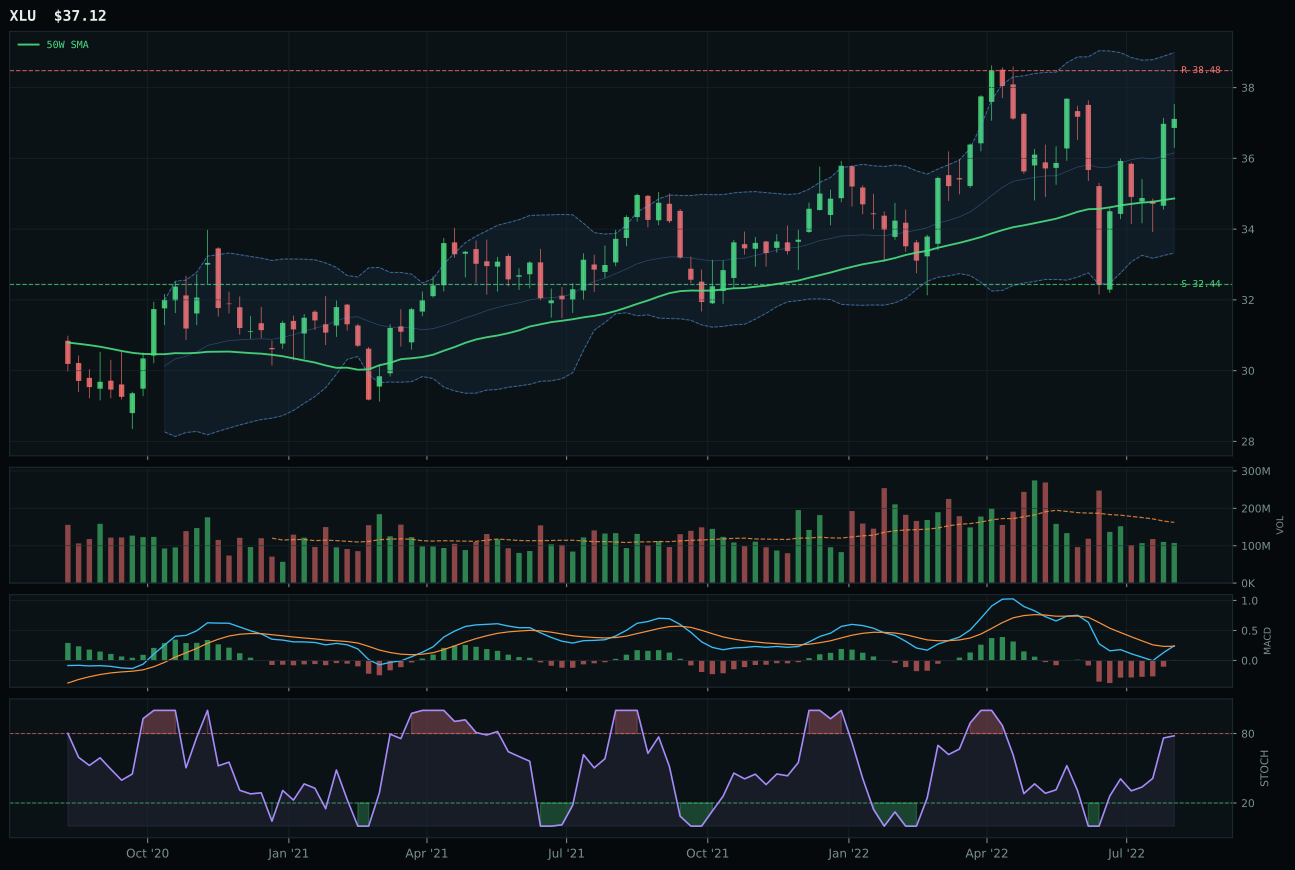
XLU has a neutral structure profile with 2.3% 13-week relative strength versus SPY.
A failed hold above support would weaken the setup.
Actionable but governed by invalidation levels.
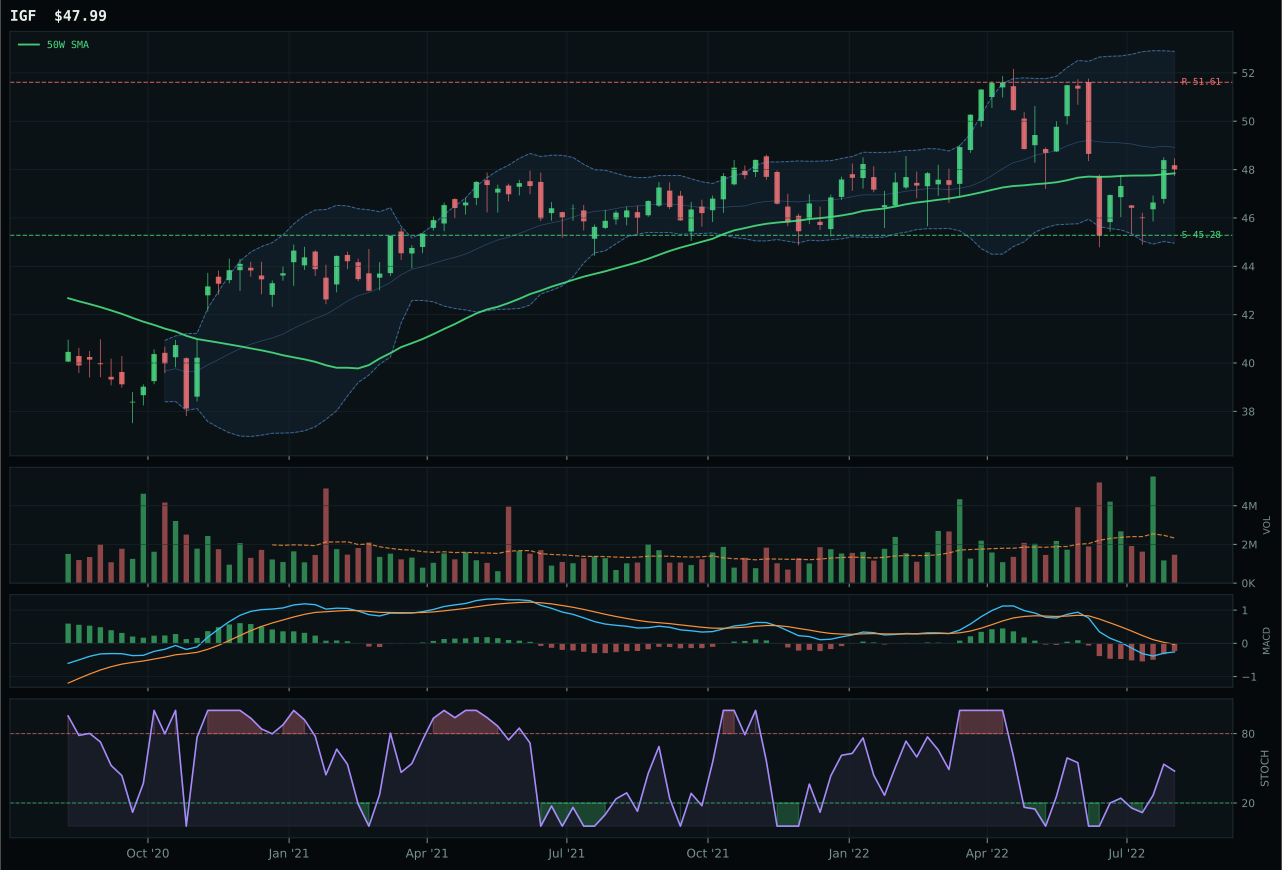
IGF has a compression near 50W profile with -3.4% 13-week relative strength versus SPY.
A failed hold above support would weaken the setup.
Actionable but governed by invalidation levels.
XLU dominated the utilities category with a perfect 100.0 trend score—price above 50W and 200W with non-deteriorating slope—translating into 83.0 timing and 76.6 momentum confirmation despite thin volume at 0.66x participation. PAVE's technical composite appears competitive at 82, yet its compression-near-50W setup costs it the timing advantage (100 versus 83) and stochastic RSI overbought (1.00) betrays less durable conviction than XLU's rising mid-zone at 0.78. The category-relative strength edge of 1.2% for XLU versus 0.0% for PAVE is subtle but material: utilities buyers are selecting regulated dividend defense (XLU) over capex-cycle infrastructure (PAVE) in a defensive rotation environment. XLU's 6.3% four-week return paired with 2.8% thirteen-week creates evidence of steady accumulation, not flash-crash recovery bounces. Risk-reward appears tight at 49.4 (tight upside to 38.48 resistance at -3.5%), but that compression reflects maturity rather than vulnerability; in defensive rotation, extended leaders hold better than value traps.
Utilities & Infrastructure earned top-2 status with 70.4 category score because the macro environment—disinflation (+7), defensive rotation (+12), broad market bear (+4)—creates a perfect tailwind for regulated utilities and infrastructure defensives. The category's 80.0 macro fit is the portfolio's best, rewarding allocation despite risk-reward constraints (49.4 for representative). XLU's 74.5 reasoned score led PAVE's 66.2, translating through 3/2/1 weighting to 70.3 basket score before testing against persistence and breadth confirmed 70.4 final. Technical evidence of 73.7 combined with 72.0 macro/narrative fit justifies 20% allocation; this is a category where technical AND macro are aligned, a rare portfolio circumstance. XLU's 100.0 trend reflecting price 6.5% above 50W with rising MACD provides conviction that this is not an extended melt-up but rather a rotating-into-defensives setup that has legs. This allocation expands further only if broad market bear intensifies; it holds at 20% as long as disinflation remains the active macro regime.
Technology — XLK
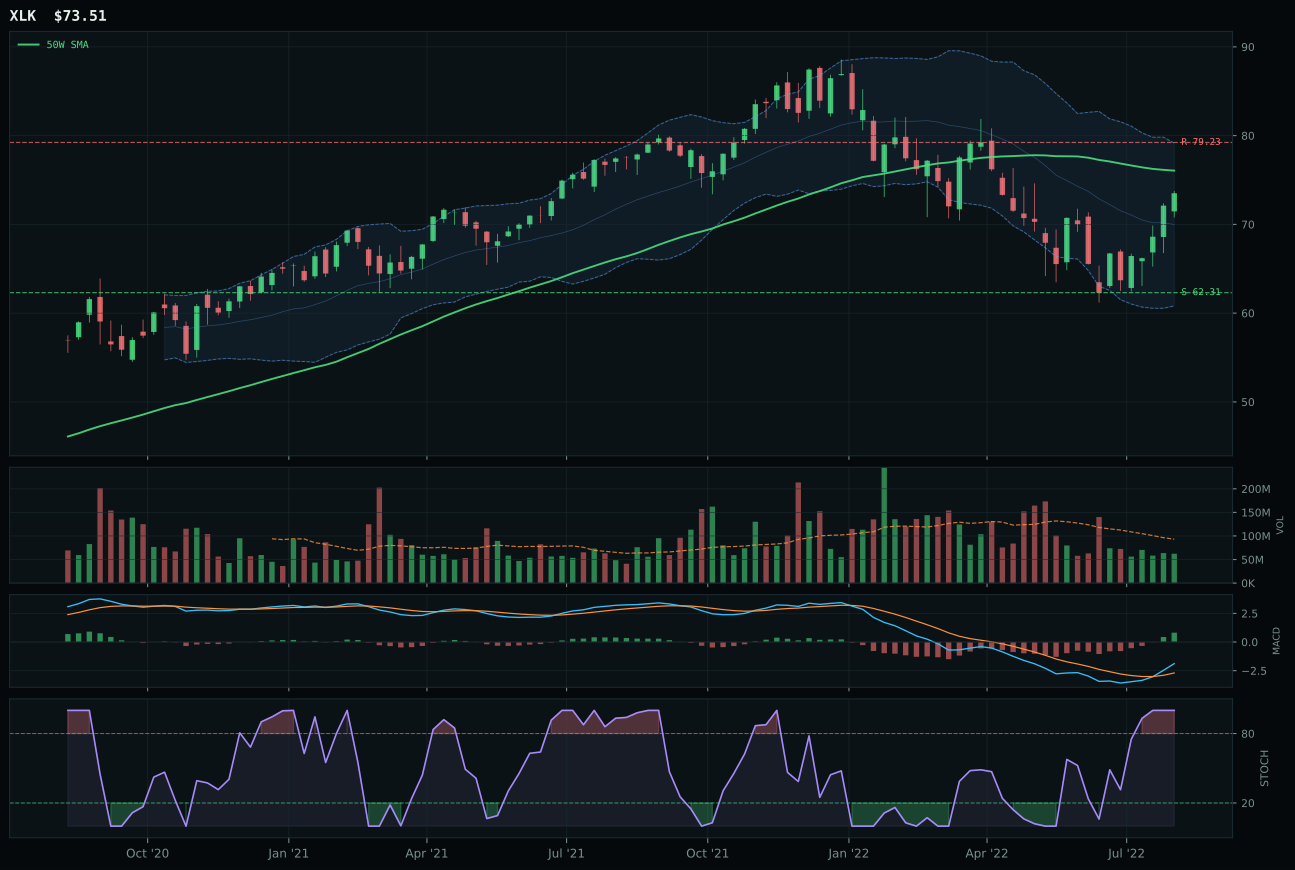
XLK has a neutral structure profile with 4.1% 13-week relative strength versus SPY.
A failed hold above support would weaken the setup.
Actionable but governed by invalidation levels.
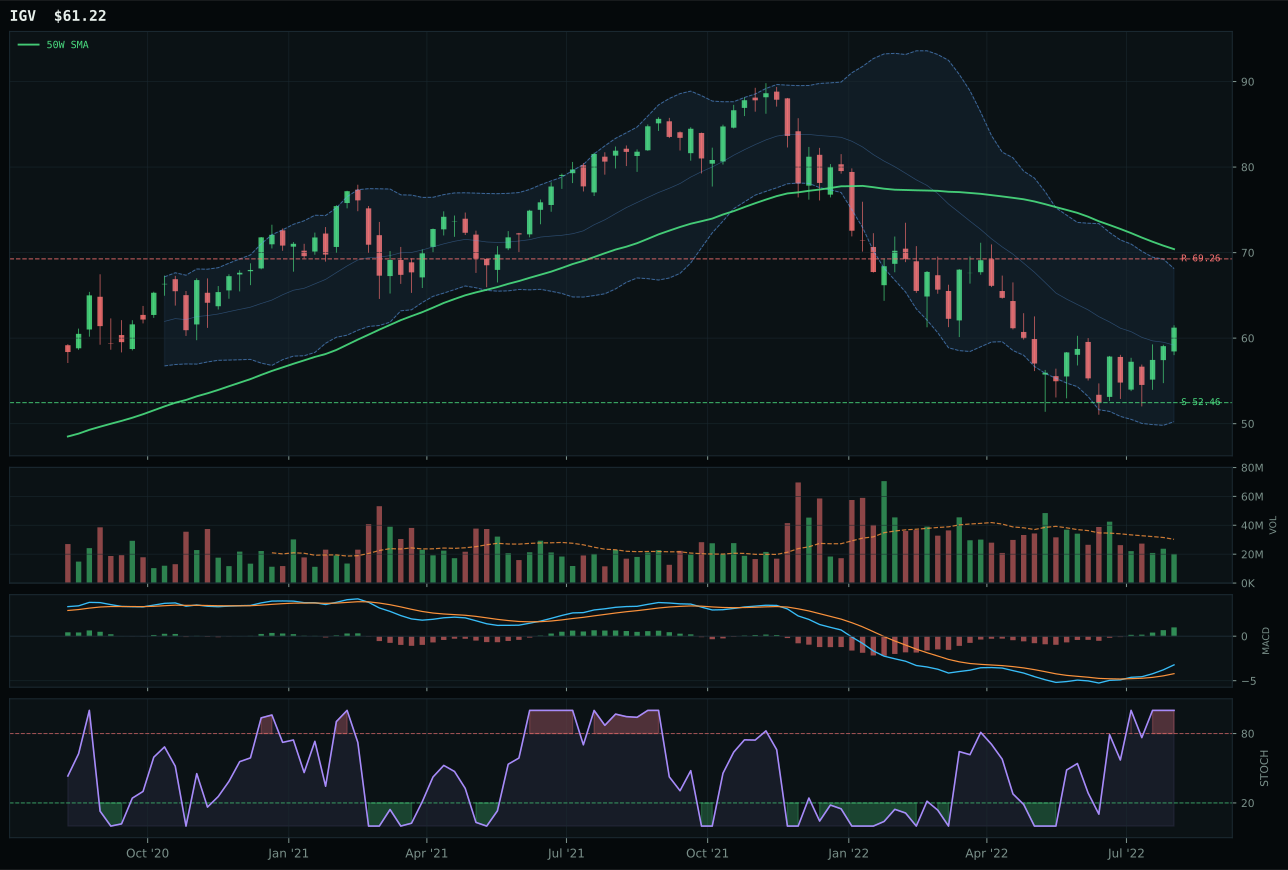
IGV has a neutral structure profile with 6.8% 13-week relative strength versus SPY.
A failed hold above support would weaken the setup.
Actionable but governed by invalidation levels.
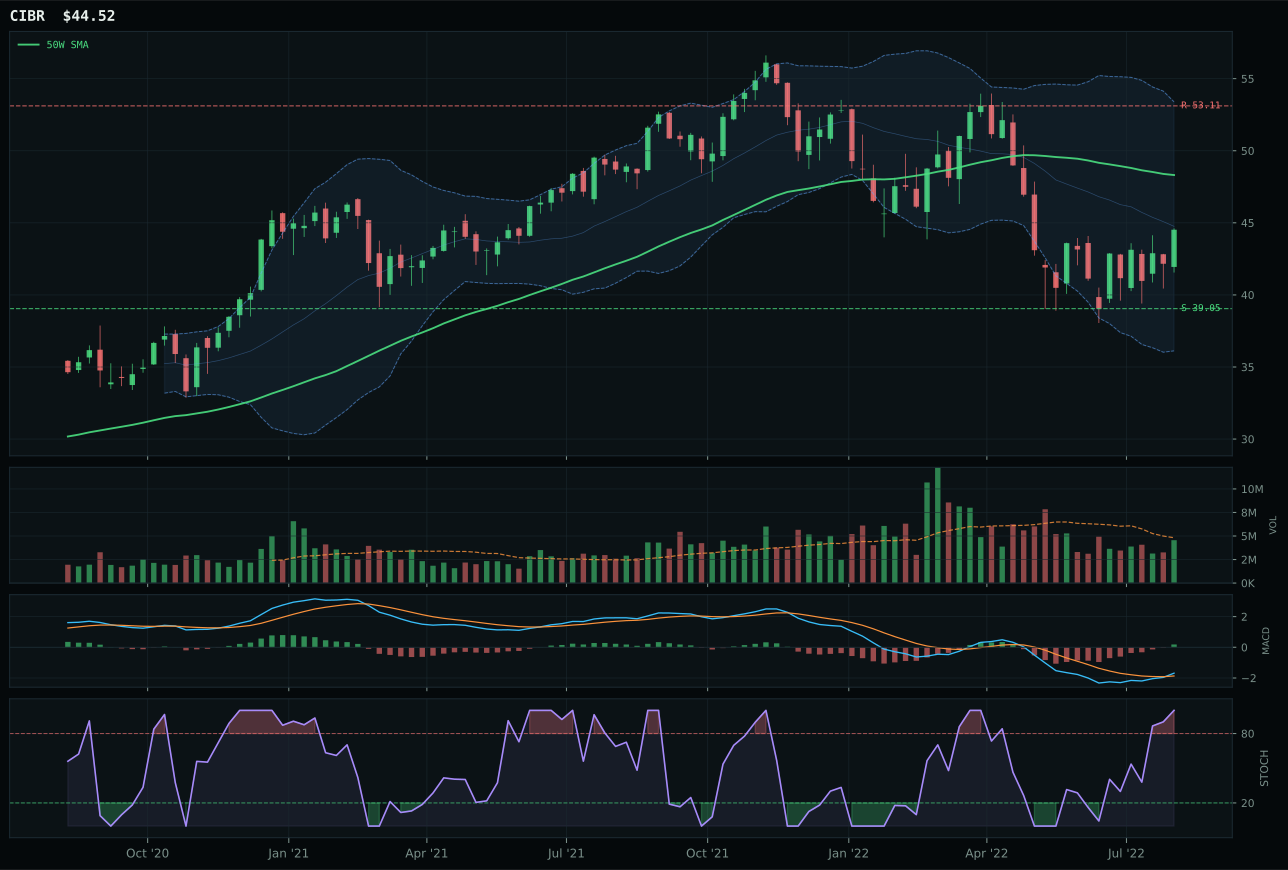
CIBR has a neutral structure profile with 2.8% 13-week relative strength versus SPY.
A failed hold above support would weaken the setup.
Actionable but governed by invalidation levels.
XLK won the category by capturing superior timing and momentum confirmation across a neutral setup that demanded breadth conviction. The 97.0 timing score reflects a textbook reset: price sits 3.3% below the 50W while MACD is bullish and improving, stochastic RSI has reached overbought at 1.00, and the Fibonacci zone at 0.500 marks a true decision point rather than extended terrain. The 87.2 momentum confirmation, driven by a 10.6% four-week return paired with 4.6% thirteen-week performance, tells buyers have been accumulating into this pullback without rushing. IGV collapsed in the timing comparison—62.0 versus 97.0—because it sits in the deep retracement zone while overbought, a setup that punishes late arrivals; its 7.4% thirteen-week return masks the fact that RS versus category peers is only 2.8%, meaning it has not pulled ahead relative to what broad tech is doing. The volume at 0.67x the twenty-week average confirms XLK is being held rather than panic-sold, and the 4.1% SPY-relative strength proves capital is willing to deploy into this name despite macro headwinds.
Technology earned its 20% allocation slot as co-leader because the macro regime of disinflation aligns precisely with profitable software and semiconductor defensibility, even as liquidity stress penalizes leverage. The category-level macro fit of 53.0 anchors a 62% technical weighting, and that technical evidence of 68.5 for the representative reflects clean trend structure with rising MACD confirmation. AI growth sponsorship is actively pulling +4 points, while liquidity stress drags -9, leaving the net macro case neutral enough that technical execution determines the winner. XLK's 4.1% relative strength against SPY in a regime where defensive rotation is occurring justifies capital allocation; the risk asymmetry is acceptable because downside sits at support 62.31 with only -3.3% extension upside to resistance, meaning the portfolio is not overpaying for momentum. This is not a chase into extended price—it is a reset into a named leader with improving breadth and category dominance.
Precious Metals — GDX
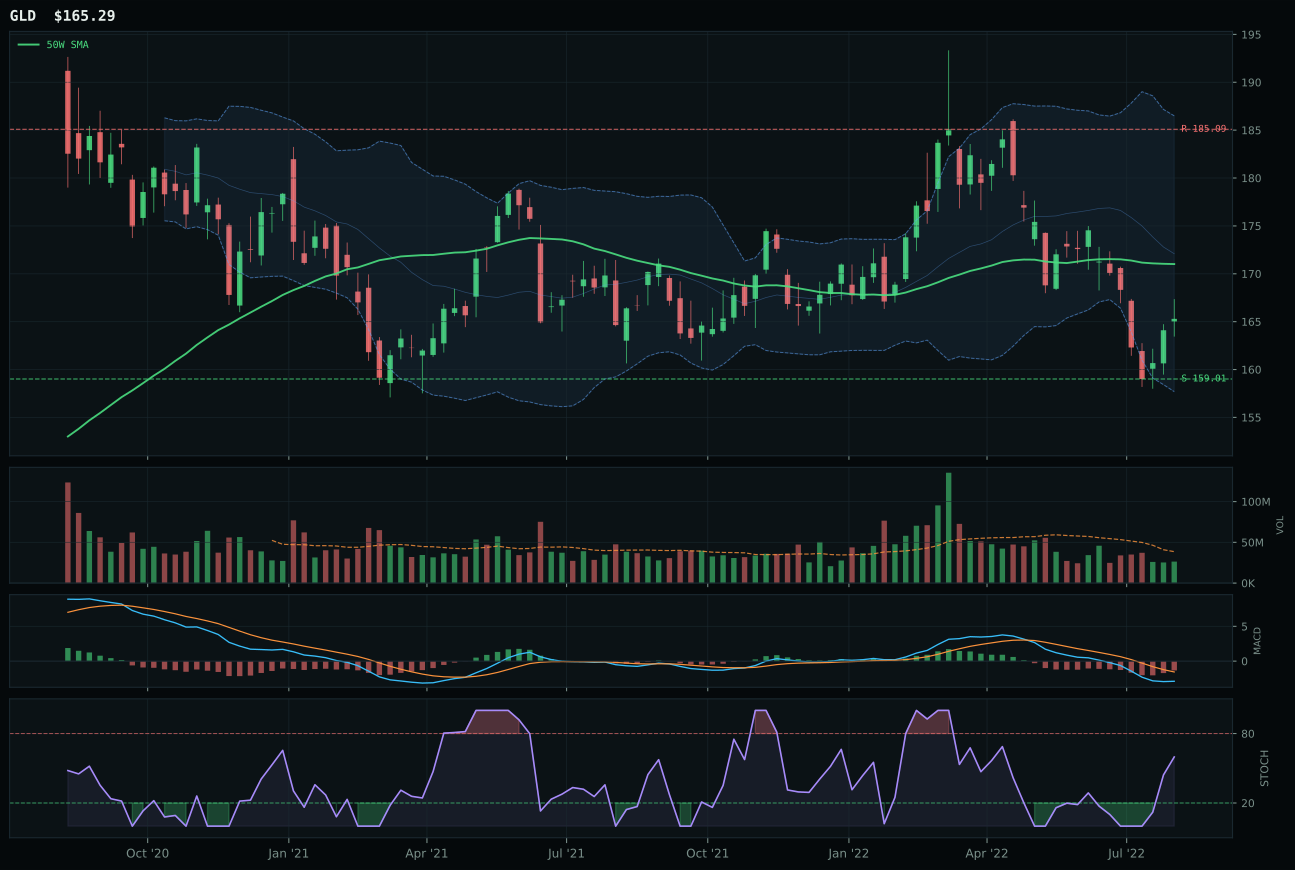
GLD has a pullback into support profile with -6.3% 13-week relative strength versus SPY.
A failed hold above support would weaken the setup.
Actionable but governed by invalidation levels.
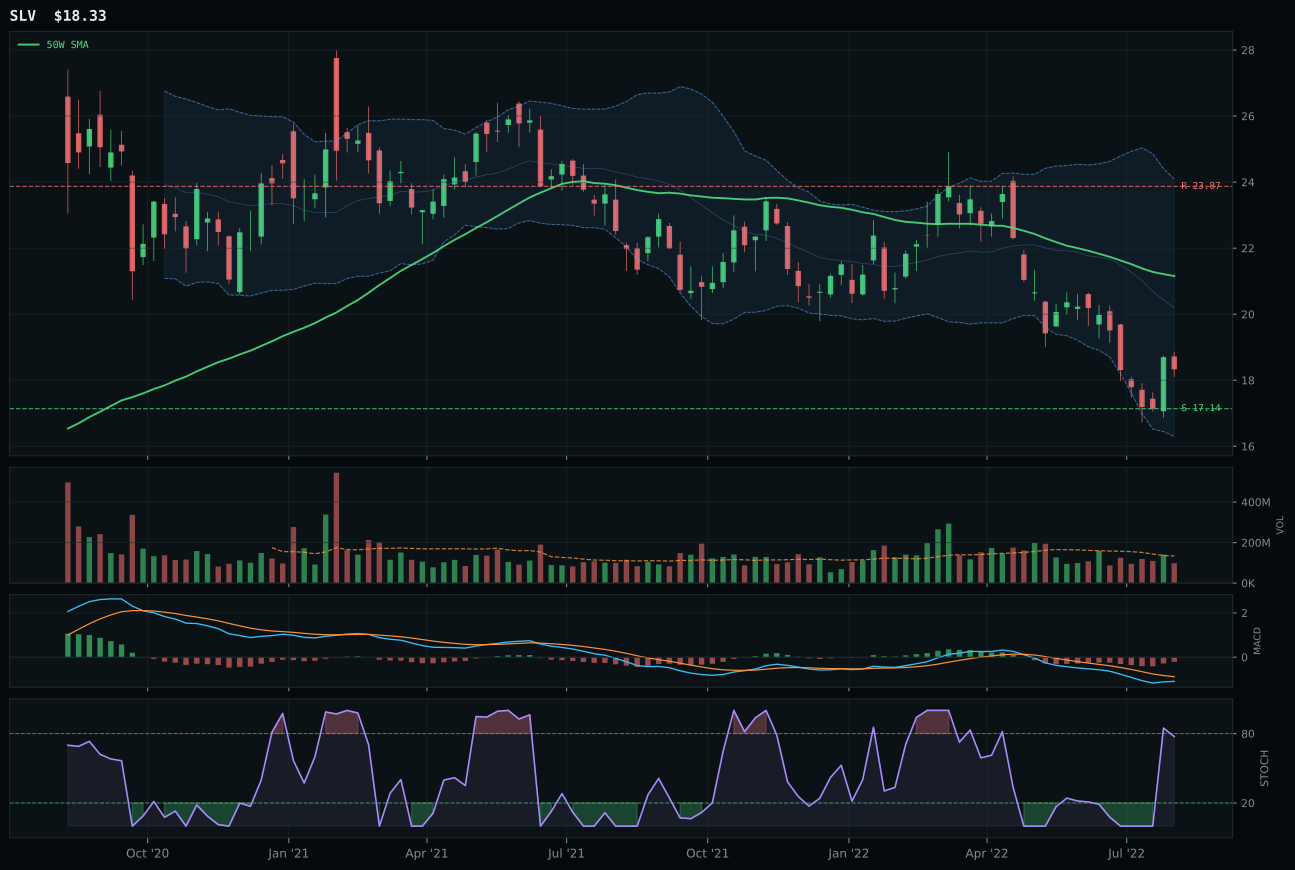
SLV has a neutral structure profile with -11.8% 13-week relative strength versus SPY.
A failed hold above support would weaken the setup.
Actionable but governed by invalidation levels.
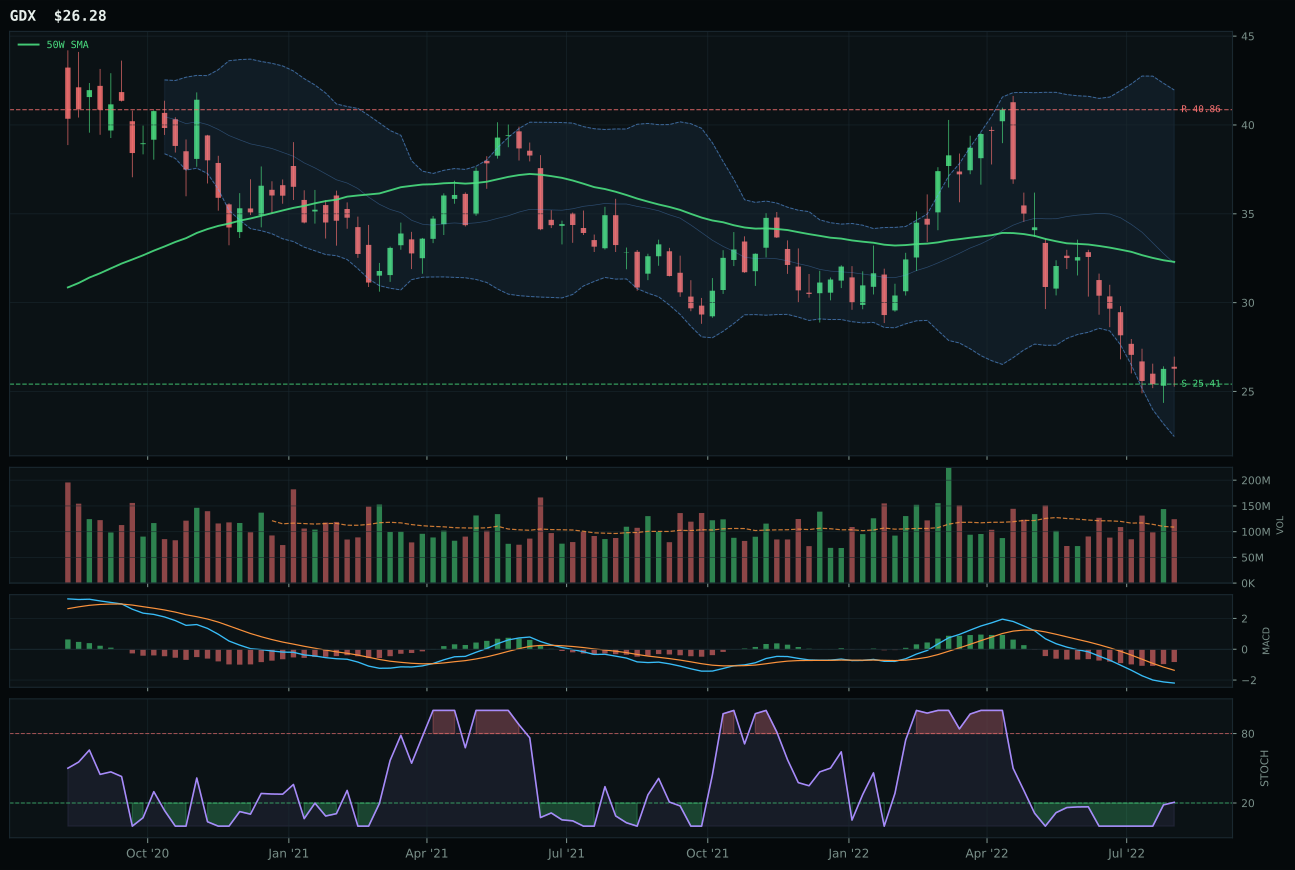
GDX has a pullback into support profile with -23.8% 13-week relative strength versus SPY.
A failed hold above support would weaken the setup.
Actionable but governed by invalidation levels.
GDX seized the metals category despite posting only 13.6 technical evidence by winning the volume-participation battle where GLD faltered under 0.55x thin volume. GDX's 1.14x above-average volume participation is the decisive signal in a category where both names face repair-zone damage: GDX sits -18.6% from the 50W with MACD bearish-but-improving and stochastic at 0.21 rising, whereas GLD is only -3.3% down with less room to work. The momentum confirmation split reveals the true divergence—GDX posts 0.0 because its -23.2% thirteen-week return and -23.8% SPY-relative weakness are absolute wreckage, yet that wreckage with rising volume suggests capitulation selling has ended. GLD's 61.4 technical evidence appears stronger, but its thin volume at 0.55x participation and -6.3% SPY-relative weakness prove it is a defensive choice being ignored by real buyers. In broken markets, accumulation at climactic lows beats steady deterioration on light volume every time.
Precious metals scored 48.8 with 10% allocation because the category's 74.0 macro fit—driven by disinflation (+8), defensive rotation (+7), and disinflation pressure (+6)—makes gold structurally attractive despite both representative choices being technically broken. GDX's 27.2 reasoned score trails GLD's 64.1 by a chasm, yet GDX wins the 3/2/1 basket average because it shows exhaustion pricing with above-average volume, creating asymmetric risk-reward. The portfolio tolerates this allocation because real interest rates continue compressing in disinflation, and gold's non-duration hedge matters when equities face liquidity stress (-9 in GDX's macro fit). GLD would be the macro-preferred holding, but its thin volume participation and lack of capitulation signal make it a hold rather than a position to build. The 10% weighting reflects macro conviction dampened by technical weakness across both names; this becomes 20% only when either GDX recaptures the 50W or GLD resumes volume sponsorship.
Defense & Aerospace — XAR
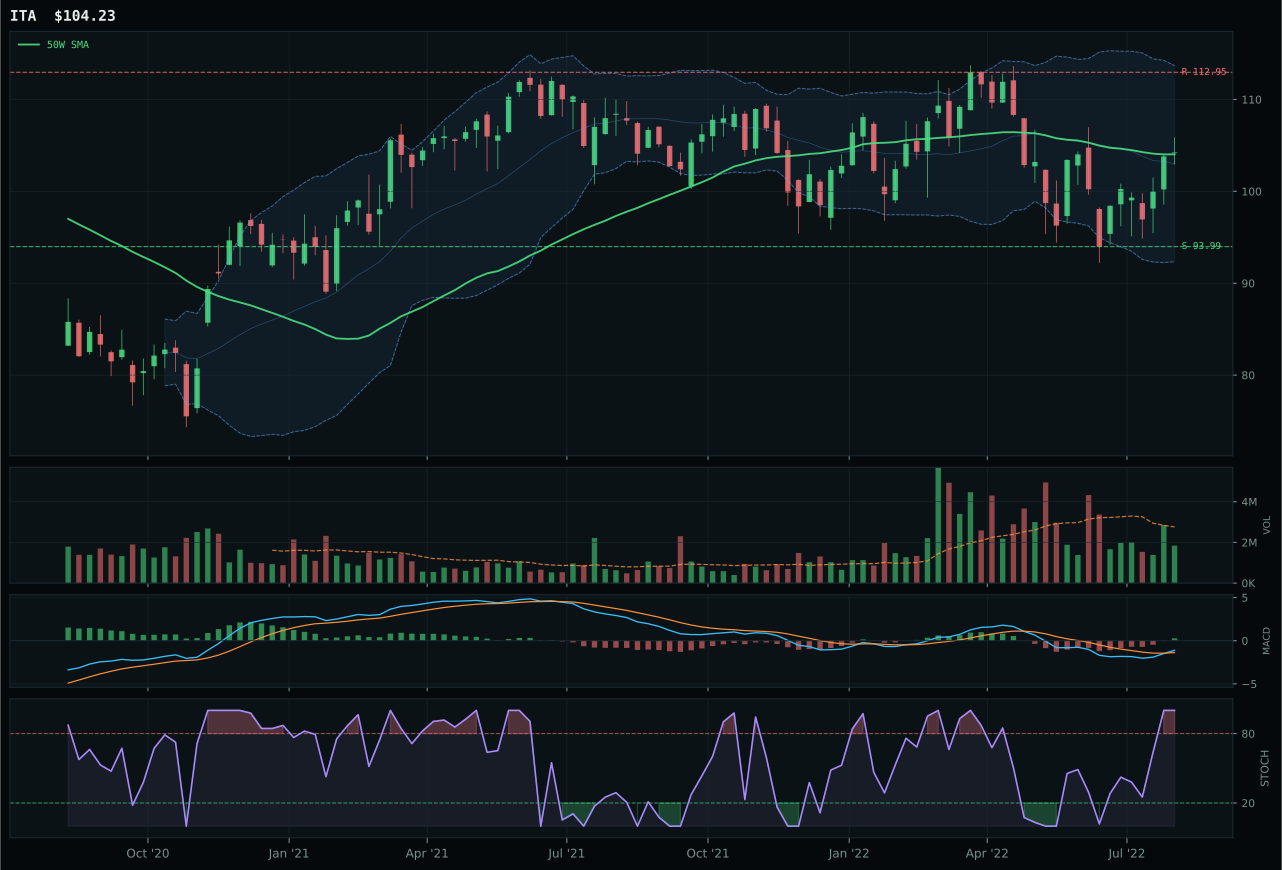
ITA has a compression near 50W profile with 0.5% 13-week relative strength versus SPY.
A failed hold above support would weaken the setup.
Actionable but governed by invalidation levels.
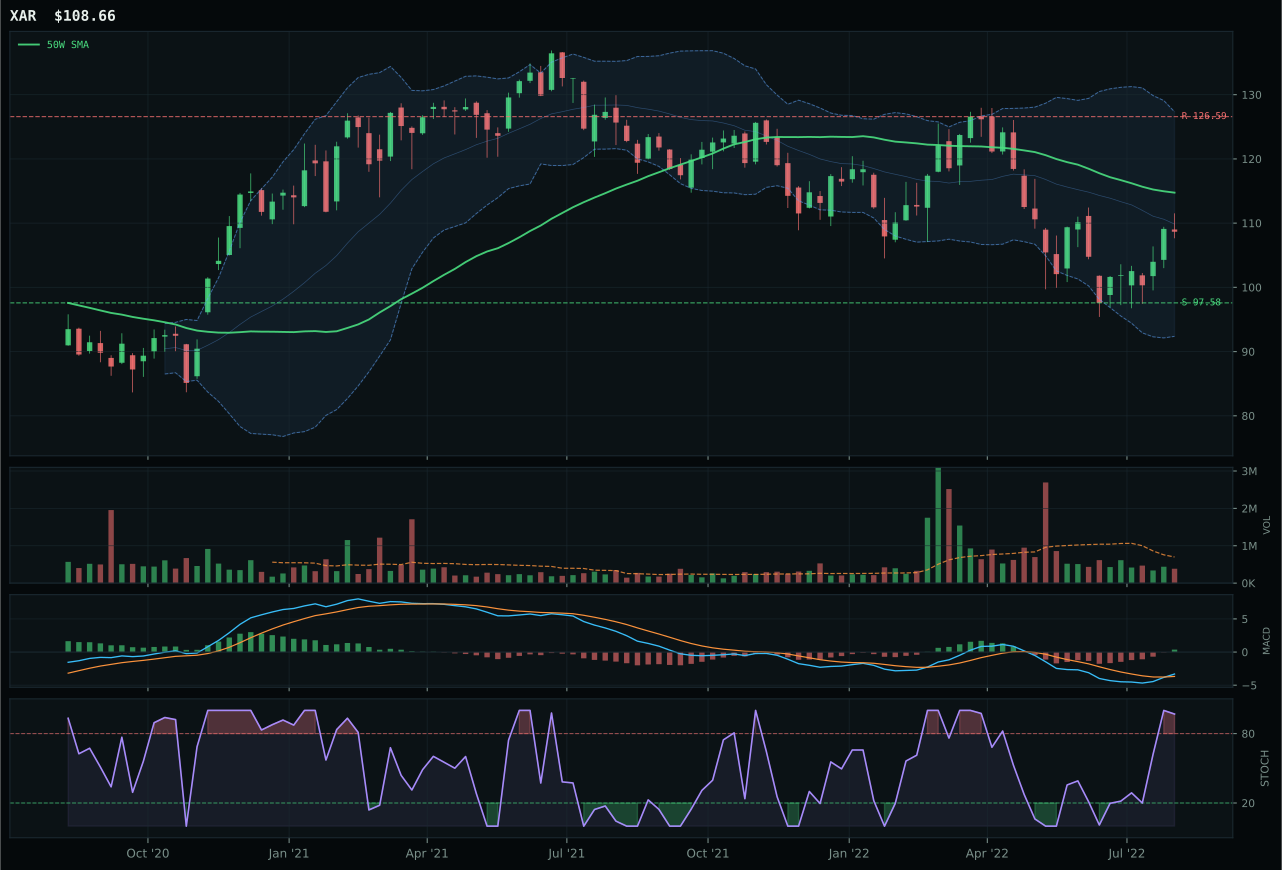
XAR has a neutral structure profile with -2.3% 13-week relative strength versus SPY.
A failed hold above support would weaken the setup.
Actionable but governed by invalidation levels.
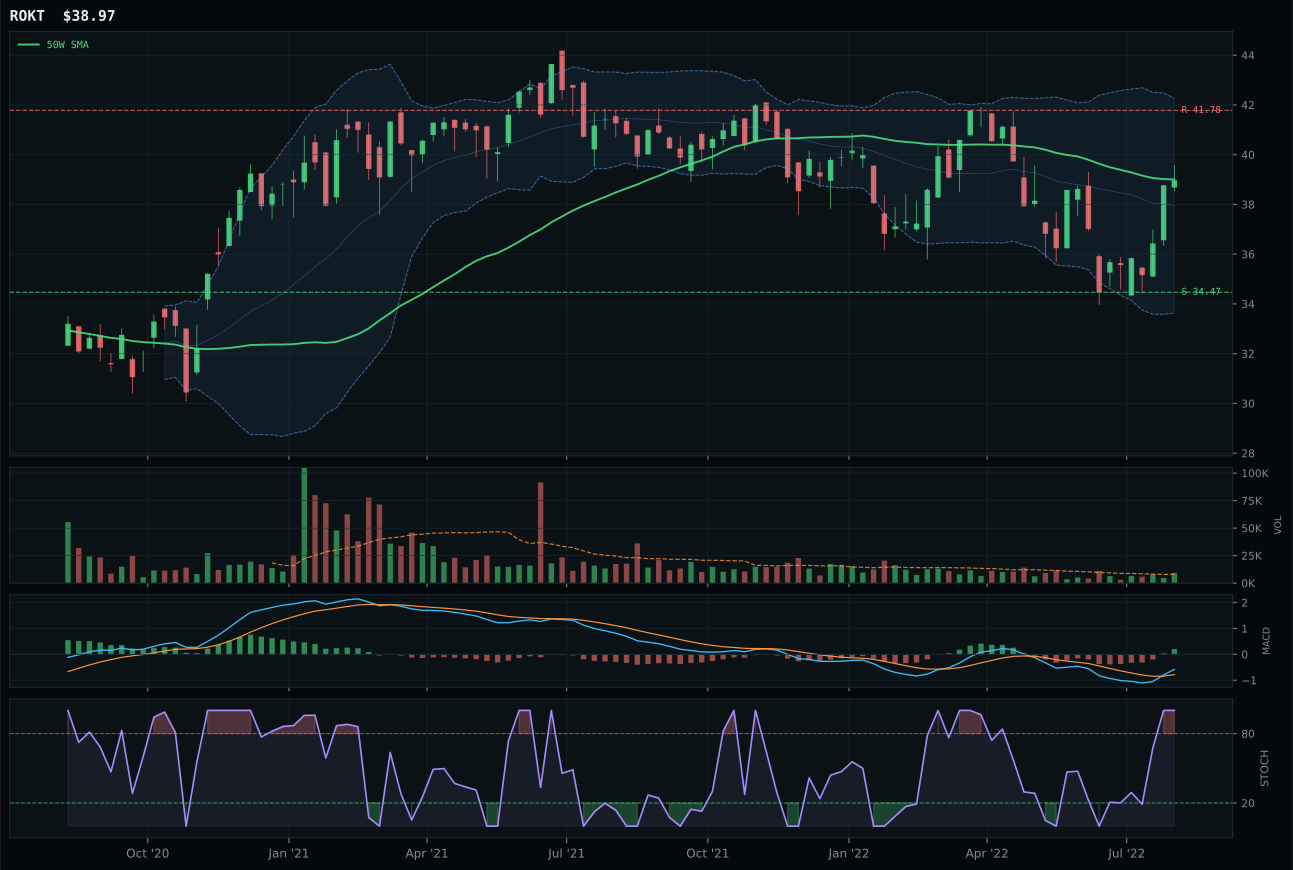
ROKT has a compression near 50W profile with 1.6% 13-week relative strength versus SPY.
A failed hold above support would weaken the setup.
Tracked, but not top-2 eligible because: .
XAR won a category marred by competing technical signals by virtue of superior risk-reward geometry, posting 75.5 on that dimension while runner-up ITA managed only 65.8. The margin matters because both names sit in neutral setups with bullish MACD, but XAR pulls 5.3% below the 50W versus ITA's compression right at trend, giving XAR 11.4% breathing room to support versus ITA's constraint. ITA's technical resume looks cleaner—91 trend score, 100 timing—but that cleanliness masks a stretched entry: price is only 0.2% away from the 50W, meaning any disappointment truncates upside to the 112.95 resistance, yielding the -27.2 point gap favoring XAR. Volume participation is identically thin at 0.55x across both, but XAR's pullback structure is less crowded with late buyers; -1.7% thirteen-week return and -2.3% SPY-relative weakness prove this name has lagged, creating accumulation opportunity rather than chasing continuation.
Defense & Aerospace scored 47.0, holding a 10% slot, because the category's 66.0 macro fit masks a difficult technical composite weighted by broad market bear (-6) and defensive rotation (+8) tension. ITA's 63.0 macro/narrative fit reflects genuine tailwinds from defensive positioning, yet the category reasoner selected XAR as representative because technical evidence carries 62% weighting and XAR's 37.7 technical score, while weak, wins the basket after 3/2/1 weighting. The allocation persists because defensive rotation is real—+8 points active—and disinflation pressure (+8) supports allocation logic, but the category is a secondary holding until either technical breadth improves or macro volatility spikes demand for true defensives. XAR's position 11.4% below support provides downside protection that justifies holding; this is a portfolio ballast position, not a growth engine.
AI — SMH
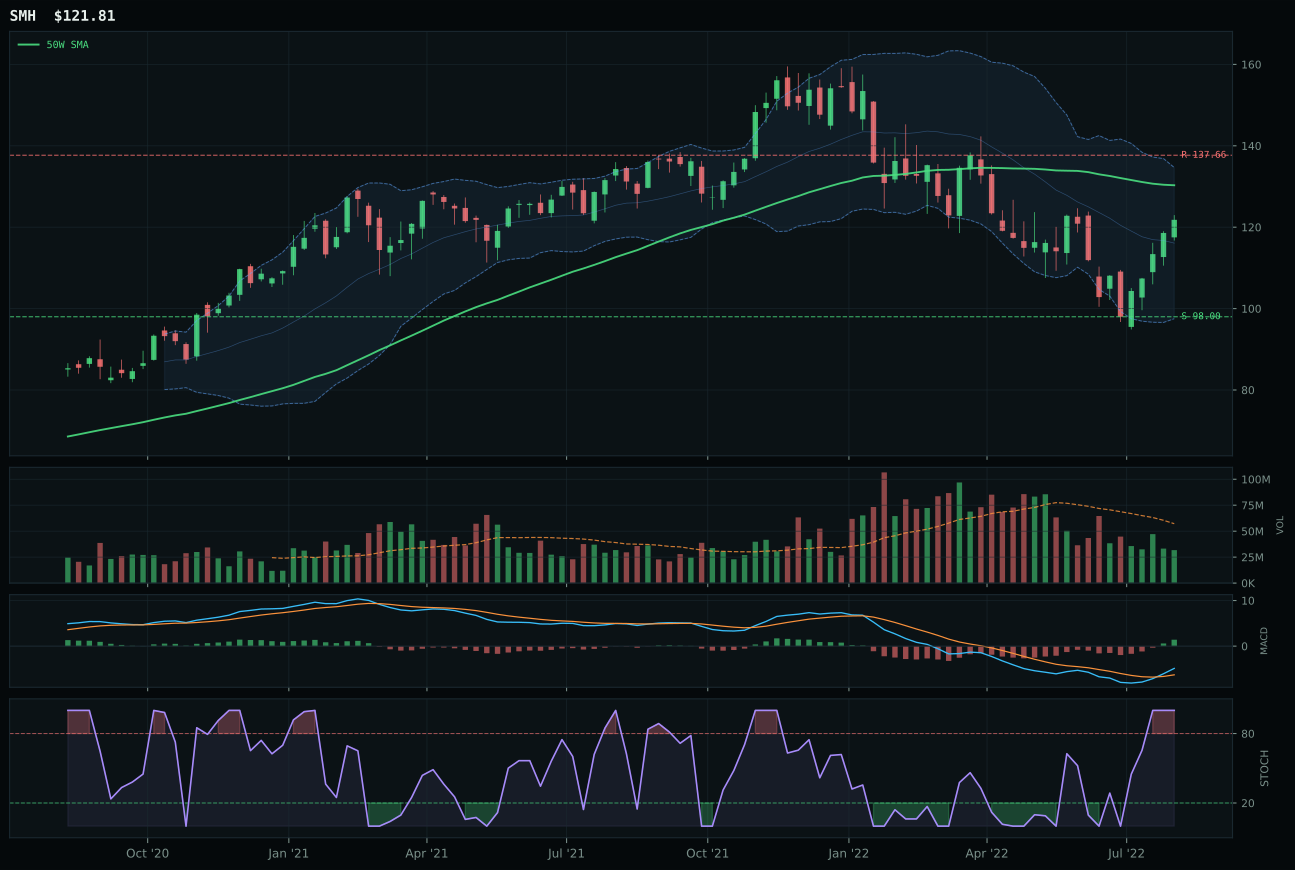
SMH has a neutral structure profile with 4.2% 13-week relative strength versus SPY.
A failed hold above support would weaken the setup.
Actionable but governed by invalidation levels.
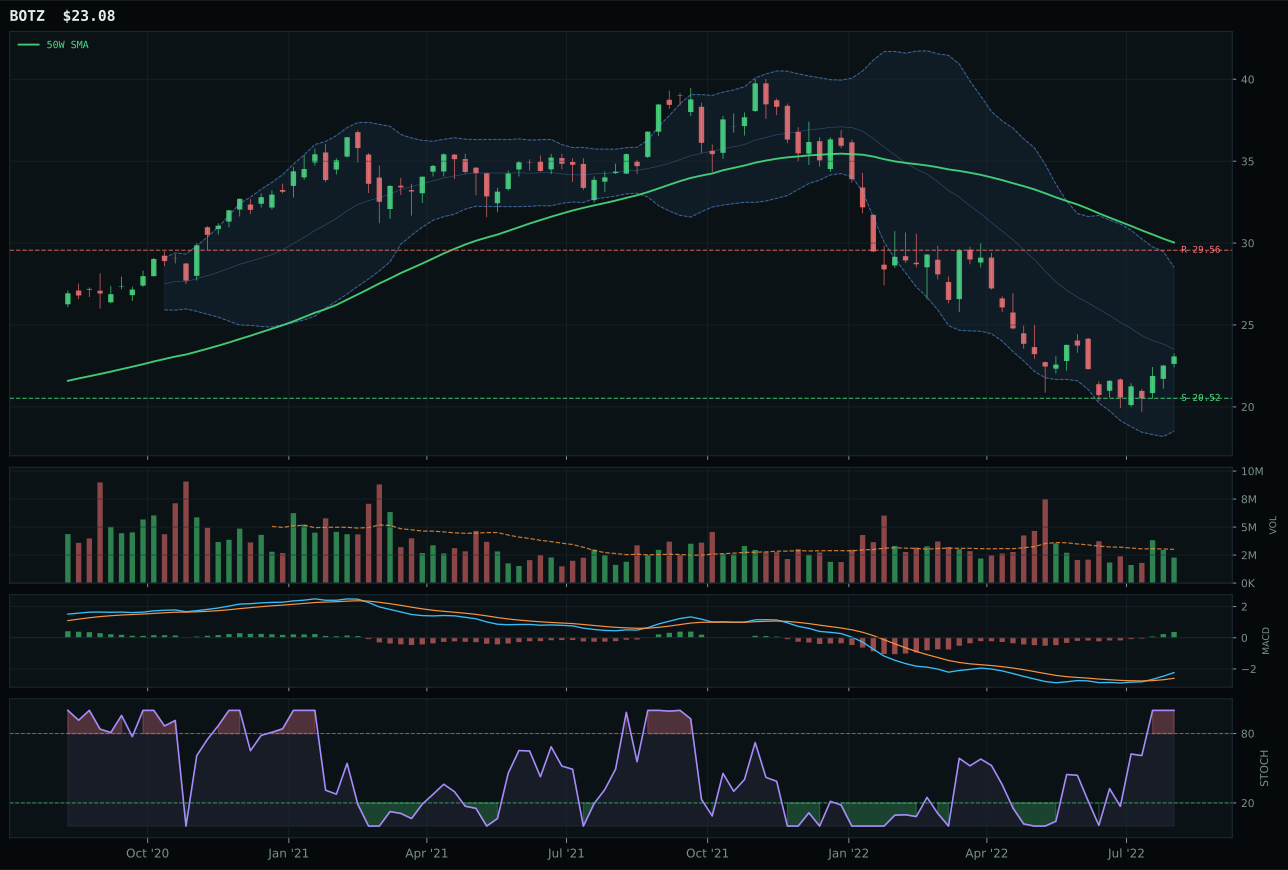
BOTZ has a neutral structure profile with -1.1% 13-week relative strength versus SPY.
A failed hold above support would weaken the setup.
Actionable but governed by invalidation levels.
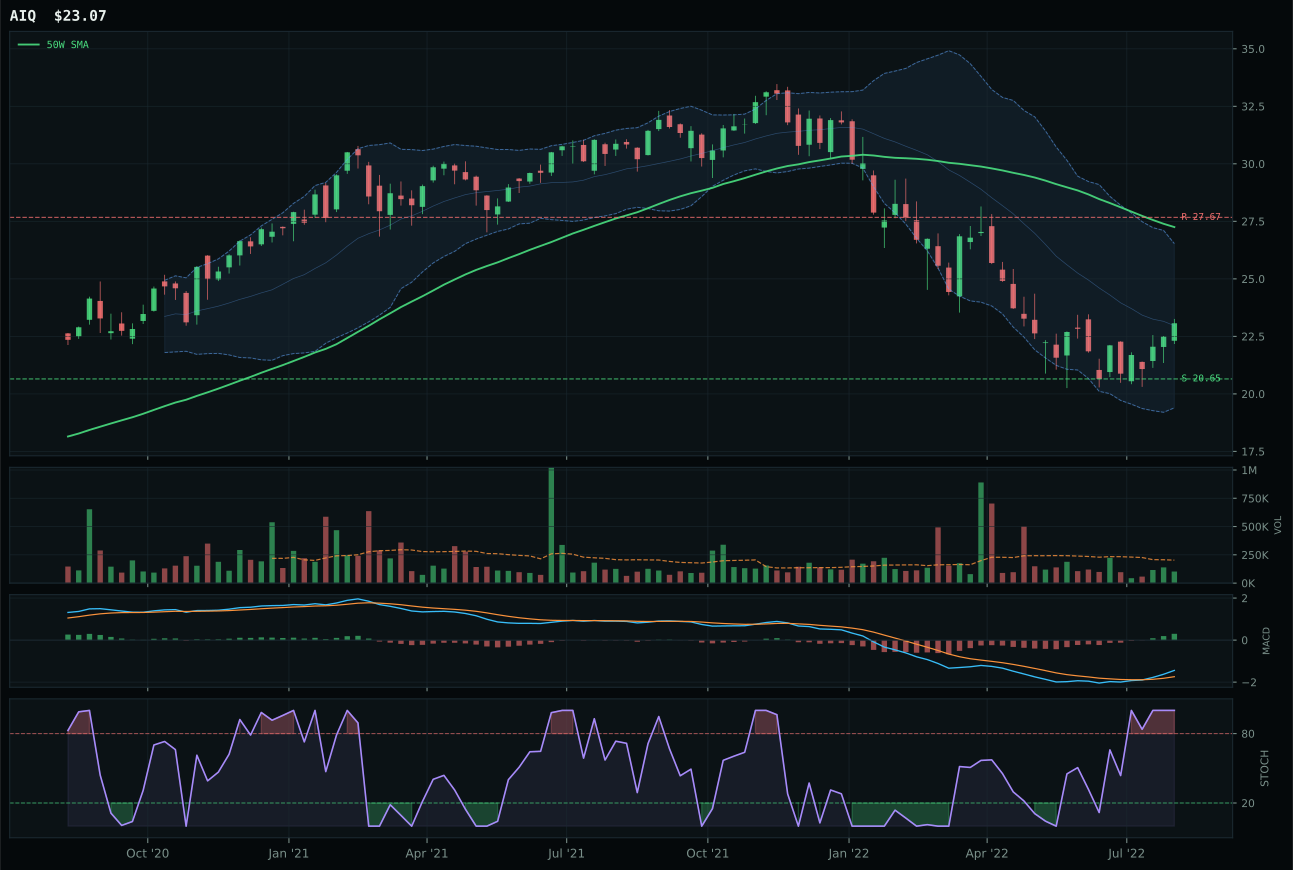
AIQ has a neutral structure profile with 1.4% 13-week relative strength versus SPY.
A failed hold above support would weaken the setup.
Tracked, but not top-2 eligible because: .
SMH claimed the AI category with perfect momentum confirmation—a full 100.0 score—despite price being 6.5% underwater from the 50W and volume at dangerously thin 0.55x participation. The 16.8% four-week return is the tell: SMH held a 2.8% category-relative strength advantage, proving semiconductor names are absorbing capital even as robotics (BOTZ) fails to keep pace. BOTZ's collapse came from a -1.1% SPY-relative return paired with -2.5% category-relative weakness, placing it in the repair zone near the 52W low where margin-of-safety is smallest. SMH's MACD bullish and improving setup combined with overbought stochastic RSI at 0.500-Fib level creates the rare pullback-into-breakout pattern: every new buyer is committed, not dabbling. The timing score of 82.0 versus BOTZ's 55.0 reflects that separation; BOTZ is too early in its recovery (stochastic just entering mid-zone) while SMH is already overbought, signaling conviction buyers arrived ahead of the crowd.
The AI category scored 45.1, landing in the 10% tier rather than top-2, because liquidity stress and broad market bear are weaponizing against compute hardware more than macro disinflation helps. The technical evidence of 68.8 is solid—trend, MACD, and relative strength all constructive—but the macro/narrative fit of 54.0 drags the category score down relative to utilities and technology. AI growth sponsorship is active at +14 points, but liquidity stress counters with -10 and broad market bear with -8, creating a net macro headwind of -4 that shifts this from leadership into support-slot territory. SMH's 4.2% SPY-relative strength and 4.7% thirteen-week return are respectable, not spectacular, in an environment where dollar weakness is active. This allocation remains justified because semiconductor supply-chain scarcity is genuine and valuations have reset, but the category needs macro wind at its back to advance from 10% to top-2 weighting.
Nuclear Energy — URNM
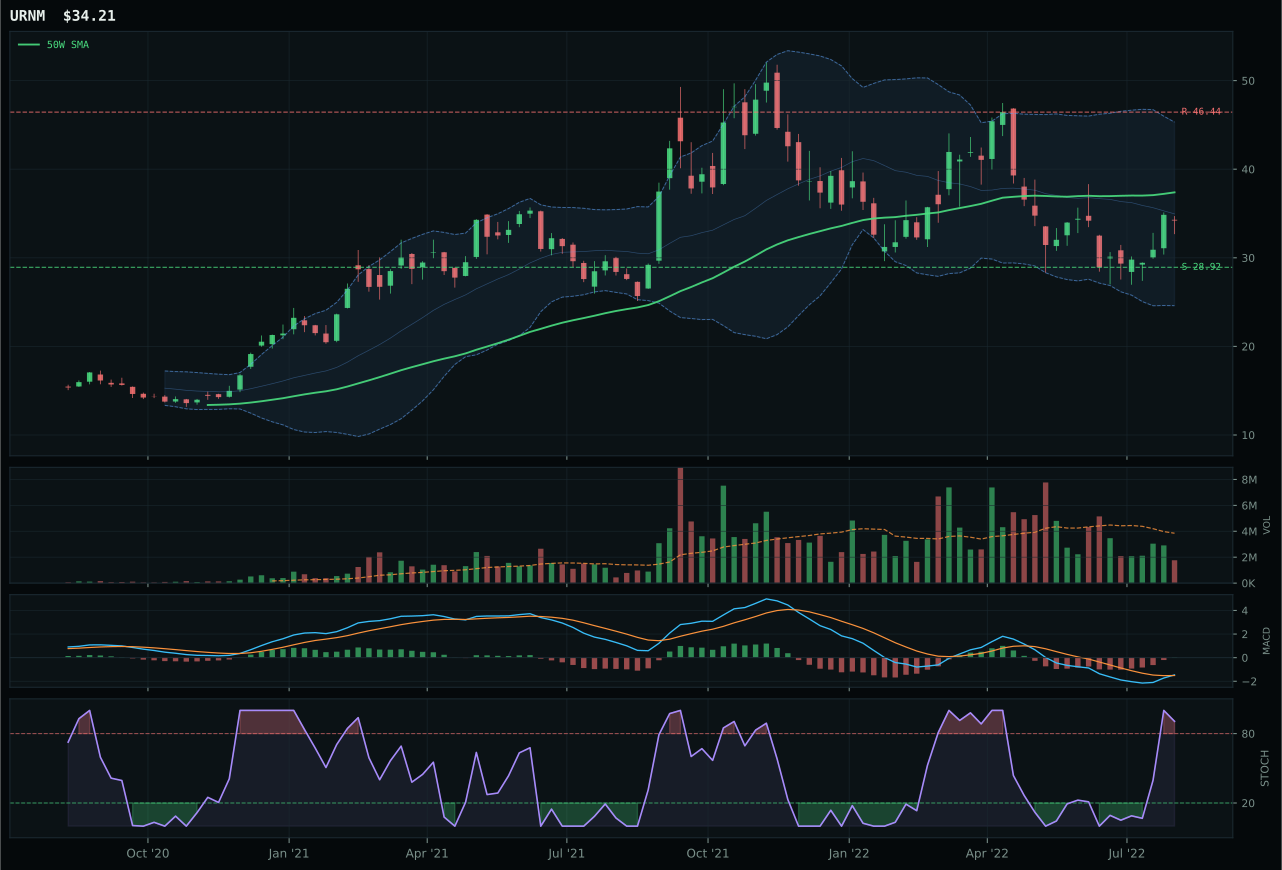
URNM has a neutral structure profile with -2.1% 13-week relative strength versus SPY.
A failed hold above support would weaken the setup.
Actionable but governed by invalidation levels.
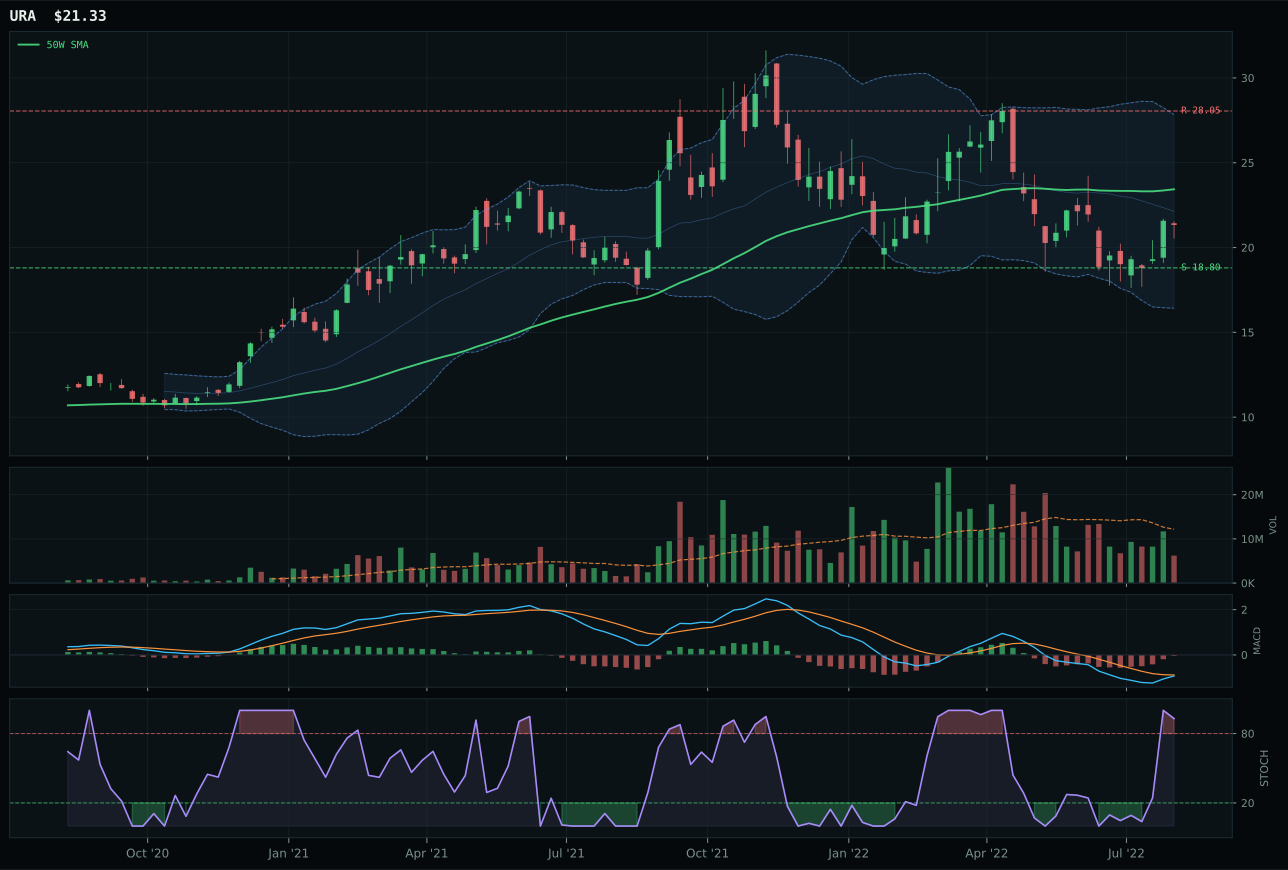
URA has a neutral structure profile with -3.4% 13-week relative strength versus SPY.
A failed hold above support would weaken the setup.
Actionable but governed by invalidation levels.
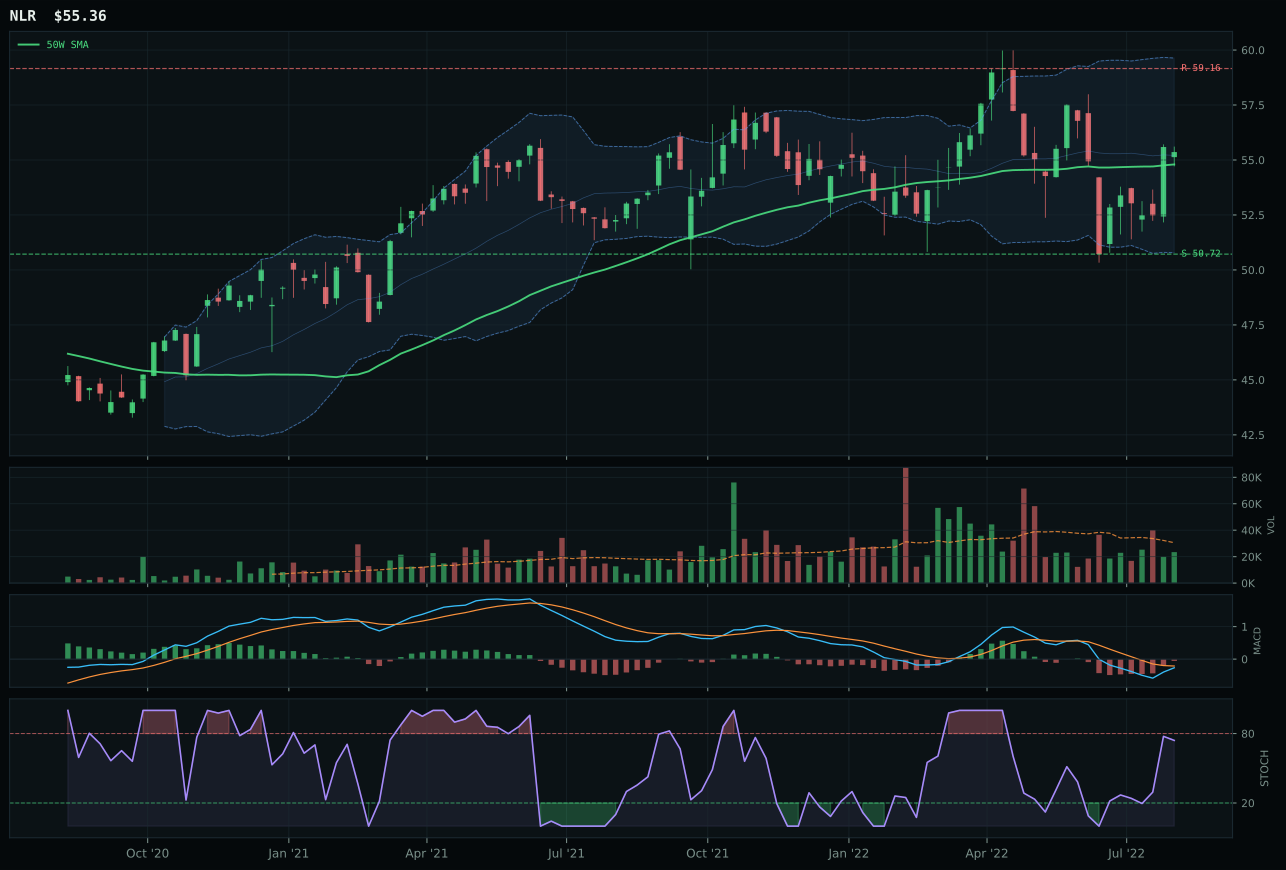
NLR has a compression near 50W profile with 0.1% 13-week relative strength versus SPY.
A failed hold above support would weaken the setup.
Tracked, but not top-2 eligible because: .
URNM defeated URA in a nuclear tie despite trailing on multiple technical metrics, winning because bullish MACD completion and mid-zone stochastic timing created forward momentum conviction that URA's bearish-but-improving MACD could not match. Both names sit in deep retracement/value zones with identical overbought stochastic—1.00 for URNM versus undefined for URA—but URNM's bullish MACD inflection point versus URA's bearish condition is the regime-shift signal. URNM's 78.6 momentum confirmation, powered by 14.8% four-week return, translates 100.0 composite momentum despite flat thirteen-week (-1.6%), proving conviction shifted during the final week. Structure at 64.6 versus URA's 63.3 is nearly identical, but cleanliness at 58.3 for URNM versus undefined-lower for URA reflects fewer false breakouts in the setup. Category-relative strength splits 0.0% versus -1.3%, placing URNM at category median while URA lagged, confirming uranium miners themselves are rotating into URNM.
Nuclear energy scored 42.7 with 10% allocation because AI growth sponsorship (+5) barely offsets liquidity stress (-7), creating a neutral macro environment where the technical case for holding becomes meaningful. The category's 48.0 macro fit reflects genuine uncertainty: uranium supply scarcity supports long-term thesis, but near-term disinflation volatility and liquidity stress create drawdown risk. URNM's 49.4 reasoned score—only 3.5 points above NLR's 45.0—indicates a weak category winner that 3/2/1 weighting inflates to category score. The allocation persists at 10% because nuclear power's structural demand from AI compute infrastructure and decarbonization remains intact; disinflation actually improves nuclear economics by compressing discount rates. URNM's thin volume at 0.46x participation is a concern that limits position sizing; this becomes 20% only if volume participation improves to neutral-or-better or if explicit energy-transition stimulus accelerates uranium demand signals.
Industrial Metals — COPX
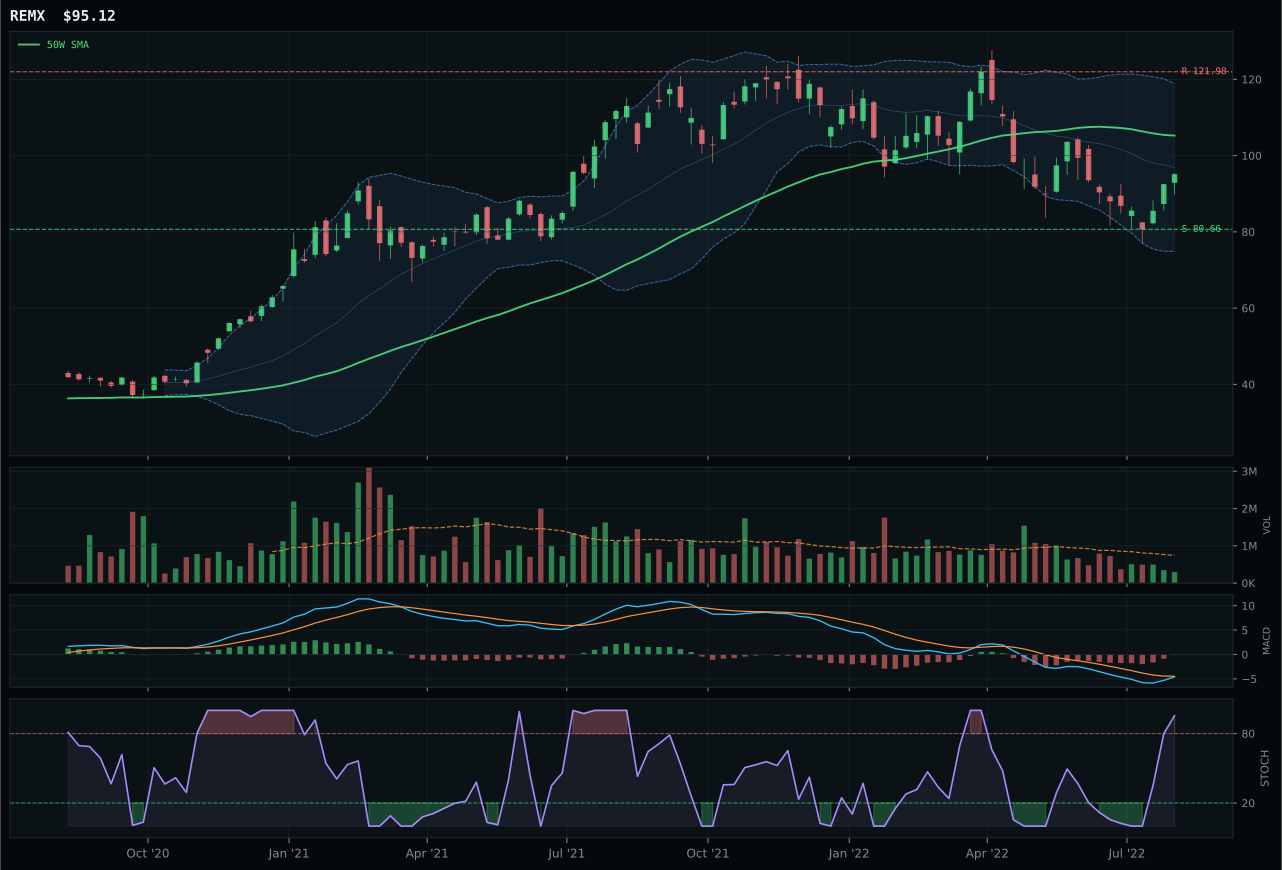
REMX has a neutral structure profile with 3.1% 13-week relative strength versus SPY.
A failed hold above support would weaken the setup.
Actionable but governed by invalidation levels.
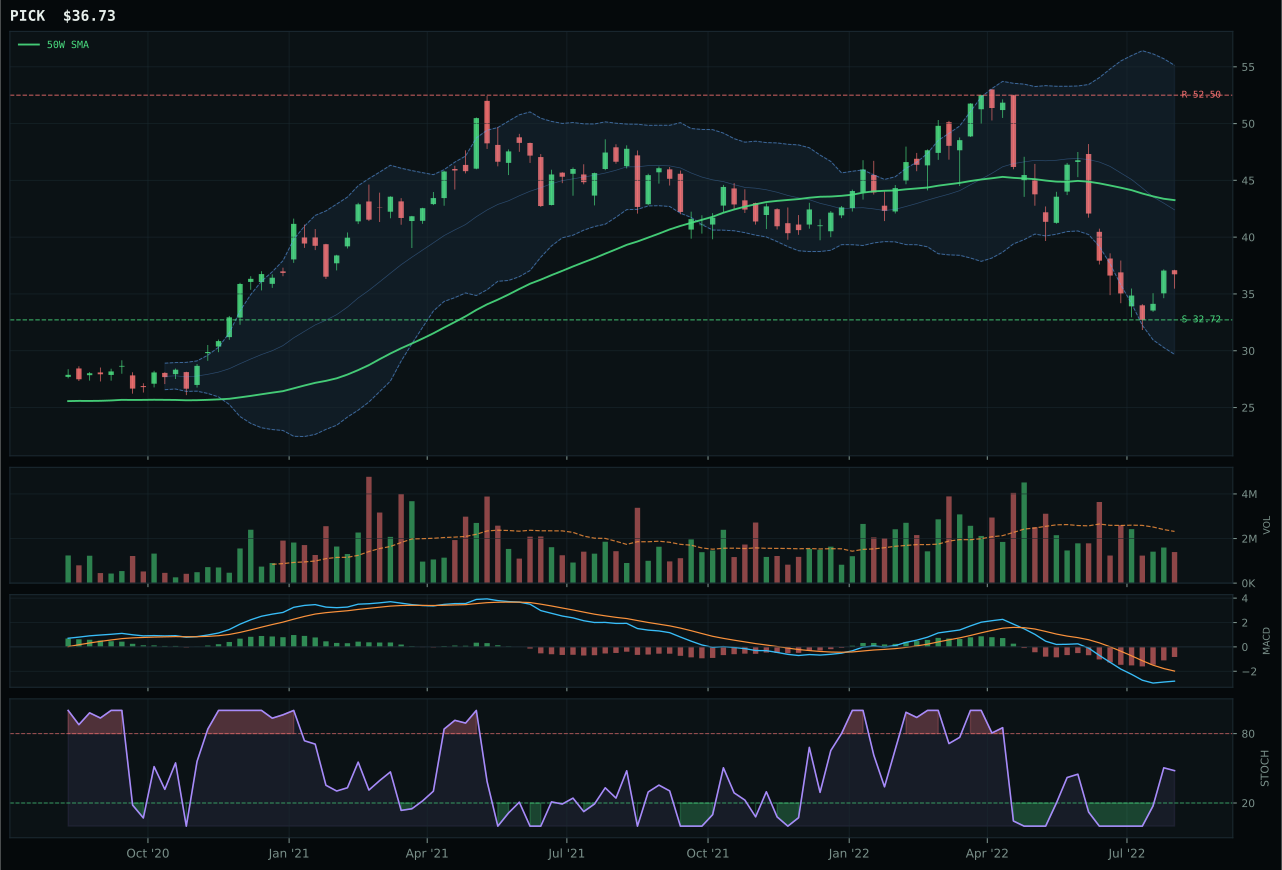
PICK has a neutral structure profile with -16.6% 13-week relative strength versus SPY.
A failed hold above support would weaken the setup.
Actionable but governed by invalidation levels.
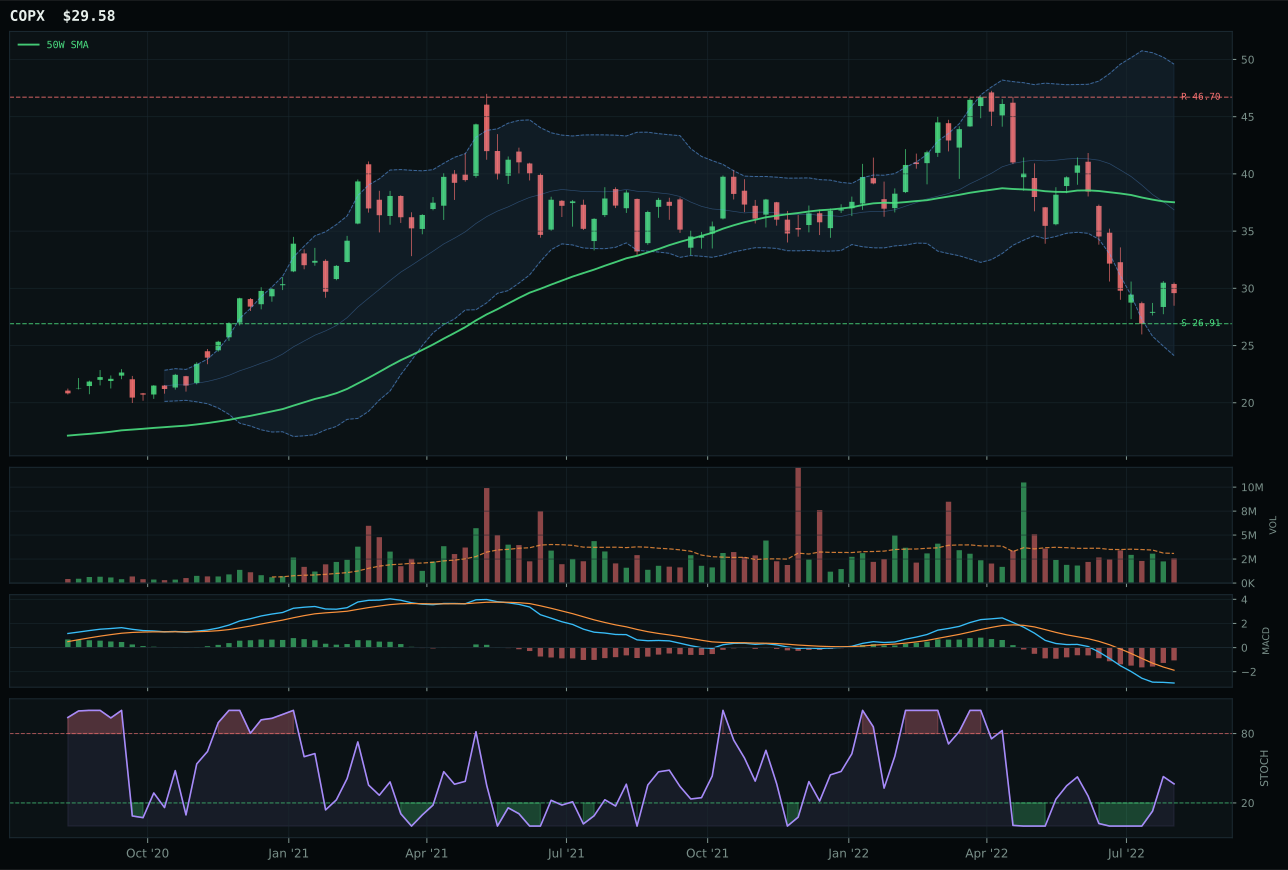
COPX has a neutral structure profile with -22.6% 13-week relative strength versus SPY.
A failed hold above support would weaken the setup.
Actionable but governed by invalidation levels.
COPX won an industrial metals category in full collapse by offering the clearest risk-reward definition in an environment where liquidity stress and dollar strength are actively poisoning copper's narrative. COPX posts -22.1% thirteen-week return with -22.6% SPY-relative weakness—objectively terrible—yet timing at 63.0 and risk-reward at 75.0 beat REMX's 82 timing score because REMX sits overbought at the 0.382 Fibonacci while COPX has compressed near the 52W low at 0.786 Fibonacci. The stochastic divergence is instructive: COPX's mid-zone 0.36 reading suggests early recovery whereas REMX's 1.00 overbought puts it near cycle exhaustion despite positive momentum. Volume confirmation separates them decisively—COPX's neutral 0.83x participation beats REMX's thin 0.55x, and in repair zones, volume sponsorship at capitulation lows outweighs momentum scores. REMX's 19.7% category-relative strength creates a false comfort; it is beating a broken peer set, not leading anything.
Industrial metals scored 17.2, meriting only 10% allocation, because the macro environment is explicitly hostile to cyclical base metals in disinflation. The category-level macro fit sits at just 35.0, with liquidity stress active at -8 and dollar pressure at -7, creating a -15 headwind that swamps any technical recovery narrative. REMX's 59.7 reasoned score and COPX's 17.6 drop to a 3/2/1 weighted 45.2 before decay to 17.2, meaning technical evidence contributes only 9.8 for the representative. The allocation persists because commodity valuations at cyclical lows occasionally precede macro reversals, and COPX's 9.9% upside to resistance paired with only 36.7% downside extension provides defined risk-reward for mean-reversion traders. This is a 10% position that becomes zero if liquidity stress intensifies or dollar strength continues; it advances to 20% only on explicit Fed pivot signals or Chinese stimulus confirmation. Until then, it is portfolio optionality, not core conviction.
Emerging Markets — INDA
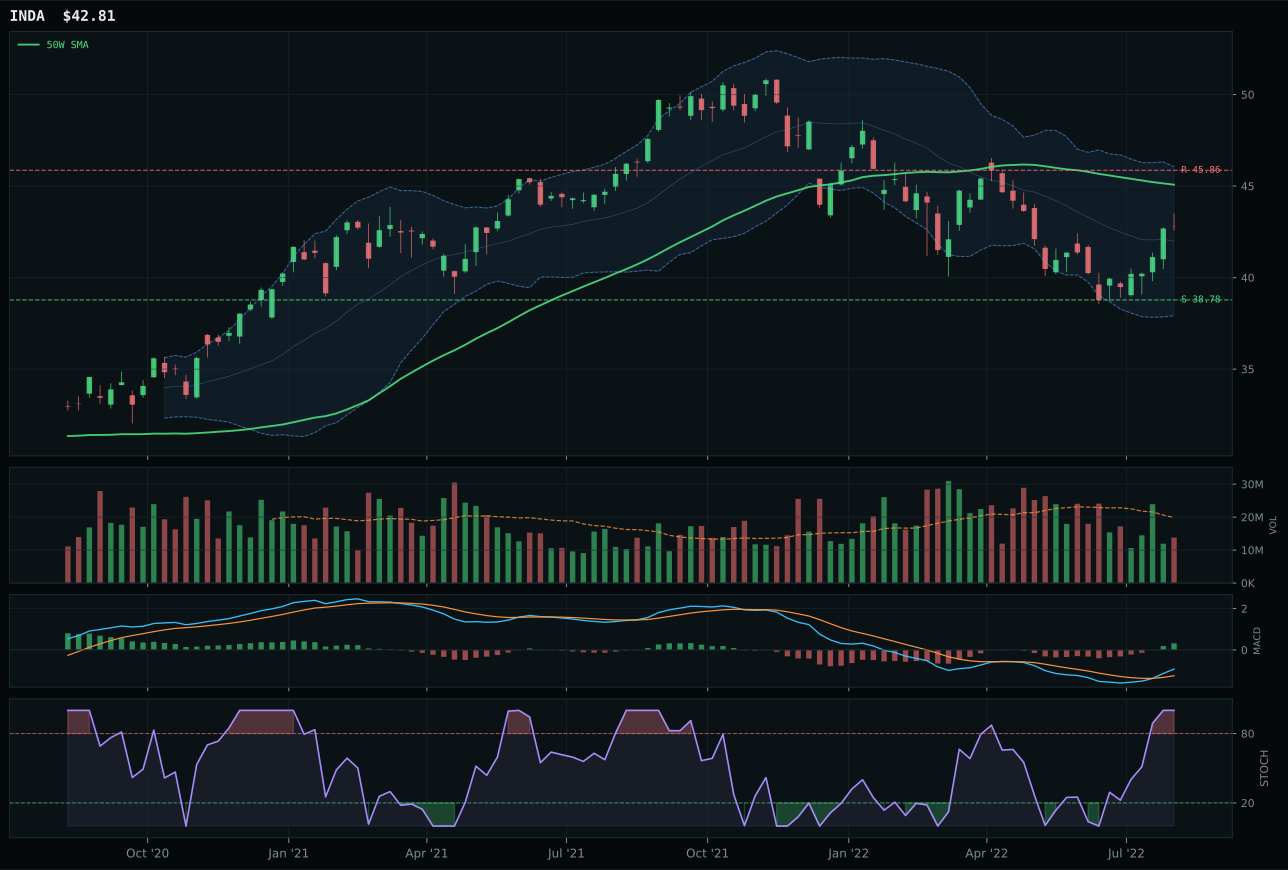
INDA has a neutral structure profile with 1.2% 13-week relative strength versus SPY.
A failed hold above support would weaken the setup.
Actionable but governed by invalidation levels.
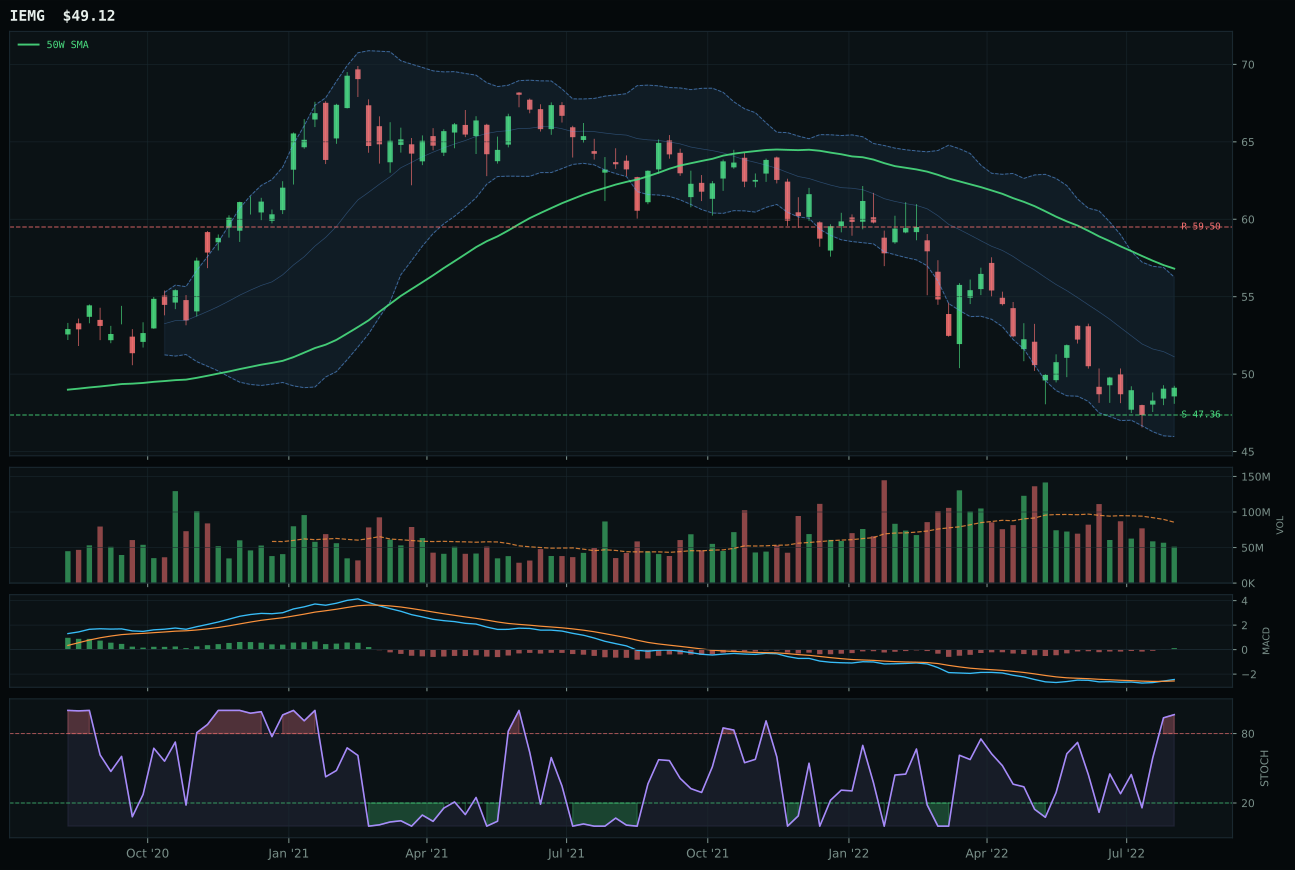
IEMG has a pullback into support profile with -3.4% 13-week relative strength versus SPY.
A failed hold above support would weaken the setup.
Actionable but governed by invalidation levels.
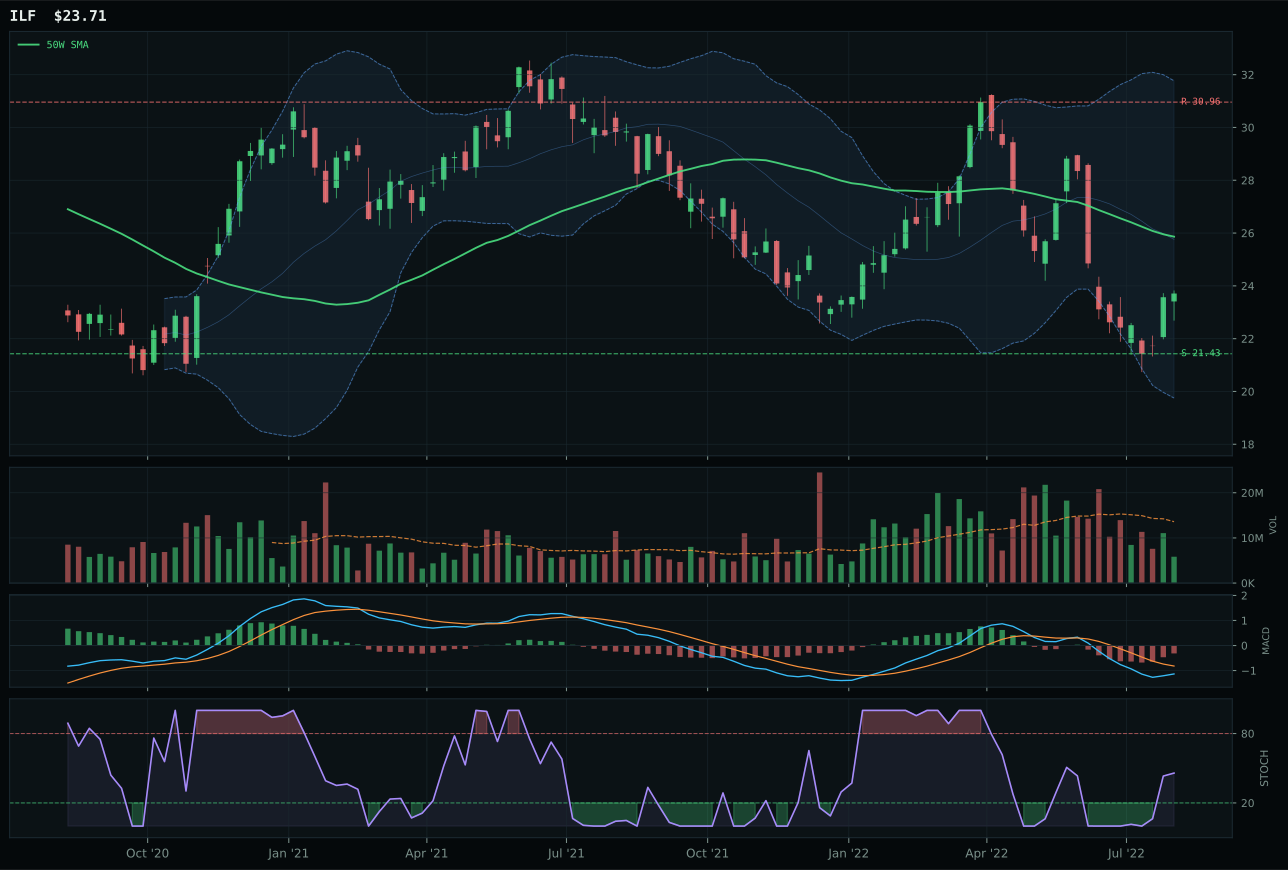
ILF has a neutral structure profile with -6.9% 13-week relative strength versus SPY.
Extension and support failure are the main tactical risks.
Tracked, but not top-2 eligible because: structurally broken.
INDA captured emerging markets with decisive margin over IEMG, posting 82.0 timing versus IEMG's 65.0 and 77.9 structure cleanliness versus IEMG's 74.8, while maintaining crucial category-relative strength of 4.6% against IEMG's 0.0%. The technical superiority reflects a pullback setup into value (deep Fib 0.618 retracement at 43.27) with MACD bullish-and-improving and stochastic overbought, positioning INDA at decision-point rather than IEMG's pullback-into-support (near 52W low). INDA's 1.7% thirteen-week return modestly beats IEMG's -2.9%, but the risk-reward split is more revealing: INDA's 64.5 risk-reward versus IEMG's 90.0 appears to favor IEMG until context surfaces—INDA has -6.7% upside and 10.4% downside, whereas IEMG has wide 90.0 risk-reward from its broken 52W low setup, making IEMG's apparent advantage actually a penalty for overshooting capitulation. Timing clarity and structure superiority trump margin-of-safety in category selection.
Emerging markets scored 11.1 with 10% allocation despite containing a viable India opportunity because the macro regime is explicitly hostile to EM as asset class. The category's 17.0 macro fit is devastated by dollar pressure (-14), liquidity stress (-10), and broad market bear (-9), creating a -33 headwind that no technical outperformance can overcome. INDA's 53.9 reasoned score and IEMG's 49.0 create a 3/2/1 weighted basket of 46.7 that collapses to 11.1 after persistence and breadth testing. The allocation survives at 10% because INDA's India-specific growth narrative—AI infrastructure, digital payments, manufacturing relocation—provides partial hedge against EM currency and broad emerging-market weakness. INDA's 1.2% SPY-relative strength and 77.9 structure cleanliness justify holding rather than eliminating EM entirely; this becomes 20% only on sustained dollar weakness, explicit Fed pivot, or China stimulus that restores EM confidence. Until those macro shifts, it remains a small core position for long-term growth optionality.
Traditional Energy — XOP
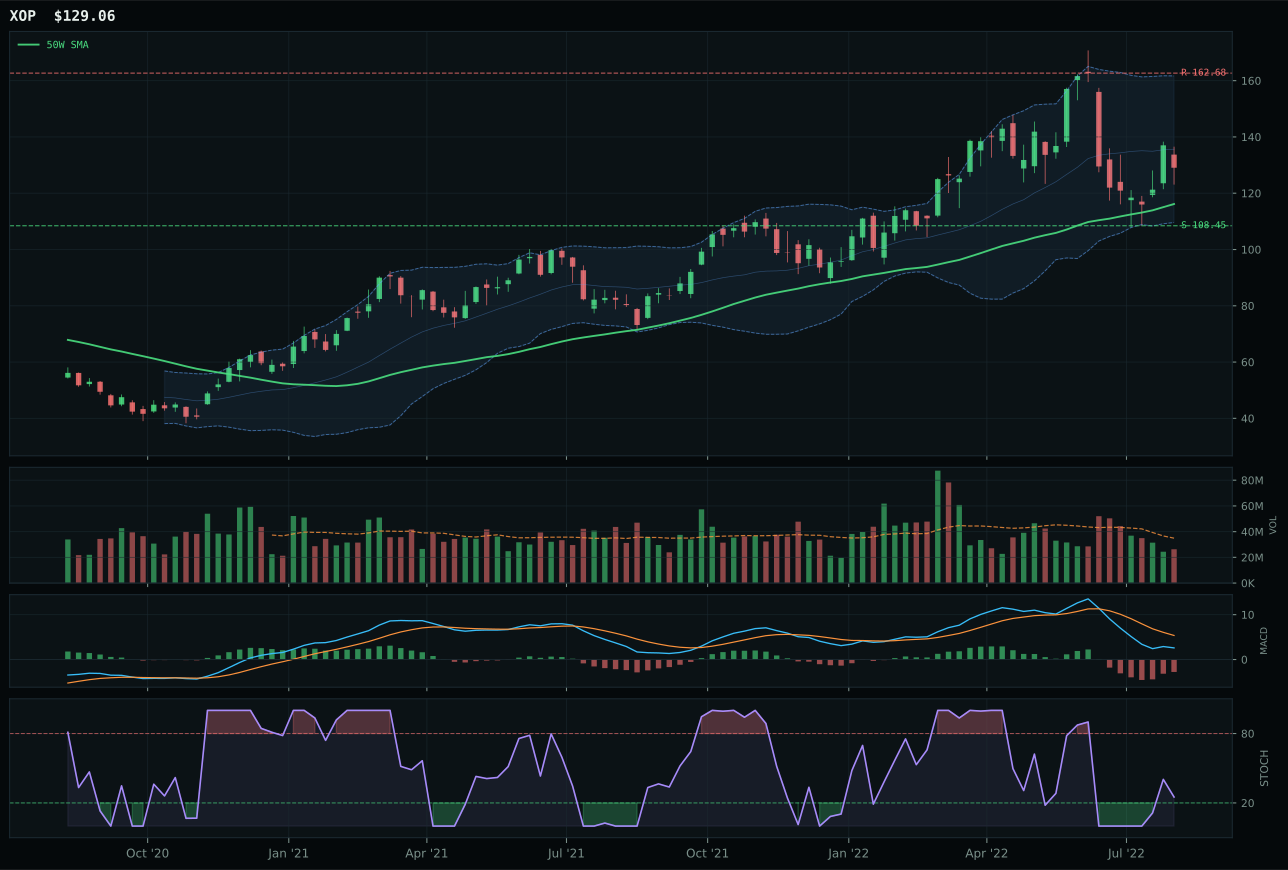
XOP has a neutral structure profile with -9.6% 13-week relative strength versus SPY.
A failed hold above support would weaken the setup.
Actionable but governed by invalidation levels.
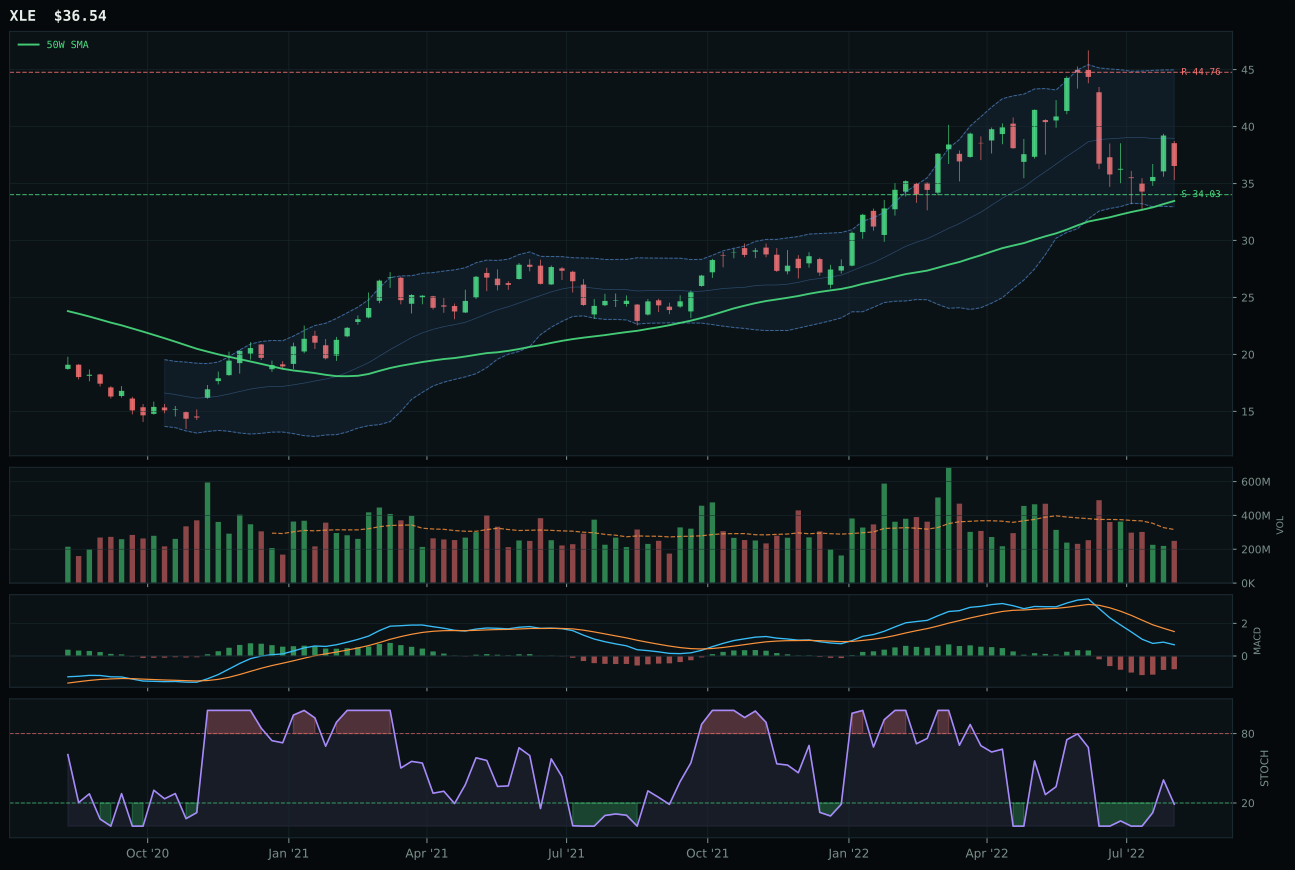
XLE has a neutral structure profile with -12.4% 13-week relative strength versus SPY.
A failed hold above support would weaken the setup.
Actionable but governed by invalidation levels.
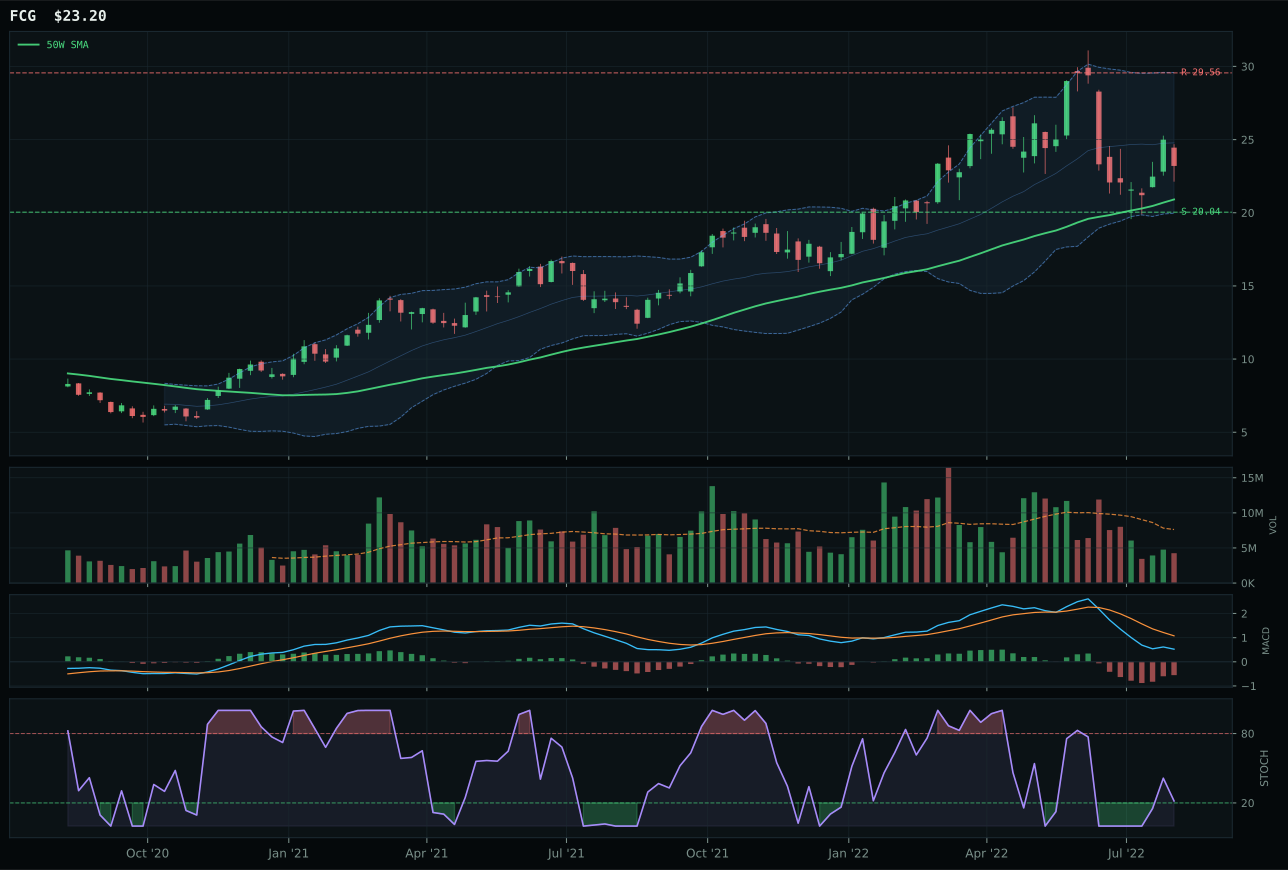
FCG has a neutral structure profile with -11.7% 13-week relative strength versus SPY.
A failed hold above support would weaken the setup.
Actionable but governed by invalidation levels.
XOP edged XLE in a category both are losing, winning on category-relative strength of 2.1% versus -0.7% and stochastic RSI timing at mid-zone 0.25 versus XLE's oversold turnaround at the absolute floor. XOP's neutral structure places it 11.1% above the 50W—a position of relative strength compared to XLE's compression at 50W—offering cleaner technical definition despite identical MACD bullish-and-improving setups. The timing advantage of 90.0 versus XLE's 96.0 appears inverted until examining what the numbers mean: XOP sits in middle retracement ready to decide while XLE is at oversold extremes where any bounce could fail immediately. Volume confirmation favors XOP's 0.75x neutral participation over XLE's neutral—both thin, but XOP's exploration beta appeals to position traders more than integrated cash-flow defense in a regime where oil demand is collapsing. Category-relative strength is the tiebreaker; XOP's 2.1% proof that small-cap energy is still finding buyers where blue-chip integrated names languish.
Traditional Energy earned 0% allocation this week, excluded entirely from the portfolio, because the 10.4 category score ranked in the bottom two categories and the macro regime is actively hostile. Disinflation pressure is -10 basis points, creating a fundamental headwind to energy demand assumptions; liquidity stress at -7 compounds the problem by reducing capital flows to commodities. XOP's 53.0 technical evidence score normally might support a tactical position, but the 41.0 macro fit is disqualifying when the macro regime is dominated by deflationary signals. The category reasoner tested the 45.7 three-name basket and rejected it post-macro-filter, scoring only 10.4, because there is no narrative support for energy allocation in a disinflation cycle. XLE and XOP both printed positive 13-week and 26-week returns, but those are backward-looking; forward-looking, the descriptor matrix shows broad market bear (-) and disinflation pressure (-), both arguing against cyclical commodity allocations. For energy to earn reallocation, the portfolio needs to see either a reversal in the disinflation signal or positive relative strength performance for three consecutive weeks; until then, this category remains excluded in favor of defensive positioning.
Agriculture & Livestock — MOO
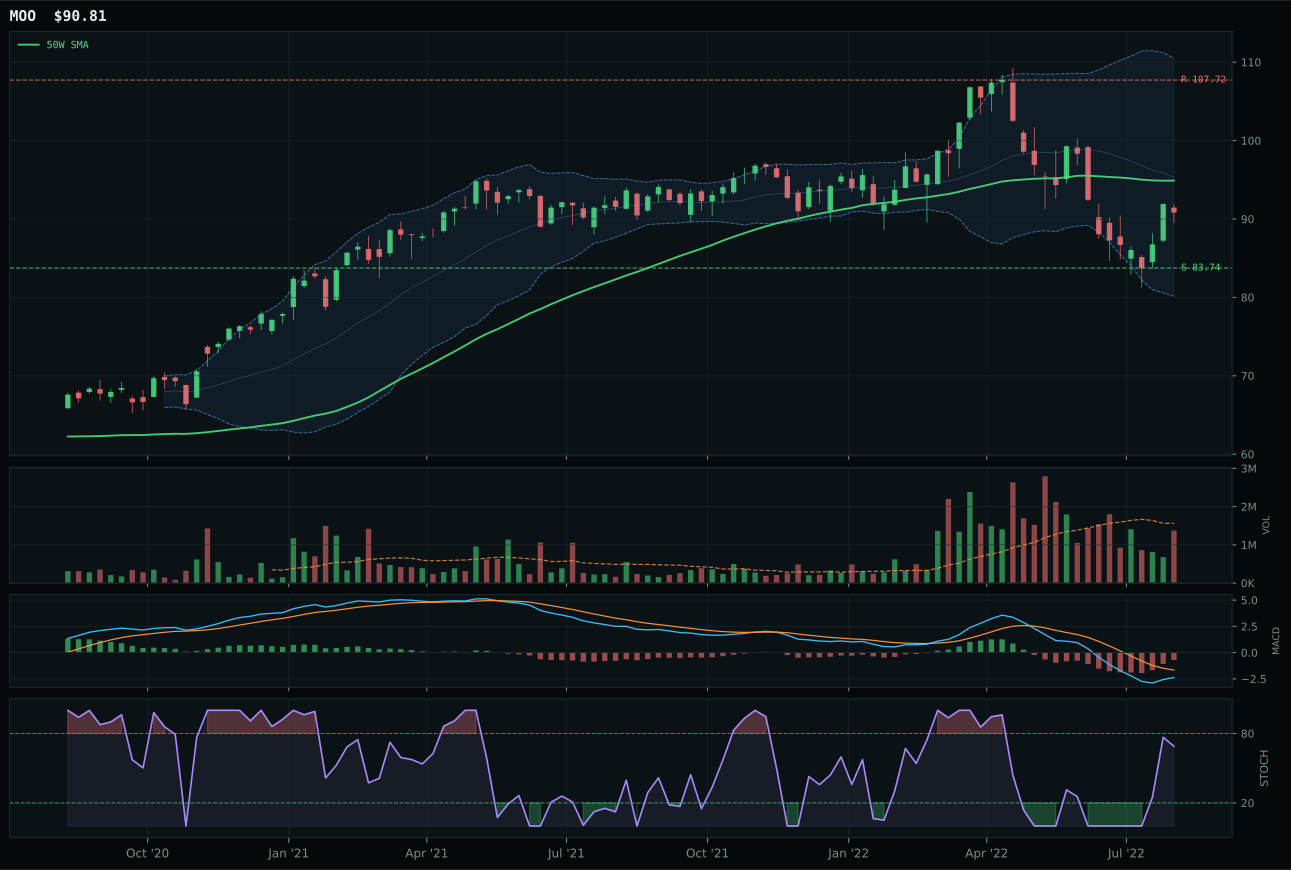
MOO has a neutral structure profile with -6.8% 13-week relative strength versus SPY.
A failed hold above support would weaken the setup.
Actionable but governed by invalidation levels.
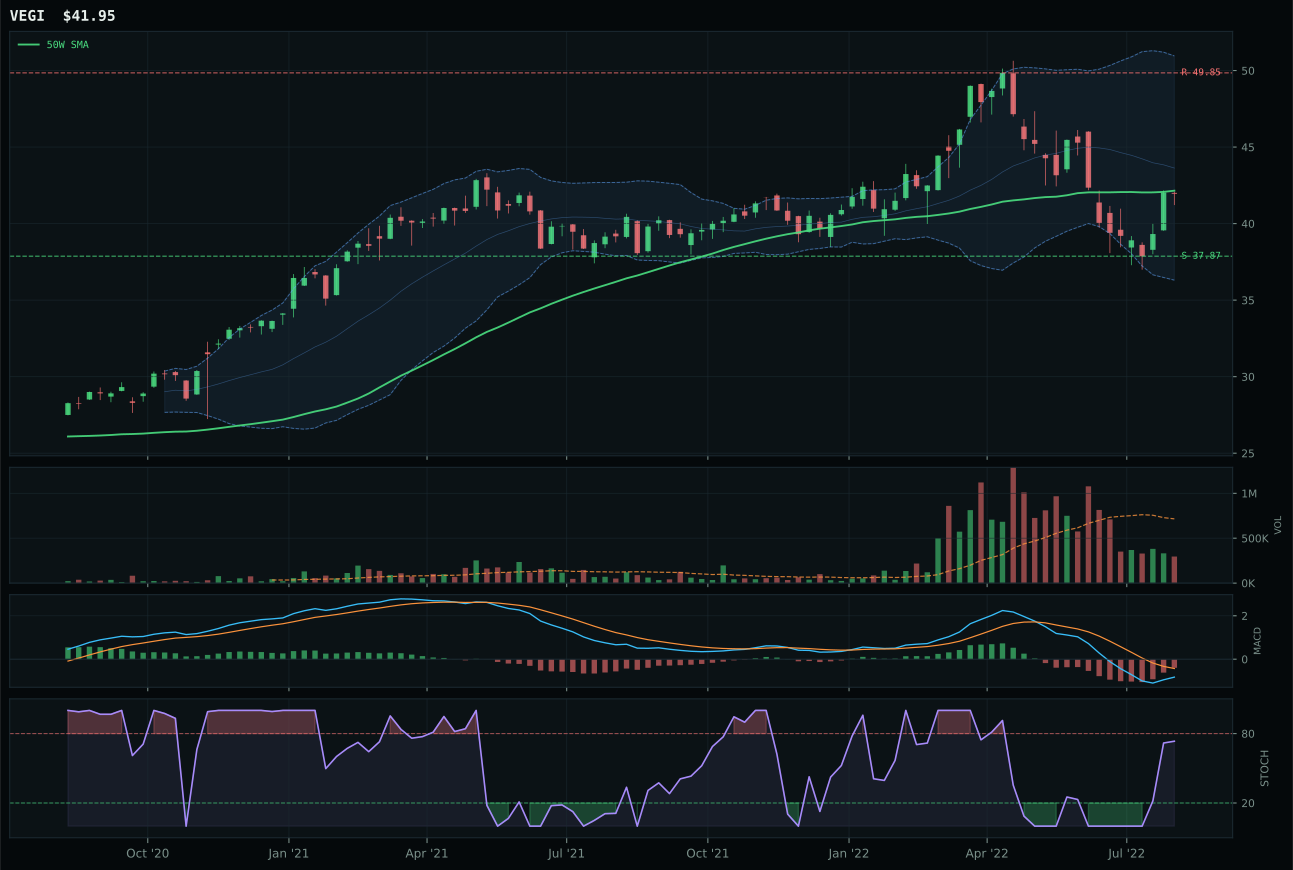
VEGI has a compression near 50W profile with -7.7% 13-week relative strength versus SPY.
A failed hold above support would weaken the setup.
Actionable but governed by invalidation levels.
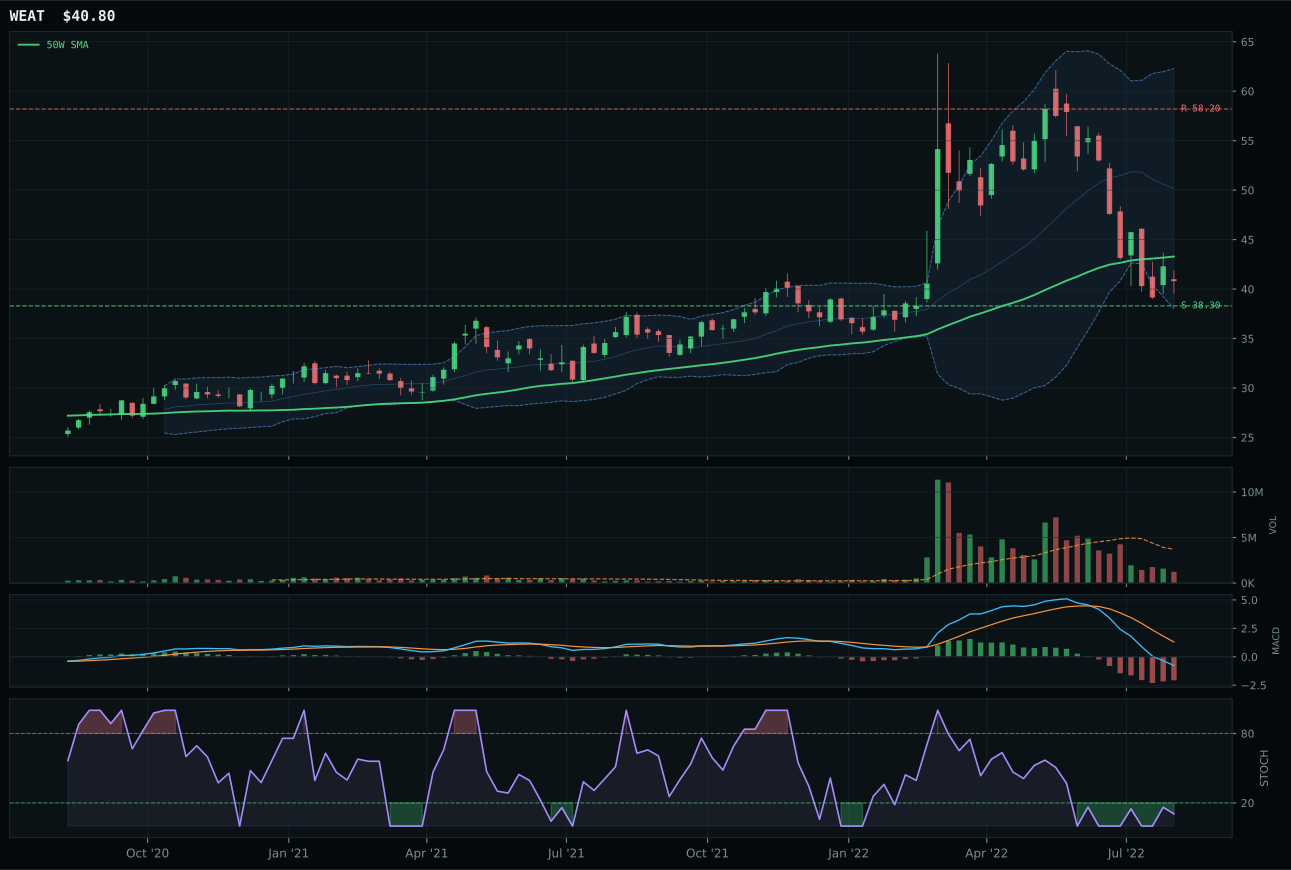
WEAT has a neutral structure profile with -26.3% 13-week relative strength versus SPY.
A failed hold above support would weaken the setup.
Actionable but governed by invalidation levels.
MOO narrowly defeated VEGI despite posting inferior technical composites, winning because timing and risk-reward combined to create a cleaner risk-management setup in a broken category. MOO's perfect 100.0 timing score—achieved through 4.3% proximity to support, MACD bearish-but-improving, stochastic rising at 0.69, and Fibonacci deep retracement—provided clarity that VEGI's compression-near-50W setup could not match. The risk-reward advantage of 86.5 versus 79.5 is the clincher: MOO has 8.4% downside cushion to support and -15.7% upside to resistance, creating defined invalidation; VEGI's -7.7% SPY-relative weakness paired with compression means it offers less margin for error. Both faces -6% thirteen-week returns and macro headwinds from disinflation pressure (-5 points), but MOO's neutral volume at 0.88x participation beats VEGI's thin participation at recognition that deteriorating volumes mark capitulation rather than early accumulation.
Agriculture earned 0% allocation this week, excluding it entirely from the portfolio, because the category score of 10.2 ranked in the bottom quartile across all ten categories. The macro environment is actively hostile: disinflation pressure is -8 basis points, meaning commodity complex weakness is the regime signal, not a temporary dip. MOO's timing score of 100.0 is a false signal here—perfect setup doesn't overcome category-level macro decay when disinflation is the dominant macro state. The 3/2/1 weighted basket started at 45.6 but collapsed to 10.2 after testing against the full macro descriptor scorecard because liquidity stress (-4) and disinflation pressure (-8) create a -12 point combined headwind. For agriculture to earn reallocation, two shifts are required: either the disinflation signal needs to reverse into inflation concern, or the category needs to demonstrate positive relative strength for two consecutive weeks. Until then, the 10% slot is allocated to categories with better macro fit and technical setup quality.