
2022-07-29
Informational purposes only. The content in this report, including allocations, analysis, and commentary, is provided solely for informational and educational purposes. It does not constitute financial advice, investment advice, trading advice, or any other type of advice. Past performance does not guarantee future results. Always conduct your own research and consult a qualified financial professional before making investment decisions.
Weekly Allocation
| Ticker | Category | Weight | Role |
|---|---|---|---|
| PAVE | Utilities & Infrastructure | 20% | Top-2 (20%) |
| XLK | Technology | 20% | Top-2 (20%) |
| XAR | Defense & Aerospace | 10% | Tier-2 (10%) |
| FCG | Traditional Energy | 10% | Tier-2 (10%) |
| URNM | Nuclear Energy | 10% | Tier-2 (10%) |
| GDX | Precious Metals | 10% | Tier-2 (10%) |
| SMH | AI | 10% | Tier-2 (10%) |
| MOO | Agriculture & Livestock | 10% | Tier-2 (10%) |
Trade Instructions — Monday Open
Sell the tranche from 2022-07-01 (completing its 4-week hold). Buy the new tranche. Instructions show net portfolio changes — same-asset positions cancel, weight changes show the delta.
| Action | Ticker | Instruction |
|---|---|---|
| SELL | SGOV | Sell 50% of SGOV position (reduce 10.00% → 5.00%) |
| SELL | GLD | Sell 31% of GLD position (reduce 20.00% → 13.75%) |
| SELL | XLU | Sell 36% of XLU position (reduce 17.50% → 11.25%) |
| SELL | CIBR | Sell 50% of CIBR position (reduce 2.50% → 1.25%) |
| SELL | ITA | Sell 25% of ITA position (reduce 5.00% → 3.75%) |
| SELL | URA | Sell 50% of URA position (reduce 2.50% → 1.25%) |
| SELL | XLE | Sell 25% of XLE position (reduce 5.00% → 3.75%) |
| SELL | BOTZ | Sell 50% of BOTZ position (reduce 2.50% → 1.25%) |
| SELL | VEGI | Sell entire VEGI position (1.25% of portfolio) |
| BUY | XLK | Buy XLK — 20.00% of freed cash (adds 5.00% to portfolio) |
| BUY | SMH | Buy SMH — 10.00% of freed cash (adds 2.50% to portfolio) |
| BUY | URNM | Buy URNM — 10.00% of freed cash (adds 2.50% to portfolio) |
| BUY | PAVE | Buy PAVE — 20.00% of freed cash (adds 5.00% to portfolio) |
| BUY | XAR | Buy XAR — 10.00% of freed cash (adds 2.50% to portfolio) |
| BUY | MOO | Buy MOO — 10.00% of freed cash (adds 2.50% to portfolio) |
| BUY | FCG | Buy FCG — 10.00% of freed cash (adds 2.50% to portfolio) |
| BUY | GDX | Buy GDX — 10.00% of freed cash (adds 2.50% to portfolio) |
Current Portfolio After Trade
Combined holdings across all 4 active tranches. Each tranche is 25% of the portfolio.
| Ticker | % of Portfolio | Weight Bar |
|---|---|---|
| GLD | 13.75% | |
| XLK | 12.50% | |
| XLU | 11.25% | |
| PAVE | 10.00% | |
| SMH | 7.50% | |
| URNM | 7.50% | |
| SGOV | 5.00% | |
| XAR | 5.00% | |
| MOO | 5.00% | |
| ITA | 3.75% | |
| XLE | 3.75% | |
| IEMG | 2.50% | |
| REMX | 2.50% | |
| FCG | 2.50% | |
| GDX | 2.50% | |
| CIBR | 1.25% | |
| URA | 1.25% | |
| BOTZ | 1.25% | |
| INDA | 1.25% |
Macro Regime — Transition / Mixed
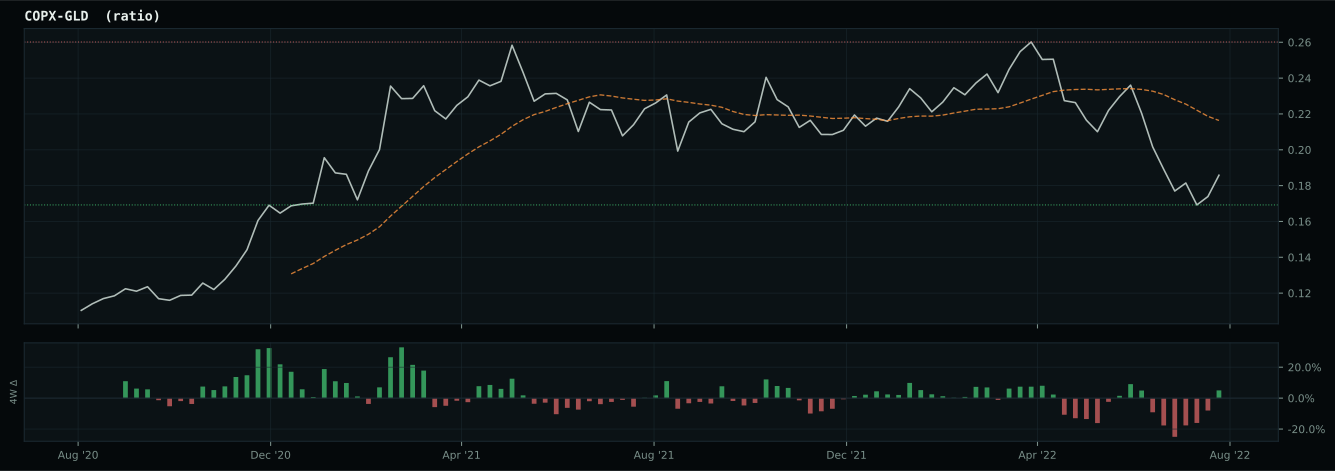
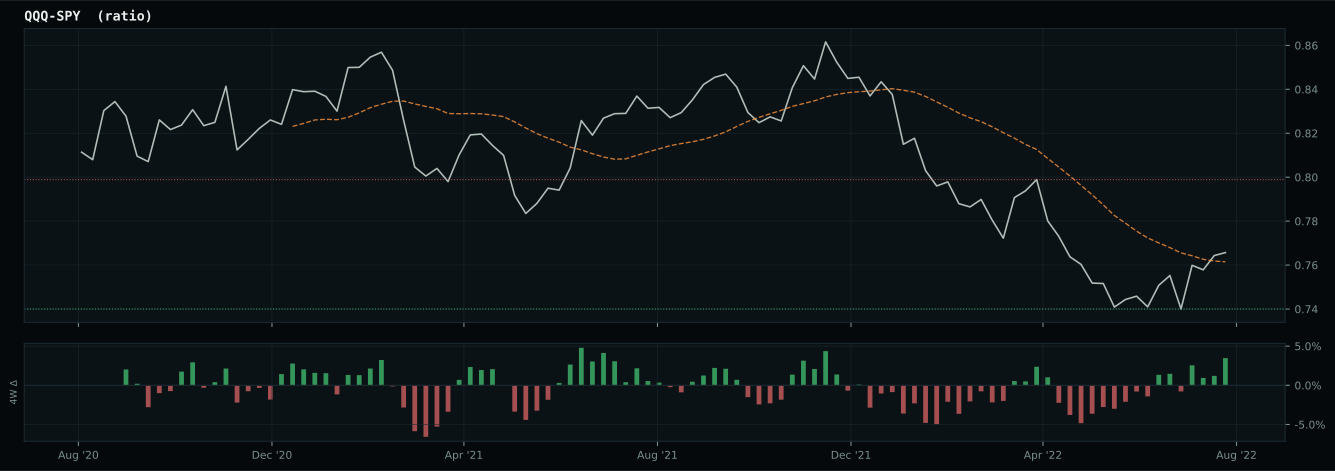
Macro Evidence Charts
Market-implied signals behind the macro regime scores. Each ratio compares two assets; the direction and slope of the ratio is what the macro engine reads.
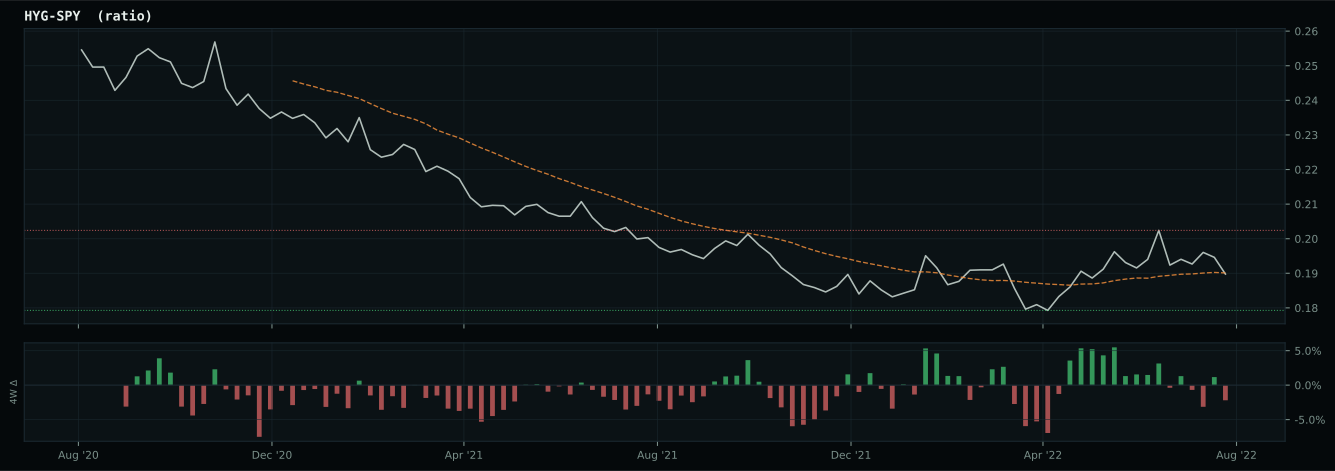
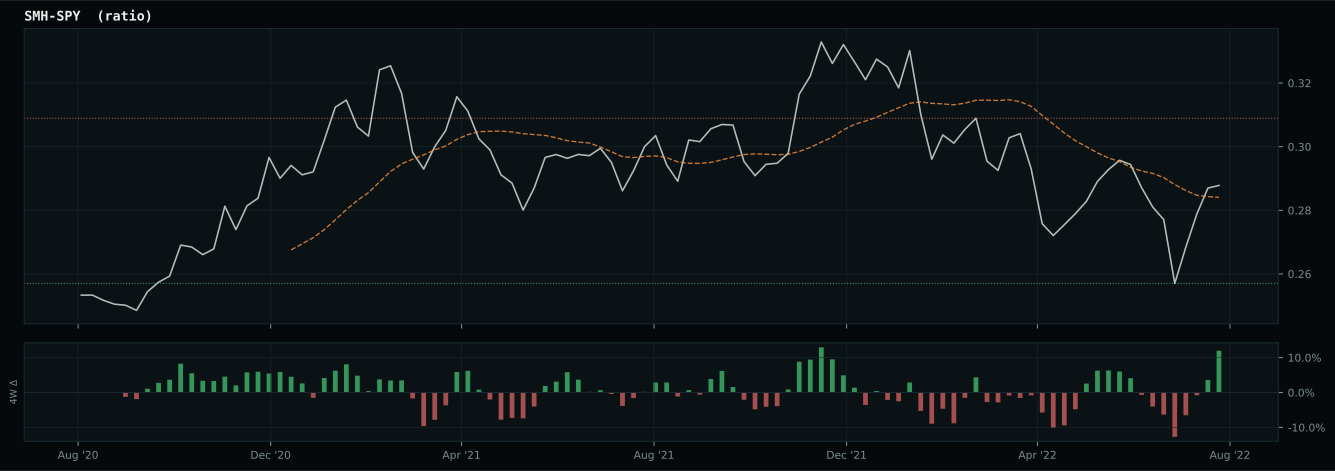
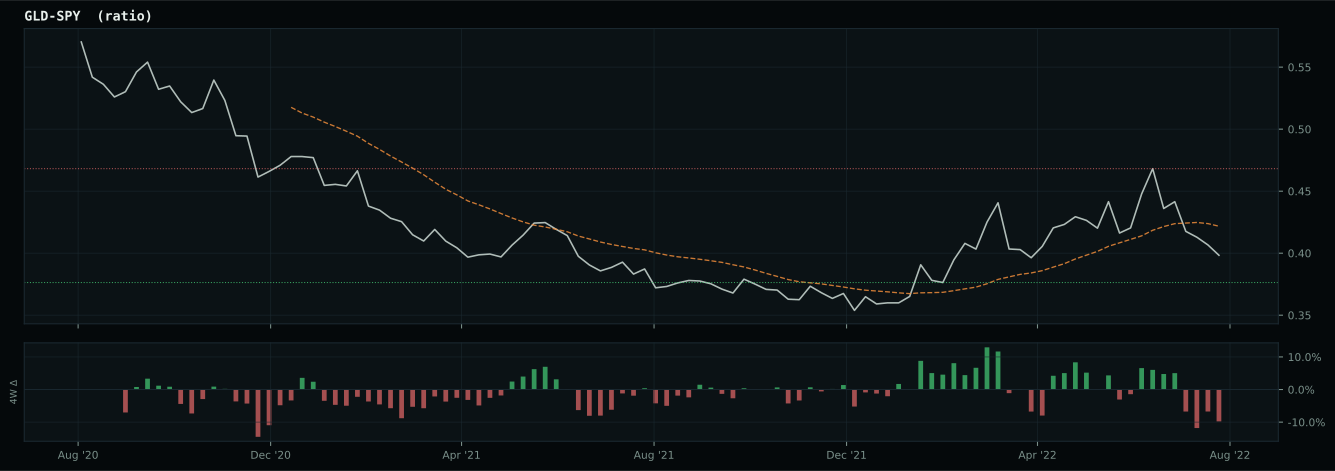
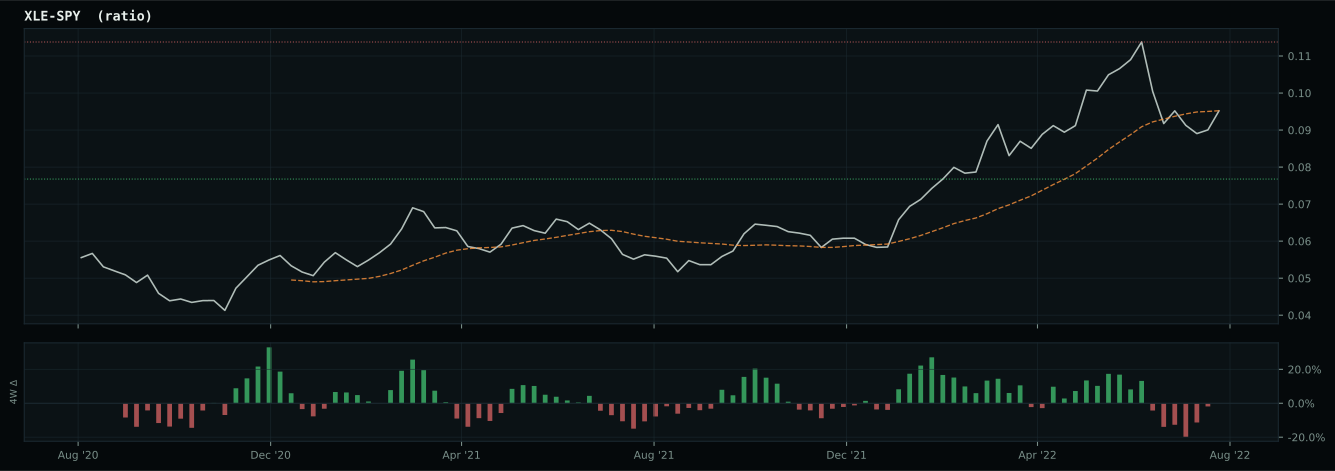
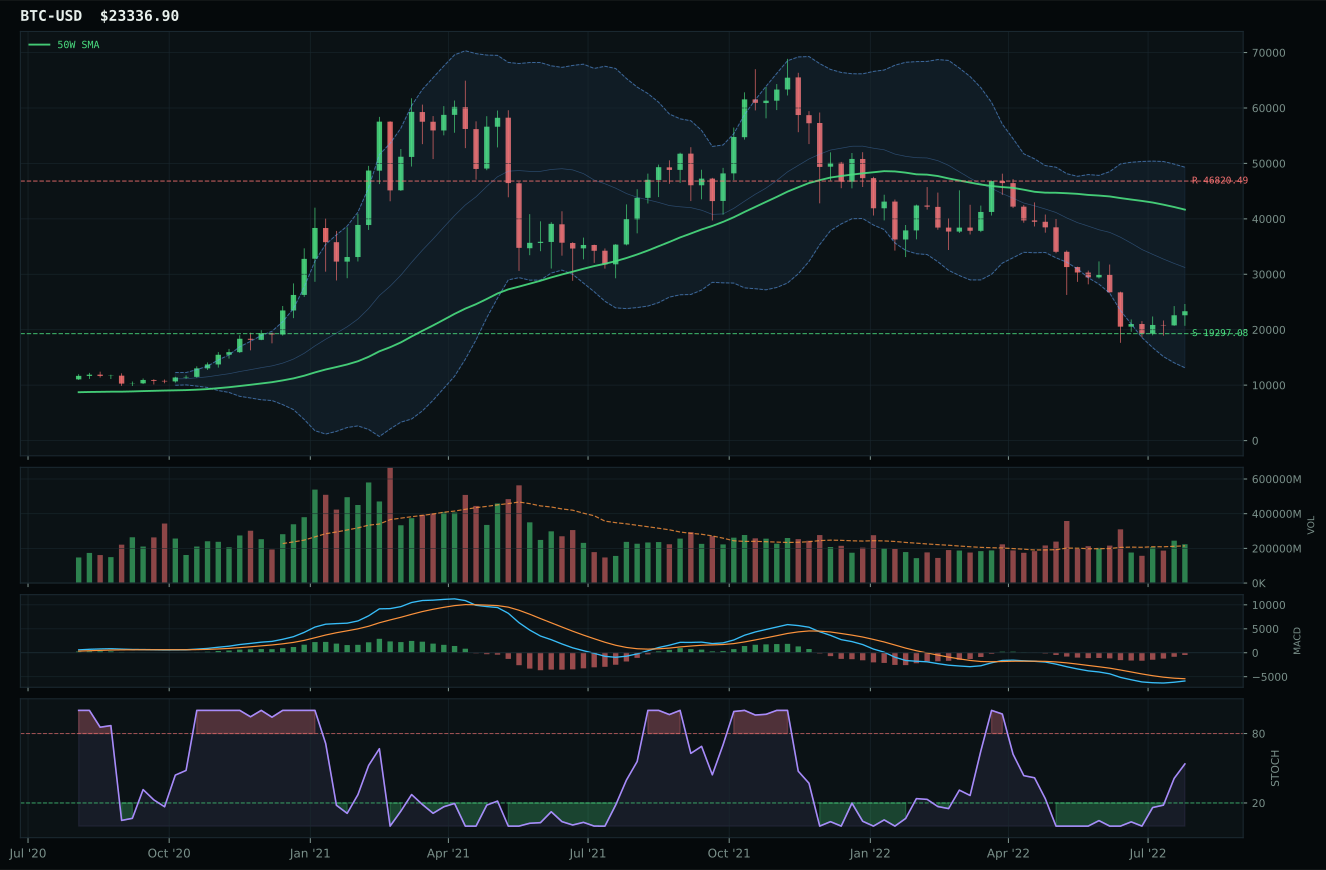
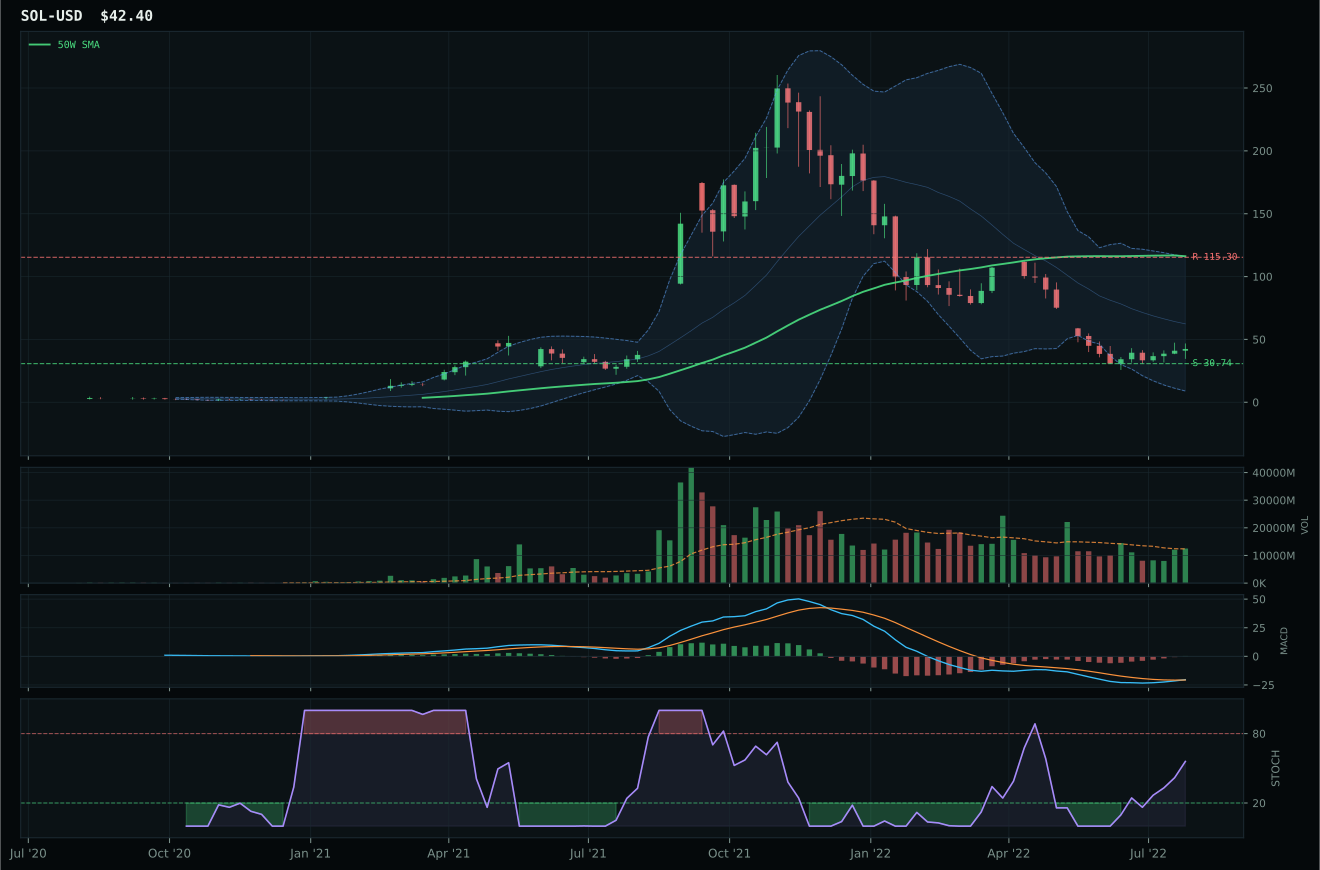
Crypto Regime — NoCrypto
ValueBTC armed by first 200W buy-zone touch, but post-touch range age is 6 weeks; minimum is 12
TrendBTC not confirmed
one or more available conditions failed
Category Rankings
| Rank | Category | Winner | Score | Alloc | 4W Ret | Peers (4W) |
|---|---|---|---|---|---|---|
| 1 | Utilities & Infrastructure | PAVE | 65.7 | 20% | +0.38% | XLU +2.2% · IGF +0.3% |
| 2 | Technology | XLK | 46.7 | 20% | -3.18% | IGV -2.6% · CIBR +3.2% |
| 3 | Defense & Aerospace | XAR | 45.8 | 10% | -1.98% | ITA -0.2% · ROKT -1.2% |
| 4 | Traditional Energy | FCG | 45.4 | 10% | +10.47% | XOP +10.6% · XLE +7.4% |
| 5 | Nuclear Energy | URNM | 41.1 | 10% | +3.22% | URA +1.0% · NLR +1.3% |
| 6 | Precious Metals | GDX | 38.3 | 10% | -6.06% | SLV -7.9% · GLD -1.9% |
| 7 | AI | SMH | 31.7 | 10% | -6.00% | BOTZ -7.3% · AIQ -2.6% |
| 8 | Agriculture & Livestock | MOO | 25.6 | 10% | +1.96% | VEGI +6.7% · WEAT +1.2% |
| 9 | Industrial Metals | REMX | 16.9 | 0% | +5.21% | PICK +2.7% · COPX +3.0% |
| 10 | Emerging Markets | INDA | 10.3 | 0% | -0.28% | IEMG +0.9% · ILF +8.7% |
Utilities & Infrastructure — PAVE
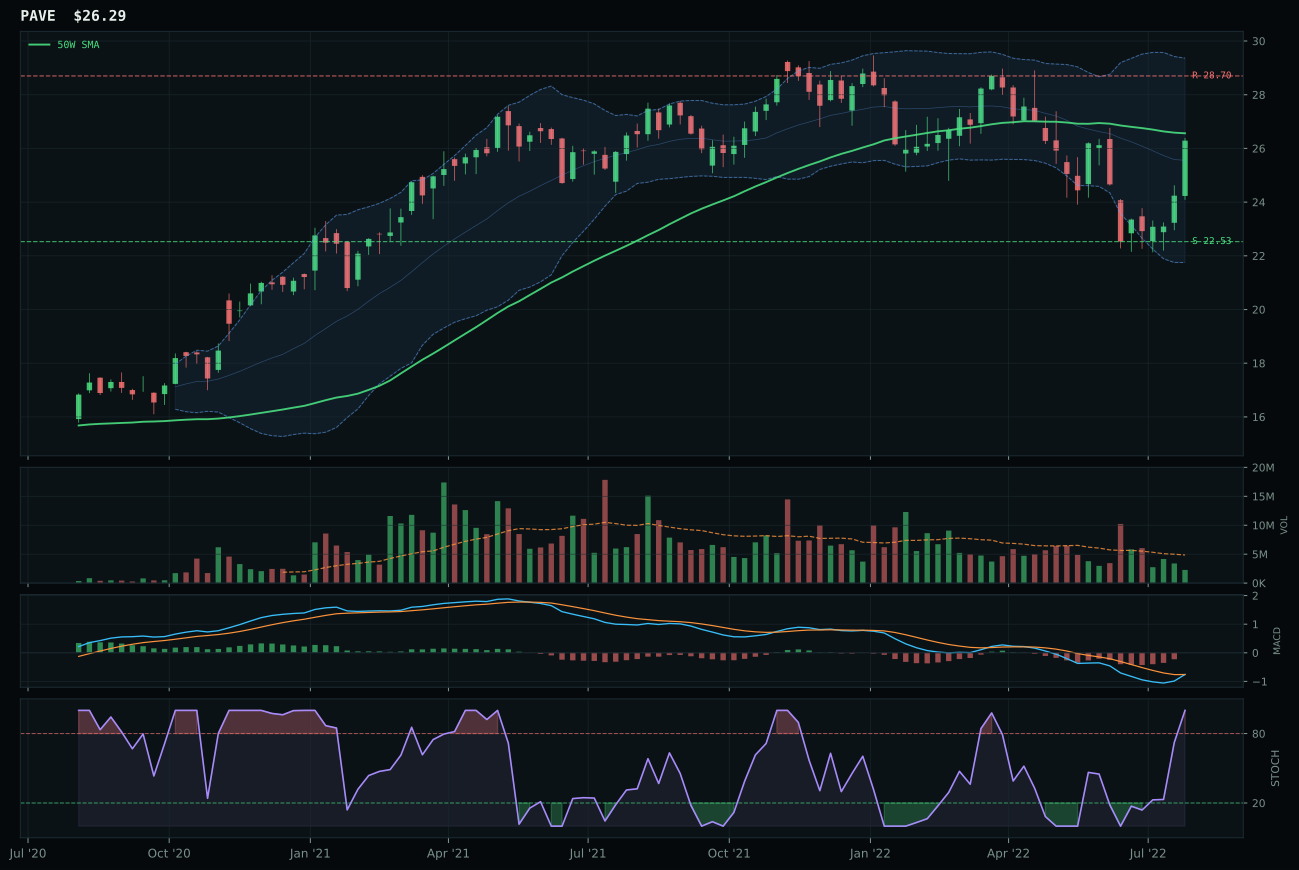
PAVE has a compression near 50W profile with 0.0% 13-week relative strength versus SPY.
A failed hold above support would weaken the setup.
Actionable but governed by invalidation levels.
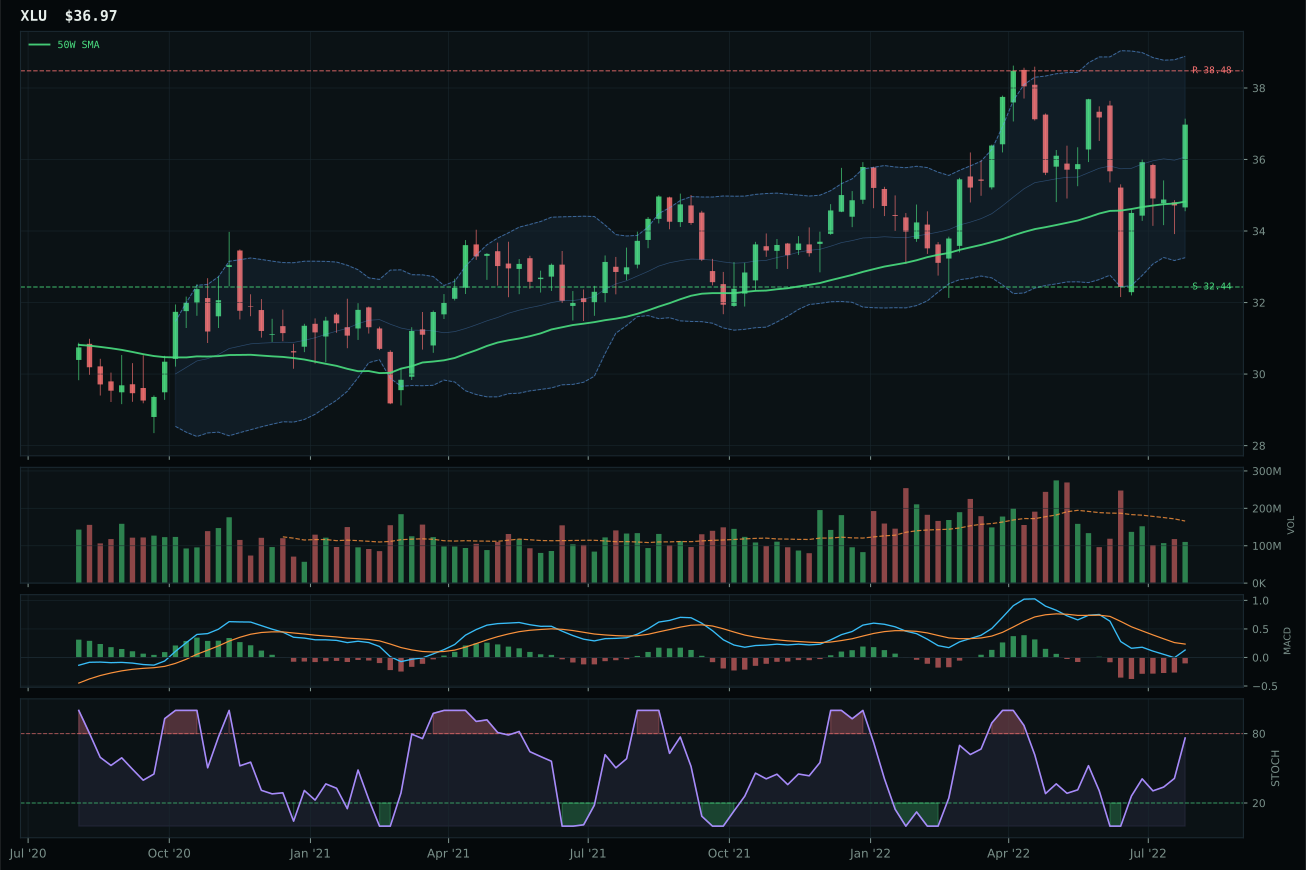
XLU has a neutral structure profile with 3.8% 13-week relative strength versus SPY.
A failed hold above support would weaken the setup.
Actionable but governed by invalidation levels.
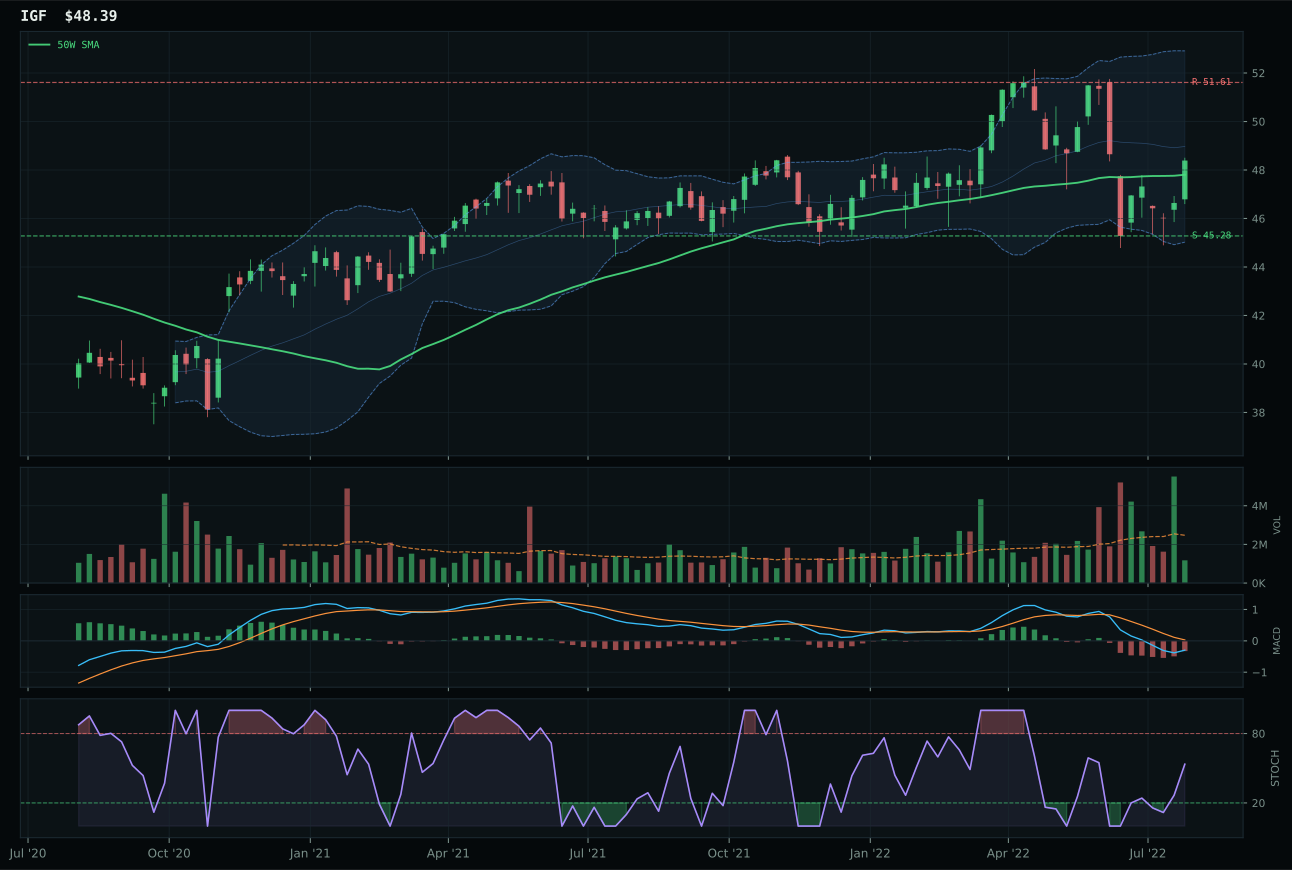
IGF has a compression near 50W profile with -0.9% 13-week relative strength versus SPY.
A failed hold above support would weaken the setup.
Actionable but governed by invalidation levels.
PAVE earned the second 20% allocation despite ranking third in the category macro proof order because its 100.0 timing score—the highest in the entire portfolio—created technical supremacy that overcame macro fit disadvantages and lower overall ETF technical evidence of 66.0. Price sits -1.0% from the 50W compressing into a defined zone between 22.53 support and 28.70 resistance, with MACD bullish and improving and stochastic rising from overbought, creating the textbook accumulation setup where buyers are defending weakness without committing fully. XLU's 83.0 timing versus PAVE's 100.0 marks a critical difference: XLU is extended 6.2% above the 50W with bearish MACD and rising mid-zone stochastic, meaning any pullback is a loss for new entrants, while PAVE is positioned for both accumulation and expansion. The 0.0% category-relative strength means PAVE is neither leading nor lagging its basket—it is neutral relative merit making the chart mechanics the tiebreaker.
Utilities & Infrastructure earned 20% as one of the two highest-ranking categories on a 65.7 score because its 67.0 macro fit reflected defensive rotation (+12), broad market bear (+4), and Transition / Mixed regime benefits (+4), creating category-level macro sponsorship that Technical and Precious Metals could not access. The 62% technical evidence weighting combined with 38% macro fit produced a decision point where PAVE's perfect timing score allowed it to overcome XLU's superior technical baseline and macro-specific defensive rotation advantage, demonstrating that in crisis regimes, execution timing matters more than pure trend confirmation. Utilities infrastructure serves dual roles in this allocation: defensive rotation hedge during bear markets and capex beneficiary during transition periods, making PAVE the clean two-way bet on this dual outcome. With 100.0 timing and compression setup, this category carries confidence that further drawdowns are limited and mean-reversion pressure is building.
Technology — XLK
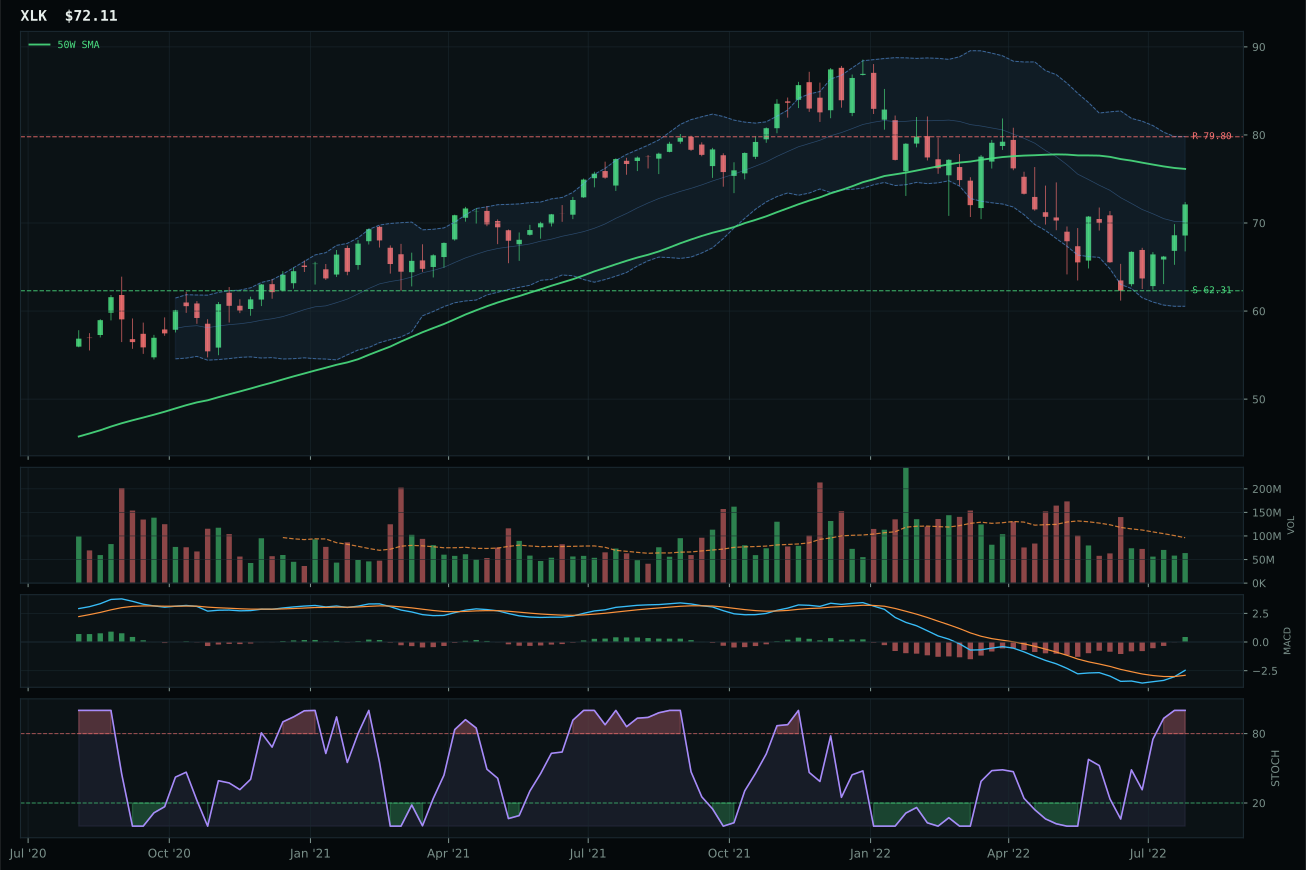
XLK has a neutral structure profile with 2.0% 13-week relative strength versus SPY.
A failed hold above support would weaken the setup.
Actionable but governed by invalidation levels.
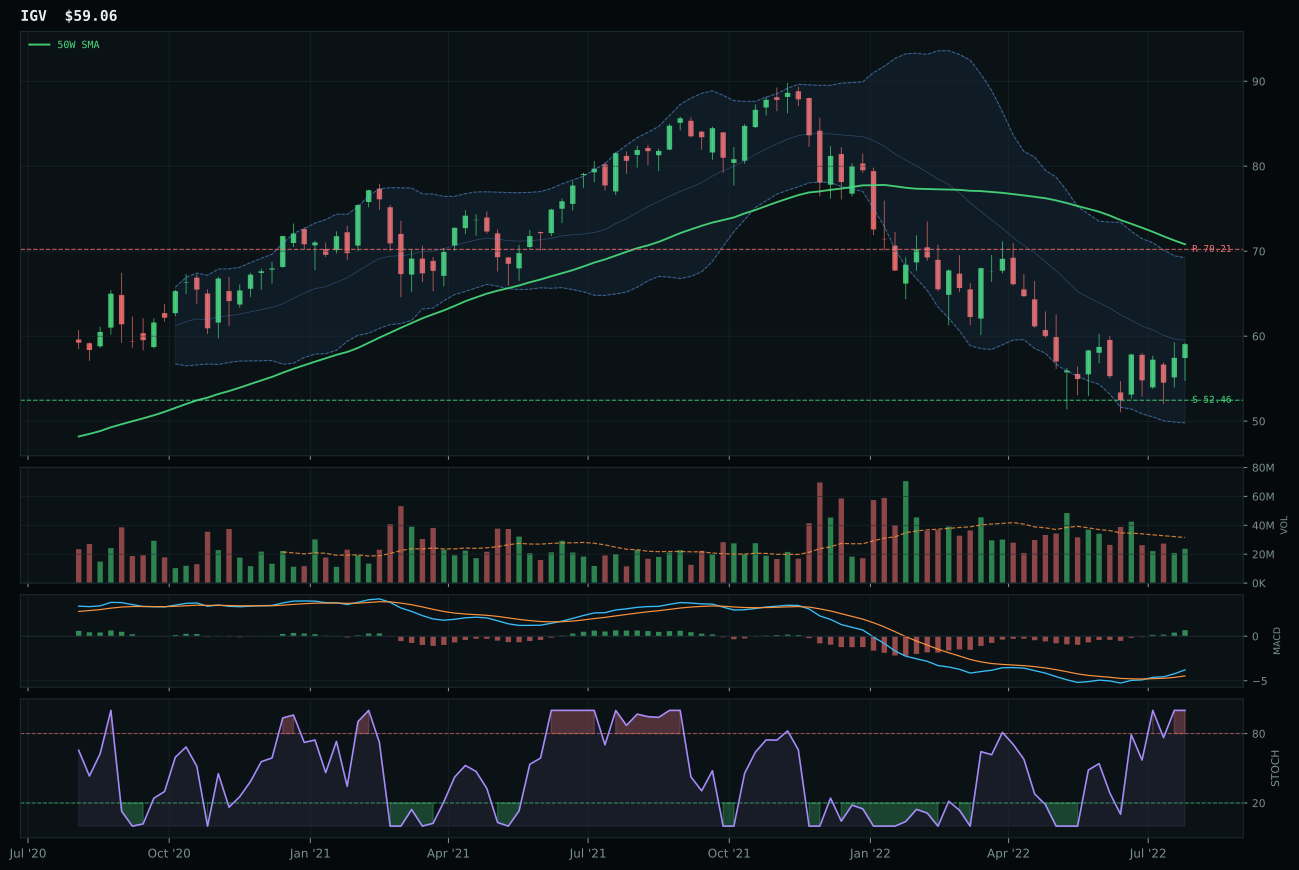
IGV has a neutral structure profile with -1.5% 13-week relative strength versus SPY.
A failed hold above support would weaken the setup.
Actionable but governed by invalidation levels.
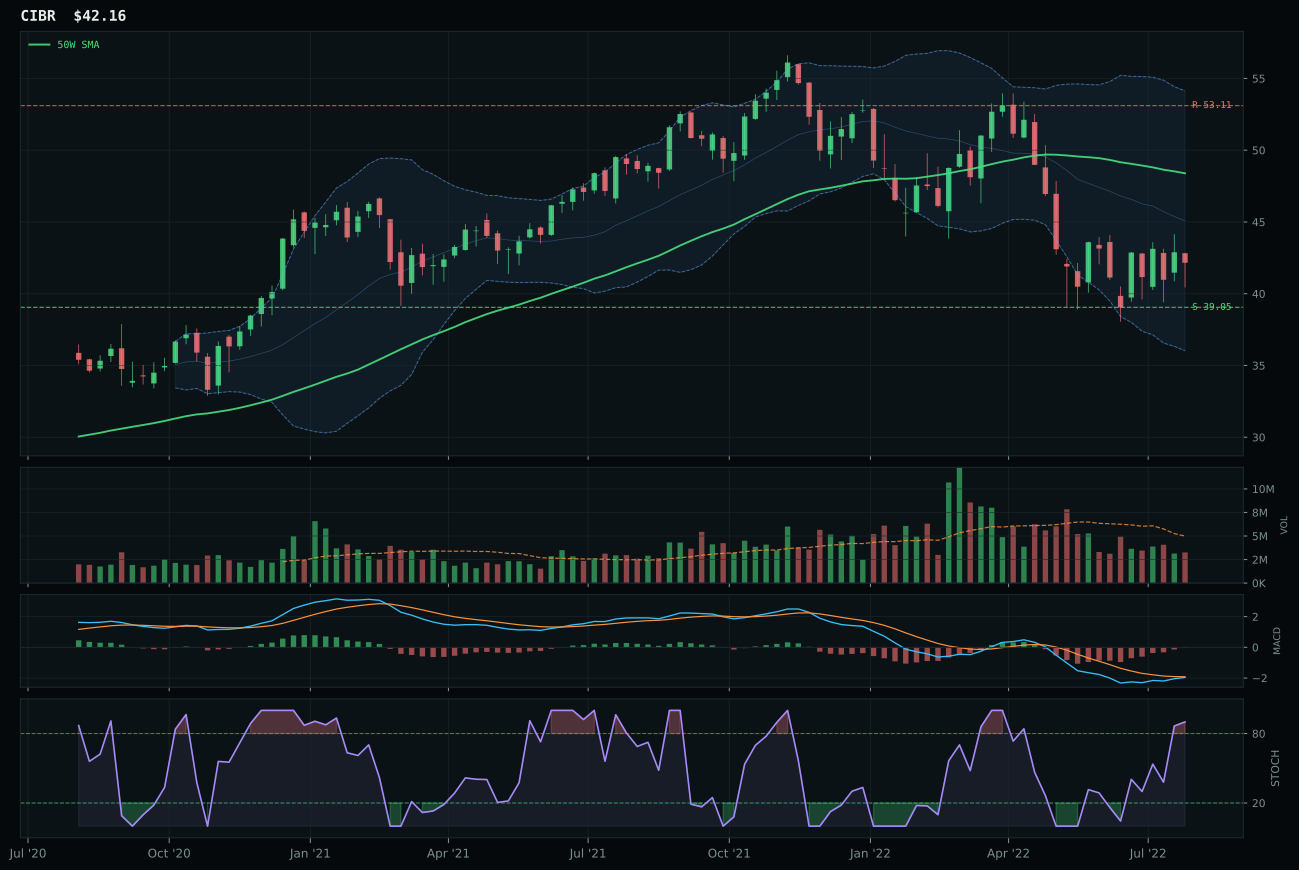
CIBR has a neutral structure profile with -10.2% 13-week relative strength versus SPY.
A failed hold above support would weaken the setup.
Actionable but governed by invalidation levels.
XLK secured the category because it combined neutral structure with positive category-relative strength of 3.5% versus SPY's 2.0%, creating a differentiated technical setup where every metric confirmed modest sponsorship rather than mere bounce. IGV lagged with 0.0% category-relative strength and a 27-point timing disadvantage, reflecting weaker overbought confirmation and duration sensitivity to the liquidity stress regime. Price sitting -5.3% below the 50W but above the 200W keeps risk asymmetry intact; new capital faces 15.7% downside to support against 9.6% upside to resistance, so the profile rewards patience over capitulation chasing. MACD bullish and improving with stochastic at 1.00 suggests oversold momentum is reversing, not extending, making this a setup for accumulation rather than breakout enthusiasm.
Technology earned 20% as one of the two highest-ranking categories because its 46.7 score reflected clean technical sponsorship across the basket despite macro headwinds that pulled category-fit to just 41.0. The Transition / Mixed regime activated both AI growth sponsorship (+6) and liquidity stress (-10), creating tension that only resolved through XLK's superior relative strength inside the three-ETF proof order. Broad profitable tech leadership—the XLK expression—outweighed the duration drag affecting software exposure during dollar pressure, making this the cleaner of the two tech plays. With 62% weight on technical evidence versus 38% on macro narrative, the category proved that chart-based leadership can overcome macro skepticism when breadth and relative strength align inside the peer basket.
Defense & Aerospace — XAR
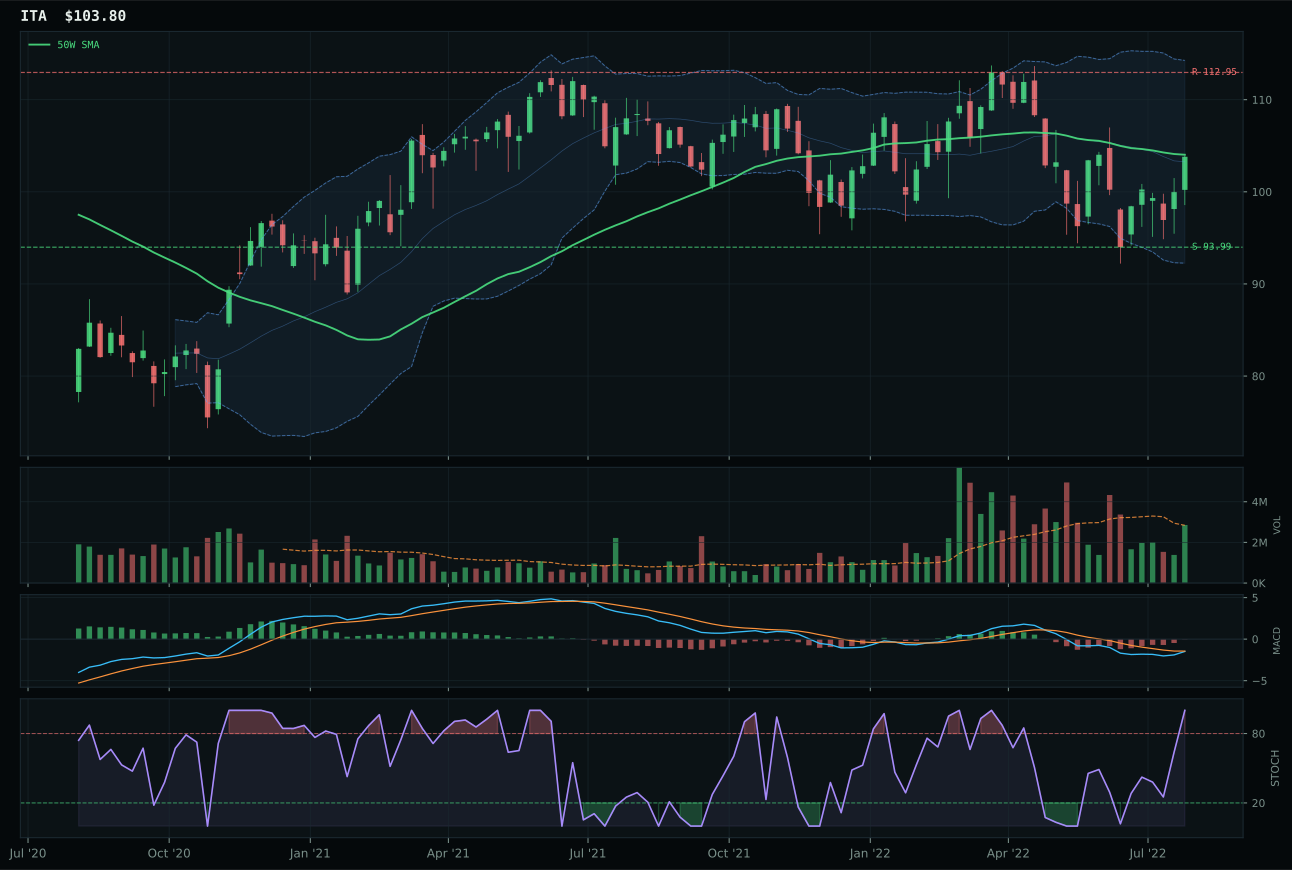
ITA has a compression near 50W profile with 0.9% 13-week relative strength versus SPY.
A failed hold above support would weaken the setup.
Actionable but governed by invalidation levels.
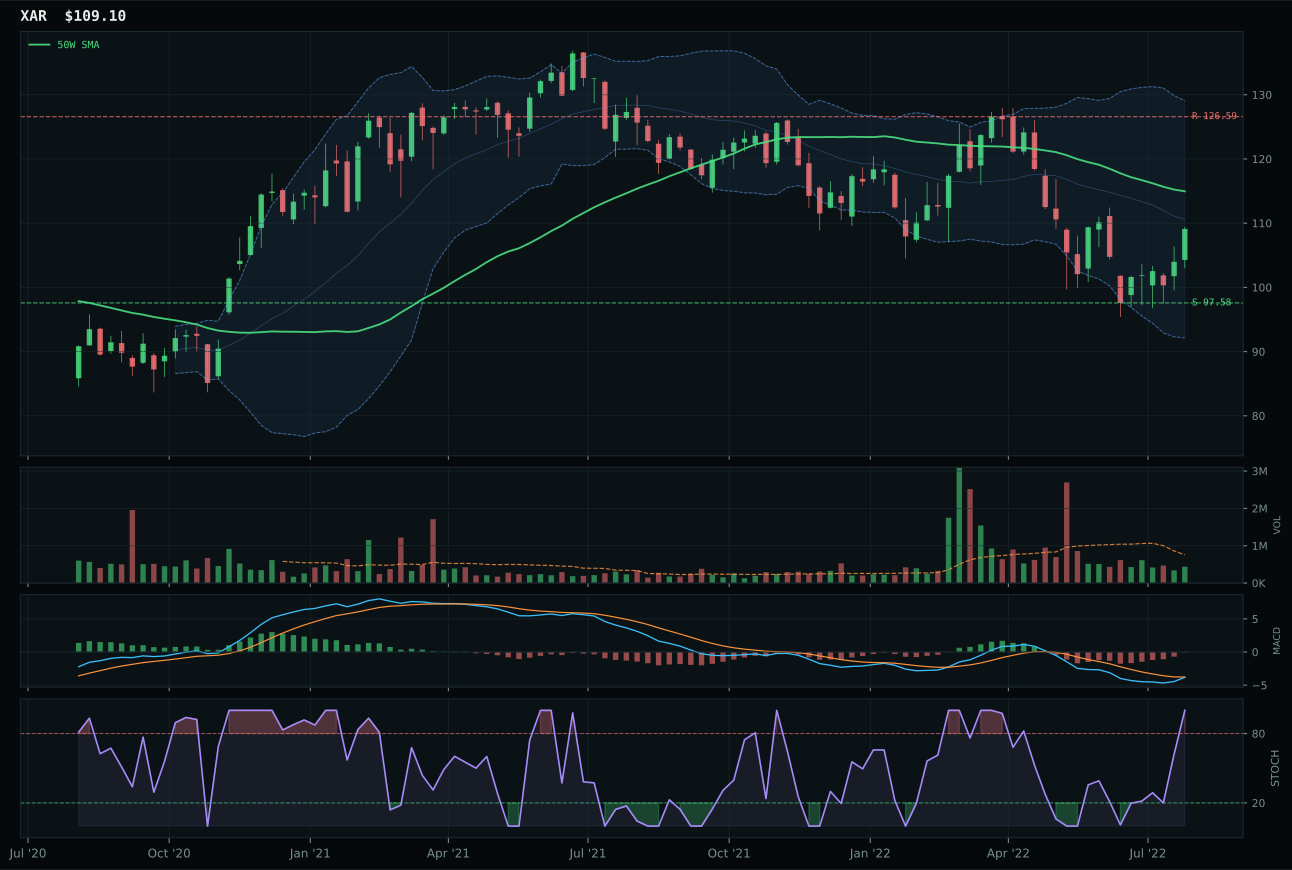
XAR has a neutral structure profile with -3.0% 13-week relative strength versus SPY.
A failed hold above support would weaken the setup.
Actionable but governed by invalidation levels.
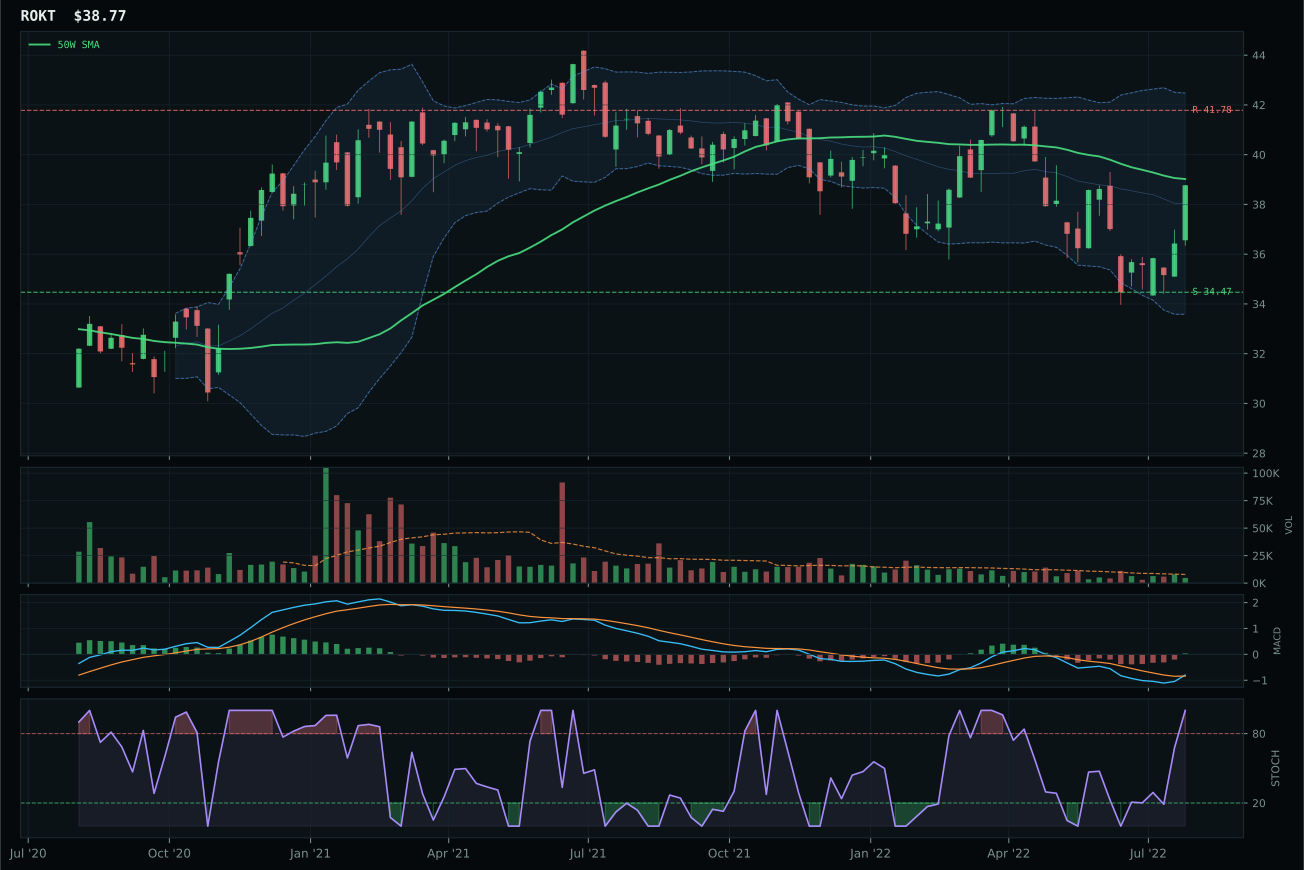
ROKT has a compression near 50W profile with 2.2% 13-week relative strength versus SPY.
A failed hold above support would weaken the setup.
Tracked, but not top-2 eligible because: .
XAR won despite trailing runner-up ITA in raw technical evidence because timing and risk-reward setup proved decisive in this regime where support levels matter more than trend confirmation. Price at -5.1% from the 50W but still above the 200W, combined with a timing score of 82.0 driven by MACD bearish-but-improving and stochastic overbought, created a defined invalidation zone at 97.58 support that ITA's 67.0 risk-reward score could not match. ITA sits in compression near the 50W with higher macro fit from defensive rotation (+7) and broad market bear (+6), but that strength created complacency; XAR's 74.1 risk-reward score reflects a setup where downside to support is only 11.8% against 13.8% upside to resistance, making it the sharper two-way bet. Category-relative strength of -3.9% versus ITA's flat 0.0% means XAR is losing less badly relative to peers, which is precisely what you want in a defensive sector that is underperforming.
Defense & Aerospace earned 10% despite a higher category macro fit of 66.0, reflecting that technical evidence compressed to just 24.2% for XAR and the broad basket showed persistence weakness. The allocation acknowledges defensive rotation and broad market bear as active tailwinds (+8 and +6), but those macro drivers were already reflected in ITA's 62.3 technical score—and ITA lost on chart timing anyway. XAR represents the lower-confidence entry point to this sector: the technical case is weaker, volume confirmation is poor at 30.3%, and persistence is fragile at 44.8%, yet it won the category selection based on cleaner support mechanics. Holding 10% in a defensive sector during Transition / Mixed regimes makes sense structurally, but investors should expect this allocation to migrate upward only if price actually holds at support and confirms MACD reversal with volume.
Traditional Energy — FCG
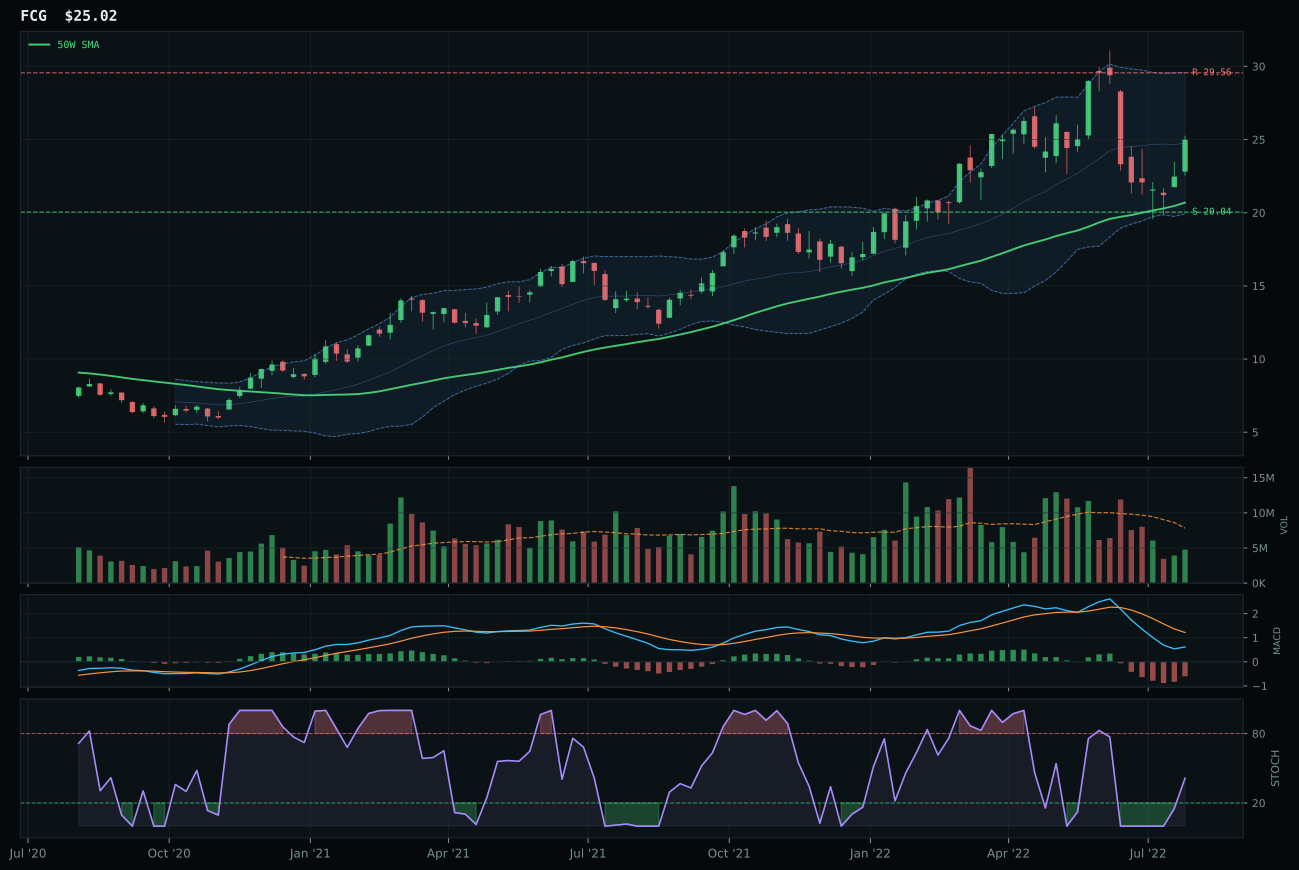
FCG has a vertical extension profile with 3.5% 13-week relative strength versus SPY.
A failed hold above support would weaken the setup.
Actionable but governed by invalidation levels.
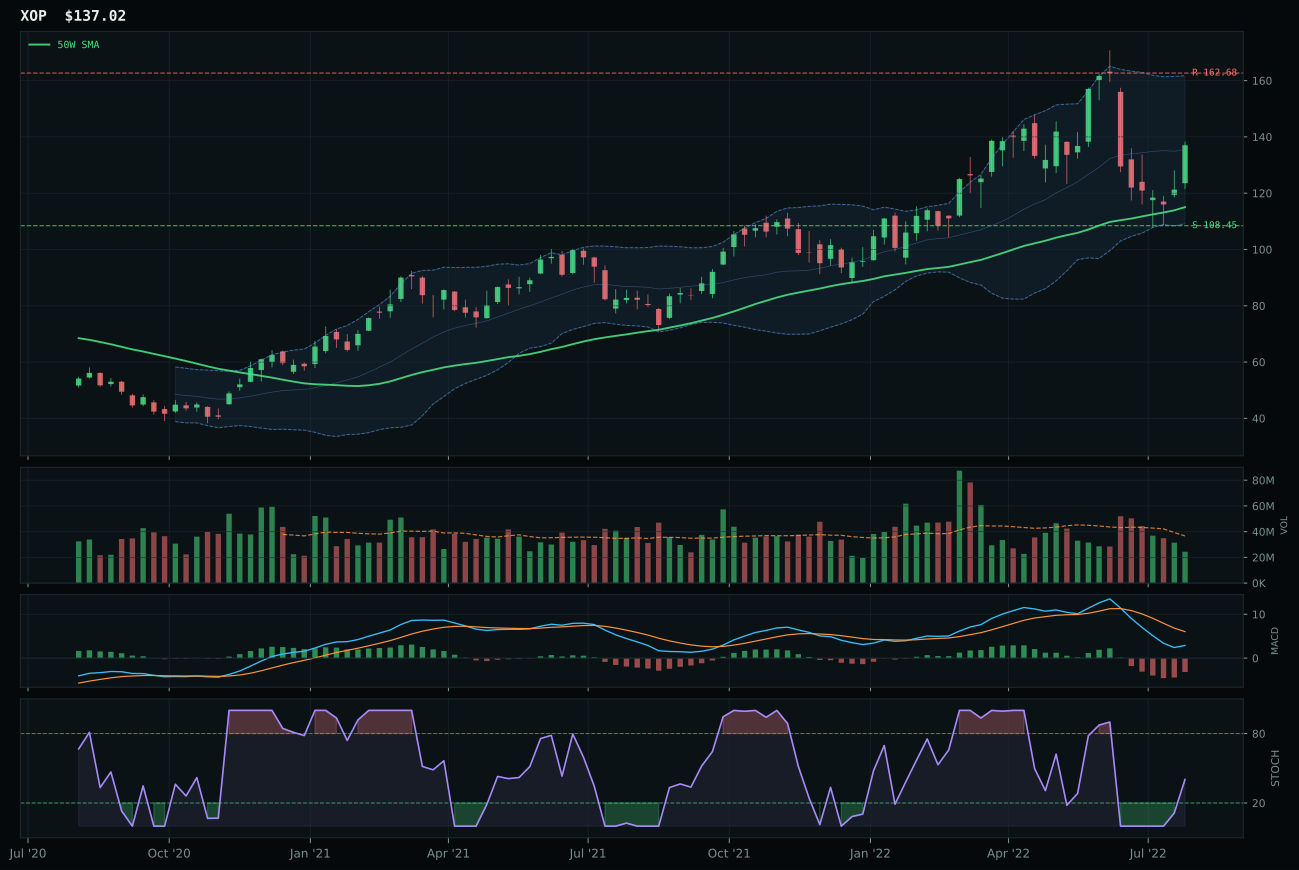
XOP has a vertical extension profile with 4.0% 13-week relative strength versus SPY.
A failed hold above support would weaken the setup.
Actionable but governed by invalidation levels.
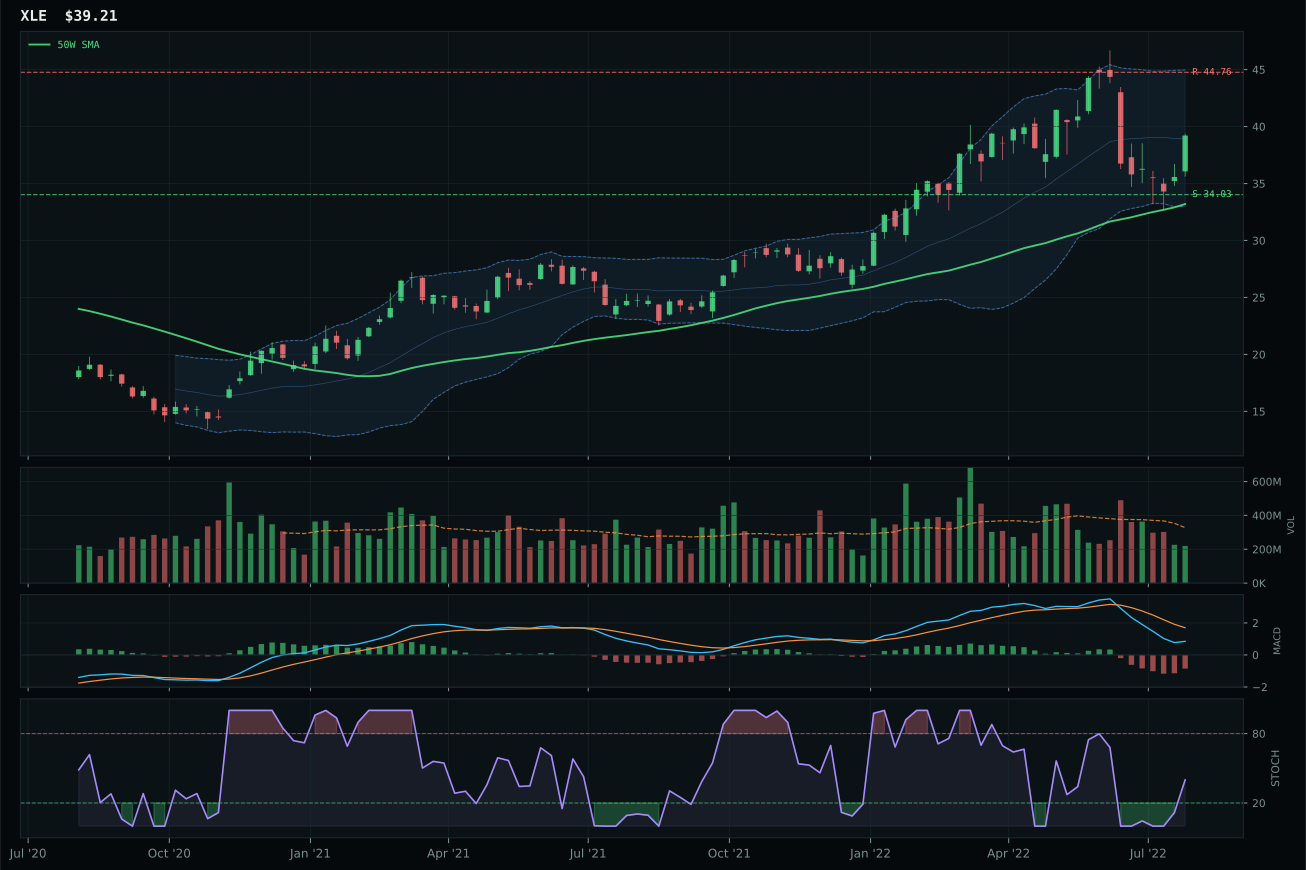
XLE has a vertical extension profile with 4.4% 13-week relative strength versus SPY.
A failed hold above support would weaken the setup.
Actionable but governed by invalidation levels.
FCG won over XOP by 9.4 points despite being positioned 20.9% above the 50W in vertical extension, because trend score of 98.2 reflected price above both moving averages with a rising 50W slope of 1.1%, creating the appearance of confirmed uptrend that overshadows extension risk. XOP's -6.5% disadvantage in risk-reward (41.1 versus 40.8) appears trivial, but combined with a timing score gap of 61.0 versus 56.0, it reveals XOP is more extended with weaker MACD confirmation (bearish-weakening versus FCG's bearish-improving). Momentum confirmation of 79.4 for FCG driven by 13.4% four-week return and 3.5% SPY-relative strength suggests that energy strength is sponsored by capital flows, not just commodity price moves. The setup carries real extension risk at 15.4% upside versus 24.9% downside to support, making this a momentum trade rather than a value setup, which is exactly what you want when energy scarcity is actively priced in.
Traditional Energy earned 10% on a category score of 45.4 because energy scarcity is active (+16), validating the sector's structural importance despite technical extension risk and poor macro breadth from liquidity stress (-7). Category macro fit reached 59.0, second-highest among the 10 categories, because the Transition / Mixed regime with active energy scarcity created genuine tailwinds that overcome FCG's extended chart position. Technical evidence for FCG came in at 44.2, barely passing competency thresholds, meaning this is a macro-driven allocation rather than a chart-driven conviction. The 10% allocation reflects energy's necessity in portfolio construction during inflation uncertainty, not FCG's technical quality; investors should expect this position to be trimmed immediately if price closes below the 50W or if energy scarcity indicators roll over.
Nuclear Energy — URNM
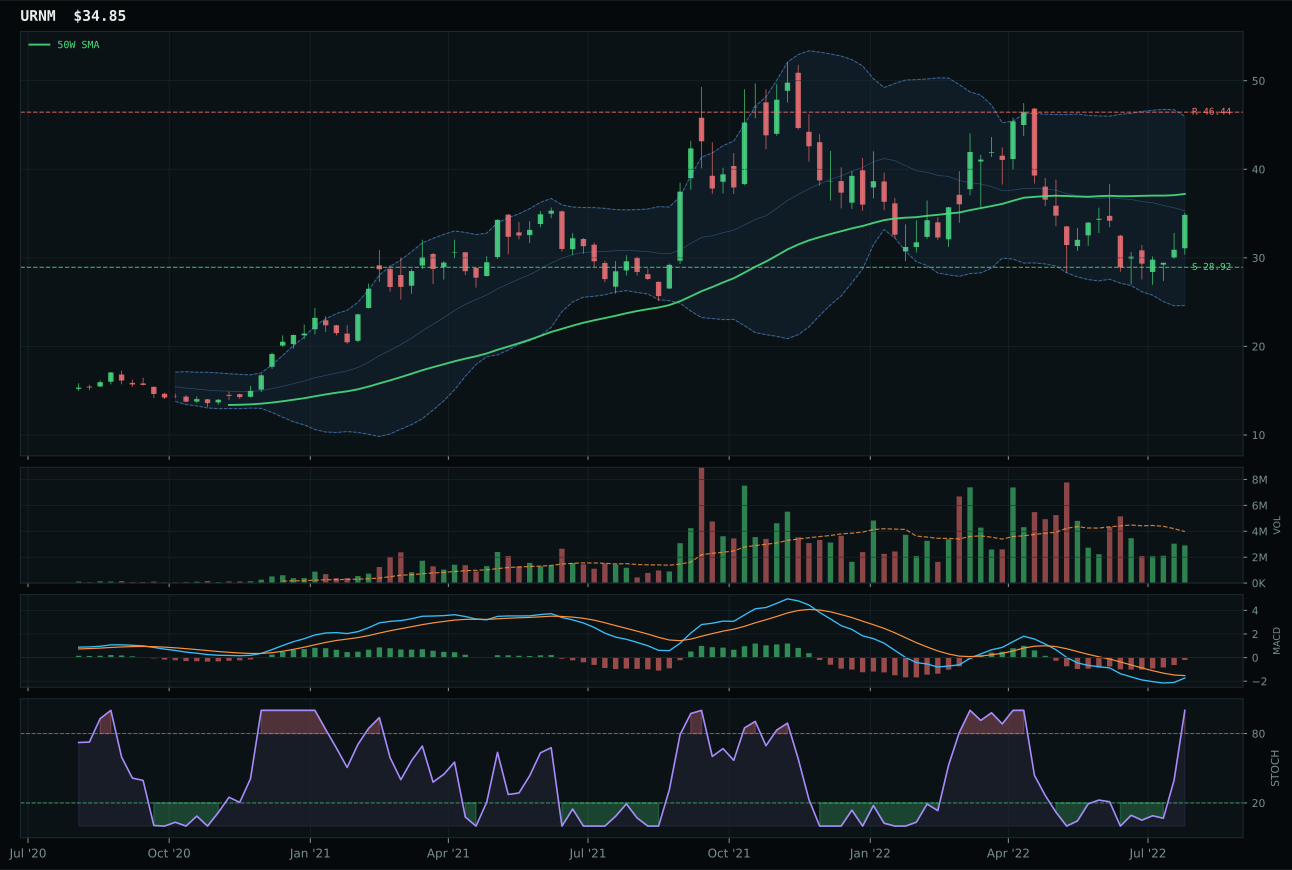
URNM has a neutral structure profile with -4.7% 13-week relative strength versus SPY.
A failed hold above support would weaken the setup.
Actionable but governed by invalidation levels.
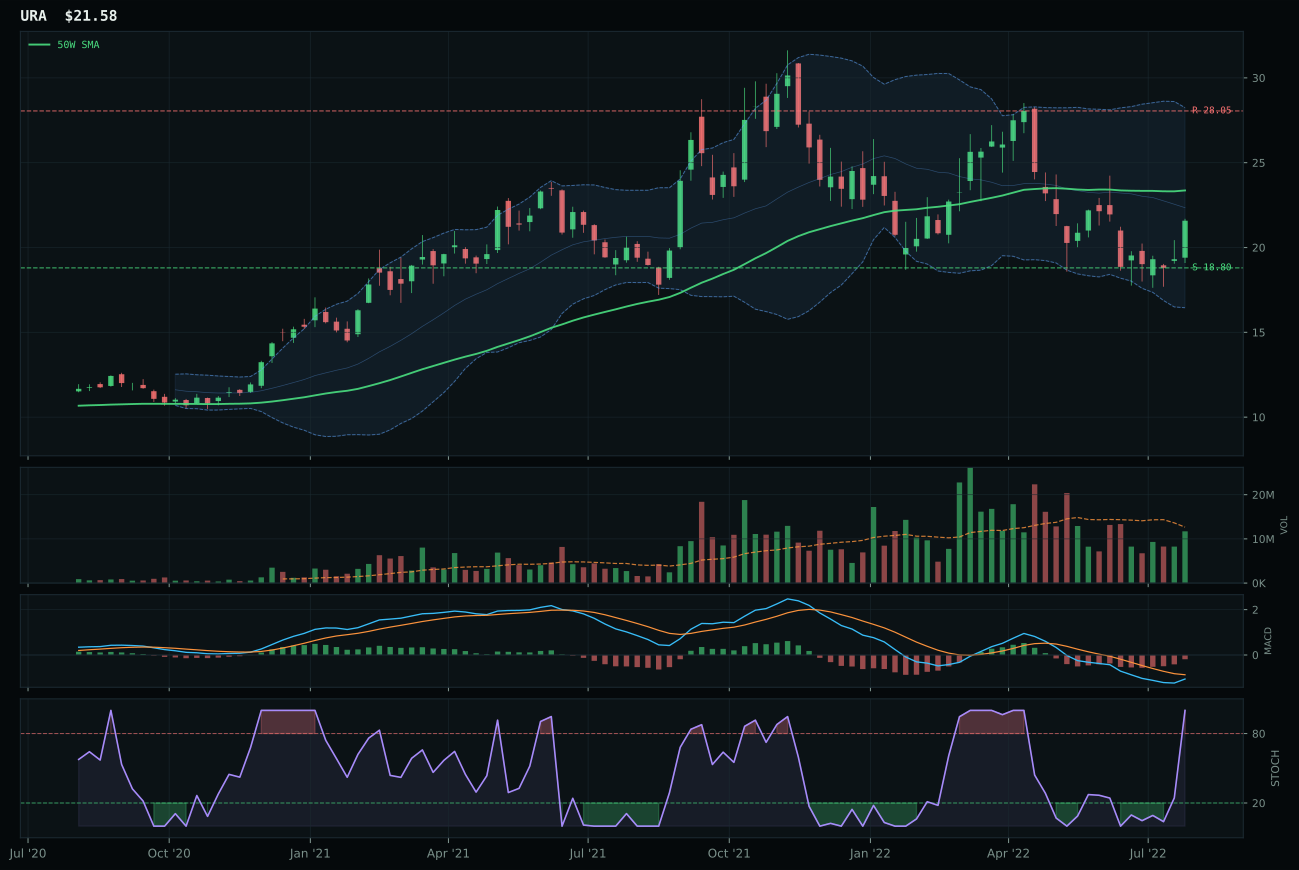
URA has a neutral structure profile with -6.9% 13-week relative strength versus SPY.
A failed hold above support would weaken the setup.
Actionable but governed by invalidation levels.
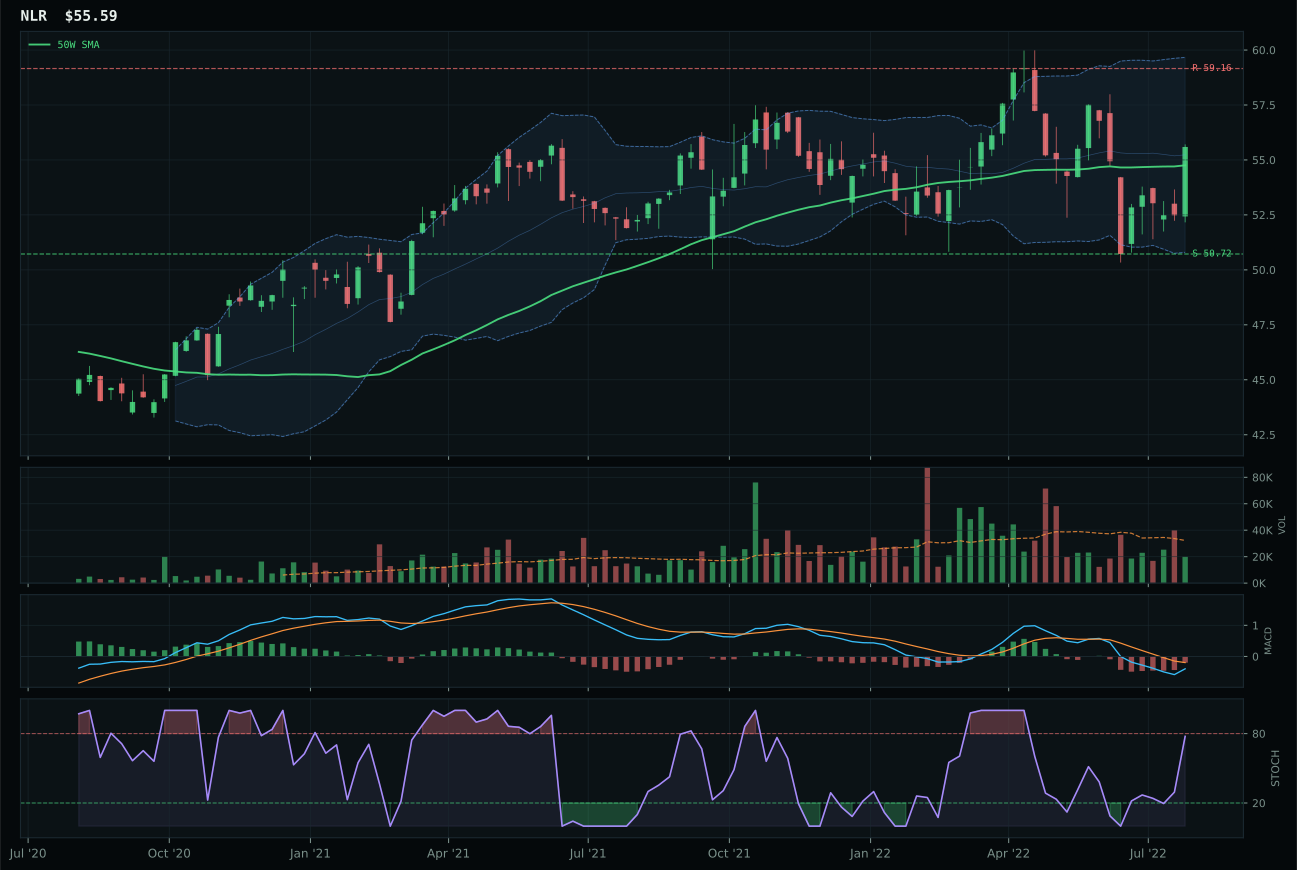
NLR has a compression near 50W profile with 0.7% 13-week relative strength versus SPY.
A failed hold above support would weaken the setup.
Tracked, but not top-2 eligible because: .
URNM won over URA by a 5.9-point margin through identical macro narratives but superior risk-reward of 59.9 versus 58.1 and category-relative strength of 0.0% versus -2.2%, demonstrating that when macro drivers are equal, chart mechanics determine winners. Price sits -6.4% below the 50W but above the 200W with 75.0 timing score driven by MACD bearish-but-improving and overbought stochastic, creating a standard consolidation setup where buyers test weakness rather than confirm strength. URA's deeper drawdown at -6.9% from the 50W and neutral volume participation pushed it into the runner-up slot despite URA winning the timing comparison with ITA's 100.0; URNM represents the safer entry with defined support at 28.92 and a 20.5% downside-to-support buffer that provides margin of safety. Category-relative strength at 0.0% is not a strength, but it is not a relative weakness either, which matters in a category where all three options are simultaneously wrestling with the same macro drivers.
Nuclear Energy earned 10% on a category score of 41.1 because energy scarcity (+9) and AI growth sponsorship (+5) created 57.0 macro fit despite liquidity stress (-7) and technical evidence scoring just 38.9 for URNM. The allocation reflects structural energy supply necessity during a regime where both AI capex demand and power grid constraints are real, not speculative; however, technical evidence remains weak, with URNM showing 51.0 trend score and 68.5 momentum confirmation that suggest consolidation rather than accumulation. Holding 10% is appropriate for a contrarian energy play that benefits from supply anxiety but lacks confirmed technical sponsorship; investors must watch for URNM to break above the 50W on above-average volume to justify position confidence. The 5.9-point gap over URA is meaningful but not decisive enough to suggest this allocation will persist unchanged; if uranium prices roll over, this becomes a 5% defensive holding.
Precious Metals — GDX
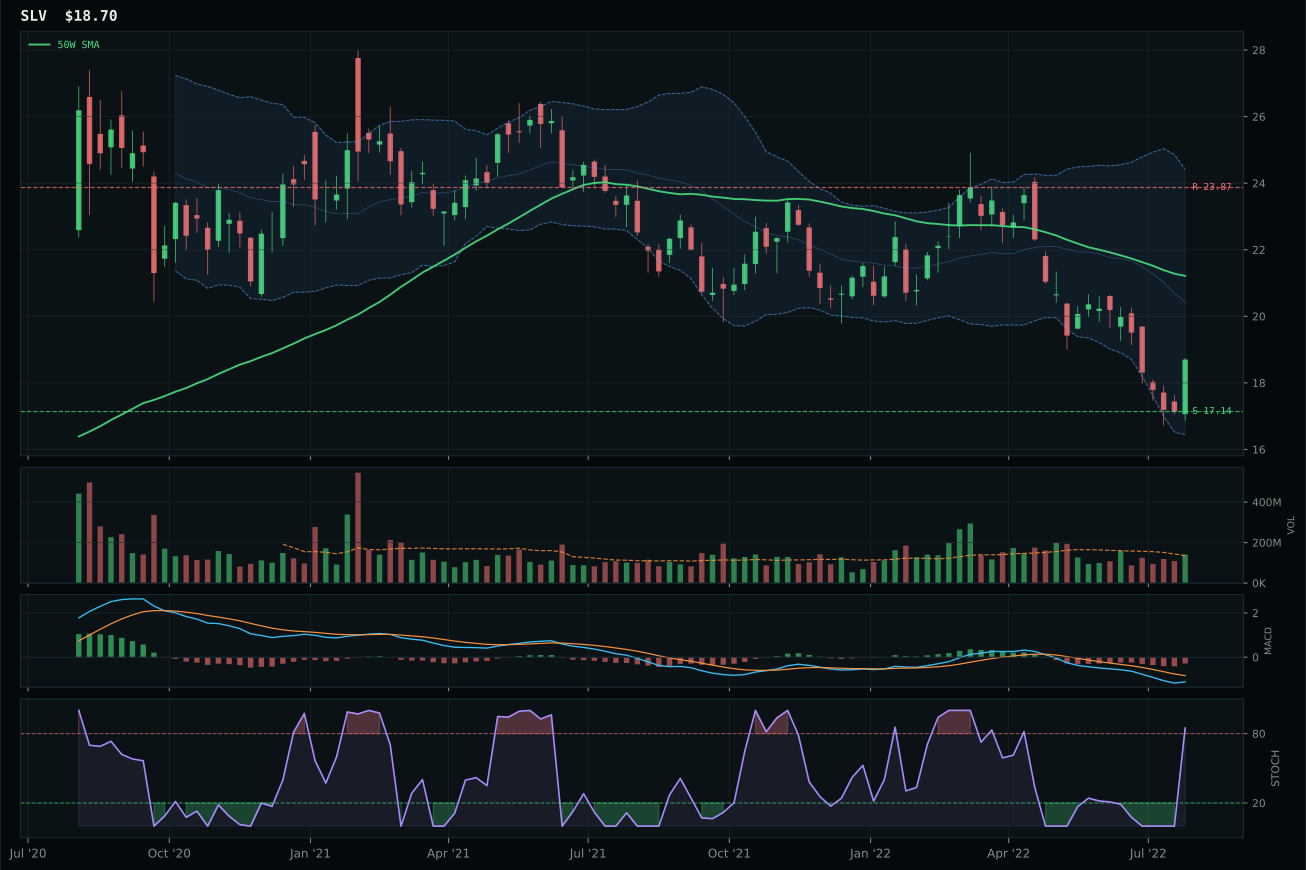
SLV has a neutral structure profile with -11.1% 13-week relative strength versus SPY.
A failed hold above support would weaken the setup.
Actionable but governed by invalidation levels.
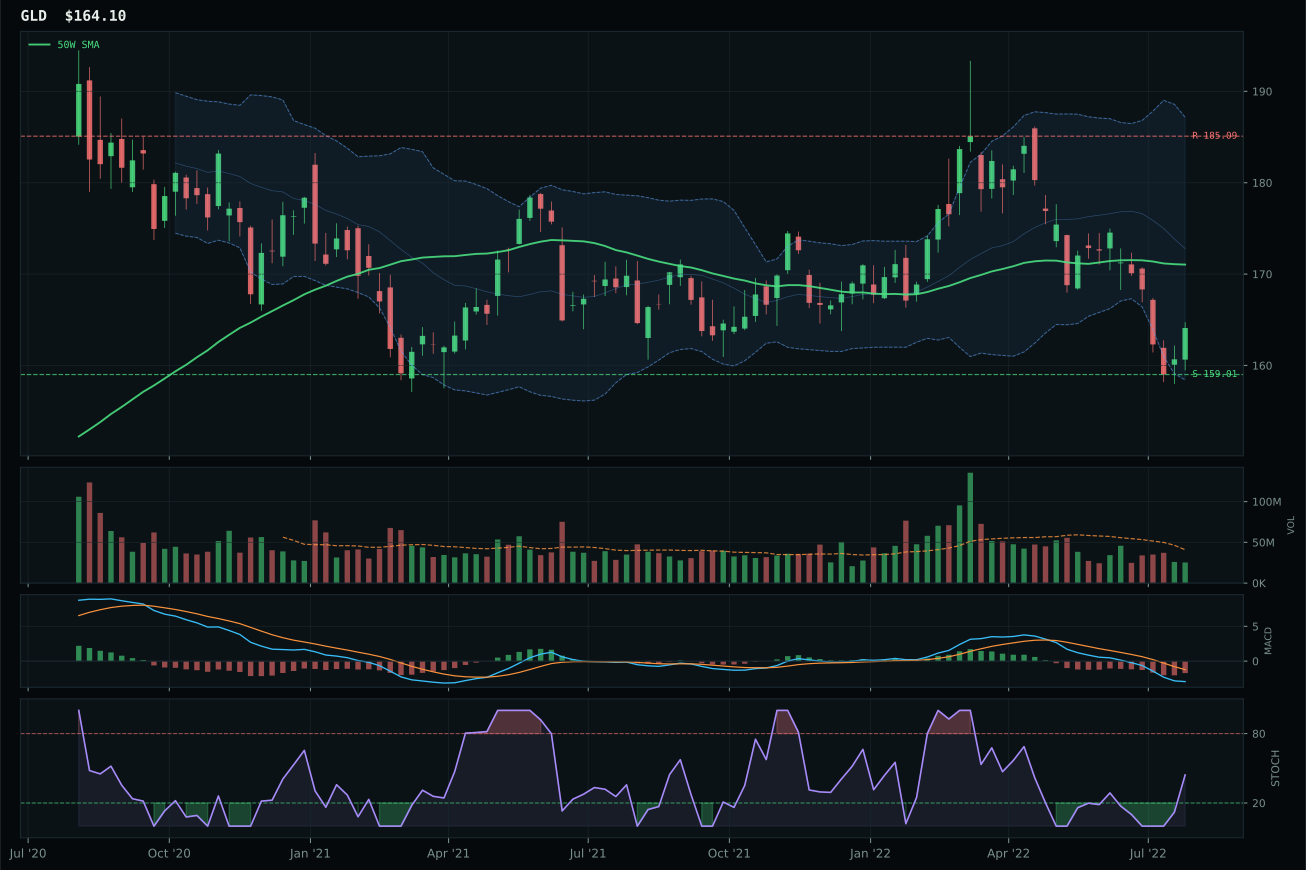
GLD has a pullback into support profile with -7.2% 13-week relative strength versus SPY.
A failed hold above support would weaken the setup.
Actionable but governed by invalidation levels.
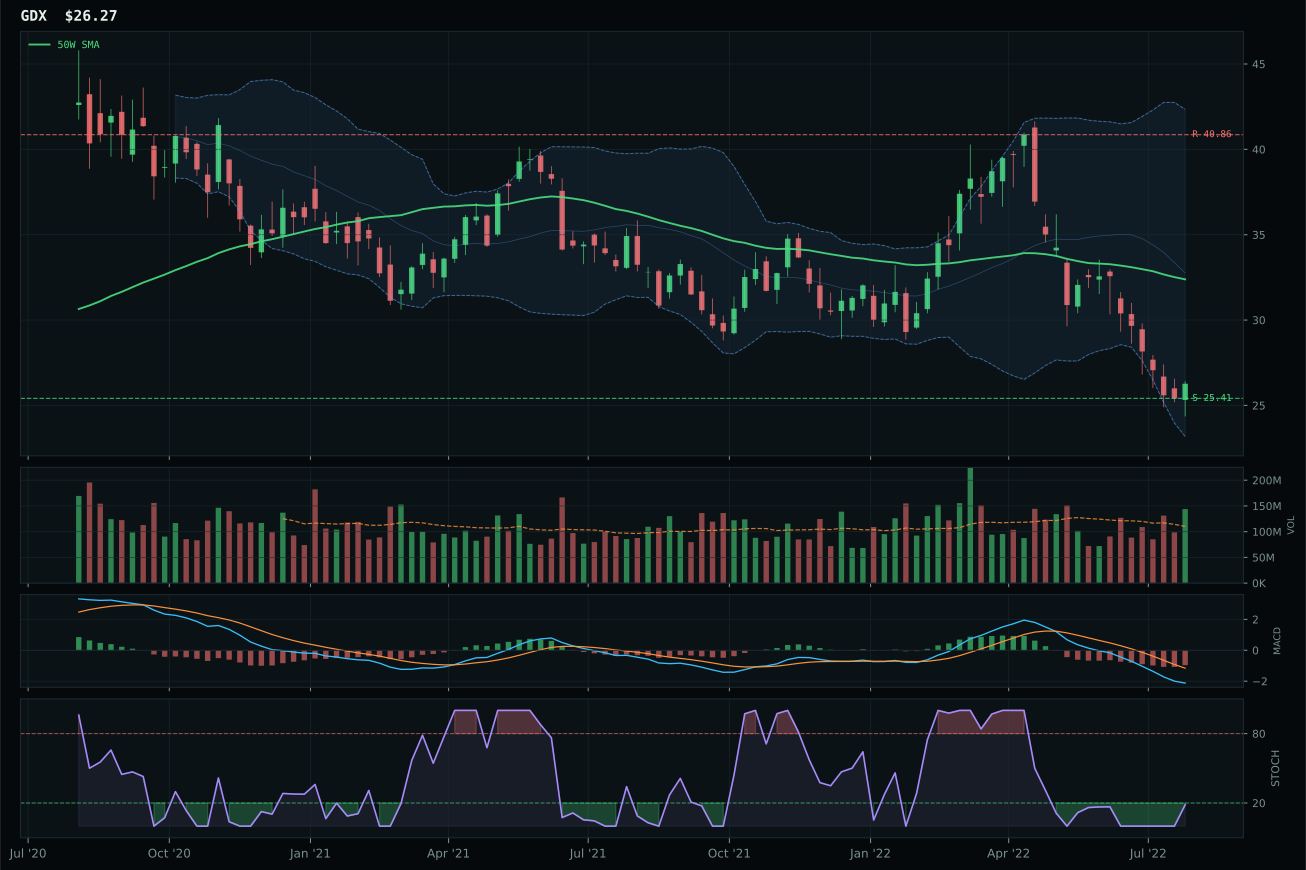
GDX has a pullback into support profile with -24.9% 13-week relative strength versus SPY.
A failed hold above support would weaken the setup.
Actionable but governed by invalidation levels.
GDX won despite a composite score of just 28 and zero momentum confirmation because this regime rewards oversold timing and support mechanics over trend confirmation, making the 74.0 timing score decisive against SLV's 55.0. Price pulled into near the 52W low at -18.9% from the 50W with stochastic rising from oversold (0.18) and MACD bearish-but-weakening, creating a textbook mean-reversion setup where volume participation above average at 1.31x suggests institutional accumulation rather than retail capitulation. SLV's neutral structure and overbought stochastic tell a different story: price is -11.1% from the 50W sitting in a decision zone, where upside breakout requires new money and downside offers no margin of safety. The category-relative strength gap of -13.8% for GDX versus 0.0% for SLV appears damaging, but in a sector this weak, losing less to your peer basket matters more than absolute performance.
Precious Metals earned 10% despite a final score of 38.3 because defensive rotation (+7) and dollar pressure (+3) created 60.0 macro fit, and leverage via miners offers asymmetric protection if credit stress intensifies from here. However, technical evidence for GDX scored a damning 0.0%, reflecting -24.9% 13-week underperformance, zero momentum confirmation, and zero volume-price confirmation, meaning this is purely a macro hedge play with no technical endorsement. The allocation represents a bet that support at 25.41 holds and oversold stochastic reversal triggers accumulation, not a conviction entry; GDX must close above the 50W on volume to justify staying in the portfolio. SLV's superior technical foundation (43.7 evidence versus GDX's 0.0) would normally win, but the category itself is so weak that even the winner carries massive risk, making 10% the appropriate sizing for a purely macro defensive hedge.
AI — SMH
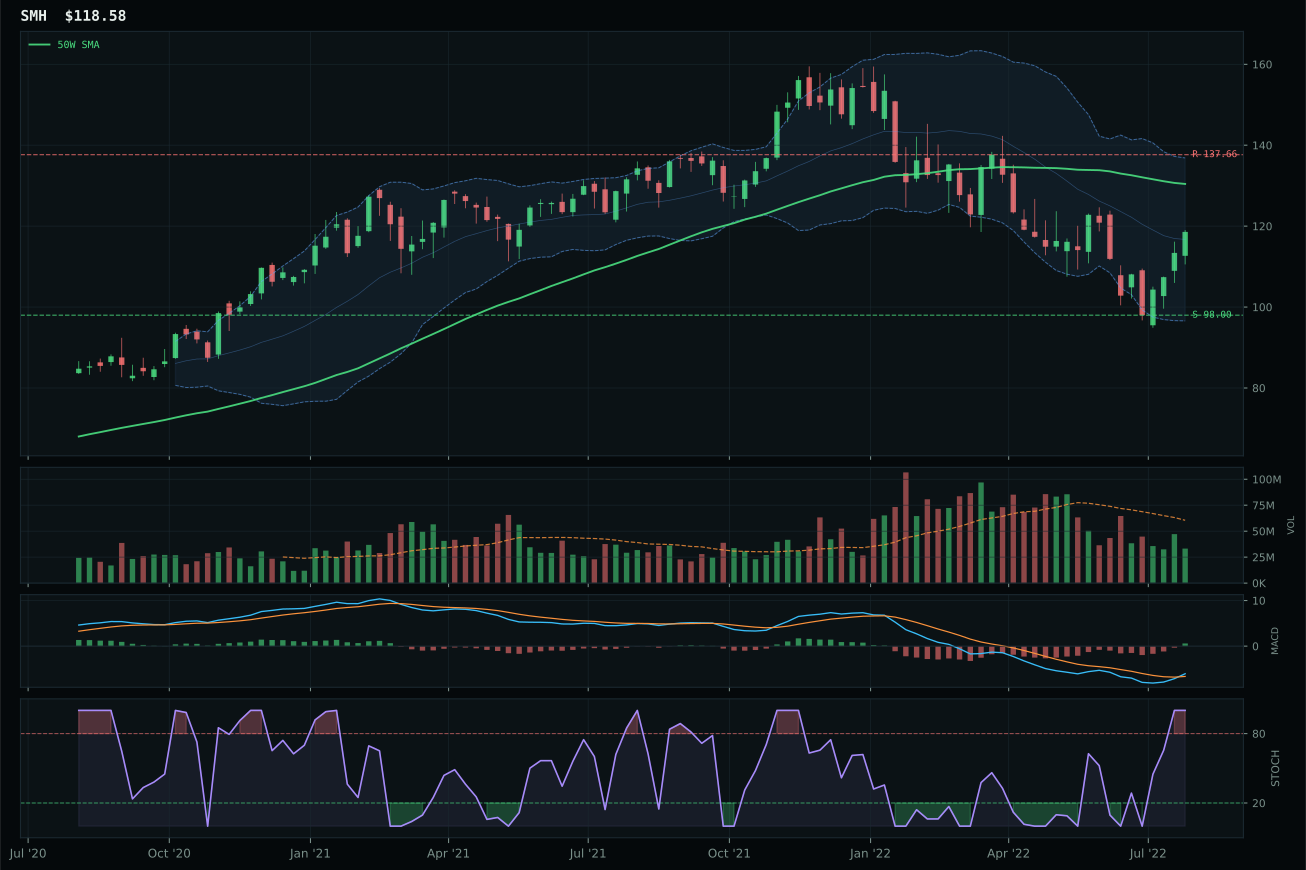
SMH has a neutral structure profile with 3.2% 13-week relative strength versus SPY.
A failed hold above support would weaken the setup.
Actionable but governed by invalidation levels.
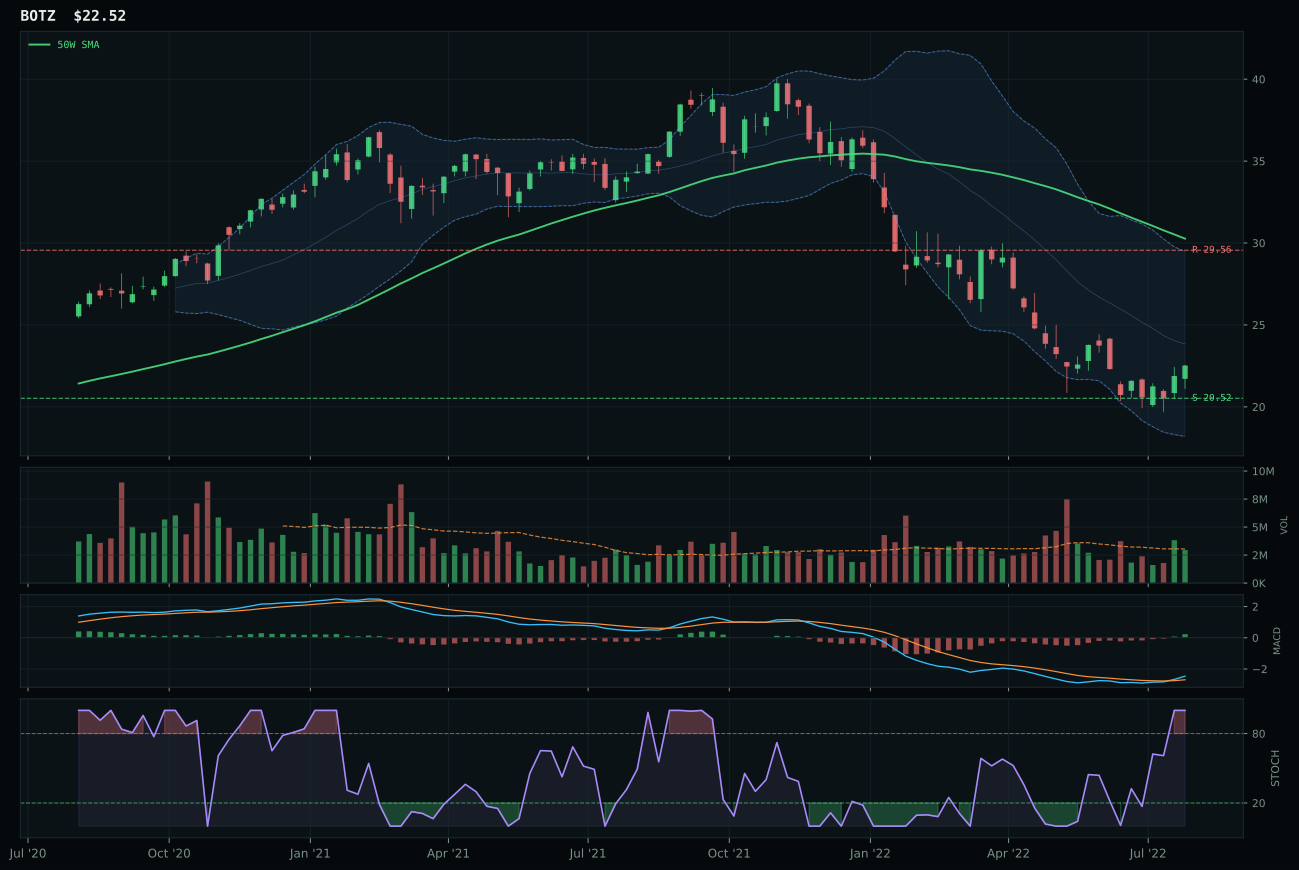
BOTZ has a neutral structure profile with -5.6% 13-week relative strength versus SPY.
A failed hold above support would weaken the setup.
Actionable but governed by invalidation levels.
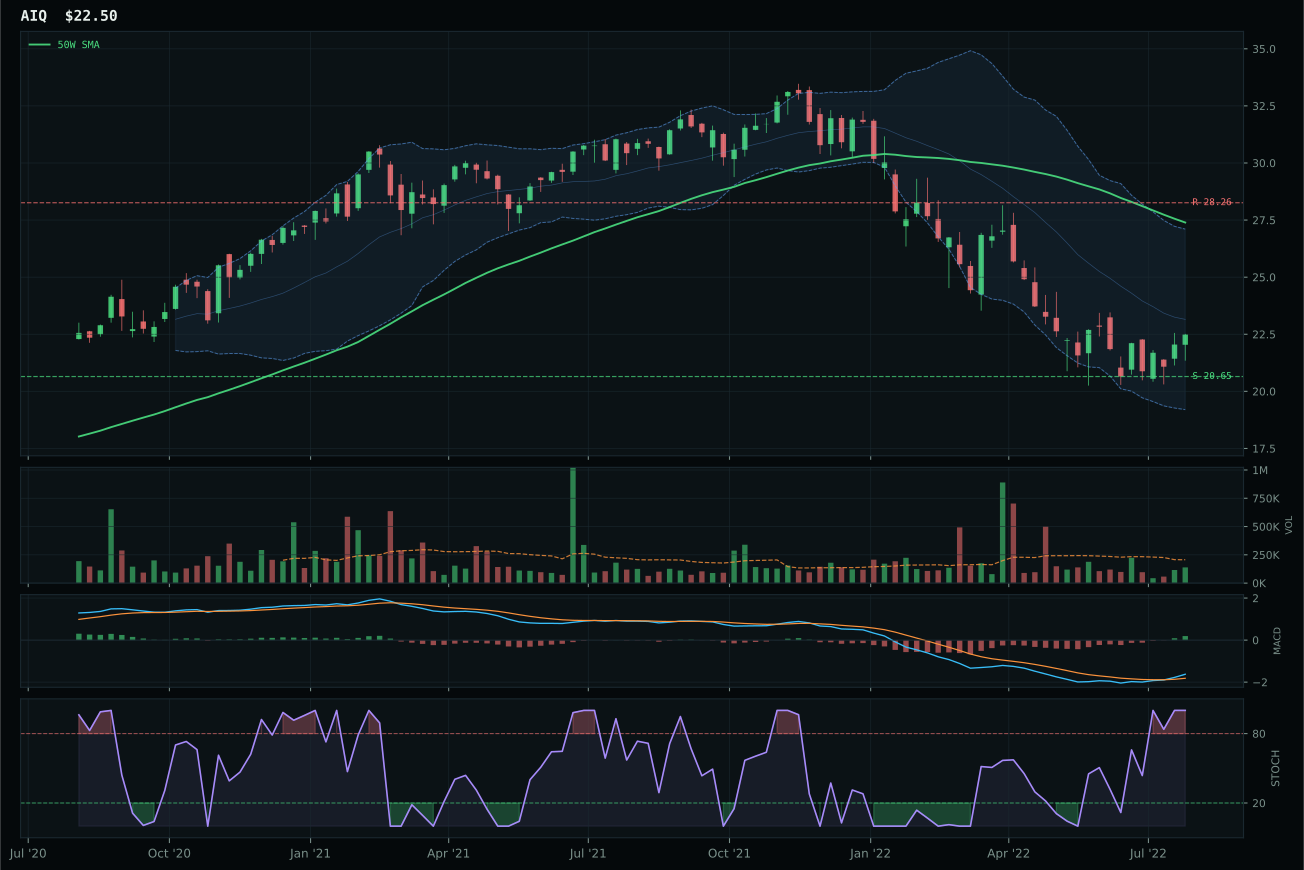
AIQ has a neutral structure profile with -3.3% 13-week relative strength versus SPY.
A failed hold above support would weaken the setup.
Tracked, but not top-2 eligible because: .
SMH won with a 24.1-point gap over BOTZ because semiconductor compute benefited from both clean technical setup and superior category-relative strength of 6.5% versus BOTZ's -2.3%, creating two-layer confirmation that robotics breadth simply could not match. The 21.0% four-week return drove momentum confirmation to a perfect 100.0, translating recent price action into forward-looking capital flows that separated the compute narrative from the cyclical manufacturing bet. BOTZ's timing score of 55.0 versus SMH's 82.0 reflects a deeper problem: robotics sits in a repair zone near the 52W low, dependent on broader accumulation rather than independently sponsored, while semiconductors sit in a clean decision zone where price compression creates defined risk boundaries. Volume at 0.55x average suggests thin but improving accumulation, not capitulation, which matters in this regime where every buyer above the 50W is adding risk capital.
AI ranked only 31.7 despite SMH's clean setup because the category macro fit collapsed to 40.0, penalized equally by liquidity stress (-12), broad market bear (-8), and dollar pressure (-4) that outweighed AI growth sponsorship (+14). A 10% allocation reflects the structural conflict: technical evidence is strong at 68.7%, but the Transition / Mixed regime with active risk-off descriptors creates a setup where even the best chart play faces macro gravity. Semiconductor leadership carries durability through the near term given capex cycles and AI infrastructure spend, but the category will need either macro stabilization or a decisive break above resistance levels to justify elevation to top-2 status in future weeks.
Agriculture & Livestock — MOO
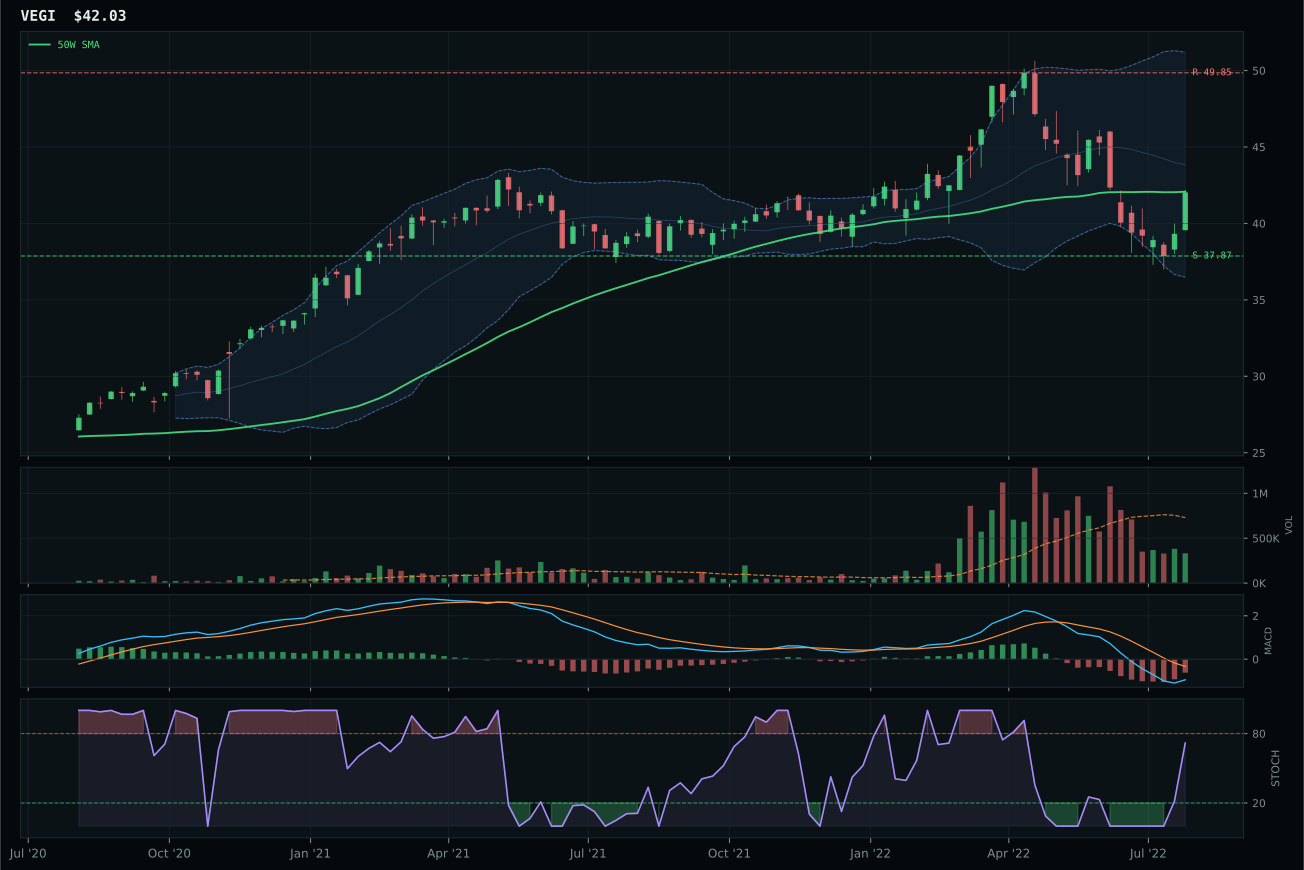
VEGI has a compression near 50W profile with -7.7% 13-week relative strength versus SPY.
A failed hold above support would weaken the setup.
Actionable but governed by invalidation levels.
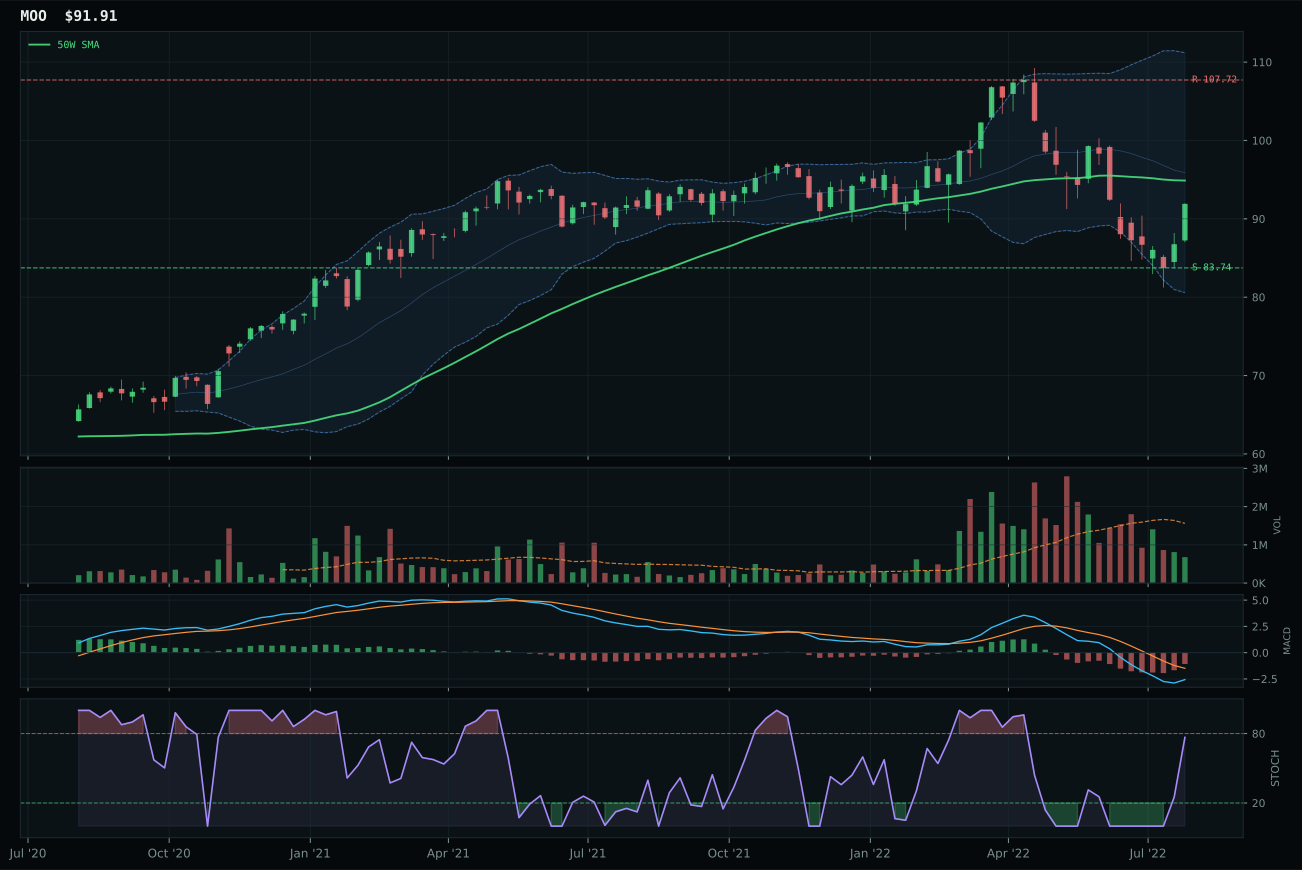
MOO has a neutral structure profile with -6.8% 13-week relative strength versus SPY.
A failed hold above support would weaken the setup.
Actionable but governed by invalidation levels.
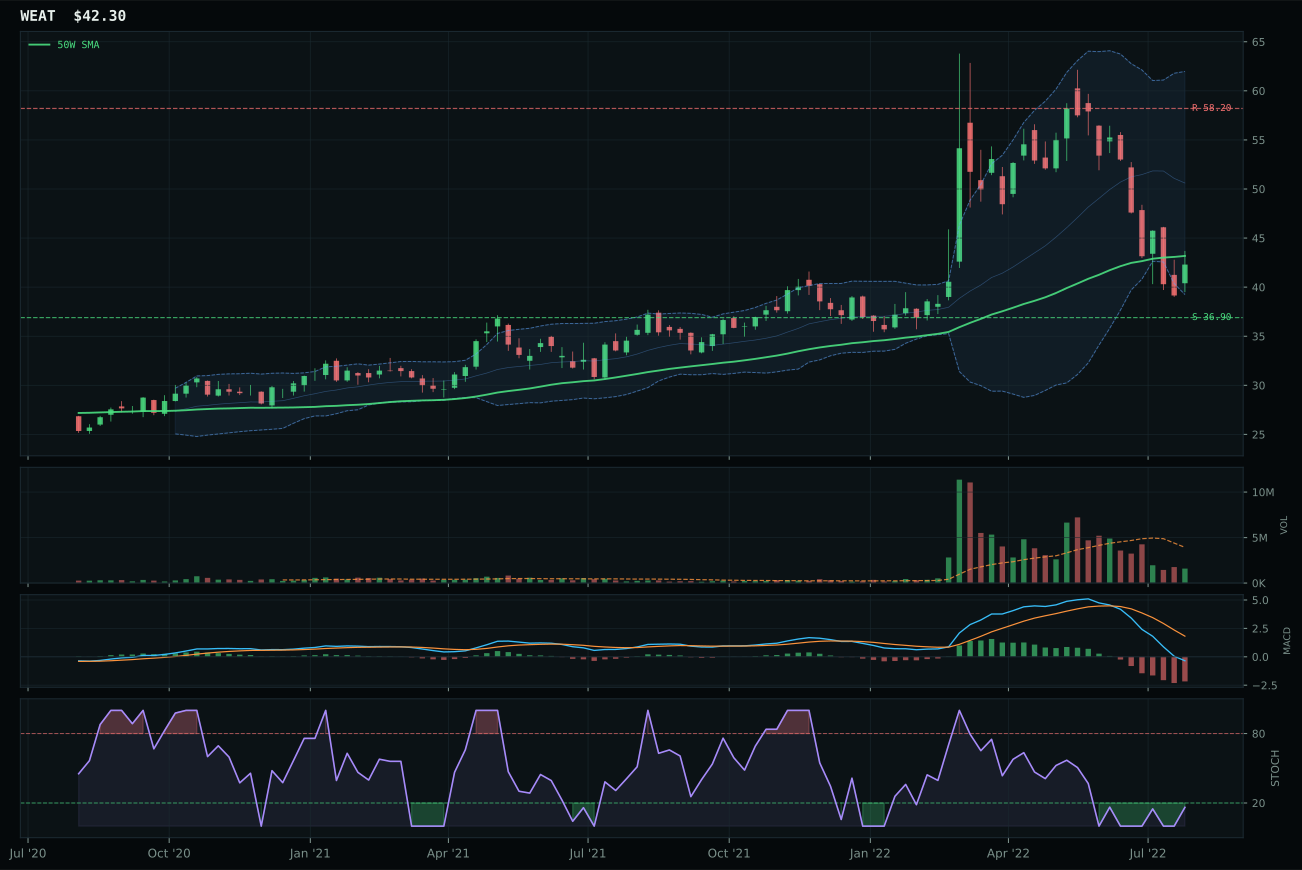
WEAT has a compression near 50W profile with -18.8% 13-week relative strength versus SPY.
A failed hold above support would weaken the setup.
Actionable but governed by invalidation levels.
MOO won over VEGI by the thinest margin—just 0.2 points in the reasoned proof order—because category-relative strength of 0.9% beat VEGI's flat 0.0%, combined with a marginally sharper risk-reward of 80.1 versus 78.7, demonstrating that in weak categories, execution precision determines winners. Both sit in the deep retracement zone near Fib 0.618 with bearish-but-improving MACD and rising mid-zone stochastic, the setup for mean-reversion plays in structurally weak sectors where timing is everything. MOO's neutral structure proved superior to VEGI's compression near the 50W, because compression often precedes breakdowns in bear markets, while neutral structure preserves two-way optionality. Price -3.1% from the 50W with 100.0 timing score and 80.1 risk-reward suggests MOO has defined its support at 83.74, creating a lower-probability double-bottom setup rather than a continued deterioration pattern.
Agriculture earned 10% despite a final category score of just 25.6, making it the weakest allocation holding, because sector rotation and commodity beta still deserve representation even in bear markets. Category macro fit came in at a neutral 46.0 with no descriptors strongly favoring or penalizing this exposure, meaning the allocation reflects pure technical setup quality rather than macro conviction. Liquidity stress (-4) provided the only meaningful headwind, while no tailwinds materialized, indicating this is a structural hedge position rather than a growth allocation. MOO's timing score of 100.0 and risk-reward of 80.1 are genuinely attractive on an isolated basis, but the category context—where VEGI is nearly equivalent, persistence is weak at 45.5%, and momentum confirmation is poor at 41.6%—argues for minimal capital commitment until breadth and volume improve materially.
Industrial Metals — REMX
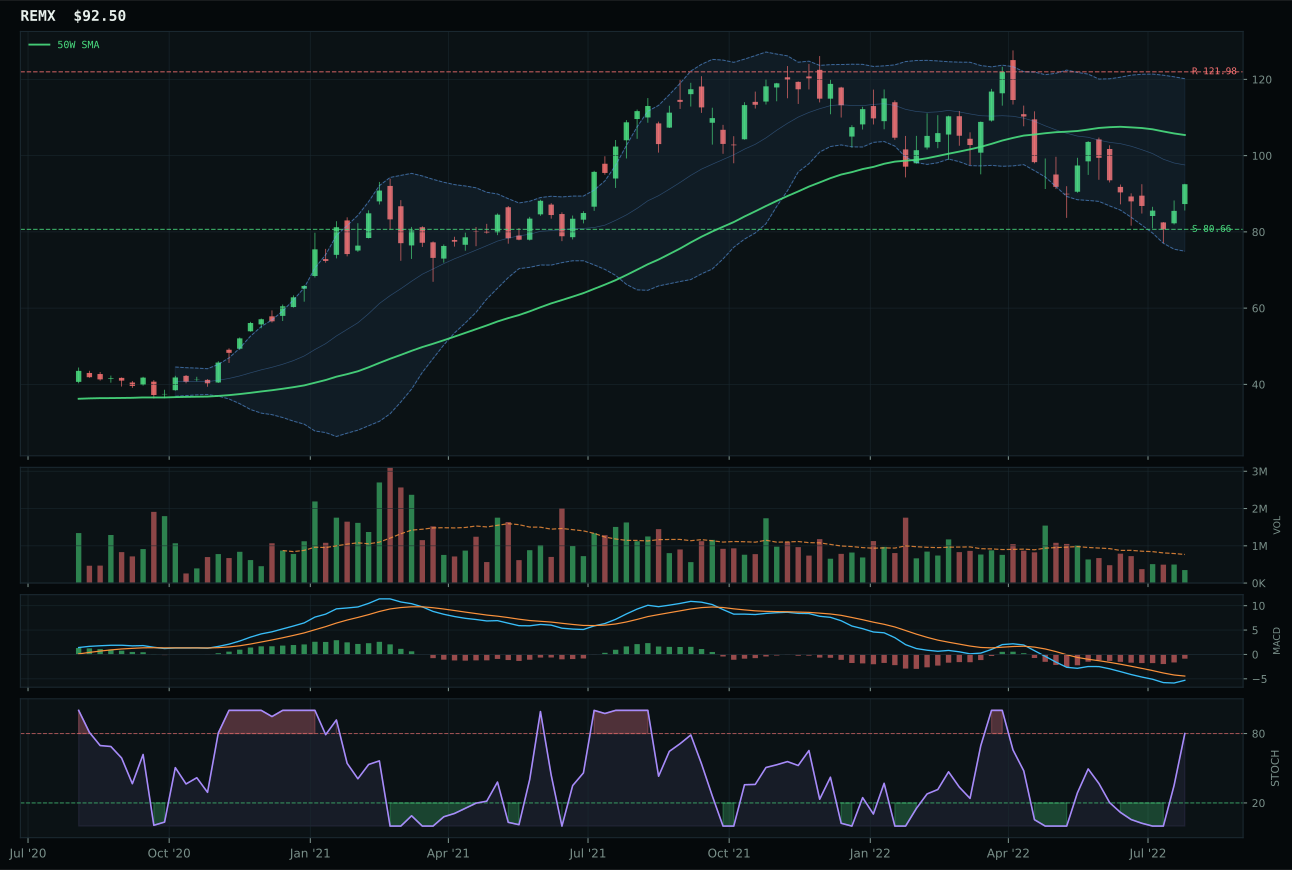
REMX has a neutral structure profile with -2.9% 13-week relative strength versus SPY.
A failed hold above support would weaken the setup.
Actionable but governed by invalidation levels.
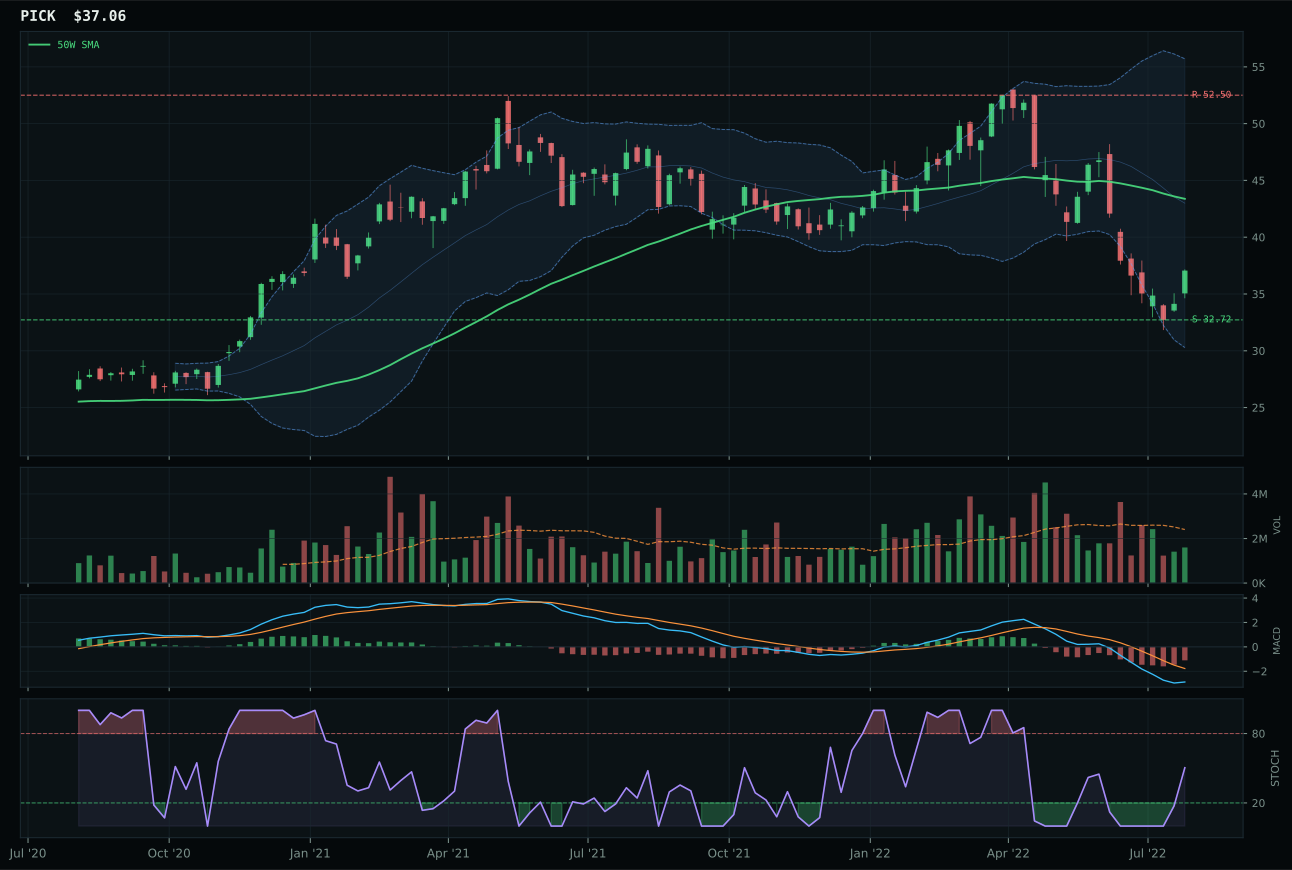
PICK has a neutral structure profile with -18.5% 13-week relative strength versus SPY.
A failed hold above support would weaken the setup.
Actionable but governed by invalidation levels.
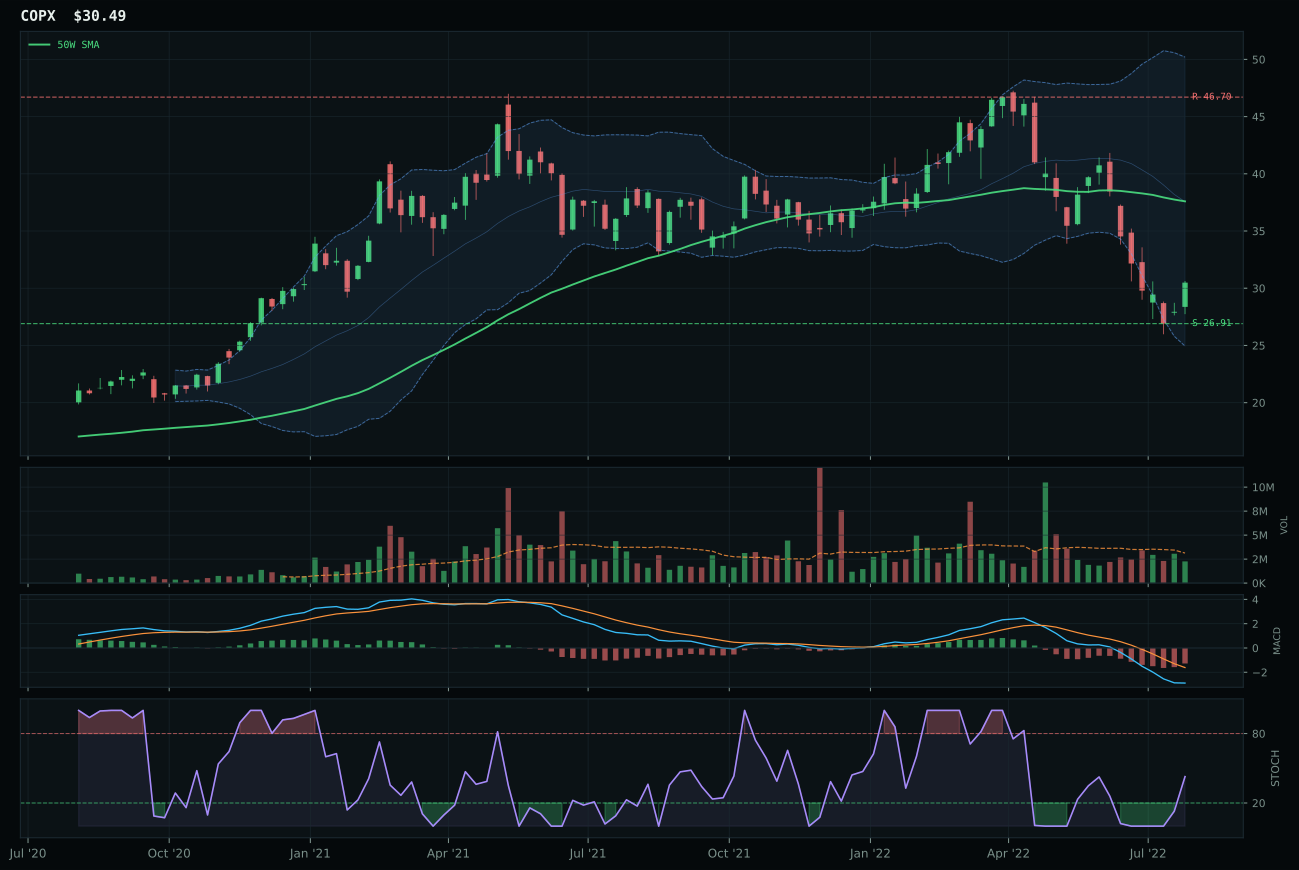
COPX has a neutral structure profile with -23.8% 13-week relative strength versus SPY.
A failed hold above support would weaken the setup.
Actionable but governed by invalidation levels.
REMX defeated PICK by 13.3 points through superior category-relative strength of 15.6% versus PICK's flat 0.0%, creating a two-step advantage: first, REMX is losing less to its peer basket, and second, the rare-earth narrative carries 4-point AI growth sponsorship that diversified mining breadth cannot access. Price -12.2% from the 50W with neutral structure and rising mid-zone stochastic created the standard reset-zone setup, but REMX's 74.5 momentum confirmation score driven by 6.6% four-week return proved that recent capital flow favored the AI-exposed bet. PICK's -18.5% 13-week relative weakness and 35.8 technical score reflect a sector that is genuinely in repair mode, where isolated strength in rare-earth supply constraints beats broad-based mining deterioration. Volume participation is thin at 0.45x across the category, but REMX's timing score of 70.0 suggests price has exhausted selling pressure and sits in a value zone, not a breakdown zone.
Industrial Metals scored 16.9 and earned 0% allocation this week, ranking ninth or tenth among categories because macro headwinds overwhelm any technical merit. Dollar pressure contributes -7 to the category macro fit, and liquidity stress adds -8, producing a 35.0 macro fit—among the lowest in the system alongside Emerging Markets. REMX's technical evidence of 61.0 cannot overcome these structural headwinds; the category is explicitly penalized by broad-dollar strength and funding stress in a transition regime. The 3/2/1 weighted basket starts at only 42.4, and the final category score drops to 16.9 after testing against persistence and setup quality, revealing weak institutional conviction. REMX's rare-earth AI-growth sponsorship narrative carries +4 macro support, but it fails to reach parity against currency and liquidity drags. Allocation zero is firm: unless dollar pressure reverses or liquidity eases measurably, industrial metals remain excluded. REMX would require +5 to +10 points of improvement in either dollar or liquidity descriptors to earn even the 10% floor position.
Emerging Markets — INDA
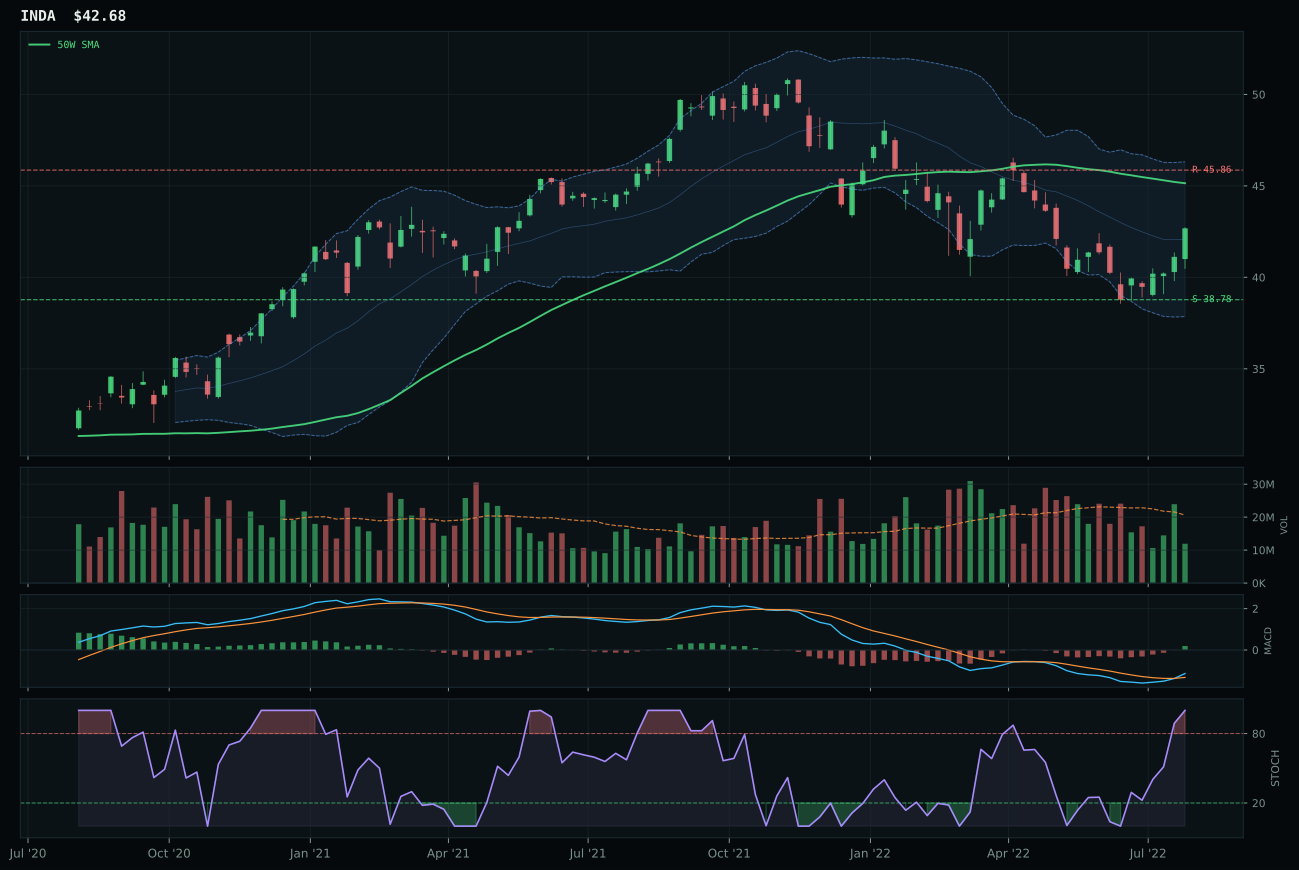
INDA has a neutral structure profile with -2.2% 13-week relative strength versus SPY.
A failed hold above support would weaken the setup.
Actionable but governed by invalidation levels.
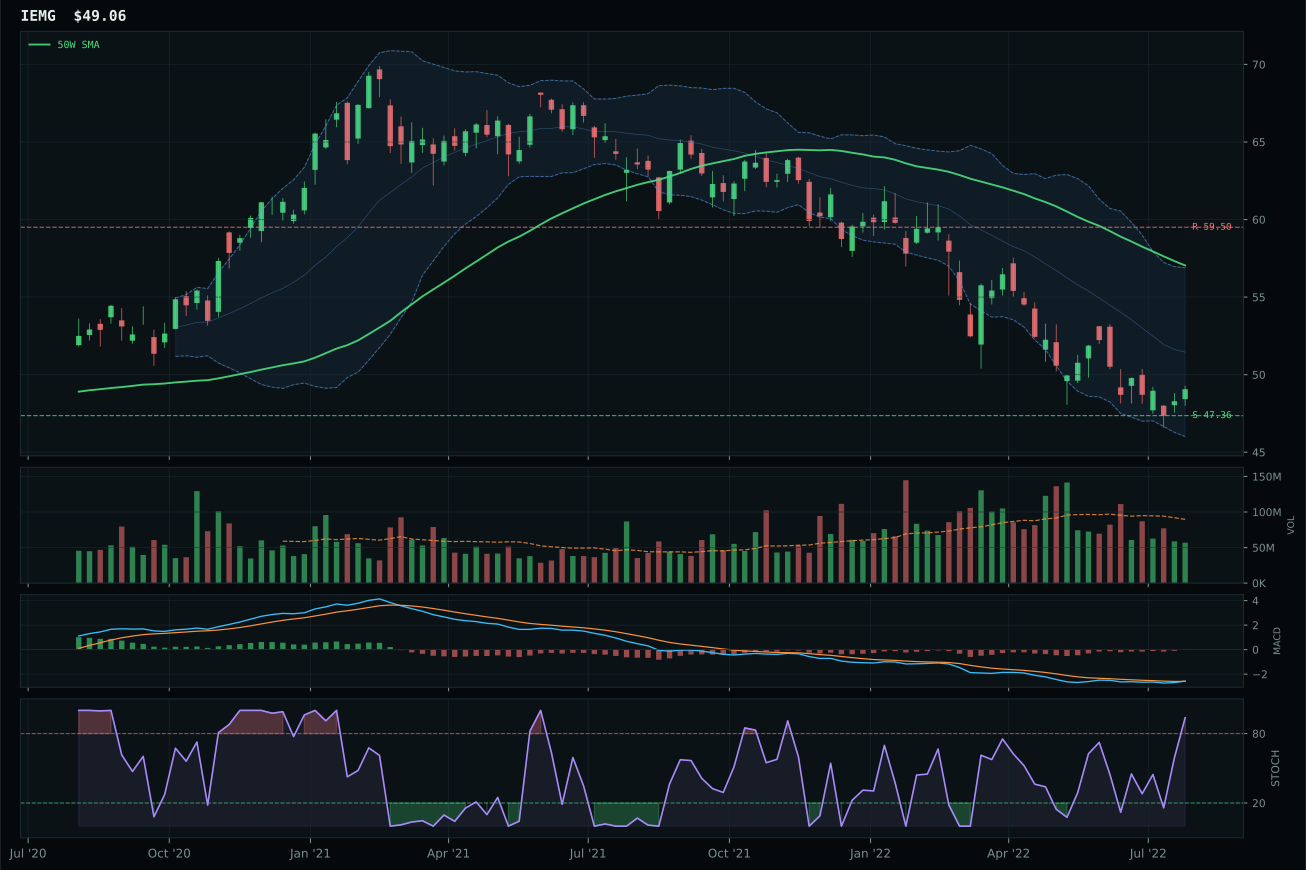
IEMG has a pullback into support profile with -6.1% 13-week relative strength versus SPY.
A failed hold above support would weaken the setup.
Actionable but governed by invalidation levels.
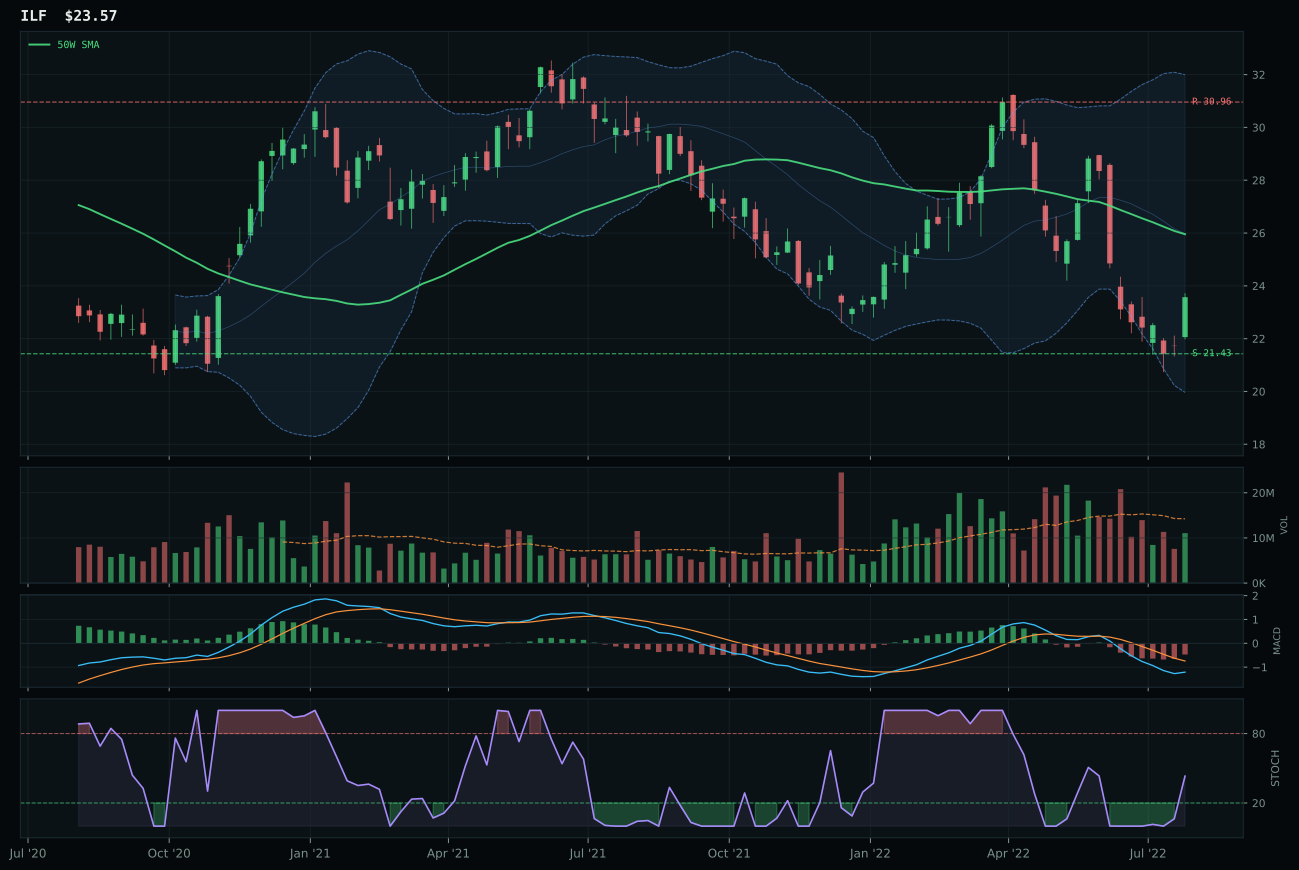
ILF has a neutral structure profile with -9.7% 13-week relative strength versus SPY.
Extension and support failure are the main tactical risks.
Tracked, but not top-2 eligible because: structurally broken.
INDA won over IEMG by 8.1 points primarily through superior timing of 82.0 versus 65.0 and structure cleanliness of 75.4 versus 72.1, creating a refined entry point where price -5.5% from the 50W sits in a decision zone rather than IEMG's deeper pullback into repair. Category-relative strength of 3.9% versus IEMG's flat 0.0% adds confirmation that India-focused quality growth is holding better than broad emerging-market beta during the dollar pressure regime. Both charts show MACD bullish and improving with overbought stochastic, but INDA's compression near the 50W with 82.7 compression score creates expansion potential if buyers defend, whereas IEMG's pullback into support suggests earlier sellers are covering losses rather than new capital entering. Risk-reward is essentially identical at 65.4 versus 90.0, but INDA's neutral structure with defined upper resistance at 45.86 gives traders a clear two-way boundary to operate within.
Emerging Markets scored 10.3 and earned 0% allocation this week, ranking last or ninth among categories because dollar pressure contributes -14 to macro fit and liquidity stress adds -10, producing a 17.0 macro fit—the lowest in the system. Broad-market bear conditions add another -9, creating a negative macro triad that overwhelms any technical merit. INDA's otherwise-solid technical evidence of 61.5 cannot overcome structural headwinds; dollar strength actively penalizes unhedged emerging-market currency exposure in a transition regime where capital rotates to safety. The category proof order begins INDA 51.2, but the final category score compresses to 10.3 after testing against persistence and risk-reward, revealing no institutional conviction. Allocation remains zero: emerging markets require a dramatic reversal in dollar trajectory or a confidence shock that triggers flight-to-yield behavior. Unless liquidity stress eases by -5 points and dollar pressure reverses to neutral or positive, emerging markets stay entirely excluded from portfolio positioning.