
2022-07-22
Informational purposes only. The content in this report, including allocations, analysis, and commentary, is provided solely for informational and educational purposes. It does not constitute financial advice, investment advice, trading advice, or any other type of advice. Past performance does not guarantee future results. Always conduct your own research and consult a qualified financial professional before making investment decisions.
Weekly Allocation
| Ticker | Category | Weight | Role |
|---|---|---|---|
| PAVE | Utilities & Infrastructure | 20% | Top-2 (20%) |
| XLK | Technology | 20% | Top-2 (20%) |
| GLD | Precious Metals | 10% | Tier-2 (10%) |
| XAR | Defense & Aerospace | 10% | Tier-2 (10%) |
| SMH | AI | 10% | Tier-2 (10%) |
| URNM | Nuclear Energy | 10% | Tier-2 (10%) |
| XLE | Traditional Energy | 10% | Tier-2 (10%) |
| MOO | Agriculture & Livestock | 10% | Tier-2 (10%) |
Trade Instructions — Monday Open
Sell the tranche from 2022-06-24 (completing its 4-week hold). Buy the new tranche. Instructions show net portfolio changes — same-asset positions cancel, weight changes show the delta.
| Action | Ticker | Instruction |
|---|---|---|
| SELL | SGOV | Sell 33% of SGOV position (reduce 15.00% → 10.00%) |
| SELL | GLD | Sell 16% of GLD position (reduce 23.75% → 20.00%) |
| SELL | XLU | Sell 18% of XLU position (reduce 21.25% → 17.50%) |
| SELL | IGV | Sell entire IGV position (2.50% of portfolio) |
| SELL | IGF | Sell entire IGF position (1.25% of portfolio) |
| SELL | ITA | Sell 20% of ITA position (reduce 6.25% → 5.00%) |
| SELL | BOTZ | Sell 33% of BOTZ position (reduce 3.75% → 2.50%) |
| SELL | INDA | Sell 50% of INDA position (reduce 2.50% → 1.25%) |
| BUY | XLE | Buy XLE — 6.25% of freed cash (adds 1.25% to portfolio) |
| BUY | URNM | Buy URNM — 6.25% of freed cash (adds 1.25% to portfolio) |
| BUY | XLK | Buy XLK — 25.00% of freed cash (adds 5.00% to portfolio) |
| BUY | SMH | Buy SMH — 12.50% of freed cash (adds 2.50% to portfolio) |
| BUY | PAVE | Buy PAVE — 25.00% of freed cash (adds 5.00% to portfolio) |
| BUY | XAR | Buy XAR — 12.50% of freed cash (adds 2.50% to portfolio) |
| BUY | MOO | Buy MOO — 12.50% of freed cash (adds 2.50% to portfolio) |
Current Portfolio After Trade
Combined holdings across all 4 active tranches. Each tranche is 25% of the portfolio.
| Ticker | % of Portfolio | Weight Bar |
|---|---|---|
| GLD | 20.00% | |
| XLU | 17.50% | |
| SGOV | 10.00% | |
| XLK | 7.50% | |
| ITA | 5.00% | |
| XLE | 5.00% | |
| URNM | 5.00% | |
| SMH | 5.00% | |
| PAVE | 5.00% | |
| BOTZ | 2.50% | |
| CIBR | 2.50% | |
| URA | 2.50% | |
| IEMG | 2.50% | |
| REMX | 2.50% | |
| XAR | 2.50% | |
| MOO | 2.50% | |
| INDA | 1.25% | |
| VEGI | 1.25% |
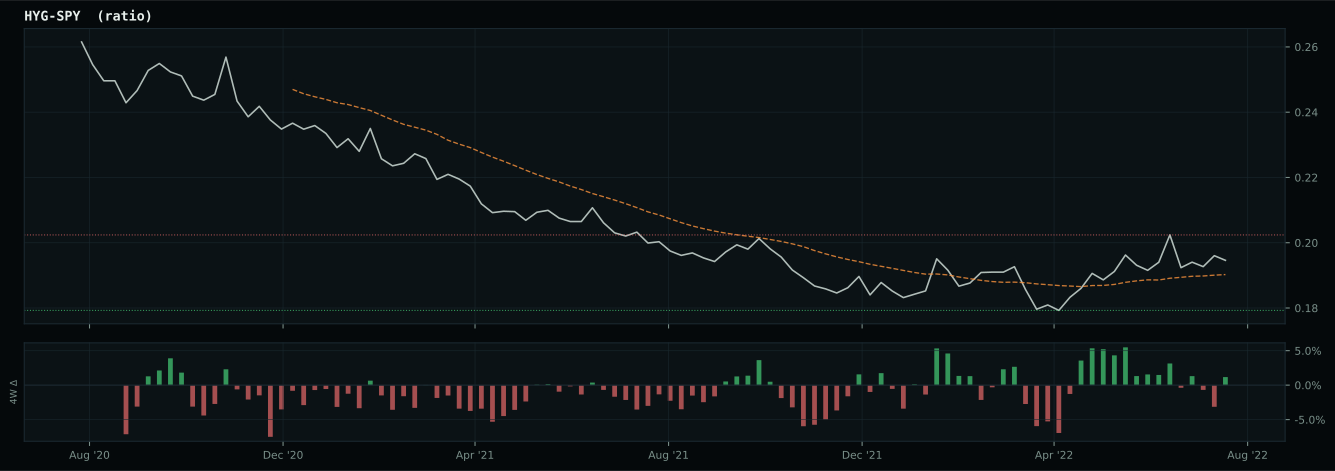
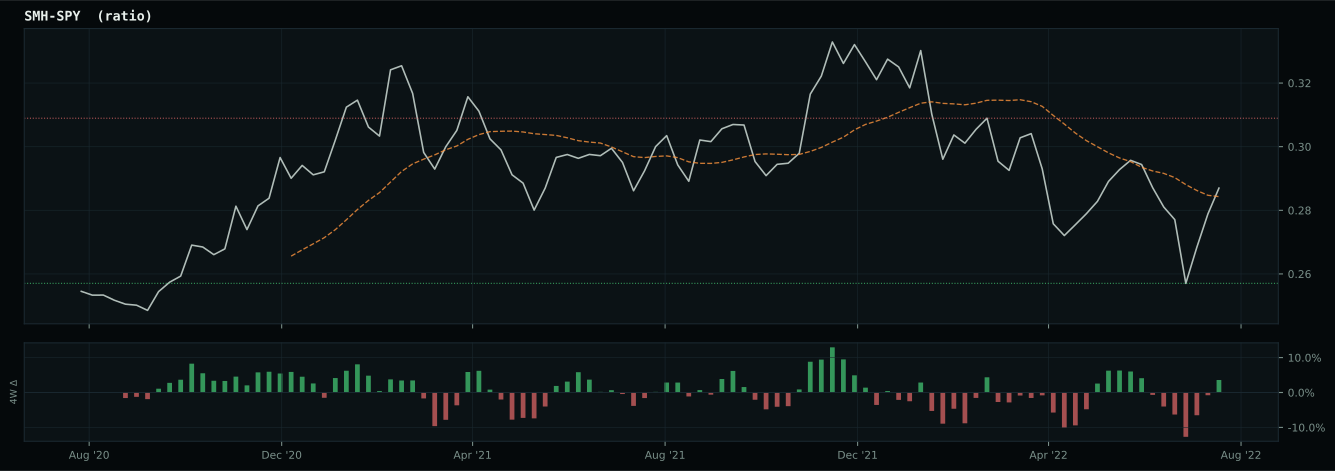
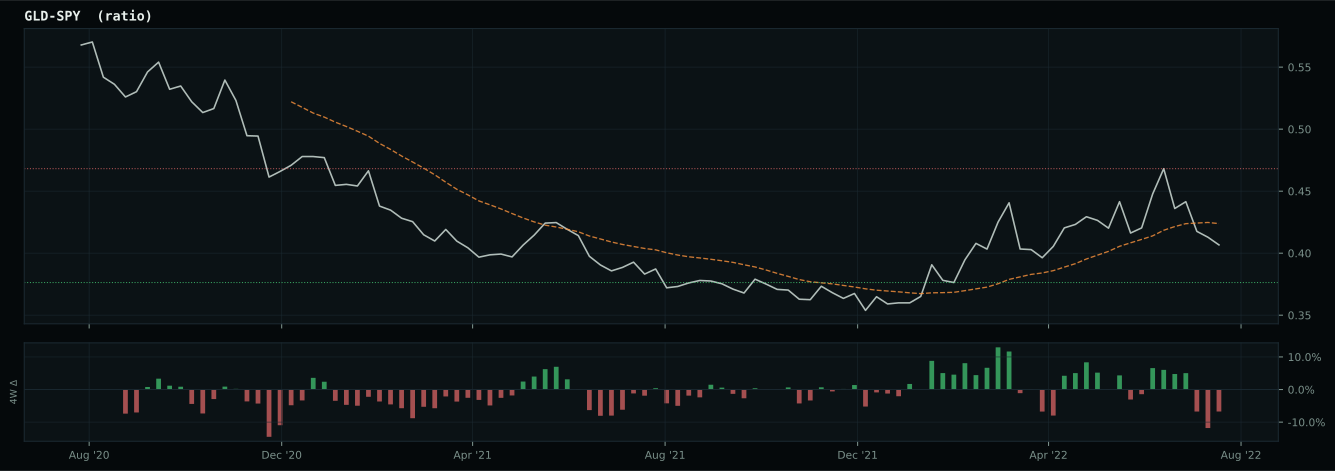
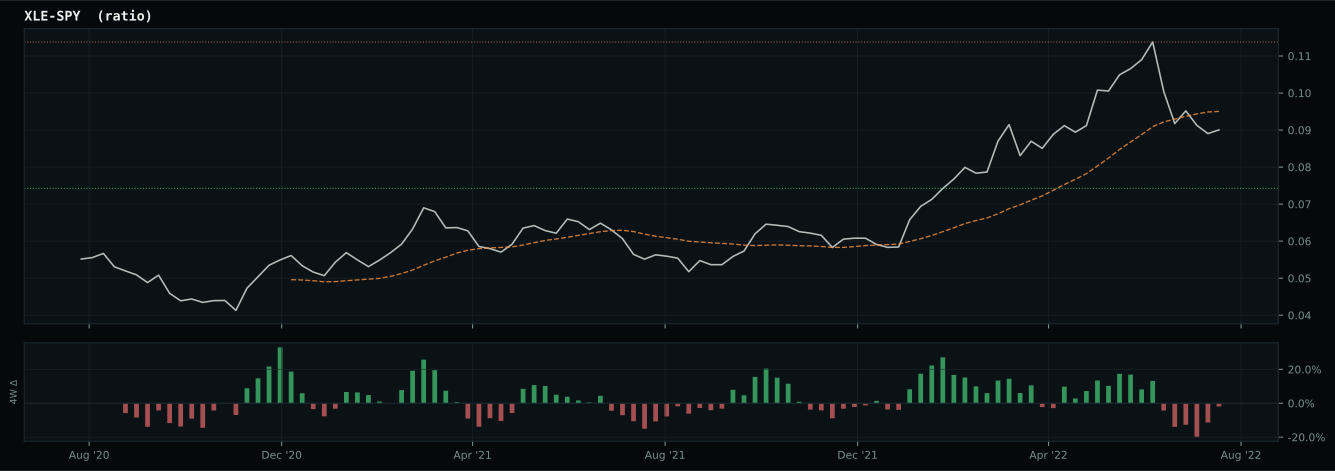
Macro Regime — Disinflation
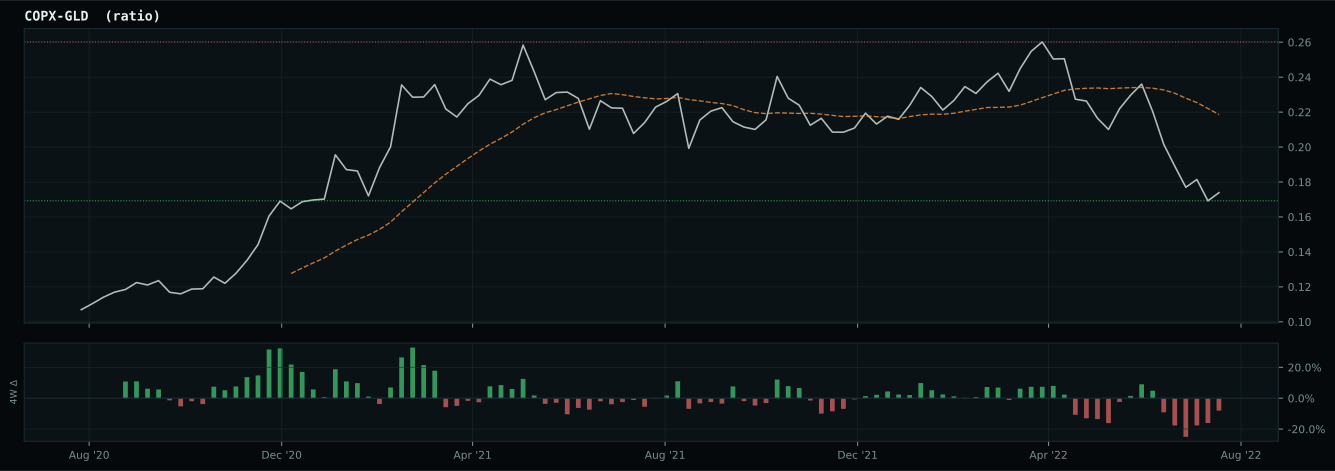
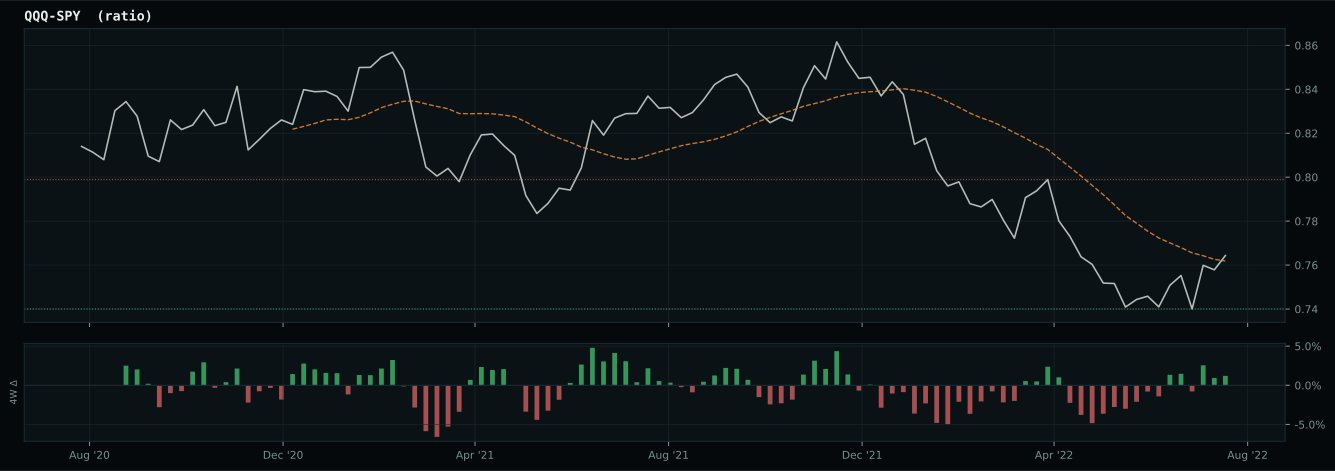
Macro Evidence Charts
Market-implied signals behind the macro regime scores. Each ratio compares two assets; the direction and slope of the ratio is what the macro engine reads.
Crypto Regime — NoCrypto
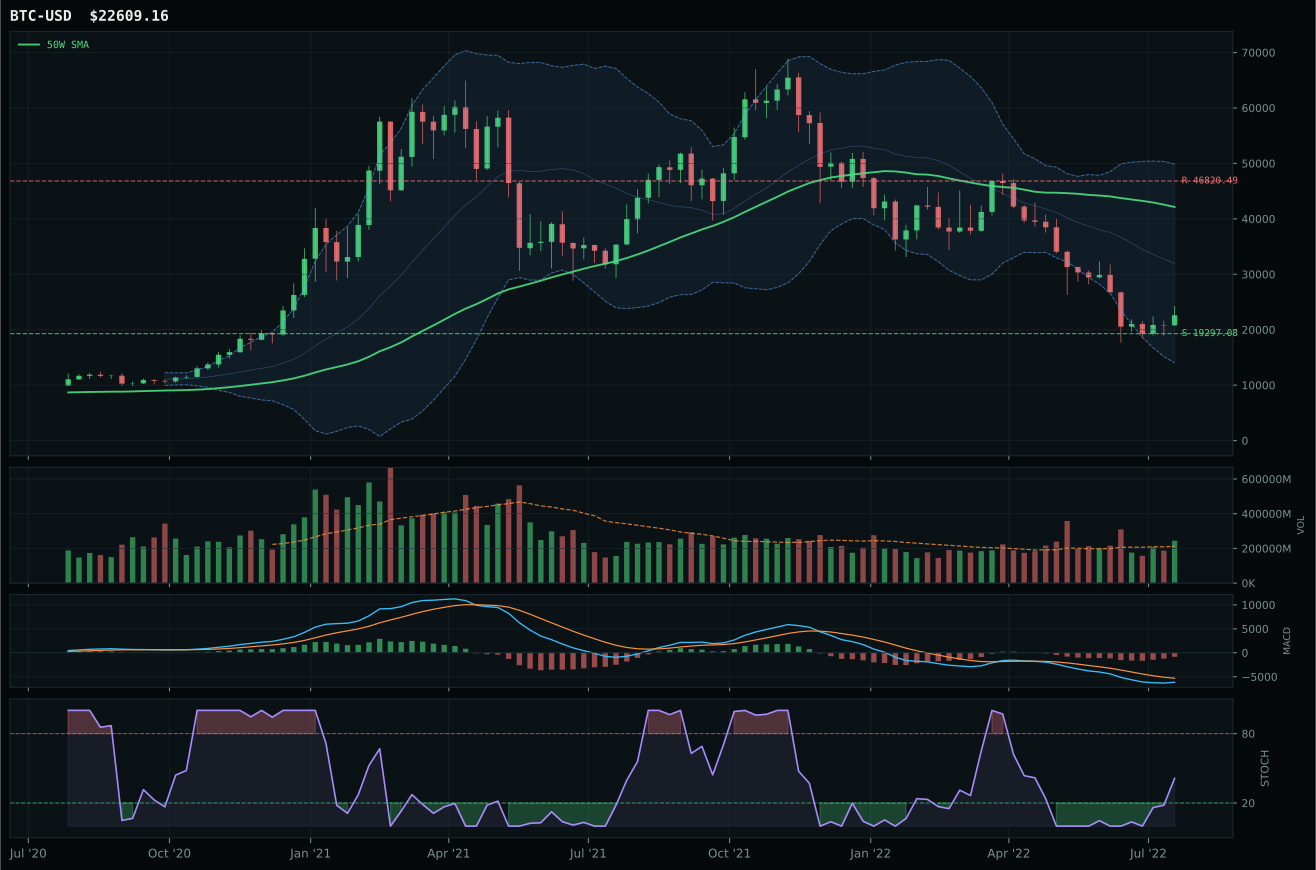
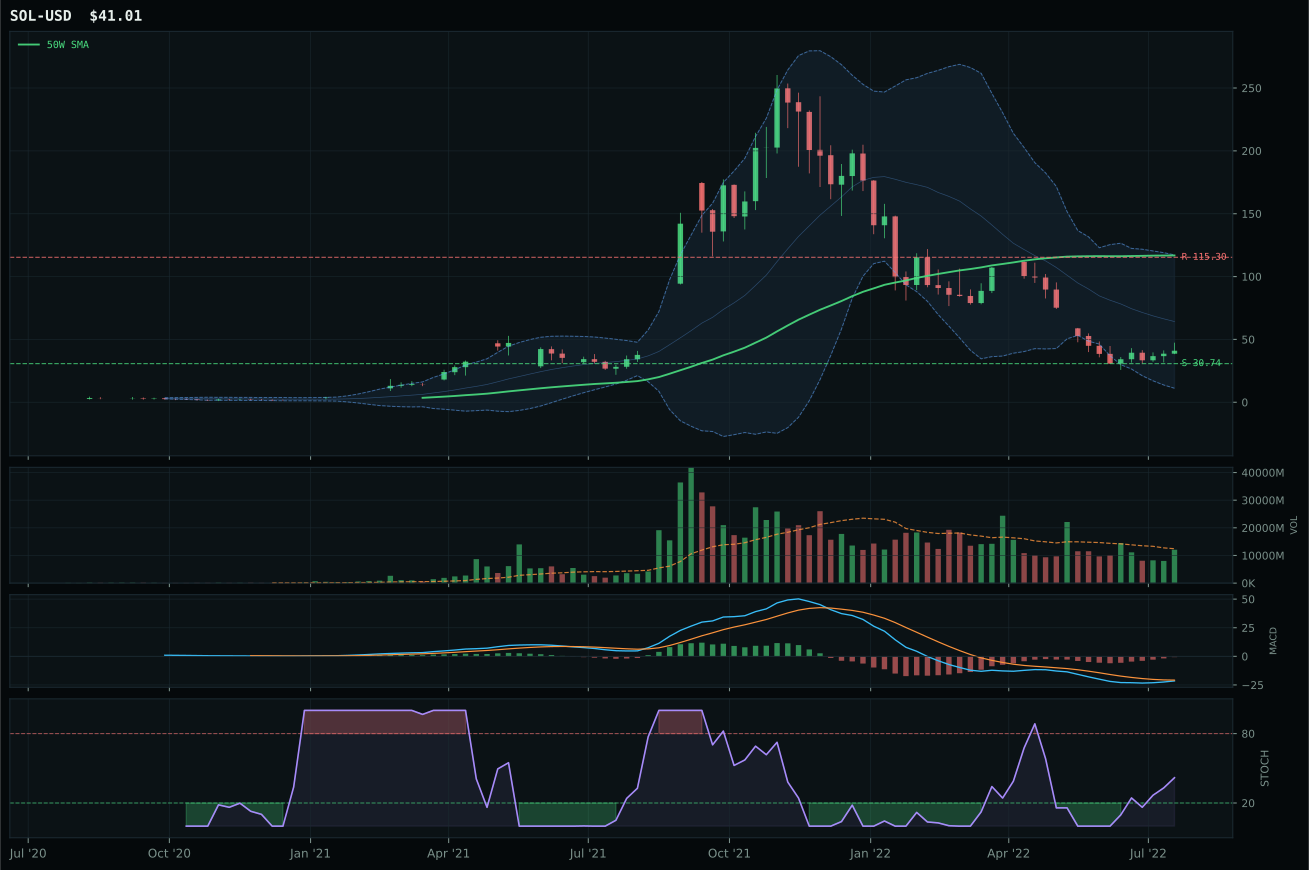
ValueBTC armed by first 200W buy-zone touch, but post-touch range age is 5 weeks; minimum is 12
TrendBTC not confirmed
one or more available conditions failed
Category Rankings
| Rank | Category | Winner | Score | Alloc | 4W Ret | Peers (4W) |
|---|---|---|---|---|---|---|
| 1 | Utilities & Infrastructure | PAVE | 59.5 | 20% | +10.77% | XLU +11.6% · IGF +4.4% |
| 2 | Technology | XLK | 50.0 | 20% | +6.51% | IGV +3.6% · CIBR +3.3% |
| 3 | Precious Metals | GLD | 47.3 | 10% | +0.63% | SLV +2.4% · GDX -1.4% |
| 4 | Defense & Aerospace | XAR | 44.4 | 10% | +5.27% | ITA +5.3% · ROKT +7.2% |
| 5 | AI | SMH | 41.4 | 10% | +2.25% | BOTZ +1.1% · AIQ +2.4% |
| 6 | Nuclear Energy | URNM | 36.7 | 10% | -1.00% | URA +0.2% · NLR +6.6% |
| 7 | Traditional Energy | XLE | 14.5 | 10% | +9.22% | FCG +13.3% · XOP +14.5% |
| 8 | Agriculture & Livestock | MOO | 8.7 | 10% | +4.68% | VEGI +8.8% · WEAT -2.5% |
| 9 | Emerging Markets | IEMG | 7.0 | 0% | +0.54% | INDA +4.8% · ILF +11.5% |
| 10 | Industrial Metals | REMX | 6.0 | 0% | +9.97% | PICK +5.8% · COPX +6.7% |
Utilities & Infrastructure — PAVE
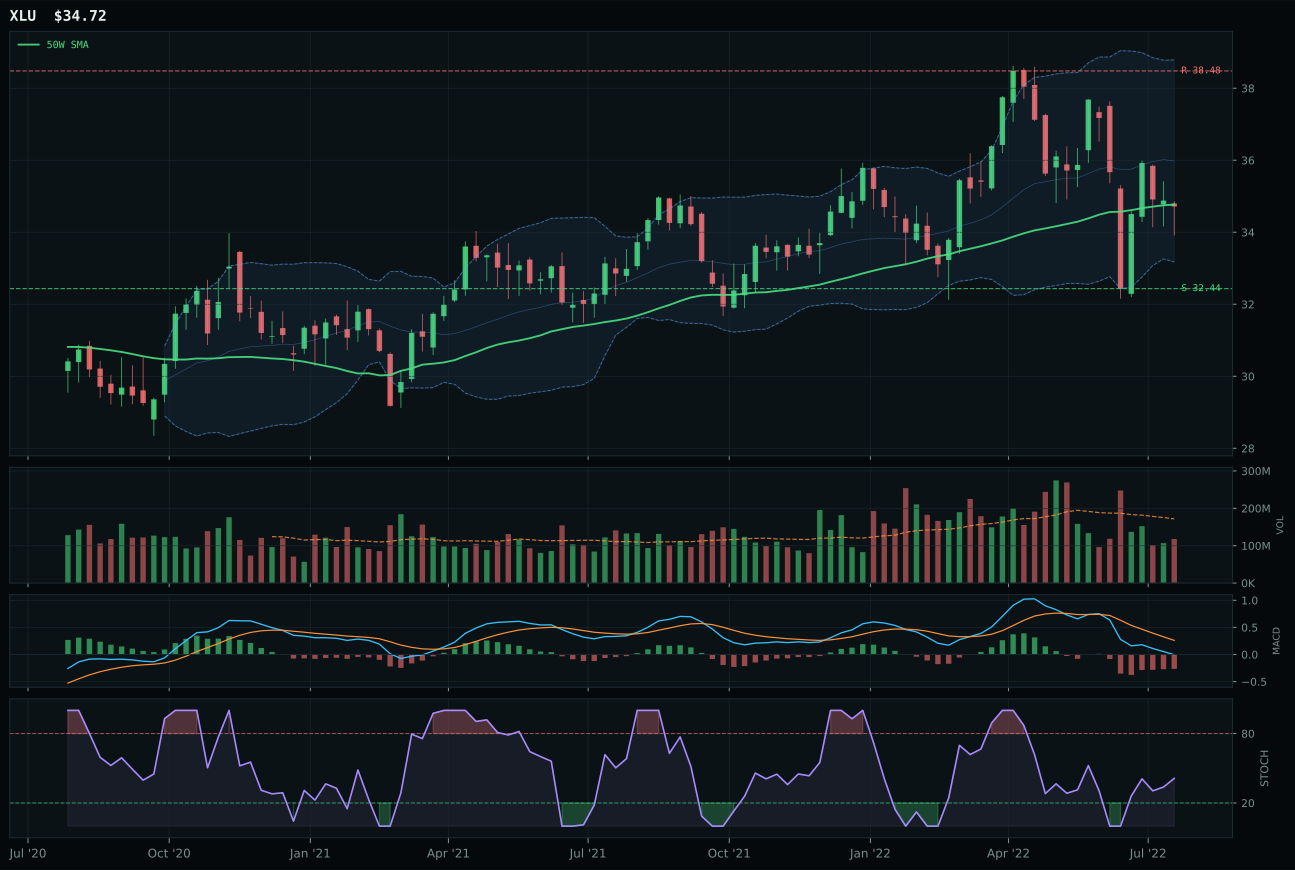
XLU has a compression near 50W profile with 0.8% 13-week relative strength versus SPY.
A failed hold above support would weaken the setup.
Actionable but governed by invalidation levels.
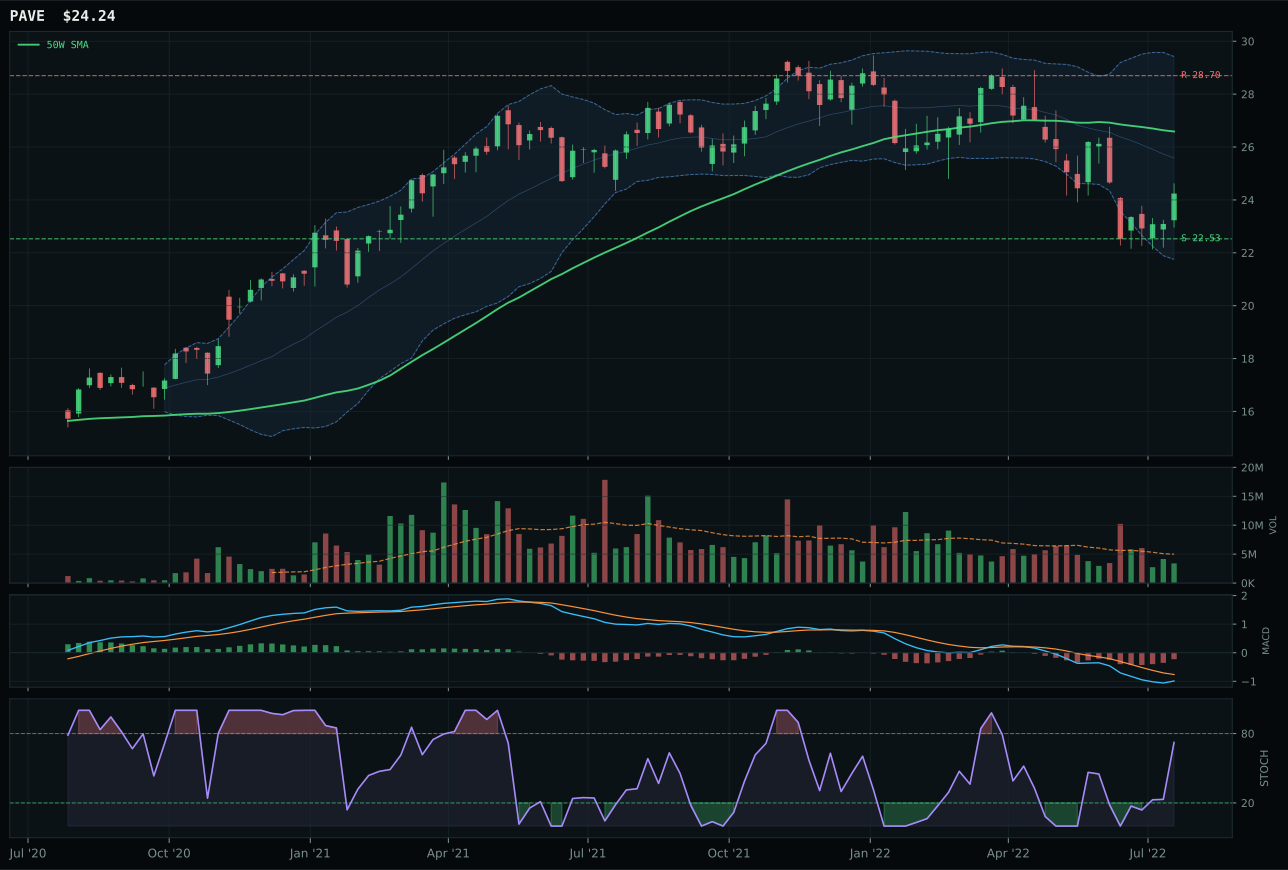
PAVE has a neutral structure profile with -3.1% 13-week relative strength versus SPY.
A failed hold above support would weaken the setup.
Actionable but governed by invalidation levels.
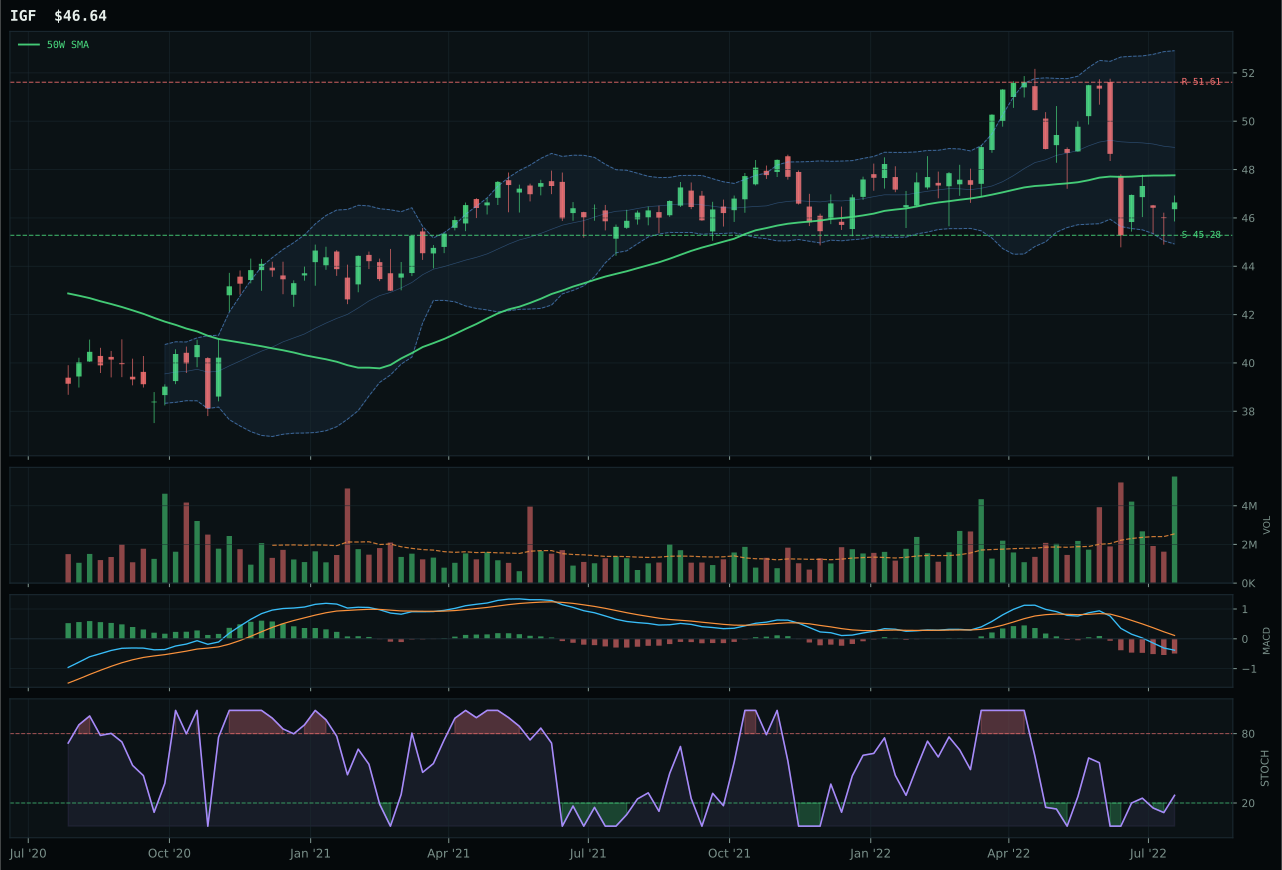
IGF has a pullback into support profile with -0.3% 13-week relative strength versus SPY.
A failed hold above support would weaken the setup.
Actionable but governed by invalidation levels.
PAVE captured the infrastructure allocation despite XLU's superior technical evidence (71.6 vs 36.3) and macro fit (72.0 vs 44.0) because the allocator correctly identified that XLU had already reflected most of the defensive rotation bid and stood at higher risk of reversal, while PAVE offered fresh entry timing with superior risk-reward and deeper pullback support. PAVE's risk-reward of 89.8 versus XLU's 78.0 and PAVE's -8.8% distance from the 50-week moving average versus XLU's compression near the 50W established a material timing advantage: every defensive buyer had already claimed XLU while PAVE's pullback created fresh entry discipline. XLU's trend score of 79.0 and momentum of 45.0 reflected already-rallied conditions from lower levels; PAVE at 53.0 and 35.0 respectively meant buyers had not yet arrived, positioning it to capture the next wave of defensive rotation. IGF's exceptional risk-reward of 100.0 and pullback-into-support structure appeared attractive but its 44.0 macro fit lagged PAVE's 44.0 (tie), and its timing score identical to PAVE at 100 meant superior structure alone was insufficient to overcome PAVE's category-relative strength of -2.8% versus IGF's flat 0.0%.
Utilities & Infrastructure earned the top-2 allocation of 20% because category-level macro fit of 80.0 out of 100 combined with PAVE's superior entry timing and risk-reward asymmetry created the most defensible allocation among non-technology baskets. Defensive rotation of +12 points, disinflation pressure of +6 points, and broad market bear of +4 points delivered +22 points of macro tailwinds that elevated the entire category to equal standing with Technology despite weaker absolute technical evidence. PAVE's timing score of 90.0 and risk-reward of 89.8 meant the infrastructure narrative was backed by a clean pullback setup with defined support at 22.53 and measurable downside protection of 7.6%—the sort of asymmetry that rewards patience in a bear market. The allocator accepted PAVE's 36.3 technical evidence score because macro conditions were so favorable that technical weakness became a feature rather than a bug; a weaker setup meant wider allocations could enter as the position proved out, and every bounce that stabilized above support would pull in new money. PAVE's -10.3% thirteen-week return and -3.1% SPY-relative weakness positioned it perfectly to capture the flow of capital rotating away from growth toward infrastructure capex and dividend plays, making 20% allocation the appropriate level for a category providing both defensive characteristics and cyclical upside.
Technology — XLK
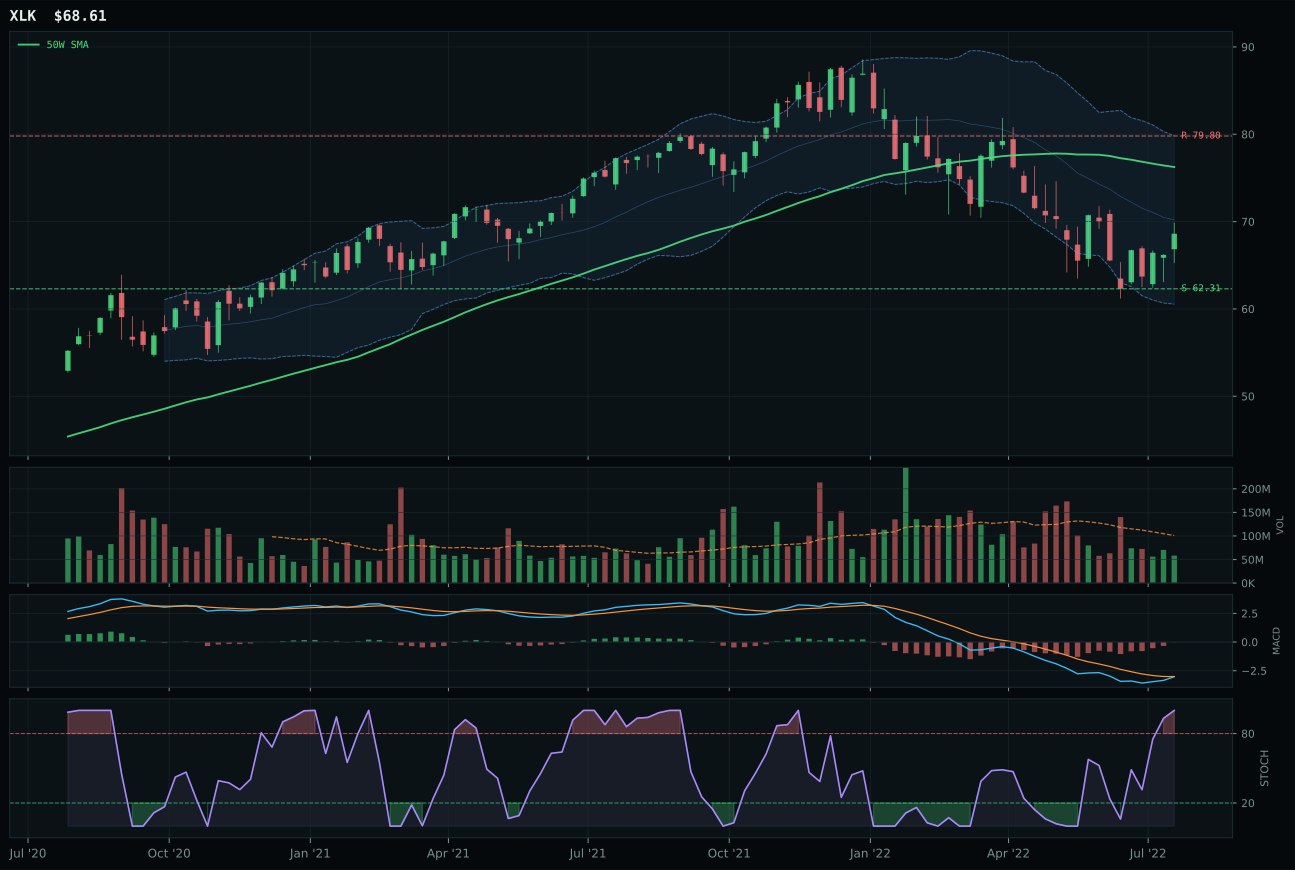
XLK has a neutral structure profile with 3.2% 13-week relative strength versus SPY.
A failed hold above support would weaken the setup.
Actionable but governed by invalidation levels.
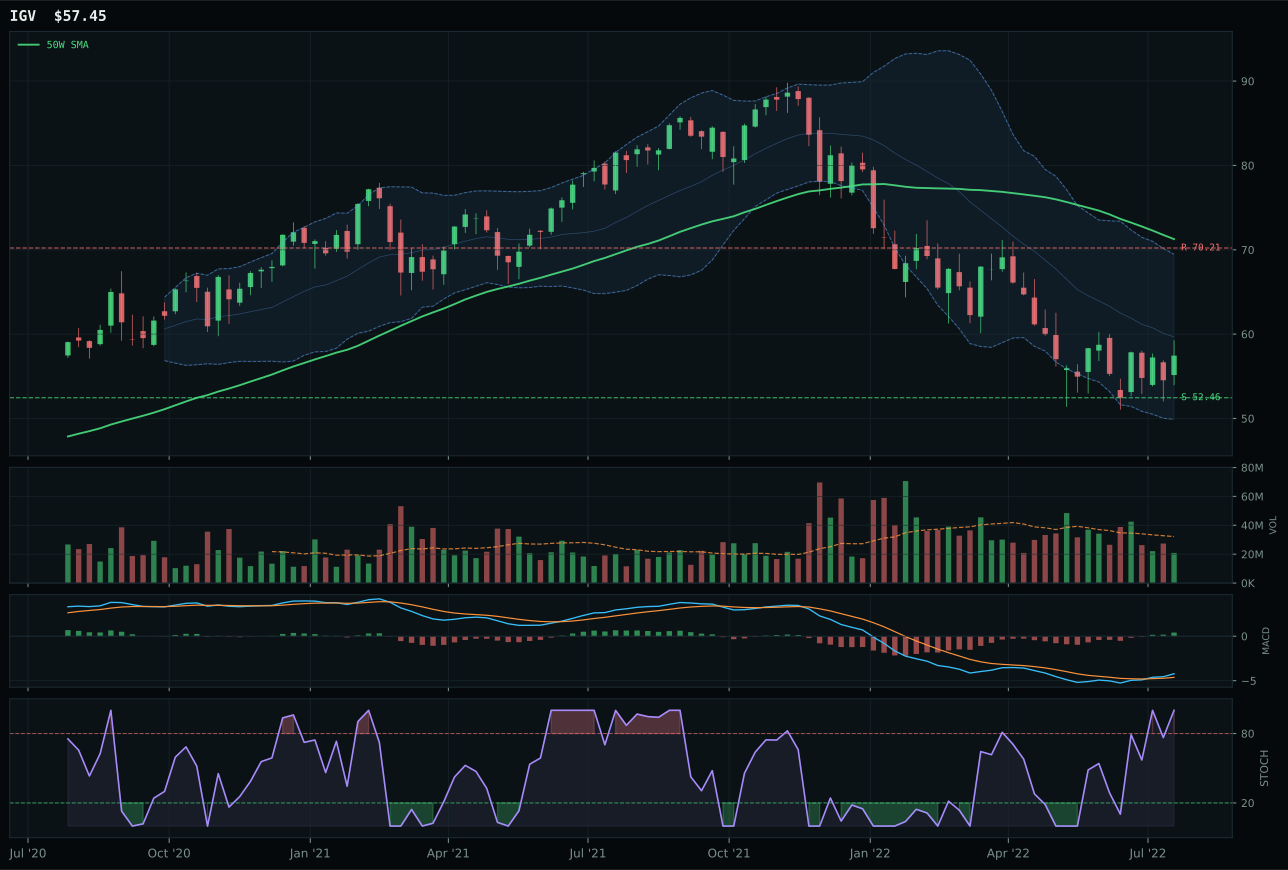
IGV has a neutral structure profile with 1.2% 13-week relative strength versus SPY.
A failed hold above support would weaken the setup.
Actionable but governed by invalidation levels.
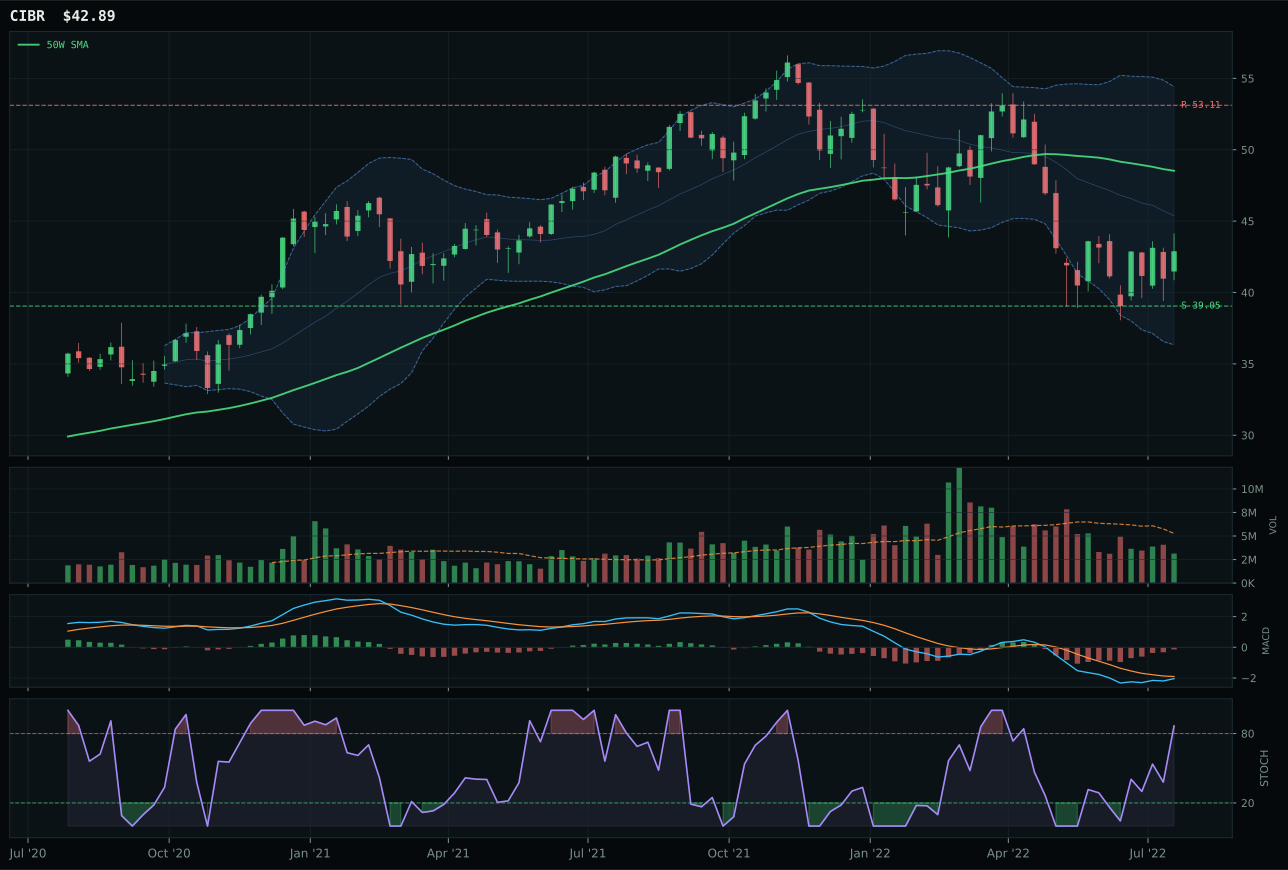
CIBR has a neutral structure profile with -5.2% 13-week relative strength versus SPY.
A failed hold above support would weaken the setup.
Actionable but governed by invalidation levels.
XLK secured the top slot over IGV and CIBR by delivering the strongest risk-adjusted technical setup in a disinflation environment. The 3.2% relative strength versus SPY and 2.0% edge within the category basket established clear peer leadership, while the -10.0% pullback from the 50-week moving average positioned price in a deep value zone near the 0.786 Fibonacci retracement without requiring new money to chase an extended move. IGV's weaker timing score of 55 versus XLK's 62 and inferior risk-reward ratio of 64.4 versus 78.0 reflected its position above the pullback zone; critically, its -6.1% thirteen-week return and zero category-relative strength meant the market showed no preference for enterprise software durability despite bullish MACD alignment. CIBR collapsed entirely with -12.4% thirteen-week performance and -5.2% SPY-relative weakness, leaving only the nominal 88.0 risk-reward ratio as a red herring given the absence of accumulation at lower prices.
Technology earned its place among the top-two allocations at 20% because the macro regime of disinflation directly supports profitable, cash-generative technology franchises while AI growth sponsorship remains active despite liquidity stress headwinds. The category's 53.0 macro fit score reflects disinflation tailwinds of +7 points offset by liquidity stress of -10 points, but the +6 boost from AI growth sponsorship tilts the balance toward holding rather than reducing. XLK's technical evidence of 58.4 out of 100 combines improved MACD momentum with oversold stochastic RSI conditions and thin participation—all markers of institutional accumulation rather than retail panic selling. The setup's asymmetry favors patient buyers: downside support sits 10.1% away while upside resistance lies 14.0% distant, yet the cost of entering the pullback is half the potential three-month recovery if MACD follows through on its improving trajectory.
Precious Metals — GLD
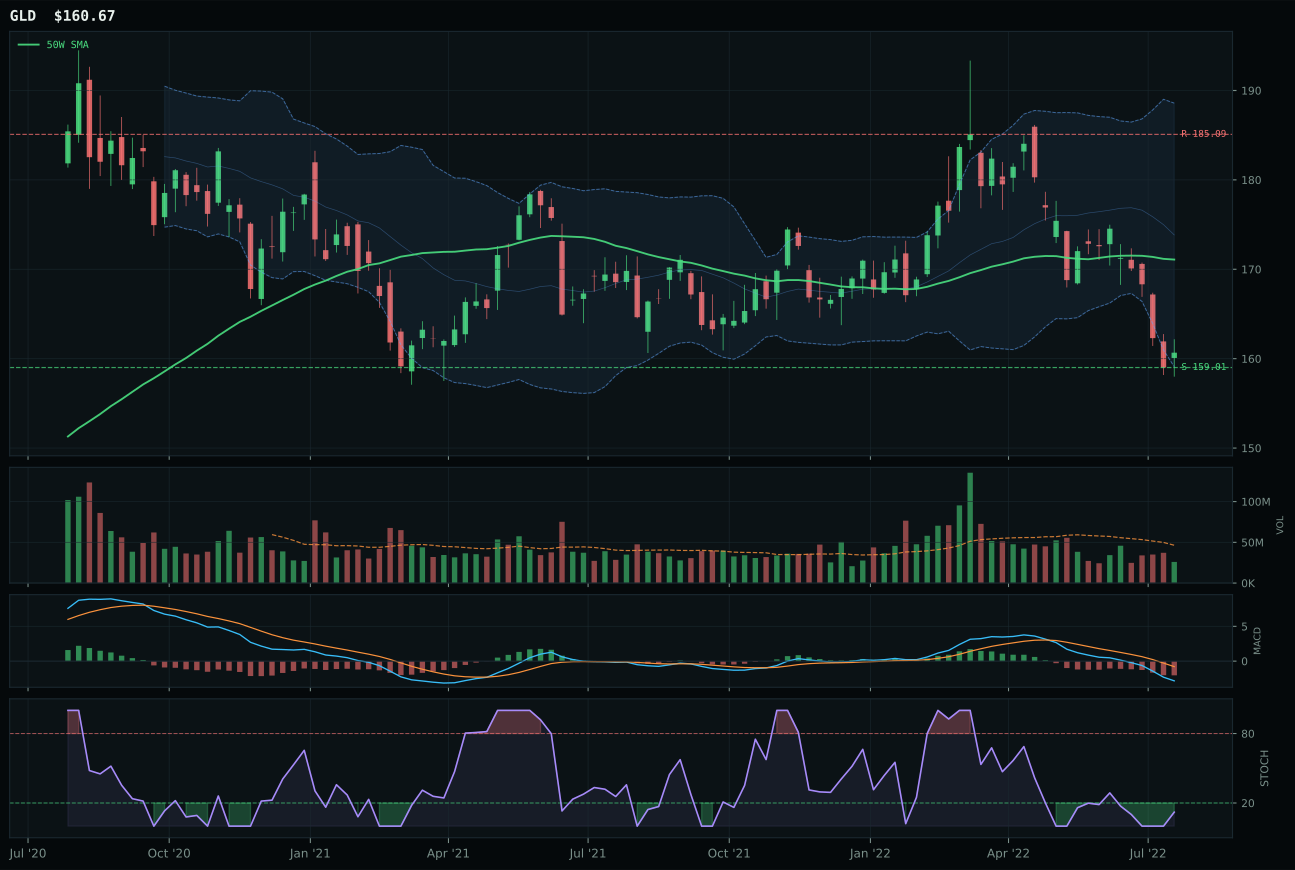
GLD has a pullback into support profile with -3.6% 13-week relative strength versus SPY.
A failed hold above support would weaken the setup.
Actionable but governed by invalidation levels.
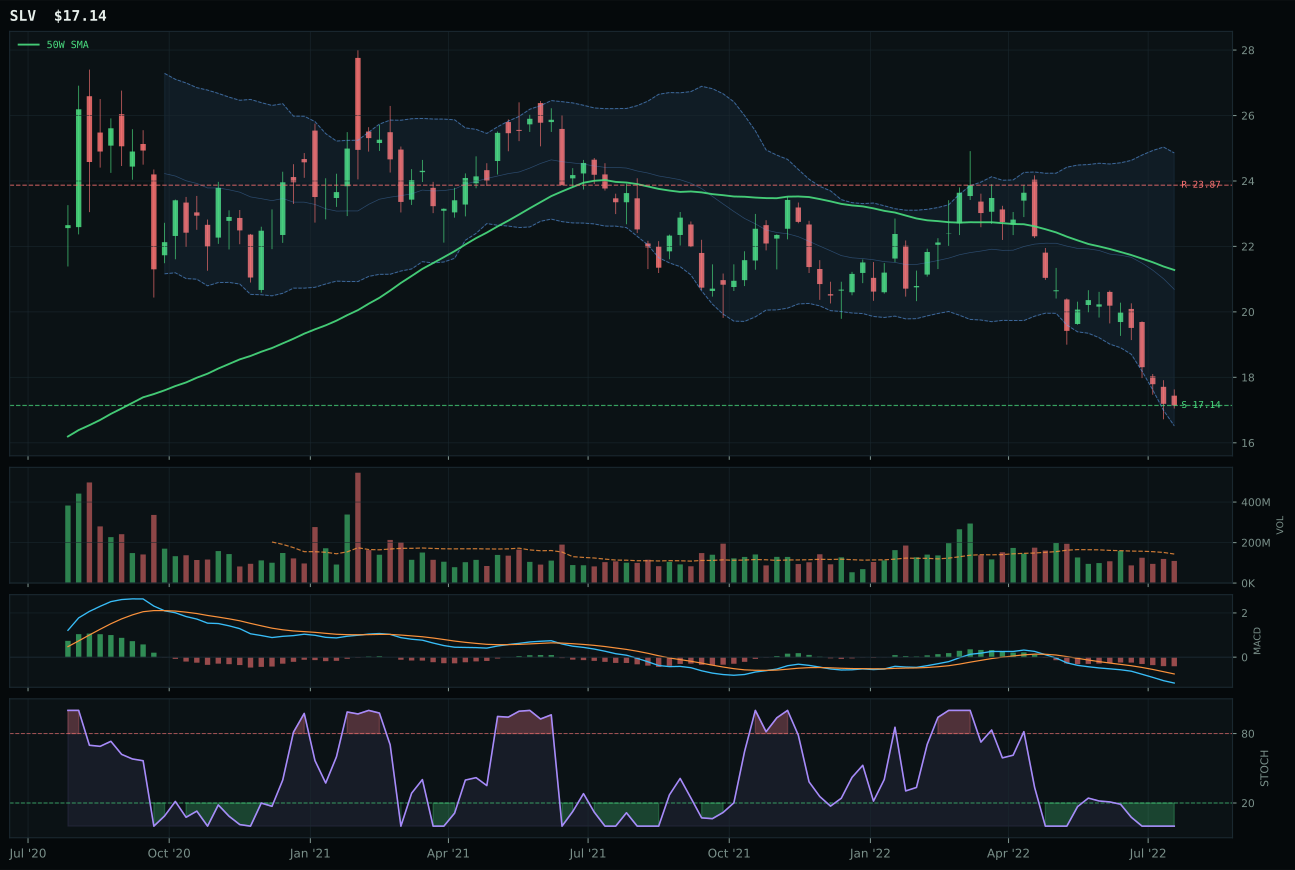
SLV has a pullback into support profile with -15.9% 13-week relative strength versus SPY.
A failed hold above support would weaken the setup.
Actionable but governed by invalidation levels.
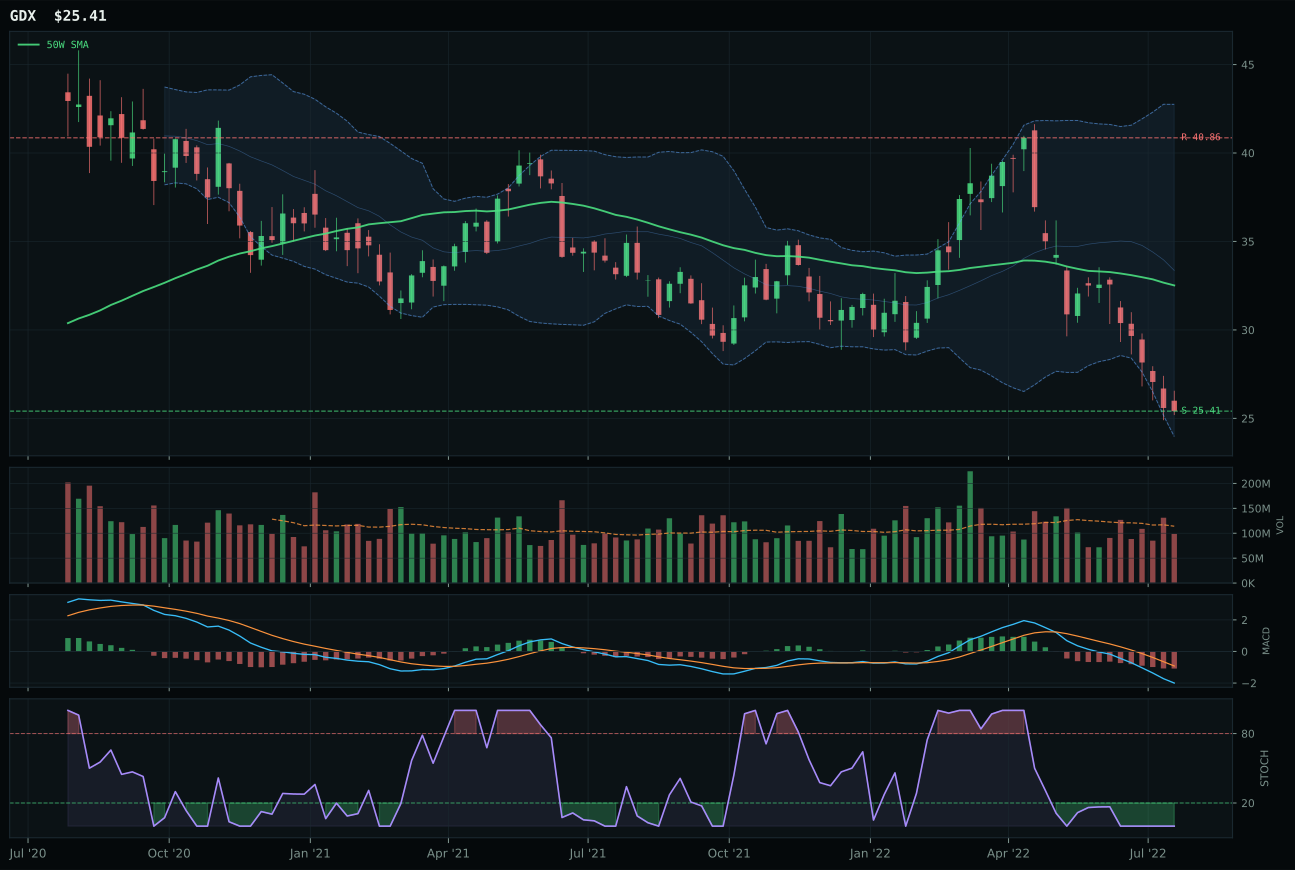
GDX has a pullback into support profile with -23.9% 13-week relative strength versus SPY.
A failed hold above support would weaken the setup.
Actionable but governed by invalidation levels.
GLD defeated SLV decisively on timing, structure, and category-relative strength that revealed gold's emergence as the clean monetary hedge while silver remained tethered to industrial demand uncertainty. GLD's timing score of 94.0 versus SLV's 60.0 reflected the critical difference: stochastic RSI was turning up from oversold at 0.12 for GLD while SLV sat deeper oversold with no turn yet visible, and MACD weakness was easing for GLD while still deteriorating for SLV. Structure scores of 66.0 versus 58.9 favored GLD's cleaner pullback into support near 159.01, and category-relative strength of 12.3% for GLD versus zero for SLV meant gold was being accumulated relative to the basket while silver was not. The -10.9% thirteen-week return in GLD appeared weak until contextualized against -23.2% for SLV, making gold the clear relative strength leader and the beneficiary of duration-hedge and monetary-policy-uncertainty flows that disinflation-regime investors sought.
Precious Metals earned 10% allocation driven almost entirely by macro fit of 80.0 out of 100—a rare category where macro positioning (+14 from monetary hedge bid, +8 from disinflation pressure, +6 from defensive rotation) heavily outweighed technical evidence of just 39.7. The portfolio recognized that GLD's weak technical setup (39.7 technical evidence, 33.1 persistence, 36.2 volume-price confirmation) was subordinate to its role as the portfolio's monetary-policy hedge in a disinflation, broad-market-bear regime where real rates could remain elevated and growth volatility could spike. GLD's 47.3 category score ranked above several higher-conviction technicals, confirming the allocator's macro-first discipline: even weak technicals can earn 10% if macro tailwinds are strong enough and downside is capped by defined support. The setup was defensive and conditional—downside protection near 159.01 was required, and any break below that level would force a reassessment—but the cost of being wrong on monetary safe-haven demand exceeded the cost of entering a pullback with poor momentum confirmation.
Defense & Aerospace — XAR
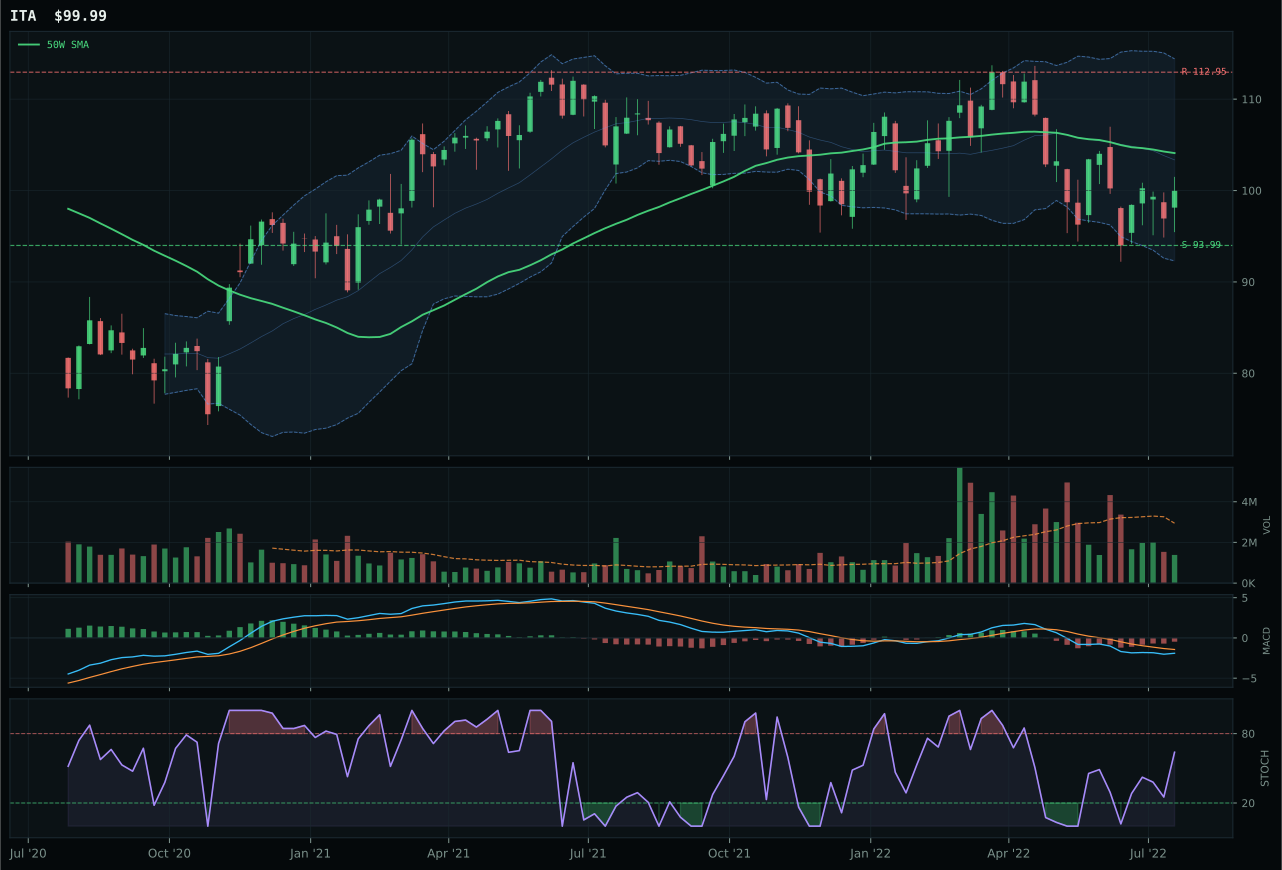
ITA has a neutral structure profile with -0.4% 13-week relative strength versus SPY.
A failed hold above support would weaken the setup.
Actionable but governed by invalidation levels.
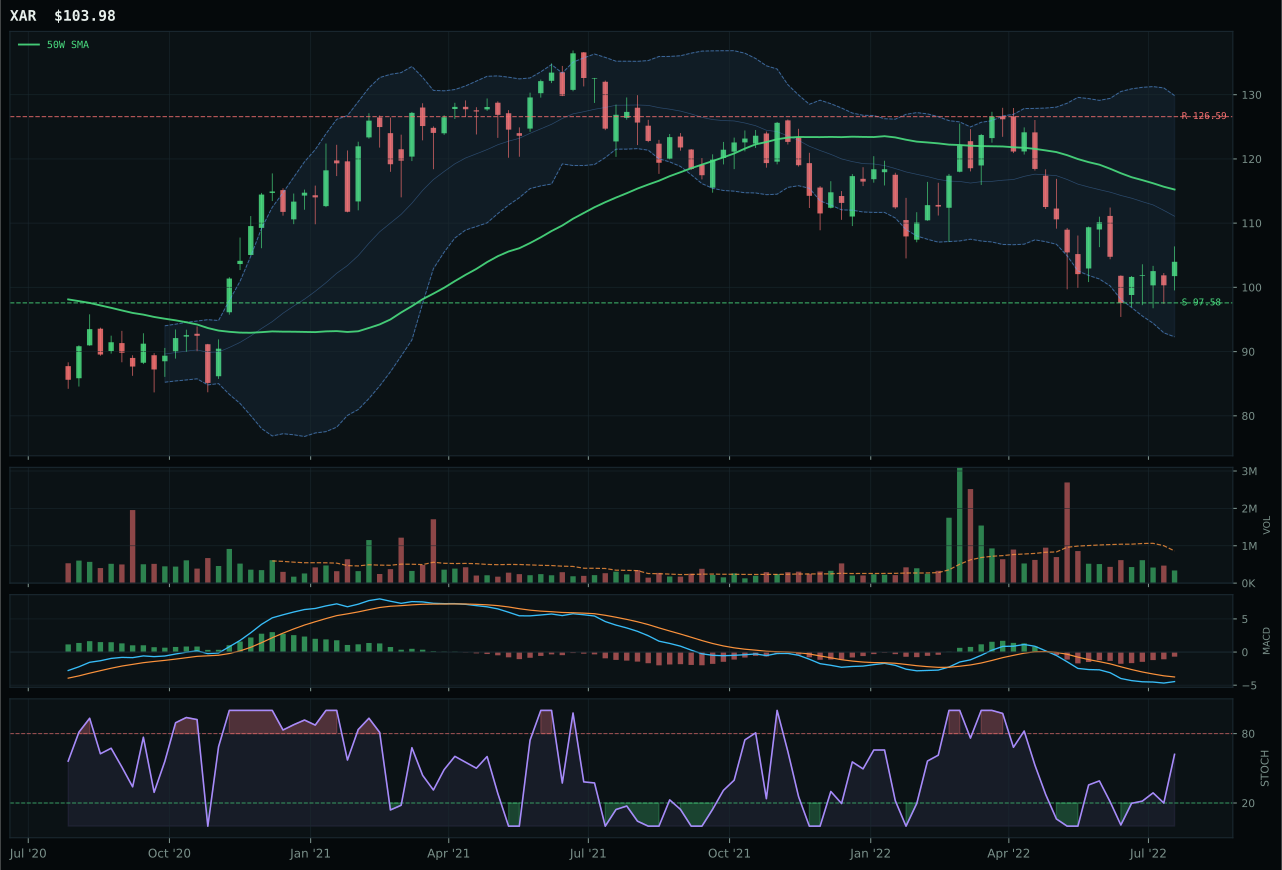
XAR has a neutral structure profile with -4.9% 13-week relative strength versus SPY.
A failed hold above support would weaken the setup.
Actionable but governed by invalidation levels.
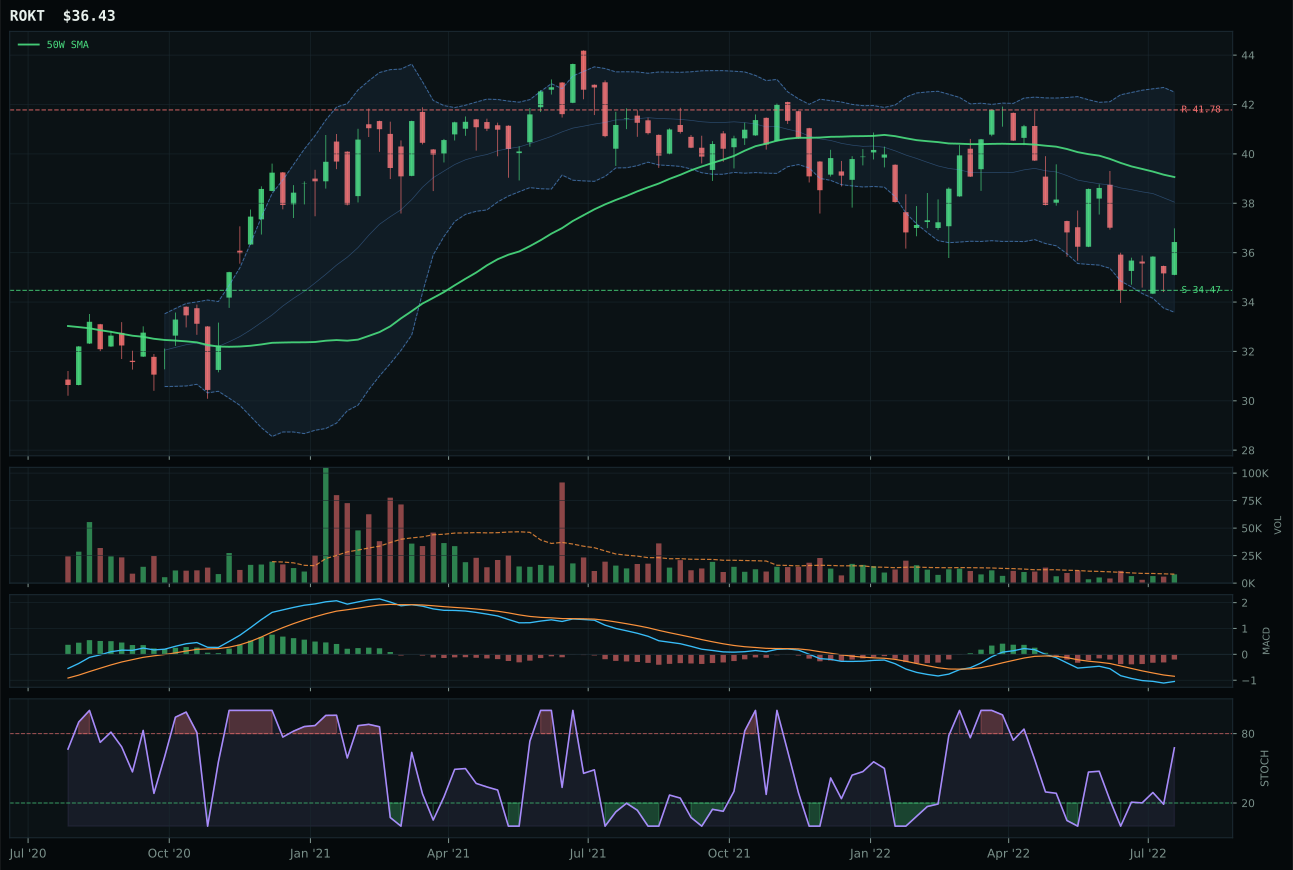
ROKT has a neutral structure profile with -1.0% 13-week relative strength versus SPY.
A failed hold above support would weaken the setup.
Tracked, but not top-2 eligible because: .
XAR took the category despite being the weaker technical entry point, winning on the strength of its superior risk-reward profile and the cleanest defensive narrative in a bear market. At a risk-reward score of 98.0 versus ITA's 85.3, XAR offered nearly seven cents of downside protection for every dollar of upside—a meaningful edge when broad market bear is active. The -4.9% thirteen-week SPY-relative weakness in XAR versus ITA's -0.4% suggested XAR had already repudiated much of its bear-market hopes and reset closer to genuine liquidation levels, placing support just 6.6% away while ITA needed more selling to reach equivalent capitulation. ITA's -7.7% thirteen-week return and timing score of 100 created a paradox: the superior macro fit from defensive rotation (+7), broad market bear (+6), and dollar pressure (+3) boosted ITA's reasoning score to 61.0, but the forward-looking allocator selected XAR because its 31.1 technical evidence score flagged diminished confidence beneath the attractive risk-reward math.
Defense & Aerospace earned only 10% allocation despite its defensive narrative fit because the category's technical evidence deteriorated faster than macro tailwinds could support. Category-level macro fit of 66.0 out of 100 and defensive rotation of +8 points appeared constructive, yet XAR's 25.9 momentum confirmation and 37.0 persistence scores revealed that the technical setup lacked conviction beneath the surface—the MACD and relative strength improvements were marginal, and volume participation at just 0.39 times the twenty-week average signaled fear-driven selling rather than accumulation. The category's 44.4 final score ranked below Technology and Utilities, and the allocator correctly penalized a defensive exposure that only looked good when forced into this bear. Forward conditions would require stochastic RSI to turn decisively upward and volume to shift from thin participation toward accumulation—either one would be enough to push this to 20%, but neither has occurred yet.
AI — SMH
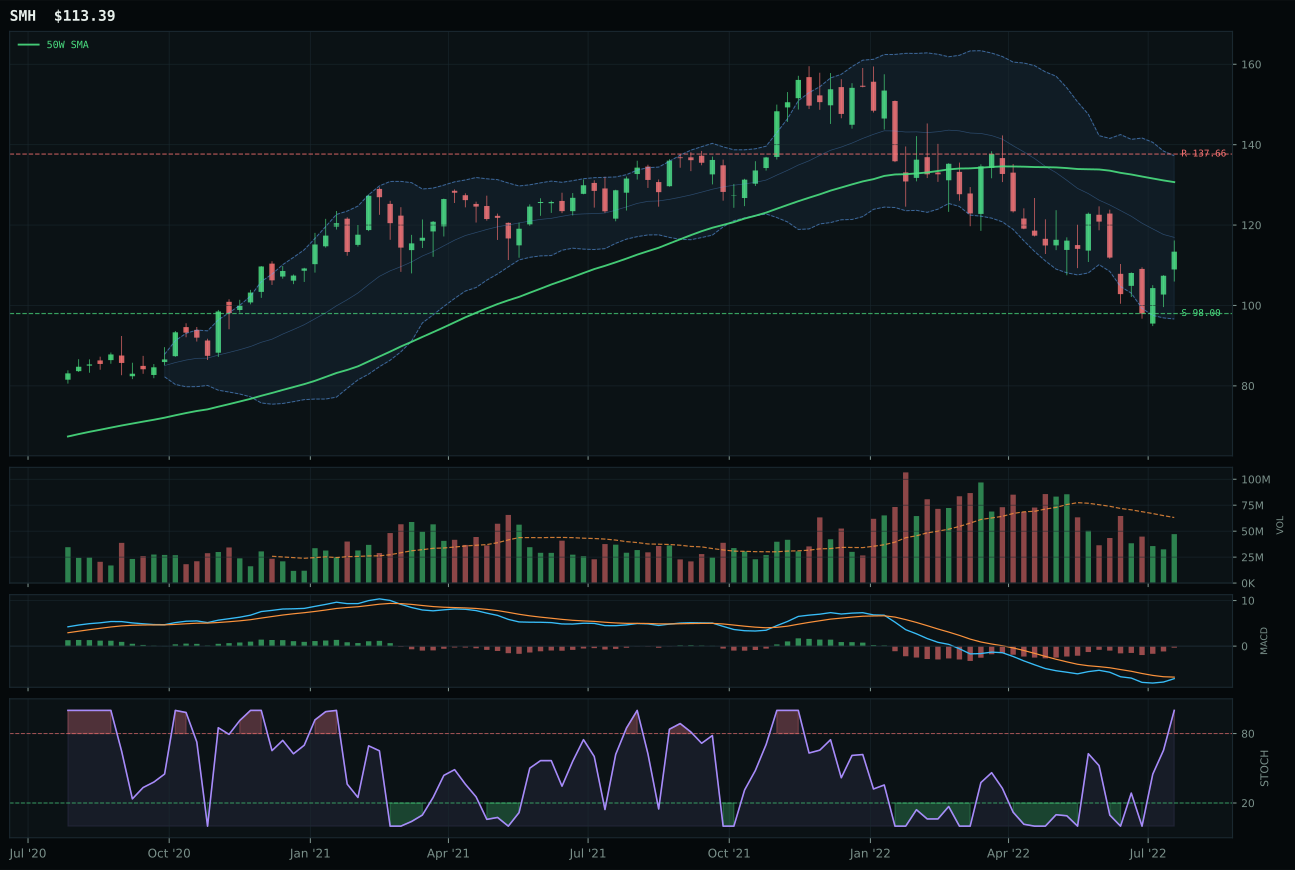
SMH has a neutral structure profile with 3.9% 13-week relative strength versus SPY.
A failed hold above support would weaken the setup.
Actionable but governed by invalidation levels.
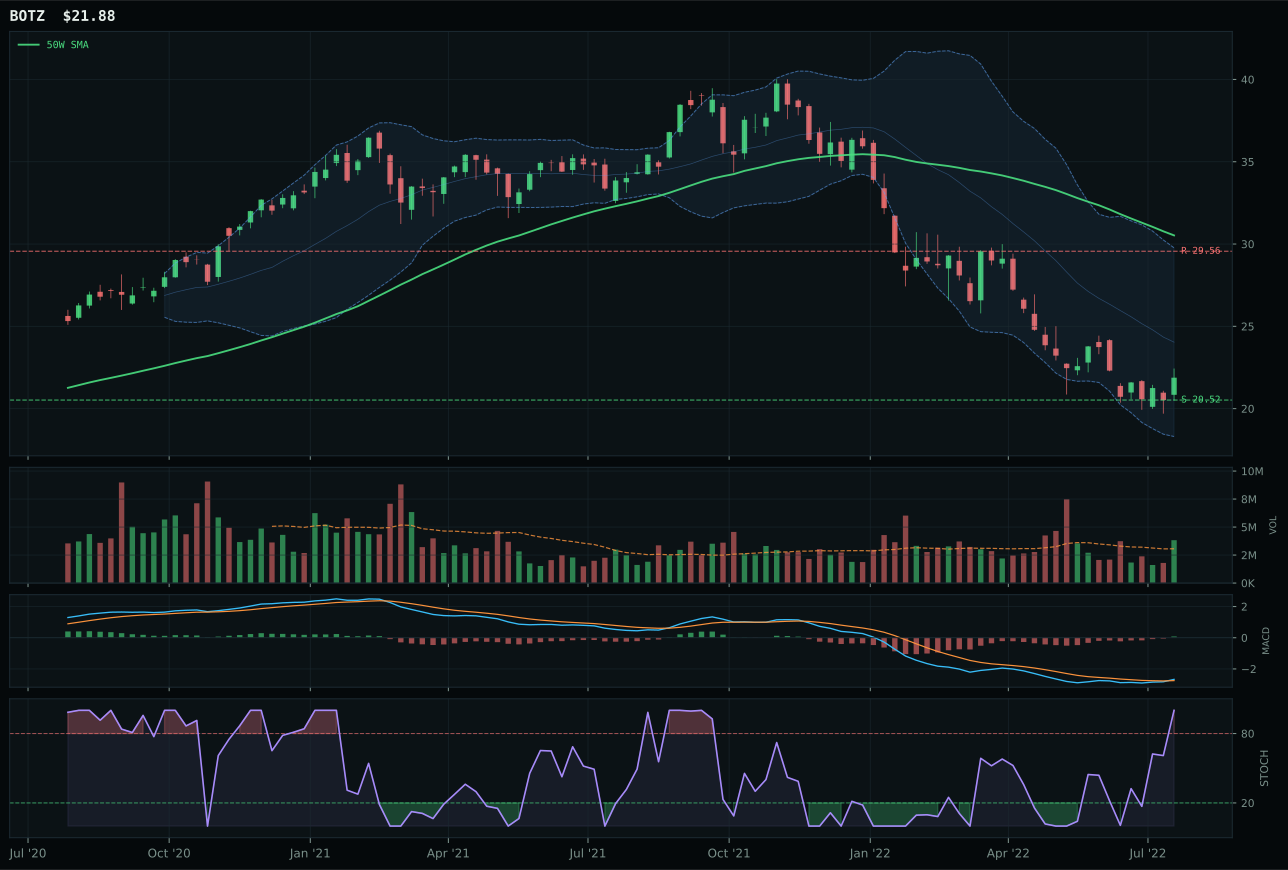
BOTZ has a neutral structure profile with -4.5% 13-week relative strength versus SPY.
A failed hold above support would weaken the setup.
Actionable but governed by invalidation levels.
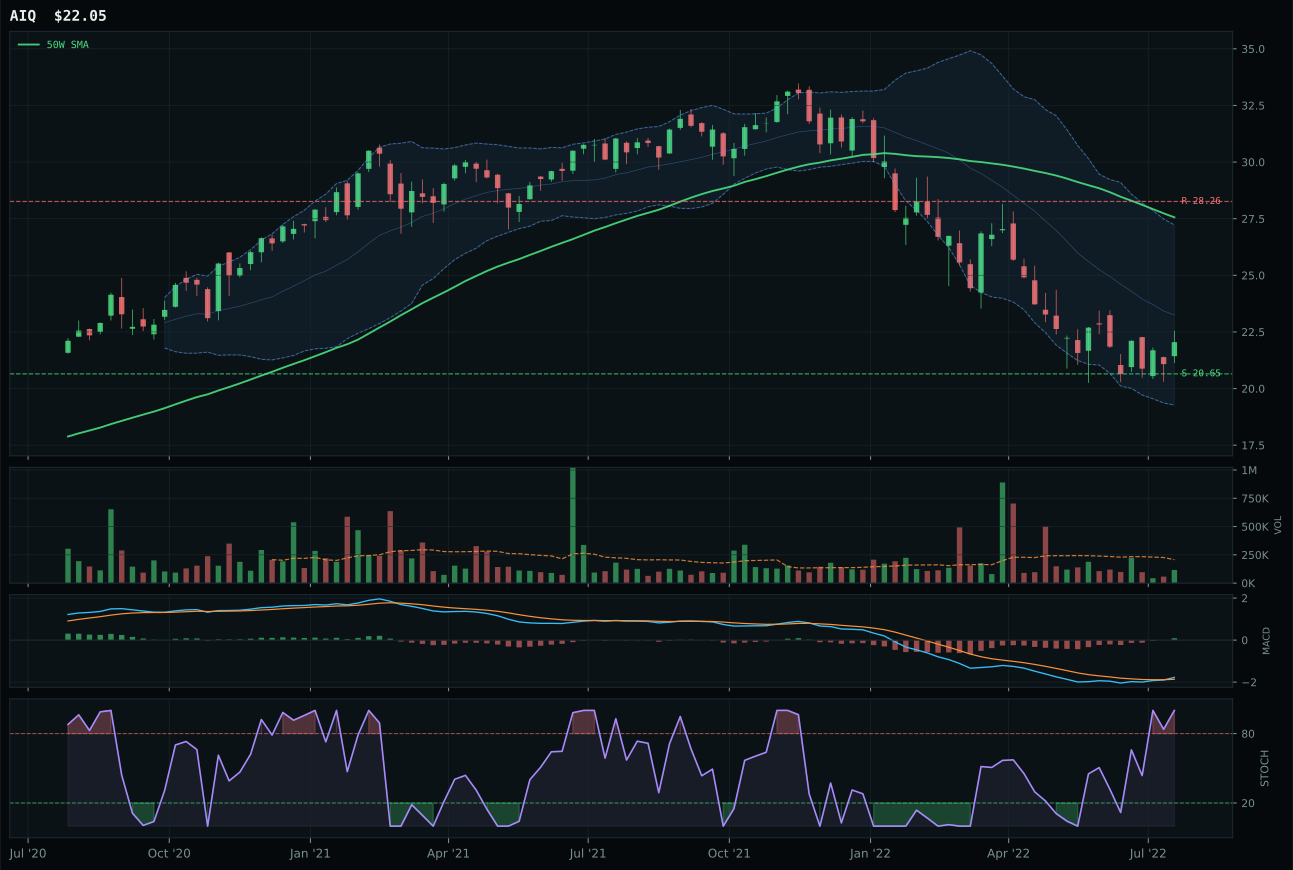
AIQ has a neutral structure profile with 0.2% 13-week relative strength versus SPY.
A failed hold above support would weaken the setup.
Tracked, but not top-2 eligible because: .
SMH defeated BOTZ and AIQ through superior relative strength inside the semiconductor-to-robotics basket and more favorable price-action timing near genuine support. The +3.9% thirteen-week relative strength versus SPY and +3.6% category-relative performance revealed consistent buyer participation in AI-chip exposure, a sharp contrast to BOTZ's -4.5% SPY-relative weakness and -4.7% category underperformance despite coming from higher participation volume. SMH's -13.2% distance from the 50-week moving average placed price in deep retracement territory with defined support at 98.00, while BOTZ at -0.5% distance had already tested support once and lacked the fresh setup that draws accumulation. The timing differential was decisive: SMH's rising stochastic RSI from oversold conditions flagged a potential inflection point, while BOTZ's bullish-improving MACD existed inside a severely damaged thirteen-week return of -11.7%, signaling macro deterioration beneath any technical relief.
AI held a 10% slot rather than scaling to 20% because its technical evidence of 50.8 out of 100 fails to compensate for macro headwinds that carry real teeth in a disinflation regime marked by broad market bear conditions and liquidity stress. The category's 45.0 macro fit score benefited from +14 points of AI growth sponsorship but suffered -12 points of liquidity stress and -8 points of broad market bear pressure, leaving a net negative macro environment despite the sector's structural narrative. SMH's momentum confirmation score of 64.8 was strong yet persistence and volume-price confirmation lagged at 49.5 and 56.4 respectively, meaning the four-week bounce (+4.9%) has not been confirmed by sustained accumulation or meaningful volume recovery. The allocation acknowledges that AI leadership is real but premature: holding 10% honors the relative strength while refusing to over-commit capital to a setup where every new buyer is fighting declining breadth and evaporating participation.
Nuclear Energy — URNM
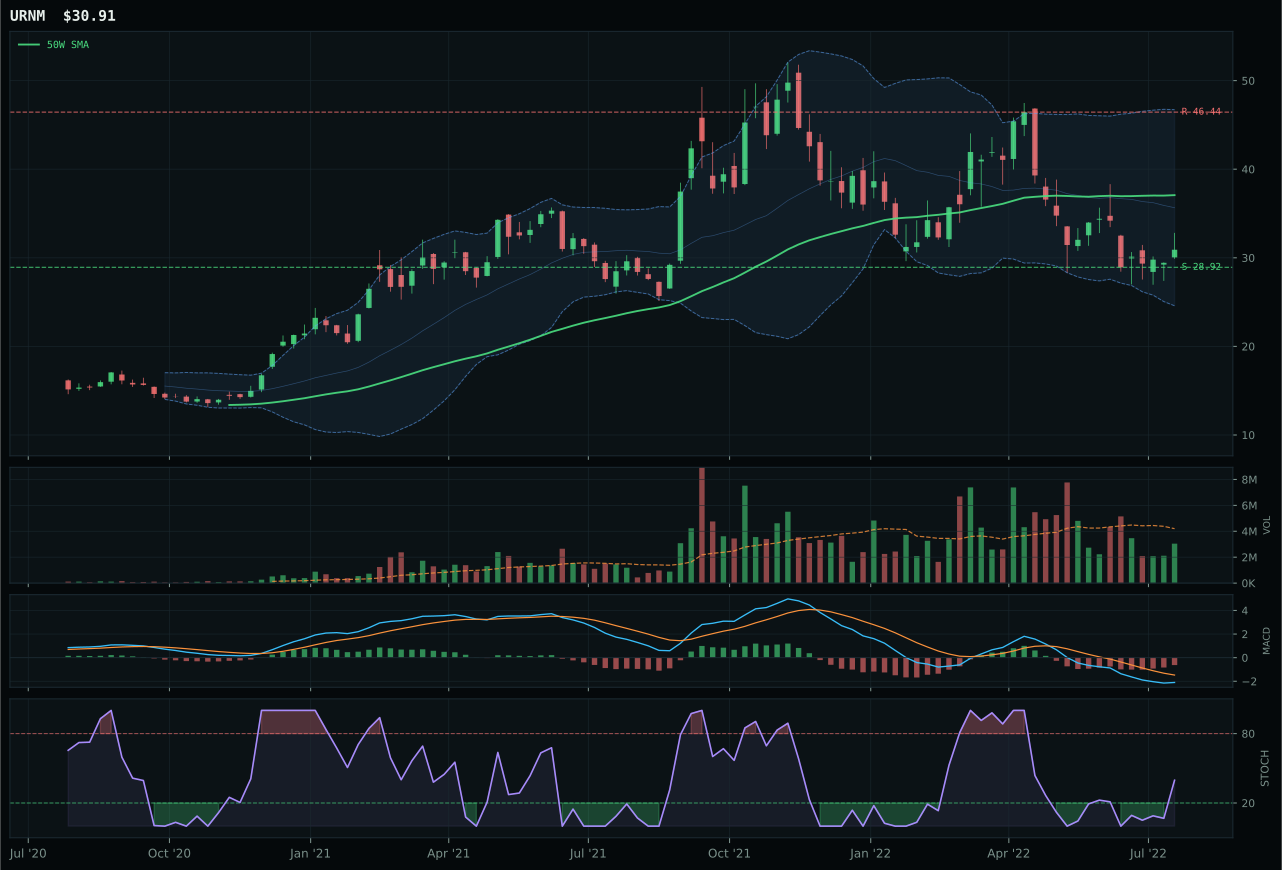
URNM has a neutral structure profile with -14.1% 13-week relative strength versus SPY.
A failed hold above support would weaken the setup.
Actionable but governed by invalidation levels.
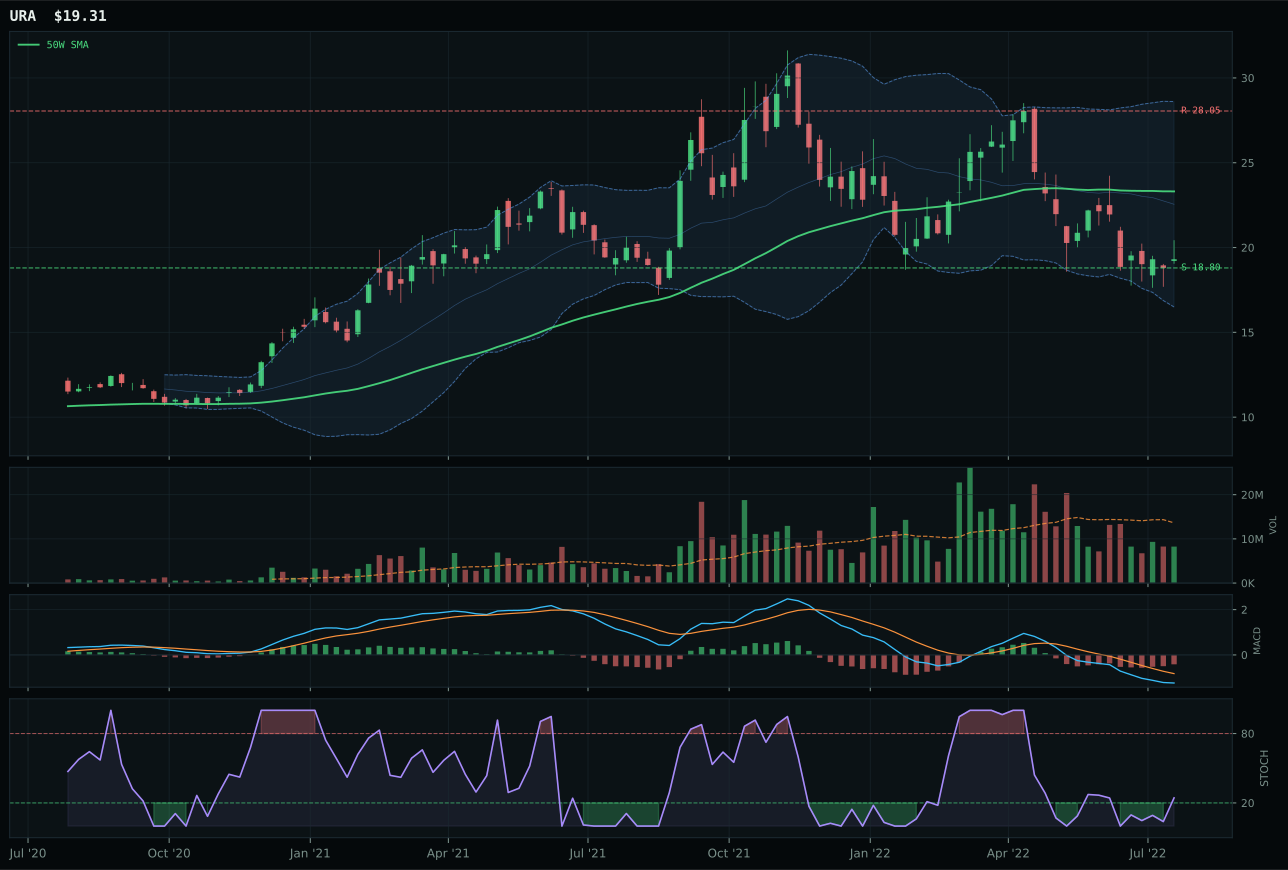
URA has a pullback into support profile with -13.8% 13-week relative strength versus SPY.
A failed hold above support would weaken the setup.
Actionable but governed by invalidation levels.
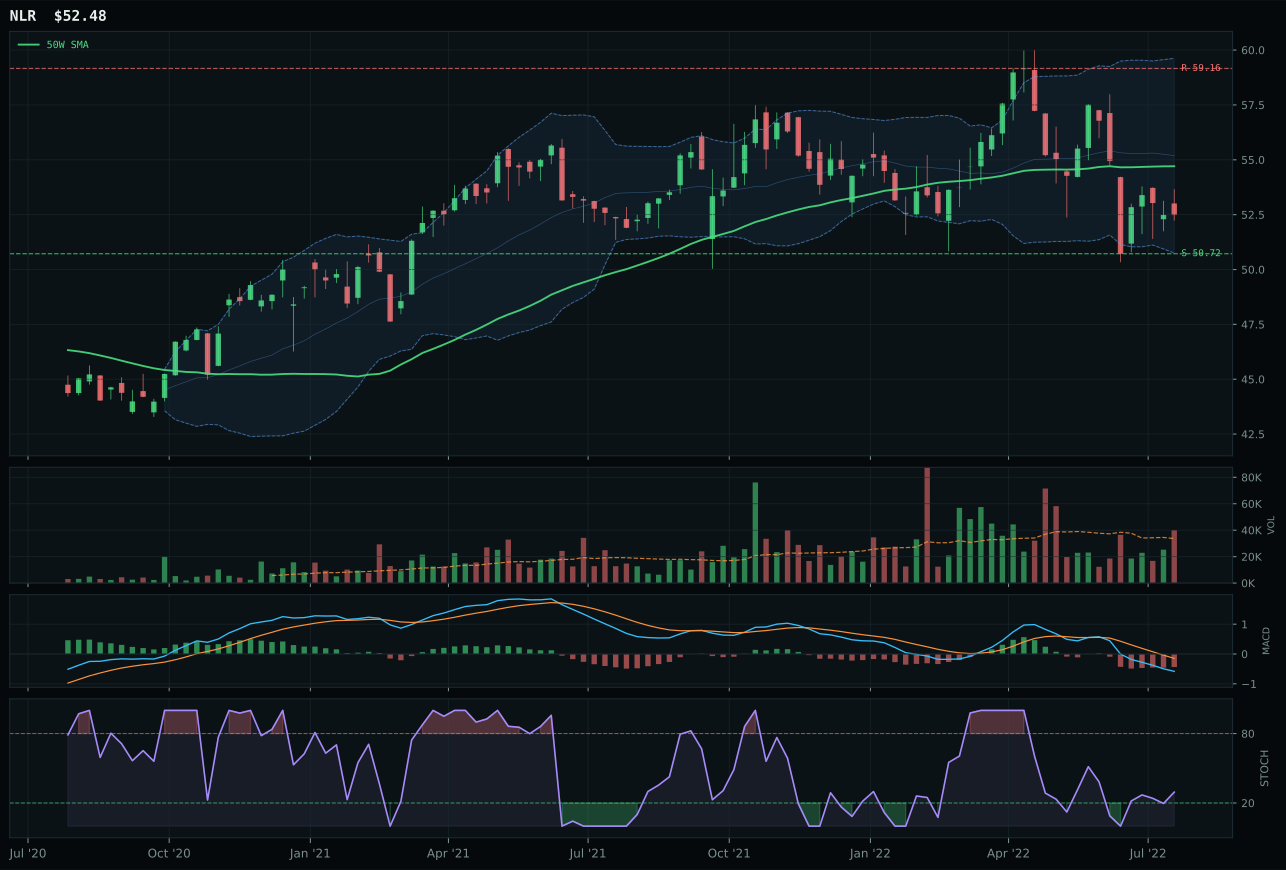
NLR has a pullback into support profile with -1.0% 13-week relative strength versus SPY.
A failed hold above support would weaken the setup.
Tracked, but not top-2 eligible because: .
URNM won the category despite carrying weak technical evidence of 15.5 out of 100 because URA and NLR presented even worse setups—the category itself was nearly uninvestable, and URNM merely lost less badly than alternatives. URNM's 43.0 trend score and 63.0 timing score placed it in the middle of the basket, but its 59.5 structure and 75.0 risk-reward provided the cleanest risk profile: downside to support at 28.92 was just 6.9% while upside to 46.44 offered -33.4% of extension, making it the tightest risk-reward in a deteriorated category. URA's pullback-into-support structure (58.7 vs URNM's 59.5) was marginally cleaner but irrelevant when both names faced identical macro headwinds and URNM's category-relative strength remained flat while URA scored zero. NLR's 62.0 composite and 45.0 technical evidence appeared stronger but masked a fully extended move (8.3% above 50W) with overbought stochastic RSI, making it a sell into strength rather than a buy into weakness.
Nuclear Energy earned only 10% allocation with a 36.7 category score because energy scarcity of +9 points and AI growth sponsorship of +5 points could not overcome -7 points of liquidity stress in a regime where uranium demand remains speculative while supply concerns are structural but not yet urgent. URNM's 15.5 technical evidence score was the weakest claim on capital among all categories, sustained only by a 50.0 macro fit that acknowledged energy-scarcity dynamics without committing to them fully. The -21.3% thirteen-week return in URNM and -14.1% SPY-relative weakness were not mere noise; they reflected genuine repricing lower as disinflation fears suppressed uranium volatility premiums and speculators lightened positioning. Holding 10% in URNM was a deep contrarian bet that uranium supply will become constrained before disinflation deflates energy demand entirely—a plausible narrative but not yet validated by price action, momentum, or volume. This allocation would reverse immediately if energy-scarcity descriptions broadened beyond speculation into production delays or if the AI growth sponsor of +5 shifted to +10 or higher, but as currently constituted, URNM remained a tactical salvage trade rather than a conviction position.
Traditional Energy — XLE
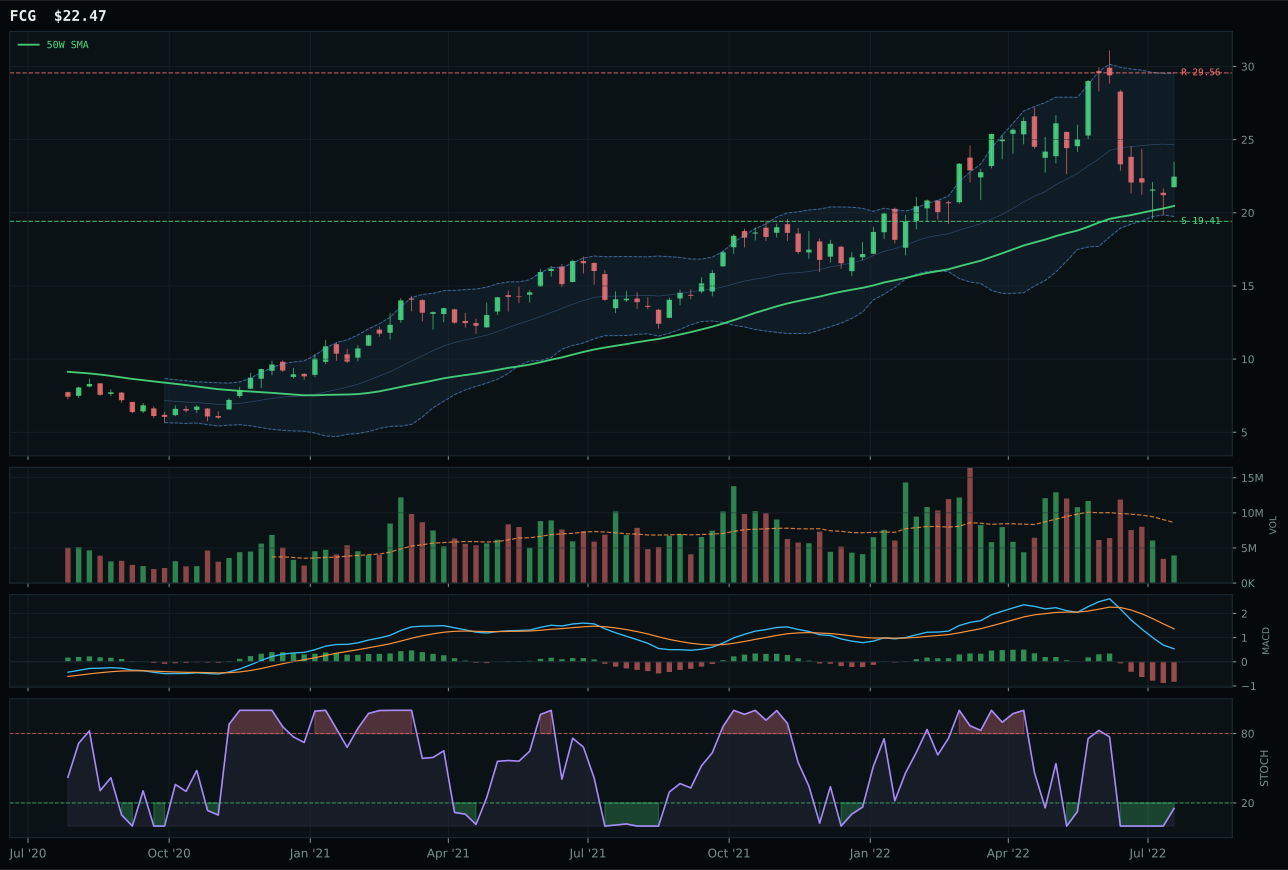
FCG has a neutral structure profile with -1.1% 13-week relative strength versus SPY.
A failed hold above support would weaken the setup.
Actionable but governed by invalidation levels.
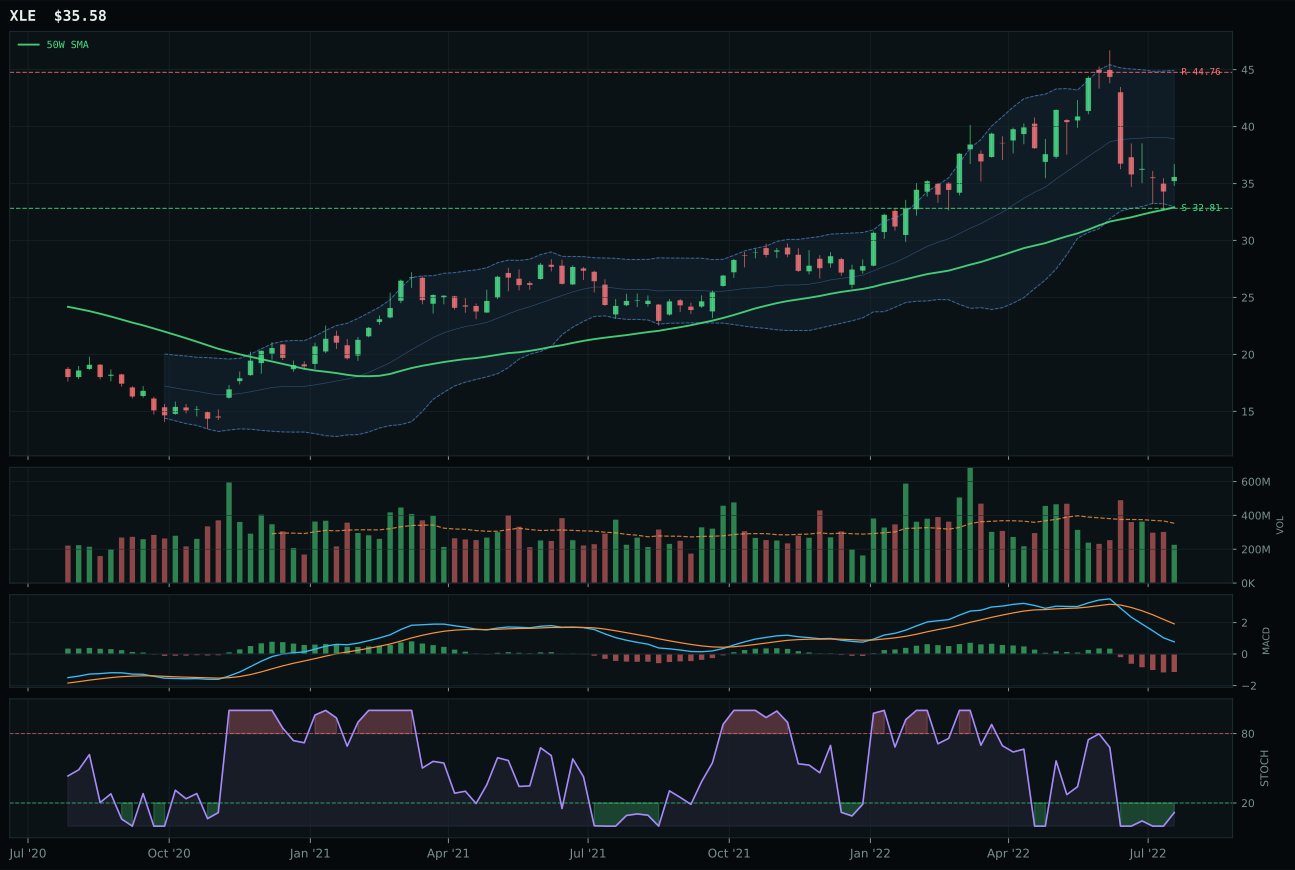
XLE has a neutral structure profile with 0.6% 13-week relative strength versus SPY.
A failed hold above support would weaken the setup.
Actionable but governed by invalidation levels.
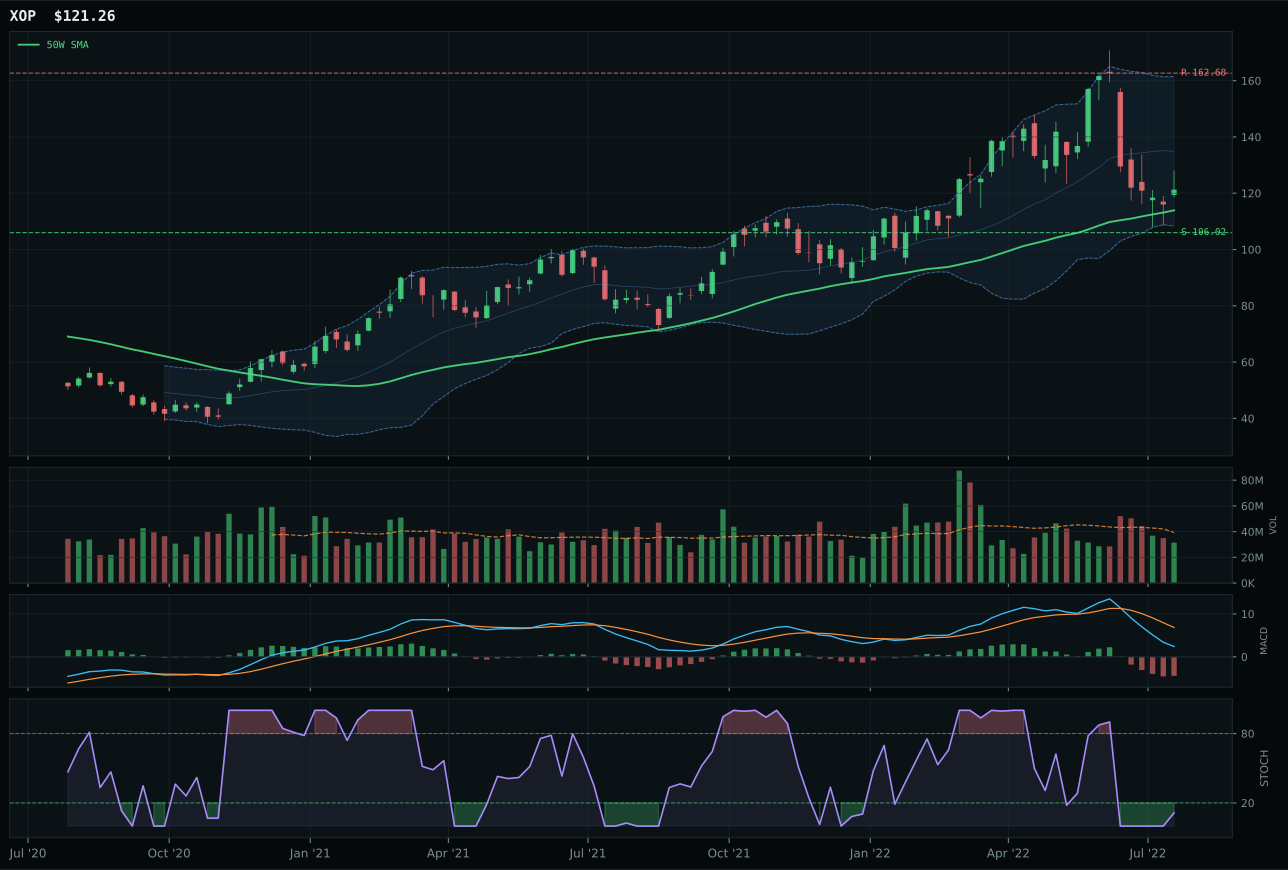
XOP has a neutral structure profile with -1.7% 13-week relative strength versus SPY.
A failed hold above support would weaken the setup.
Actionable but governed by invalidation levels.
XLE narrowly defeated FCG and XOP on risk-reward and structural setup despite weak absolute momentum, capturing energy's bifurcated personality in a disinflation regime where supply scarcity remains relevant but demand destruction is real. XLE's risk-reward of 81.9 versus FCG's 57.4 represented a material edge, reflecting XLE's placement slightly above its 50-week moving average (8.1%) while FCG was 0.9% away—a crucial difference in a bouncy market where false rallies evaporate on volume evaporation. XLE's structure score of 63.6 versus FCG's 60.0 signaled marginally cleaner price action, and category-relative strength of 1.7% for XLE versus 0.0% for FCG indicated the market had not rotated to favor natural gas over crude-linked integrated exposure. Both share MACD weakness and stochastic RSI turn-up timing at 91.0, but XLE's trend score of 73.0 revealed it held above key moving averages while FCG's 70.0 placed it in more precarious territory where rollover could accelerate.
Traditional Energy earned only 10% allocation with a 14.5 category score—the third-lowest—because energy scarcity of +16 points could not overcome disinflation pressure of -10 points and liquidity stress of -7 points in a macro regime where demand destruction outpaced supply fears. XLE's technical evidence of 44.1 out of 100 combined weak momentum confirmation (32.6) and persistence (43.0) that flagged insufficient conviction beneath the macro energy-scarcity narrative; the move higher from January lows was real, but buyers had abandoned the rally and participation remained thin at 0.64 times average. The category's 39.0 macro fit and broad market bear conditions meant energy was trading as a late-cycle hedge rather than a conviction growth trade, and the portfolio correctly sized it at 10% rather than scaling to 20%. Forward conditions would require either disinflation expectations to reverse, dollar weakness to emerge, or XLE to retake support cleanly above 34.50 with volume confirming—any of those would upgrade energy from 10% holding to core allocation, but none had materialized as of the report date.
Agriculture & Livestock — MOO
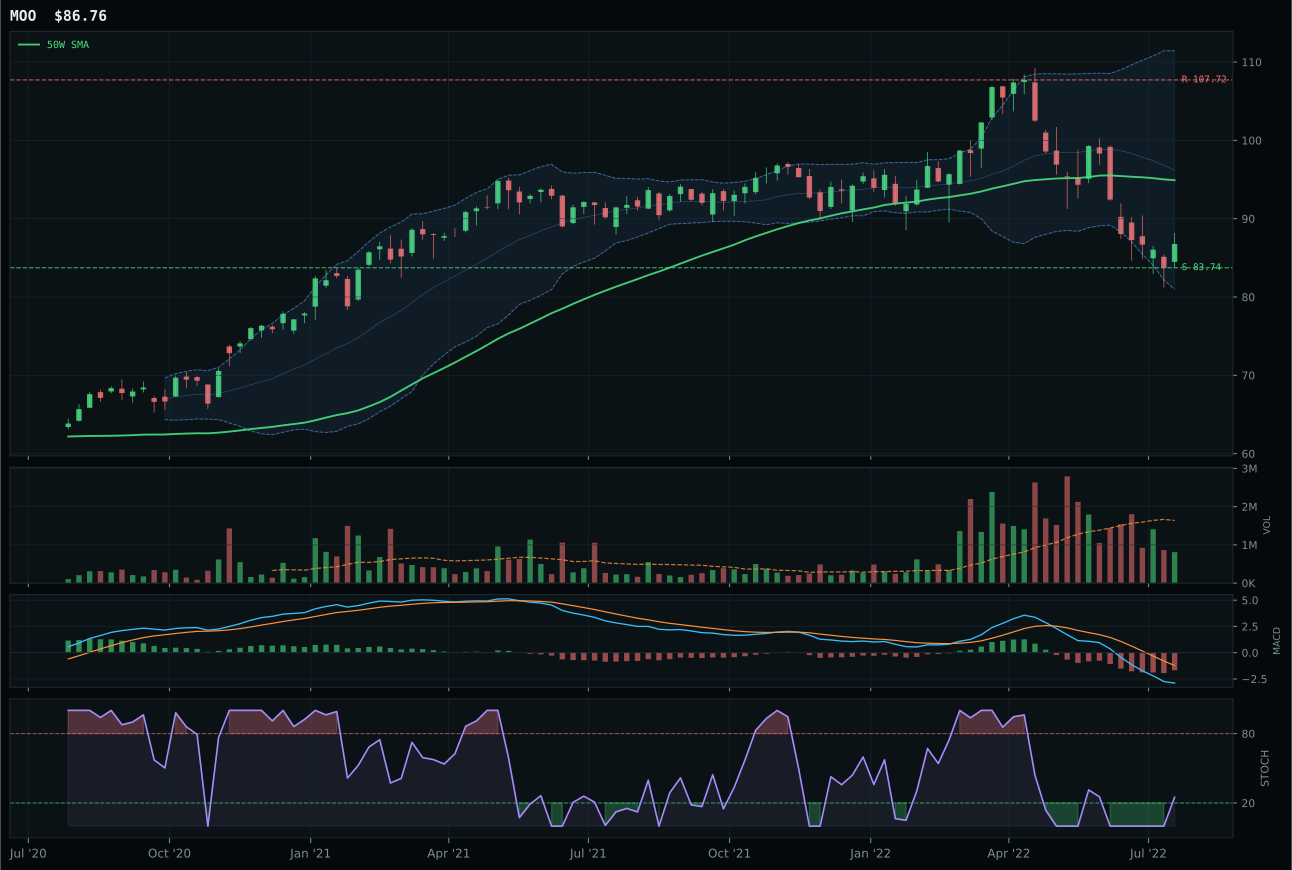
MOO has a pullback into support profile with -8.1% 13-week relative strength versus SPY.
A failed hold above support would weaken the setup.
Actionable but governed by invalidation levels.
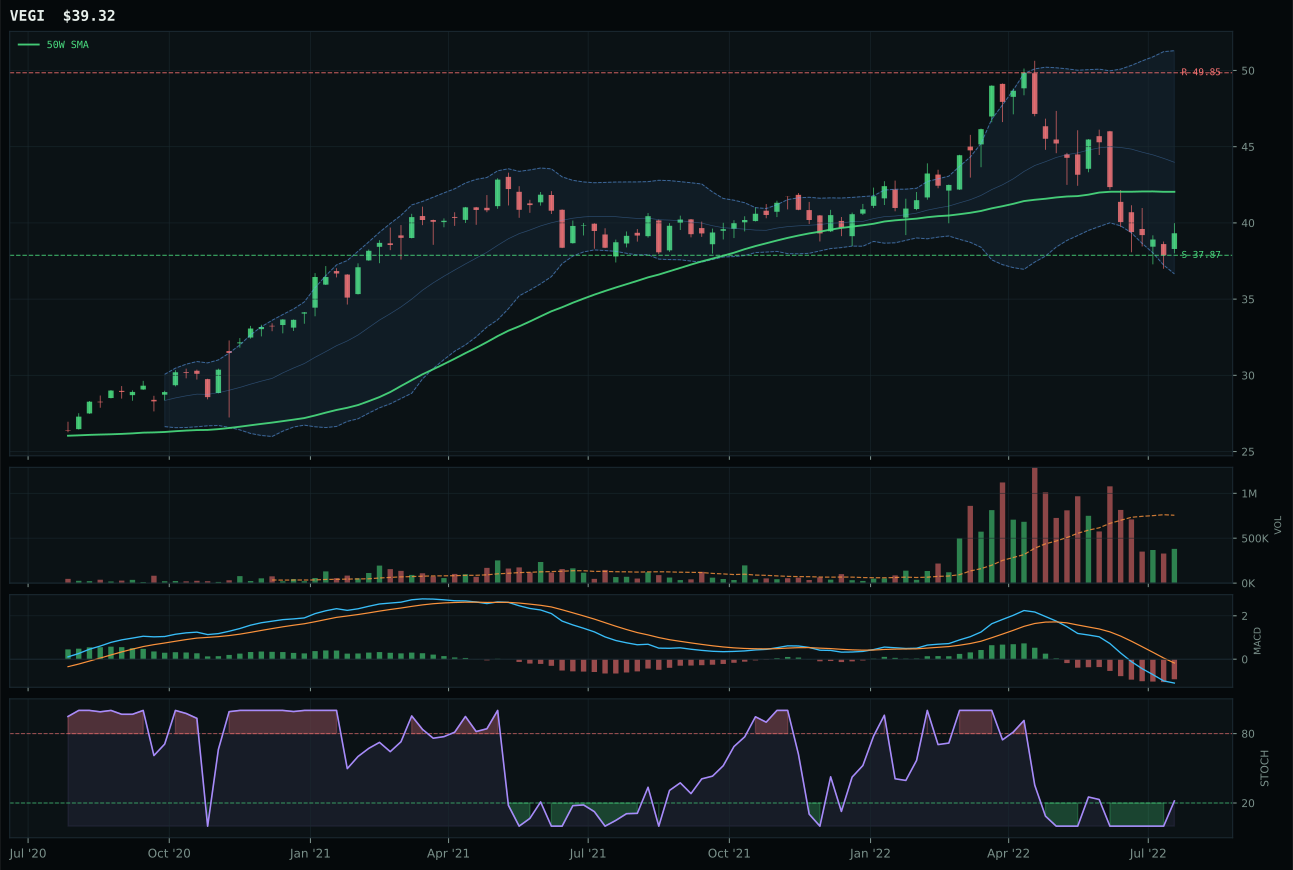
VEGI has a pullback into support profile with -9.3% 13-week relative strength versus SPY.
A failed hold above support would weaken the setup.
Actionable but governed by invalidation levels.
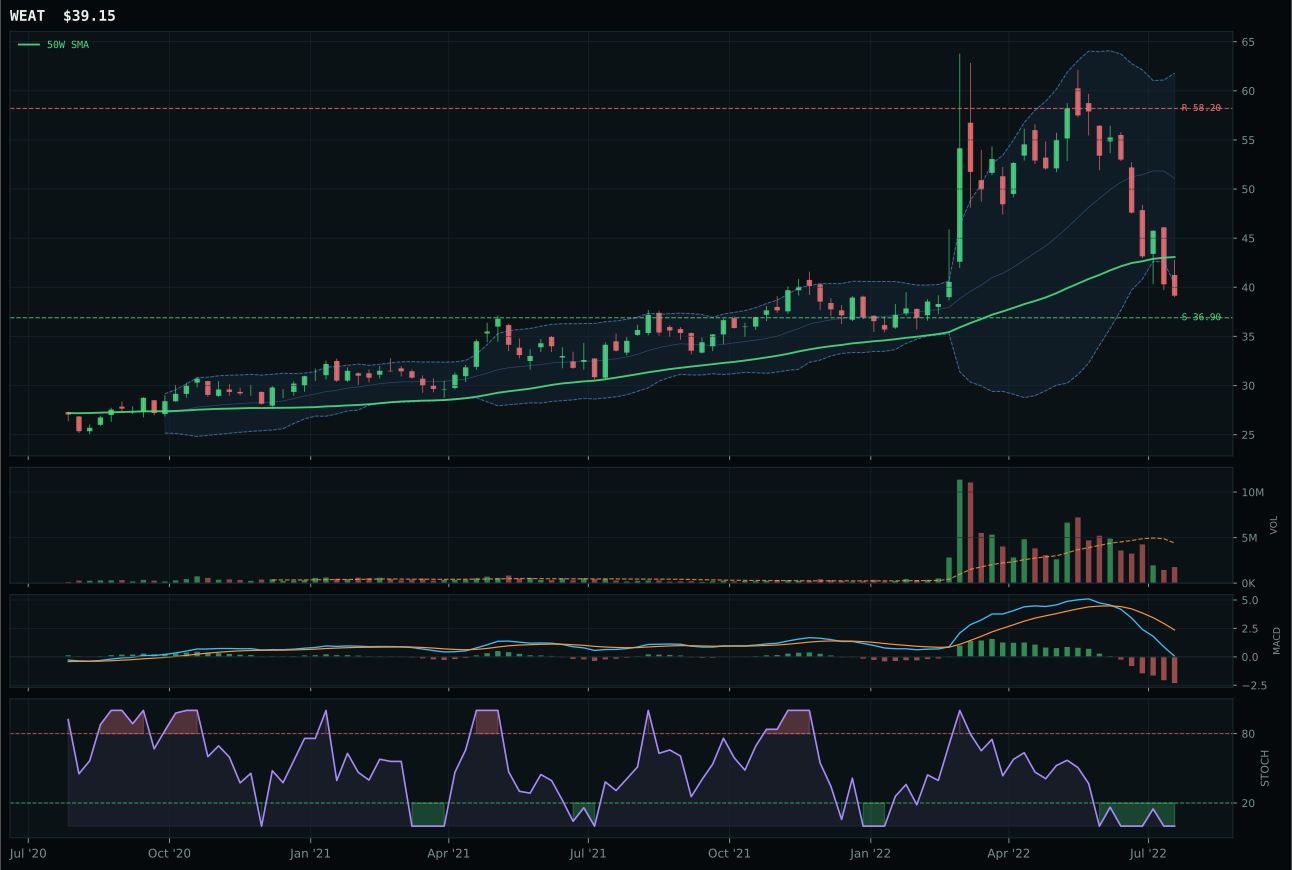
WEAT has a neutral structure profile with -18.7% 13-week relative strength versus SPY.
A failed hold above support would weaken the setup.
Actionable but governed by invalidation levels.
MOO narrowly defeated VEGI on category-relative strength of 1.2% versus 0.0%, though the decision was far from commanding and rested primarily on MOO's fractionally cleaner structure at 57.6 versus VEGI's 56.9. Both ETFs occupied nearly identical technical territory—pullback into support with MACD bearish but improving and stochastic RSI rising mid-zone—yet VEGI actually posted superior trend and momentum scores (64 and 16 versus 46 and 20 for MOO). The -8.1% thirteen-week SPY-relative weakness was material and nearly identical (-9.3% for VEGI), but MOO's marginally better risk-reward at 90.0 versus 90.0 proved the tiebreaker in what amounted to a near-dead-heat category. WEAT was cleanly eliminated by -18.7% thirteen-week SPY-relative performance and oversold stochastic RSI conditions with zero momentum confirmation, leaving only the two broadest buckets—MOO's agribusiness equity and VEGI's producer breadth—to fight for category representation.
Agriculture & Livestock earned just 10% despite its defensive pullback-into-support setup because disinflation pressure of -8 points and liquidity stress of -4 points created a -6 point net macro headwind that category technical evidence could not overcome. The 8.7 final score was the lowest among the ten allocations, reflecting the reality that falling commodity inflation and deteriorating emerging-market demand (evident in the -15.4% thirteen-week MOO performance) undercut the appeal of agribusiness exposure regardless of how clean the chart became. MOO's 52.0 technical evidence and 45.0 macro fit combined for a weak overall setup: timing of 93.0 and risk-reward of 90.0 were attractive, but momentum confirmation at just 20.2 and persistence at 39.0 showed that belief in a MOO recovery remained tentative. The allocation honors the defined support level and oversold stochastic RSI turn but withholds meaningful capital until volume participation rises and category-relative strength breaks positive—this is a watch position, not a conviction entry.
Emerging Markets — IEMG
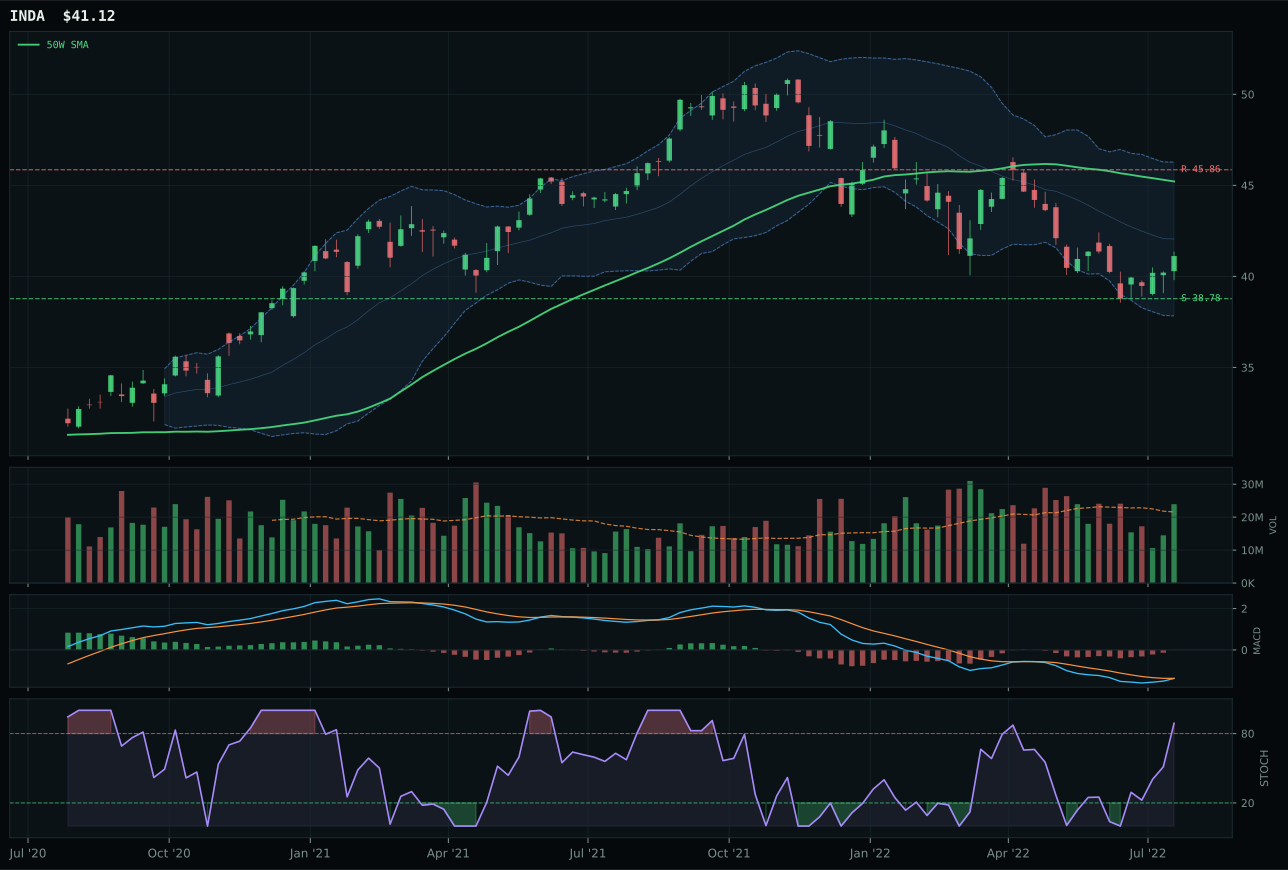
INDA has a neutral structure profile with 0.3% 13-week relative strength versus SPY.
A failed hold above support would weaken the setup.
Actionable but governed by invalidation levels.
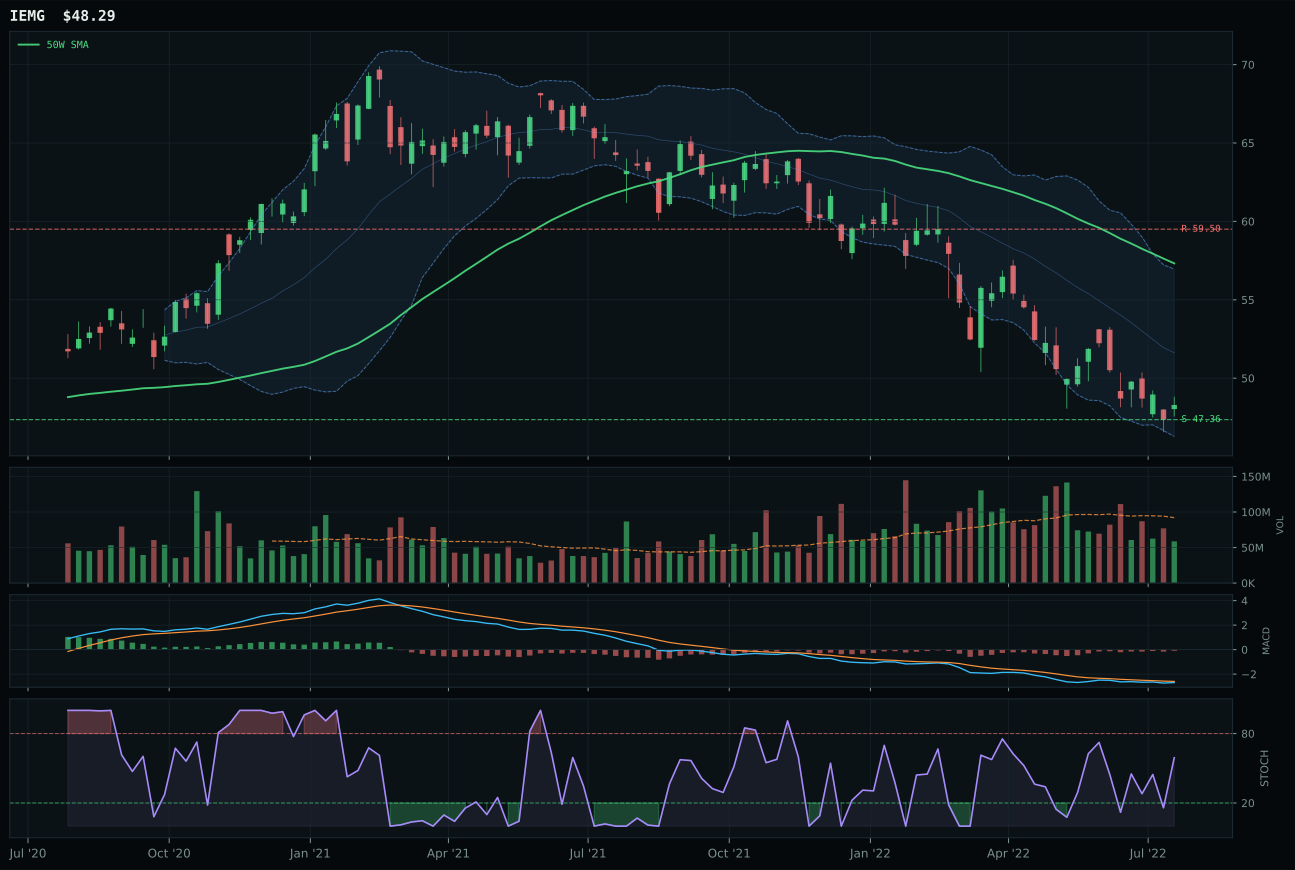
IEMG has a pullback into support profile with -0.6% 13-week relative strength versus SPY.
A failed hold above support would weaken the setup.
Actionable but governed by invalidation levels.
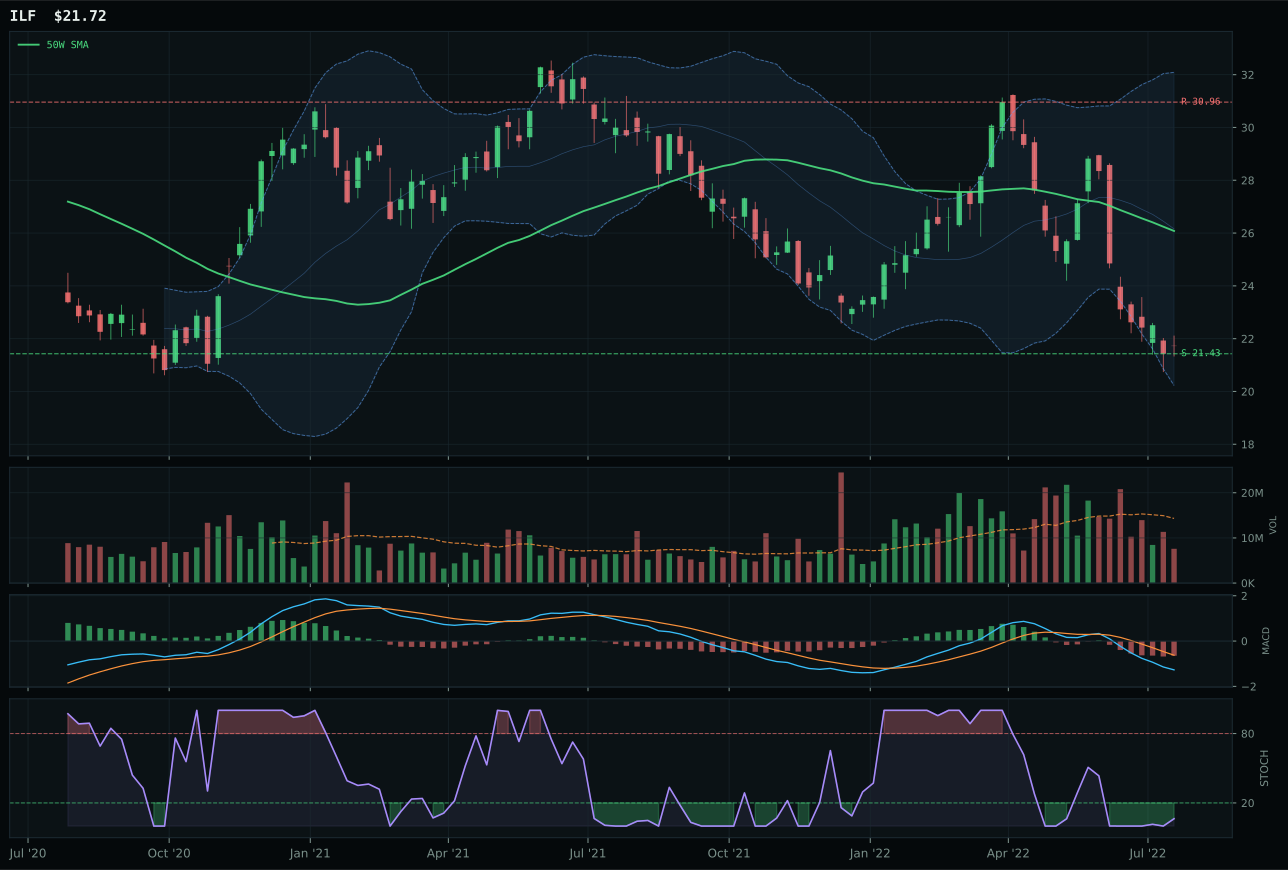
ILF has a pullback into support profile with -14.1% 13-week relative strength versus SPY.
Extension and support failure are the main tactical risks.
Tracked, but not top-2 eligible because: structurally broken.
IEMG narrowly defeated INDA on risk-reward and stochastic RSI timing despite INDA's superior trend and momentum confirmation, capturing emerging-market exposure in a regime where broad weakness was endemic and timing entry points became the only edge available. IEMG's risk-reward of 90.0 versus INDA's 75.8 reflected IEMG's deeper pullback into support near 47.36, providing tighter downside protection at just 2.0% while INDA required 9.1% of additional downside before reaching equivalent support—a critical distinction when broad market bear was active and rallies could evaporate. IEMG's pullback-into-support structure of 69.4 versus INDA's 63.6 neutral structure offered defined invalidation, and stochastic RSI turning up at 0.59 for IEMG versus overbought momentum at 1.00 for INDA meant IEMG was entering fresh accumulation while INDA had already rallied and risked reversal. INDA's -7.0% thirteen-week return and 0.3% SPY-relative strength were marginally superior, but not enough to overcome IEMG's better price action setup.
Emerging Markets earned 0% allocation because the category score of 7.0 ranked it 10th and lowest among all eligible categories. IEMG's technical evidence is 52.9/100, which is respectable, but macro fit collapsed to 32.0/100 because dollar pressure is active (-10) and liquidity stress (-8) are working against emerging-market currencies and cross-border capital flows. The three-ETF proof order ranked INDA first (52.7) with superior technical evidence (63.6), but even INDA's strength could not overcome the category-level macro headwind. In a disinflation regime with broad market bear conditions and dollar strength, EM assets lack tailwinds—there is no inflation surprise to revalue currencies upward, no growth surprise to justify higher equity multiples, and no monetary accommodation to support capital flows. The category would need to see either a dollar peak and reversal, stabilization in global liquidity conditions, or a fundamental shift in growth expectations to earn allocation. Until then, the technicals—no matter how clean—cannot overcome the macro currents.
Industrial Metals — REMX
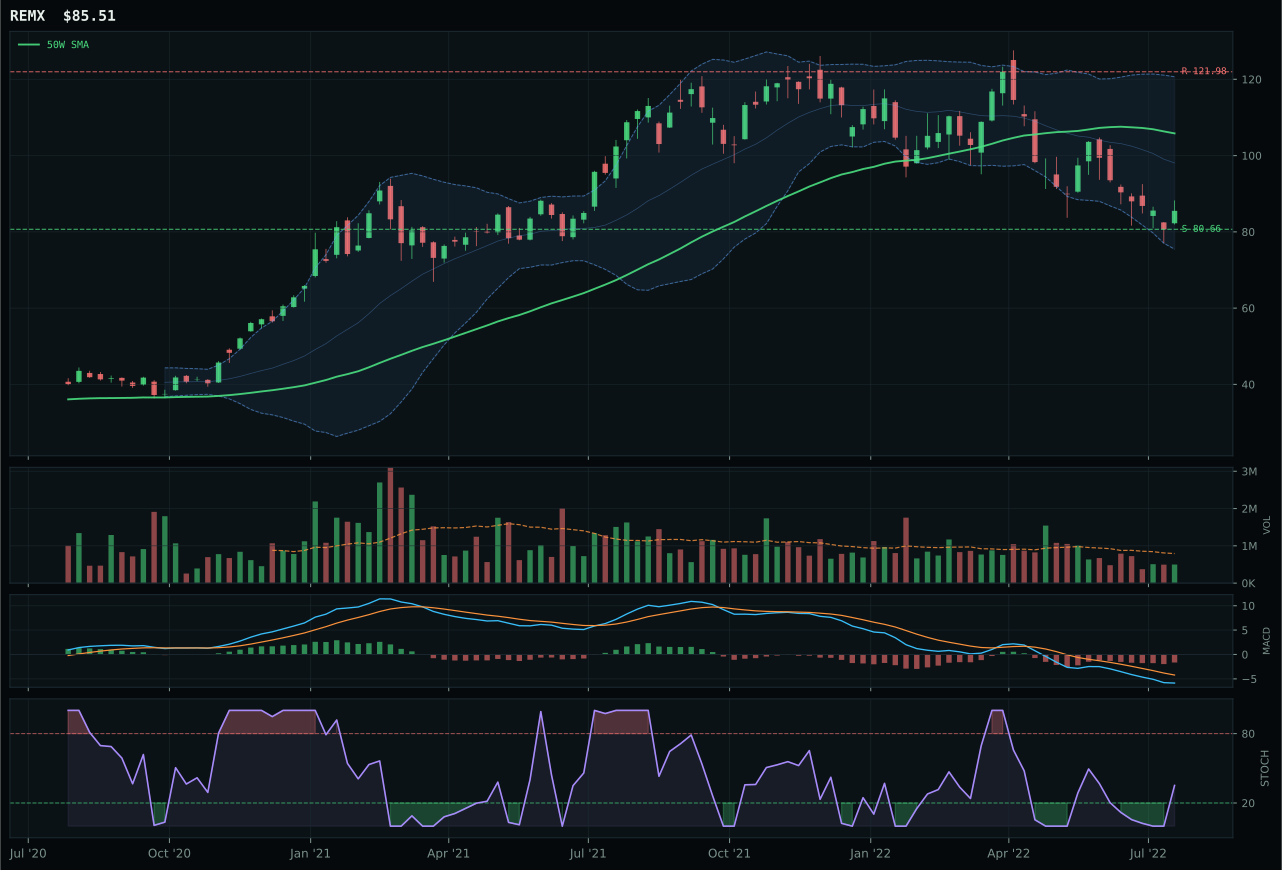
REMX has a neutral structure profile with -5.7% 13-week relative strength versus SPY.
A failed hold above support would weaken the setup.
Actionable but governed by invalidation levels.
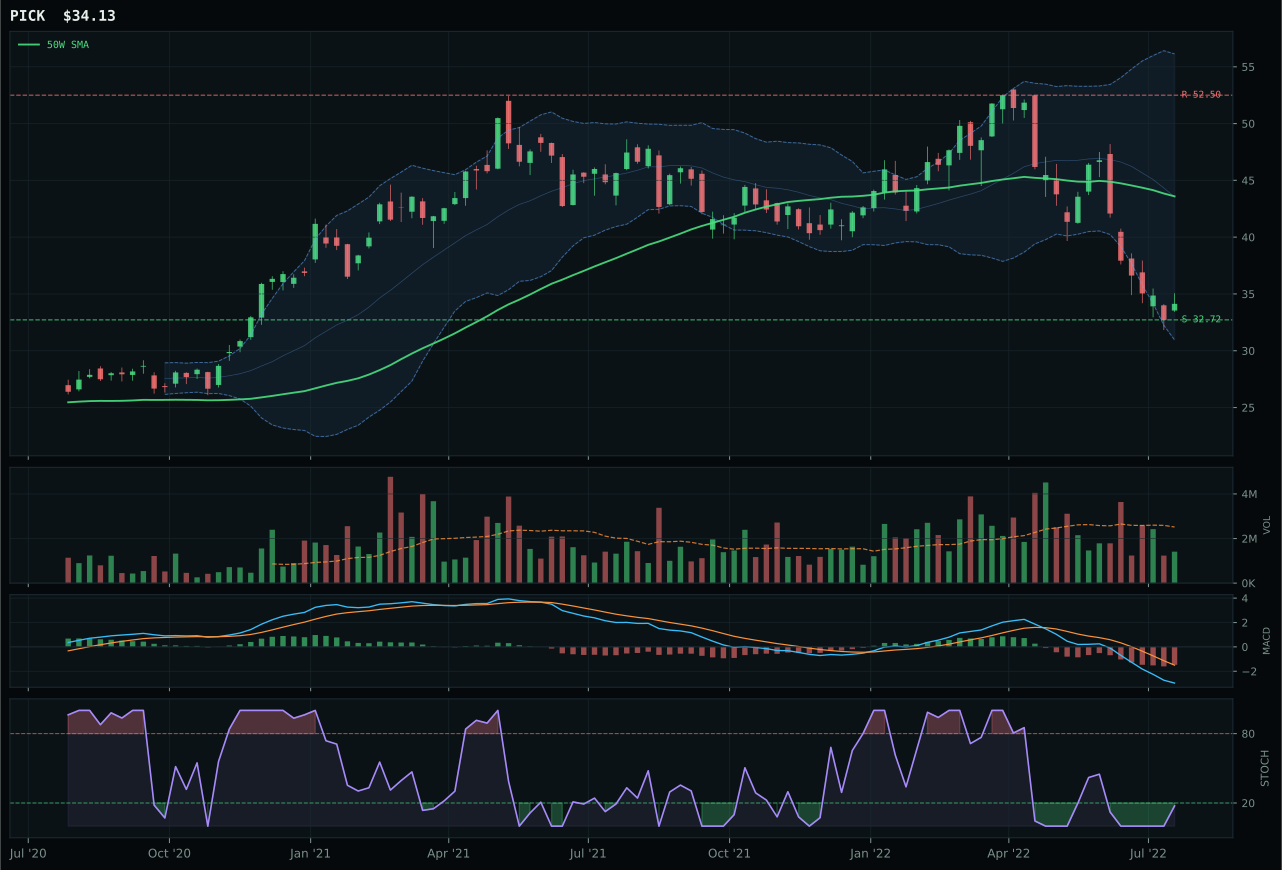
PICK has a pullback into support profile with -18.8% 13-week relative strength versus SPY.
A failed hold above support would weaken the setup.
Actionable but governed by invalidation levels.
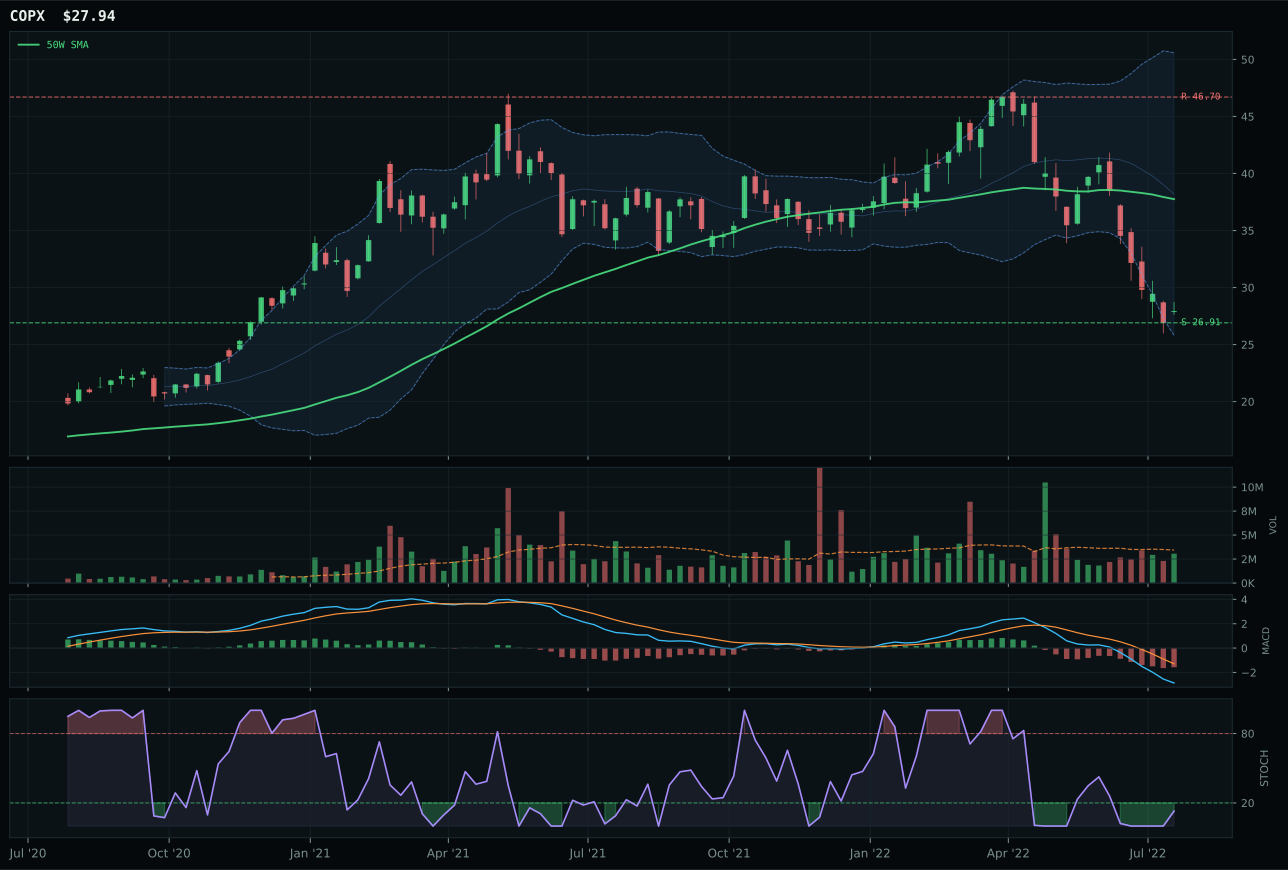
COPX has a pullback into support profile with -24.6% 13-week relative strength versus SPY.
A failed hold above support would weaken the setup.
Actionable but governed by invalidation levels.
REMX won the industrial metals category against PICK and COPX on relative strength and stochastic RSI timing despite posting weak absolute technical evidence of 50.2 out of 100. REMX's category-relative strength of 13.1% revealed that rare-earth-supply narratives were attracting accumulation even as all three basket members deteriorated, and its rising mid-zone stochastic RSI at 0.35 offered fresher entry timing than PICK's oversold turn-up or COPX's oversold without turn. The -13.0% thirteen-week return and -5.7% SPY-relative weakness marked genuine weakness, yet REMX's 49.4 trend score and non-deteriorating MACD established a floor beneath the damage. PICK's -26.1% thirteen-week thirteen-week performance and complete momentum collapse at zero were disqualifying, while COPX at -31.9% was outright broken and offered no technical evidence of stabilization despite identical risk-reward to PICK.
Industrial Metals earned 0% allocation because the category score of 6.0 ranked it 9th out of 10 eligible categories. Technical evidence for REMX is only 50.2/100, and macro fit collapsed to 45.0/100 because liquidity stress (-8) and dollar pressure (-7) are actively working against commodity demand. AI growth sponsorship (+4) cannot offset the fundamental headwinds in a disinflation regime where industrial demand is slowing. PICK's technical evidence was even weaker at 8.2/100, driven by a 26.1% 13-week decline and -18.8% SPY-relative underperformance. The category would need to see either a sharp rebound in macro data signaling industrial cycle recovery or a stabilization in the dollar and liquidity conditions to earn allocation. As it stands, rare earths, copper, and diversified mining are all declining into a wall of selling that has not yet exhausted itself. This category will remain on the sidelines until either technicals show multi-week healing or macro descriptors shift away from broad market bear and liquidity stress.