
2022-07-15
Informational purposes only. The content in this report, including allocations, analysis, and commentary, is provided solely for informational and educational purposes. It does not constitute financial advice, investment advice, trading advice, or any other type of advice. Past performance does not guarantee future results. Always conduct your own research and consult a qualified financial professional before making investment decisions.
Weekly Allocation
| Ticker | Category | Weight | Role |
|---|---|---|---|
| XLU | Utilities & Infrastructure | 20% | Top-2 (20%) |
| GLD | Precious Metals | 20% | Top-2 (20%) |
| XLK | Technology | 10% | Tier-2 (10%) |
| ITA | Defense & Aerospace | 10% | Tier-2 (10%) |
| SMH | AI | 10% | Tier-2 (10%) |
| URNM | Nuclear Energy | 10% | Tier-2 (10%) |
| IEMG | Emerging Markets | 10% | Tier-2 (10%) |
| REMX | Industrial Metals | 10% | Tier-2 (10%) |
Trade Instructions — Monday Open
Sell the tranche from 2022-06-17 (completing its 4-week hold). Buy the new tranche. Instructions show net portfolio changes — same-asset positions cancel, weight changes show the delta.
| Action | Ticker | Instruction |
|---|---|---|
| SELL | SGOV | Sell 25% of SGOV position (reduce 20.00% → 15.00%) |
| SELL | GLD | Sell 5% of GLD position (reduce 25.00% → 23.75%) |
| SELL | XLE | Sell 40% of XLE position (reduce 6.25% → 3.75%) |
| SELL | VEGI | Sell 50% of VEGI position (reduce 2.50% → 1.25%) |
| SELL | COPX | Sell entire COPX position (1.25% of portfolio) |
| SELL | CIBR | Sell 33% of CIBR position (reduce 3.75% → 2.50%) |
| BUY | ITA | Buy ITA — 10.00% of freed cash (adds 1.25% to portfolio) |
| BUY | URNM | Buy URNM — 10.00% of freed cash (adds 1.25% to portfolio) |
| BUY | XLK | Buy XLK — 20.00% of freed cash (adds 2.50% to portfolio) |
| BUY | SMH | Buy SMH — 20.00% of freed cash (adds 2.50% to portfolio) |
| BUY | IEMG | Buy IEMG — 20.00% of freed cash (adds 2.50% to portfolio) |
| BUY | REMX | Buy REMX — 20.00% of freed cash (adds 2.50% to portfolio) |
Current Portfolio After Trade
Combined holdings across all 4 active tranches. Each tranche is 25% of the portfolio.
| Ticker | % of Portfolio | Weight Bar |
|---|---|---|
| GLD | 23.75% | |
| XLU | 21.25% | |
| SGOV | 15.00% | |
| ITA | 6.25% | |
| URNM | 3.75% | |
| BOTZ | 3.75% | |
| XLE | 3.75% | |
| CIBR | 2.50% | |
| IGV | 2.50% | |
| INDA | 2.50% | |
| URA | 2.50% | |
| XLK | 2.50% | |
| SMH | 2.50% | |
| IEMG | 2.50% | |
| REMX | 2.50% | |
| VEGI | 1.25% | |
| IGF | 1.25% |
Macro Regime — Disinflation
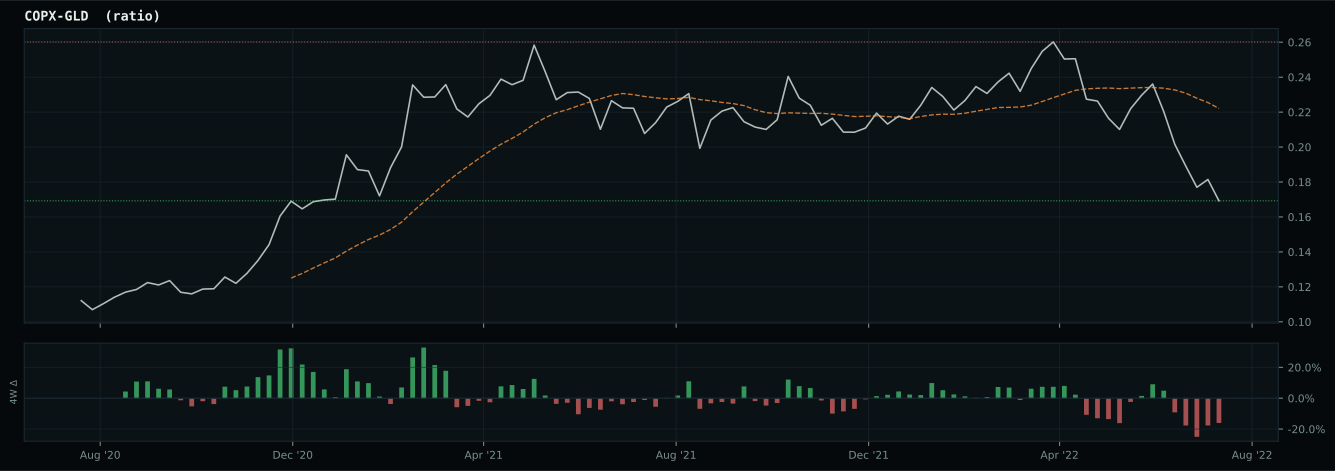
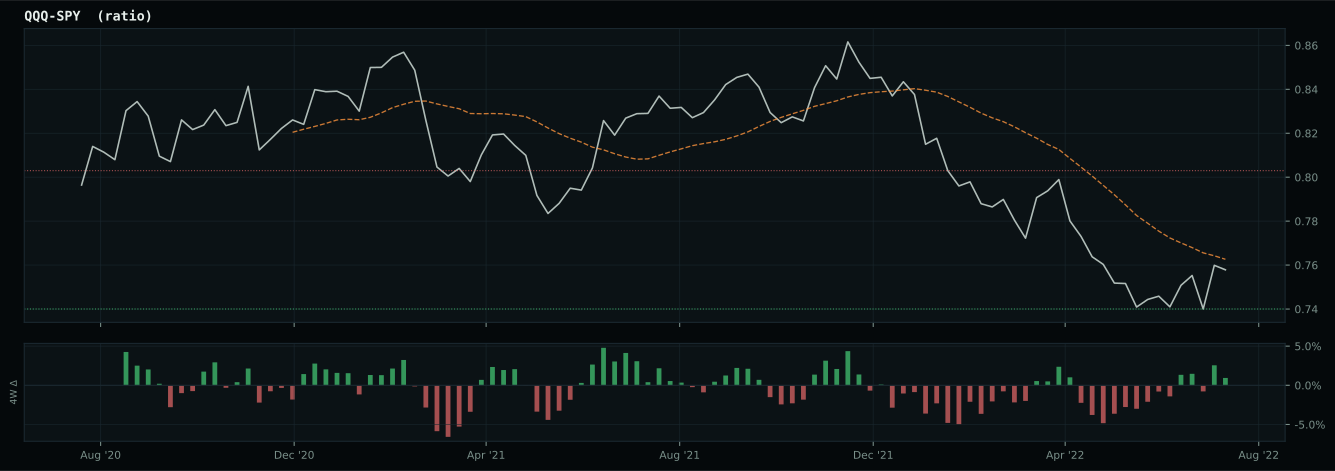
Macro Evidence Charts
Market-implied signals behind the macro regime scores. Each ratio compares two assets; the direction and slope of the ratio is what the macro engine reads.
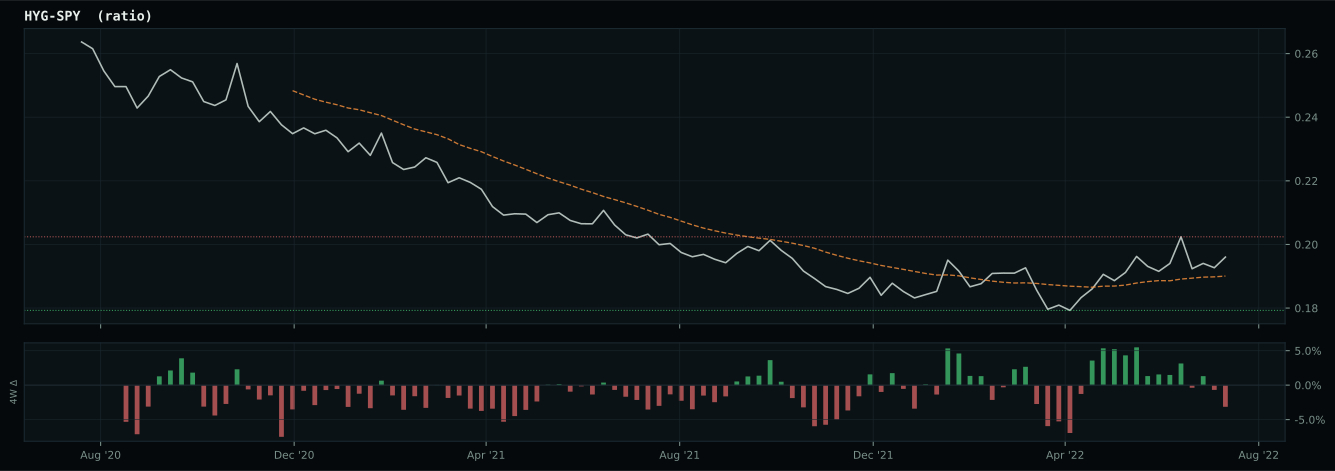
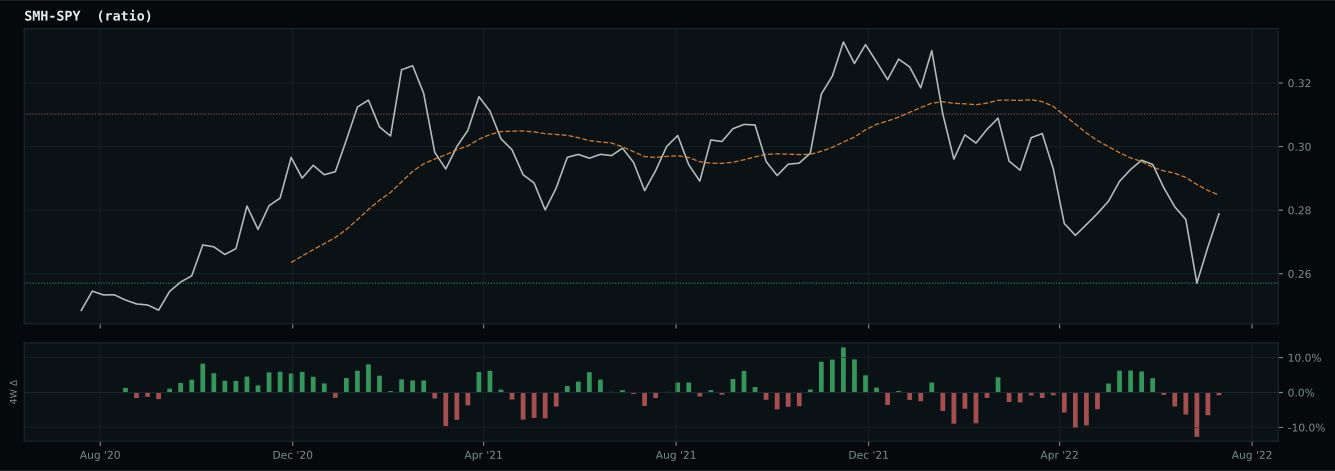
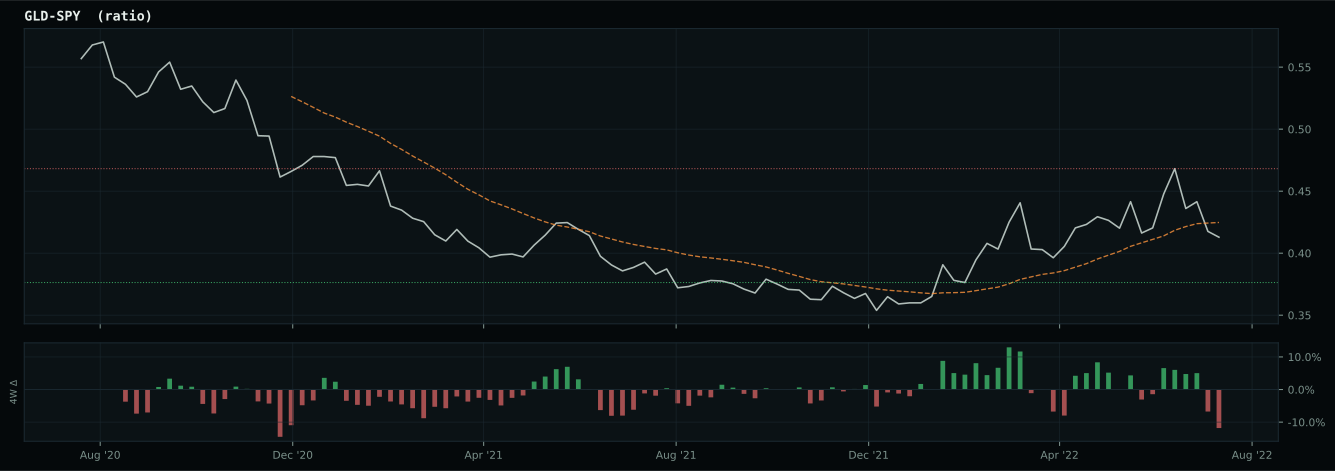
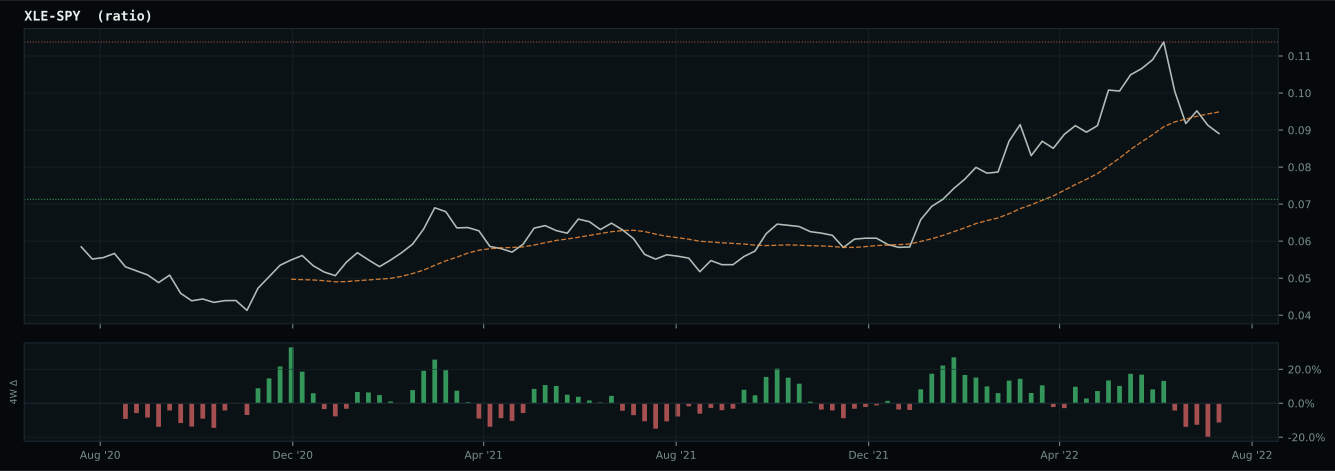
Crypto Regime — NoCrypto
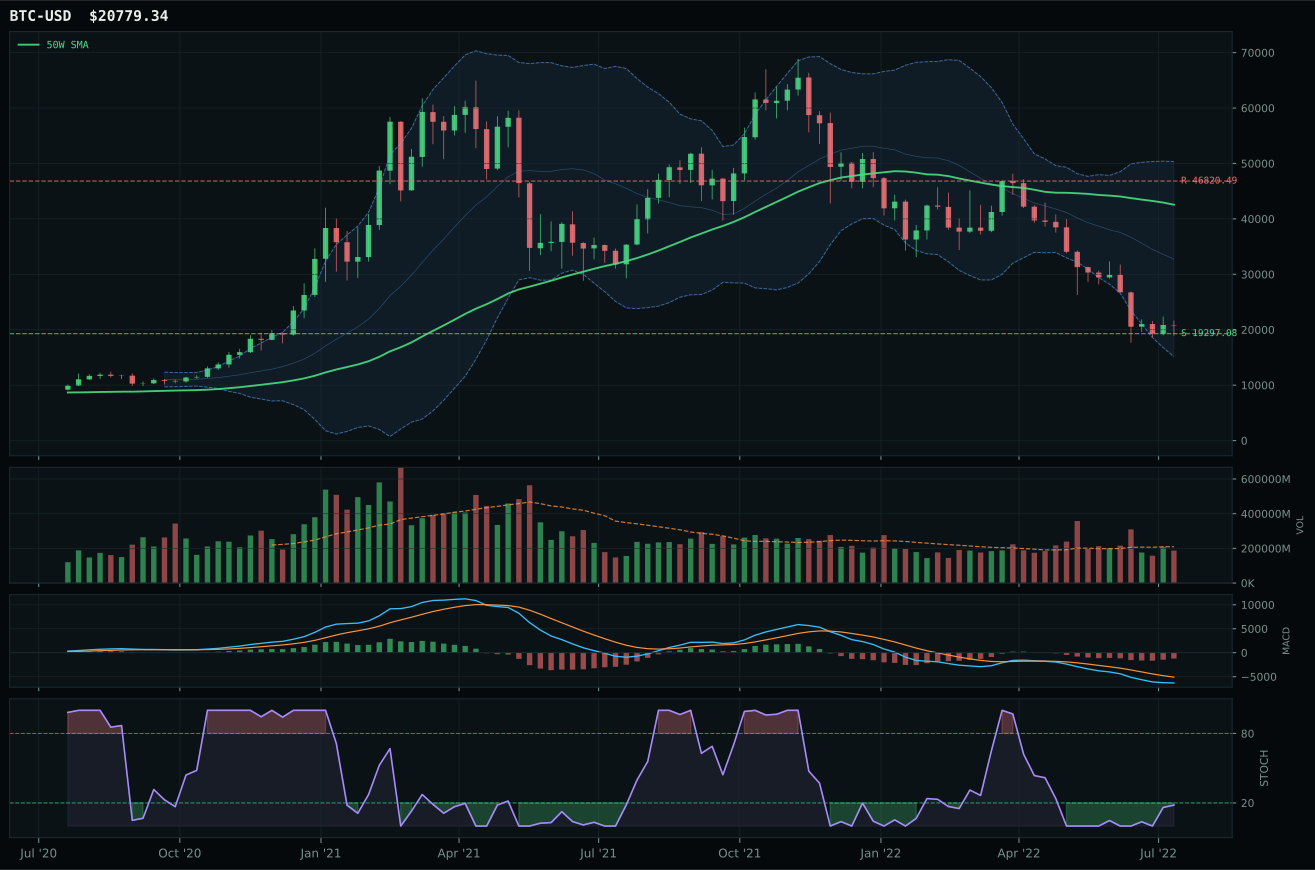
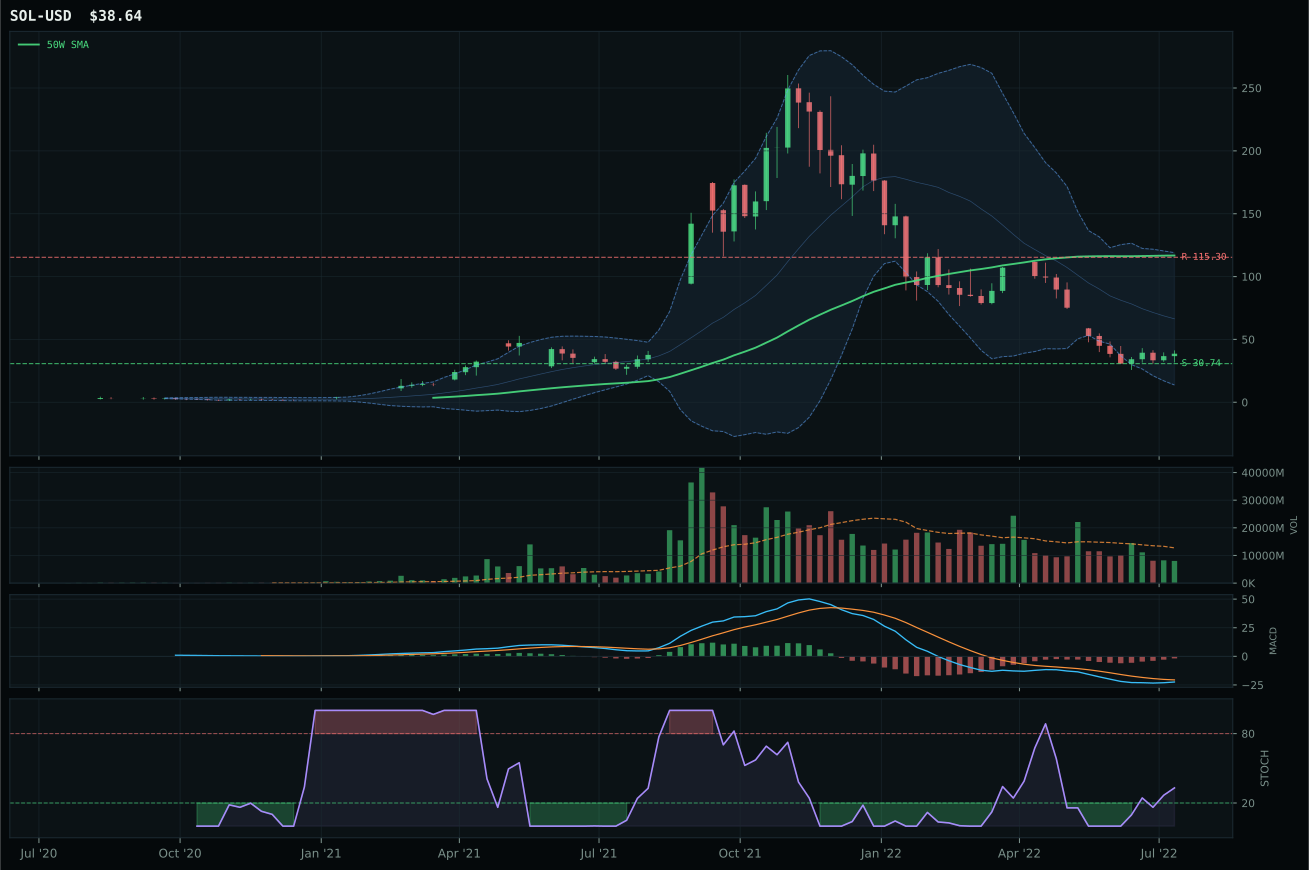
ValueBTC armed by first 200W buy-zone touch, but post-touch range age is 4 weeks; minimum is 12
TrendBTC not confirmed
one or more available conditions failed
Category Rankings
| Rank | Category | Winner | Score | Alloc | 4W Ret | Peers (4W) |
|---|---|---|---|---|---|---|
| 1 | Utilities & Infrastructure | XLU | 55.2 | 20% | +10.01% | PAVE +17.9% · IGF +6.0% |
| 2 | Precious Metals | GLD | 47.5 | 20% | +3.69% | SLV +7.1% · GDX +2.2% |
| 3 | Technology | XLK | 46.9 | 10% | +12.22% | IGV +13.7% · CIBR +10.5% |
| 4 | Defense & Aerospace | ITA | 42.2 | 10% | +9.41% | XAR +12.4% · ROKT +15.6% |
| 5 | AI | SMH | 38.2 | 10% | +11.92% | BOTZ +13.7% · AIQ +10.3% |
| 6 | Nuclear Energy | URNM | 29.3 | 10% | +11.68% | URA +10.7% · NLR +7.0% |
| 7 | Emerging Markets | IEMG | 5.9 | 10% | +4.10% | INDA +8.3% · ILF +17.3% |
| 8 | Industrial Metals | REMX | 5.1 | 10% | +25.99% | PICK +14.1% · COPX +11.5% |
| 9 | Traditional Energy | XLE | 2.3 | 0% | +7.40% | FCG +12.2% · XOP +12.8% |
| 10 | Agriculture & Livestock | VEGI | 1.1 | 0% | +13.76% | MOO +10.7% · WEAT -0.5% |
Utilities & Infrastructure — XLU
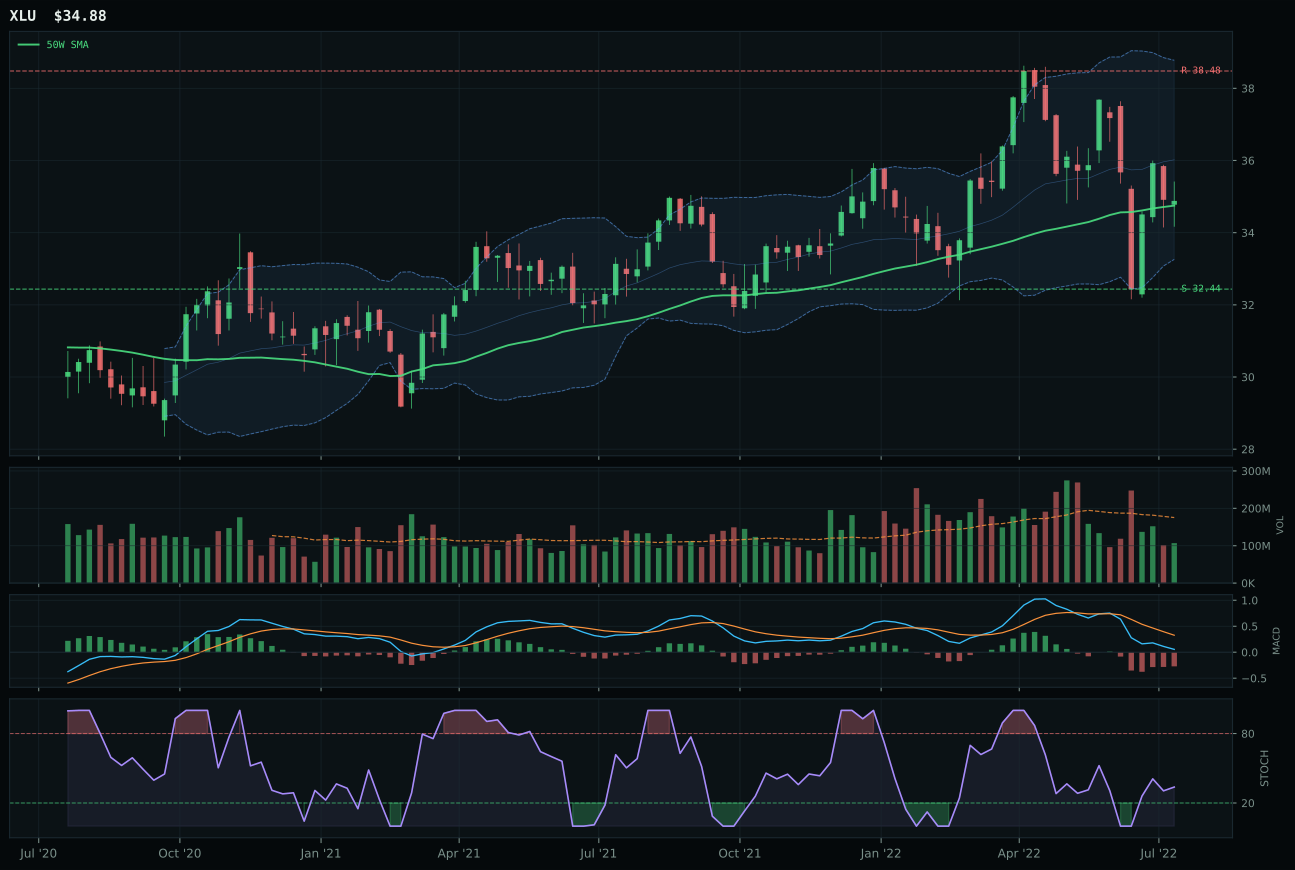
XLU has a compression near 50W profile with 3.7% 13-week relative strength versus SPY.
A failed hold above support would weaken the setup.
Actionable but governed by invalidation levels.
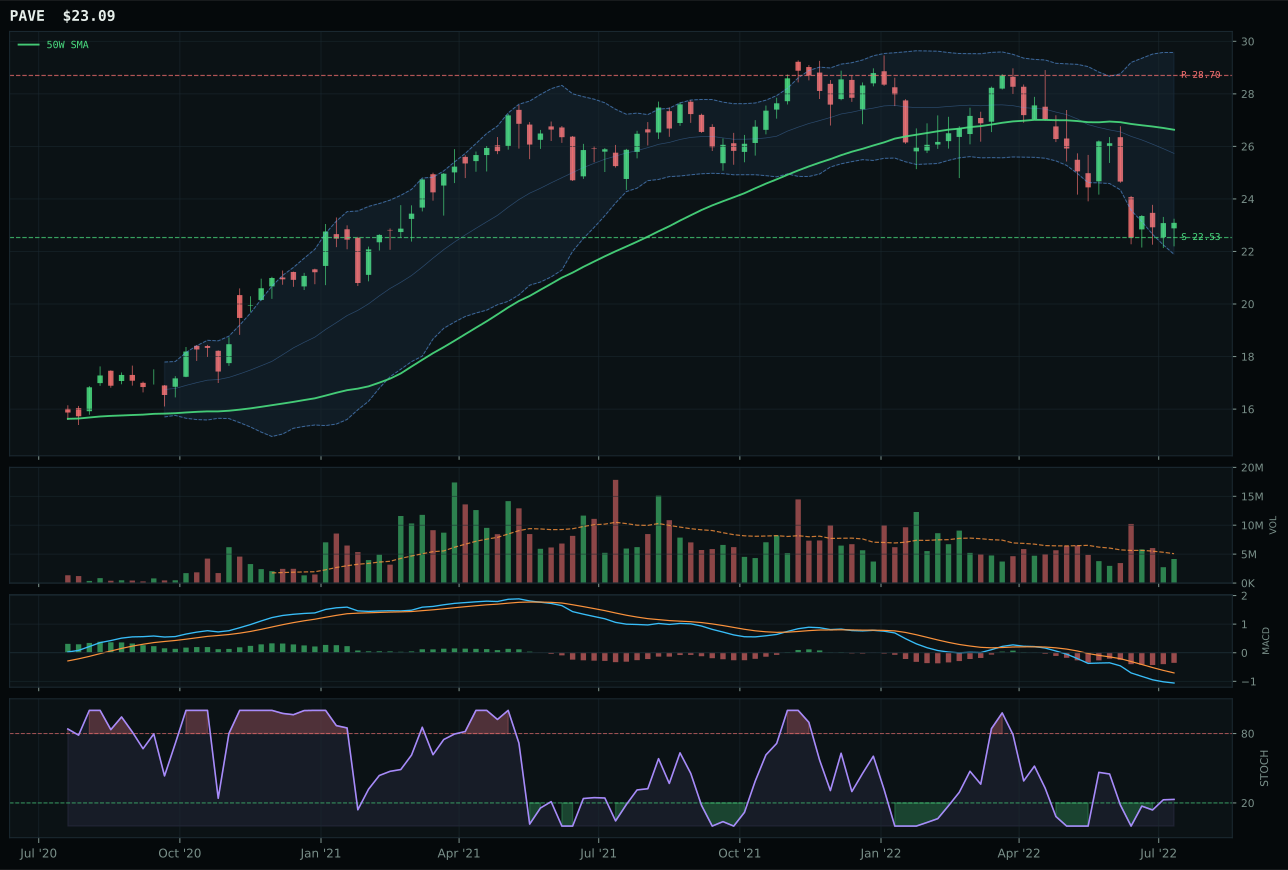
PAVE has a pullback into support profile with -4.2% 13-week relative strength versus SPY.
A failed hold above support would weaken the setup.
Actionable but governed by invalidation levels.
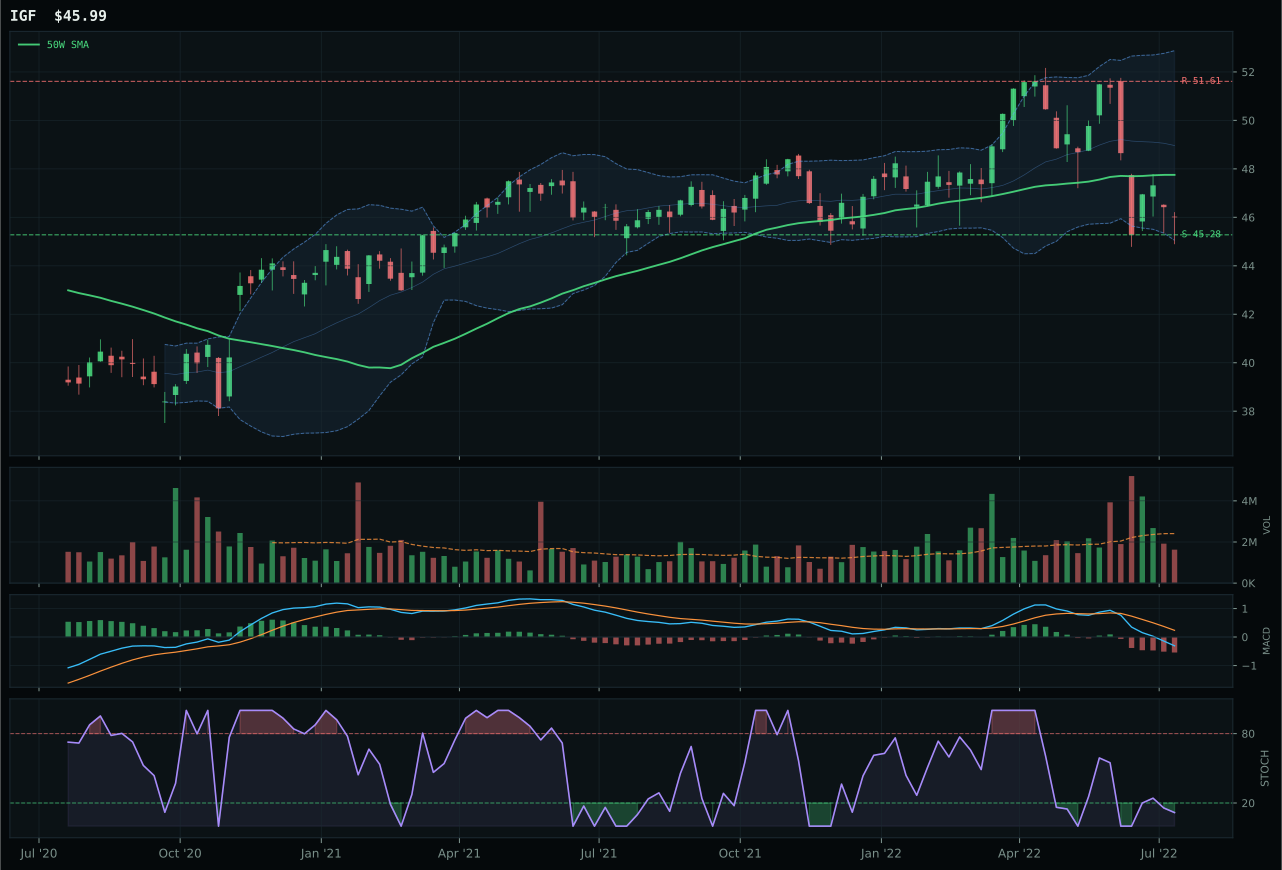
IGF has a pullback into support profile with 1.1% 13-week relative strength versus SPY.
A failed hold above support would weaken the setup.
Actionable but governed by invalidation levels.
XLU wins utilities with a 35.0-point gap over PAVE in the cleanest category victory this week, driven by textbook technical superiority across every dimension: trend at 98.6 versus PAVE's 52, timing at perfect 100.0 versus 73, momentum at 63.2 versus 27, and structure cleanliness at 66.3 versus 63.7. XLU's chart sits at true decision point—just 0.4% above the 50-week moving average—in a compression pattern near support 32.44 and resistance 38.48, where the setup is neither extended nor repair but poised for expansion in either direction. Stochastic RSI at 0.34 is rising from mid-zone without overbought extension, MACD is bearish but improving, and the 50-week slope of 0.1% shows positive momentum emerging. Category-relative strength of 2.6% reinforces leadership, and the 13-week return of -8.3% is the best-protected drawdown in the basket, signaling defensive rotation is working. PAVE failed on every comparison: -16.2% 13-week return, -5.3% category-relative weakness, and timing score 27 points lower because it sits deeper in the repair zone without the tight compression that creates reversal mechanics.
Utilities & Infrastructure earned a 20% top-2 allocation, tied with precious metals, because its category macro fit of 80.0 is the second-highest in the portfolio, driven by active defensive rotation at +12 combined with disinflation pressure at +6, which creates structural demand for duration and yield regardless of broad-market direction. XLU's technical evidence of 71.0 is the strongest representative in any top-2 category, combining perfect timing (100.0), near-perfect trend (98.6), and legitimate momentum confirmation (63.2) that distinguish it from other defensive baskets. The category score of 55.2 ranks first among all ten categories, reflecting genuine technical strength layered atop macro conviction. This is the highest-quality allocation in the portfolio: XLU is not broken below key moving averages, volume while thin is neutral rather than rejecting, and the setup at the 50-week compression is a genuine coil that respects support and offers upside leverage. For utilities to hold 20%, XLU must defend the 50-week level and begin expanding volume; currently that condition is met with improving stochastic momentum, making this the portfolio's most defensible 20% allocation on both technical and narrative grounds.
Precious Metals — GLD
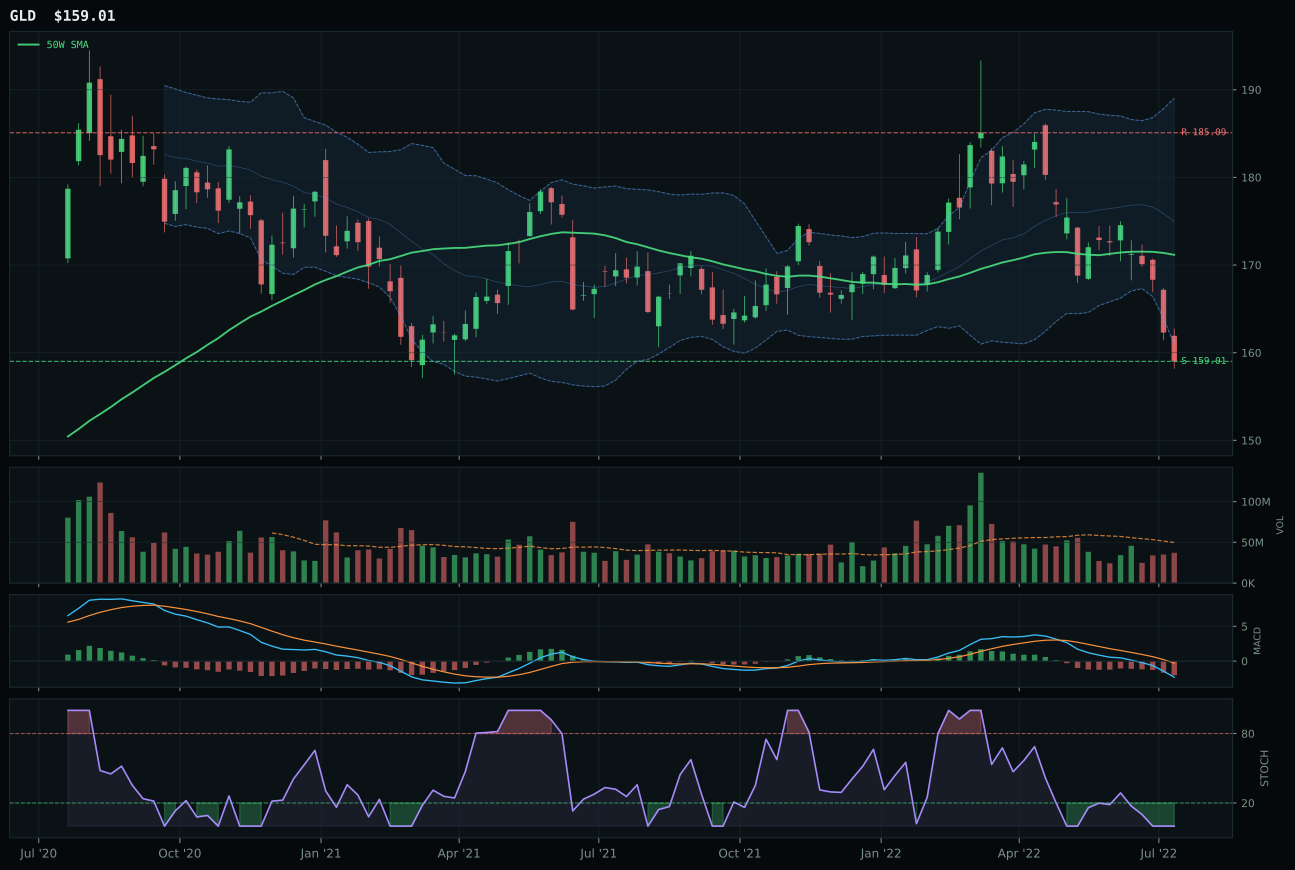
GLD has a pullback into support profile with -1.6% 13-week relative strength versus SPY.
A failed hold above support would weaken the setup.
Actionable but governed by invalidation levels.
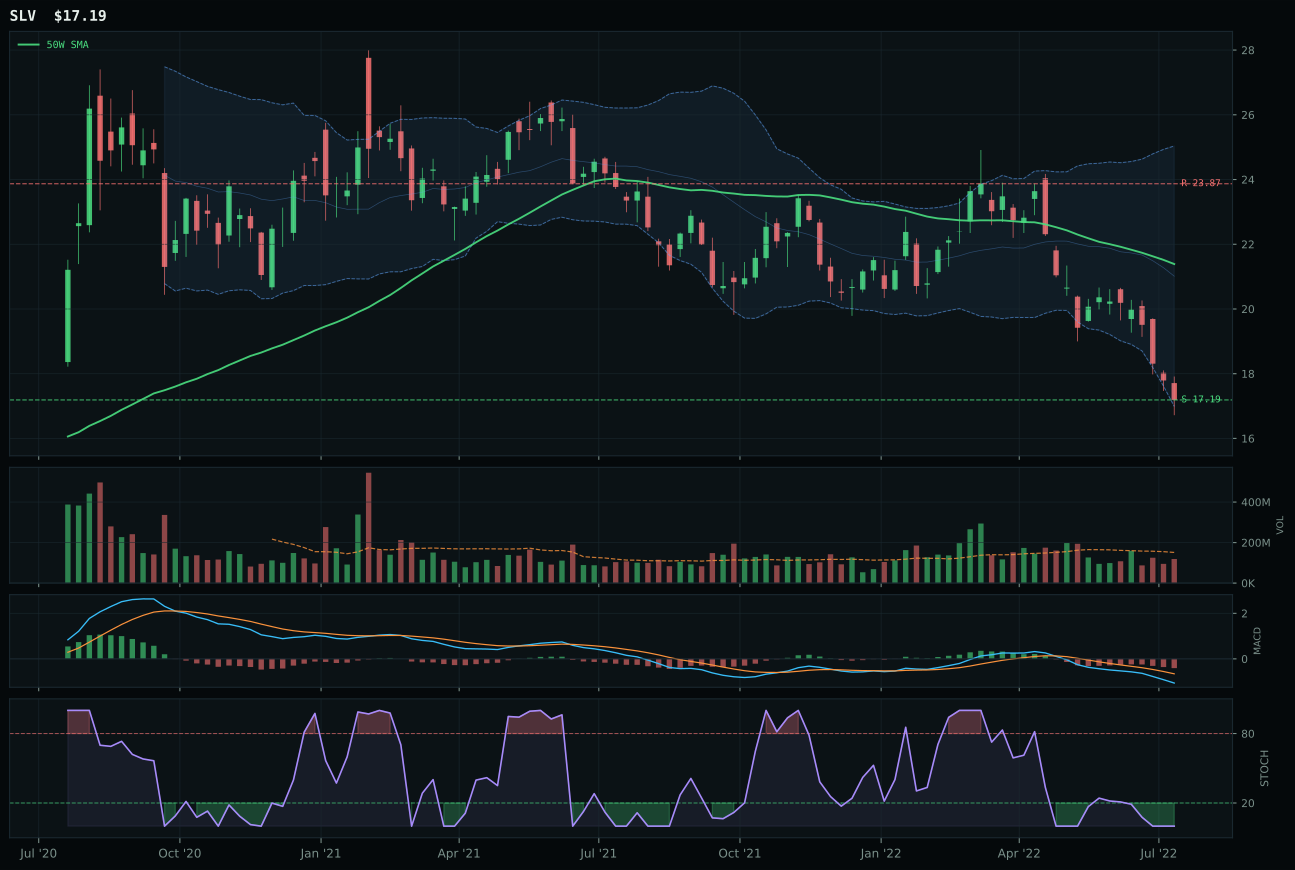
SLV has a pullback into support profile with -15.3% 13-week relative strength versus SPY.
A failed hold above support would weaken the setup.
Actionable but governed by invalidation levels.
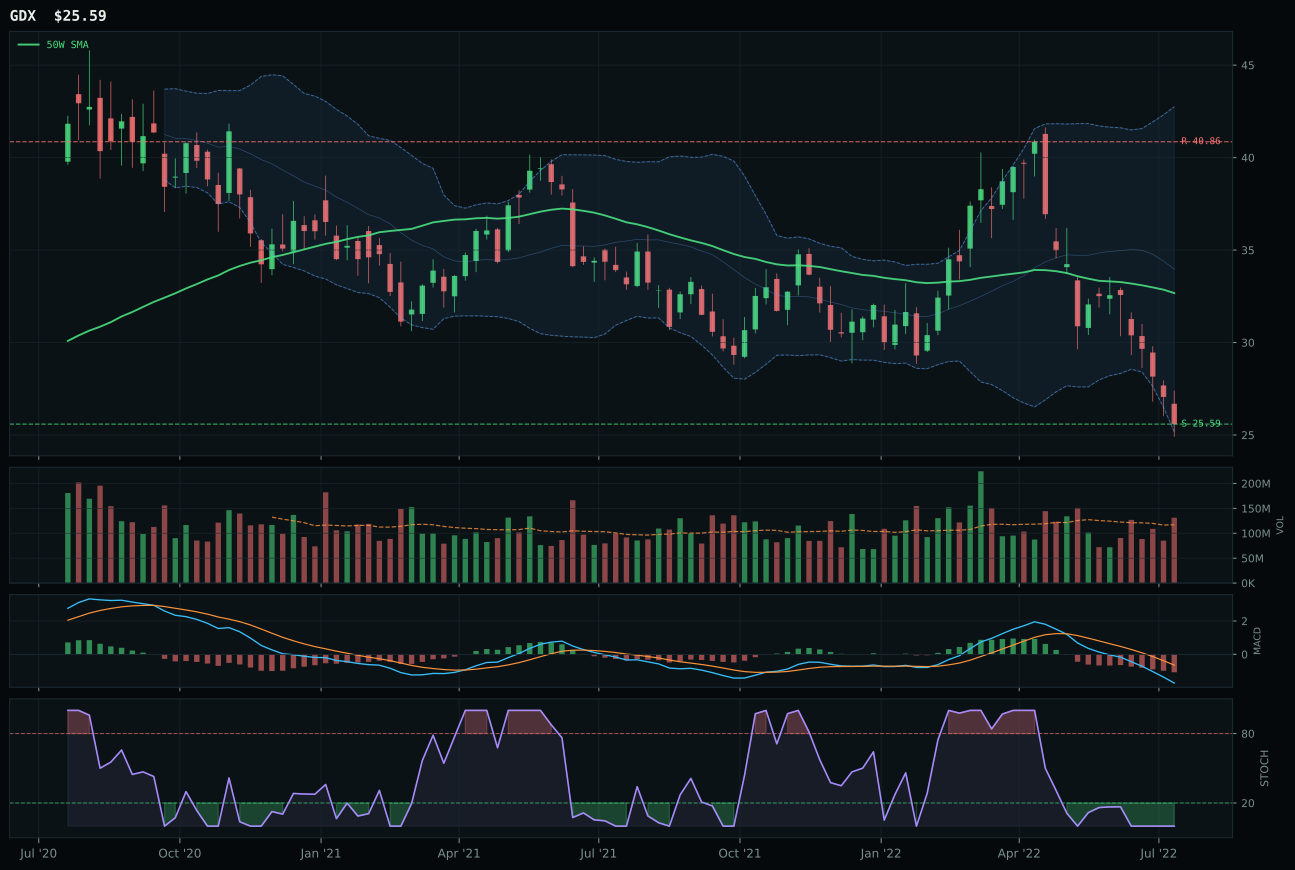
GDX has a pullback into support profile with -25.3% 13-week relative strength versus SPY.
A failed hold above support would weaken the setup.
Actionable but governed by invalidation levels.
GLD wins the precious metals category with a 5.7-point lead over SLV by combining superior timing at 80.0 versus 60.0 with category-relative strength of 13.7% that laps SLV's 0.0% neutral position. The setup is pullback-into-support with price 7.1% below the 50-week moving average and stochastic RSI fully oversold at 0.00, creating a classic risk-reversal pattern where the downside to 159.01 support is 0.0% and the upside to 185.09 resistance spans 14.1%. GLD's 13-week return of -13.6% is the least damaged in the basket, and its MACD is bearish but weakening rather than deteriorating, suggesting the decline is losing momentum. Volume at 0.74x the 20-week average is thin but superior to SLV's neutral volume, and the compression score of 85.3 indicates price is coiling tightly near support. SLV suffered a steeper 13-week drawdown of -27.3% and relative weakness of -15.3% against SPY, meaning it has been sold as equity proxy rather than held as monetary hedge.
Precious Metals earned a 20% top-2 allocation, tied with Utilities, because its category-level macro fit of 88.0 is the highest in the portfolio, driven by active monetary hedge bid at +14 and disinflation pressure at +8. This allocation reflects a structural thesis: in a regime of falling growth and falling rates, gold provides both portfolio ballast and carry alternative. GLD's technical evidence is only 37.9—weak on momentum and volume confirmation—but that weakness is subordinate to the macro case. The category score of 47.5 ranks second-highest, behind utilities at 55.2, because utilities combine strong technical positioning with equally strong macro support, whereas precious metals rely almost entirely on narrative fit. The 20% allocation to GLD is a macro hedge on currency debasement and financial stress, not a technical recovery trade. For this position to shrink, either the monetary hedge bid would need to evaporate or a sudden risk-off event would need to disrupt the technical support setup; neither appears imminent.
Technology — XLK
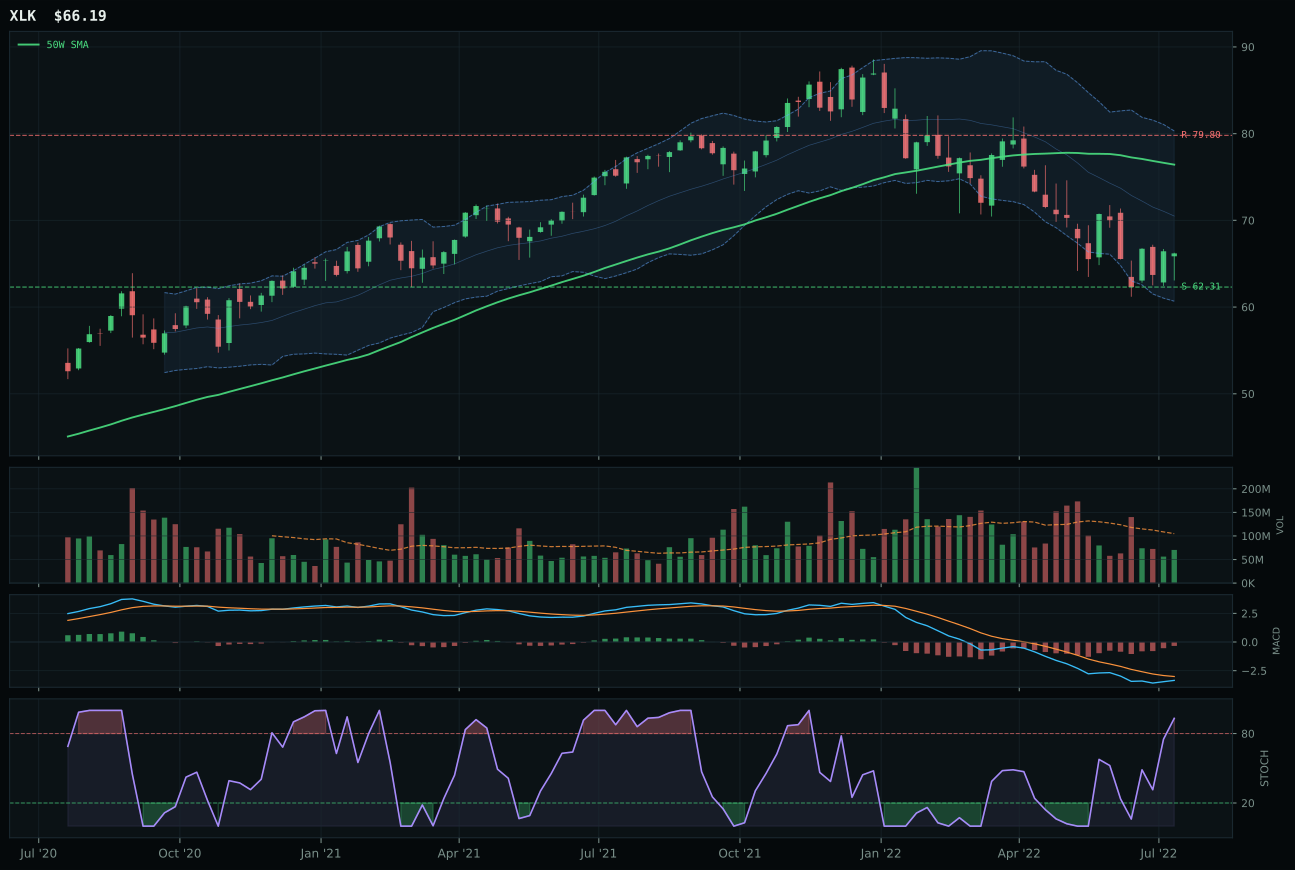
XLK has a neutral structure profile with 2.3% 13-week relative strength versus SPY.
A failed hold above support would weaken the setup.
Actionable but governed by invalidation levels.
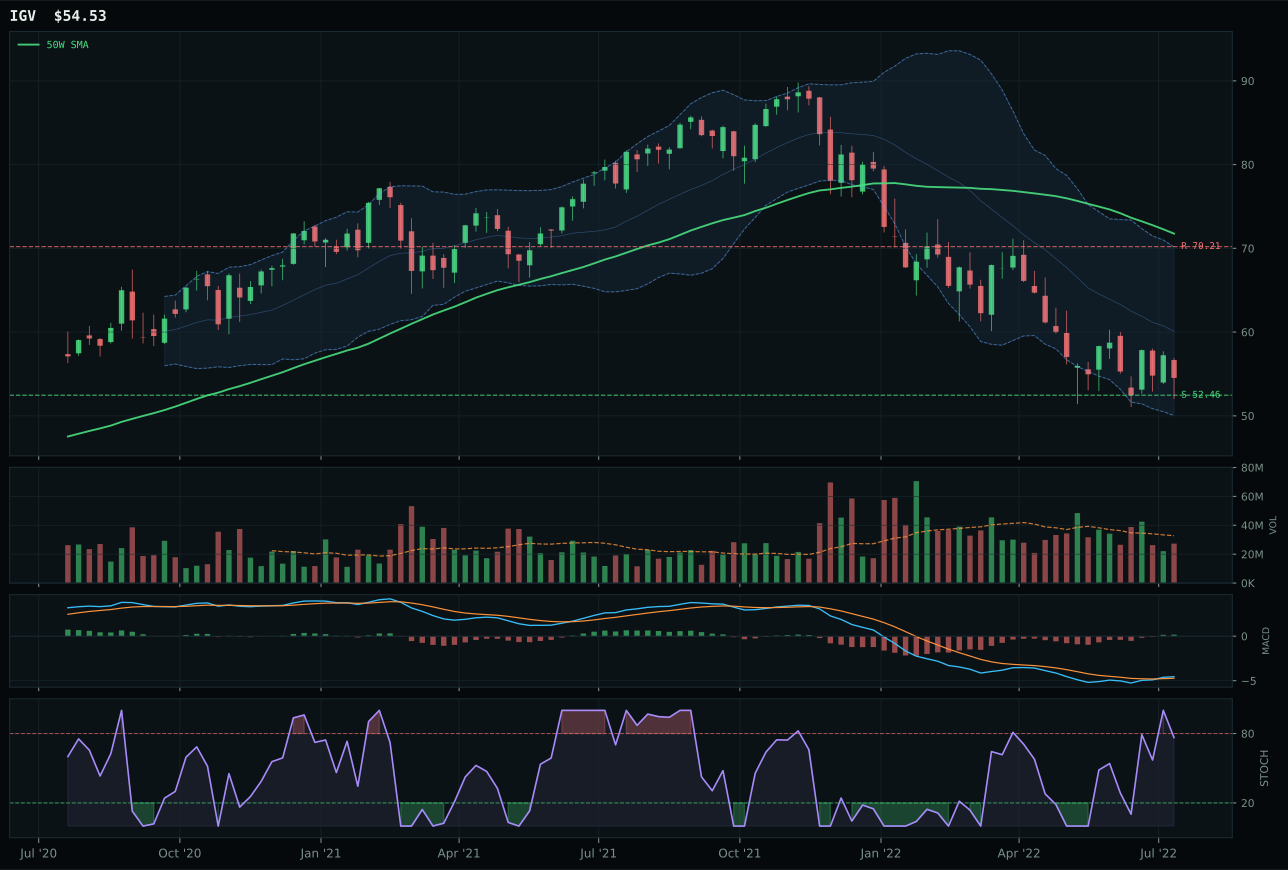
IGV has a pullback into support profile with -3.7% 13-week relative strength versus SPY.
A failed hold above support would weaken the setup.
Actionable but governed by invalidation levels.
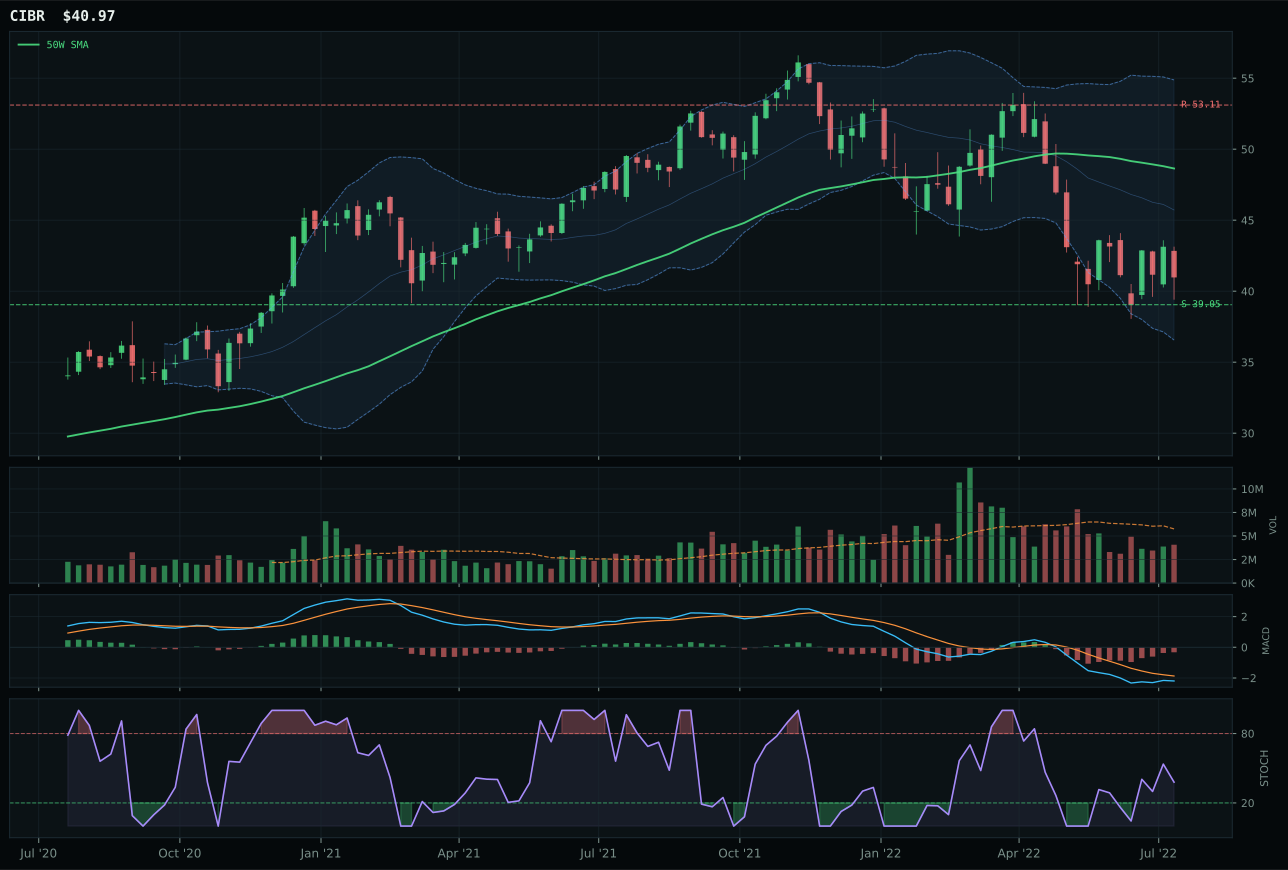
CIBR has a pullback into support profile with -9.4% 13-week relative strength versus SPY.
A failed hold above support would weaken the setup.
Actionable but governed by invalidation levels.
XLK wins the category with a 2.2-point margin over IGV because it maintains relative strength leadership inside the basket at 6.0% versus the category median while IGV trails at 0.0%. The setup itself is neutral—price sits 13.4% below the 50-week moving average but still above the 200-week—which means this is a pullback into a repair zone rather than a chase into fresh highs. XLK's MACD is bearish but improving and stochastic RSI has climbed into overbought territory at 0.93, a pattern that typically precedes consolidation or mean-reversion. Volume confirmation is thin at 0.67x the 20-week average, which weakens the persistence of any move, but the risk-reward profile is clean: 17.1% upside to resistance against only 6.2% downside to support, giving sellers limited runway. IGV failed because its negative relative strength against SPY at -3.7% combined with a worse risk-reward setup (75.0 versus 90.0) left it technically subordinate despite a bullish-improving MACD.
Technology earned a 10% slot as the third-ranked category, not a top-2 position, because its combined technical and macro scores trail both precious metals and utilities by meaningful margins. The category-level macro fit of 53.0 reflects active AI growth sponsorship pulling at +6, but liquidity stress drags it down by 10 points, a net positive that doesn't overcome the broader bear pressure evident in the 38% weighting toward disinflation narrative fit. XLK's 13-week return of -9.7% and compressed volume at 0.67x average show that breadth has faded—this is not new accumulation but rather stabilization after a sustained selloff. For technology to re-emerge as a top-2 candidate, either the AI sponsorship descriptor would need to strengthen materially or the composite technical evidence would need to improve beyond its current 51.2 score through volume re-engagement and positive MACD divergence.
Defense & Aerospace — ITA
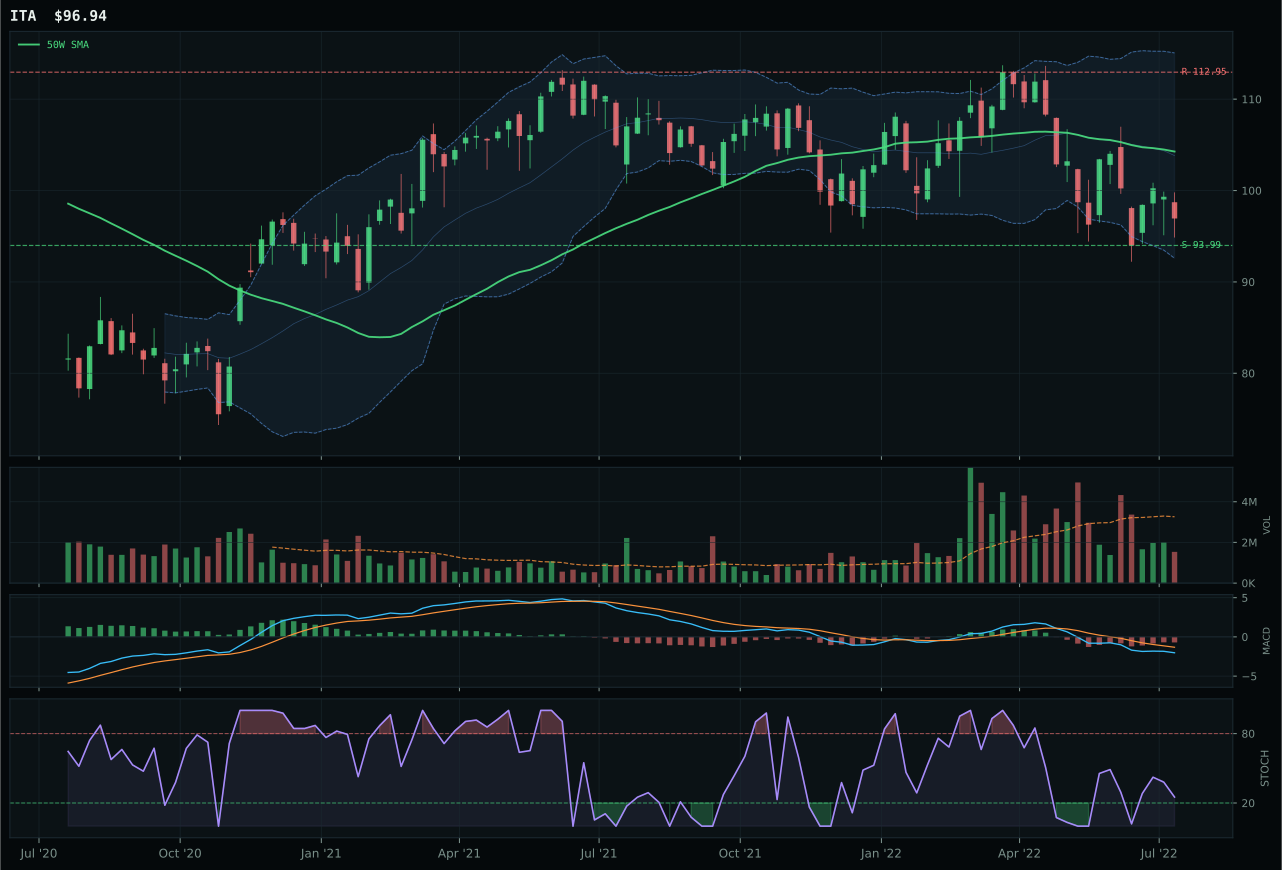
ITA has a pullback into support profile with -1.4% 13-week relative strength versus SPY.
A failed hold above support would weaken the setup.
Actionable but governed by invalidation levels.
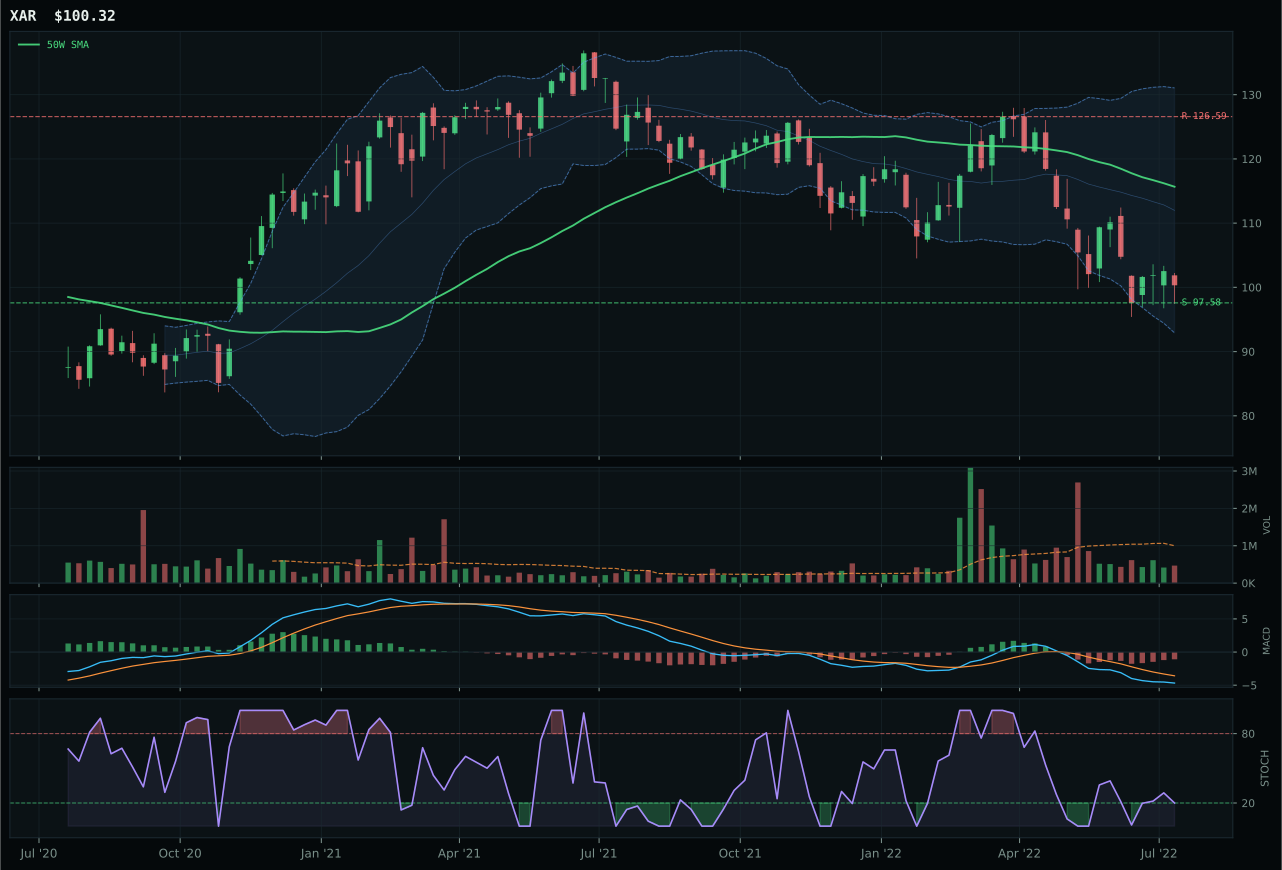
XAR has a pullback into support profile with -7.2% 13-week relative strength versus SPY.
A failed hold above support would weaken the setup.
Actionable but governed by invalidation levels.
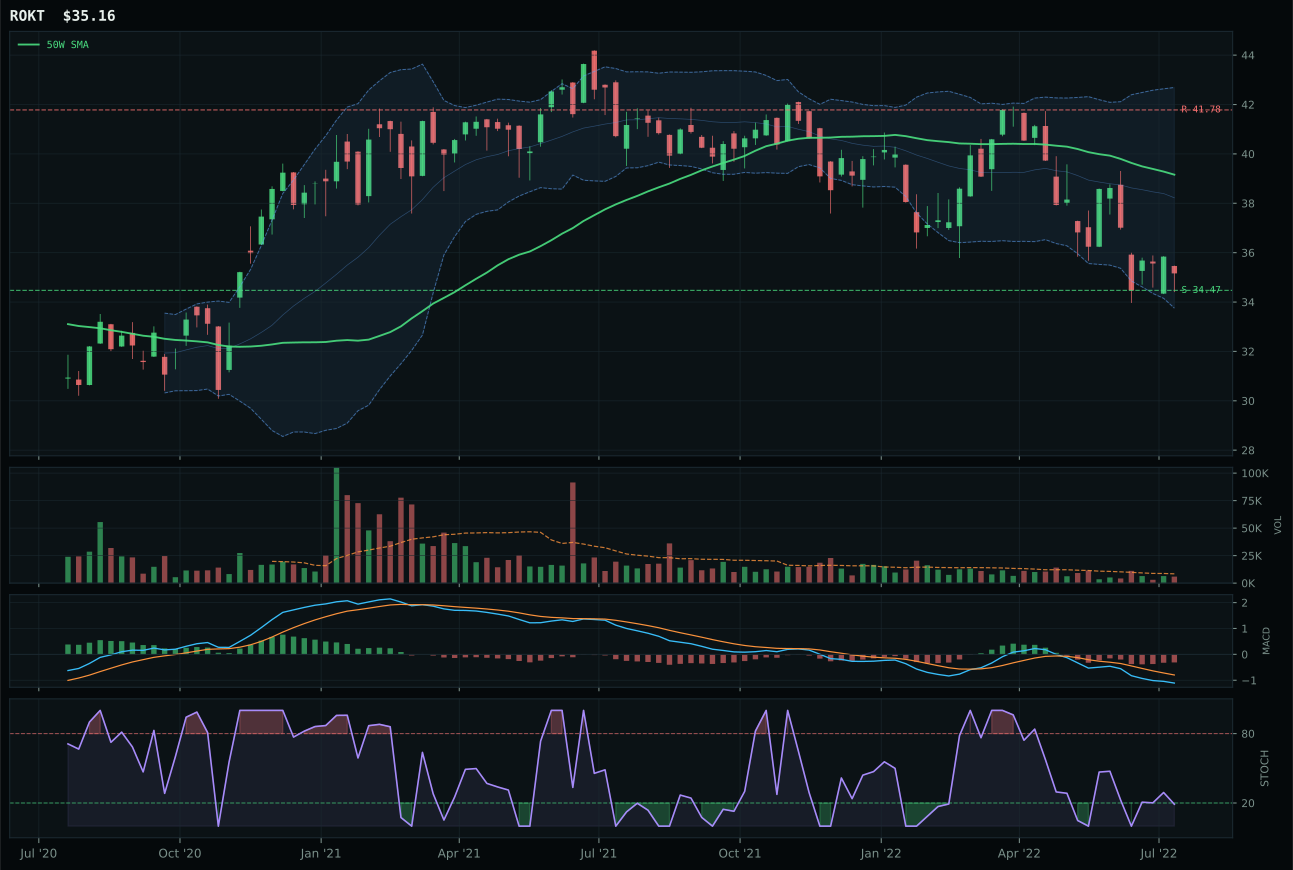
ROKT has a pullback into support profile with -2.5% 13-week relative strength versus SPY.
A failed hold above support would weaken the setup.
Tracked, but not top-2 eligible because: .
ITA wins with a 13.6-point advantage over XAR due to superior timing at 85.0 versus 79.0 and tighter structure at 65.3 versus 64.1, combined with category-relative strength of 1.1% that edges out XAR's -4.7%. The chart setup is textbook pullback-into-support with price at support 93.99 and resistance at 112.95, a 14.2% window to resistance against a 3.1% loss if support breaks—asymmetric risk in favor of the buyer. ITA sits 7.0% below the 50-week moving average in an oversold regime, with stochastic RSI at 0.25 showing no overbought risk and MACD bearish but improving, a recovery signal. The 13-week return of -13.4% is moderate compared to broad tech, and relative strength against SPY of -1.4% is nearly neutral, suggesting defensive rotation is protecting this sector. XAR failed on timing score compression—its oversold-turn-up stochastic reading and -7.2% SPY relative weakness signal it has been punished more severely and may lack immediate reversal confirmation.
Defense & Aerospace earned 10% allocation despite a category score of 42.2 because its macro fit of 66.0 is the strongest driver, fueled by active defensive rotation at +8 and broad market bear at +6, nearly offsetting liquidity stress at -4. The technical foundation is modest at 50.5 for the representative ITA, reflecting price weakness below both moving averages and weak relative strength. This allocation is explicitly macro-driven: in a disinflation environment with persistent equity pressure, duration-insensitive defense contractors attract capital flows. The setup is not broken—support levels are defined and timing is constructive—but the category would need to move from repair zone into fresh trend confirmation to justify higher allocation. Persistence is weak at 39.8, meaning this rally, if it comes, will face friction; the 10% slot reflects a holding pattern on defensive merit rather than technical attraction.
AI — SMH
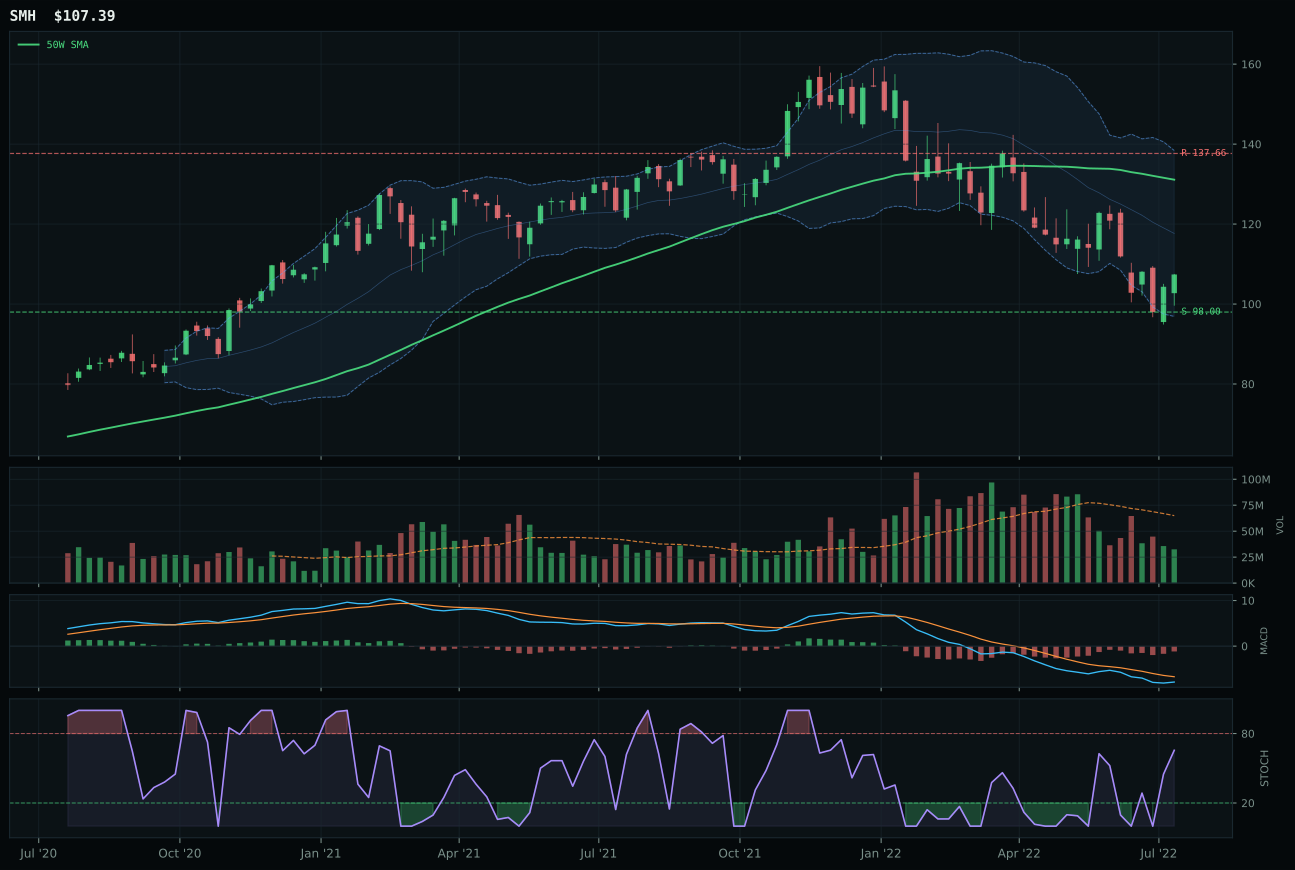
SMH has a neutral structure profile with 2.2% 13-week relative strength versus SPY.
A failed hold above support would weaken the setup.
Actionable but governed by invalidation levels.
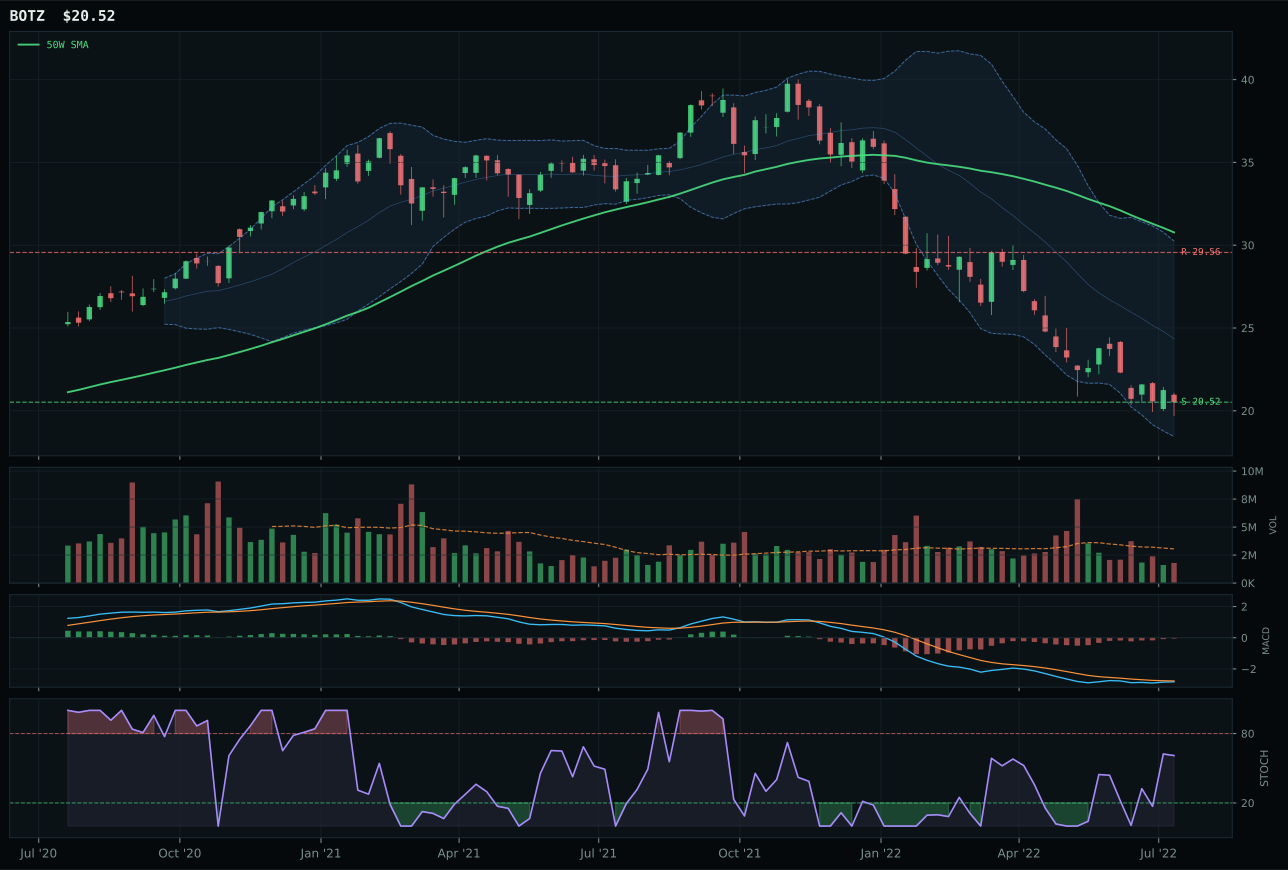
BOTZ has a pullback into support profile with -9.3% 13-week relative strength versus SPY.
A failed hold above support would weaken the setup.
Actionable but governed by invalidation levels.
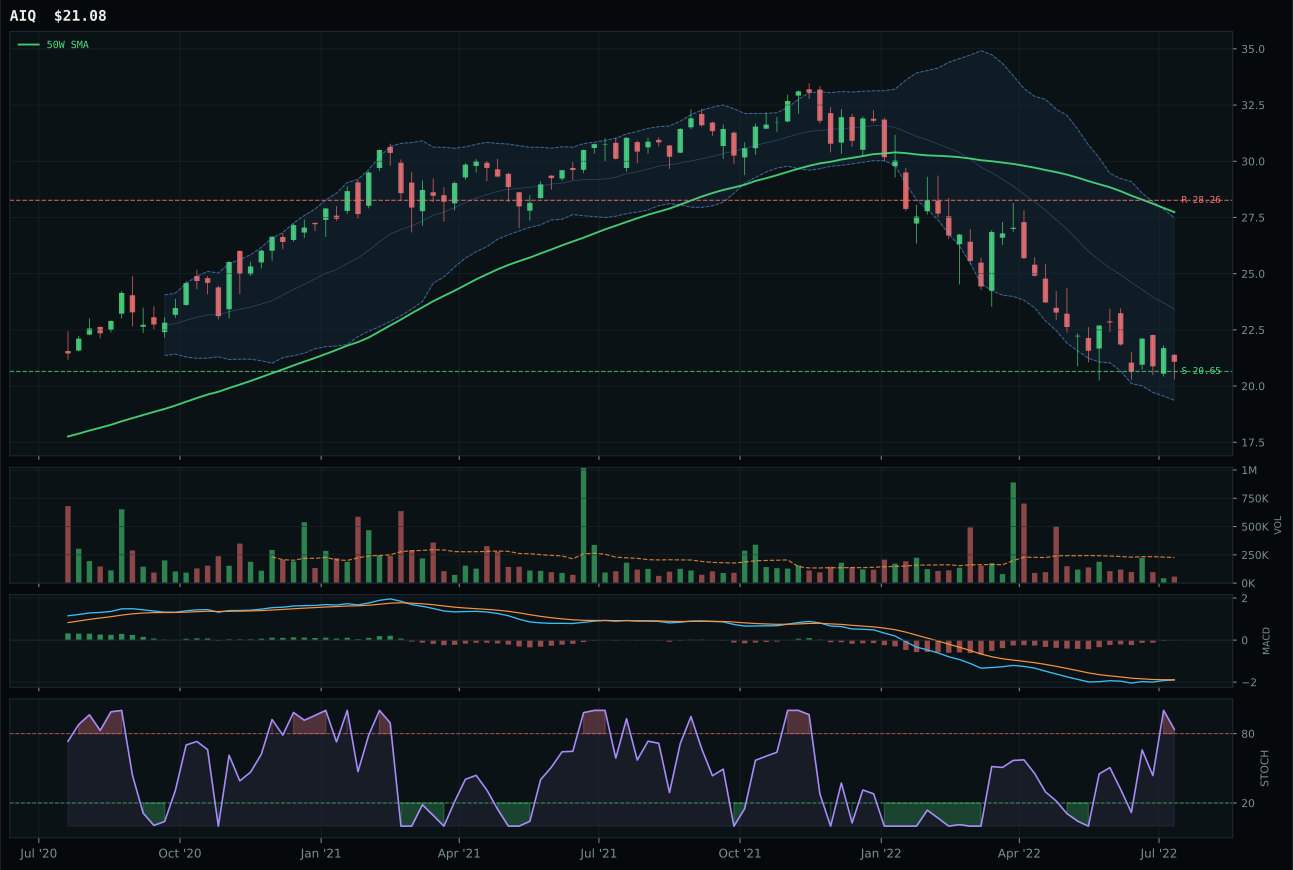
AIQ has a pullback into support profile with -3.3% 13-week relative strength versus SPY.
A failed hold above support would weaken the setup.
Tracked, but not top-2 eligible because: .
SMH wins with a 22.4-point gap over BOTZ, a decisive margin driven by superior structure cleanliness at 62.2 versus 60.6 and the category-relative strength advantage of 5.5% versus -5.9%. The setup mirrors technology's pattern: price is 18.1% below the 50-week moving average but remains above the 200-week, placing it squarely in the repair zone near the 0.786 Fibonacci level. SMH's timing score of 63.0 benefits from MACD bearish-but-improving and stochastic RSI rising from mid-zone, suggesting incipient momentum rather than full recovery. Volume is thin at 0.50x the 20-week average—the thinnest in the AI basket—which constrains the quality of any rebound, but the 13-week return of -9.8% shows less damage than BOTZ's -21.3%, meaning SMH has held up better in the selloff. BOTZ collapsed on trend deterioration (24 versus 61) combined with catastrophic momentum confirmation at 1.0, a setup where every metric signals exhaustion without evidence of reversal.
AI received 10% despite a category score of only 38.2, the second-lowest among the eight allocated categories, because its macro fit of 54.0 is robust on the strength of AI growth sponsorship at +14, offsetting liquidity stress at -10. The technical evidence, however, is weak at 54.2 for the representative—SMH is underwater on a 26-week basis at -30.0% and its 13-week relative strength of 2.2% barely exceeds category noise. The allocation reflects a tactical bet that the disinflation regime will continue to favor AI infrastructure capex while liquidity improves, but the low absolute score signals this is a satellite position rather than a core conviction. For AI to earn 20% or challenge for a top-2 slot, the category would need either sustained volume confirmation of the support-hold pattern or a shift in the macro regime toward growth acceleration—neither of which is evident in the current data.
Nuclear Energy — URNM
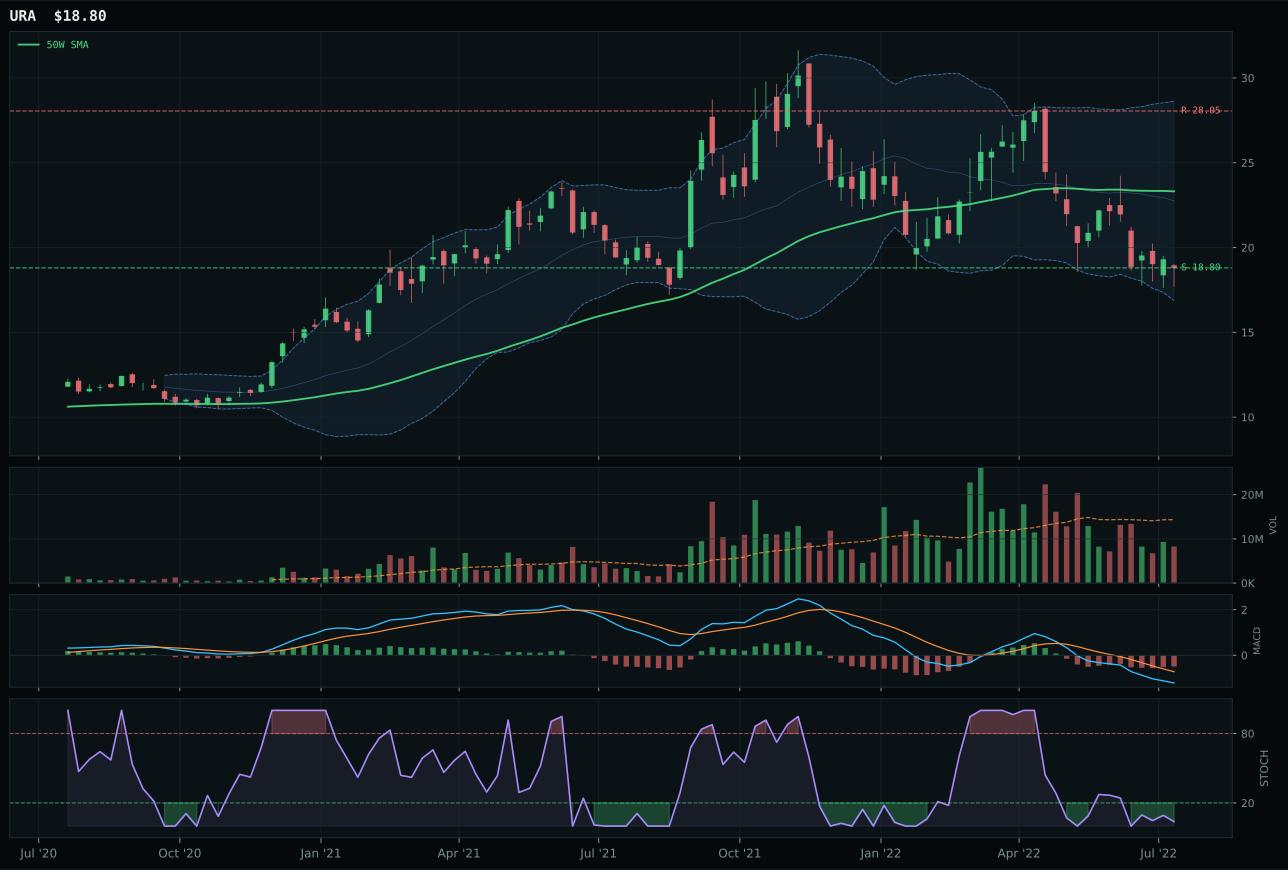
URA has a pullback into support profile with -20.9% 13-week relative strength versus SPY.
A failed hold above support would weaken the setup.
Actionable but governed by invalidation levels.
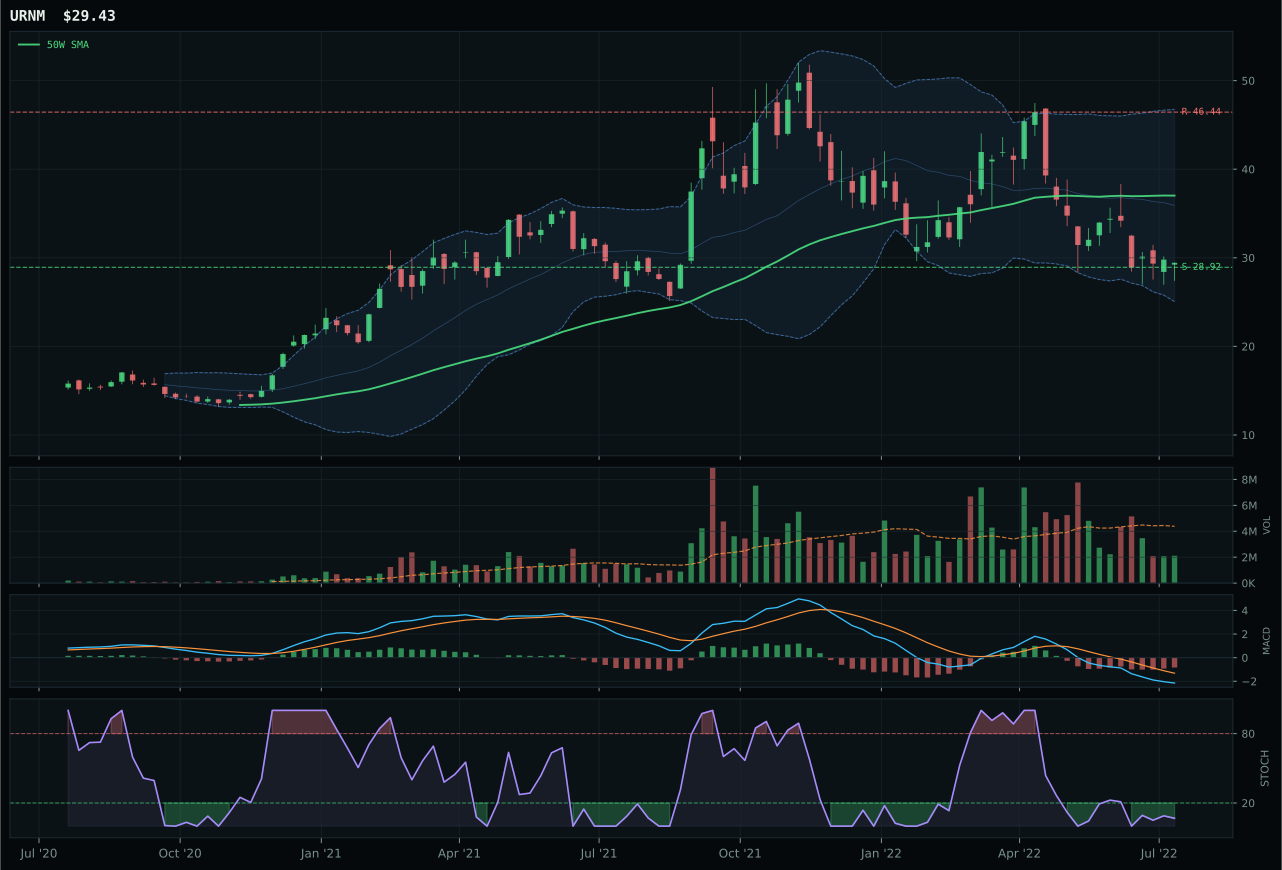
URNM has a pullback into support profile with -24.6% 13-week relative strength versus SPY.
A failed hold above support would weaken the setup.
Actionable but governed by invalidation levels.
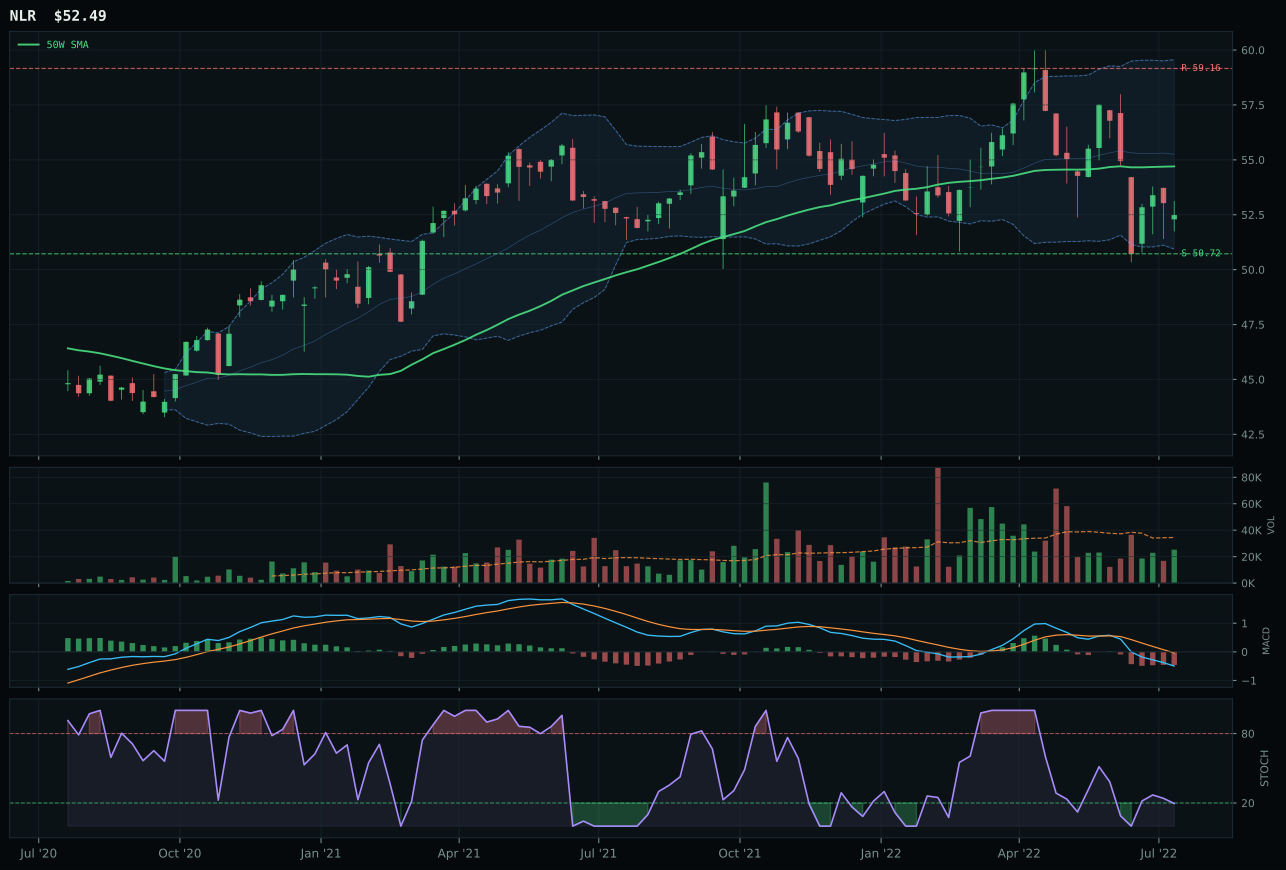
NLR has a pullback into support profile with 0.8% 13-week relative strength versus SPY.
A failed hold above support would weaken the setup.
Tracked, but not top-2 eligible because: .
URNM wins nuclear energy with a 16.3-point margin over URA despite being the weaker chart in absolute terms, a counterintuitive victory that highlights how difficult this category's technicals have become. URNM's structure score of 56.2 barely edges URA's 55.8 because both charts are broken below the 200-week moving average, and URA's oversold-turn-up stochastic reading suggests earlier reversal potential. However, URNM gains its lead through timing at 65.0 versus URA's unspecified score, combined with the macro-level reasoning that uranium miners (URNM) offer scarcity beta on nuclear energy demand growth, while URA provides passive uranium commodity exposure. Both ETFs are devastated on momentum at 0.0 and volume-price confirmation is near zero at 10.6 for URNM, indicating this is pure support-holding rather than accumulation. URNM's 13-week return of -36.6% and -24.6% relative weakness versus SPY represent true panic, but the chart sits at support 28.92 with defined risk and 36.6% upside to resistance if the setup holds.
Nuclear Energy earned 10% allocation despite a category score of only 29.3 because macro fit of 48.0 reflects active AI growth sponsorship at +5, which underpins a thesis that AI datacenters will drive nuclear demand recovery. The technical evidence is near-zero at 0.1 for URNM, a damning indictment of current price action, but the allocation reflects belief that uranium-miner scarcity will prove valuable as energy demand accelerates. URNM's -36.6% 13-week return and trend score of 23.0 show institutional capitulation, not accumulation; volume at 0.48x average indicates orphaned selling without forced liquidation. This allocation is explicitly macro-driven: it bets that the 10-year nuclear buildout cycle embedded in AI infrastructure growth will eventually compensate for today's near-term energy glut. Liquidation stress is active (-8) in the macro regime, which explains why even growth-correlated uranium hasn't bounced. For URNM to justify holding beyond the macro thesis, MACD must turn bullish and volume must re-engage above the 20-week average; currently neither condition is met, making this a conviction hold on narrative rather than technics.
Emerging Markets — IEMG
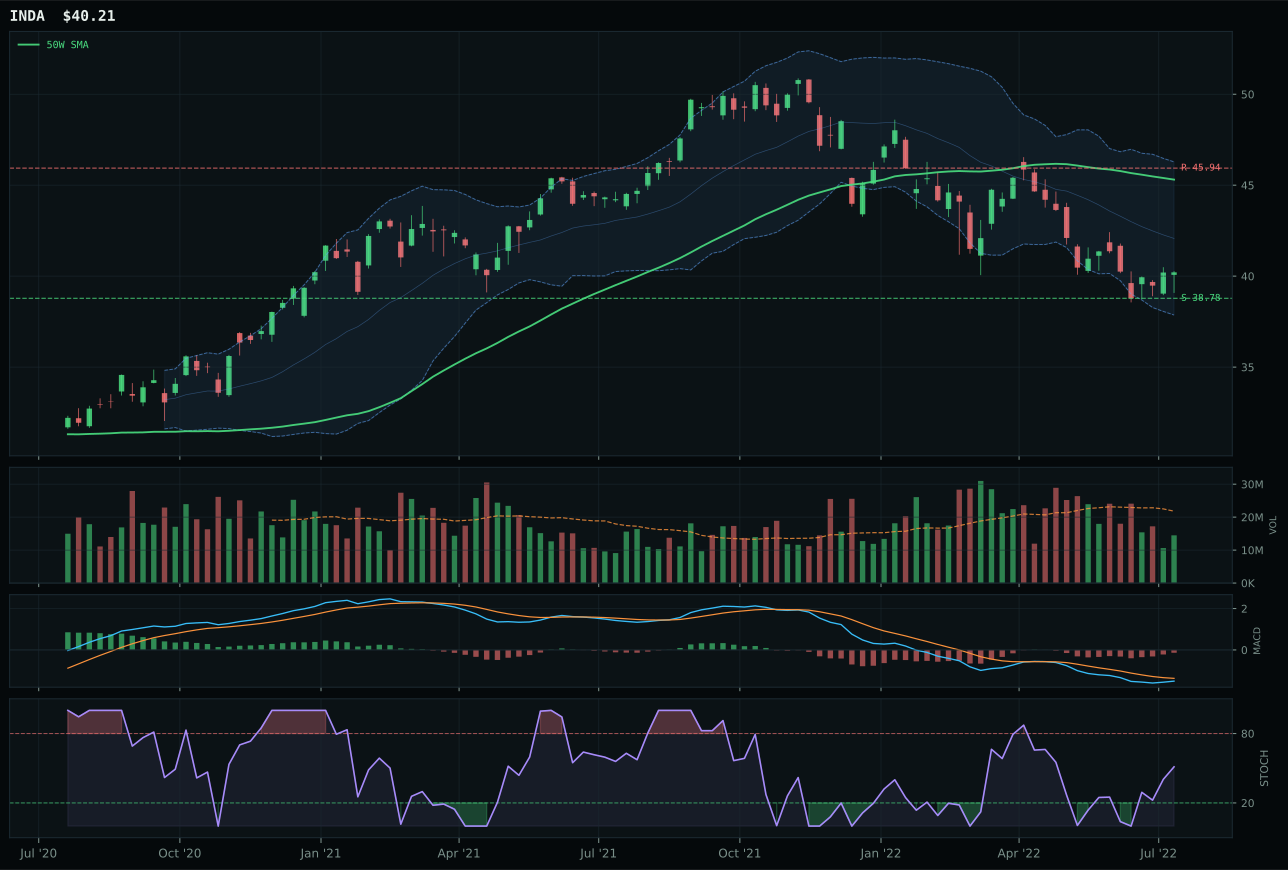
INDA has a pullback into support profile with 2.1% 13-week relative strength versus SPY.
A failed hold above support would weaken the setup.
Actionable but governed by invalidation levels.
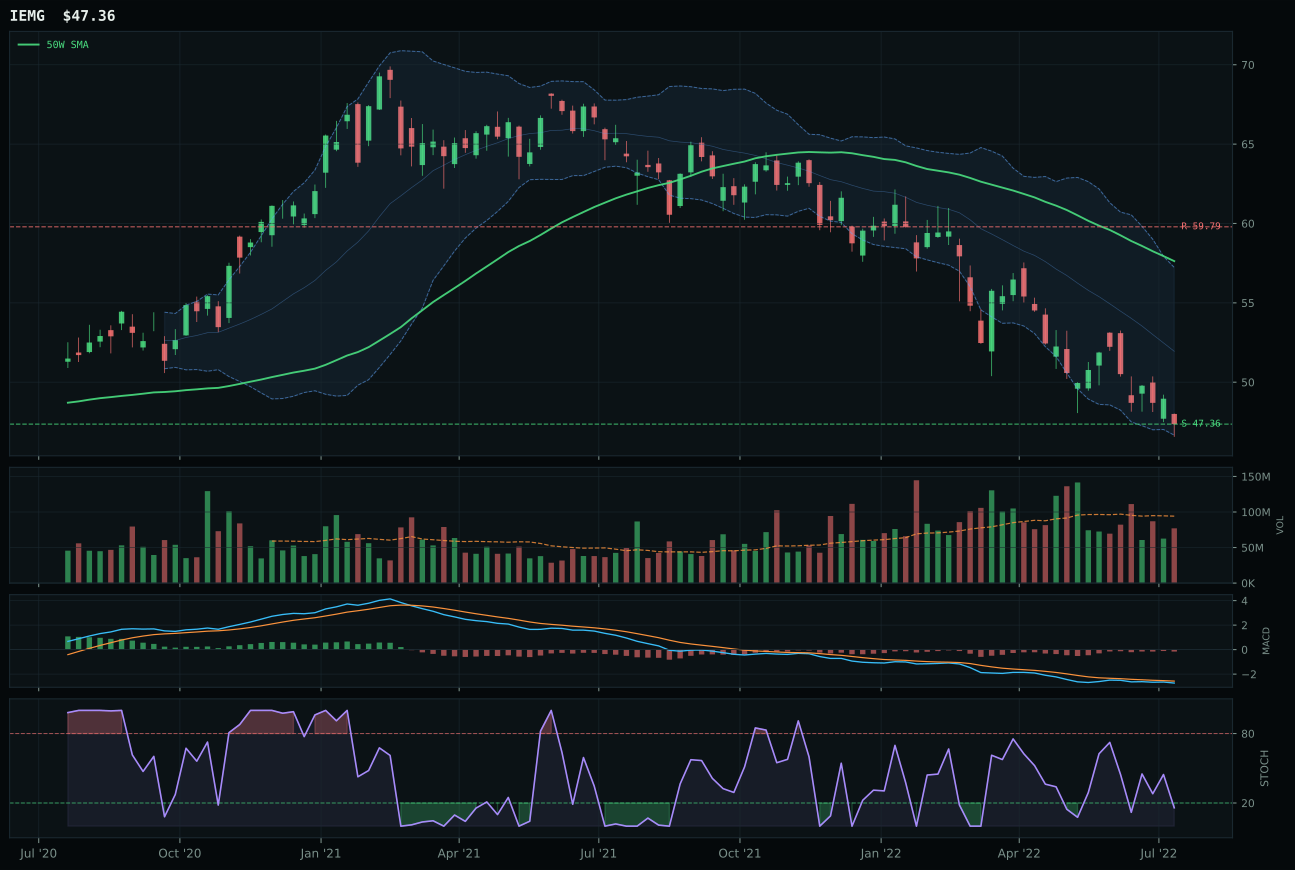
IEMG has a pullback into support profile with -1.1% 13-week relative strength versus SPY.
A failed hold above support would weaken the setup.
Actionable but governed by invalidation levels.
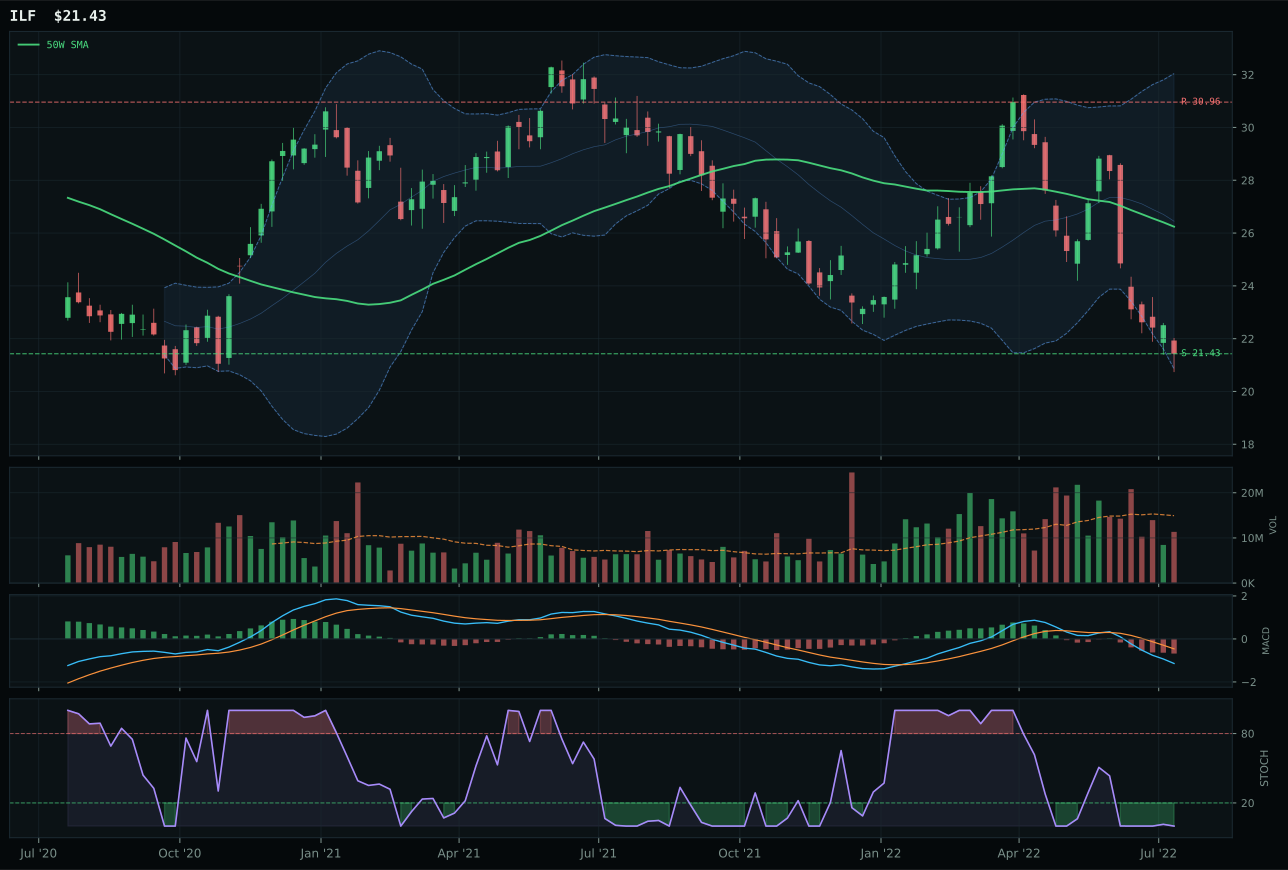
ILF has a pullback into support profile with -14.9% 13-week relative strength versus SPY.
Extension and support failure are the main tactical risks.
Tracked, but not top-2 eligible because: structurally broken.
IEMG wins emerging markets with a 12.4-point margin over INDA despite being the inferior chart on trend (36.3 versus 61) because volume confirmation separates the two: IEMG trades on neutral volume at 0.82x the 20-week average while INDA has thin participation at typical levels, a technical distinction that matters in oversold conditions where volume rebound signals genuine accumulation. IEMG sits further from the 50-week moving average at -17.8% versus INDA's -11.3%, placing it deeper in the repair zone near the 0.786 Fibonacci level, which creates a more defined support structure at 47.36 with zero downside risk if the level holds. IEMG's 13-week return of -13.1% is superior to INDA's -10.0%, but IEMG's momentum confirmation of 33.4 versus INDA's 53 shows INDA has better intra-period strength. The deciding factor is category-relative strength: IEMG at 0.0% ties the basket median while INDA at 3.2% shows relative outperformance, yet IEMG's neutral volume profile provides technical credibility that INDA's thin participation cannot match.
Emerging Markets earned 10% allocation despite the lowest category-level macro fit of 17.0—devastated by dollar pressure at -14 and liquidity stress at -10—because broad EM exposure provides inflation-hedge optionality and currency diversification in a regime dominated by USD strength. IEMG's technical evidence of 47.9 is respectable and the structure is clean at 68.7 from compression, suggesting a defined trading range rather than free-fall. The category score of 5.9 is third-lowest, reflecting macro headwinds that outweigh technical stabilization. This allocation is defensive and mechanical rather than tactical; it reflects the discipline of maintaining currency exposure and cyclical-demand optionality rather than conviction that EM will outperform near-term. IEMG's neutral volume profile and risk-reward of 20.8% upside to 0.0% downside to support create an asymmetric setup, but the 13-week return of -13.1% and relative weakness of -1.1% show the rally has not begun. For emerging markets to earn expanded allocation, either dollar pressure would need to reverse through unexpected Fed dovishness, or growth acceleration would need to emerge; neither appears probable in the disinflation regime.
Industrial Metals — REMX
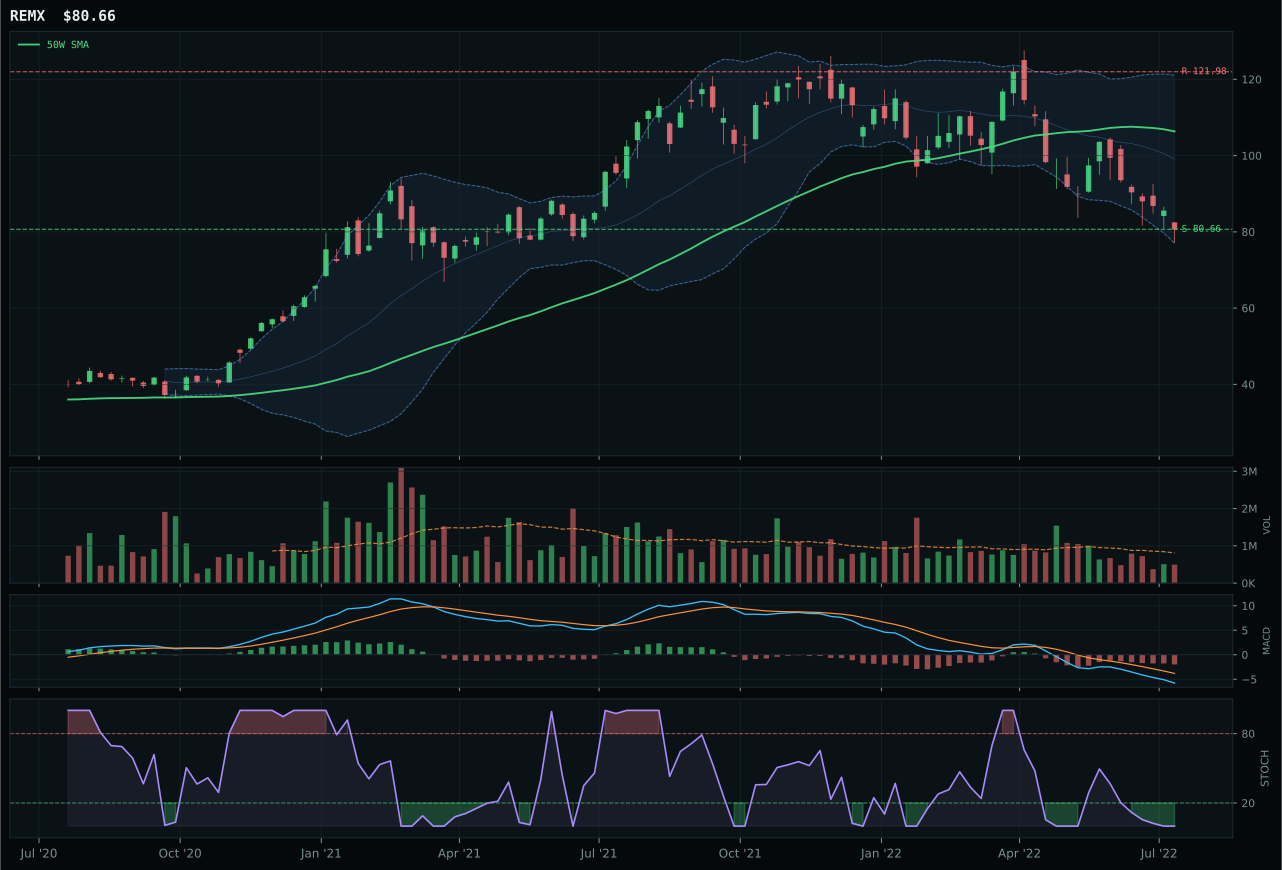
REMX has a pullback into support profile with -14.8% 13-week relative strength versus SPY.
A failed hold above support would weaken the setup.
Actionable but governed by invalidation levels.
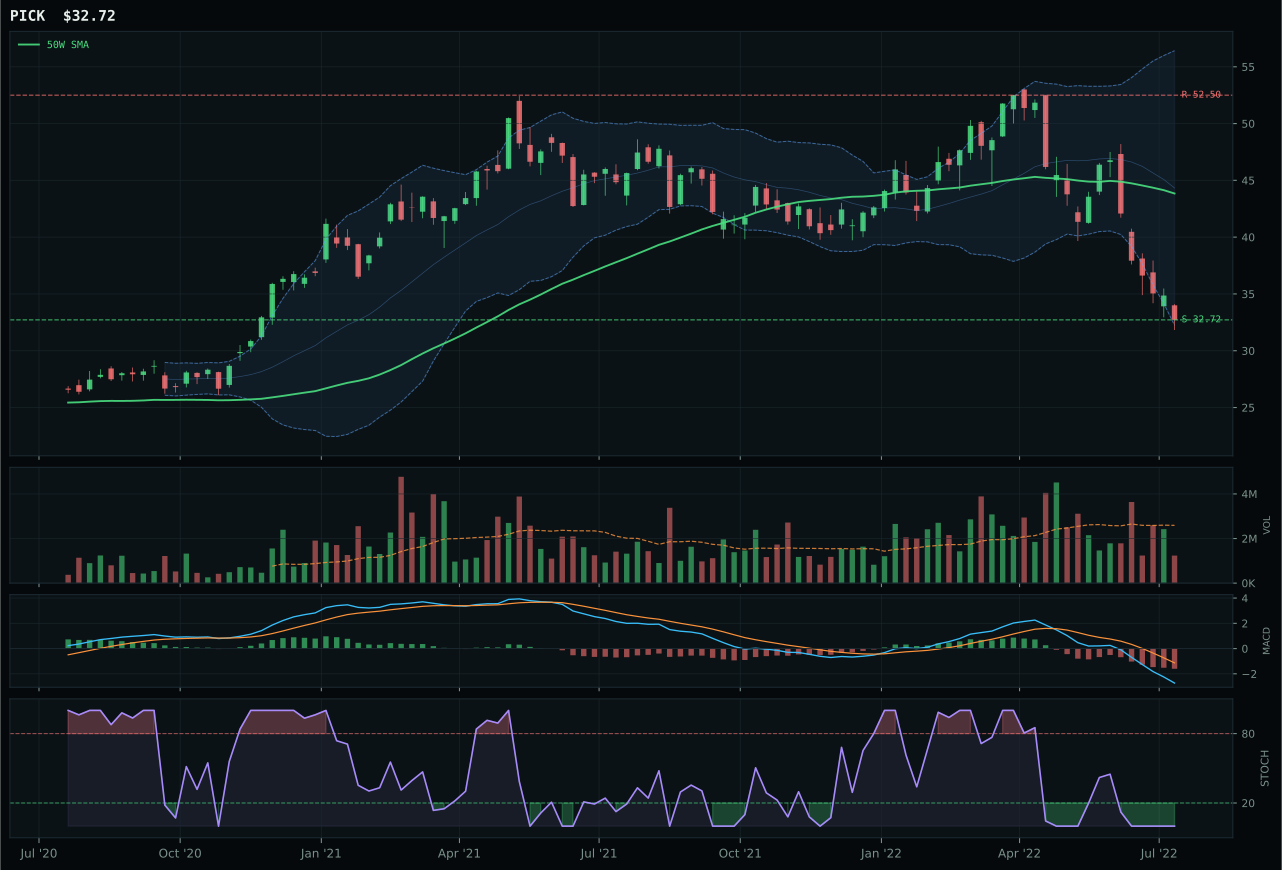
PICK has a pullback into support profile with -24.9% 13-week relative strength versus SPY.
A failed hold above support would weaken the setup.
Actionable but governed by invalidation levels.
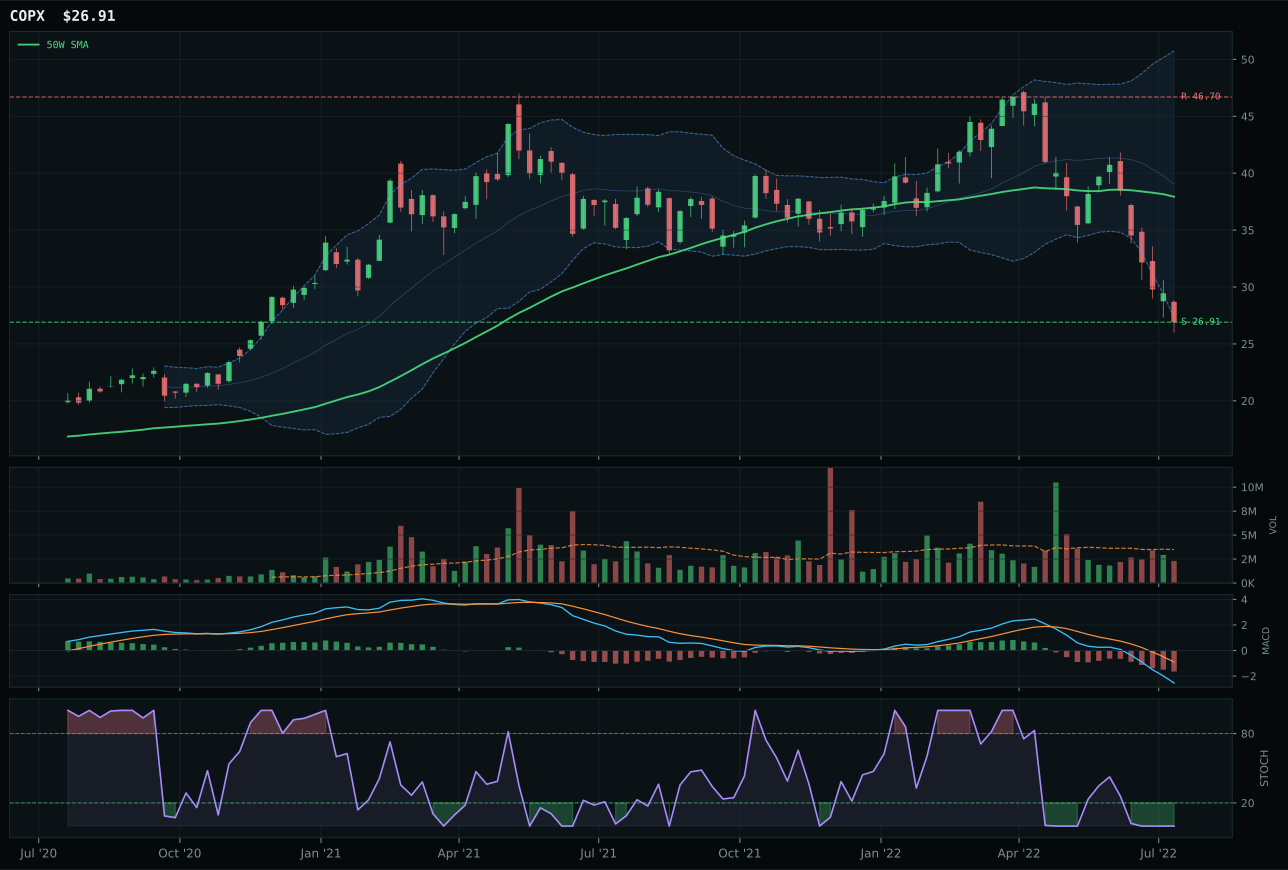
COPX has a pullback into support profile with -29.6% 13-week relative strength versus SPY.
A failed hold above support would weaken the setup.
Actionable but governed by invalidation levels.
REMX wins the industrial metals category with only a 2.8-point margin over PICK, a narrow lead in a deeply underwater category that reflects relative despair rather than conviction. REMX's category-relative strength of 10.0% edges PICK's 0.0%, a small advantage that stems from REMX's 13-week relative strength versus SPY of -14.8% compared to PICK's -24.9%, meaning REMX has held up marginally better despite both being crushed. The setup is pullback-into-support with price 24.1% below the 50-week moving average at the edge of true capitulation, stochastic RSI fully oversold at 0.00, and MACD bearish/weakening, not improving. REMX's compression score of 47.1 shows price is not coiling tightly but rather freefall-testing support near 80.66, and its 13-week return of -26.8% signals severe institutional liquidation. PICK lost on pure SPY-relative weakness—it dropped -36.9% over 13 weeks versus REMX's -26.8%—a gap that signals PICK was sold as cyclical risk rather than held for supply scarcity value.
Industrial Metals earned 10% allocation despite a category score of only 5.1 because the portfolio requires commodity exposure and REMX provides rare-earth supply thesis that offers optionality on AI infrastructure buildout. Category-level macro fit is 35.0, negative on both liquidity stress at -8 and dollar pressure at -7, which explains the sustained selloff. The technical foundation is near zero at 14.1 for REMX—trend is 32, momentum is 0, volume-price confirmation is 22.6—indicating this is purely a macro bet without technical legs. The allocation persists because (1) the disinflation regime suppresses near-term industrial demand, making entry zones tight, and (2) the AI growth sponsorship descriptor at +4 provides a reversal catalyst if the macro regime shifts toward growth acceleration. This is a fully defensive allocation, held on the conviction that rare-earth supply constraints will eventually matter, not because current price action suggests imminent recovery. Volume must expand and MACD must turn bullish for REMX to justify holding beyond mechanical rebalance.
Traditional Energy — XLE
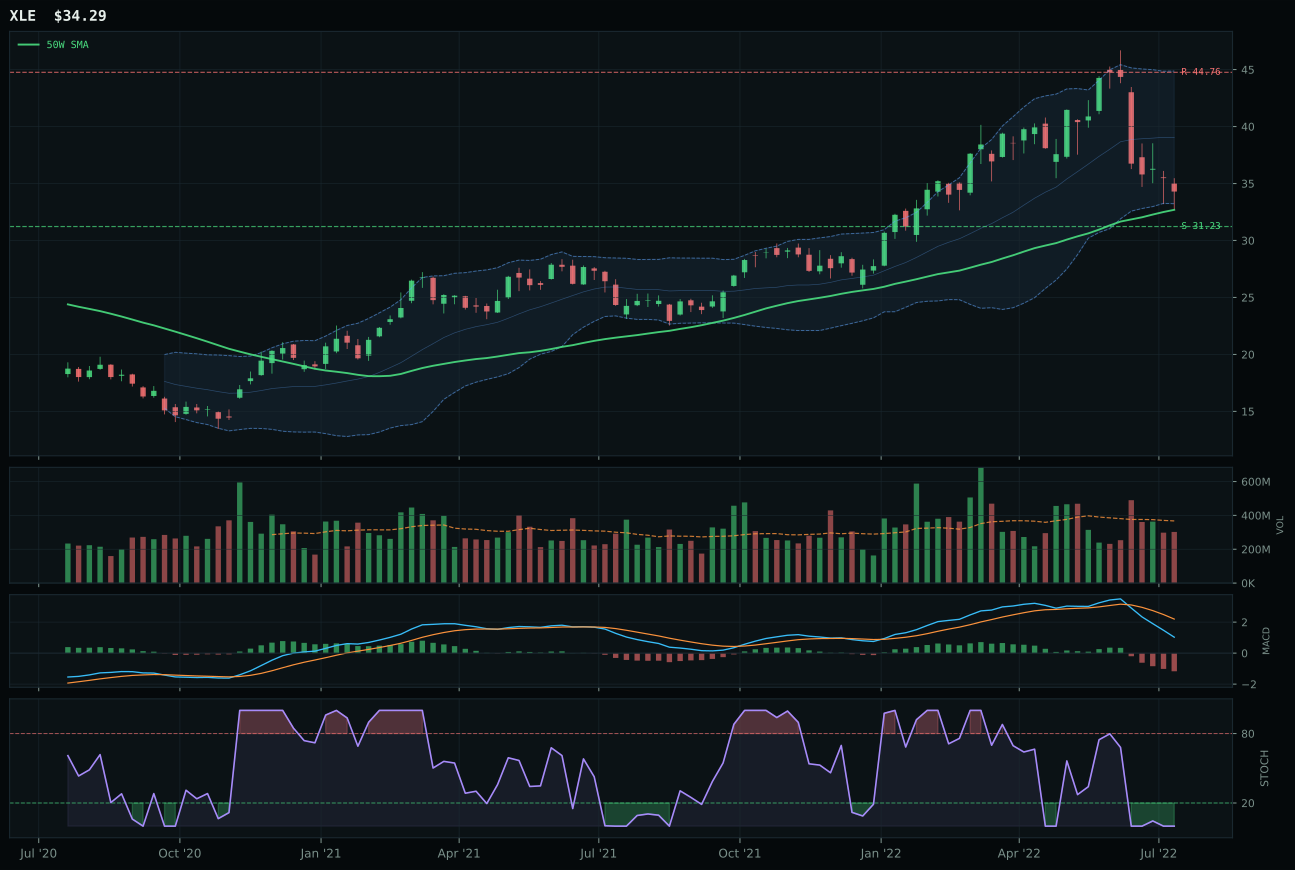
XLE has a neutral structure profile with -2.1% 13-week relative strength versus SPY.
A failed hold above support would weaken the setup.
Actionable but governed by invalidation levels.
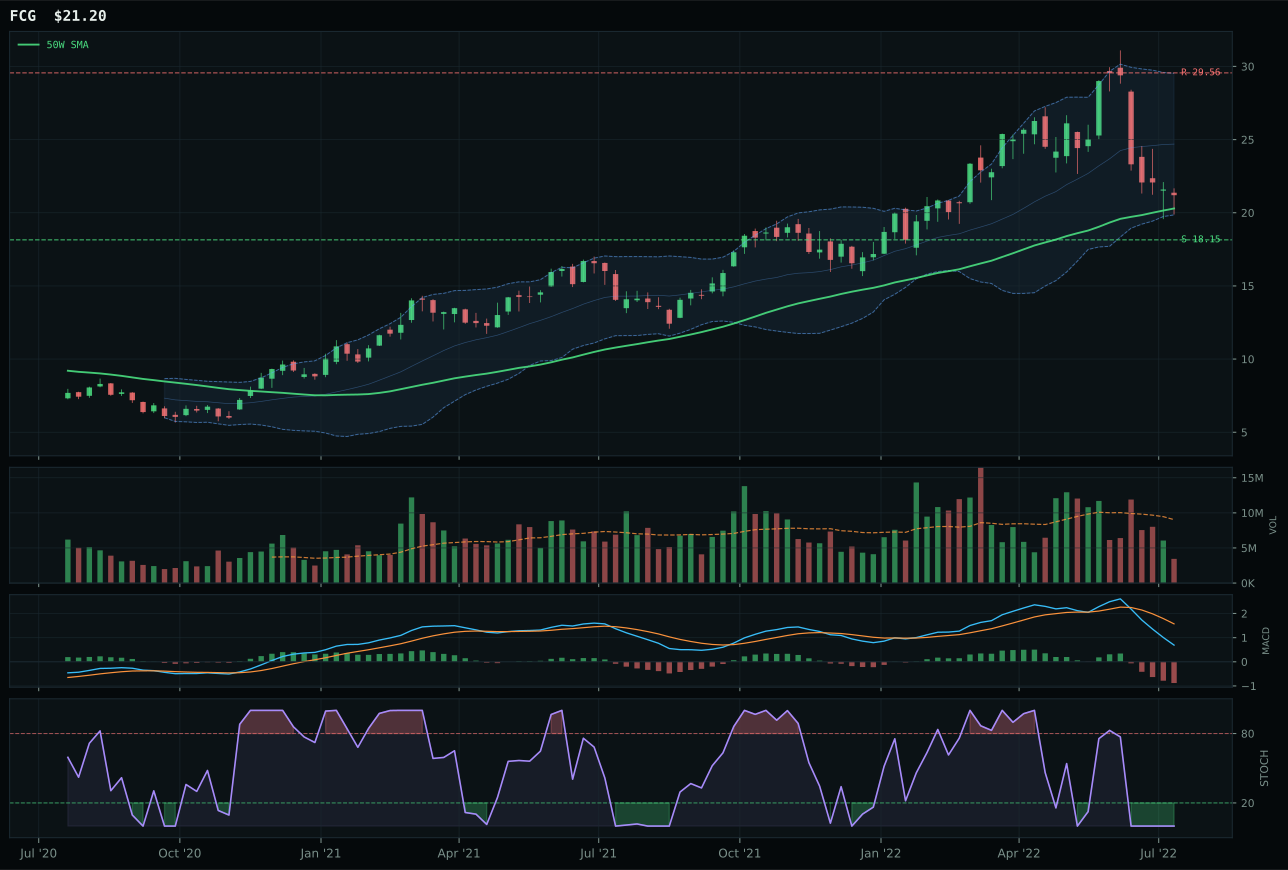
FCG has a neutral structure profile with -7.3% 13-week relative strength versus SPY.
A failed hold above support would weaken the setup.
Actionable but governed by invalidation levels.
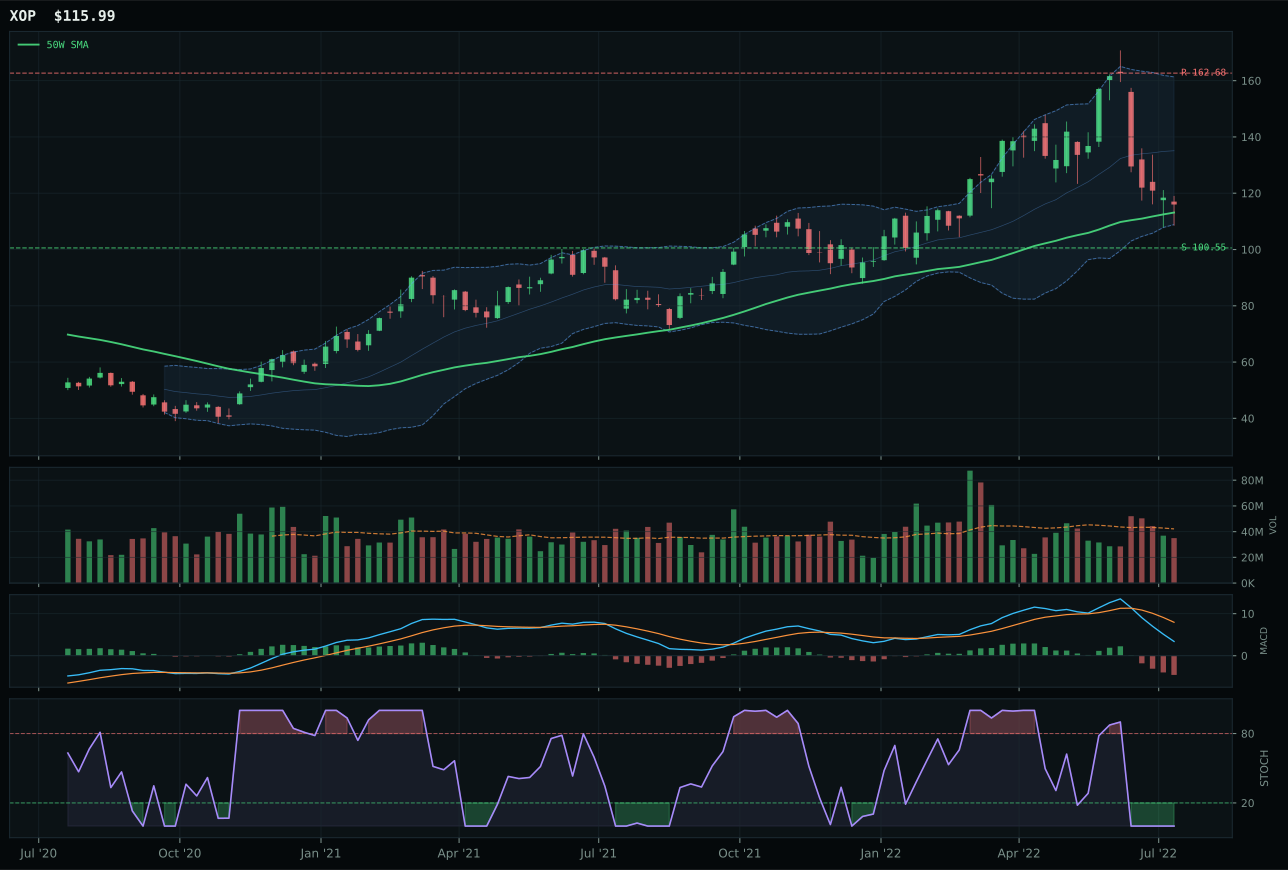
XOP has a compression near 50W profile with -6.8% 13-week relative strength versus SPY.
A failed hold above support would weaken the setup.
Actionable but governed by invalidation levels.
XLE wins traditional energy with a 14.6-point advantage over FCG by combining superior risk-reward at 80.8 versus 68.3 with better structure cleanliness at 62.6 versus 56.8, and strongest relative strength at 4.7% versus FCG's -0.5%. XLE's chart sits 4.9% above the 50-week moving average in a neutral structure that is neither extension nor repair, occupying the decision zone near the 0.500 Fibonacci level. Stochastic RSI is oversold at 0.00 despite price being near 50-week, suggesting early reversal potential if buyers defend the level; MACD is bearish/weakening, not improving, but volume at 0.82x the 20-week average provides neutral confirmation rather than rejection. XLE's 13-week return of -14.1% is superior to FCG's -19.3%, indicating selective support for integrated energy versus pure exploration. The setup offers 23.4% upside to resistance against 9.8% downside to support, an attractive risk-reversal for those betting on disinflation-driven demand recovery. FCG fails on relative weakness and smaller upside window, suggesting pure gas exposure lacks the defensive cash-flow moat of integrated players.
Traditional Energy earned 0% allocation because the category macro fit of 23/100 is the worst environment in the portfolio—disinflation actively hurts at minus 10 points, disinflation pressure costs another 10, and liquidity stress removes 7 more. The technical evidence of 39.6 for the category representative is below-average, and the 3/2/1 basket score started at only 30.8 before deteriorating to a final 2.3. This is not a timing call; it is a regime rejection. For Traditional Energy to earn even 10% allocation, disinflation would need to reverse course (unlikely near-term), or oil prices would need to spike beyond Fibonacci resistance at 44.76 with volume participation demonstrating institutional accumulation—neither appears in play. The 0% assignment reflects that energy's negative correlation to equity bear markets is already captured through short-duration alternatives like utilities and precious metals, which offer better macro fit and technical sponsorship for the current regime. XLE's competence as a category winner does not excuse the category's macro irrelevance.
Agriculture & Livestock — VEGI
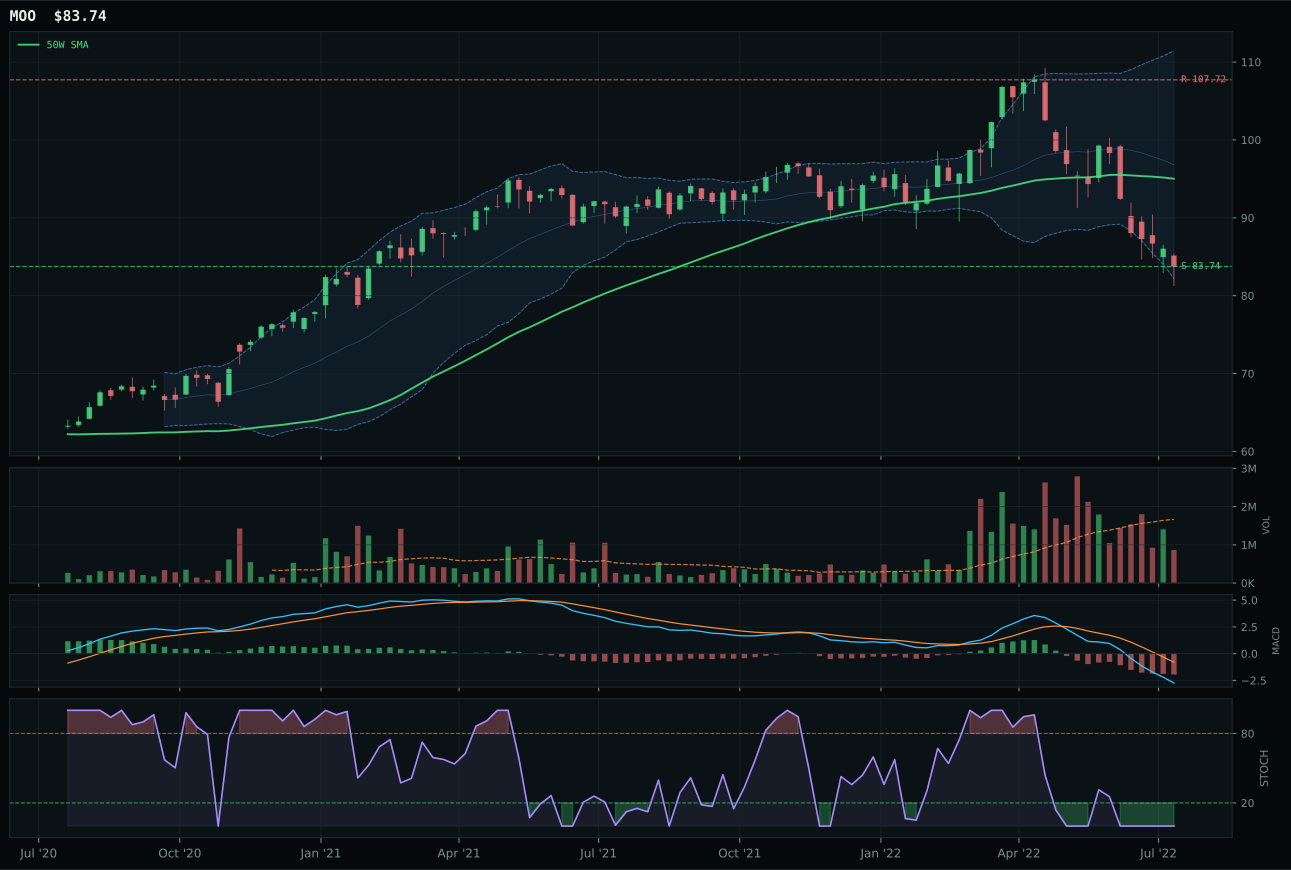
MOO has a pullback into support profile with -10.2% 13-week relative strength versus SPY.
A failed hold above support would weaken the setup.
Actionable but governed by invalidation levels.
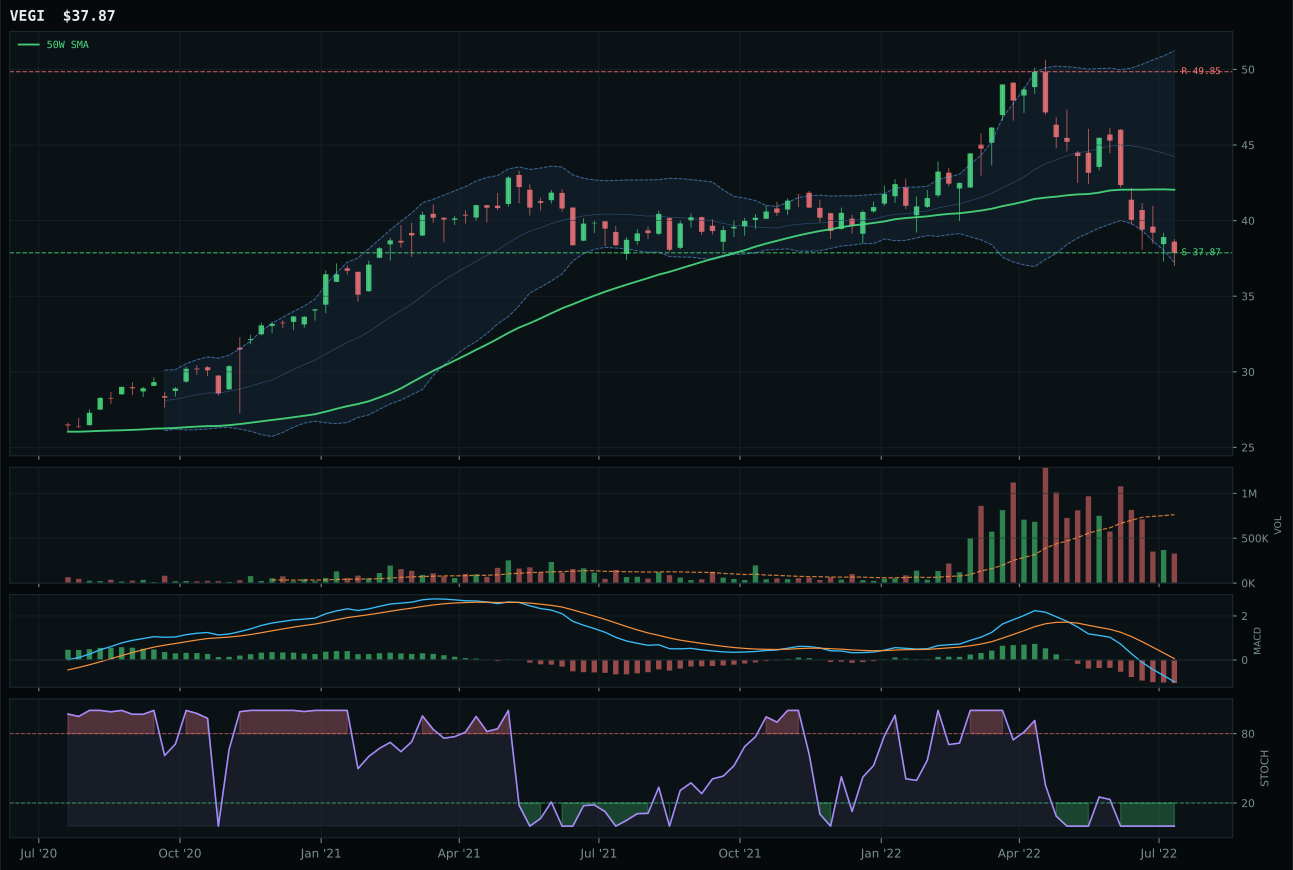
VEGI has a pullback into support profile with -12.0% 13-week relative strength versus SPY.
A failed hold above support would weaken the setup.
Actionable but governed by invalidation levels.
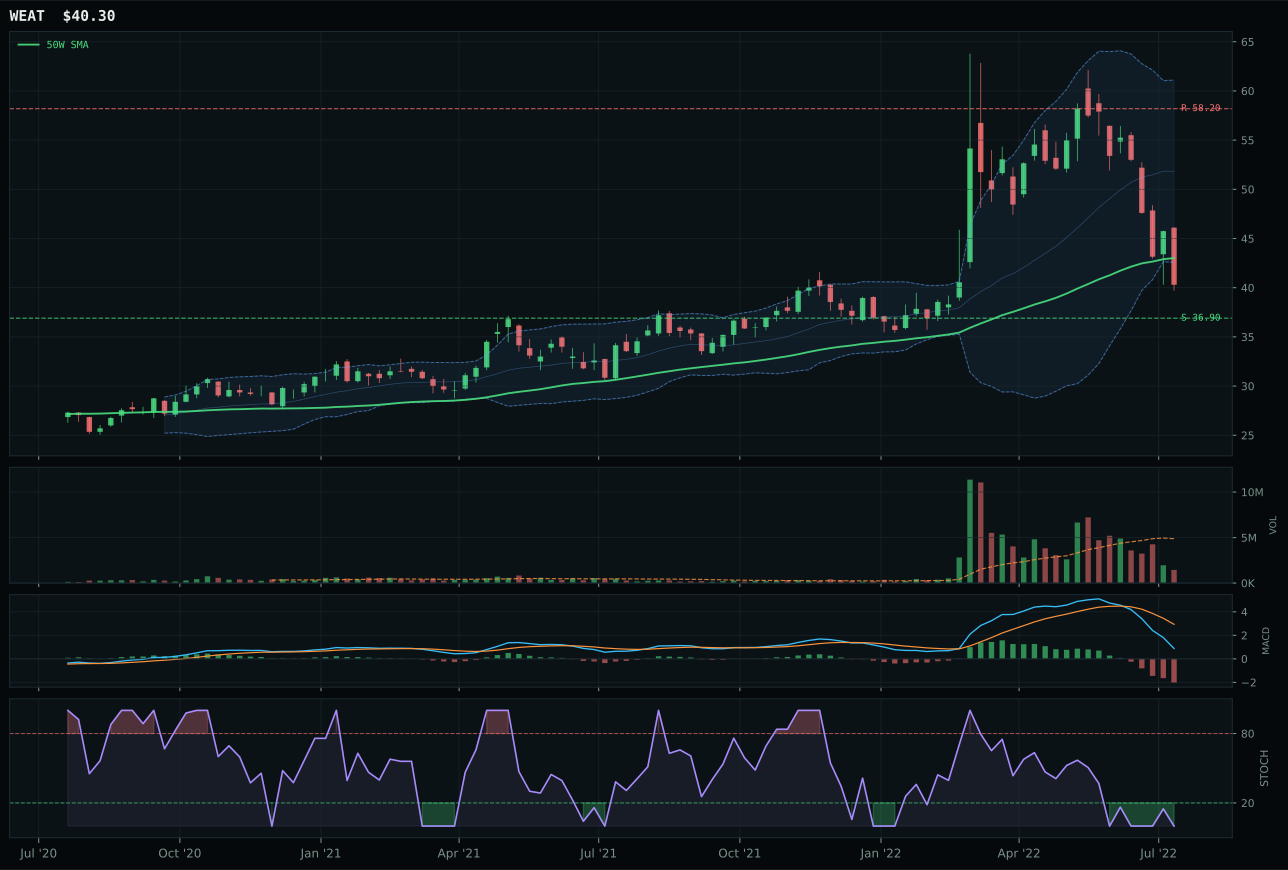
WEAT has a neutral structure profile with -14.1% 13-week relative strength versus SPY.
A failed hold above support would weaken the setup.
Actionable but governed by invalidation levels.
VEGI wins the category with only a 2.8-point margin over MOO in what is the weakest category outright, a victory that signals no absolute quality, only relative survival. VEGI's timing score of 80.0 beats MOO's 60.0 because price sits closer to support at -9.9% from the 50-week versus MOO's further stretch, and its Fibonacci positioning near the 0.786 repair level provides a tighter invalidation area. Both ETFs are crushed on momentum—VEGI's momentum confirmation is 0.0 and MOO's is also 0.0—because the 13-week return is -24.0% and -22.3% respectively, losses that obliterate any hope of accumulation signals in compressed volume at 0.43x and normal participation. Stochastic RSI at 0.00 for VEGI is true oversold, but MACD is bearish and weakening, not improving, which means the oversold condition may signal panic capitulation rather than prepared reversal. MOO's structure is slightly cleaner at 54.2 but loses on timing because it doesn't sit quite as close to the defined support level.
Agriculture & Livestock scored 1.1, the second-lowest category in the portfolio, and received 0% allocation because disinflation regime actively hurts commodities and agricultural inputs by 6 points, while disinflation pressure subtracts another 8. The category-level macro fit of 32/100 is the weakest macro environment for any category this week, and technical evidence of only 21.8 for the representative ETF confirms that both macro and price action are aligned against holding. Liquidity stress costs another 3 points. For this category to earn even a 10% allocation slot, either disinflation pressure would need to reverse or VEGI would need to demonstrate actual volume accumulation above the 0.43x participation level—neither is evident. The 0% allocation is not indifference; it is active rejection of a category where macro headwinds, technical deterioration, and lack of institutional sponsorship converge to create unfavorable risk-reward.