
2022-07-08
Informational purposes only. The content in this report, including allocations, analysis, and commentary, is provided solely for informational and educational purposes. It does not constitute financial advice, investment advice, trading advice, or any other type of advice. Past performance does not guarantee future results. Always conduct your own research and consult a qualified financial professional before making investment decisions.
XLE defensive overlay excluded: price is below its 8W SMA. Cause selector will use GLD or cash alternative.
GLD defensive overlay excluded: price is below its 8W SMA. Cause selector will use cash alternative.
Macro risk engine requires the 50% Defensive overlay for this run; payload selected by cause: Transition Defense.
Weekly Allocation
| Ticker | Category | Weight | Role |
|---|---|---|---|
| SGOV | 20% | Overlay | |
| GLD | Precious Metals | 25% | Overlay |
| XLU | Utilities & Infrastructure | 25% | Overlay |
| CIBR | Technology | 5% | Tier-2 (5%) |
| ITA | Defense & Aerospace | 5% | Tier-2 (5%) |
| URA | Nuclear Energy | 5% | Tier-2 (5%) |
| BOTZ | AI | 5% | Tier-2 (5%) |
| XLE | Traditional Energy | 5% | Tier-2 (5%) |
| INDA | Emerging Markets | 5% | Tier-2 (5%) |
Trade Instructions — Monday Open
Sell the tranche from 2022-06-10 (completing its 4-week hold). Buy the new tranche. Instructions show net portfolio changes — same-asset positions cancel, weight changes show the delta.
| Action | Ticker | Instruction |
|---|---|---|
| SELL | XLE | Sell 64% of XLE position (reduce 17.50% → 6.25%) |
| SELL | XOP | Sell entire XOP position (2.50% of portfolio) |
| SELL | COPX | Sell 67% of COPX position (reduce 3.75% → 1.25%) |
| SELL | VEGI | Sell 33% of VEGI position (reduce 3.75% → 2.50%) |
| SELL | URNM | Sell 33% of URNM position (reduce 3.75% → 2.50%) |
| SELL | IGV | Sell 33% of IGV position (reduce 3.75% → 2.50%) |
| BUY | XLU | Buy XLU — 25.00% of freed cash (adds 5.00% to portfolio) |
| BUY | GLD | Buy GLD — 25.00% of freed cash (adds 5.00% to portfolio) |
| BUY | SGOV | Buy SGOV — 25.00% of freed cash (adds 5.00% to portfolio) |
| BUY | CIBR | Buy CIBR — 6.25% of freed cash (adds 1.25% to portfolio) |
| BUY | BOTZ | Buy BOTZ — 6.25% of freed cash (adds 1.25% to portfolio) |
| BUY | INDA | Buy INDA — 6.25% of freed cash (adds 1.25% to portfolio) |
| BUY | URA | Buy URA — 6.25% of freed cash (adds 1.25% to portfolio) |
Current Portfolio After Trade
Combined holdings across all 4 active tranches. Each tranche is 25% of the portfolio.
| Ticker | % of Portfolio | Weight Bar |
|---|---|---|
| GLD | 25.00% | |
| XLU | 21.25% | |
| SGOV | 20.00% | |
| XLE | 6.25% | |
| ITA | 5.00% | |
| CIBR | 3.75% | |
| BOTZ | 3.75% | |
| VEGI | 2.50% | |
| URNM | 2.50% | |
| IGV | 2.50% | |
| INDA | 2.50% | |
| URA | 2.50% | |
| COPX | 1.25% | |
| IGF | 1.25% |
Macro Regime — Disinflation
growth data is not confirming the weak market-implied risk appetite signal
Defensive overlay cause is not singular enough to concentrate: the sleeve diversifies across liquidity, monetary defense, and defensive equity exposure while the market resolves the next regime.
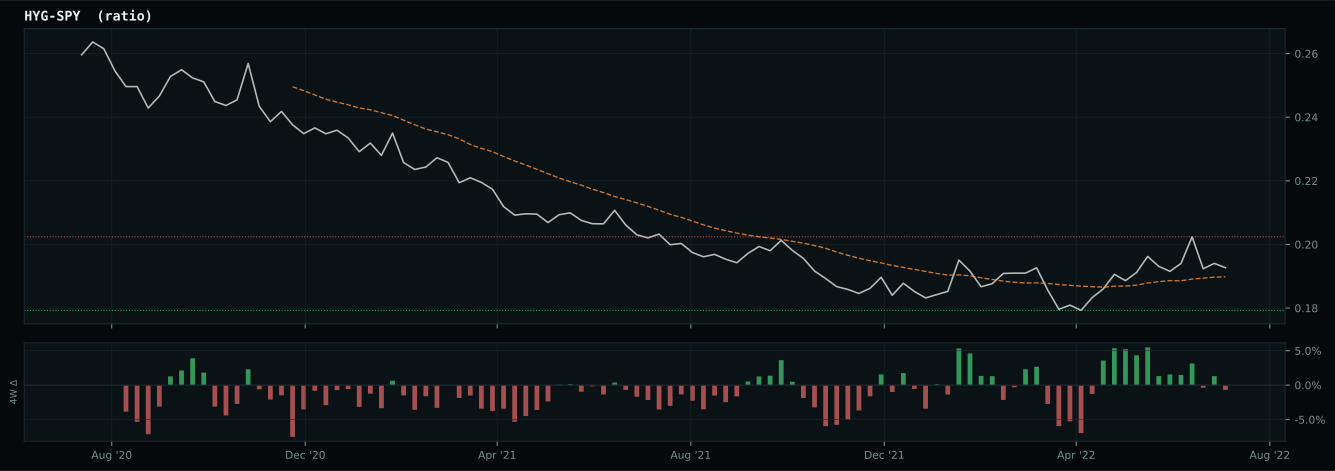
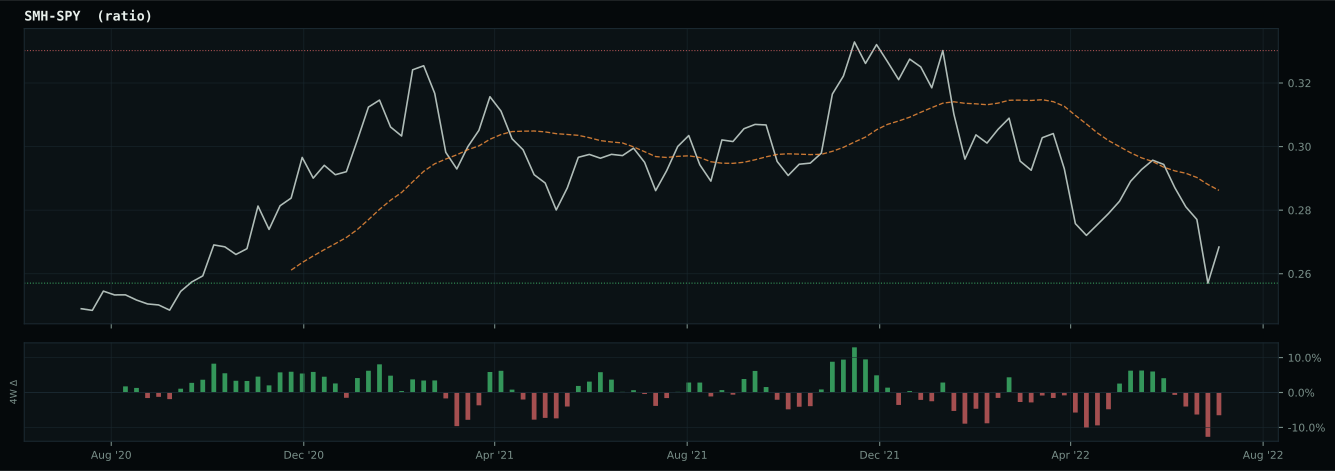
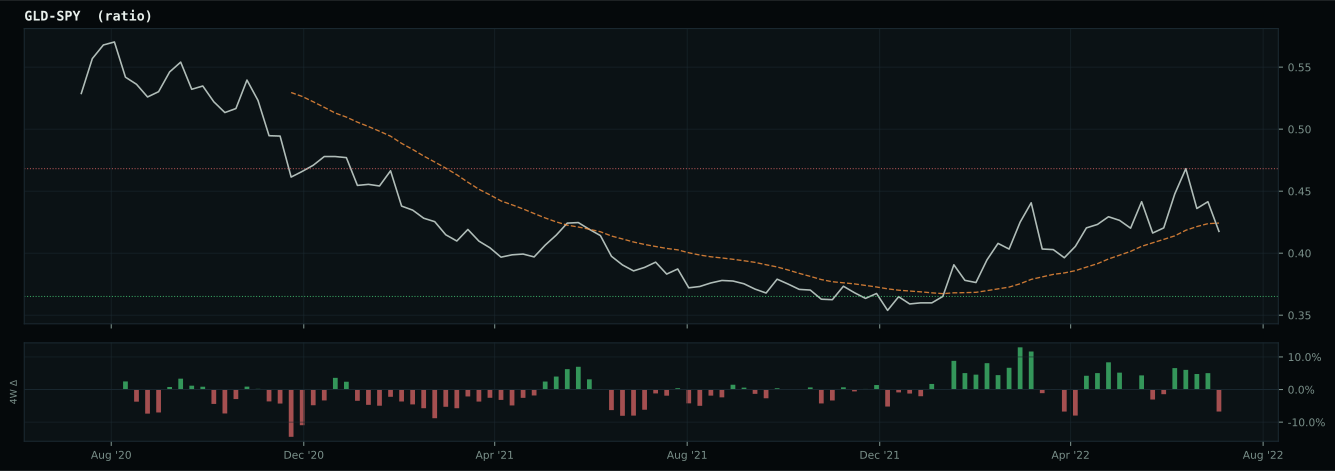
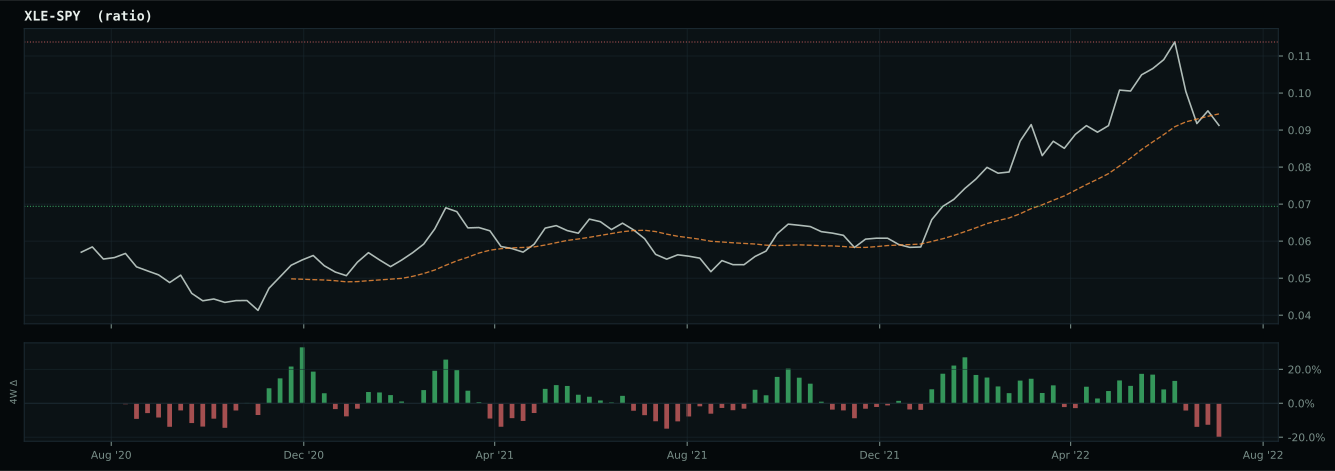
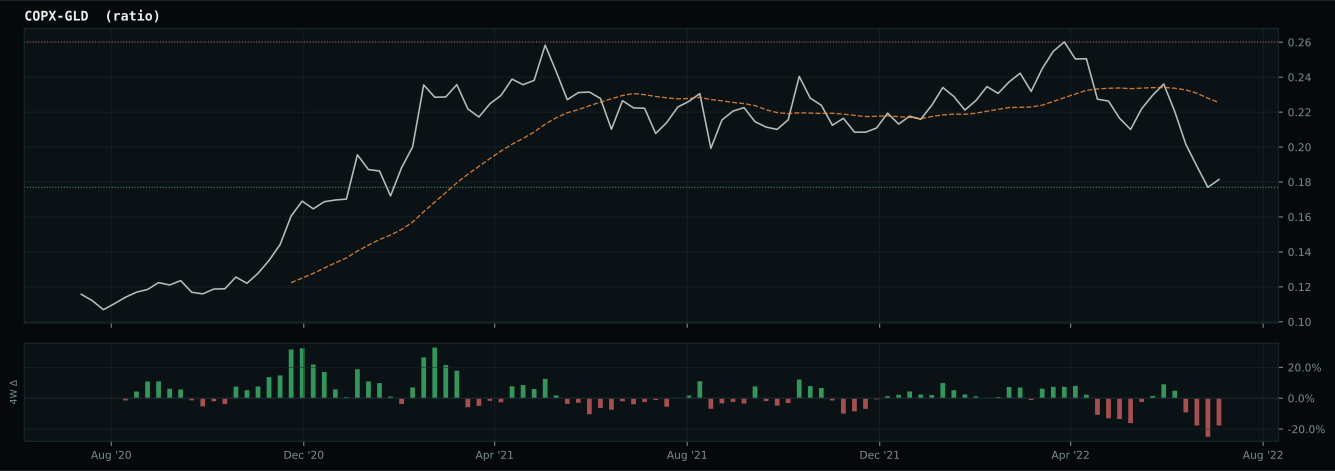
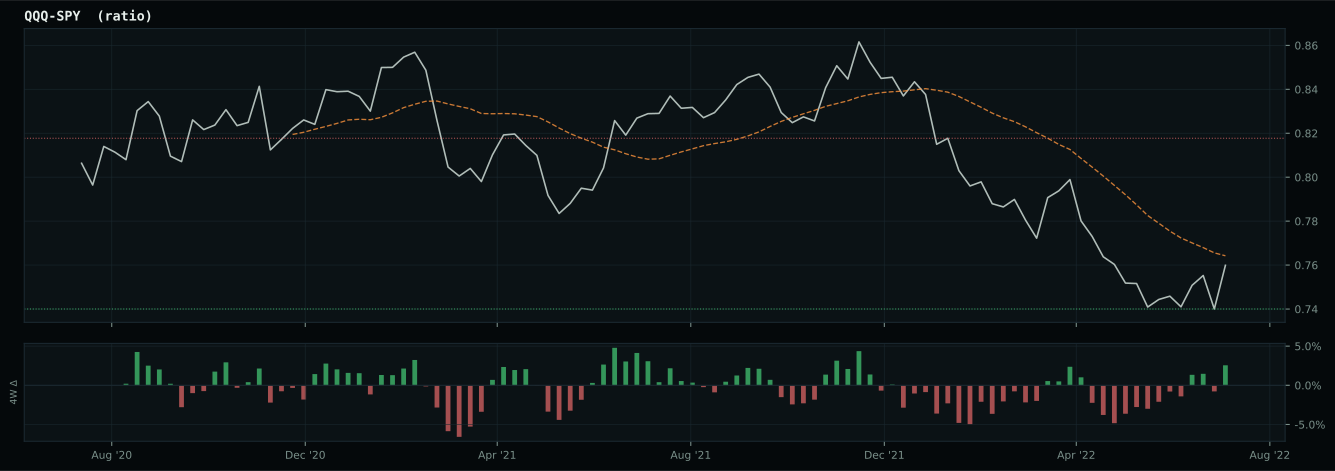
Macro Evidence Charts
Market-implied signals behind the macro regime scores. Each ratio compares two assets; the direction and slope of the ratio is what the macro engine reads.
Crypto Regime — NoCrypto
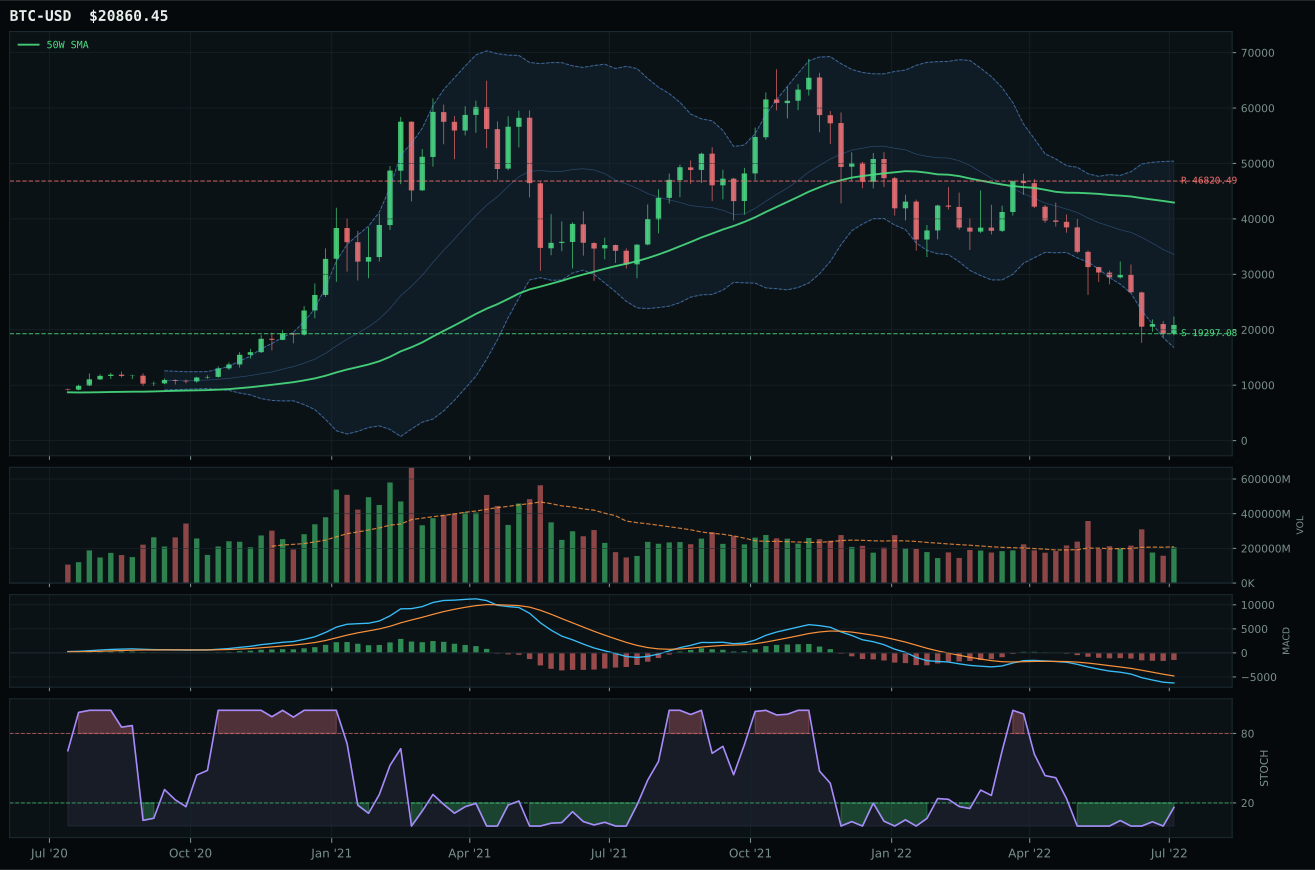
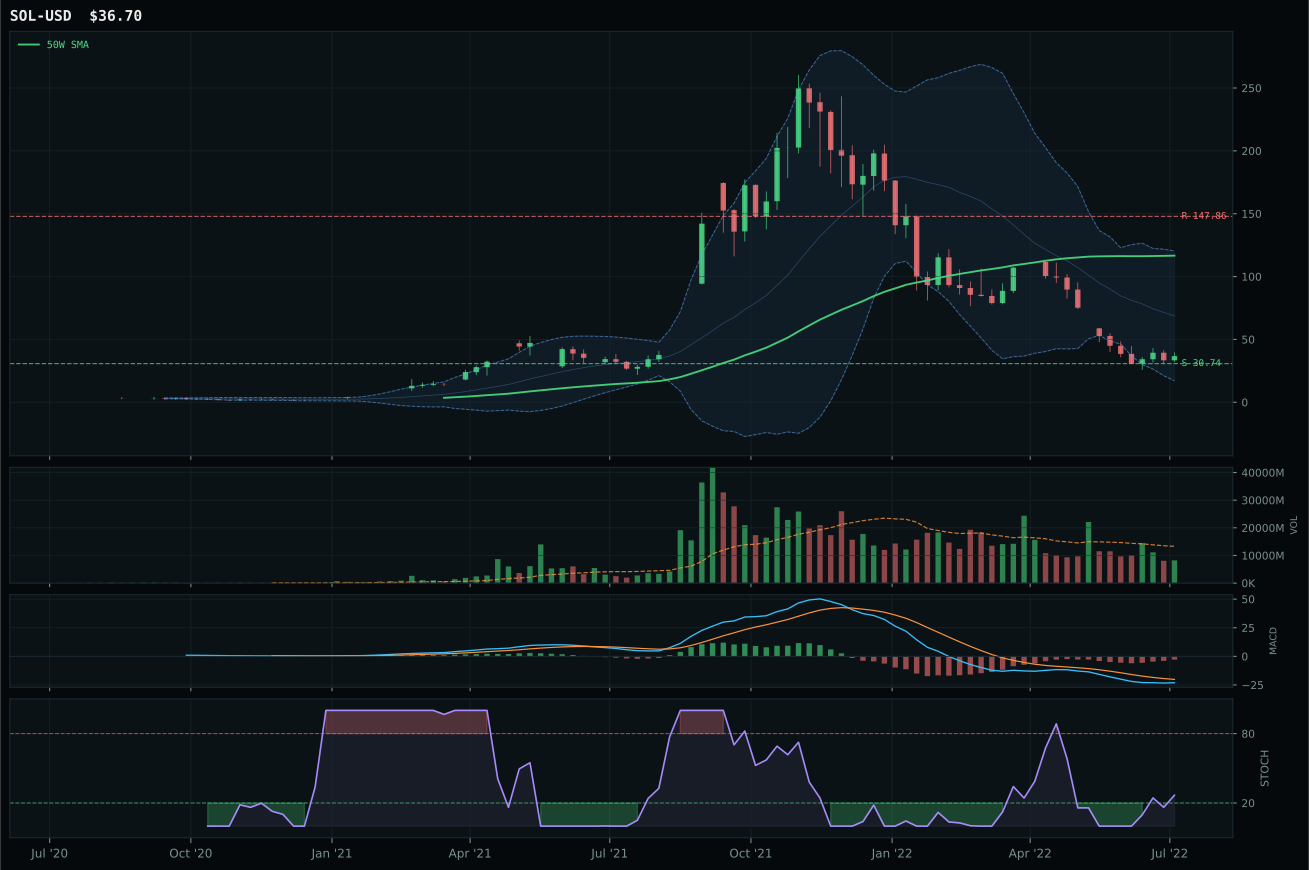
ValueBTC armed by first 200W buy-zone touch, but post-touch range age is 3 weeks; minimum is 12
TrendBTC not confirmed
one or more available conditions failed
Category Rankings
| Rank | Category | Winner | Score | Alloc | 4W Ret | Peers (4W) |
|---|---|---|---|---|---|---|
| 1 | Utilities & Infrastructure | XLU | 52.6 | 20% | +7.65% | IGF +5.2% · PAVE +15.7% |
| 2 | Precious Metals | GLD | 48.5 | 20% | +2.53% | SLV +6.0% · GDX +0.3% |
| 3 | Technology | CIBR | 46.9 | 10% | +4.32% | IGV +8.4% · XLK +11.5% |
| 4 | Defense & Aerospace | ITA | 40.7 | 10% | +6.01% | XAR +7.3% · ROKT +11.0% |
| 5 | Nuclear Energy | URA | 24.8 | 10% | +13.98% | NLR +7.2% · URNM +18.1% |
| 6 | AI | BOTZ | 12.9 | 10% | +9.97% | SMH +17.1% · AIQ +7.9% |
| 7 | Traditional Energy | XLE | 11.0 | 10% | +4.20% | XOP +10.5% · FCG +8.1% |
| 8 | Emerging Markets | INDA | 6.3 | 10% | +7.74% | IEMG +2.6% · ILF +10.0% |
| 9 | Industrial Metals | COPX | 6.0 | 0% | +6.13% | REMX +17.8% · PICK +9.1% |
| 10 | Agriculture & Livestock | VEGI | 5.0 | 0% | +9.56% | WEAT -12.5% · MOO +6.9% |
Utilities & Infrastructure — XLU
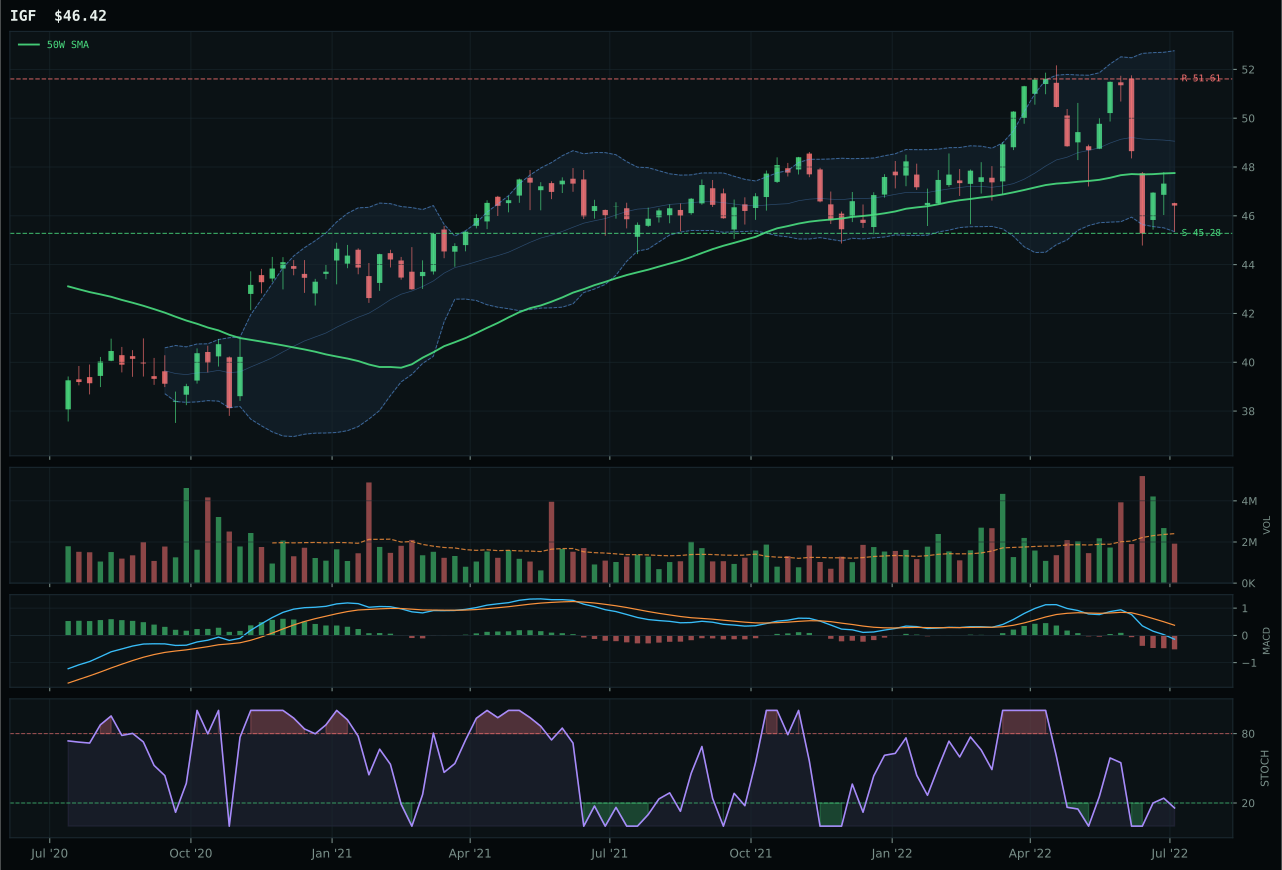
IGF has a pullback into support profile with 3.2% 13-week relative strength versus SPY.
A failed hold above support would weaken the setup.
Actionable but governed by invalidation levels.
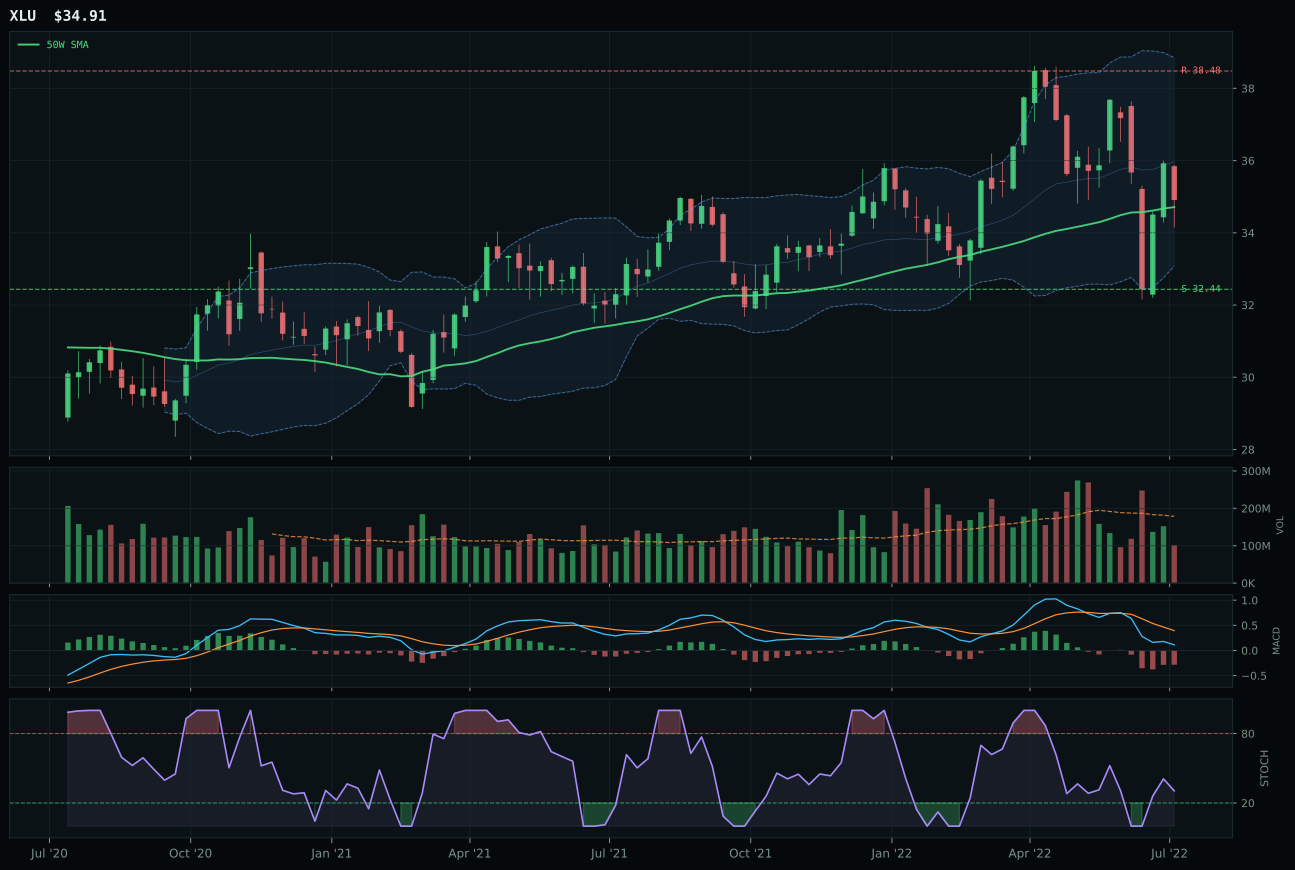
XLU has a compression near 50W profile with 3.9% 13-week relative strength versus SPY.
A failed hold above support would weaken the setup.
Actionable but governed by invalidation levels.
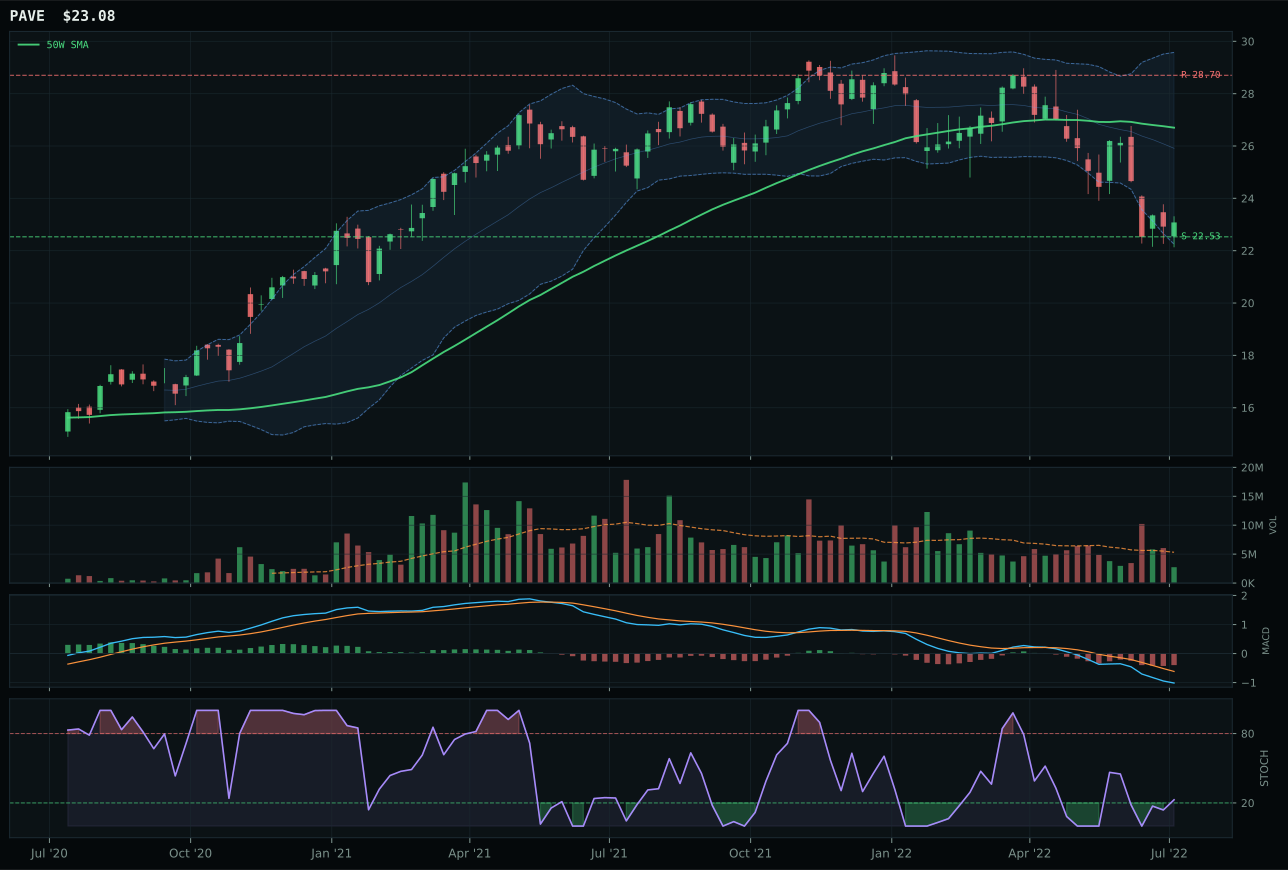
PAVE has a pullback into support profile with -2.0% 13-week relative strength versus SPY.
A failed hold above support would weaken the setup.
Actionable but governed by invalidation levels.
XLU earns the co-top-2 allocation alongside GLD by assembling a rare combination of trend strength and perfect timing. The ETF trades 0.6% from the 50-week moving average with price above both the 50W and 200W, a compression setup that can explode higher if buyers defend the level. The timing score reaches 100.0/100—perfect—because XLU sits exactly at the Fib 0.500 decision zone, where institutional buyers typically establish tactical positions. Relative strength is +3.9% versus SPY, the best in its three-ETF peer set, and category-relative strength is +0.7% above IGF. Most critically, XLU's MACD is bearish/weakening (not yet confirming a breakout) while stochastic RSI is rising mid-zone (0.31), suggesting the setup is early in accumulation rather than extended. IGF's stochastic RSI at oversold turn-up is technically more capitulated, but it also means IGF is further along in its reversal and therefore more vulnerable to false signals. XLU's 9.9-point score gap reflects both superior positioning (compression vs pullback-into-support) and better relative strength (0.7% category-relative vs 0.0%).
Utilities & Infrastructure commands 10% allocation as a top-2 overweight category with a final score of 52.6, second-highest in the portfolio after Precious Metals' 48.5. The macro fit of 80.0/100 is driven by four active tailwinds: defensive rotation (+12 points), disinflation helps this exposure (+7), disinflation pressure (+6), and broad market bear (+4), totaling 29 points of pure macro support. XLU's superior trend score of 87.8/100 reflects its ability to stay above the 50W during broader market weakness, a signal that institutional money is rotating into regulated utility cash flows. The risk/reward at 74.9/100 is favorable: downside is limited to 7.6% versus resistance 9.3% away, a skew that rewards patient accumulation. For this allocation to hold at 10%, the portfolio must assume that defensive rotation remains active and that regulated utility dividends continue to attract capital during disinflation. If risk appetite suddenly reverses and the broad market bear descriptor flips off, Utilities might compress toward 5% tier-2 status. However, with current macro conditions, the 10% weight is justified as the portfolio's second-largest defensive sleeve alongside gold.
Precious Metals — GLD
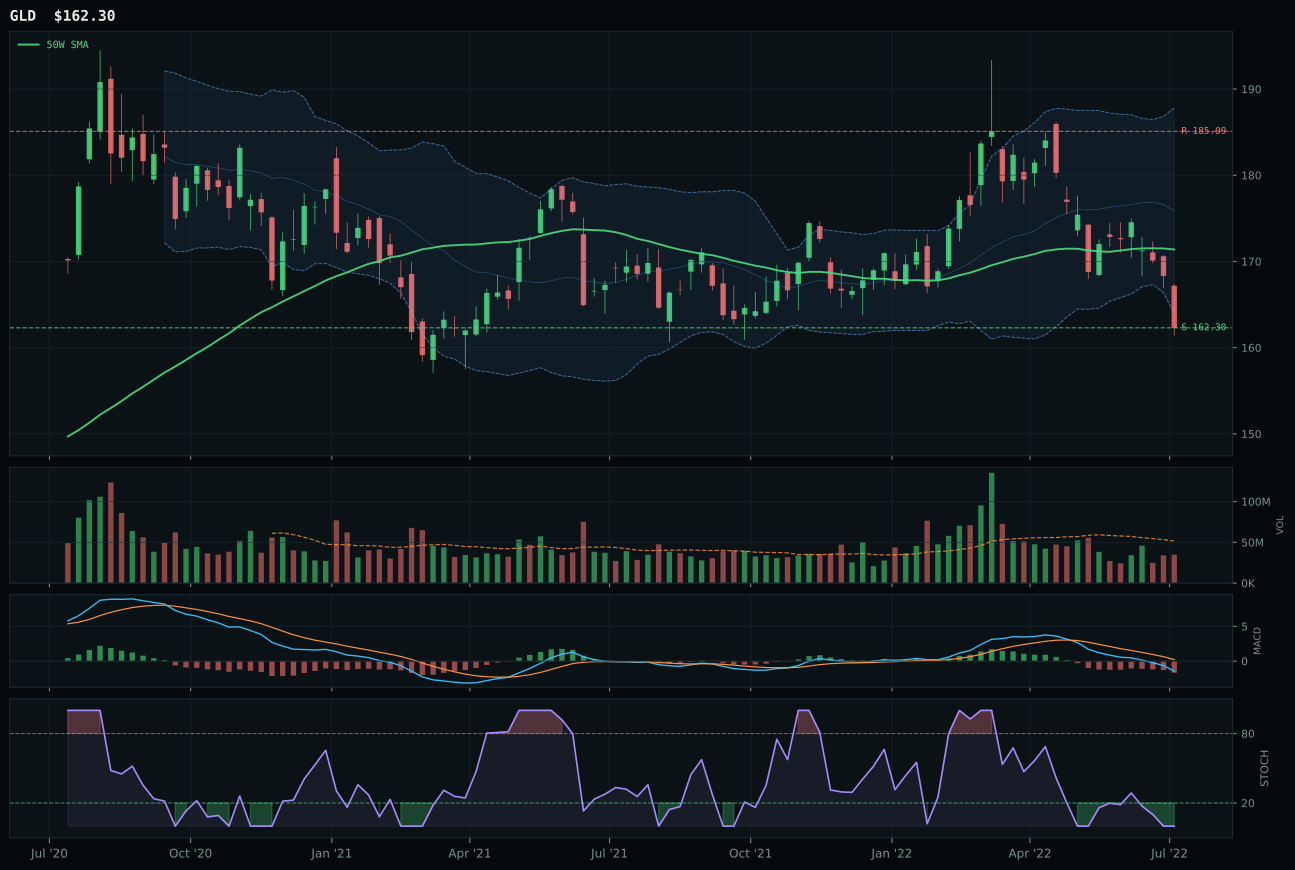
GLD has a pullback into support profile with 2.6% 13-week relative strength versus SPY.
A failed hold above support would weaken the setup.
Actionable but governed by invalidation levels.
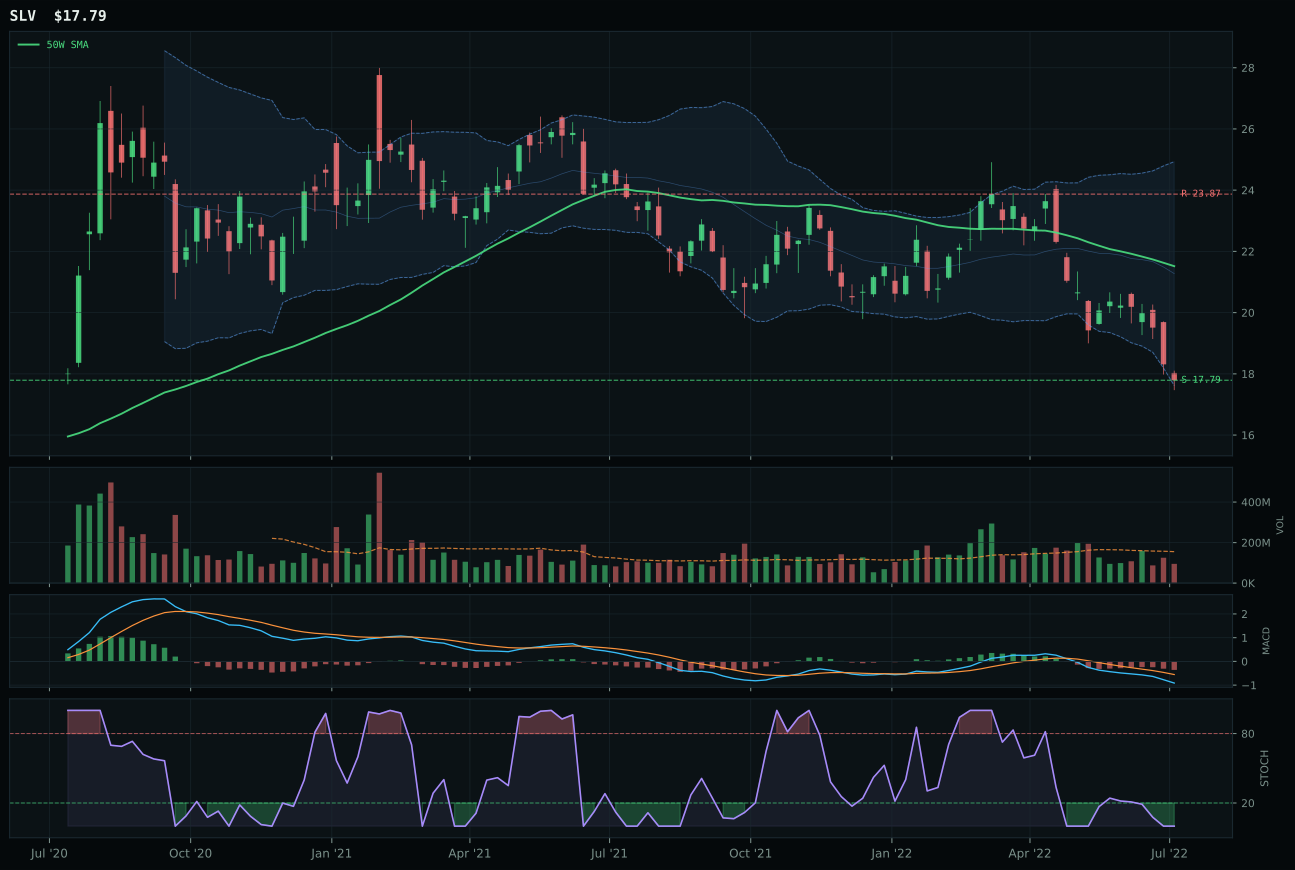
SLV has a pullback into support profile with -8.9% 13-week relative strength versus SPY.
A failed hold above support would weaken the setup.
Actionable but governed by invalidation levels.
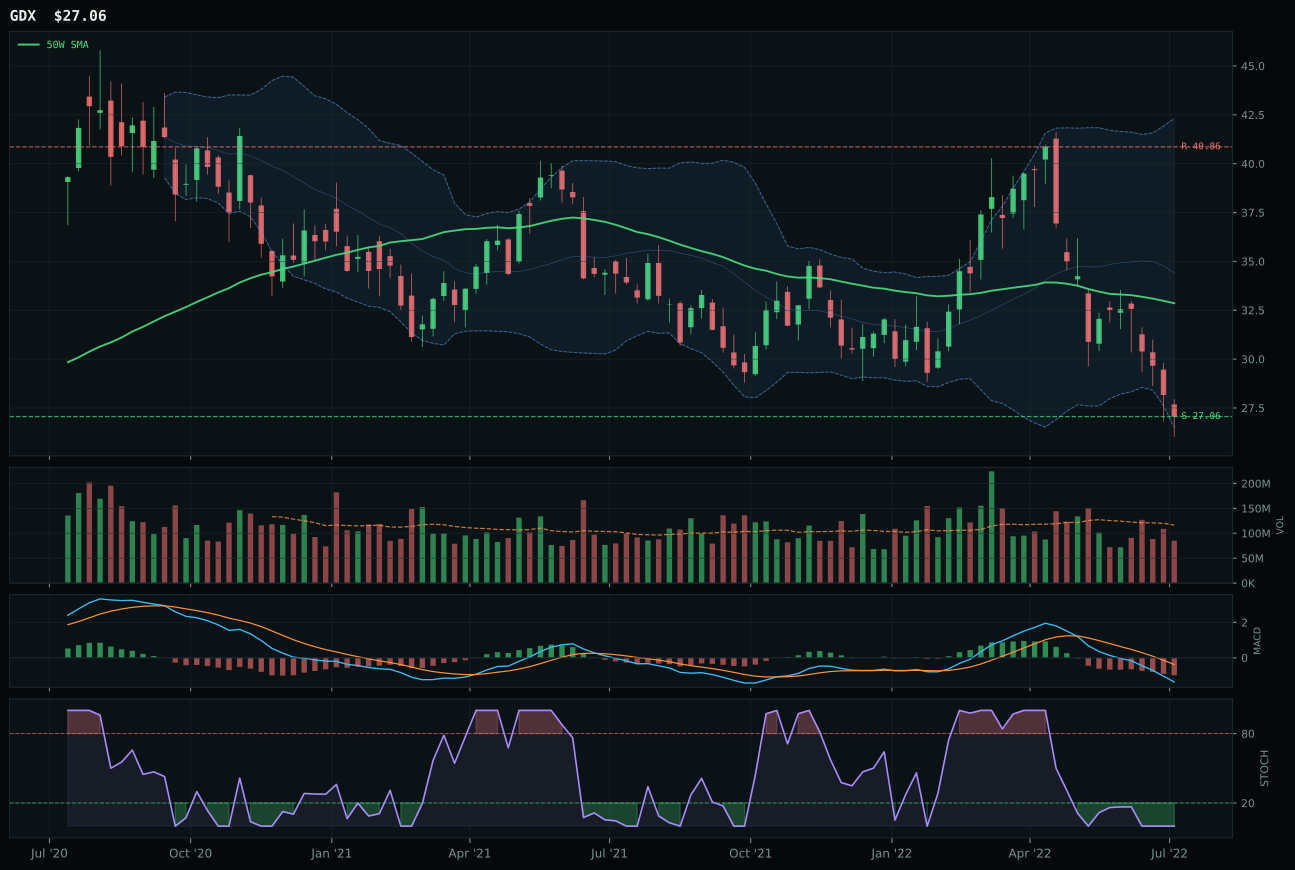
GDX has a pullback into support profile with -18.6% 13-week relative strength versus SPY.
A failed hold above support would weaken the setup.
Actionable but governed by invalidation levels.
GLD earns the top-2 allocation slot by assembling a portfolio-grade setup that combines technical precision with exceptional macro fit. The ETF trades -5.3% from the 50-week moving average in a pullback-into-support structure near 162.30, with stochastic RSI oversold (0.00) and rising, suggesting buyers are stepping in at capitulation levels. The 11.5% relative strength advantage within its three-ETF category peers (versus SLV and GDX) is decisive: it proves gold as a monetary hedge is outperforming industrial silver and mining equities. MACD is still bearish/weakening, but the setup is clean and the risk/reward at 72.7/100 offers a favorable skew where downside is defined by support at 162.30 (0% residual) and upside stretches to 185.09. SLV loses on timing (60.0 vs 80.0 for GLD) because silver sits further from the 50-week average and lacks category leadership; its industrial beta makes it a derivative bet on manufacturing demand, whereas GLD is the pure monetary hedge. The 14.8-point gap reflects GLD's superior macro positioning and technical cleanliness.
Precious Metals commands 10% allocation as a top-2 overweight category, tied with Utilities for the portfolio's primary defensive slot. The macro fit of 88.0/100 is the second-highest across all ten categories, driven by a monetary hedge bid that is actively scoring +14 points. Disinflation adds +8, defensive rotation adds +7, and disinflation pressure adds +6—a combined 31-point tailwind that no other category (except Utilities) receives. The regime of falling inflation expectations and fear-driven capital preservation naturally benefits gold. GLD's category leadership of +11.5% confirms that allocators are specifically choosing gold over broader commodity or mining bets. At only 40.4/100 in pure technical evidence, GLD's top-2 slot rests almost entirely on macro fit (80.0/100), which is the correct framework: in disinflation regimes, the macro descriptor set overwhelms technicals. The portfolio should hold this position unless either (a) the monetary hedge bid descriptor flips off, or (b) the broad market bear descriptor reverses, signaling renewed risk appetite. Until one of those regime shifts occurs, 10% in GLD is a core defensive anchor.
Technology — CIBR
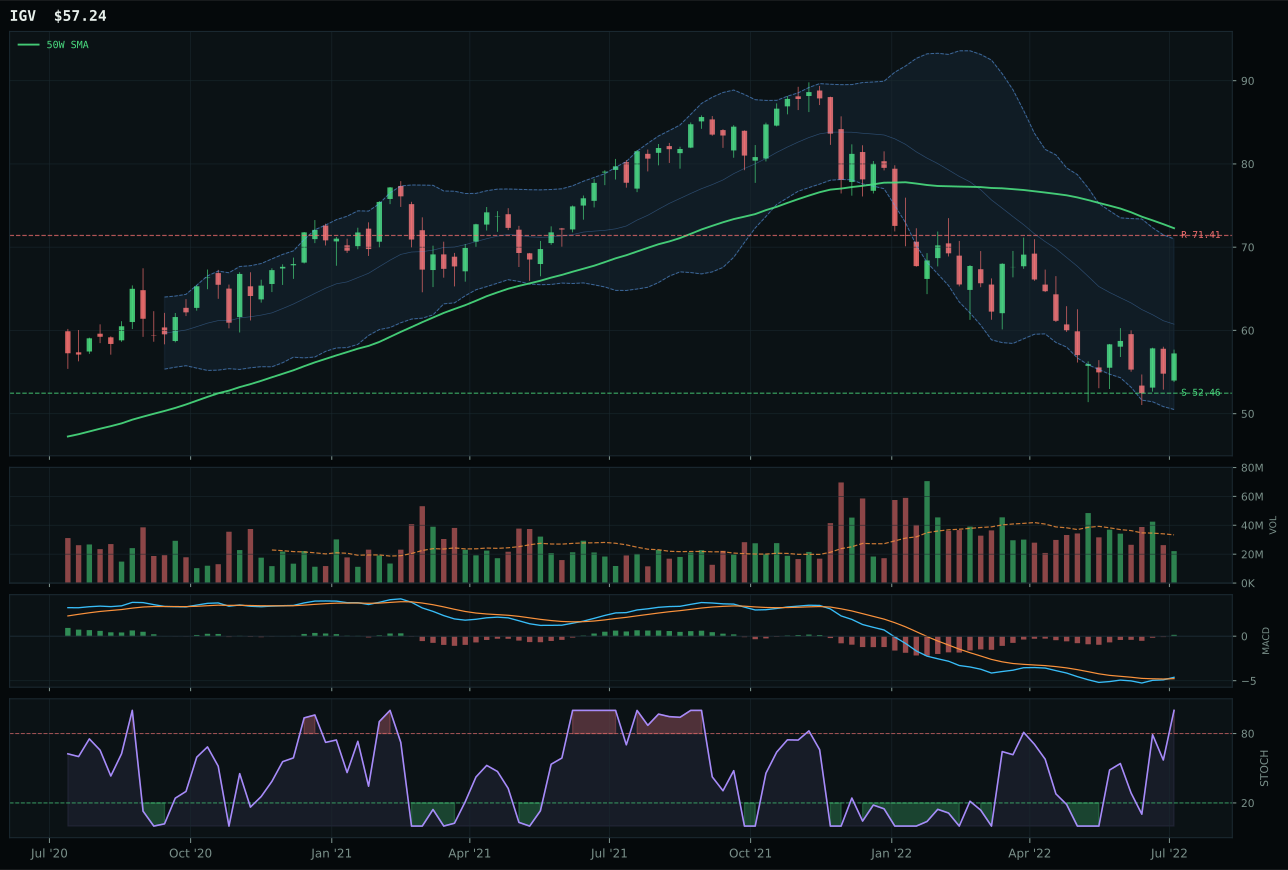
IGV has a neutral structure profile with -0.3% 13-week relative strength versus SPY.
A failed hold above support would weaken the setup.
Actionable but governed by invalidation levels.
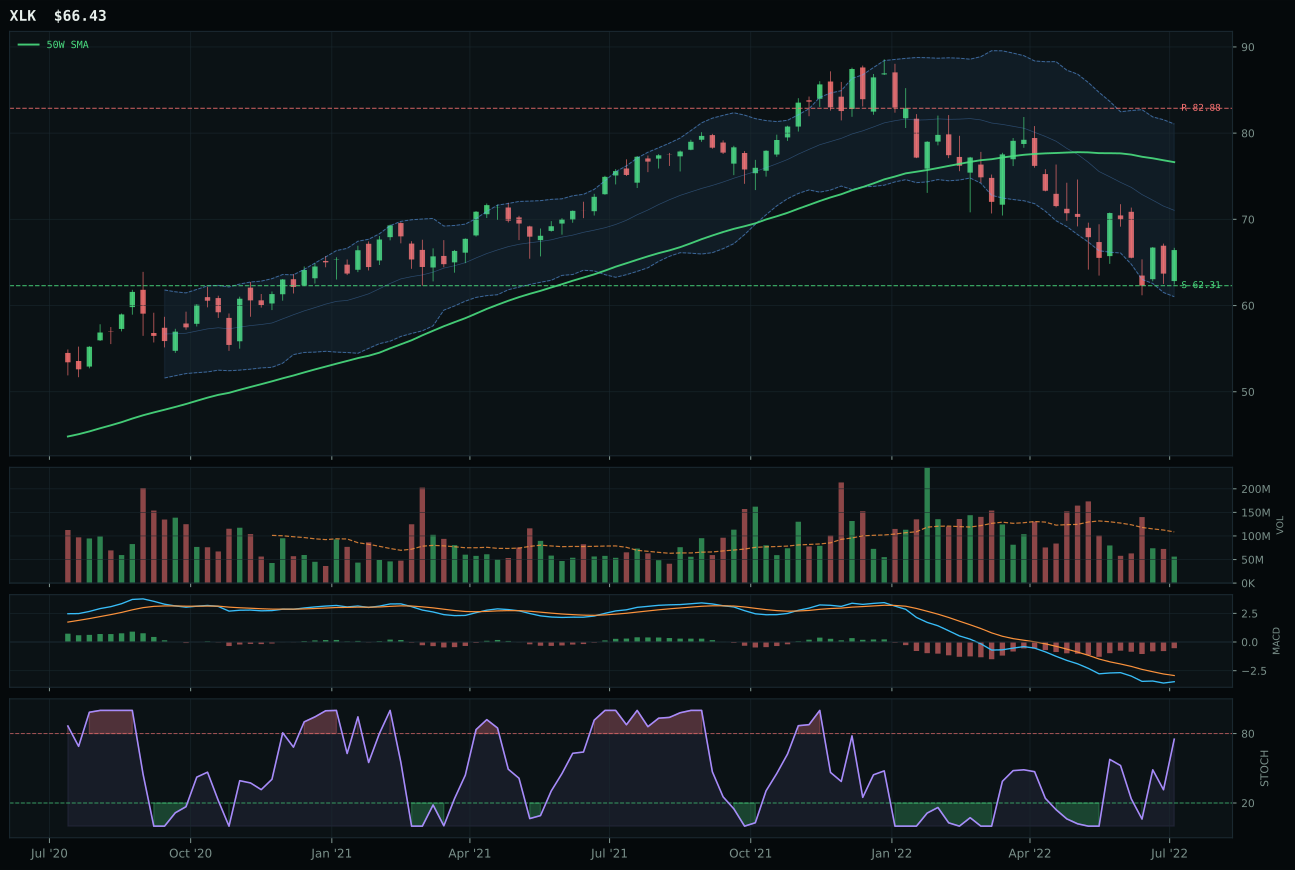
XLK has a neutral structure profile with 0.3% 13-week relative strength versus SPY.
A failed hold above support would weaken the setup.
Actionable but governed by invalidation levels.
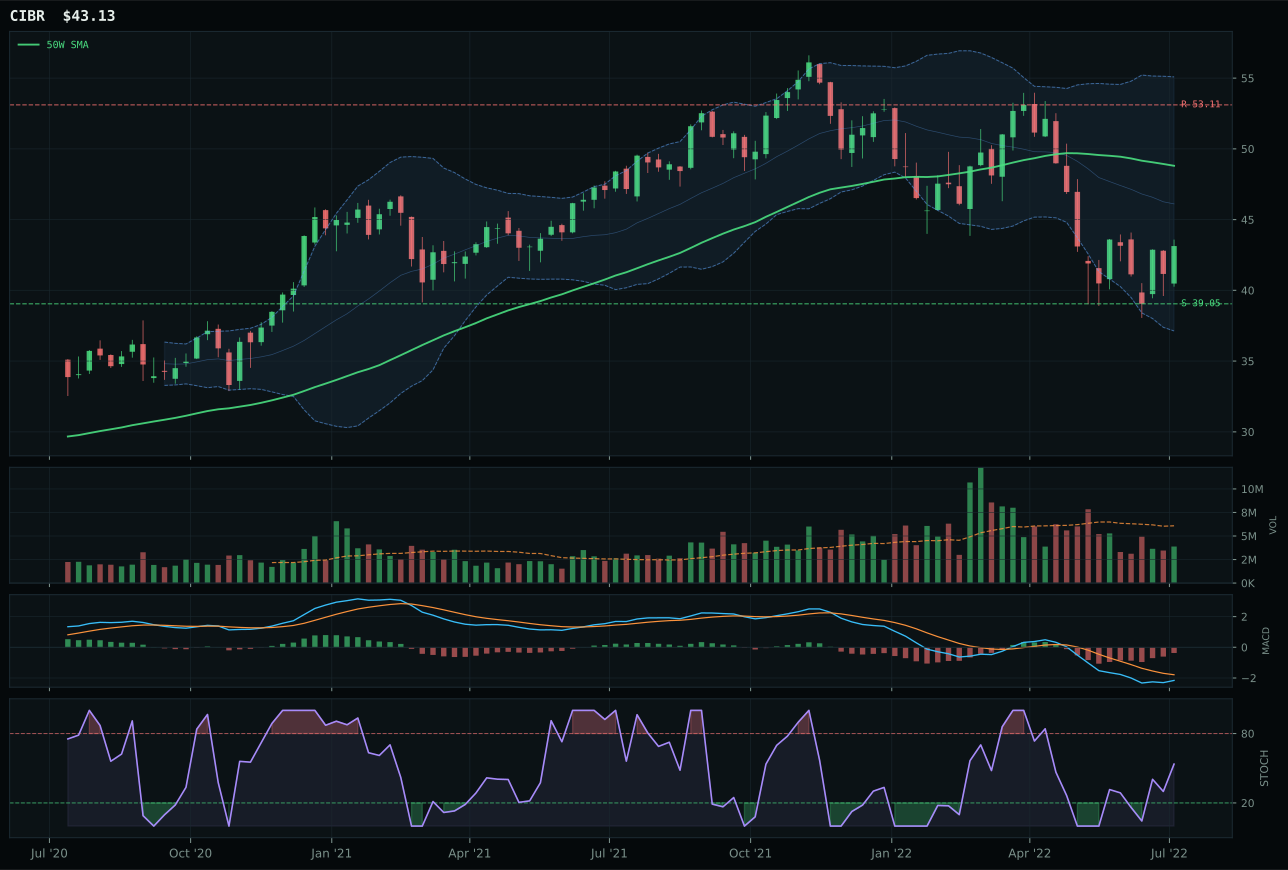
CIBR has a neutral structure profile with -2.5% 13-week relative strength versus SPY.
A failed hold above support would weaken the setup.
Actionable but governed by invalidation levels.
CIBR wins the category by establishing a cleaner timing setup than IGV, its most serious rival. While both names sport neutral structures and thin volume participation, CIBR's distance to the 50-week moving average at -11.6% places it in the deep retracement zone, whereas IGV at -4.9% is closer to resistance and therefore more vulnerable to rejection. CIBR's stochastic RSI is rising from mid-zone (0.54) versus IGV's overbought momentum (0.75), giving cybersecurity a better risk-adjusted entry if this disinflation regime continues to favor defensive rotation. The timing score gap of 15 points reflects a genuine structural advantage: CIBR is early to potential accumulation, while IGV is already late. Both face identical macro headwinds—liquidity stress and risk-appetite deterioration—but the technician must respect that CIBR's -2.5% relative strength versus SPY and -2.2% category-relative strength position it as the least crowded expression within a weak category.
Technology earned 5% allocation as a tier-2 category, well below the dual 10% overweights commanded by Precious Metals and Utilities. The macro regime of disinflation helps the category modestly (+7 points), and rising disinflation pressure adds another +5, yet these gains are overwhelmed by -10 points of active liquidity stress. A 47.0 macro fit score signals this is a defensive-transition play, not a growth opportunity. The category's final score of 46.9 reflects technical evidence weighted at 62% and macro/narrative fit at 38%, a weighting that penalizes exposed growth proxies in a flight-to-safety environment. For allocation to move from 5% to 10%, Technology would need either a material break in the liquidity stress descriptor or for the category's three-ETF basket to demonstrate measurably better volume-price confirmation—right now persistence is only 38.0/100, which tells the allocator that the setup is fragile. The 10.6-point deficit versus IGV's technical evidence (60.4 vs 49.0 for CIBR) underscores that even the winning ETF in this category is fighting a headwind.
Defense & Aerospace — ITA
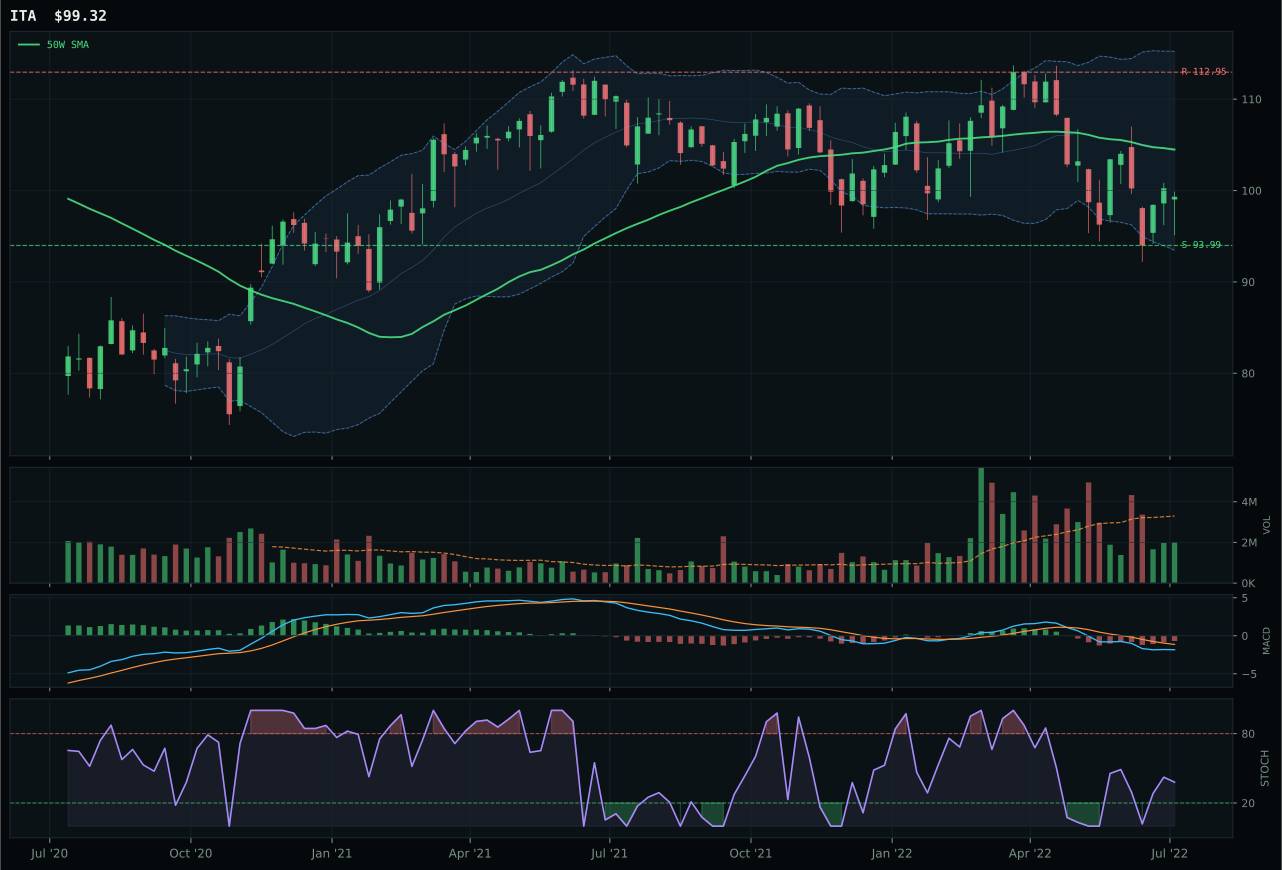
ITA has a neutral structure profile with 3.7% 13-week relative strength versus SPY.
A failed hold above support would weaken the setup.
Actionable but governed by invalidation levels.
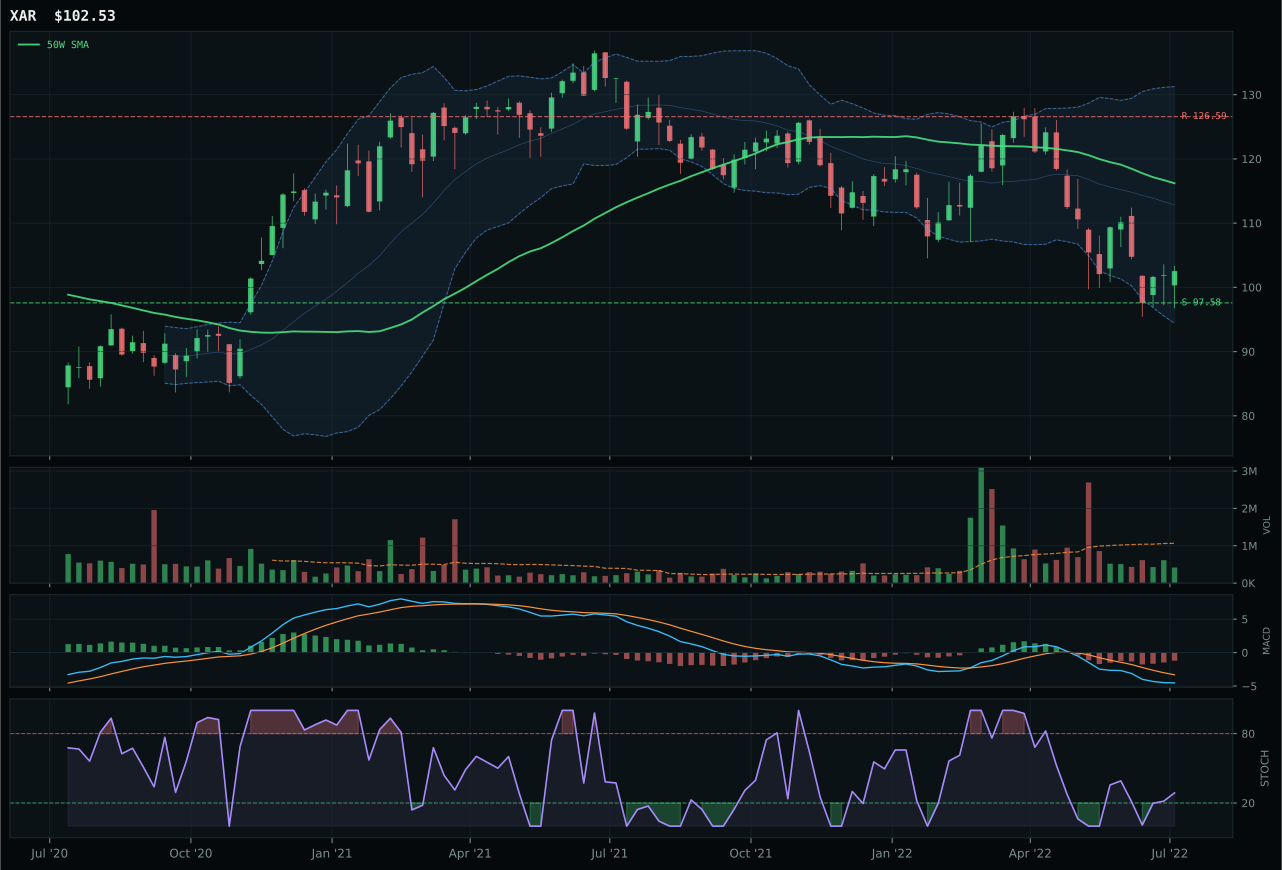
XAR has a neutral structure profile with -2.2% 13-week relative strength versus SPY.
A failed hold above support would weaken the setup.
Actionable but governed by invalidation levels.
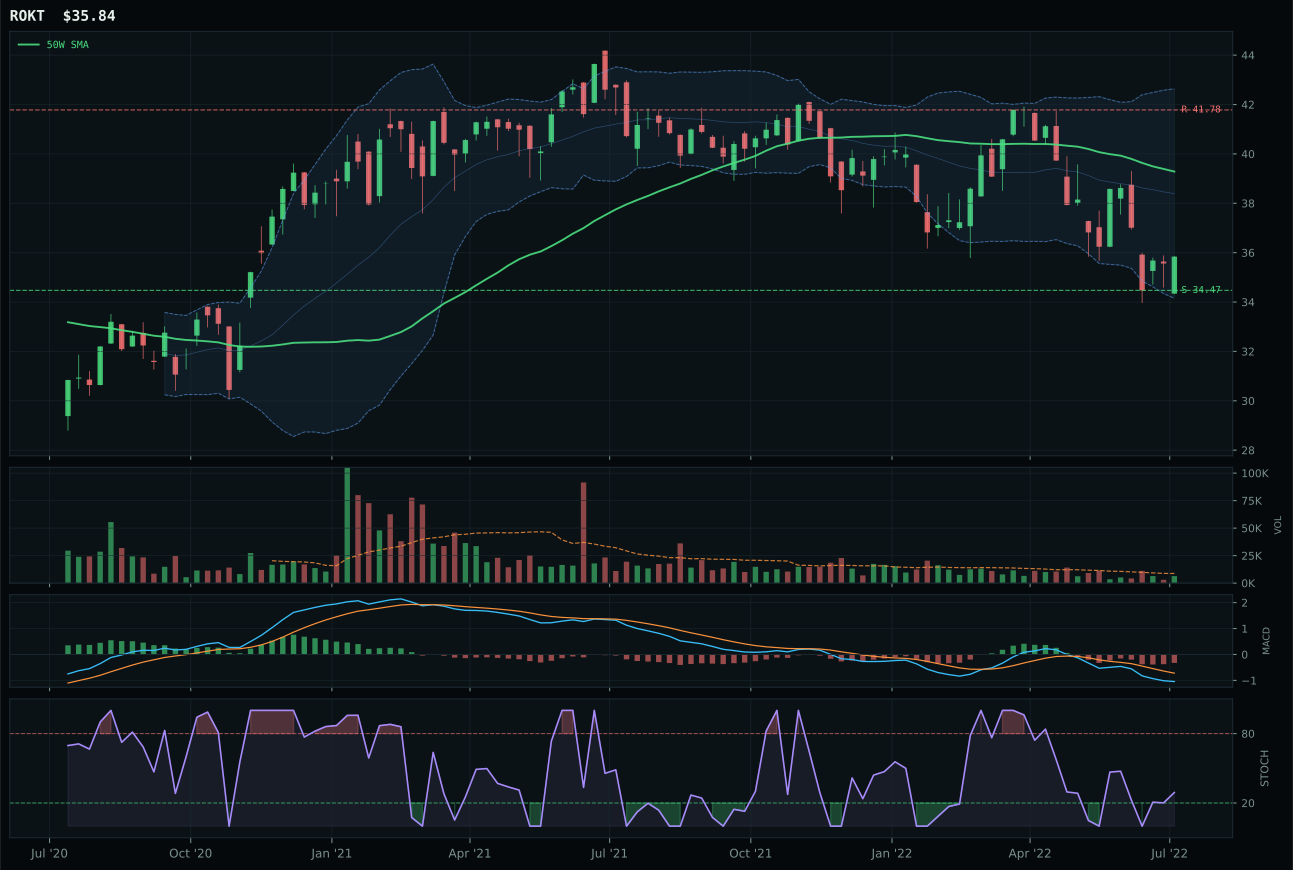
ROKT has a pullback into support profile with 1.6% 13-week relative strength versus SPY.
A failed hold above support would weaken the setup.
Tracked, but not top-2 eligible because: .
ITA dominates its category with a timing score that reaches 98.0/100, a level that reflects nearly perfect proximity to a support-level setup. The ETF sits only -4.9% from the 50-week moving average and lands in the deep retracement zone near Fib 0.618 at 100.43, with defined support at 93.99 and room to resistance at 112.95. Relative strength of +3.7% versus SPY and +2.2% within the category proves that defense-prime durability has held better than the broader market through this bear phase. The runner-up XAR, by contrast, timing scores only 63.0/100 because it sits in the near 52-week low zone and carries negative category-relative strength of -3.8%, suggesting its aerospace beta got hit harder than ITA's integrated defense positioning. MACD is improving across both names, but ITA's stochastic RSI sits in the rising mid-zone sweet spot (0.38), while XAR's timing window is narrower and riskier. The 19.3-point score gap reflects a material technical advantage, not a marginal distinction.
Defense & Aerospace holds 5% allocation as a tier-2 category despite a respectable final score of 40.7. The category benefits substantially from active macro descriptors: defensive rotation adds +8 points, broad market bear adds +6, and dollar pressure oddly contributes +3 (as foreign defense contracts become cheaper for US buyers). However, these gains total only 17 points against a 64.0 macro fit score, meaning the technicals are doing the heavy lifting. ITA's technical evidence of 60.5/100 is solid but not exceptional; the timing score is what saves it. For this category to move from 5% to 5% allocation, it would need XLU or GLD to stumble, which is unlikely given their superior macro fitness (80.0 and 88.0 scores respectively). The intermediate path would require ITA to move above the 50-week average with expanding volume—right now at 0.61x, volume is too thin to trust a sustained move higher. Defense is correctly positioned as a secondary tactical hedge, not a primary portfolio driver.
Nuclear Energy — URA
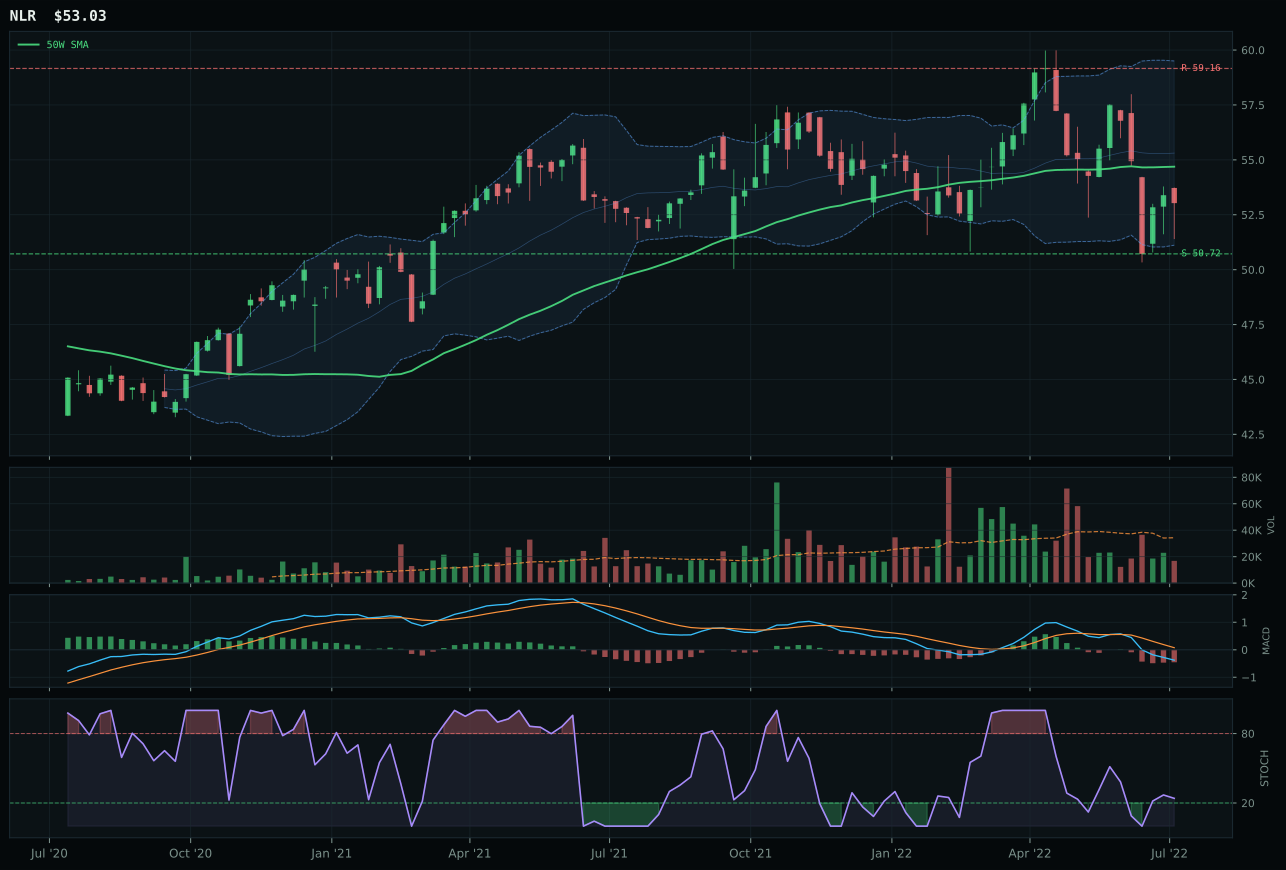
NLR has a pullback into support profile with 3.1% 13-week relative strength versus SPY.
A failed hold above support would weaken the setup.
Tracked, but not top-2 eligible because: .
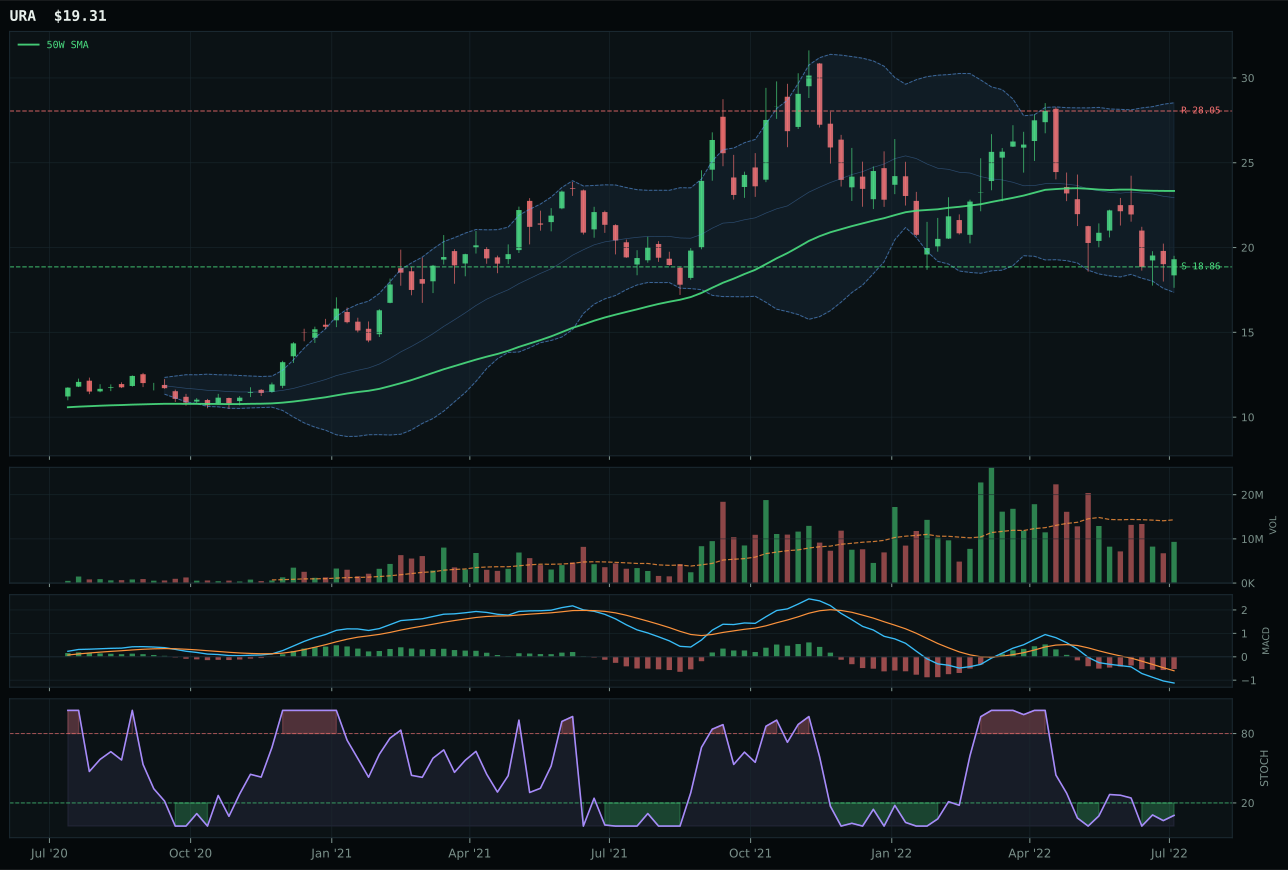
URA has a pullback into support profile with -16.6% 13-week relative strength versus SPY.
A failed hold above support would weaken the setup.
Actionable but governed by invalidation levels.
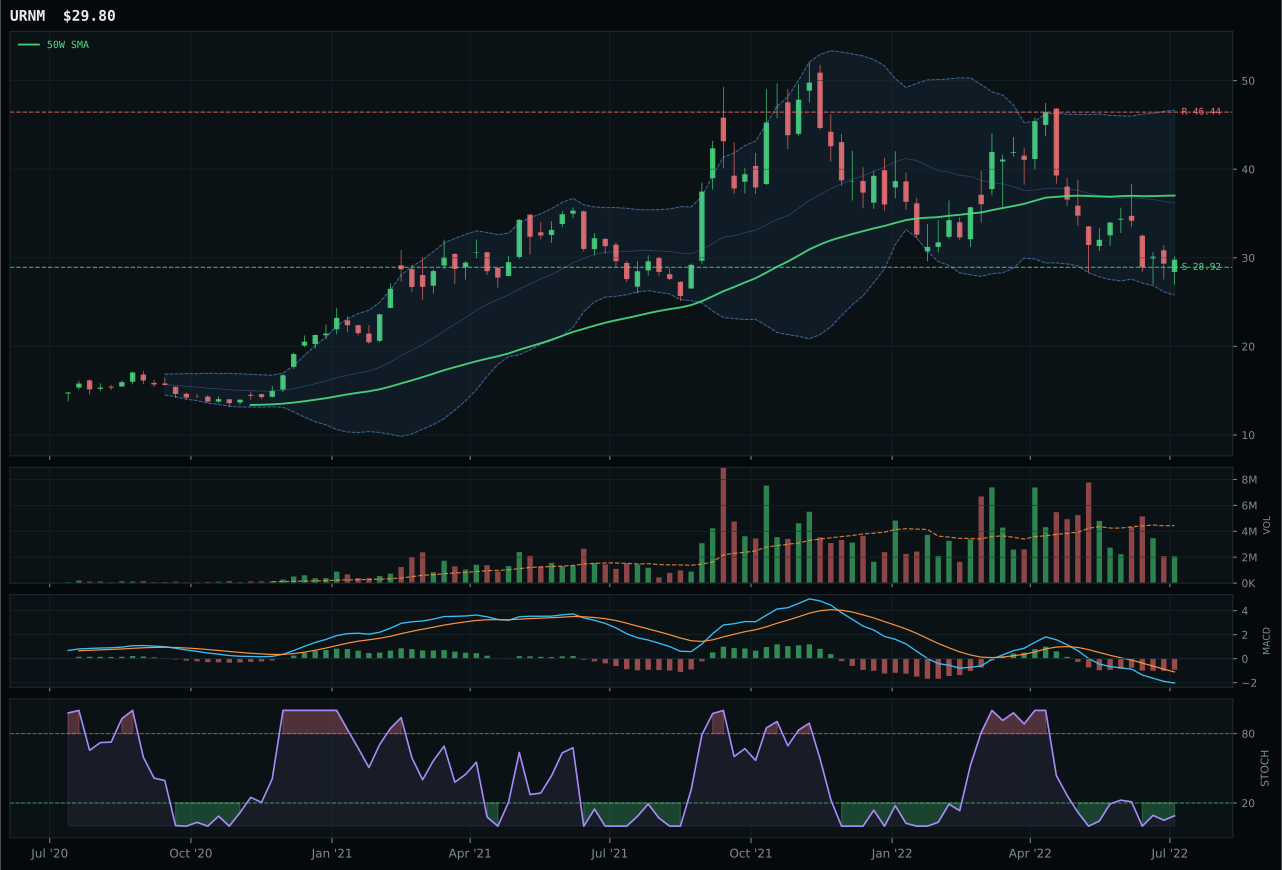
URNM has a pullback into support profile with -21.2% 13-week relative strength versus SPY.
A failed hold above support would weaken the setup.
Actionable but governed by invalidation levels.
URA wins a weak nuclear energy category by being the only name positioned in a genuine oversold-turn-up setup, whereas the runner-up NLR is only rising mid-zone. URA's stochastic RSI reads 0.09 (oversold turn up) compared to NLR's rising mid-zone at higher levels, suggesting uranium has compressed the final capitulation sellers and is now early in an accumulation move. URA sits -17.3% from the 50-week moving average versus NLR's smaller -3.0% distance, meaning uranium has decayed harder and offers better risk geometry if buyers commit. However, the gap is painful: URA's technical evidence is only 10.4/100, driven by zero momentum confirmation and weak structure (55.7/100). NLR, the runner-up, has superior technical evidence (45.0/100) because it shows rising momentum and stronger category-relative strength (+19.7% versus URA's 0.0%). The decision to crown URA reflects the portfolio's preference for deep-value resets over late-cycle continuation, but this is a win in a losing category.
Nuclear Energy holds 5% allocation as a tier-2 category with a final score of only 24.8. The category benefits from active energy scarcity (+9 points) and defensive rotation, yet suffers from active liquidity stress (-7 points) and risk-appetite deterioration (-4 points). A 48.0 macro fit score is substantially weaker than Precious Metals (88.0) or Utilities (80.0), explaining why nuclear is tier-2 and not top-2. For this category to move from 5% to 10%, URA would need to demonstrate sustained accumulation in volume and breadth above the 50-week moving average—right now it sits well below at 0.65x volume participation. Additionally, NLR's technical superiority (45.0 vs 10.4 for URA) creates an internal conflict: the macro regime favors defensive utilities with steady cash flows, not the speculative leverage inherent in uranium mining. The 5% weight is a token position held because energy scarcity remains active, but the portfolio's true defensive plays are in Utilities and Precious Metals, not nuclear.
AI — BOTZ
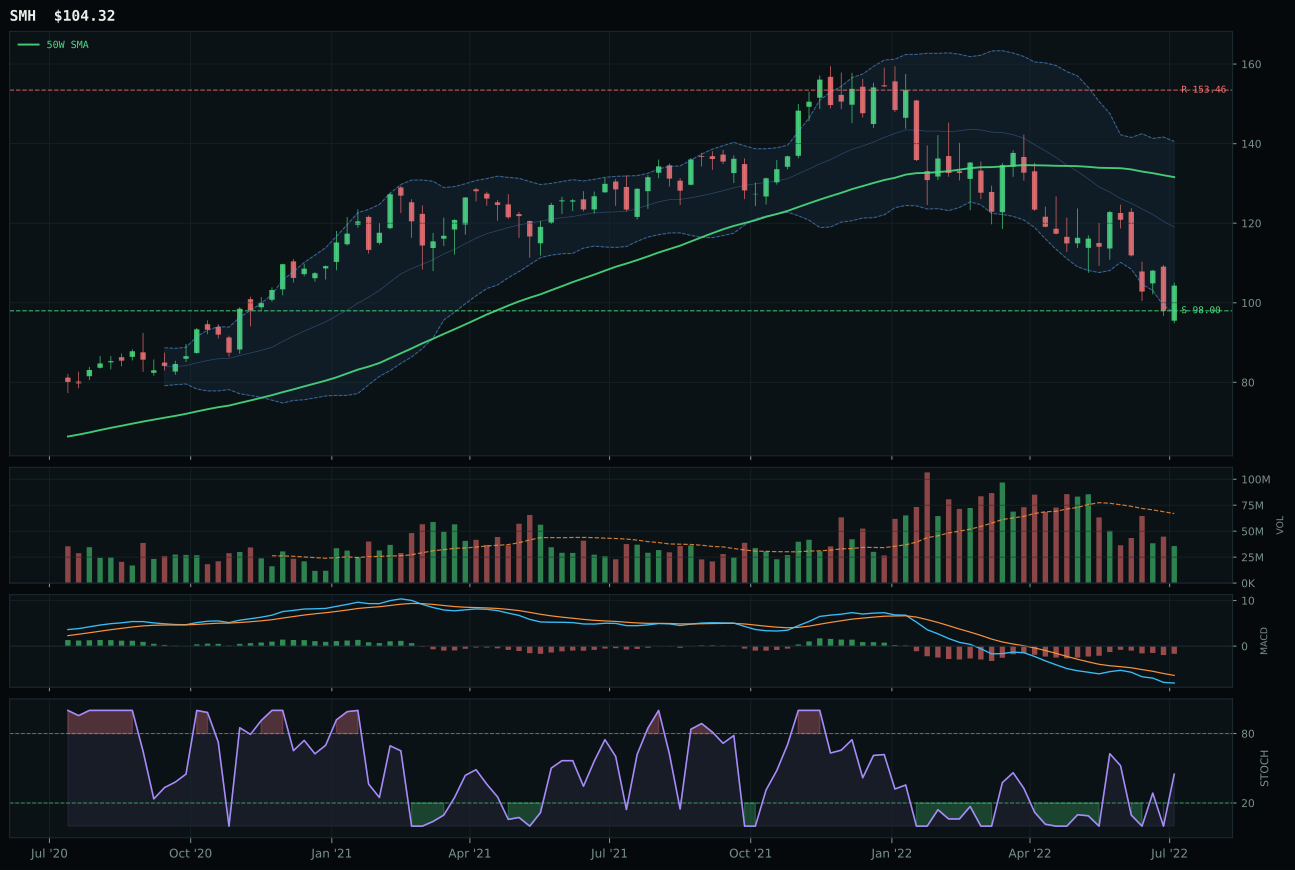
SMH has a neutral structure profile with -2.3% 13-week relative strength versus SPY.
A failed hold above support would weaken the setup.
Actionable but governed by invalidation levels.
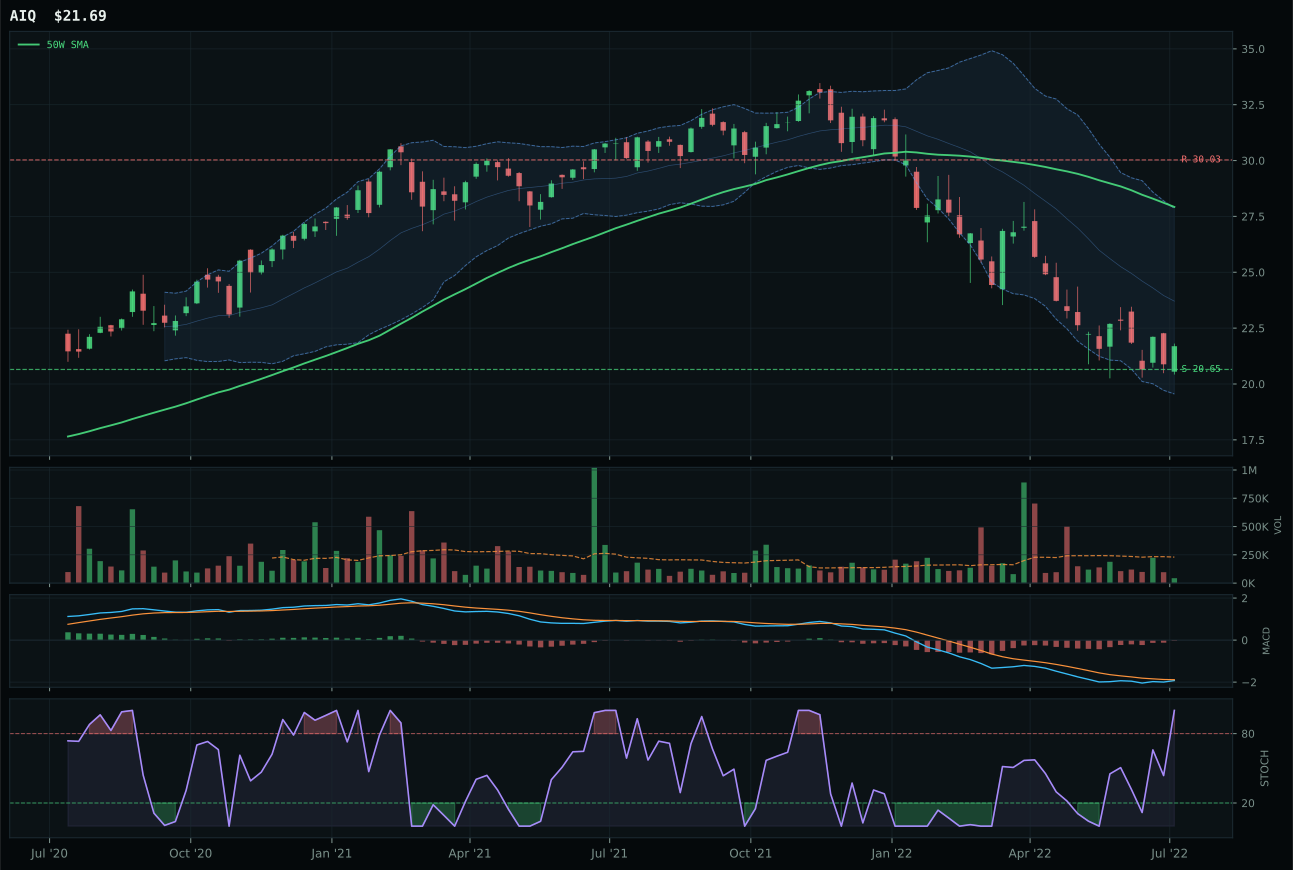
AIQ has a neutral structure profile with -2.4% 13-week relative strength versus SPY.
A failed hold above support would weaken the setup.
Tracked, but not top-2 eligible because: .
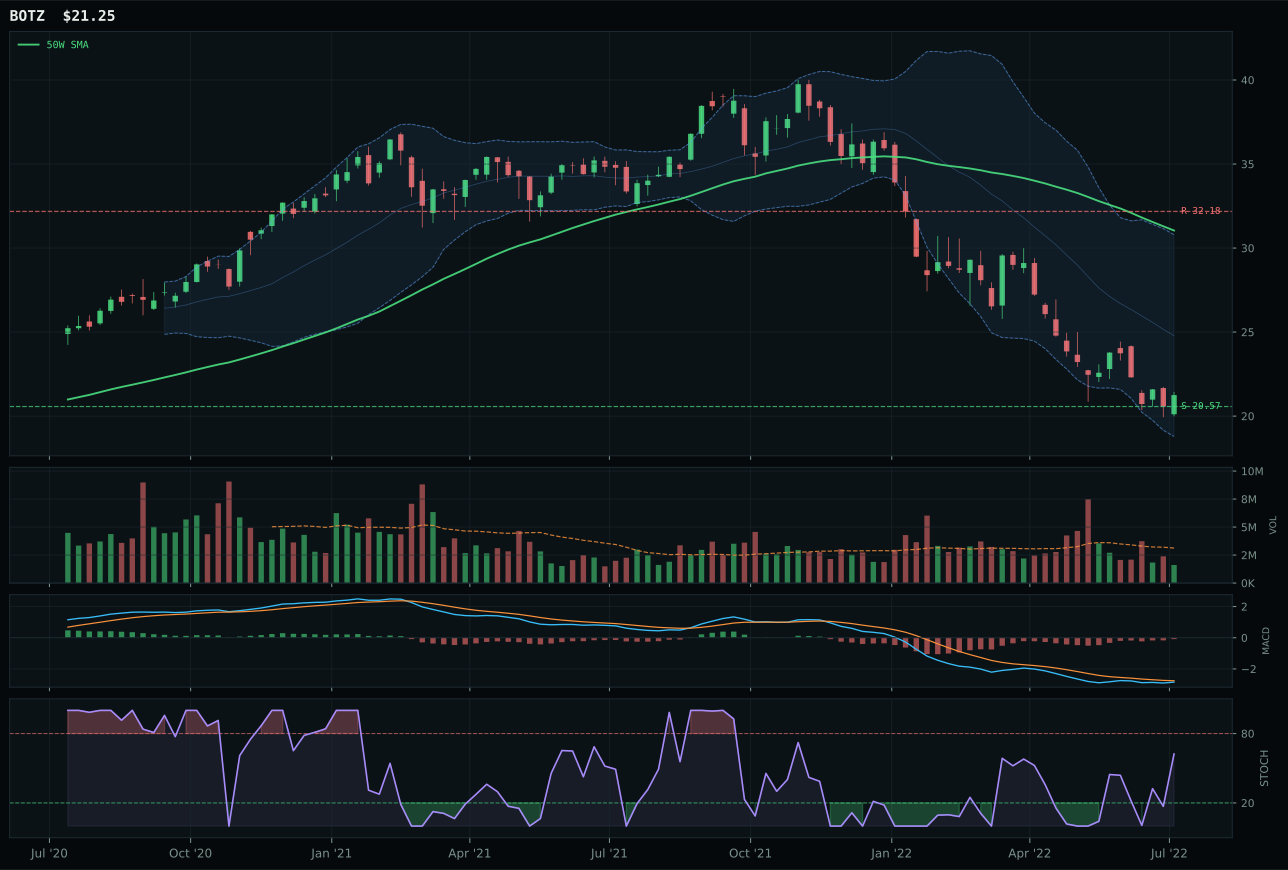
BOTZ has a pullback into support profile with -8.8% 13-week relative strength versus SPY.
A failed hold above support would weaken the setup.
Actionable but governed by invalidation levels.
BOTZ wins a deeply troubled category by being the only name with a pullback-into-support setup and a stochastic RSI that is rising from oversold mid-zone (0.62) rather than weakening from overbought. At -31.5% from the 50-week average and -22.0% over 13 weeks, BOTZ has compressed all the near-term damage into price, with support now defined at 20.57 and only 3.3% downside cushion remaining. This doesn't make BOTZ attractive on absolute terms—momentum confirmation scores a catastrophic 0.0/100 and persistence is 16.2/100—but it does make it the only candidate worth holding if robotics and AI cyclicality eventually stabilize. SMH's MACD is bearish and weakening (versus BOTZ's bearish but improving), and SMH at -20.7% from the 50W is neither fully capitulated nor cleanly structured. The category-level macro fit of 31.0/100 reflects -12 points from active liquidity stress and -8 from broad market bear, explaining why even the winner carries a composite technical evidence score of just 16.5/100.
AI holds 5% allocation despite a final category score of only 12.9, making it one of the portfolio's lowest-ranked positions. The allocation reflects a hold position rather than a conviction bet. Liquidity stress active across the regime costs this category -12 basis points of macro fit, and the broad market bear costs another -8. For AI to earn a top-2 spot at 10%, the category would require not just a stabilization in momentum (currently 0.0/100 across the winner) but also visible accumulation in volume—right now BOTZ trades at 0.52x its 20-week average, a signal of indifference rather than demand. The disinflation backdrop does provide +5 points of help, but that gain is dwarfed by risk-appetite deterioration. This is a category held for optionality: if semiconductor and robotics demand suddenly prove resilient to a growth slowdown, BOTZ's -31.5% drawdown offers recovery potential. Until that signal appears in volume and breadth, the 5% weight is appropriate as a small speculative allocation within a defensive portfolio framework.
Traditional Energy — XLE
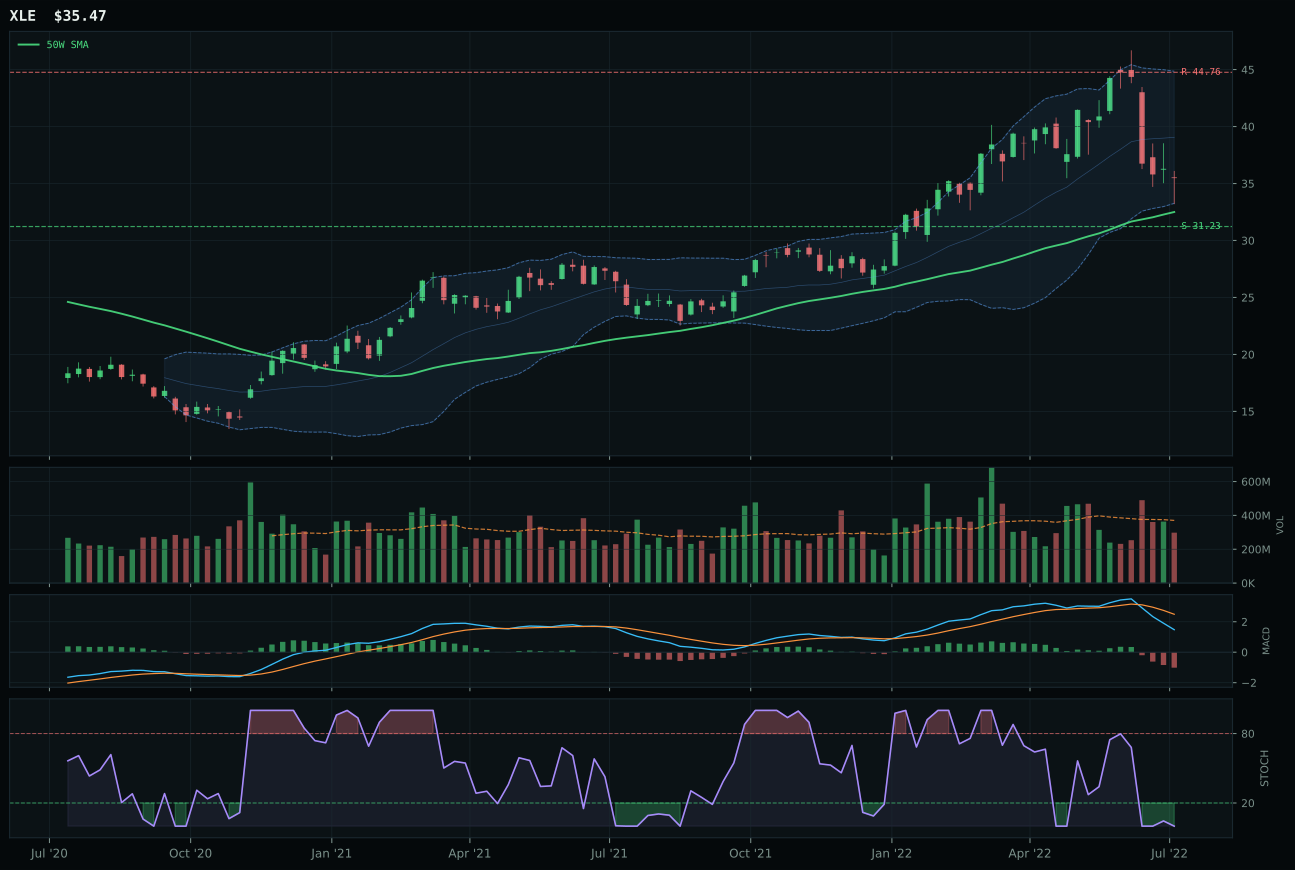
XLE has a neutral structure profile with 2.4% 13-week relative strength versus SPY.
A failed hold above support would weaken the setup.
Actionable but governed by invalidation levels.
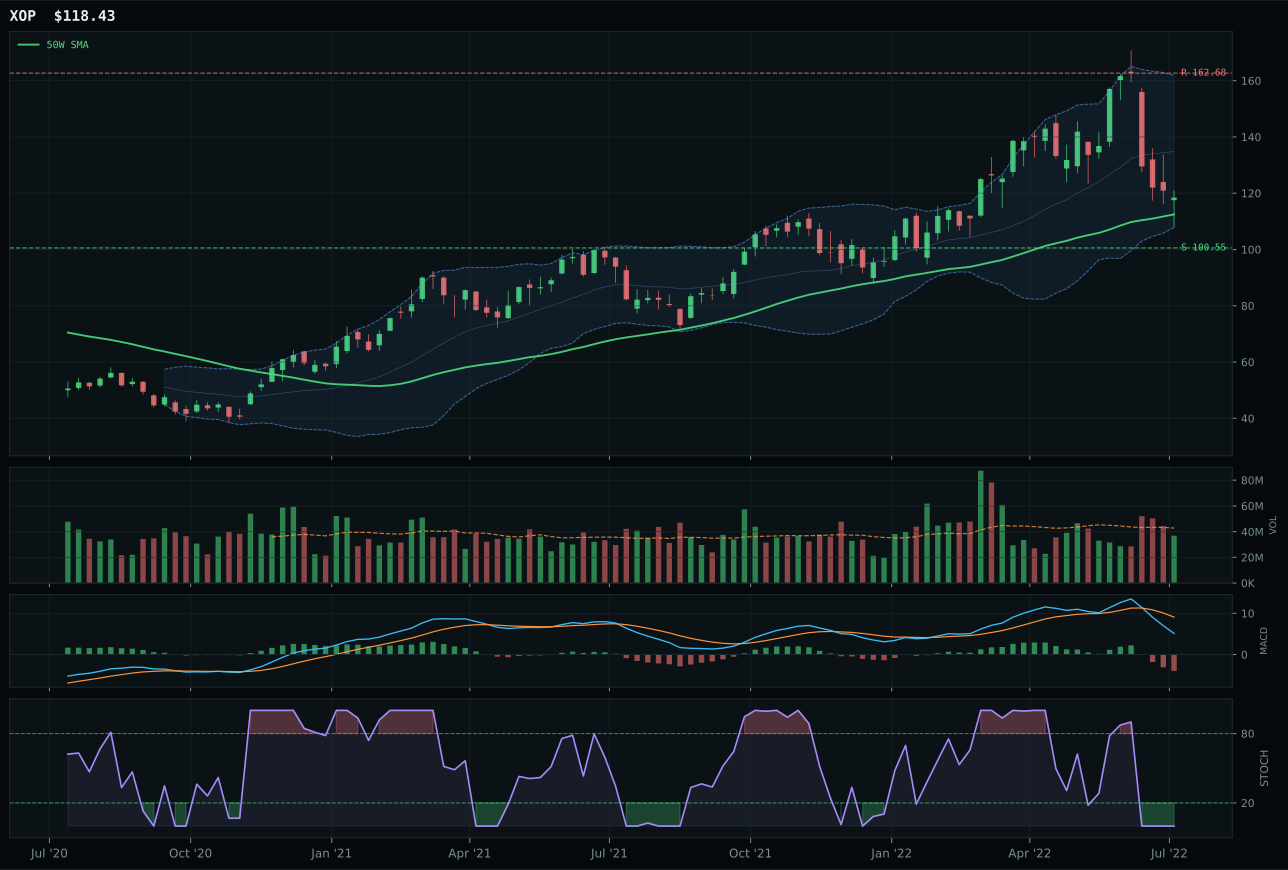
XOP has a neutral structure profile with -2.2% 13-week relative strength versus SPY.
A failed hold above support would weaken the setup.
Actionable but governed by invalidation levels.
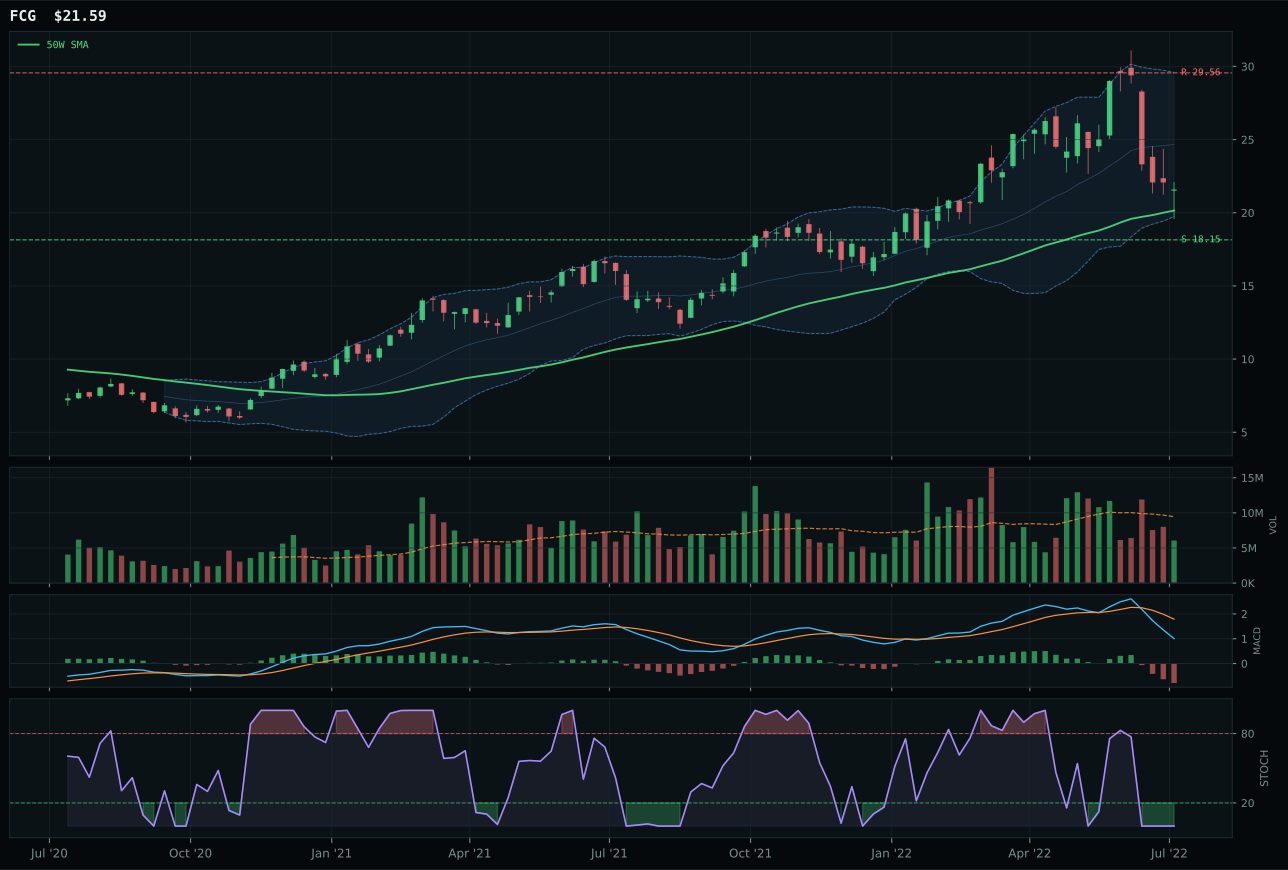
FCG has a neutral structure profile with -2.7% 13-week relative strength versus SPY.
A failed hold above support would weaken the setup.
Actionable but governed by invalidation levels.
XLE wins the energy category not through momentum, but through relative durability and trend stability. The ETF trades 9.2% above the 50-week moving average—the only name in its basket above the 50W—with price above the 200W and a 50W slope holding steady at 0.7%. This setup scores 75.6/100 on trend, substantially higher than XOP (69.0) and FCG (78.0, though FCG's trend is slightly better). The critical differentiator is XLE's category-relative strength of +4.6% versus XOP's 0.0%, proof that integrated energy cash-flow defense is outperforming pure exploration and natgas plays. XOP loses because its structure is less clean (59.1 vs 63.1 for XLE) and its category-relative strength reveals zero outperformance. Both face identical macro headwinds: energy scarcity is active (+14 to +16 points depending on the ETF), yet disinflation pressure costs -8 to -10 points. XLE's ability to stay above the 50W while peers have sold off below suggests institutional cash-flow buyers are defending integrated energy valuations.
Traditional Energy holds 5% allocation as a tier-2 category despite a weak final score of 11.0. The category-level macro fit is only 39.0/100, meaning XLE and its peers are fighting a disinflation headwind that costs -10 points. The offsetting tailwind is energy scarcity (+16 points active), yet that scarcity benefit appears fully priced into the technical setup already: XLE's momentum confirmation scores only 1.1/100, and volume is neutral at 0.80x the 20-week average. For Traditional Energy to graduate to 5% allocation, the energy scarcity descriptor would need to remain active AND demonstrate visible follow-through in volume and breadth. Right now, buyers have stepped in tactically to defend XLE above the 50W, but the setup lacks persistence (39.2/100). The 5% weight reflects a hold of a disinflation-resistant play, not a conviction accumulation. If risk appetite suddenly improves and the broad market bear descriptor flips off, energy will likely remain a secondary sector play behind Utilities and Precious Metals.
Emerging Markets — INDA
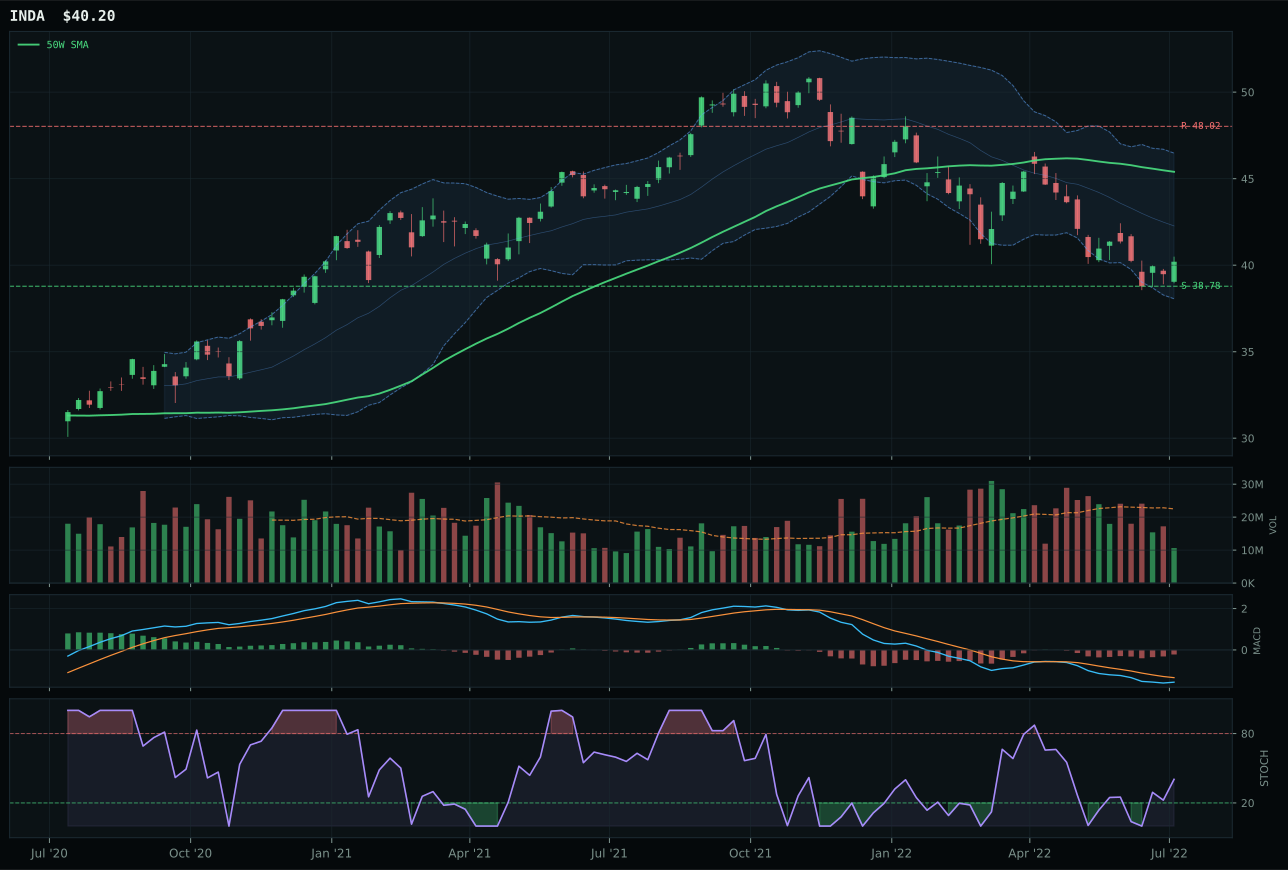
INDA has a pullback into support profile with 0.8% 13-week relative strength versus SPY.
A failed hold above support would weaken the setup.
Actionable but governed by invalidation levels.
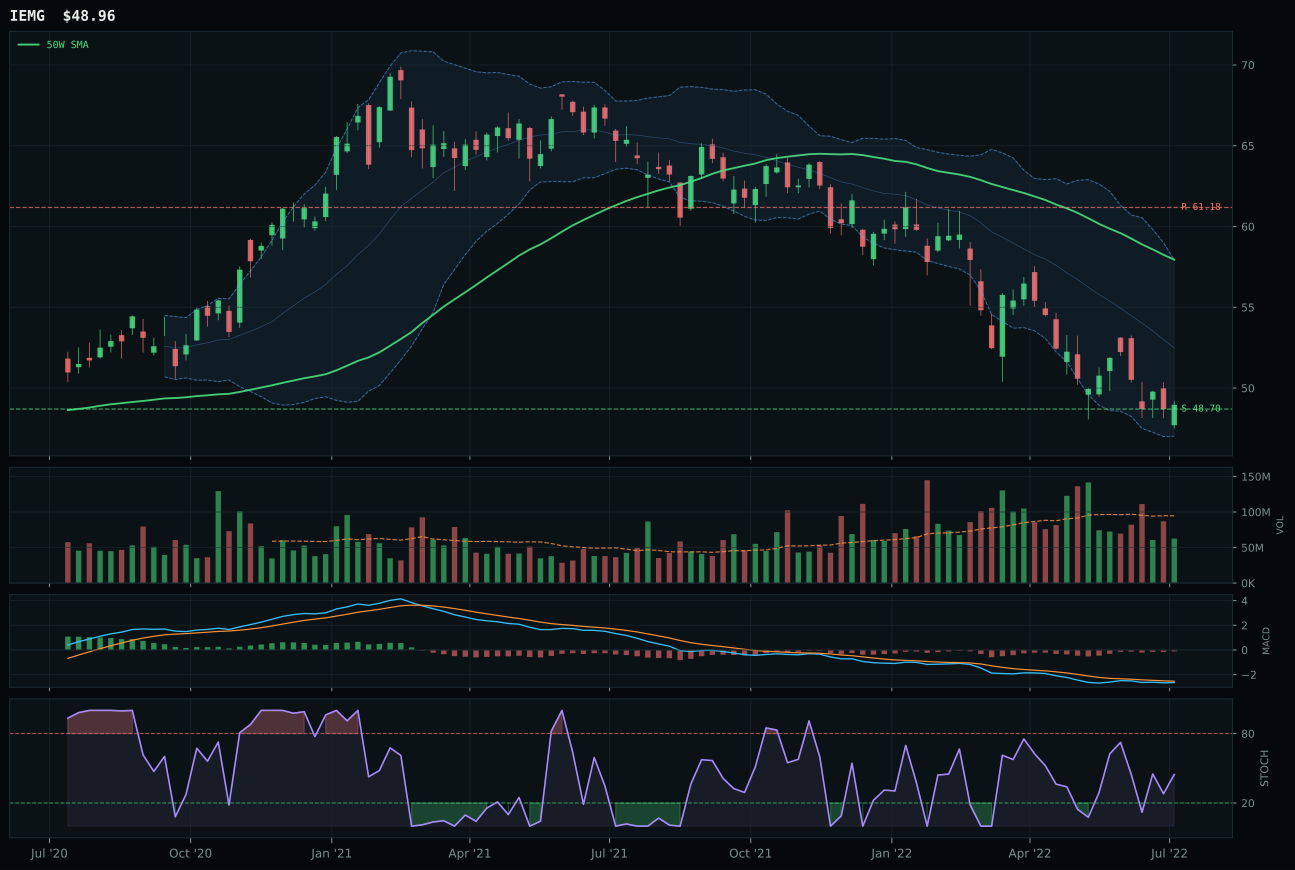
IEMG has a pullback into support profile with 1.5% 13-week relative strength versus SPY.
A failed hold above support would weaken the setup.
Actionable but governed by invalidation levels.
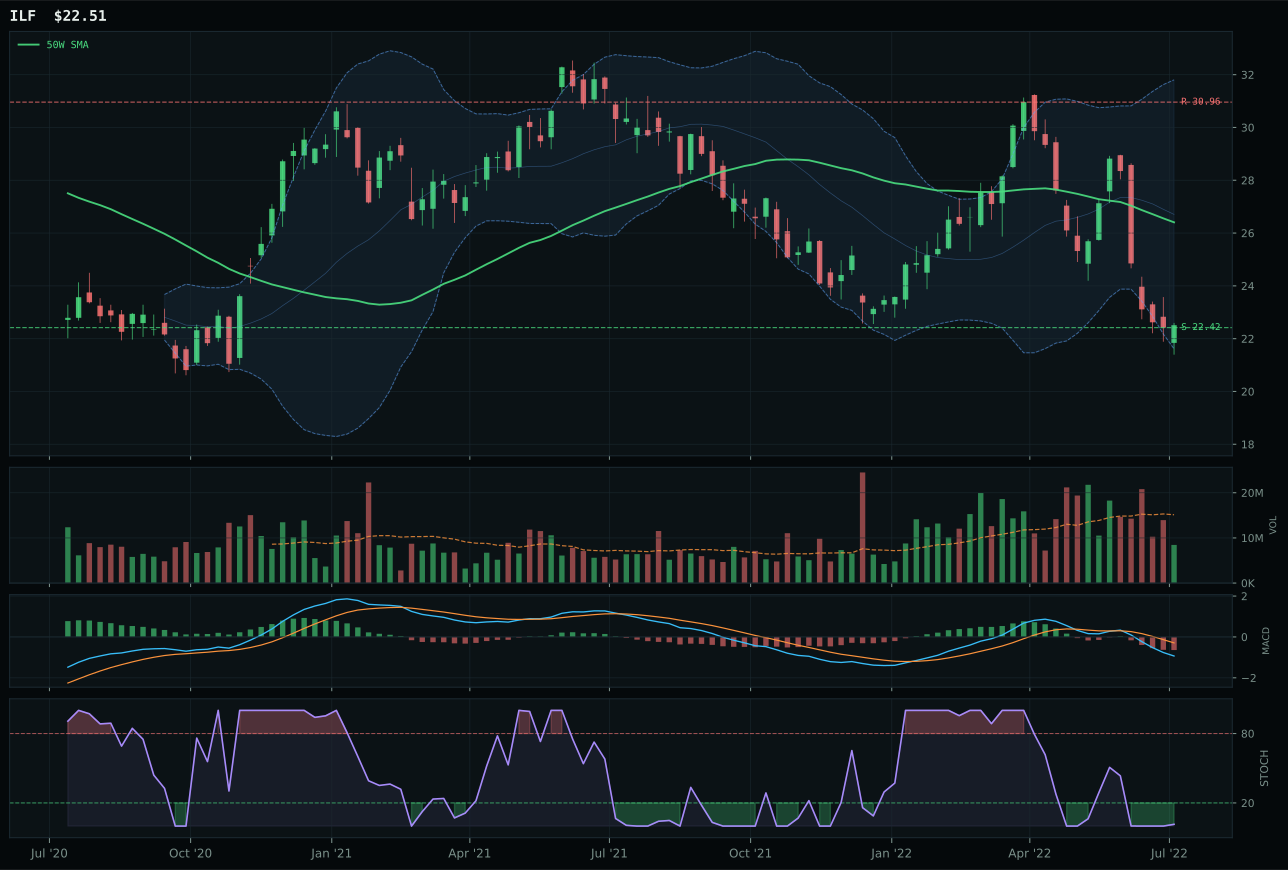
ILF has a pullback into support profile with -11.5% 13-week relative strength versus SPY.
Extension and support failure are the main tactical risks.
Tracked, but not top-2 eligible because: structurally broken.
INDA wins its category with a pullback-into-support structure and strong trend positioning (59.2/100), plus a critical 0.8% relative strength advantage versus SPY that reflects India's structural growth profile holding better than broader emerging-market baskets. The ETF trades -11.4% from the 50-week moving average with support defined at 38.78 and only 3.7% downside cushion, versus IEMG's broader emerging-market exposure which has suffered -11.6% over 13 weeks and carries a timing score of only 73 (versus INDA's 73, but on a weaker structure). INDA's composition as quality-growth exposure means it carries less currency and commodity sensitivity than IEMG's broader basket, which is why INDA maintains positive relative strength despite the macro headwinds. The structure gap of 0.8 points (67.8 vs 67.0) appears small, but combined with INDA's +0.8% SPY-relative strength, it demonstrates India's defensive qualities are being rewarded. The score gap of 6.6 points reflects a material edge on macro fit (40.0 for INDA vs 32.0 for IEMG).
Emerging Markets holds 5% allocation as a tier-2 category with a final score of only 6.3. The macro regime is sharply hostile: dollar pressure active costs -14 points, liquidity stress active costs -10 points, and the broad market bear costs -9 points. A category-level macro fit of 17.0/100 is the third-lowest in the portfolio, surpassed only by Agriculture (32.0) and Industrial Metals (35.0). INDA's +0.8% relative strength is a bright spot, but it cannot overcome the structural headwind of dollar strength and capital flows retreating from emerging markets. For Emerging Markets to move from 5% to 10%, one of three things must occur: (a) the dollar pressure descriptor must flip off (requiring a dollar breakdown), (b) the broad market bear must reverse (requiring renewed risk appetite), or (c) emerging-market currencies and equities must decouple from these macro flows through a positive earnings surprise. None of these signals exist today. The 5% weight is held primarily for optionality and because INDA's quality-growth positioning offers some protection if the broader EM complex deteriorates further. However, this is a low-conviction allocation.
Industrial Metals — COPX
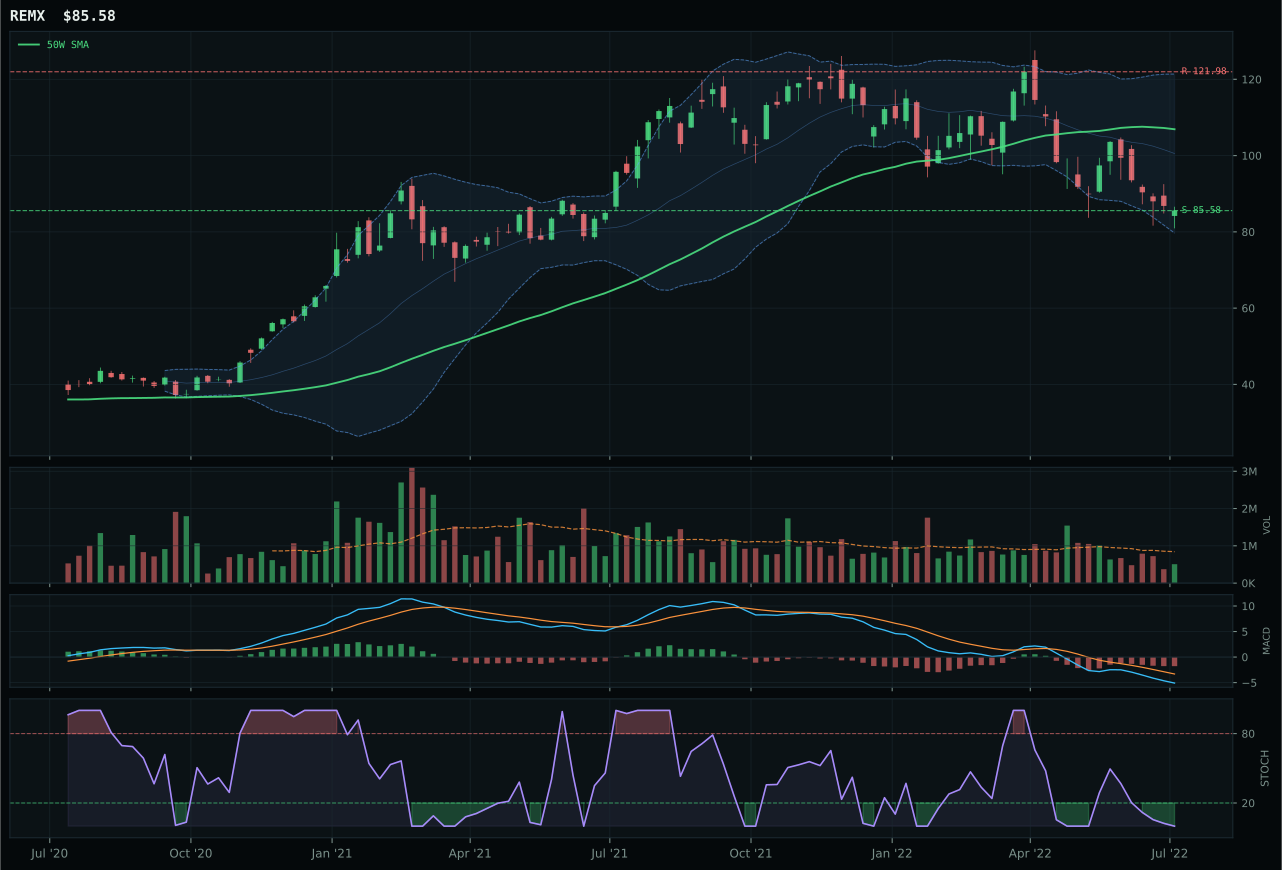
REMX has a pullback into support profile with -12.2% 13-week relative strength versus SPY.
A failed hold above support would weaken the setup.
Actionable but governed by invalidation levels.
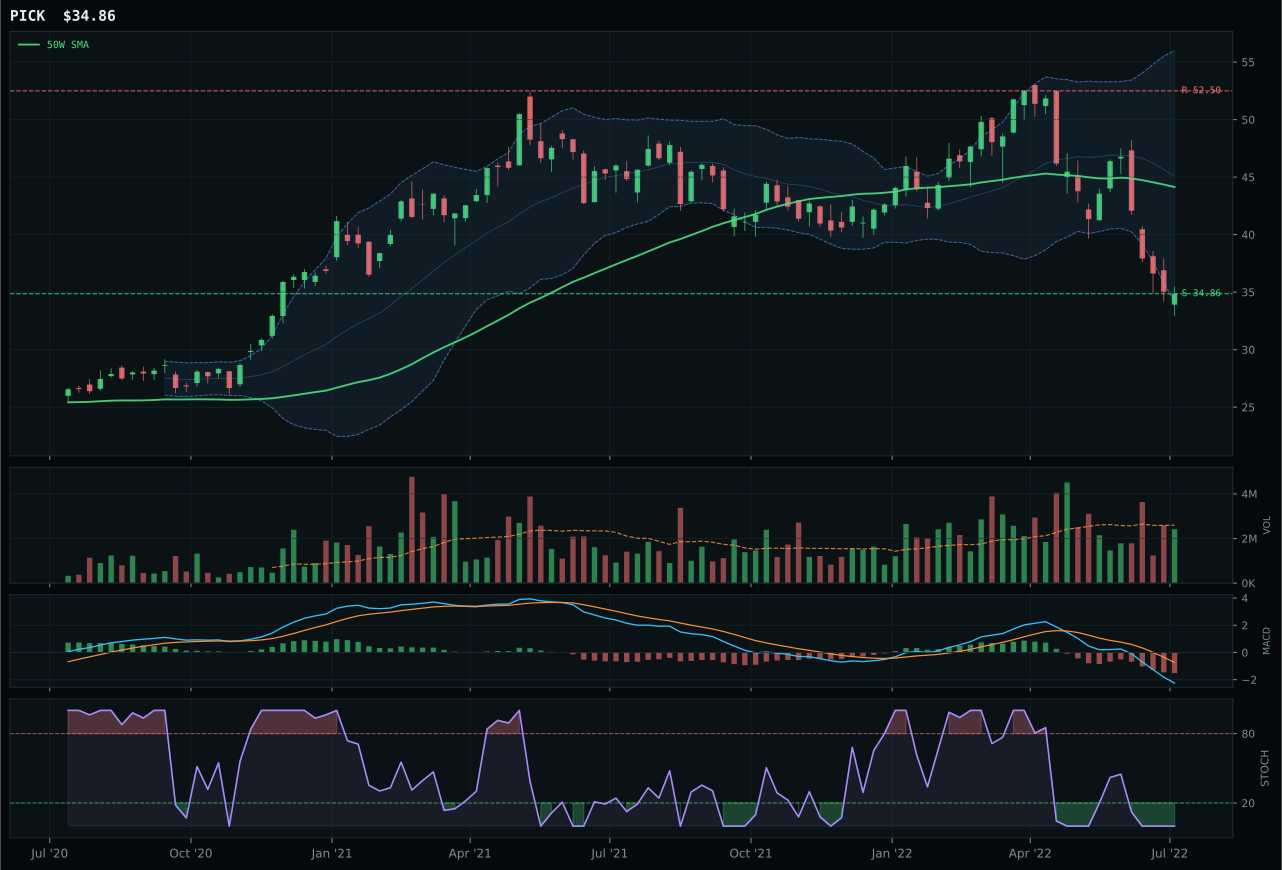
PICK has a pullback into support profile with -19.0% 13-week relative strength versus SPY.
A failed hold above support would weaken the setup.
Actionable but governed by invalidation levels.
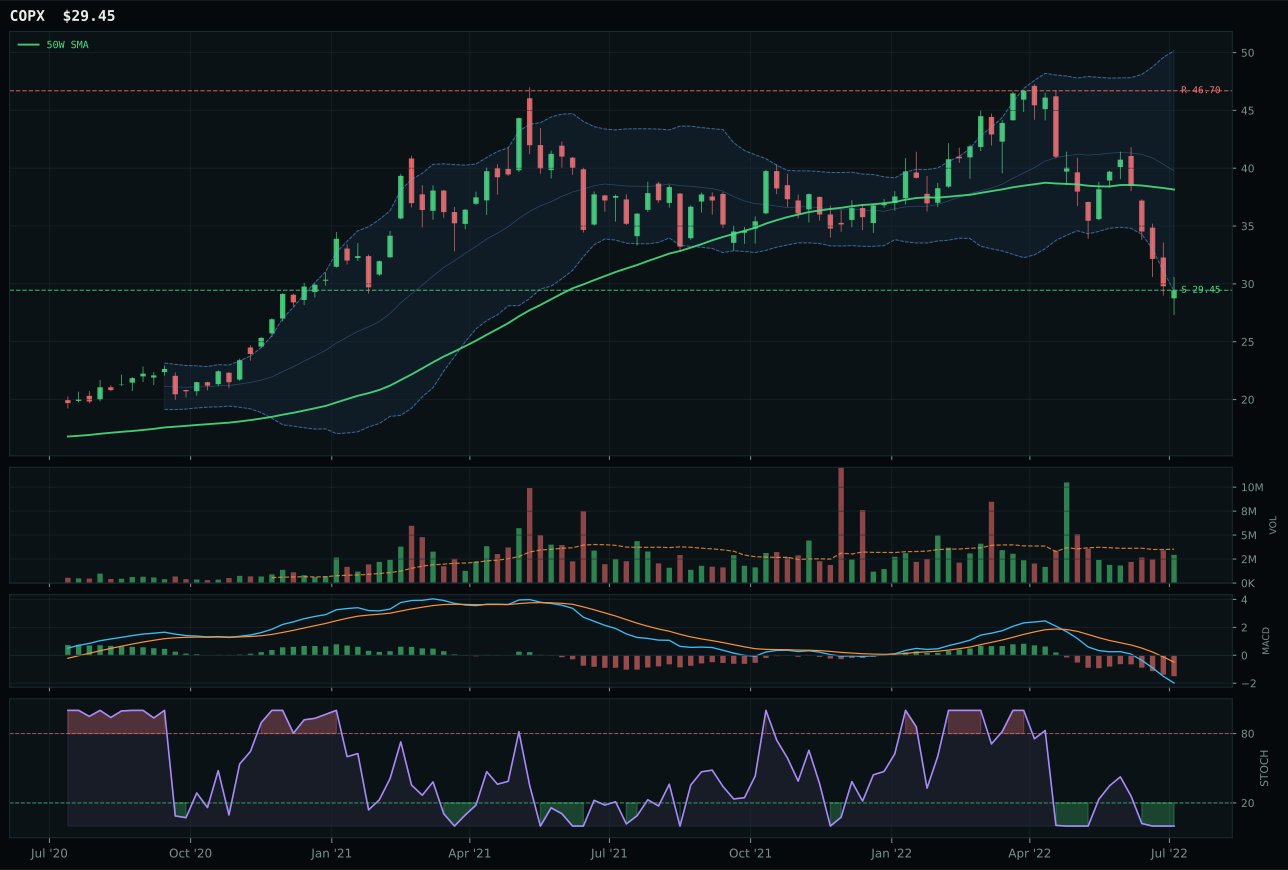
COPX has a pullback into support profile with -22.0% 13-week relative strength versus SPY.
A failed hold above support would weaken the setup.
Actionable but governed by invalidation levels.
Industrial Metals earned 0% allocation this week, excluded entirely as the 10th-ranked category. COPX nominally wins a category that is being de-allocated, posting a final score of only 6.0—lower than the competing Precious Metals category despite similar chart structures. The setup mechanics resemble VEGI's agriculture coil: price sits -22.8% from the 50-week moving average in pullback-into-support structure with support defined at 29.45 and MACD bearish/weakening. However, COPX's relative strength at -22.0% versus SPY is deeply negative, signaling that copper demand expectations have deteriorated substantially. The category's technical evidence from COPX is 0.0/100, a zero-floor score that indicates no momentum confirmation whatsoever across the four-week, 13-week, and category-relative windows. REMX, the runner-up, offers slightly better structure (52.7 vs 55.2) but equally weak technicals. The 2.6-point gap between COPX and REMX is immaterial; both are broken and excluded.
Industrial Metals earned 0% allocation as a tier-2 excluded category, ranked 10th among all ten categories. The macro regime is actively hostile: liquidity stress costs -8 points and dollar pressure costs -7 points. Unlike Precious Metals, industrial metals benefit from neither the monetary hedge bid (active for gold) nor the disinflation deflation that supports fixed-income allocations. Copper's negative relative strength of -22.0% versus SPY is the canary in the coal mine for growth expectations—if industrial metals are selling off this badly, it reflects anticipated slowdown in manufacturing and construction demand. The category-level macro fit of 35.0/100 is 53 points lower than Precious Metals, an enormous gap that explains the exclusion. For Industrial Metals to earn a 5% tier-2 slot, the macro regime would need to shift decisively away from disinflation fears toward either (a) sudden inflation resurge, or (b) sustained risk-on appetite that makes manufacturing recovery credible. Neither signal is present; the portfolio correctly de-allocates this category entirely.
Agriculture & Livestock — VEGI
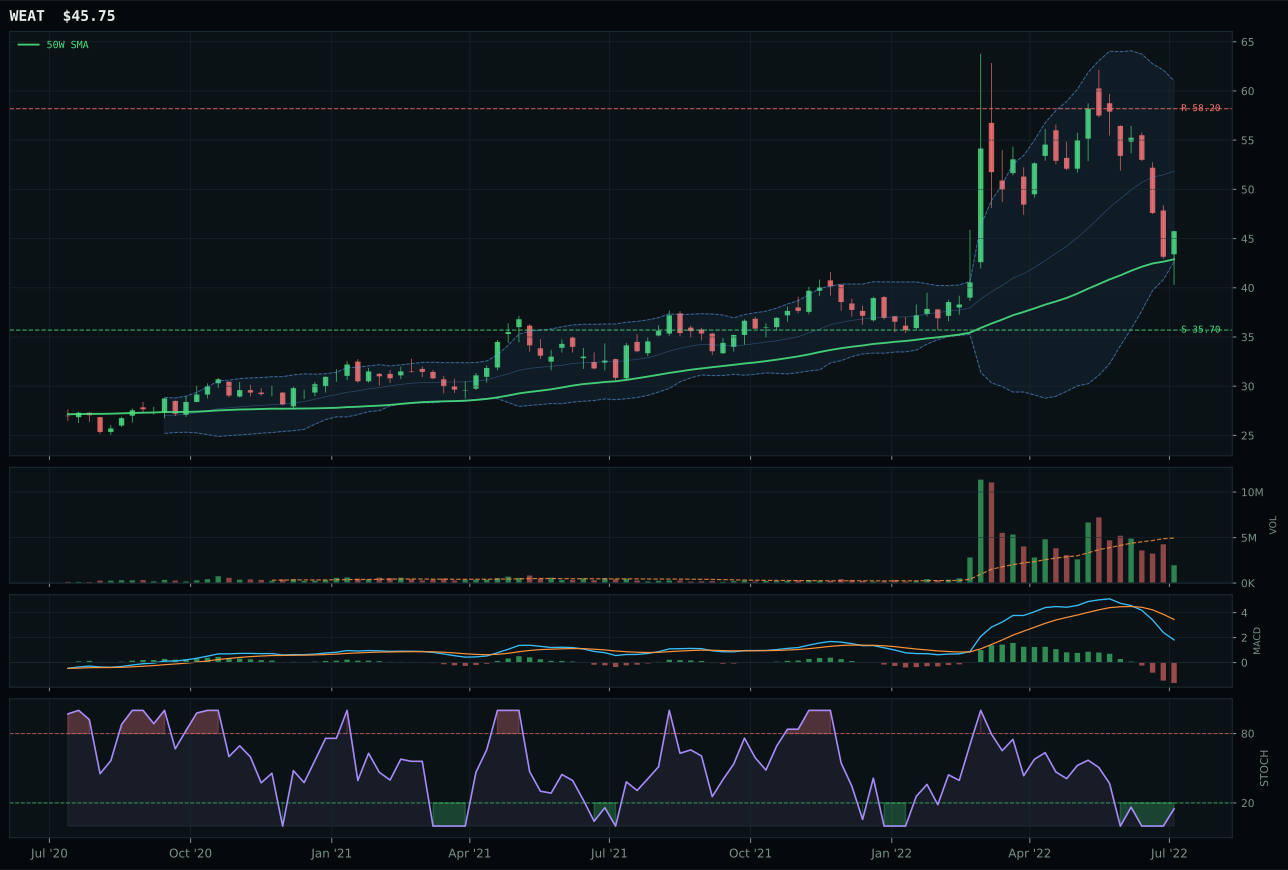
WEAT has a neutral structure profile with 0.1% 13-week relative strength versus SPY.
A failed hold above support would weaken the setup.
Actionable but governed by invalidation levels.
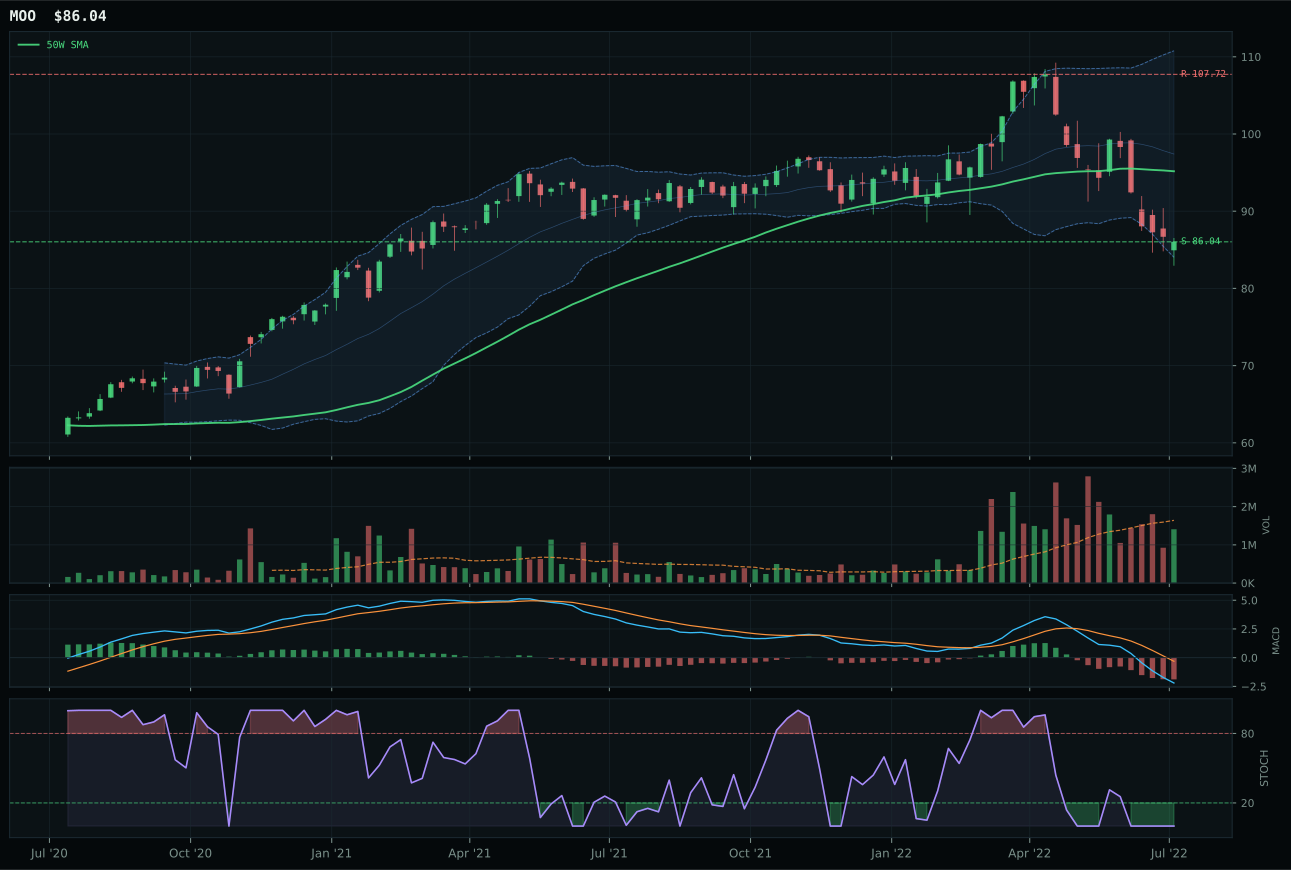
MOO has a pullback into support profile with -6.7% 13-week relative strength versus SPY.
A failed hold above support would weaken the setup.
Actionable but governed by invalidation levels.
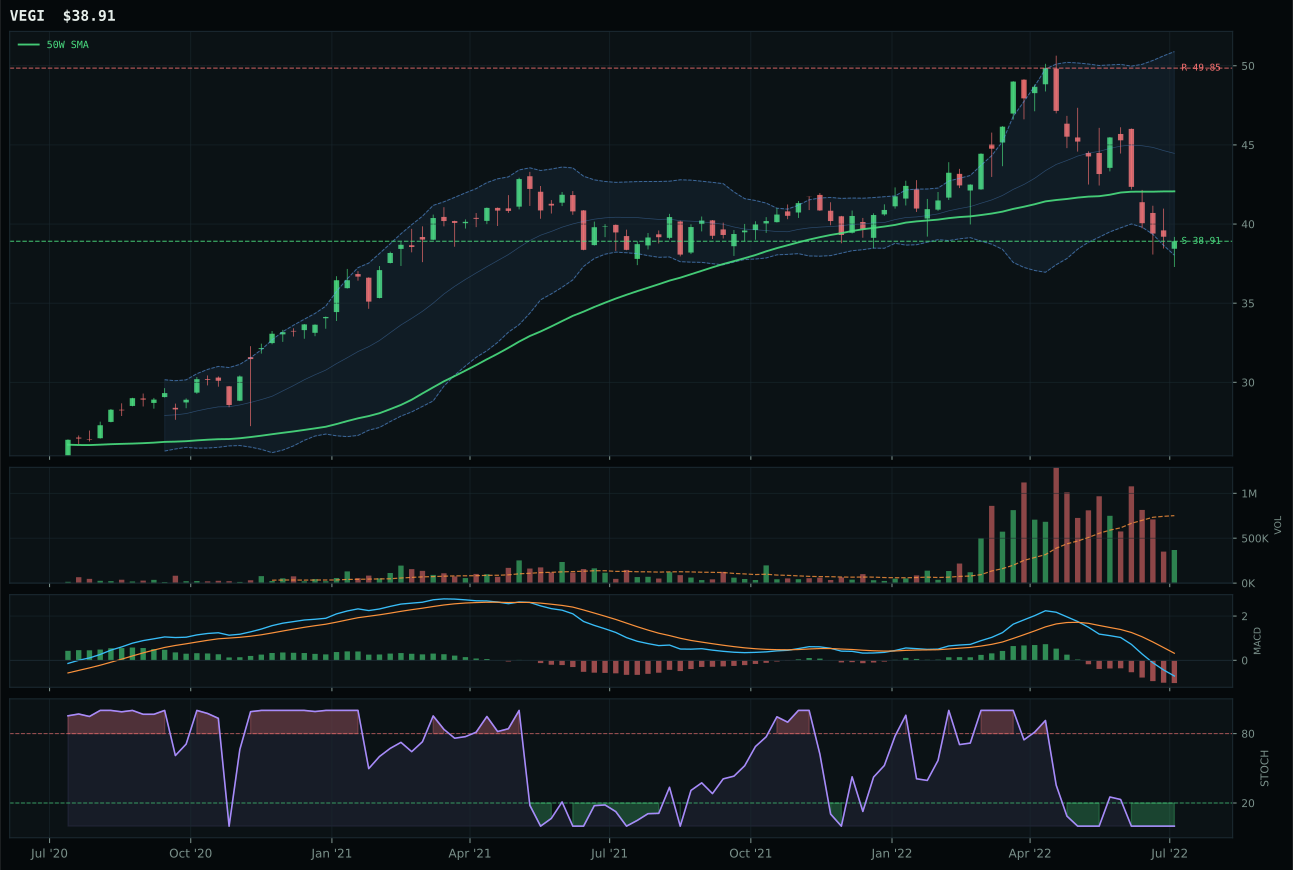
VEGI has a pullback into support profile with -6.9% 13-week relative strength versus SPY.
A failed hold above support would weaken the setup.
Actionable but governed by invalidation levels.
Agriculture received 0% allocation this week, excluded entirely as the 9th-ranked category. VEGI nominally 'wins' a category that is being de-allocated, posting a final score of only 5.0. The setup does have merit on a standalone basis: price sits -7.5% from the 50-week moving average in pullback-into-support structure with a support level defined at 38.91. However, the category's macro fitness collapses to 32.0/100 because disinflation hurts agricultural exposure by -6 points, and active disinflation pressure costs another -8. VEGI's technical evidence is catastrophically low at 2.7/100, driven by bearish/weakening MACD, oversold stochastic RSI, and zero momentum confirmation. WEAT, the runner-up, has superior trend and timing scores but its risk/reward is crippled at 43.7/100 because it sits 6.7% above the 50-week average, meaning every new buyer is late. The 23.8-point gap between VEGI and WEAT exists not because VEGI is good, but because WEAT is further extended and therefore riskier.
Agriculture & Livestock earned 0% allocation as a tier-2 excluded category. The disinflation macro regime is directly hostile to commodity producers: a falling price environment for agricultural outputs removes the scarcity premium that would otherwise support valuations. The category-level macro fit of 32.0/100 reflects -6 points from disinflation itself, -8 from active disinflation pressure, and -4 from liquidity stress. Even the best-timed entry point (VEGI's 80.0 timing score) cannot overcome a 3/2/1 weighted basket that starts at only 31.4 and deteriorates further after testing against leadership and persistence. For Agriculture to earn even a 5% tier-2 slot, this category would require either a visible macro shift away from disinflation or a sudden spike in agricultural commodity prices driven by scarcity. Neither signal is present. The portfolio's capital is better deployed in categories where macro tailwinds exist rather than massive headwinds—this is a clear exclusion, not a marginal call.