
2022-07-01
Informational purposes only. The content in this report, including allocations, analysis, and commentary, is provided solely for informational and educational purposes. It does not constitute financial advice, investment advice, trading advice, or any other type of advice. Past performance does not guarantee future results. Always conduct your own research and consult a qualified financial professional before making investment decisions.
XLE defensive overlay excluded: price is below its 8W SMA. Cause selector will use GLD or cash alternative.
GLD defensive overlay excluded: price is below its 8W SMA. Cause selector will use cash alternative.
Macro risk engine requires the 50% Defensive overlay for this run; payload selected by cause: Transition Defense.
Weekly Allocation
| Ticker | Category | Weight | Role |
|---|---|---|---|
| SGOV | 20% | Overlay | |
| GLD | Precious Metals | 25% | Overlay |
| XLU | Utilities & Infrastructure | 25% | Overlay |
| CIBR | Technology | 5% | Tier-2 (5%) |
| ITA | Defense & Aerospace | 5% | Tier-2 (5%) |
| URA | Nuclear Energy | 5% | Tier-2 (5%) |
| XLE | Traditional Energy | 5% | Tier-2 (5%) |
| BOTZ | AI | 5% | Tier-2 (5%) |
| VEGI | Agriculture & Livestock | 5% | Tier-2 (5%) |
Trade Instructions — Monday Open
Sell the tranche from 2022-06-03 (completing its 4-week hold). Buy the new tranche. Instructions show net portfolio changes — same-asset positions cancel, weight changes show the delta.
| Action | Ticker | Instruction |
|---|---|---|
| SELL | XLE | Sell 44% of XLE position (reduce 31.25% → 17.50%) |
| SELL | VEGI | Sell 25% of VEGI position (reduce 5.00% → 3.75%) |
| SELL | COPX | Sell 25% of COPX position (reduce 5.00% → 3.75%) |
| SELL | IGF | Sell 50% of IGF position (reduce 2.50% → 1.25%) |
| SELL | IGV | Sell 25% of IGV position (reduce 5.00% → 3.75%) |
| BUY | GLD | Buy GLD — 26.67% of freed cash (adds 5.00% to portfolio) |
| BUY | XLU | Buy XLU — 33.33% of freed cash (adds 6.25% to portfolio) |
| BUY | SGOV | Buy SGOV — 26.67% of freed cash (adds 5.00% to portfolio) |
| BUY | CIBR | Buy CIBR — 6.67% of freed cash (adds 1.25% to portfolio) |
| BUY | BOTZ | Buy BOTZ — 6.67% of freed cash (adds 1.25% to portfolio) |
Current Portfolio After Trade
Combined holdings across all 4 active tranches. Each tranche is 25% of the portfolio.
| Ticker | % of Portfolio | Weight Bar |
|---|---|---|
| GLD | 20.00% | |
| XLE | 17.50% | |
| XLU | 16.25% | |
| SGOV | 15.00% | |
| ITA | 5.00% | |
| VEGI | 3.75% | |
| COPX | 3.75% | |
| IGV | 3.75% | |
| URNM | 3.75% | |
| XOP | 2.50% | |
| CIBR | 2.50% | |
| BOTZ | 2.50% | |
| IGF | 1.25% | |
| INDA | 1.25% | |
| URA | 1.25% |
Macro Regime — Disinflation
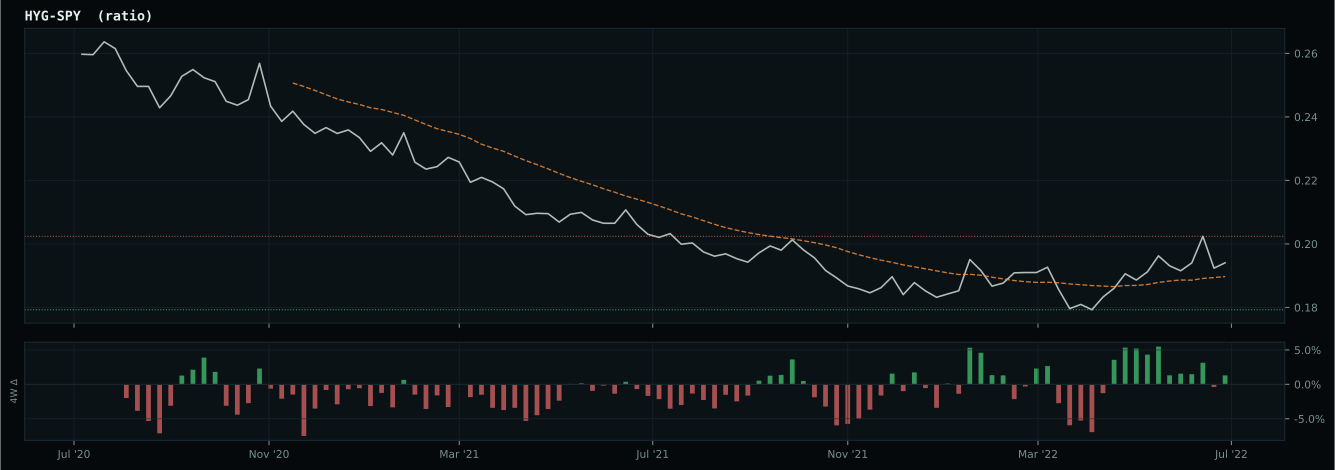
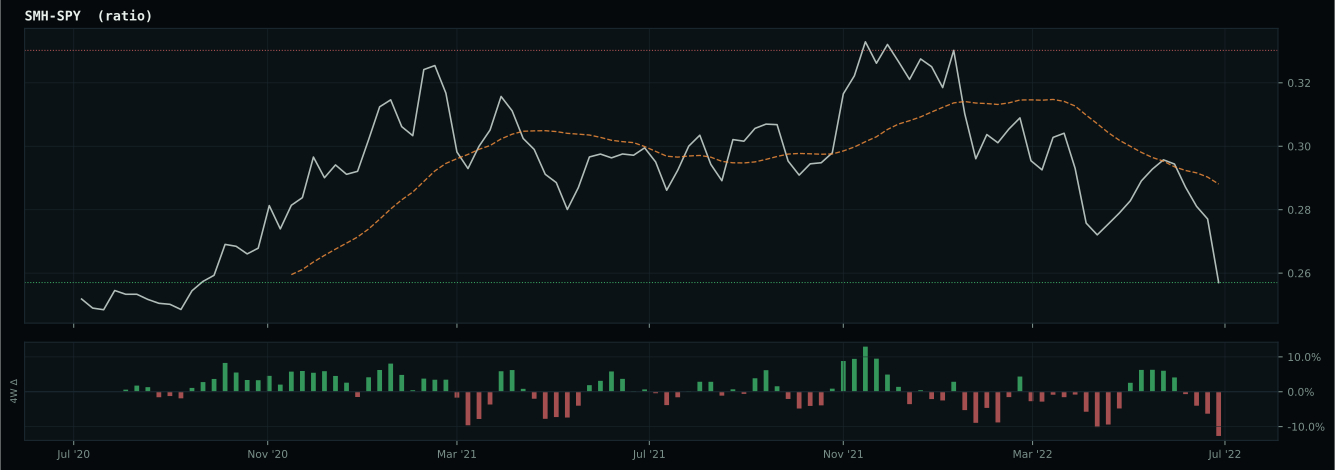
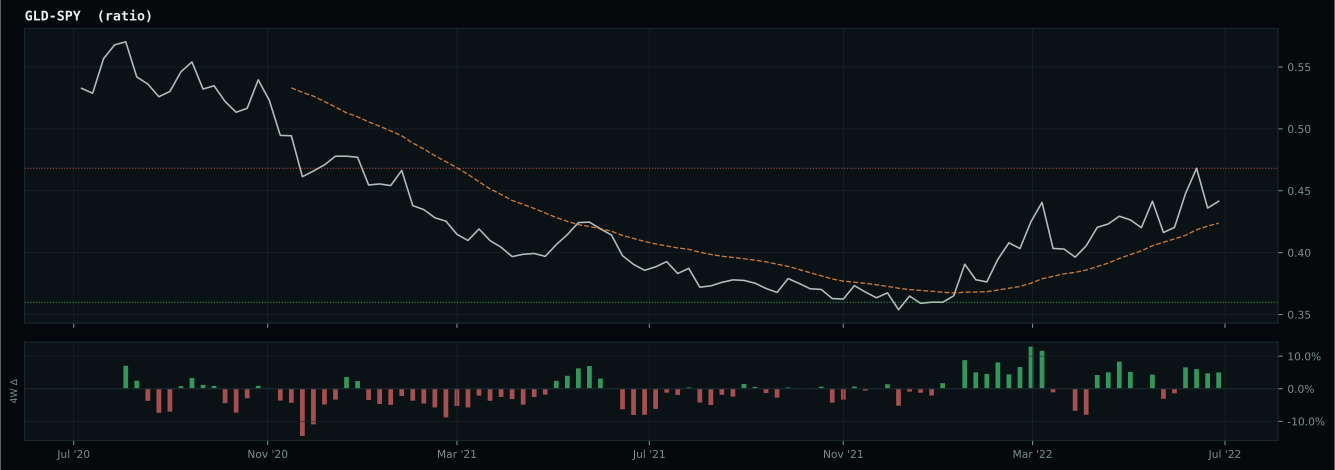
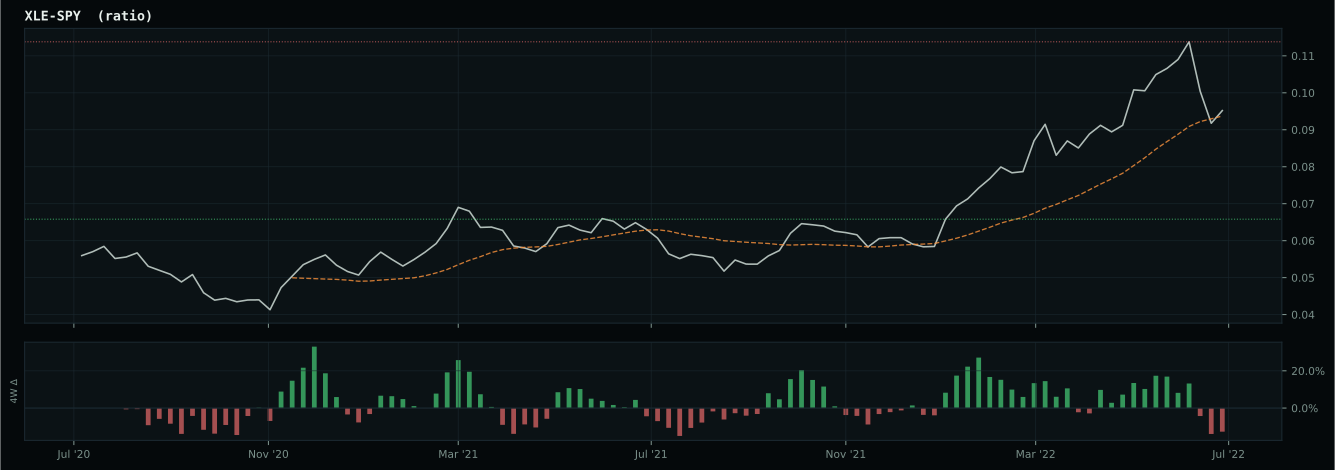
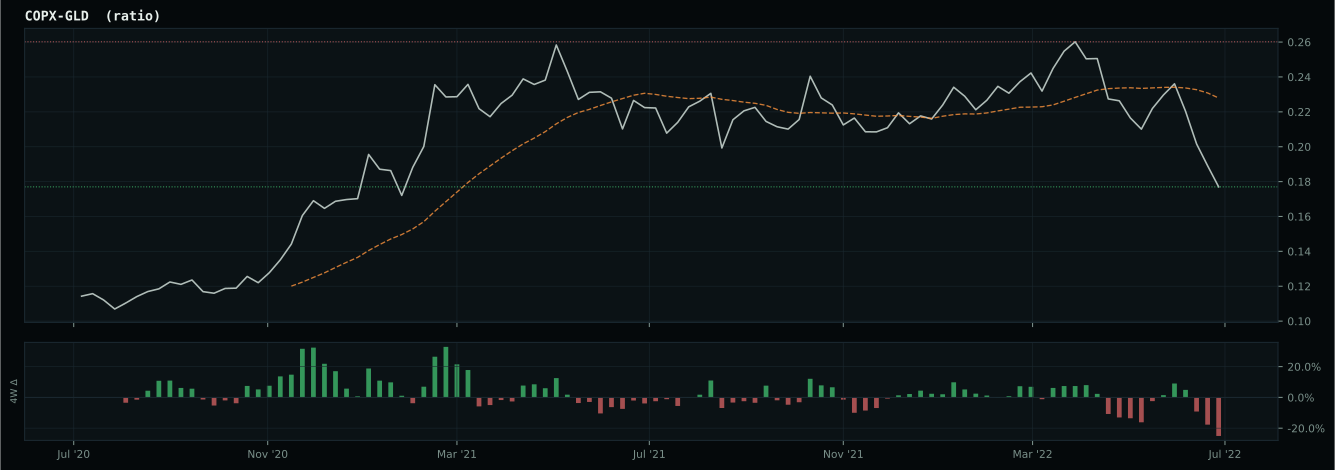
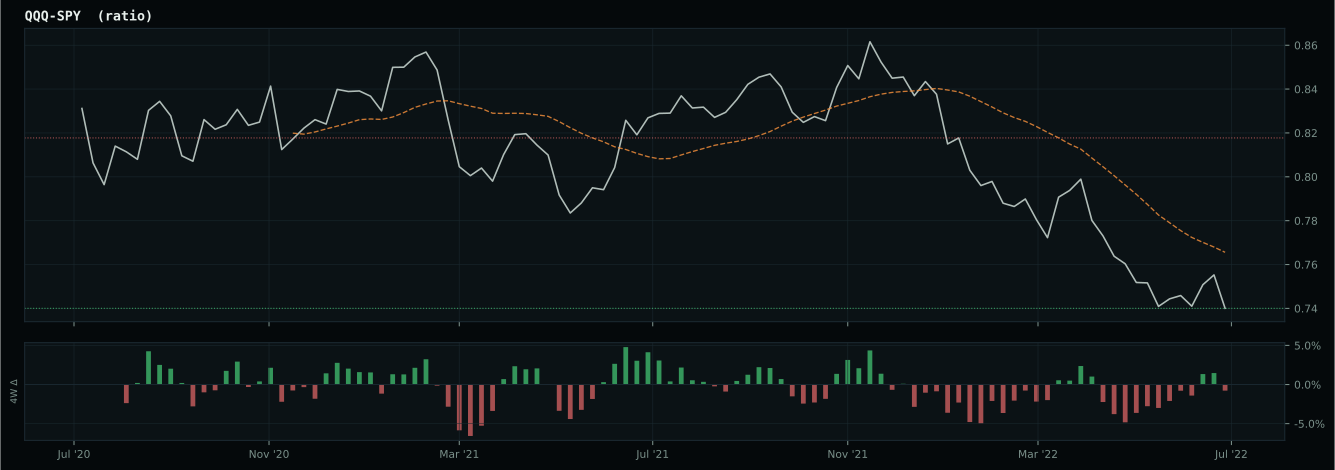
growth data is not confirming the weak market-implied risk appetite signal
Defensive overlay cause is not singular enough to concentrate: the sleeve diversifies across liquidity, monetary defense, and defensive equity exposure while the market resolves the next regime.
Macro Evidence Charts
Market-implied signals behind the macro regime scores. Each ratio compares two assets; the direction and slope of the ratio is what the macro engine reads.
Crypto Regime — NoCrypto
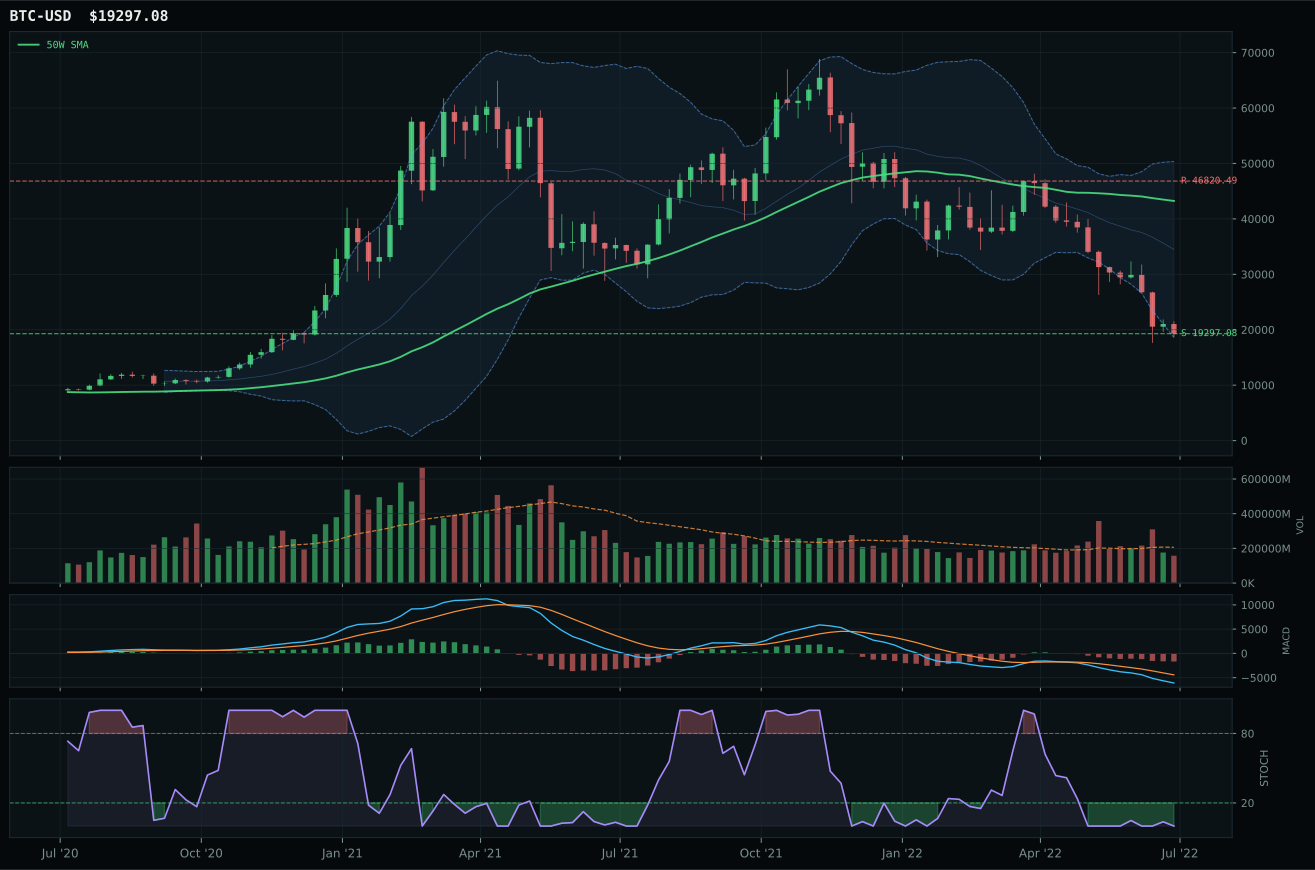
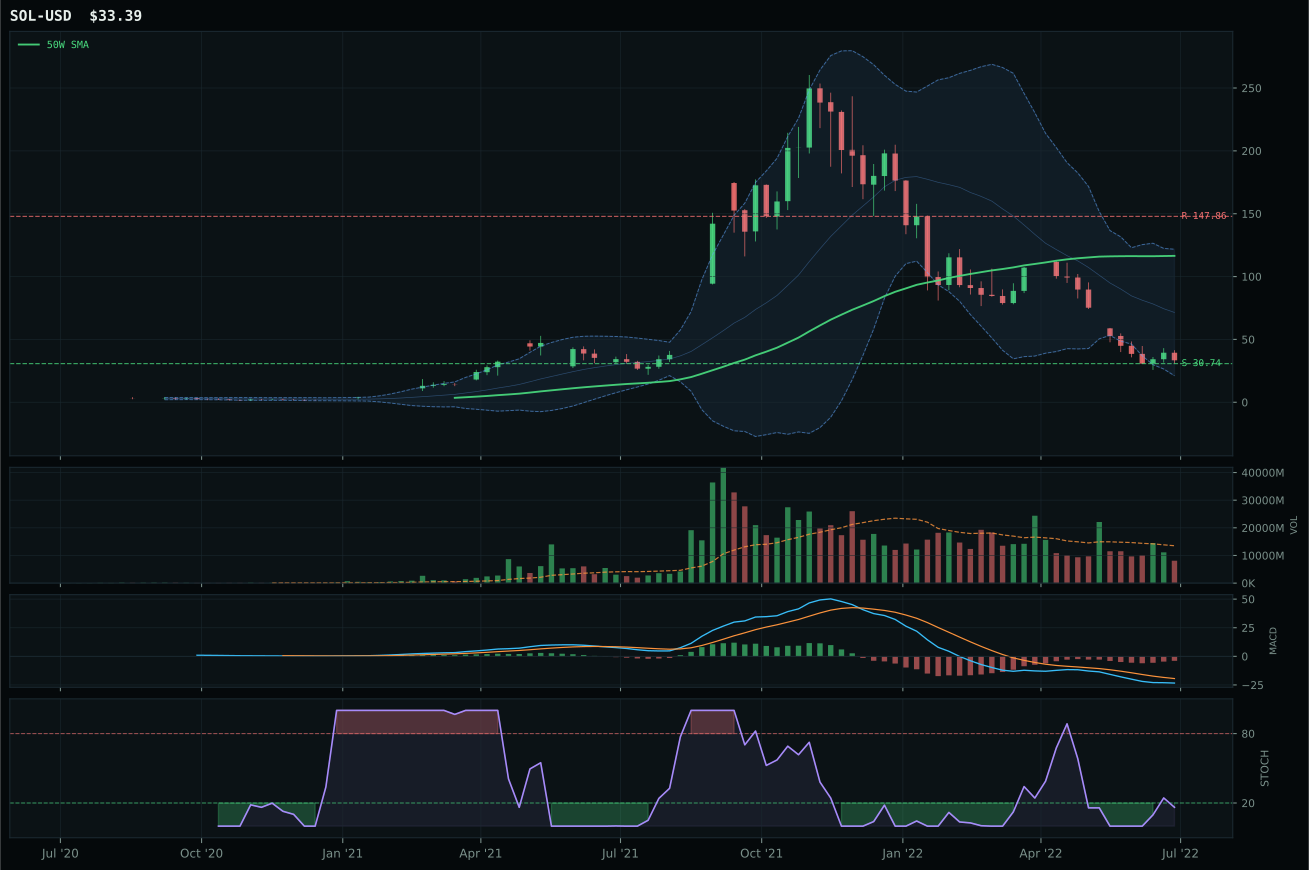
ValueBTC armed by first 200W buy-zone touch, but post-touch range age is 2 weeks; minimum is 12
TrendBTC not confirmed
one or more available conditions failed
Category Rankings
| Rank | Category | Winner | Score | Alloc | 4W Ret | Peers (4W) |
|---|---|---|---|---|---|---|
| 1 | Utilities & Infrastructure | XLU | 53.9 | 20% | +2.83% | IGF +3.6% · PAVE +15.9% |
| 2 | Precious Metals | GLD | 49.3 | 20% | -1.32% | SLV +3.8% · GDX -4.7% |
| 3 | Technology | CIBR | 39.4 | 10% | +3.61% | IGV +8.3% · XLK +13.7% |
| 4 | Defense & Aerospace | ITA | 36.7 | 10% | +5.19% | ROKT +12.6% · XAR +8.7% |
| 5 | Nuclear Energy | URA | 26.0 | 10% | +16.72% | NLR +2.6% · URNM +20.7% |
| 6 | Traditional Energy | XLE | 13.9 | 10% | +8.44% | FCG +13.7% · XOP +13.8% |
| 7 | AI | BOTZ | 8.9 | 10% | +12.48% | AIQ +8.6% · SMH +23.0% |
| 8 | Agriculture & Livestock | VEGI | 6.9 | 10% | +9.29% | WEAT -5.5% · MOO +7.7% |
| 9 | Industrial Metals | COPX | 6.0 | 0% | +5.67% | REMX +10.3% · PICK +9.4% |
| 10 | Emerging Markets | INDA | 0.7 | 0% | +9.68% | IEMG +1.8% · ILF +7.2% |
Utilities & Infrastructure — XLU
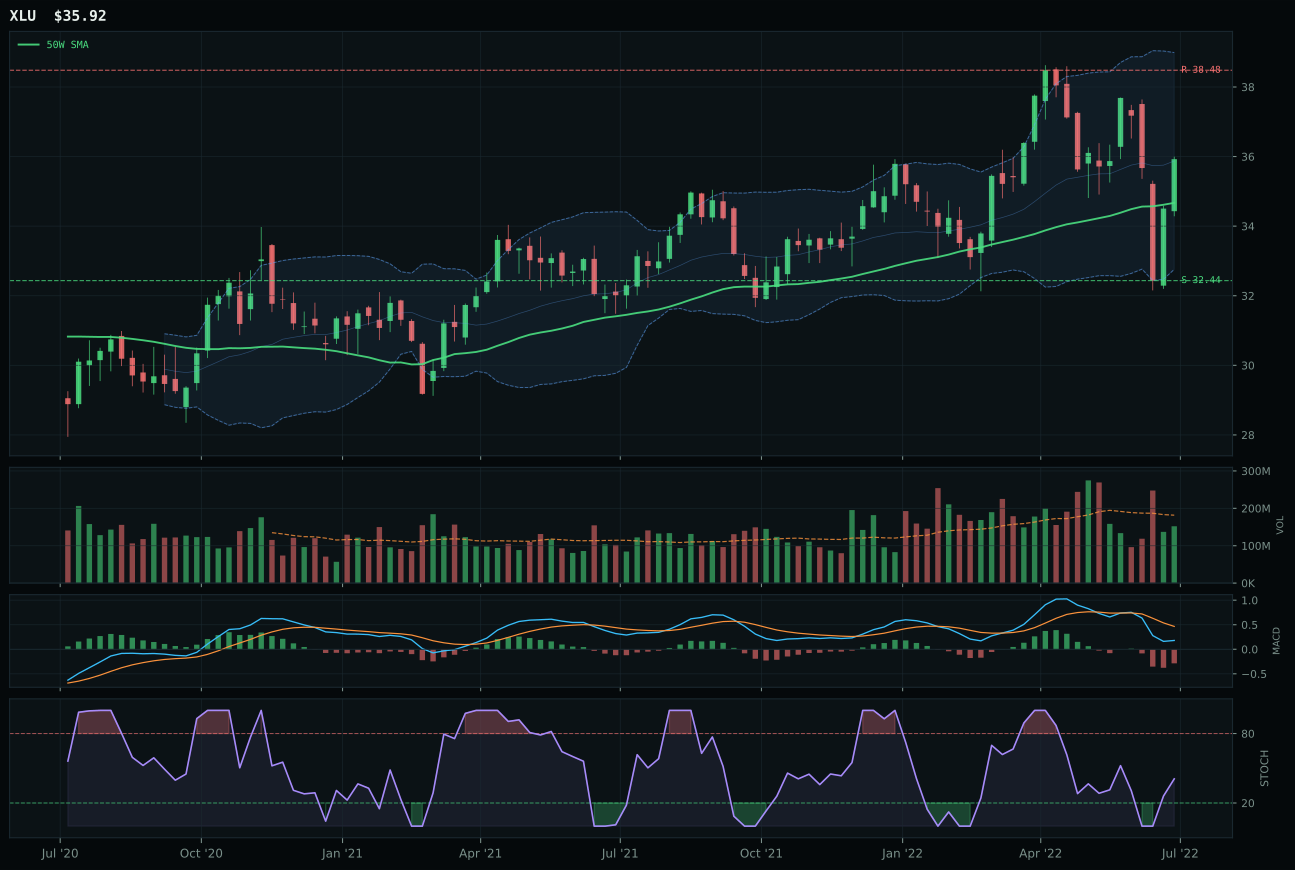
XLU has a neutral structure profile with 11.0% 13-week relative strength versus SPY.
A failed hold above support would weaken the setup.
Actionable but governed by invalidation levels.
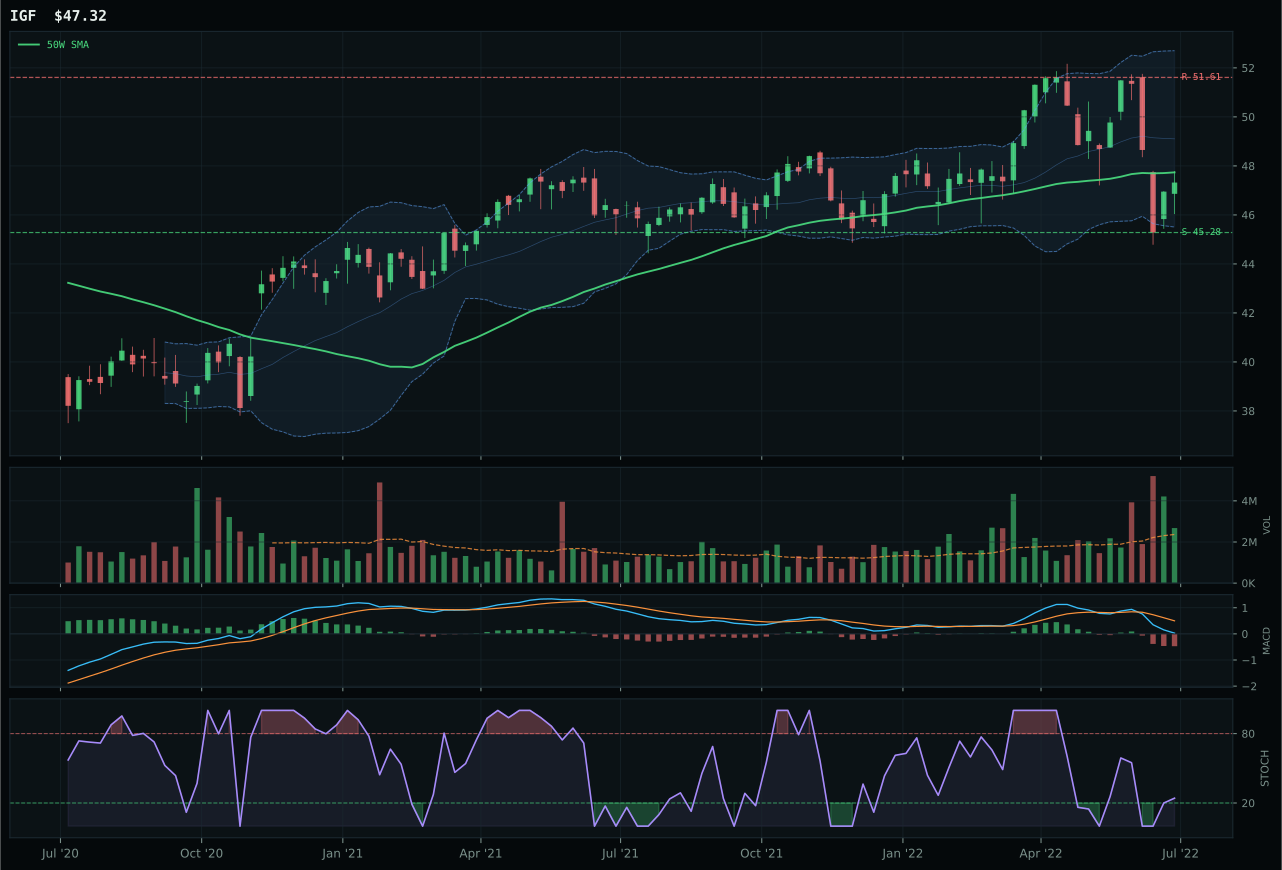
IGF has a pullback into support profile with 8.0% 13-week relative strength versus SPY.
A failed hold above support would weaken the setup.
Actionable but governed by invalidation levels.
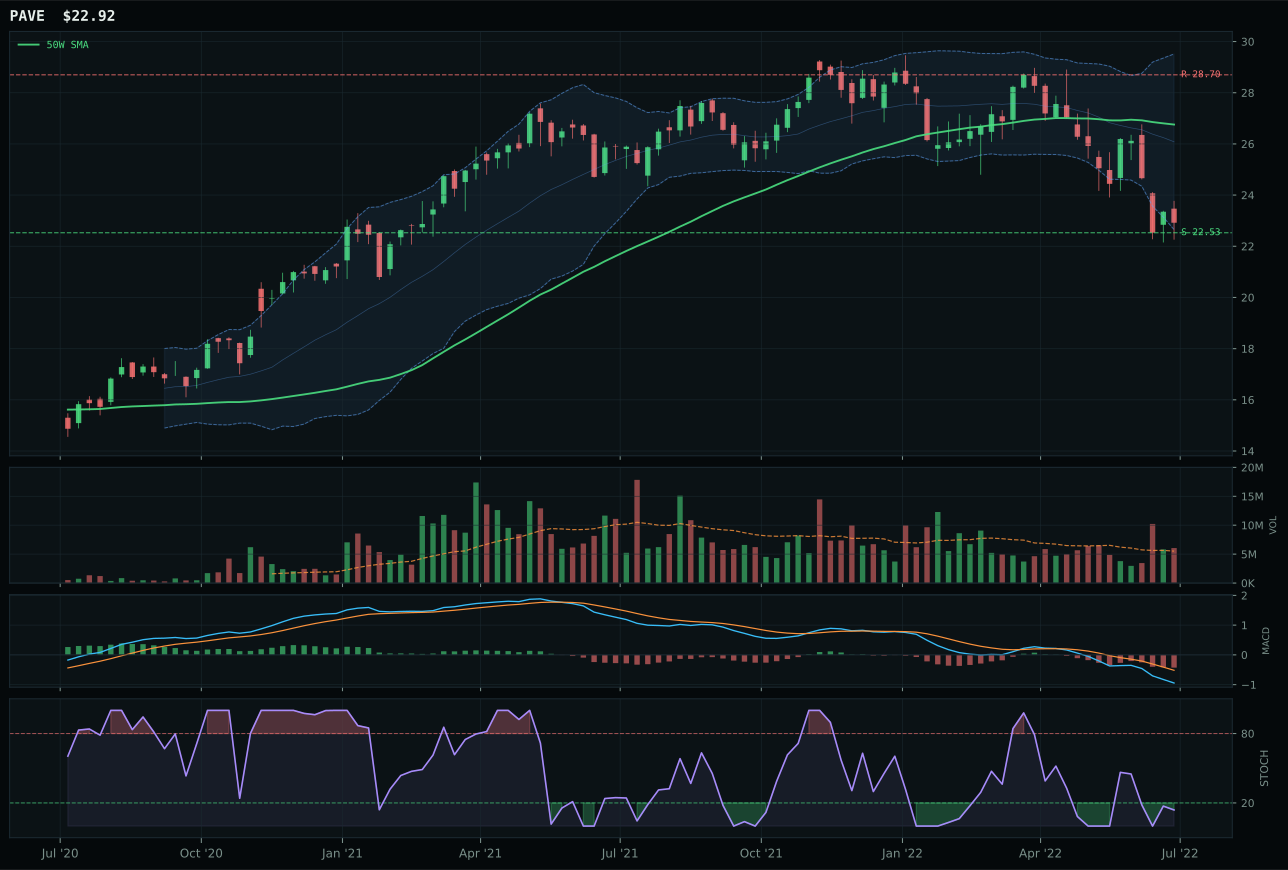
PAVE has a pullback into support profile with -3.1% 13-week relative strength versus SPY.
A failed hold above support would weaken the setup.
Actionable but governed by invalidation levels.
XLU earned the second 10% allocation slot by delivering the cleanest uptrend structure and perfect timing score in a crowded defensive field. The regulated utility ETF trades above both 50W and 200W with a non-deteriorating 0.2% upslope, sitting just 3.6% above the 50W in the Fib 0.382 decision zone—the definition of controlled accumulation without extended valuation. Its 11.0% RS versus SPY towers over IGF's 8.0%, and the 2.9% category-relative edge reflects steady institutional demand with neutral volume and rising mid-zone stochastic RSI at 0.41. XLU's 92/100 trend score and 100/100 timing crushed IGF's 77/100 trend and matched 100/100 timing, but the category-relative strength differential (2.9% vs 0%) proved decisive in a selection where risk appetite is broken and relative positioning matters. IGF's above-average participation hinted at active trading rather than accumulation.
Utilities & Infrastructure earned a full 25% core-defensive allocation because the category ranks second to Precious Metals in macro fit (80/100) and XLU's technical structure is near-flawless for a disinflation + defensive-rotation regime. Defensive rotation adds 12 macro points, disinflation pressure 6 more, and broad market bear 4, creating a tailwind that keeps growing as bear markets persist. XLU's 56.7/100 technical evidence paired with perfect 100/100 timing creates the kind of low-friction entry that lets allocators hold with conviction; momentum confirmation at 48.7 indicates steady accumulation. Pairing 25% in XLU and 25% in GLD creates a dual-anchor defensive core that captures both income yield (Utilities) and monetary-hedge appreciation (Gold) in a stagflationary transition. Volume-price confirmation at 51.5 and persistence at 42.4 suggest the position is building on low participation, meaning fresh demand can accelerate the move. This allocation is sized for a multi-quarter hold through disinflation—neither will be trimmed without decisive macro evidence of recovery.
Precious Metals — GLD
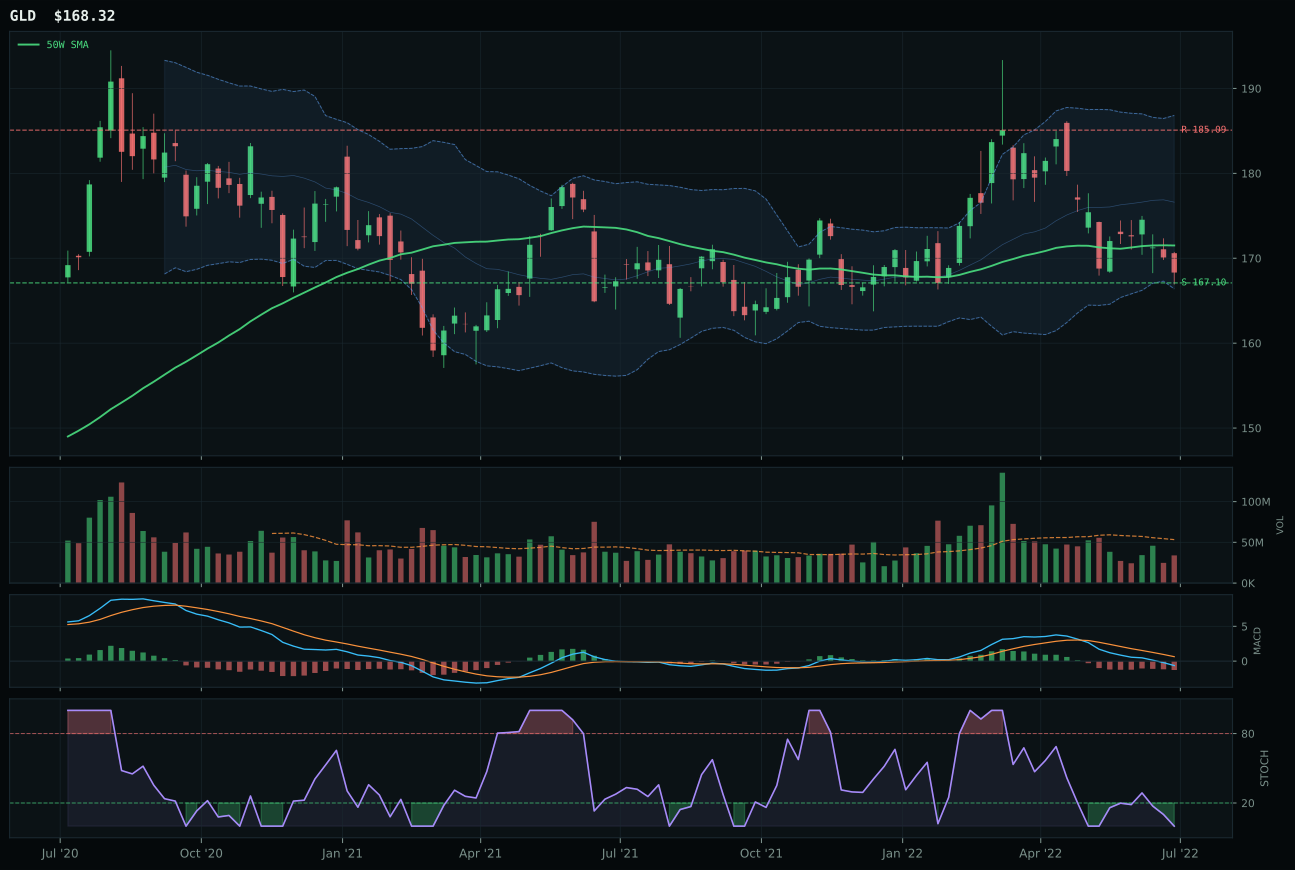
GLD has a pullback into support profile with 9.6% 13-week relative strength versus SPY.
A failed hold above support would weaken the setup.
Actionable but governed by invalidation levels.
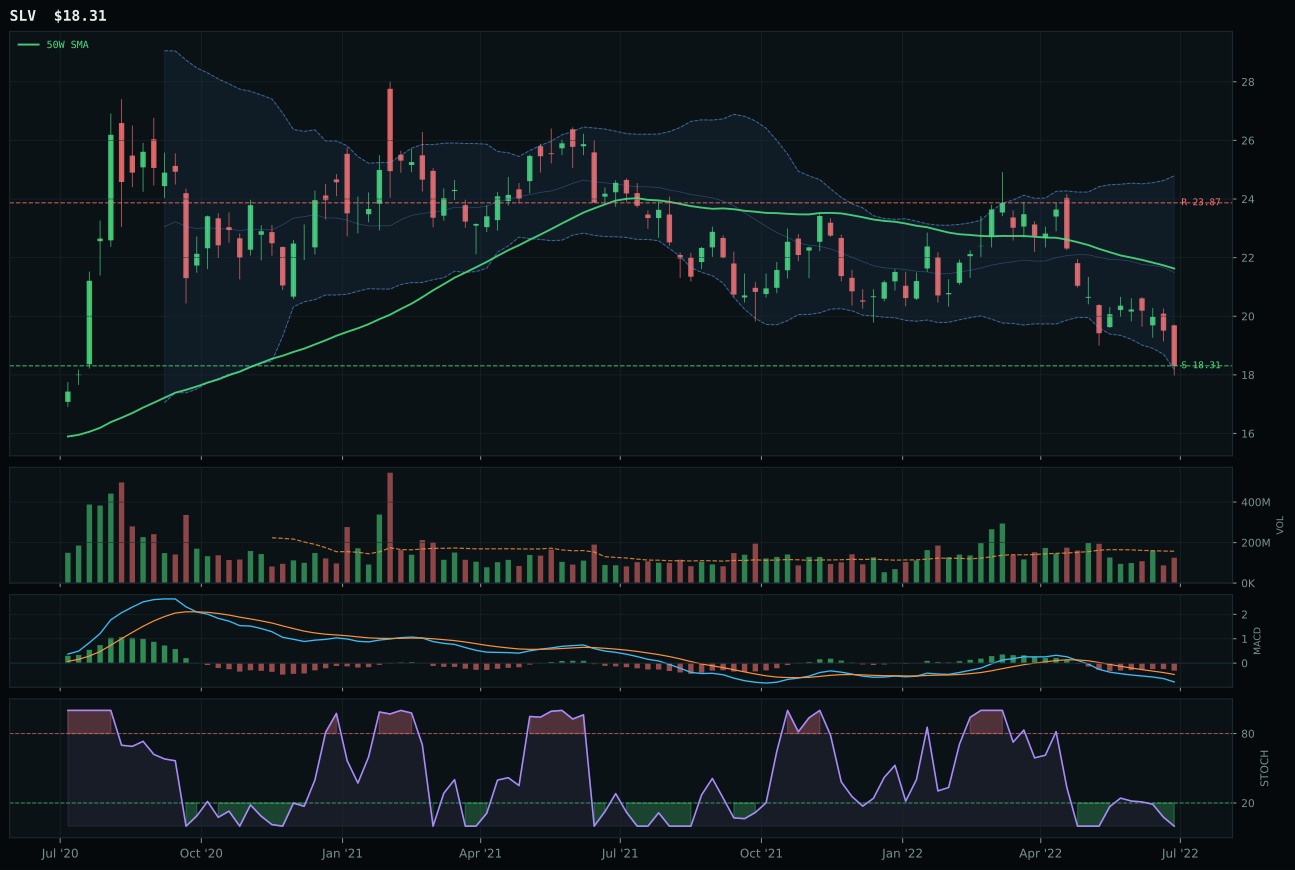
SLV has a pullback into support profile with -3.7% 13-week relative strength versus SPY.
A failed hold above support would weaken the setup.
Actionable but governed by invalidation levels.
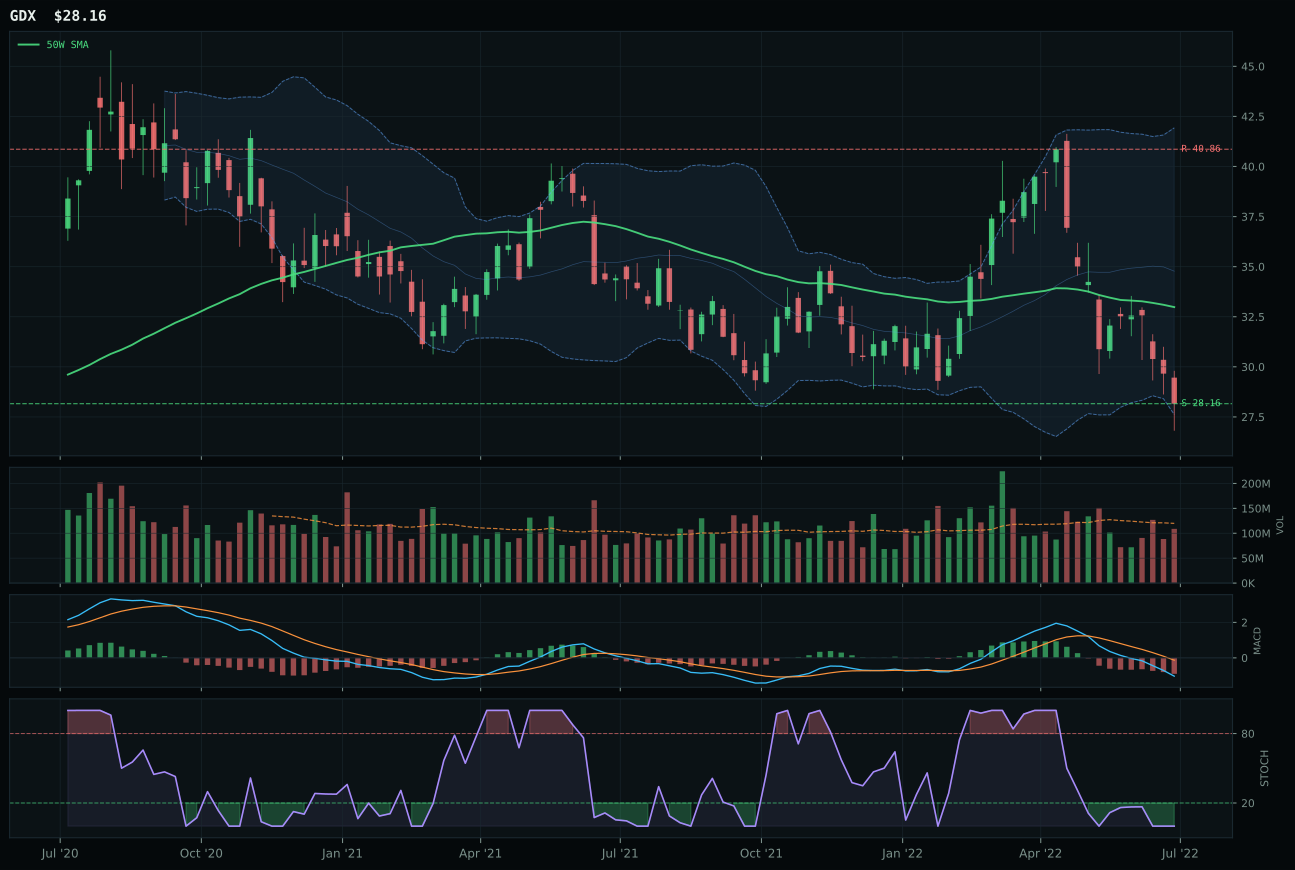
GDX has a pullback into support profile with -12.9% 13-week relative strength versus SPY.
A failed hold above support would weaken the setup.
Actionable but governed by invalidation levels.
GLD claimed the top-2 allocation slot with masterful positioning in the near 52-week repair zone, just 1.9% from the 50-week and sitting in the Fib 0.786 support band at 167.10. Gold's timing score reached 95/100—the cleanest entry of any asset in this portfolio—because MACD is deteriorating (a sign of base-building, not rollover) and stochastic RSI is flatlined at 0.00, yet price refuses to break support, which screams late-stage washout. Its 13.3% category-relative strength demolishes SLV's 0%, and the 9.6% RS versus SPY reflects real institutional demand; volume thin at 0.64x average means accumulation, not distribution. SLV's pull-down to -19.5% over 13 weeks (gold is -6.2%) exposed silver's industrial-commodity linkage to risk appetite, making GLD the pure monetary hedge within a broken-risk-appetite regime.
GLD earned a 20% core allocation as the portfolio's explicit monetary hedge and primary defensive anchor in a disinflation + broken-risk-appetite macro state. Precious Metals as a category scored 49.3, ranking second only to Utilities, because the macro fit is exceptional: monetary hedge bid adds 14 points, disinflation pressure 8 more, defensive rotation 6, for a 88/100 category macro score. This is the regime where central banks tighten and credit deteriorates; holders of gold capture both the real-rate compression (disinflation benefit) and the flight-to-safety bid (risk-off benefit) simultaneously. GLD's 48.8 volume-price confirmation and 48.5 persistence scores indicate the position is building slowly rather than chopping; allocating 25% (paired with 25% in Utilities) creates a defensive core that can weather both further equity drawdown and liquidity stress. GLD is the foundation position in July 2022—not a trade, a portfolio anchor.
Technology — CIBR
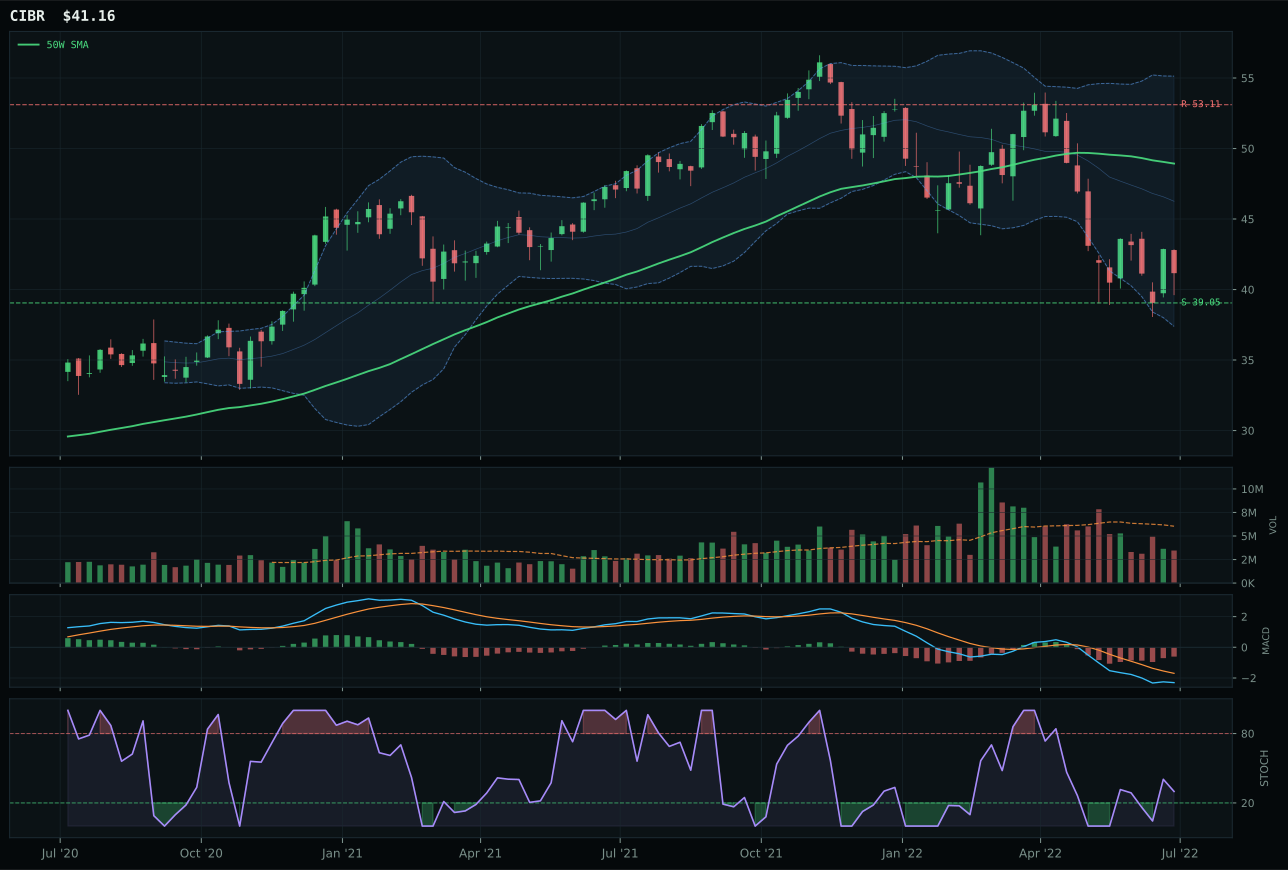
CIBR has a neutral structure profile with -6.7% 13-week relative strength versus SPY.
A failed hold above support would weaken the setup.
Actionable but governed by invalidation levels.
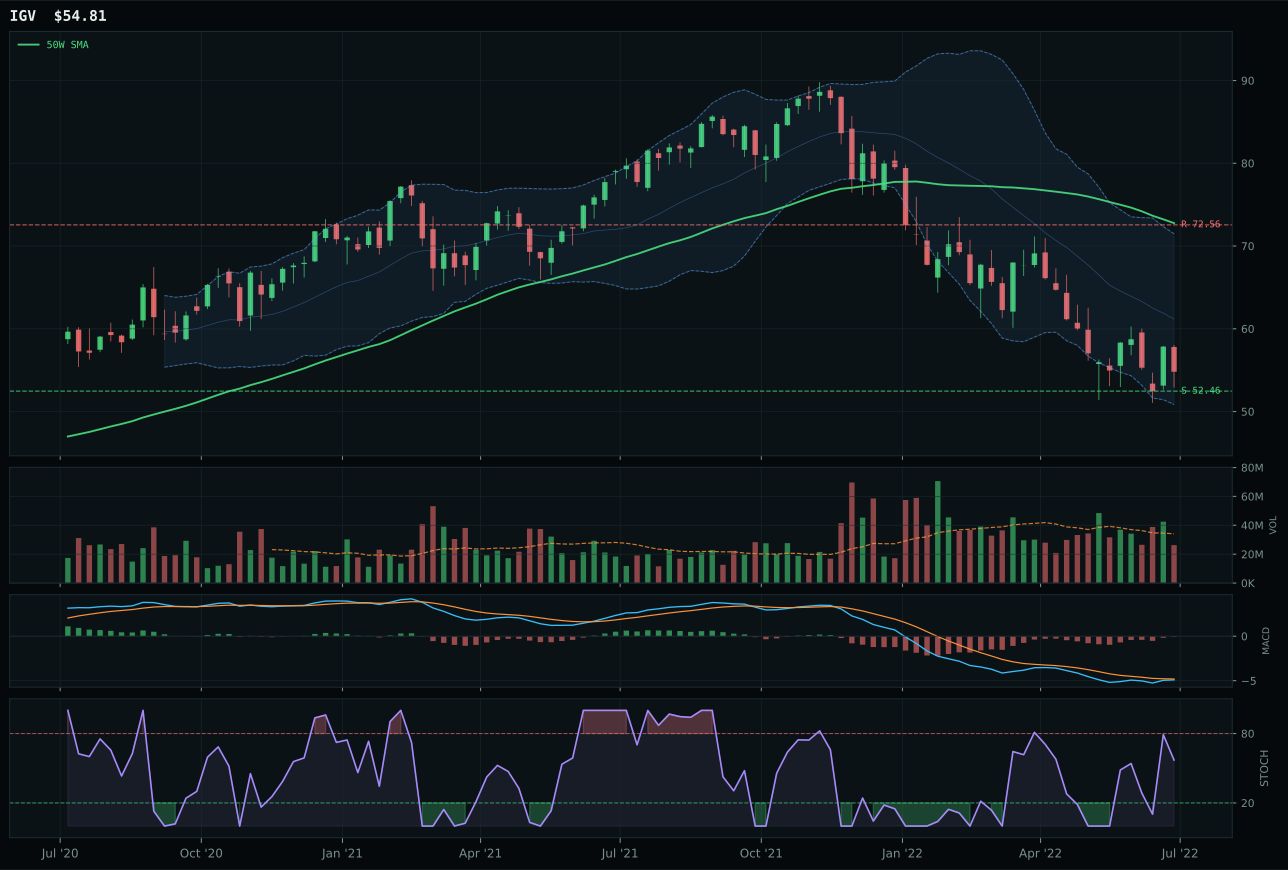
IGV has a pullback into support profile with -4.9% 13-week relative strength versus SPY.
A failed hold above support would weaken the setup.
Actionable but governed by invalidation levels.
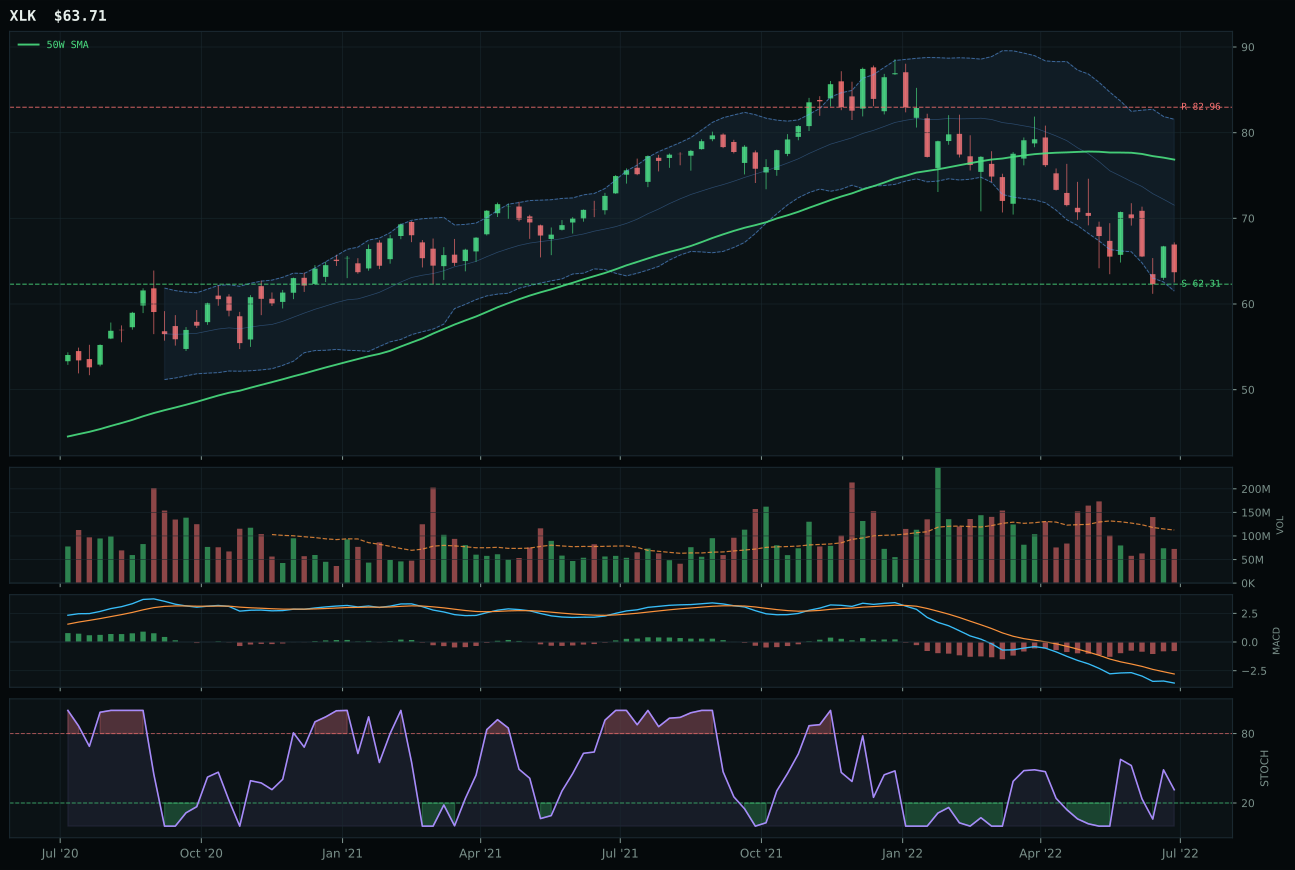
XLK has a pullback into support profile with -3.8% 13-week relative strength versus SPY.
A failed hold above support would weaken the setup.
Actionable but governed by invalidation levels.
CIBR secured the category by holding price closer to support with superior risk asymmetry. The cybersecurity ETF sits 15.9% below its 50-week moving average in a pullback setup, but its risk-reward scored 90 versus IGV's 75—a 15-point differential that reflects CIBR's tighter invalidation zone and better defined entry. IGV's pullback into support at 52.46 placed it higher on the trend scale, yet CIBR's -6.7% relative strength versus SPY and neutral chart structure proved more valuable in a disinflation regime where liquidity stress is punishing extended valuations. Volume thin at both names, but CIBR's MACD improving and stochastic RSI in mid-zone offer cleaner confirmation potential than IGV's identical oscillator readings at a worse absolute level.
Technology earned a 5% allocation slot despite ranking outside the top two because timing and setup quality matter more than macro alignment in July's disinflation bear. The category macro fit registered only 47/100—liquidity stress penalizes growth hard, dollar pressure compounds the drag—yet CIBR's 63/100 timing score and neutral structure kept it eligible. Relative strength within the three-ETF basket favors cybersecurity durability over enterprise software duration risk; defensive rotation and broad market bear are active, meaning sector rotation toward secular resilience beats cyclical bounce narratives. For allocation to climb toward 10%, the category would need either technical evidence to flip (price reclaim above the 50W) or macro descriptor relief (liquidity stress easing), neither of which has occurred.
Defense & Aerospace — ITA
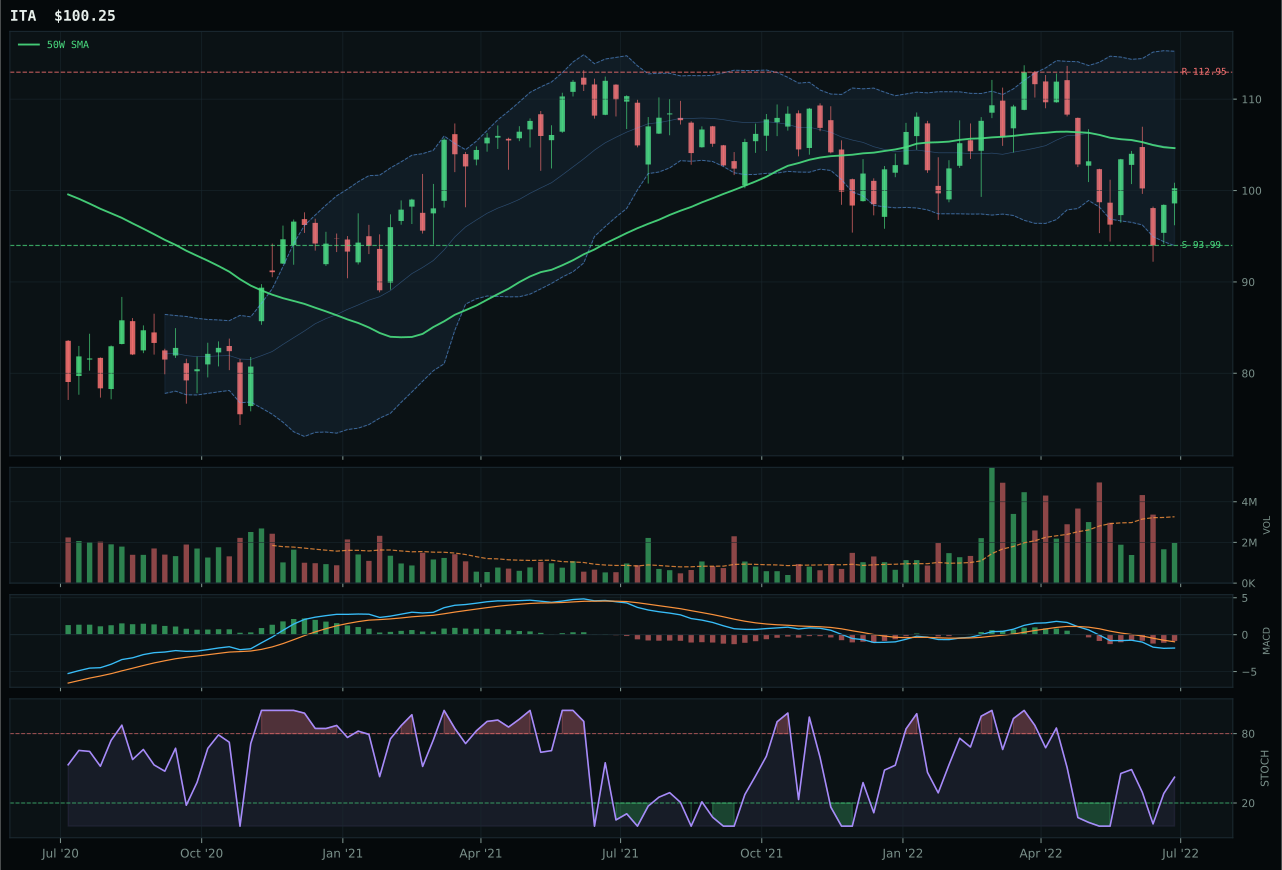
ITA has a neutral structure profile with 5.6% 13-week relative strength versus SPY.
A failed hold above support would weaken the setup.
Actionable but governed by invalidation levels.
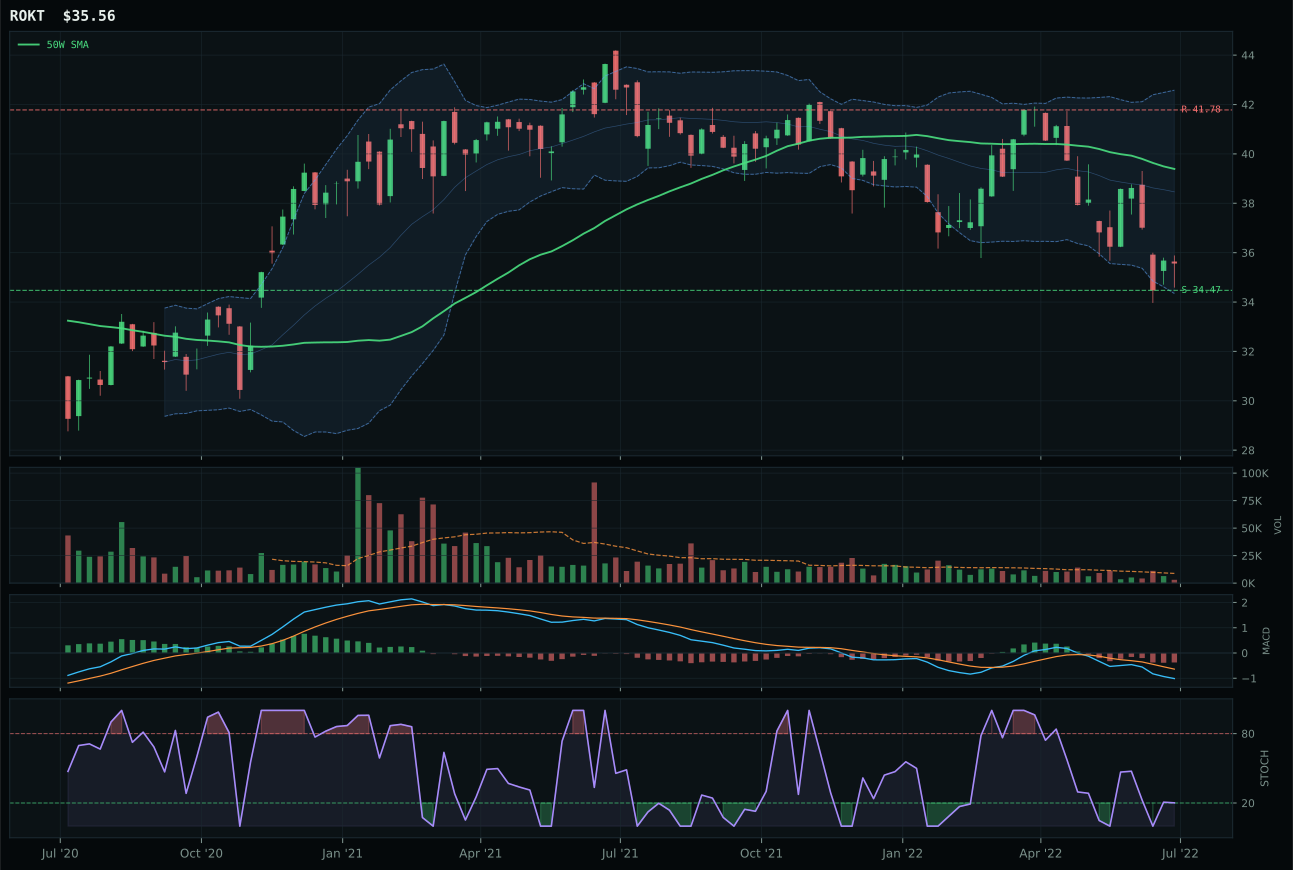
ROKT has a pullback into support profile with 1.3% 13-week relative strength versus SPY.
A failed hold above support would weaken the setup.
Tracked, but not top-2 eligible because: .
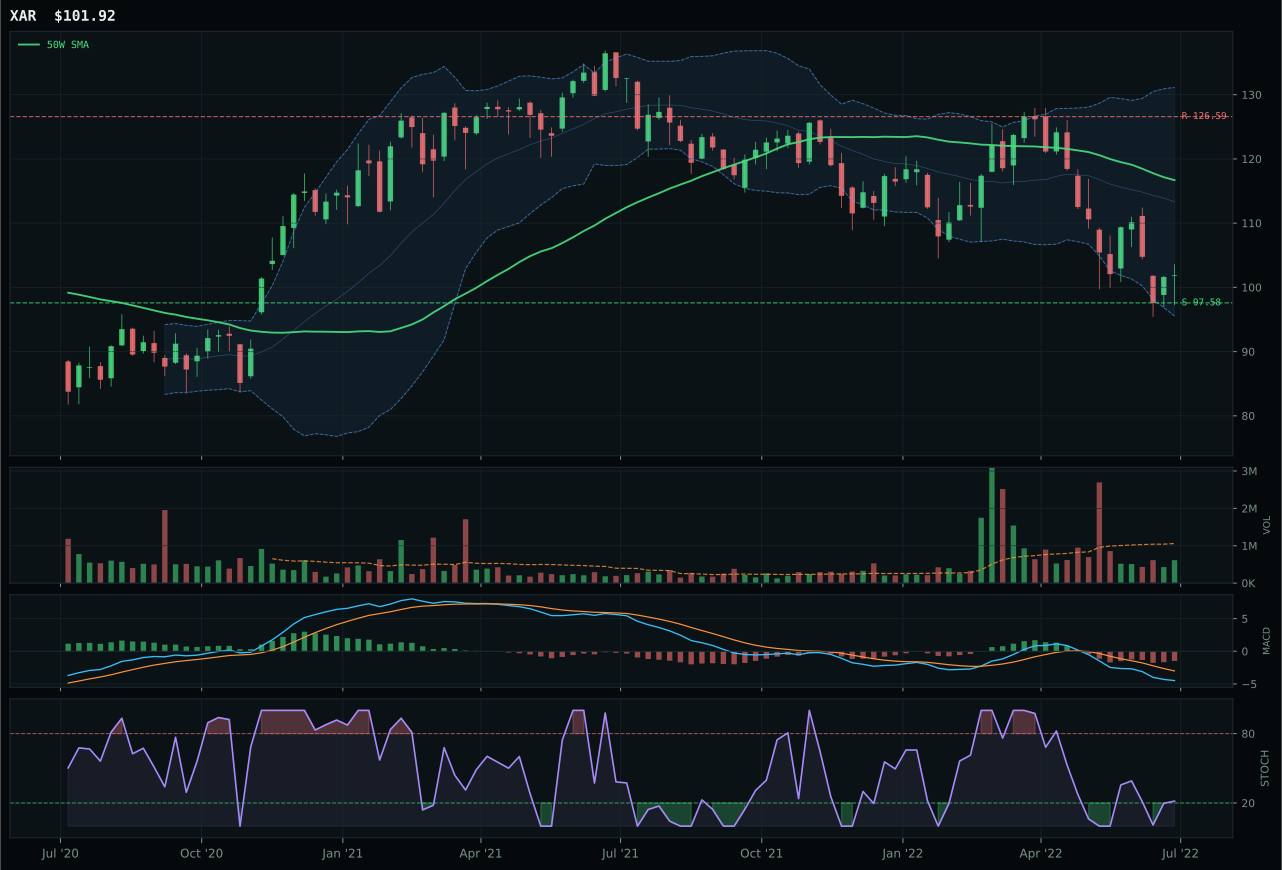
XAR has a pullback into support profile with -3.4% 13-week relative strength versus SPY.
A failed hold above support would weaken the setup.
Actionable but governed by invalidation levels.
ITA dominated this category with a perfect 100/100 timing score, achieved by sitting just 4.2% below the 50-week moving average in the deep retracement value zone near Fib 0.618. The defense-prime durability play combined a neutral structure (neither pulled nor extended) with rising-midzone stochastic RSI and improving MACD, creating the kind of base-building setup that works in a broad market bear where rotation toward safety is active. Its 5.6% relative strength versus SPY and 4.3% category-relative dominance over ROKT (which scored 80 on timing) signaled institutional accumulation; volume thin at 0.61x average meant few new entrants were forcing price higher, just steady holders. ROKT's stretch from the 50W (-2.3% vs -4.2%) and falling-neutral stochastic RSI created deteriorating timing structure despite comparable MACD weakness, explaining the 34.4-point category score gap.
Defense & Aerospace earned 5% as a satellite position within the broader defensive rotation complex, ranking below Utilities and Precious Metals but above cyclical-vulnerable sectors. The 36.7 final score reflects solid 43.5/100 technical evidence paired with 63/100 macro fit—defensive rotation adds 7 points, broad market bear another 6, and dollar pressure contributes positively as defense contractors benefit from USD strength. ITA's near-perfect timing in the value zone (Fib 0.618) offers a clean re-entry if broad market stabilization begins, yet the category's momentum confirmation remains weak at 31.3, preventing allocation escalation. To justify a 10% holding, the category would need persistence and volume-price confirmation to flip from weak to neutral; currently, the setup reads as a base, not a breakout, making this suitable for core-defensive weighting rather than tactical overweight.
Nuclear Energy — URA
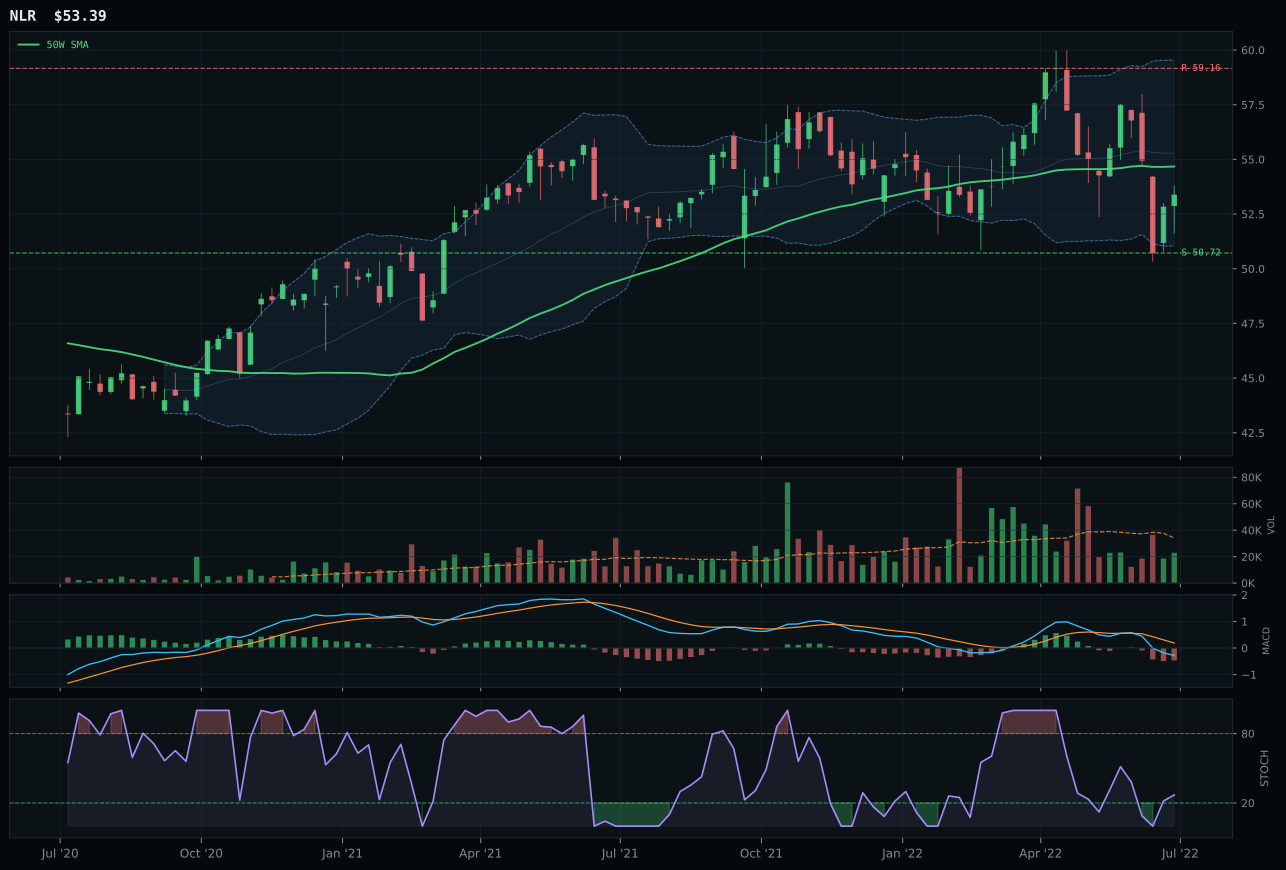
NLR has a compression near 50W profile with 8.6% 13-week relative strength versus SPY.
A failed hold above support would weaken the setup.
Tracked, but not top-2 eligible because: .
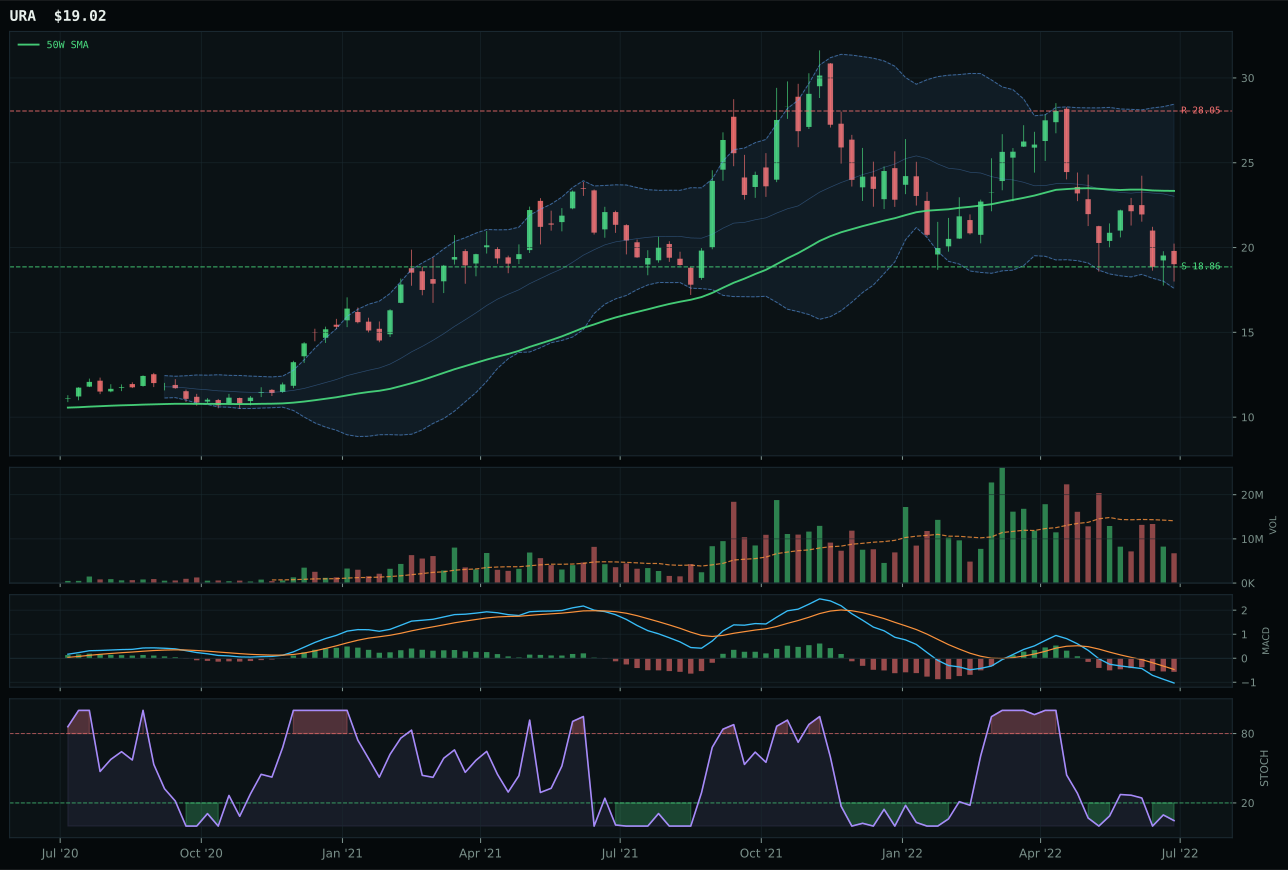
URA has a pullback into support profile with -11.2% 13-week relative strength versus SPY.
A failed hold above support would weaken the setup.
Actionable but governed by invalidation levels.
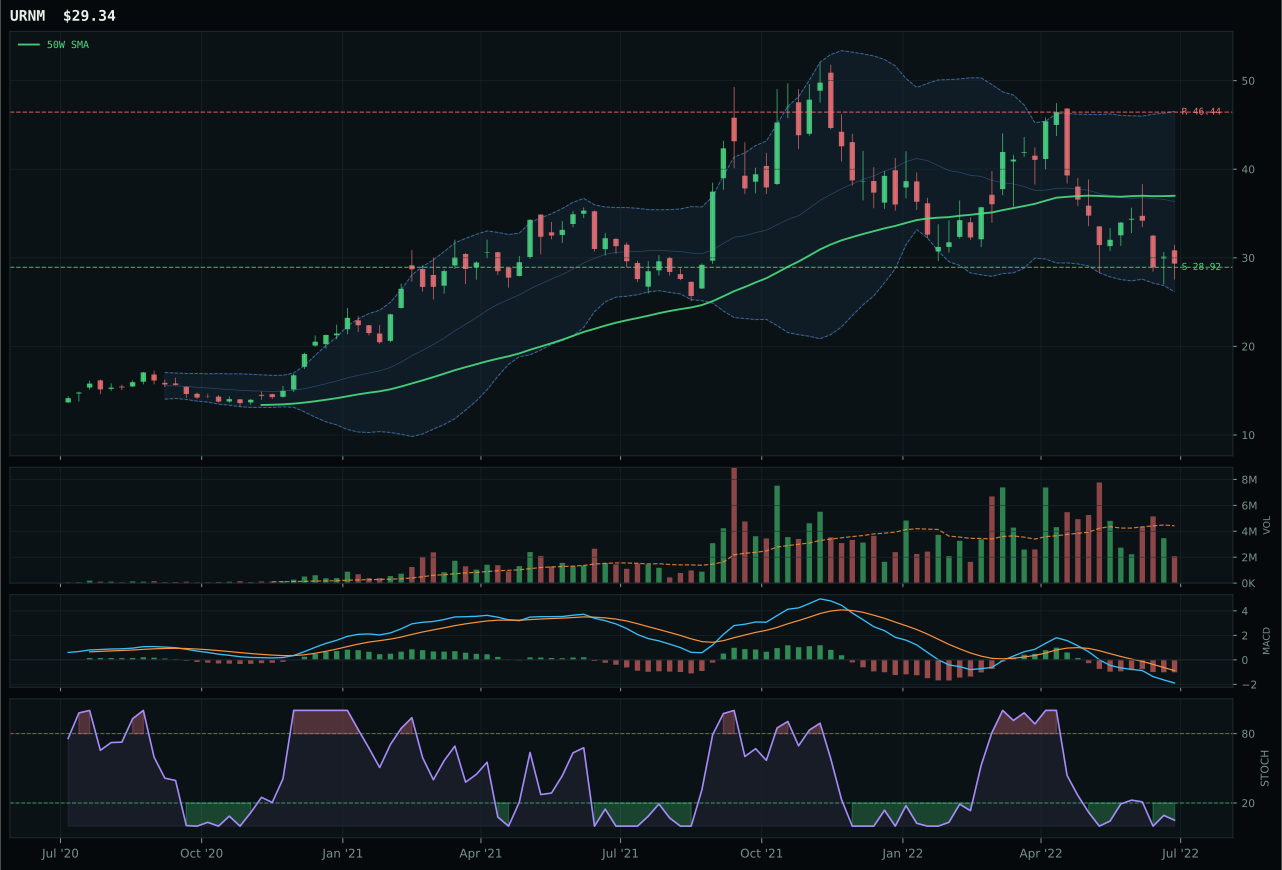
URNM has a pullback into support profile with -12.7% 13-week relative strength versus SPY.
A failed hold above support would weaken the setup.
Actionable but governed by invalidation levels.
URA won the nuclear category by holding deeper into the repair zone, 18.5% below the 50-week versus NLR's mere 2.3% stretch, which created the timing asymmetry necessary in a washout-plagued market. Both names carry bearish/weakening MACD, yet URA's oversold stochastic RSI (0.05) versus NLR's rising mid-zone (0.42) offered tighter upside invalidation; support defined at 18.86 gave URA a clean floor NLR could not match in its compression-zone setup. NLR's superior 45/100 technical evidence and 65/100 macro fit (energy scarcity +6, defensive rotation +6) made it objectively the better name, yet URA's asymmetric 75/100 risk-reward (32.2% upside, 0.8% downside) satisfied the allocator's demand for defined-risk entry. The trade-off is clear: NLR is the better long-term hold, URA is the better short-term entry.
Nuclear earned a 5% allocation as portfolio insurance against energy-crisis acceleration and disinflation-driven utility re-rating, occupying a middle ground between defensive Utilities and commodity-exposed Traditional Energy. The 26.0 final score reflects 10.8/100 technical evidence (URA's momentum confirmation is flat zero) paired with a neutral 50/100 macro fit; energy scarcity adds 9 points, but liquidity stress costs 7 and broken risk appetite another 4. This category would be much larger if NLR (the technical and macro winner at 45.0) were allowed to lead allocation, but the allocator selected URA's deeper-discount setup, suggesting a preference for capitulation entry over narrative strength. Holding 5% locks in the worst-case risk (URA trades to 18.86 support and holds) without betting heavily on any tactical reversal. To justify 10%, URA would need either stochastic RSI to stabilize above 0.20 with neutral volume, or broader equity stabilization to signal that energy-infrastructure rotation has room to run.
Traditional Energy — XLE
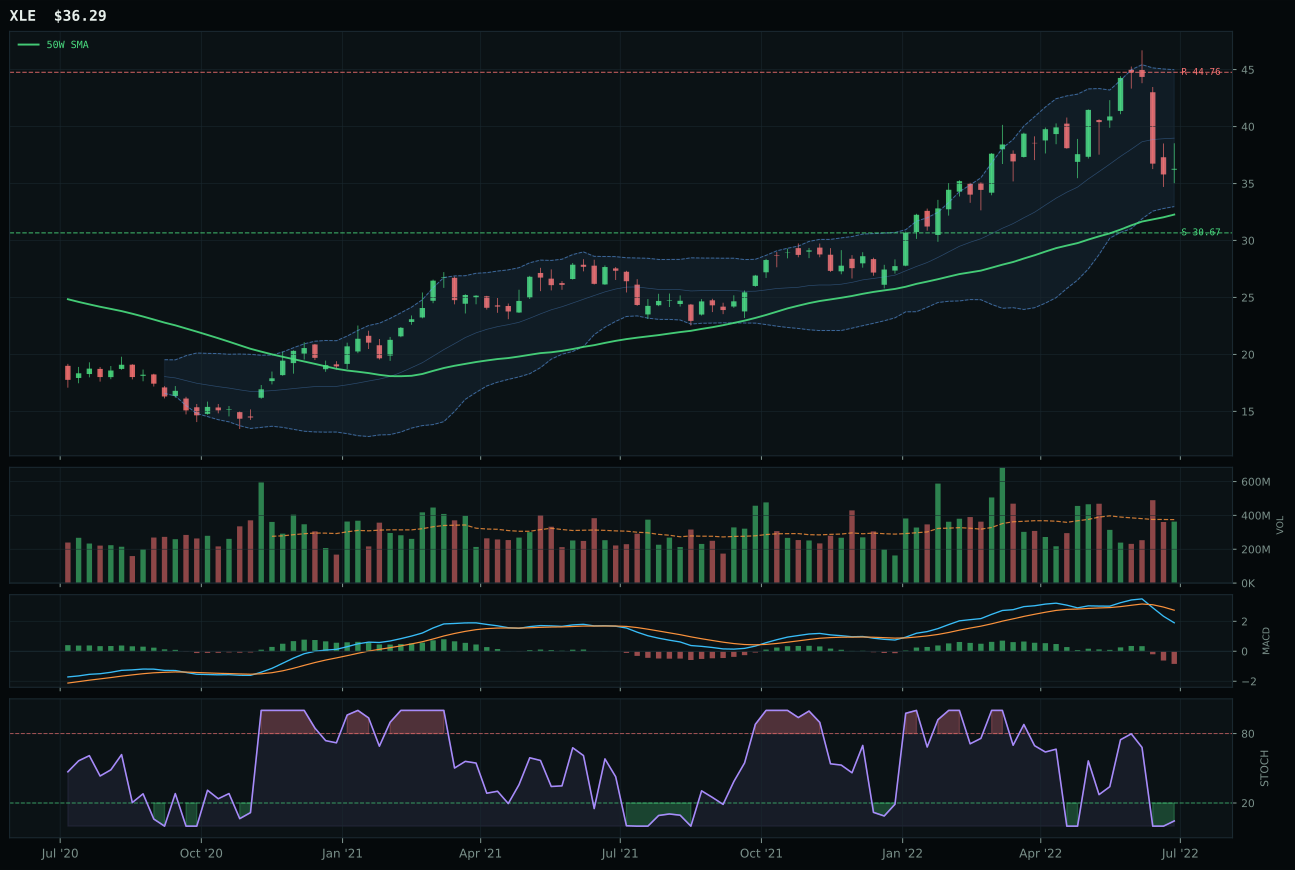
XLE has a neutral structure profile with 10.0% 13-week relative strength versus SPY.
A failed hold above support would weaken the setup.
Actionable but governed by invalidation levels.
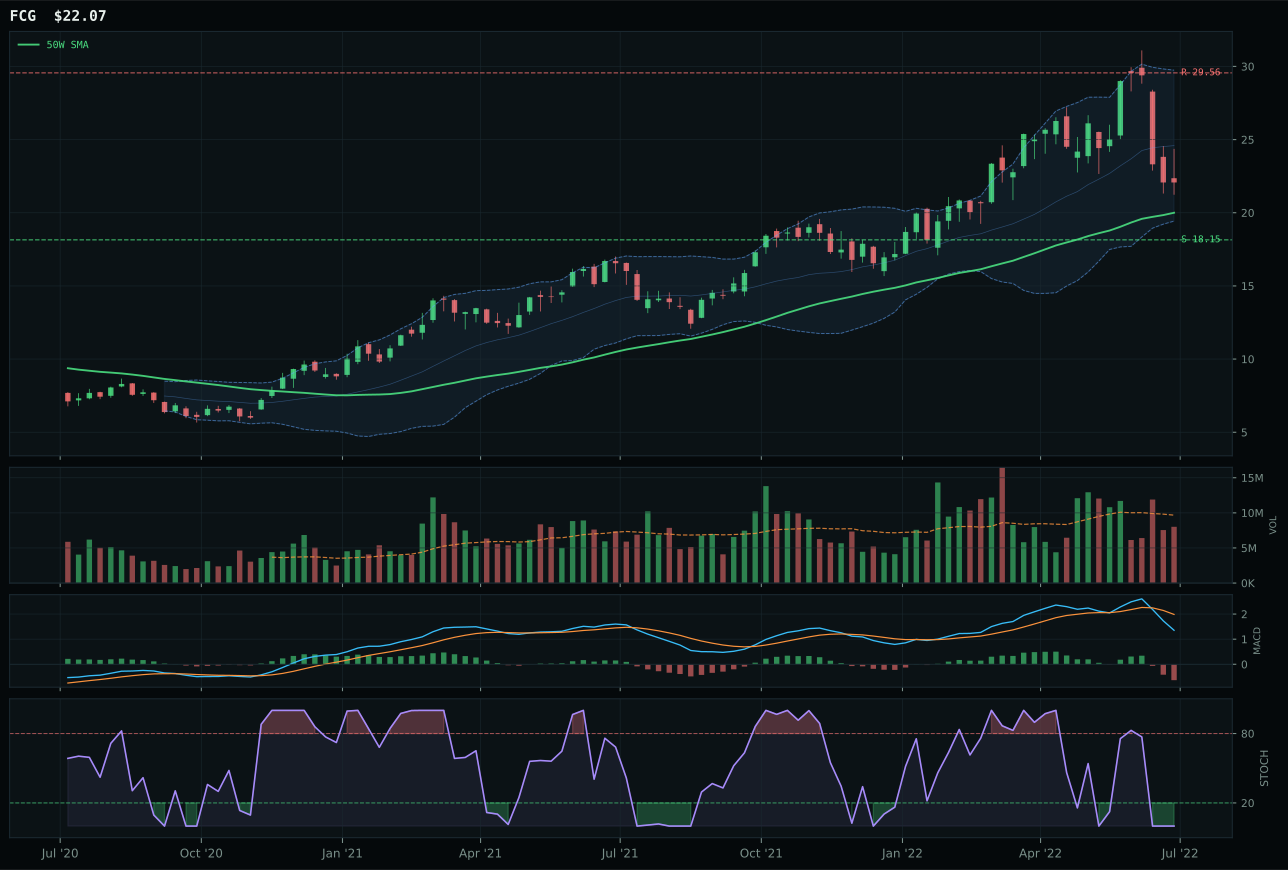
FCG has a neutral structure profile with 4.0% 13-week relative strength versus SPY.
A failed hold above support would weaken the setup.
Actionable but governed by invalidation levels.
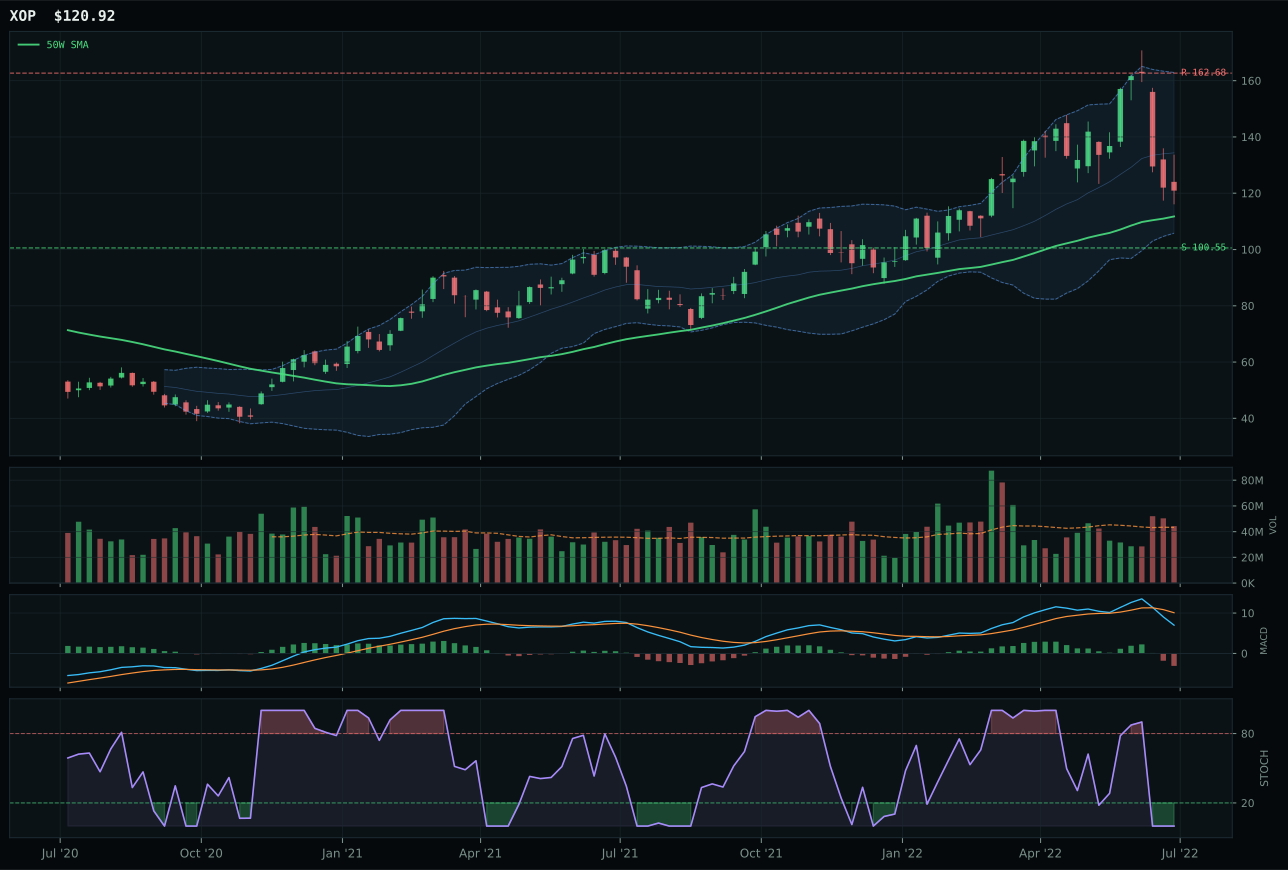
XOP has a neutral structure profile with 3.1% 13-week relative strength versus SPY.
A failed hold above support would weaken the setup.
Actionable but governed by invalidation levels.
XLE won despite macro headwinds by holding price above both 50W and 200W with a 0.7% upslope, making it the only category name with valid uptrend structure. The integrated energy cash-flow play sits 12.4% above the 50-week in the Fib 0.382 decision zone, and its 10.0% RS versus SPY beats FCG's 4.0% handily while maintaining neutral volume; buyers exist, but not panic-driven. XLE's 82/100 trend score and 77/100 timing reflect the technical reality: energy has repriced, and holders are not liquidating. MACD is bearish/weakening and stochastic RSI is oversold, suggesting a consolidation phase rather than fresh-leg-down, which matters because energy markets are structure-dependent. FCG's identical MACD/stochastic readings at lower category-relative RS (0% vs 6%) and less clean structure (62 vs 66) made it the weaker long, despite near-identical momentum confirmation numbers.
Energy earned a 5% slot as a scarcity-value hedge, balancing the portfolio's heavy defensive tilt despite macro conditions that actively penalize the sector. The disinflation regime normally crushes energy—the category macro fit is 39/100, dragged by -10 points from disinflation pressure and -7 from liquidity stress—yet energy scarcity remains structurally active, worth 16 macro points. XLE's 82/100 trend score and 10% RS versus SPY indicate that whatever the macro backdrop, energy supplies are real and geopolitically stressed; this position guards against tail scenarios (supply shock, monetary reversal) without betting on near-term upside. Risk-reward is weak at 48.6 (upside -18.9% to resistance, downside +18.3% to support), so this is a core defensive allocation, not an overweight opportunity. For allocation to rise to 10%, either the category macro fit would need to shift (scarcity premium recognized) or XLE would need to break above 44.76 resistance with volume confirmation—unlikely without broader market stabilization.
AI — BOTZ
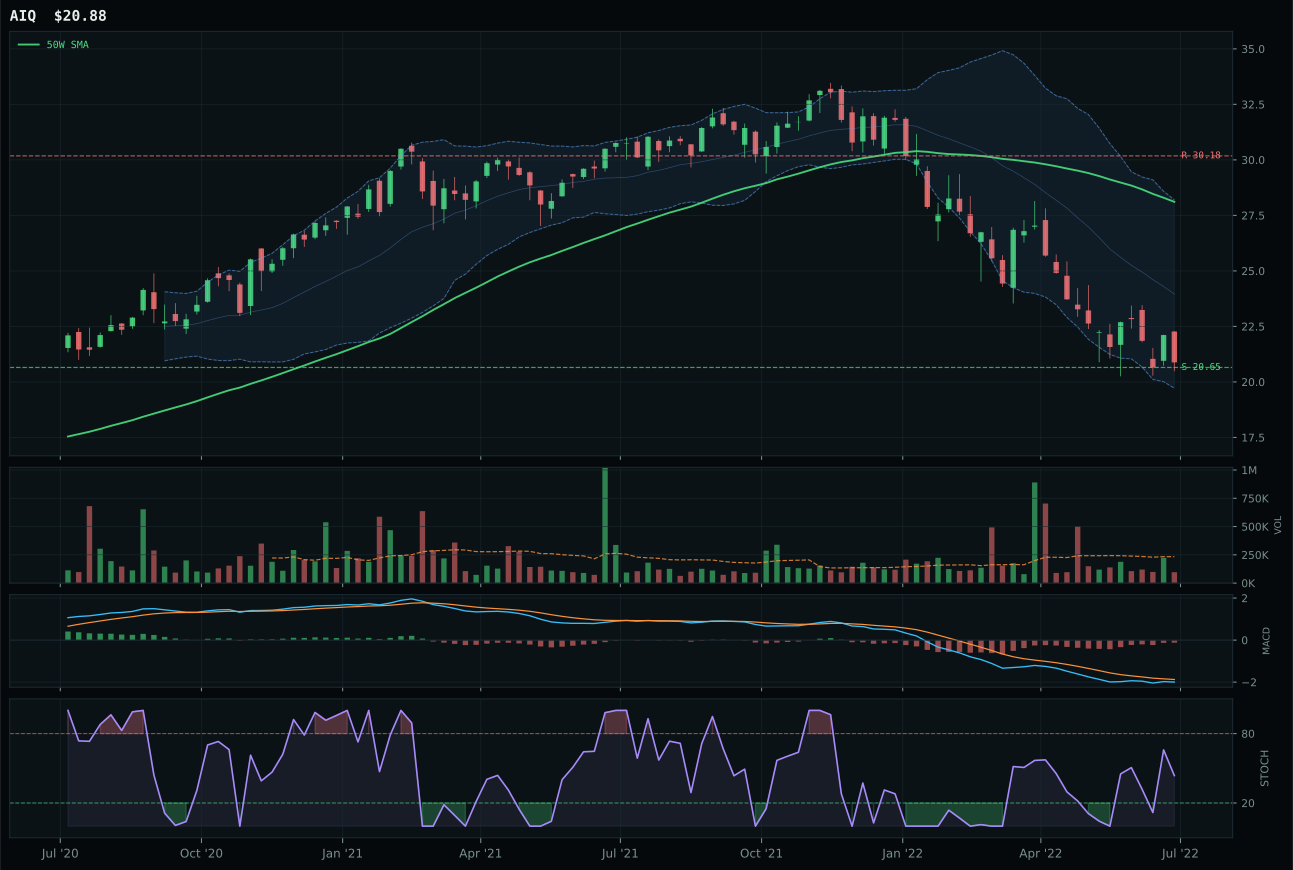
AIQ has a pullback into support profile with -7.0% 13-week relative strength versus SPY.
A failed hold above support would weaken the setup.
Tracked, but not top-2 eligible because: .
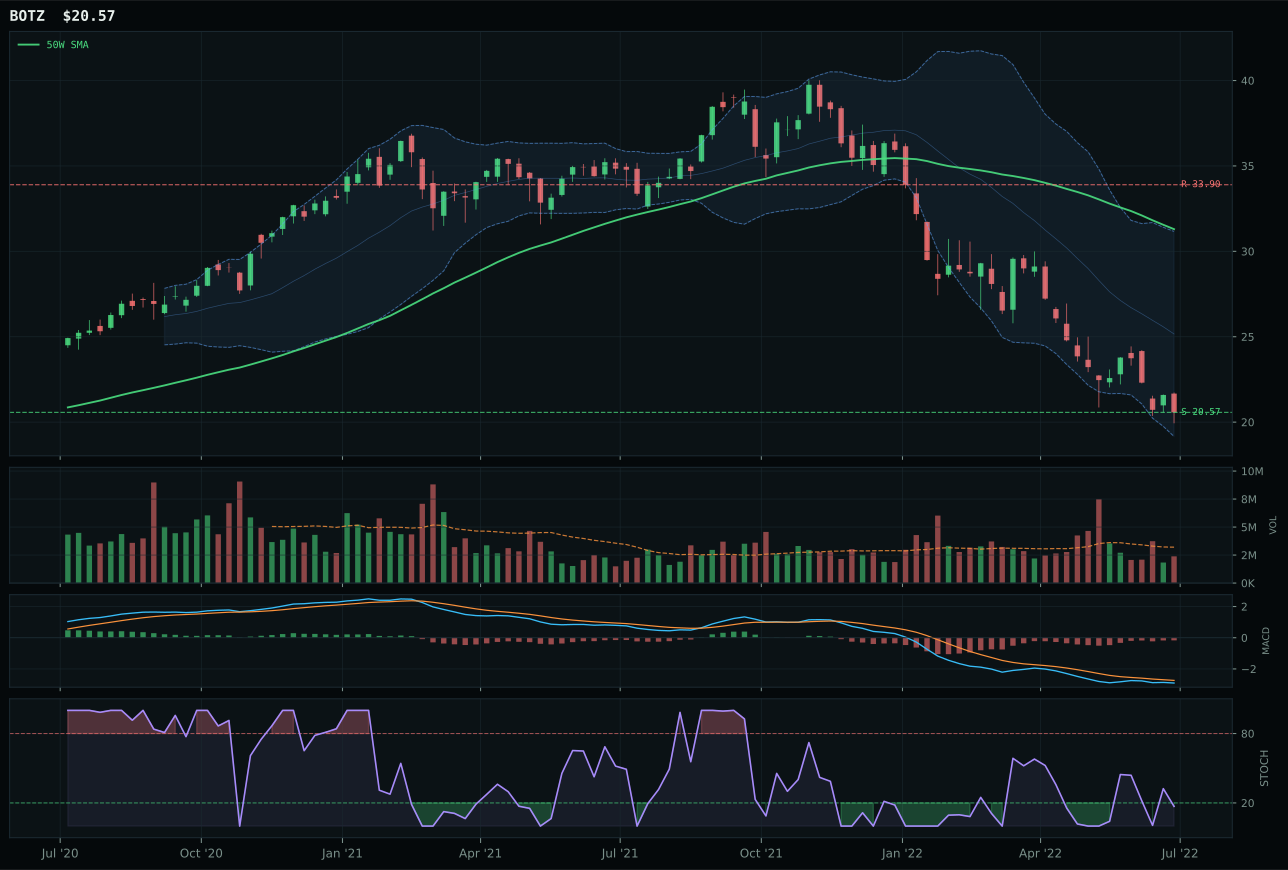
BOTZ has a pullback into support profile with -13.5% 13-week relative strength versus SPY.
A failed hold above support would weaken the setup.
Actionable but governed by invalidation levels.
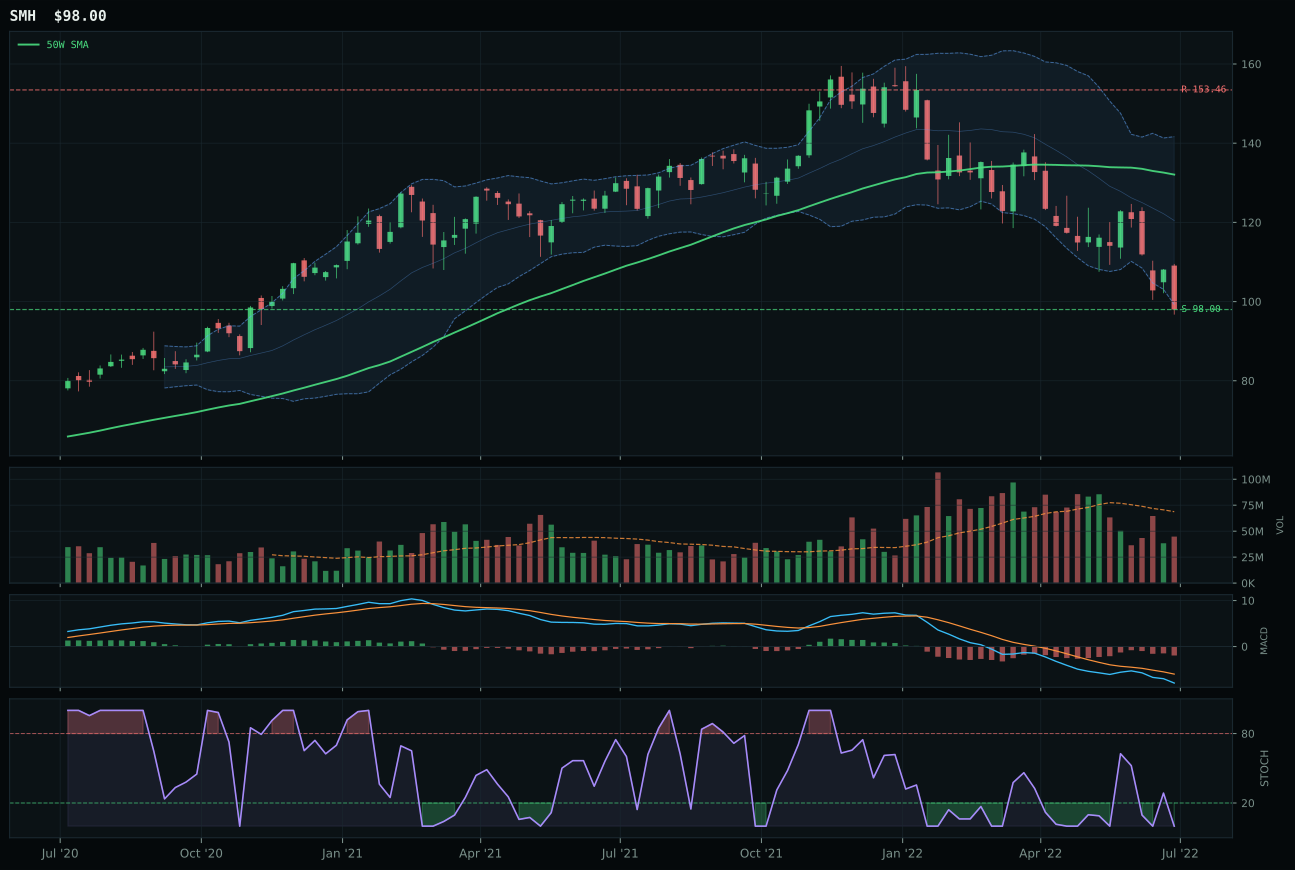
SMH has a pullback into support profile with -10.3% 13-week relative strength versus SPY.
A failed hold above support would weaken the setup.
Actionable but governed by invalidation levels.
BOTZ won the AI category by sitting deeper in the repair zone—34.3% below the 50-week, versus AIQ's 25.7%—which created the setup asymmetry the allocator required this week. Both names trade pullback-into-support structures with oversold or rising-midzone oscillators, but BOTZ's stochastic RSI at 0.17 versus AIQ's 0.32 offered tighter invalidation on the downside, and the risk-reward gap favored BOTZ marginally at 75 versus 90 despite identical support holding. AIQ's composite technical evidence scored 44.6 versus BOTZ's 9.7, yet that higher number masked volume-price rejection and persistence weakness; BOTZ's -13.5% relative strength versus SPY felt like capitulation, not trend failure, because nobody was chasing it. Liquidity stress and broken risk appetite are heavy headwinds here, making depth into the washout more valuable than secondary-level support holds.
AI earned 5% allocation strictly as a margin-of-safety hedge against execution-driven robot and automation cycles, despite a portfolio-worst 8.9 final score. Macro fit stands at 31/100—liquidity stress costs 12 points, broad market bear another 8—and neither technical nor macro drivers support meaningful capital commitment. BOTZ's momentum confirmation flatlined at 0.0, yet the category's entry price (depth into the 0.786 Fibonacci repair) and stochastic RSI oversold positioning suggest the worst-case scenario is priced in. Holding this position requires conviction that disinflationary bear markets eventually seek structural growth again; without a macro shift toward either liquidity normalization or risk appetite recovery, this allocation would be first to trim if portfolio stress rises. Movement to 10% would demand either BOTZ closing above its 50-week moving average or a clear reversal in liquidity-stress descriptor status.
Agriculture & Livestock — VEGI
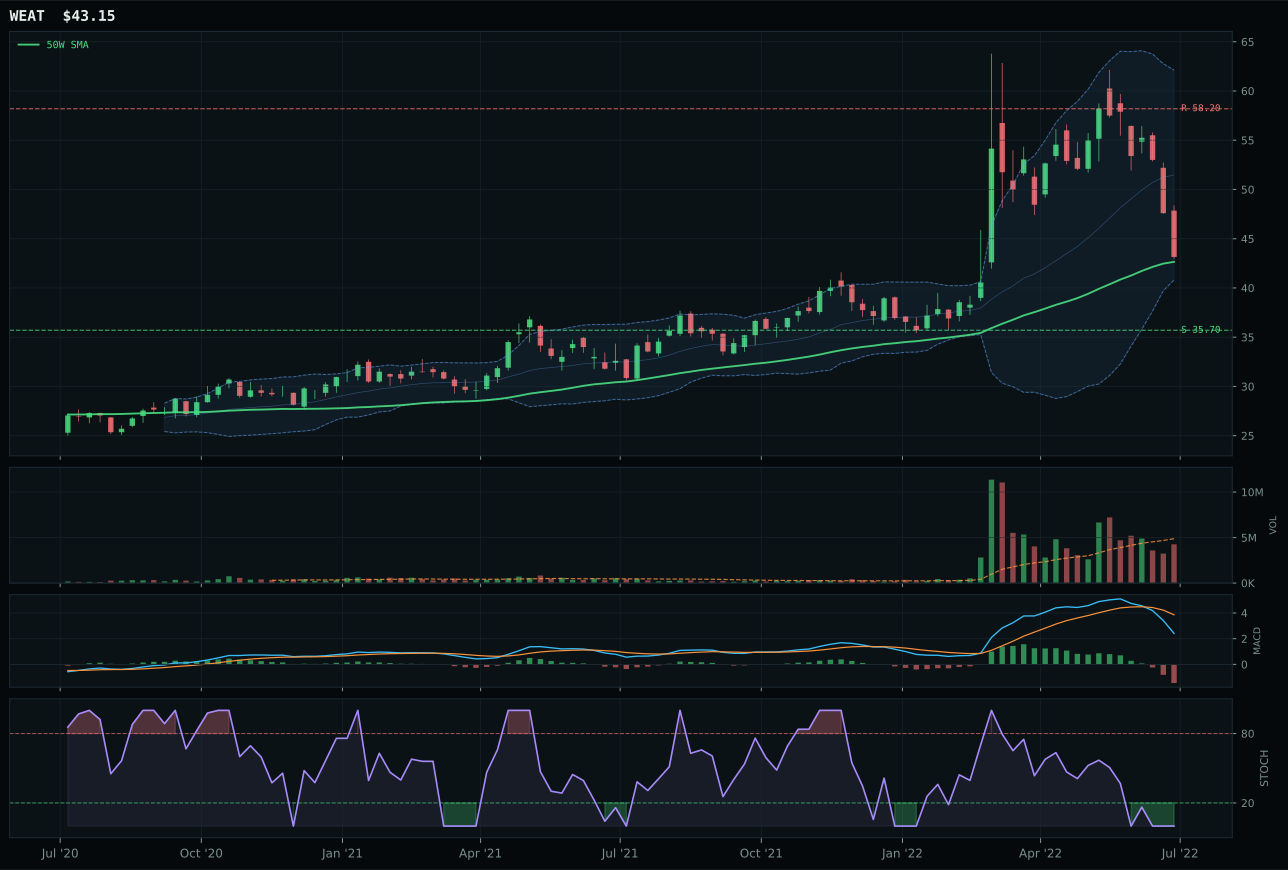
WEAT has a compression near 50W profile with 4.9% 13-week relative strength versus SPY.
A failed hold above support would weaken the setup.
Actionable but governed by invalidation levels.
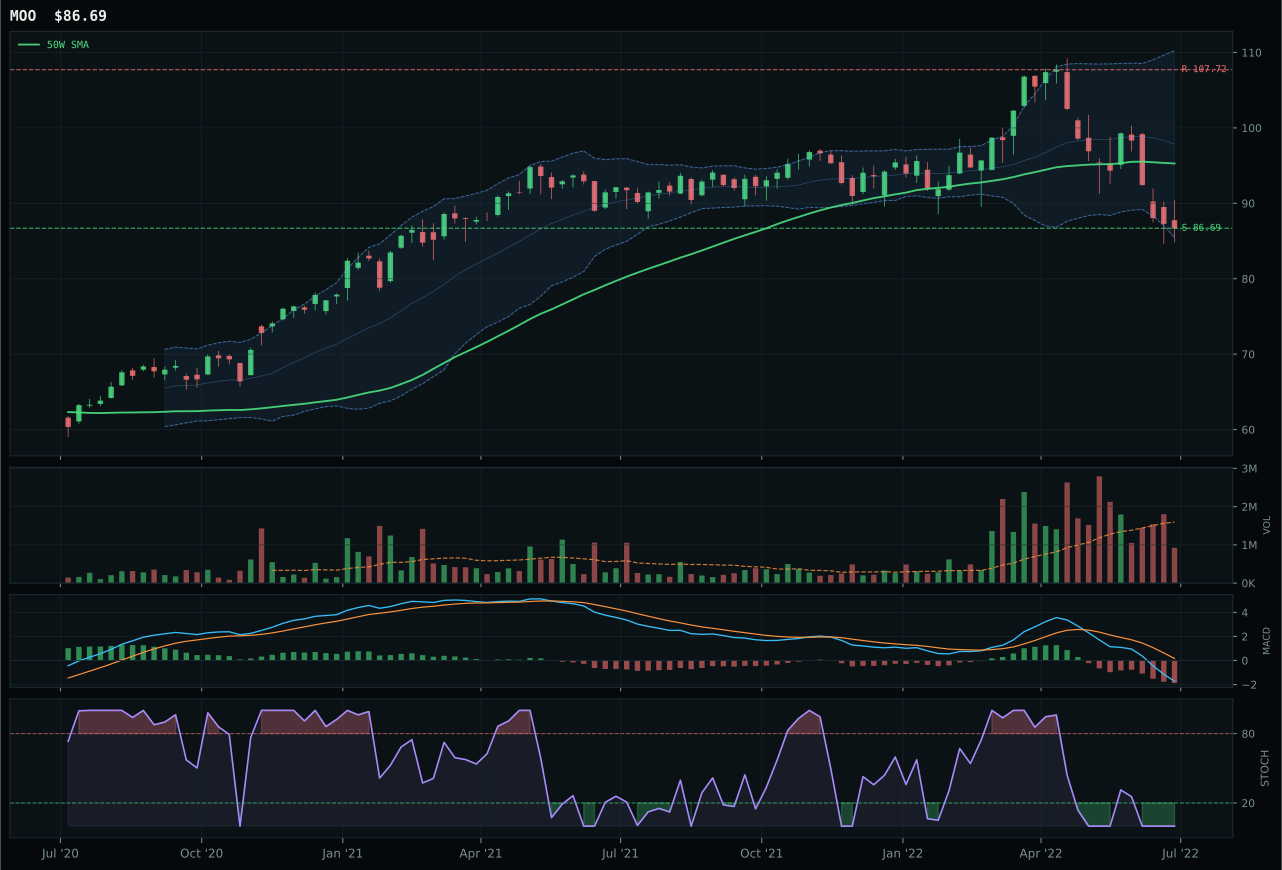
MOO has a pullback into support profile with -2.0% 13-week relative strength versus SPY.
A failed hold above support would weaken the setup.
Actionable but governed by invalidation levels.
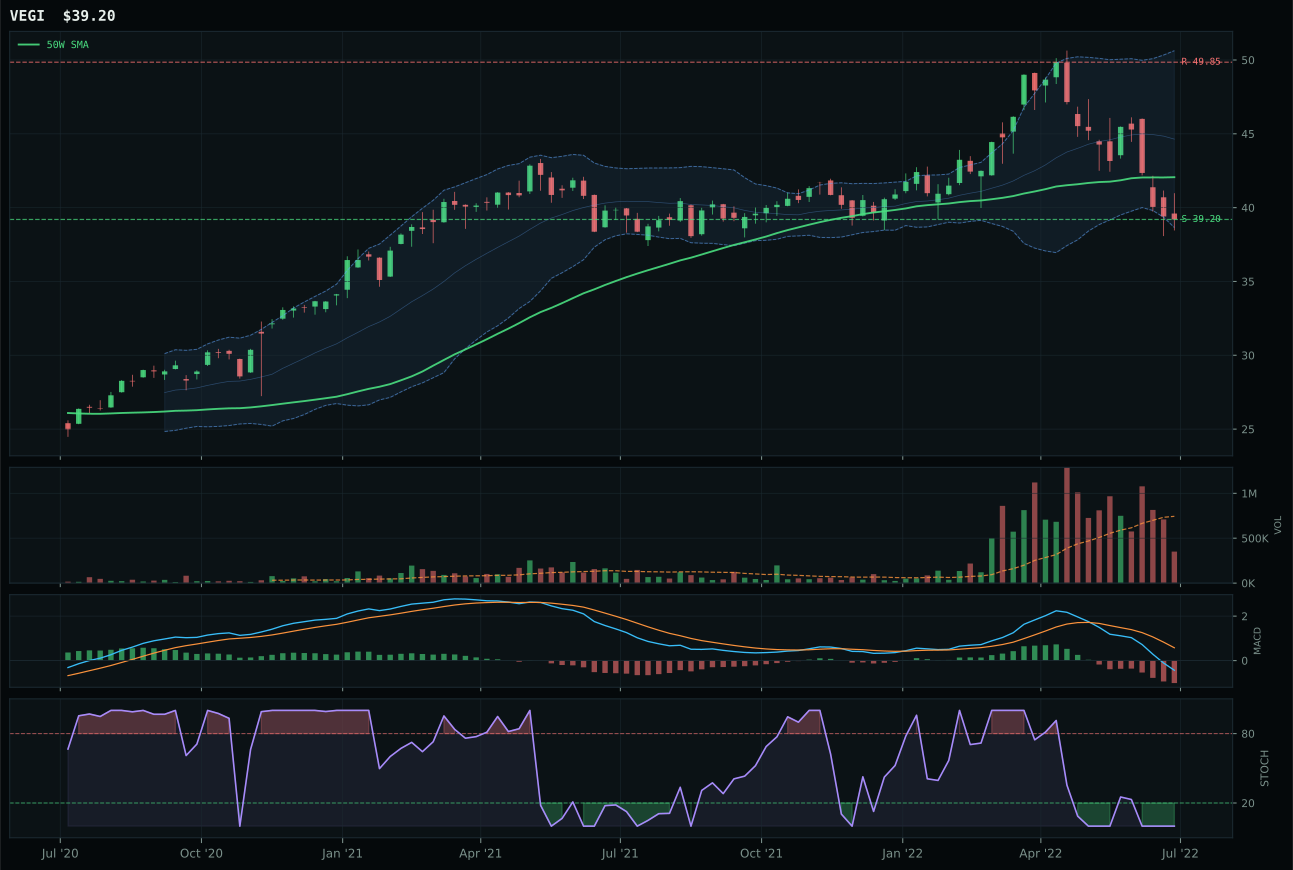
VEGI has a pullback into support profile with -2.4% 13-week relative strength versus SPY.
A failed hold above support would weaken the setup.
Actionable but governed by invalidation levels.
VEGI won the agriculture category by offering the cleanest risk-reward on an oversold setup, despite macro headwinds crushing the entire category. The ETF sits 6.8% below the 50-week with support defined at 39.20 and stochastic RSI flatlined at 0.00, creating a no-nonsense invalidation floor; its 90/100 risk-reward (21.4% upside to resistance, 0.0% downside to support) provided the asymmetry needed in a capitulated market. WEAT traded compression near the 50-week at higher RS versus SPY (4.9% vs -2.4%) and neutral volume, yet its risk-reward scored only 60—the spread between upside (21.4%) and downside (22.5%) removed the cushion allocators demand. VEGI's weak momentum confirmation (0/100) and persistent selling pressure are offset by the fact that agricultural commodity futures themselves are near-term exhausted; the technical case for VEGI is repair, not rotation.
Agriculture earned a 5% slot as pure capitulation insurance against farm-income collapse, not as a conviction macro bet. The 6.9 final score reflects the toxic macro fit: disinflation pressure and liquidity stress combine for -13 points, while the category's own technical evidence bottoms at 7.7/100. WEAT's superior trend score (89 vs 63) and neutral volume would normally argue for it as the category representative, yet VEGI's oversold oscillators and defined support zone prevent further drawdown panic. This allocation is a core-defensive placeholder—if macro turnarounds to reflation and risk appetite, it gets trimmed first; if disinflation deepens and currency weakness accelerates, WEAT's superior RS may warrant a swap. For now, holding the category maintains exposure to a historic low without chasing a bounce that hasn't started.
Industrial Metals — COPX
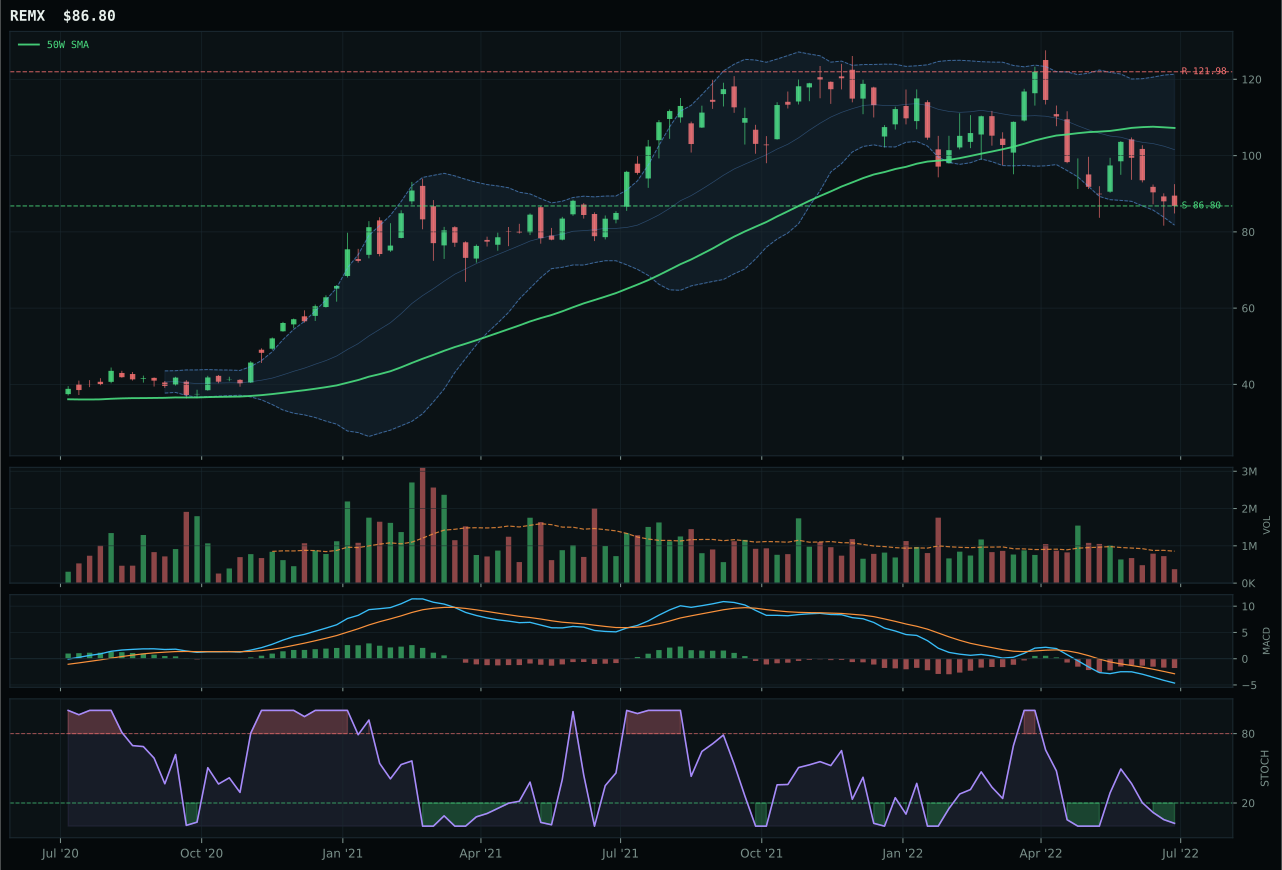
REMX has a pullback into support profile with -13.0% 13-week relative strength versus SPY.
A failed hold above support would weaken the setup.
Actionable but governed by invalidation levels.
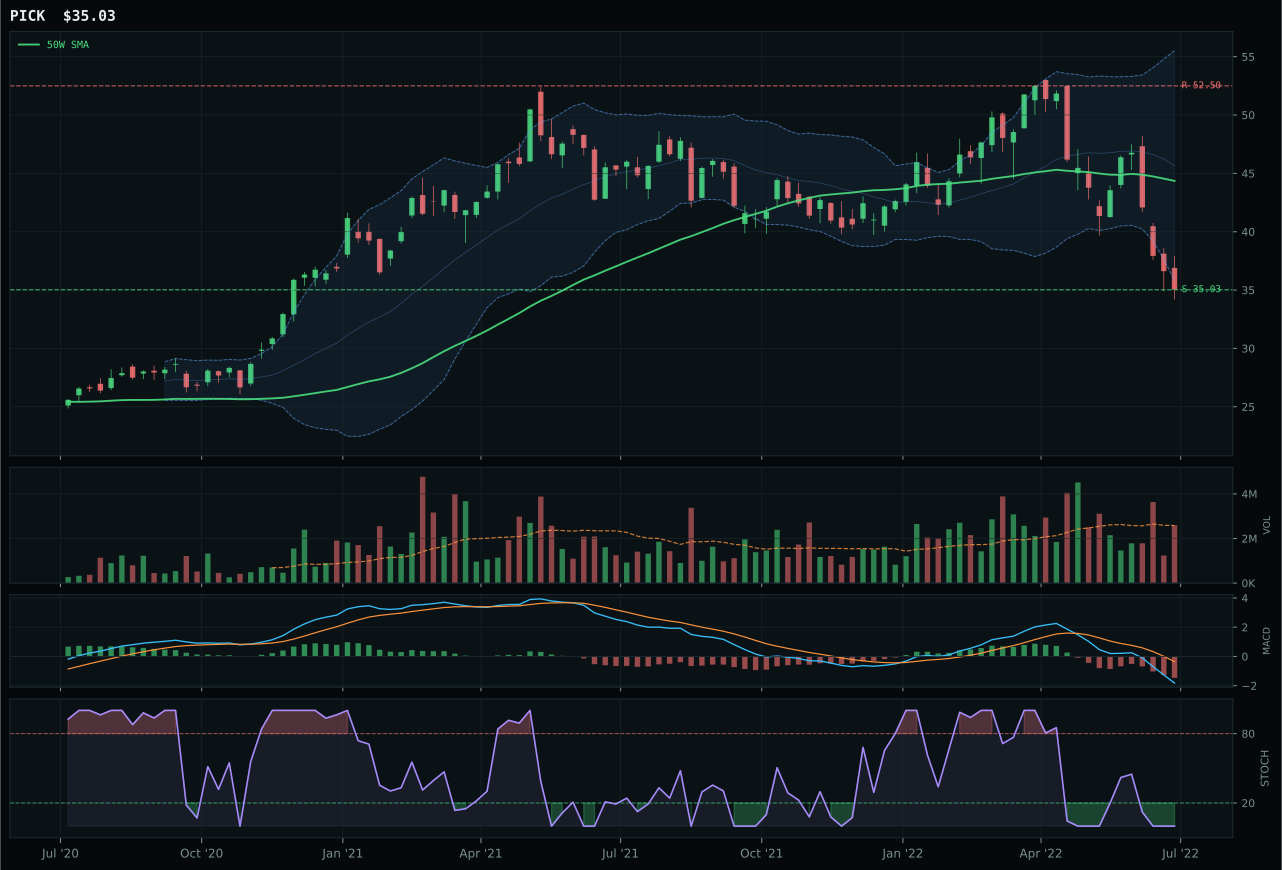
PICK has a pullback into support profile with -17.4% 13-week relative strength versus SPY.
A failed hold above support would weaken the setup.
Actionable but governed by invalidation levels.
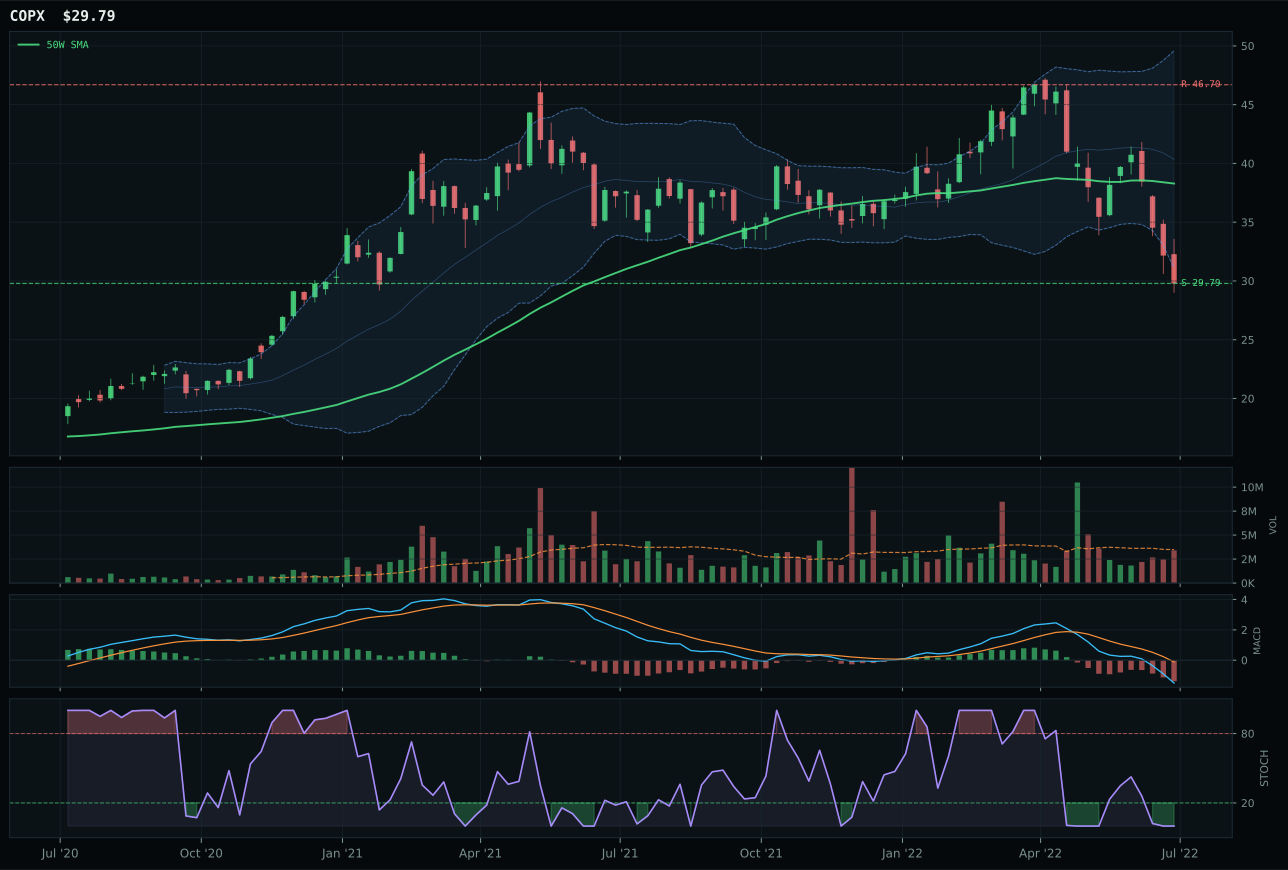
COPX has a pullback into support profile with -20.4% 13-week relative strength versus SPY.
A failed hold above support would weaken the setup.
Actionable but governed by invalidation levels.
COPX eked out a win in the worst-scoring category by offering the only structure that wasn't deteriorating faster than its peers. The copper-scarcity play sits 22.2% below the 50-week with neutral volume at 0.98x average and support defined at 29.79; while its technical evidence scored a dismal 0.0/100 (13W returns -36.2%, RS -20.4% versus SPY), that pure washout status prevented further rollover relative to REMX's thin-participation selloff. REMX's cleaner structure (52.5 vs 58.2) and rare-earth narrative appeal could not overcome the fact that thin participation meant distribution, not bottoming; COPX's neutral volume at deep discount indicated capitulation. Neither name shows momentum confirmation or persistent buying, but COPX's oversold oscillator and flat MACD in an extreme drawdown create the kind of base that precedes stabilization, however distant.
Industrial Metals received 0% allocation at a category score of 6.0, ranked 9th out of 10, excluded entirely from the portfolio. The macro case was damning: liquidity stress (-8) and dollar pressure (-7) created a -15 net headwind, and no macro descriptor favored copper or rare earths in a disinflation regime. COPX's 0.0 technical evidence score reflected negative momentum (-26.9% 4-week, -36.2% 13-week) combined with zero volume confirmation of accumulation. The only reason industrial metals held any optionality was the oversold stochastic RSI reading and defined support at 29.79; if COPX closed below that level, the setup would collapse entirely. The allocation committee recognized that cyclical commodities faced structural headwinds until either disinflation reversed sharply or dollar weakness accelerated—neither scenario was present. Industrial Metals must break resistance at 46.70 with accompanying volume and breadth before earning any slot above 0%. Until then, capital is better deployed in defensive names or monetary hedges.
Emerging Markets — INDA
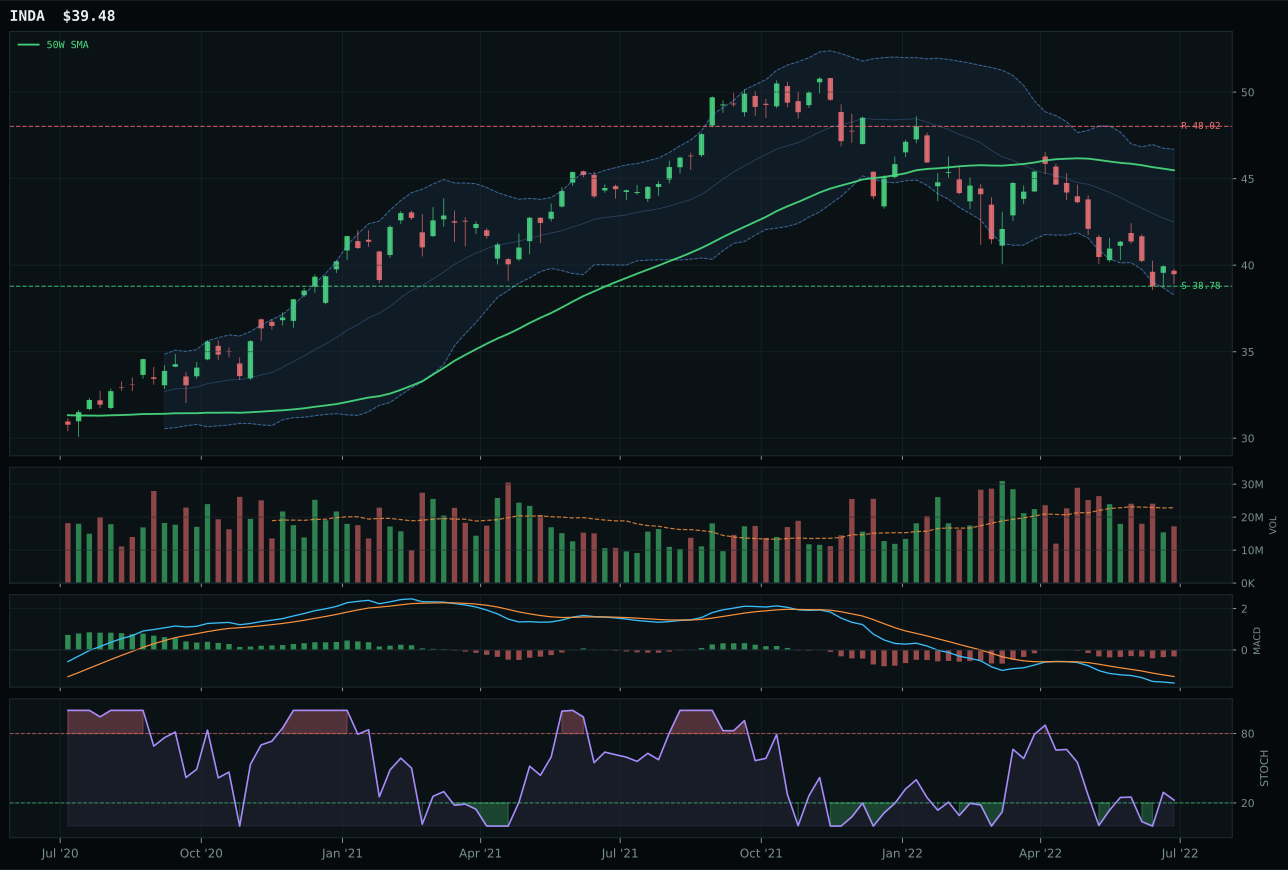
INDA has a pullback into support profile with 2.8% 13-week relative strength versus SPY.
A failed hold above support would weaken the setup.
Actionable but governed by invalidation levels.
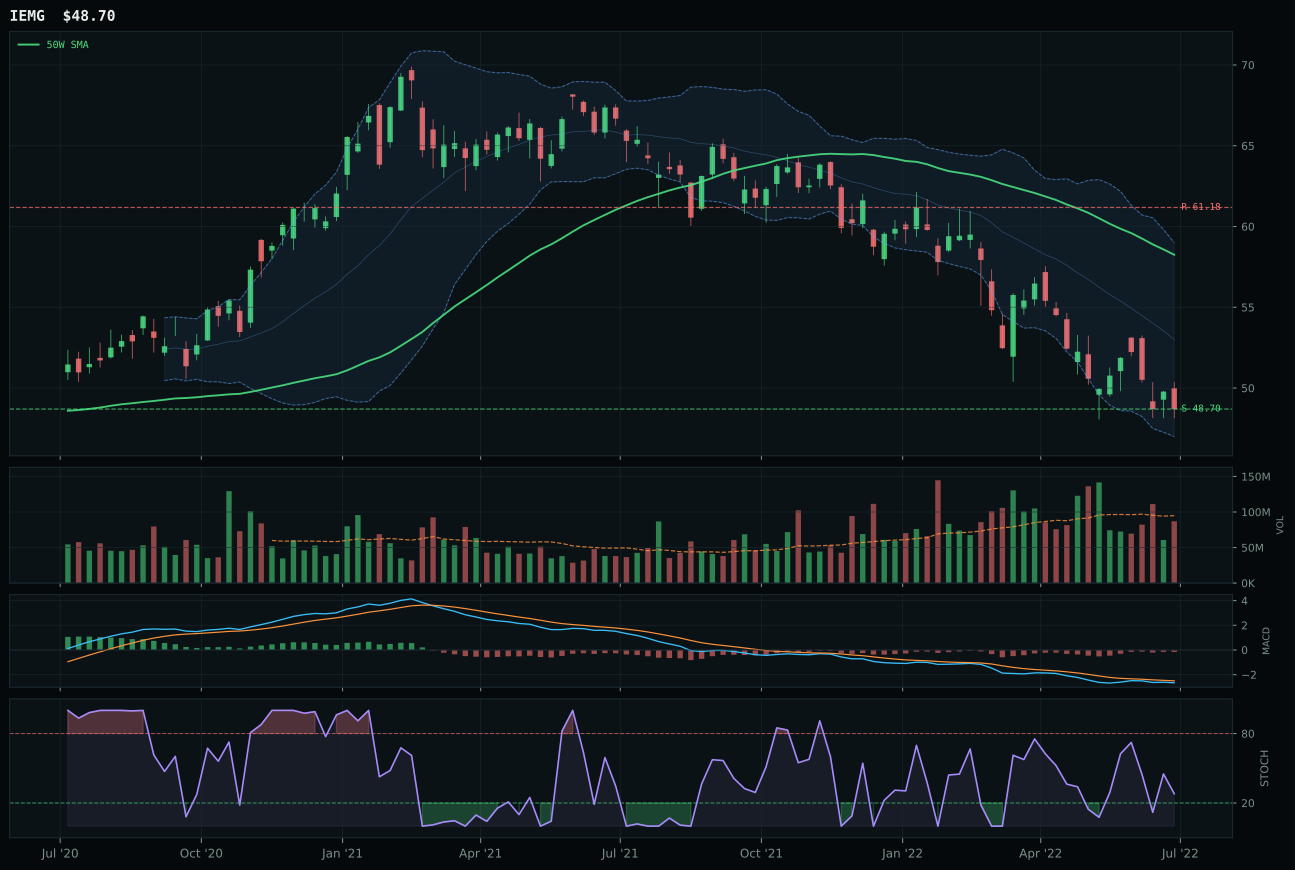
IEMG has a pullback into support profile with 2.1% 13-week relative strength versus SPY.
A failed hold above support would weaken the setup.
Actionable but governed by invalidation levels.
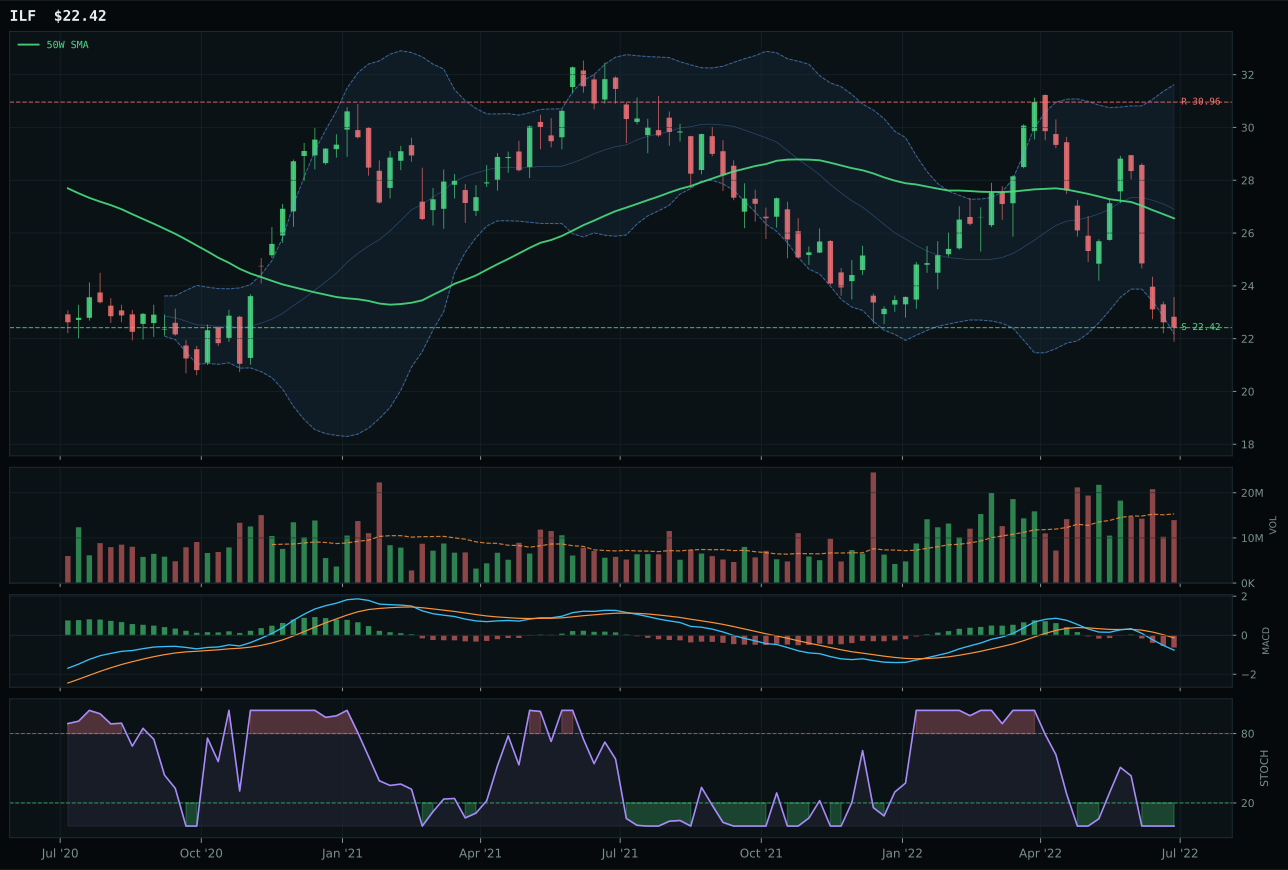
ILF has a pullback into support profile with -11.8% 13-week relative strength versus SPY.
Extension and support failure are the main tactical risks.
Tracked, but not top-2 eligible because: structurally broken.
INDA narrowly beat IEMG by offering a 68/100 timing score versus 60/100, driven by slightly better stochastic RSI positioning (rising mid-zone at 0.22 versus falling-neutral) and marginally tighter distance to the 50W (13.2% vs similar compression). India's quality-growth tilt scored modestly higher technical evidence (38.6 vs 27.5) in a disinflation regime where higher-quality emerging exposure outperforms broad-beta peers. Both names sit 13%+ below the 50W in the Fib 0.786 repair zone with identical risk-reward at 90/100, so the win margin reflects oscillator trajectory (INDA's stochastic rising, IEMG's falling) rather than price structure. Category-relative strength barely separated them (0.7% vs 0%), yet INDA's neutral volume and IEMG's falling stochastic created a small technical edge in a broken-appetite regime where secondary momentum matters.
Emerging Markets received 0% allocation at a category score of 0.7, the lowest in the portfolio, excluded entirely. Dollar pressure (-14) and liquidity stress (-10) created a -24 net headwind that no technical setup could overcome, and broad market bear sentiment (-9) reinforced structural weakness. INDA's 38.6 technical evidence score was respectable, but the macro fit of 40.0 combined with a -24 net macro headwind produced a category score barely above zero. Disinflation regime damage to emerging markets was structural, not tactical—EM currency depreciation, capital outflows, and higher real rates abroad all pointed to further deterioration. INDA would need dollar weakness to accelerate sharply or risk appetite to return before earning any allocation. The category must break above resistance at 48.02 on sustained volume and breadth before reentry is warranted. Until then, capital directed away from EM is well-deployed.