
2022-06-24
Informational purposes only. The content in this report, including allocations, analysis, and commentary, is provided solely for informational and educational purposes. It does not constitute financial advice, investment advice, trading advice, or any other type of advice. Past performance does not guarantee future results. Always conduct your own research and consult a qualified financial professional before making investment decisions.
XLE defensive overlay excluded: price is below its 8W SMA. Cause selector will use GLD or cash alternative.
GLD defensive overlay excluded: price is below its 8W SMA. Cause selector will use cash alternative.
Macro risk engine requires the 50% Defensive overlay for this run; payload selected by cause: Transition Defense.
Weekly Allocation
| Ticker | Category | Weight | Role |
|---|---|---|---|
| SGOV | 20% | Overlay | |
| GLD | Precious Metals | 25% | Overlay |
| XLU | 15% | Overlay | |
| IGV | Technology | 10% | Top-2 (10%) |
| IGF | Utilities & Infrastructure | 5% | Tier-2 (5%) |
| ITA | Defense & Aerospace | 5% | Tier-2 (5%) |
| XLE | Traditional Energy | 5% | Tier-2 (5%) |
| URNM | Nuclear Energy | 5% | Tier-2 (5%) |
| BOTZ | AI | 5% | Tier-2 (5%) |
| INDA | Emerging Markets | 5% | Tier-2 (5%) |
Trade Instructions — Monday Open
Sell the tranche from 2022-05-27 (completing its 4-week hold). Buy the new tranche. Instructions show net portfolio changes — same-asset positions cancel, weight changes show the delta.
| Action | Ticker | Instruction |
|---|---|---|
| SELL | XLE | Sell 31% of XLE position (reduce 45.00% → 31.25%) |
| SELL | WEAT | Sell entire WEAT position (2.50% of portfolio) |
| SELL | COPX | Sell 20% of COPX position (reduce 6.25% → 5.00%) |
| SELL | URA | Sell 50% of URA position (reduce 2.50% → 1.25%) |
| SELL | XLK | Sell entire XLK position (1.25% of portfolio) |
| BUY | XLU | Buy XLU — 12.50% of freed cash (adds 2.50% to portfolio) |
| BUY | GLD | Buy GLD — 25.00% of freed cash (adds 5.00% to portfolio) |
| BUY | IGF | Buy IGF — 6.25% of freed cash (adds 1.25% to portfolio) |
| BUY | IGV | Buy IGV — 12.50% of freed cash (adds 2.50% to portfolio) |
| BUY | URNM | Buy URNM — 6.25% of freed cash (adds 1.25% to portfolio) |
| BUY | SGOV | Buy SGOV — 25.00% of freed cash (adds 5.00% to portfolio) |
| BUY | BOTZ | Buy BOTZ — 6.25% of freed cash (adds 1.25% to portfolio) |
| BUY | INDA | Buy INDA — 6.25% of freed cash (adds 1.25% to portfolio) |
Current Portfolio After Trade
Combined holdings across all 4 active tranches. Each tranche is 25% of the portfolio.
| Ticker | % of Portfolio | Weight Bar |
|---|---|---|
| XLE | 31.25% | |
| GLD | 15.00% | |
| XLU | 10.00% | |
| SGOV | 10.00% | |
| COPX | 5.00% | |
| ITA | 5.00% | |
| VEGI | 5.00% | |
| IGV | 5.00% | |
| URNM | 3.75% | |
| IGF | 2.50% | |
| XOP | 2.50% | |
| URA | 1.25% | |
| CIBR | 1.25% | |
| BOTZ | 1.25% | |
| INDA | 1.25% |
Macro Regime — Goldilocks
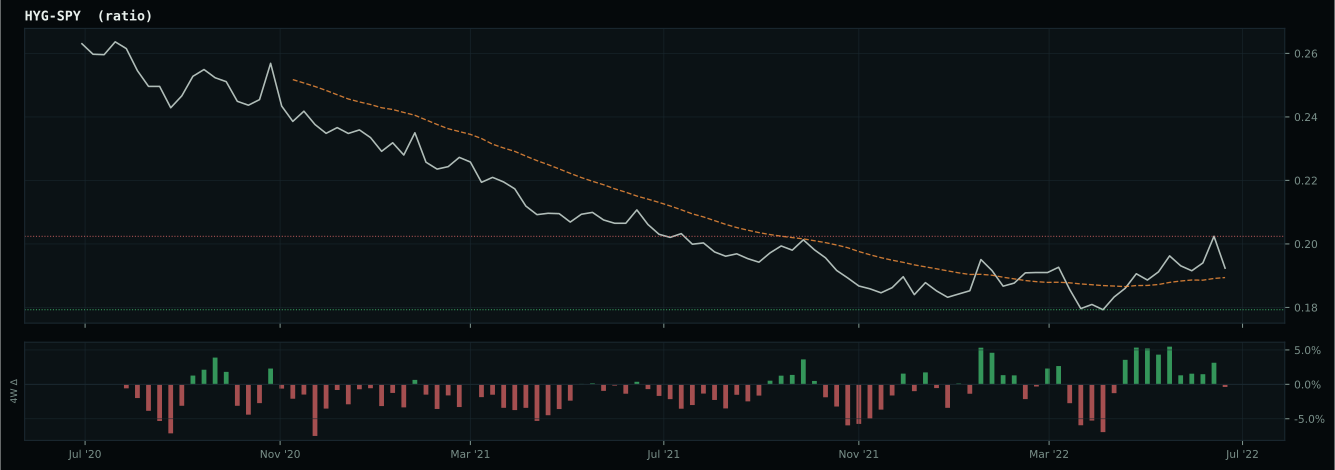
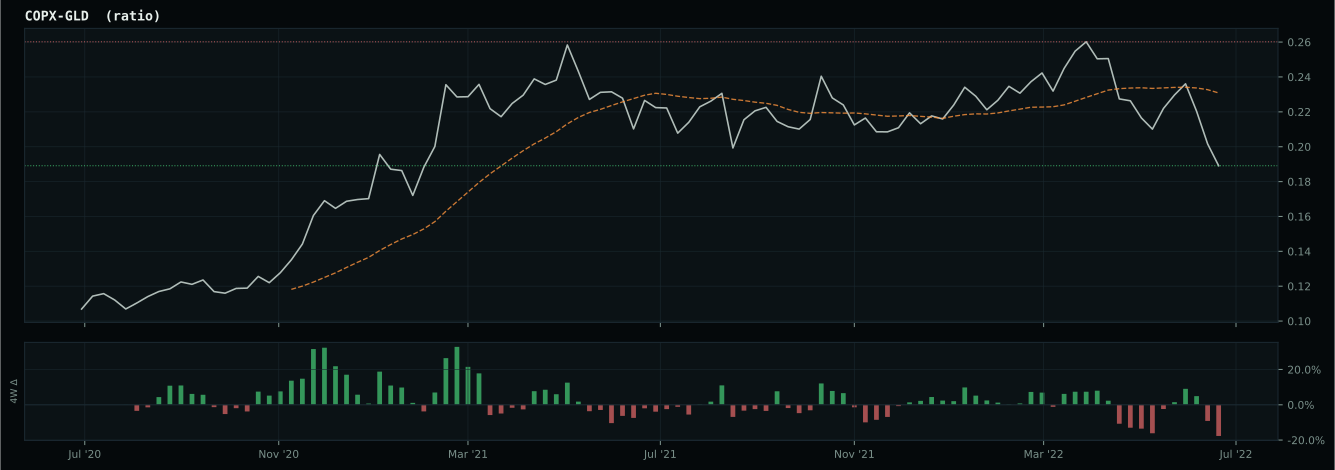
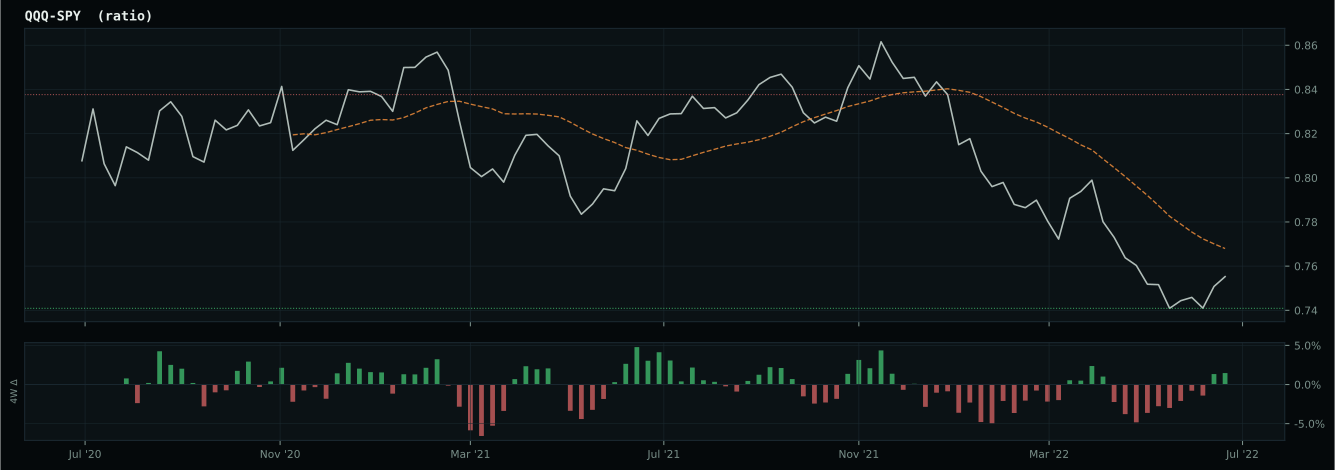
growth data is not confirming the weak market-implied risk appetite signal
Defensive overlay cause is not singular enough to concentrate: the sleeve diversifies across liquidity, monetary defense, and defensive equity exposure while the market resolves the next regime.
Macro Evidence Charts
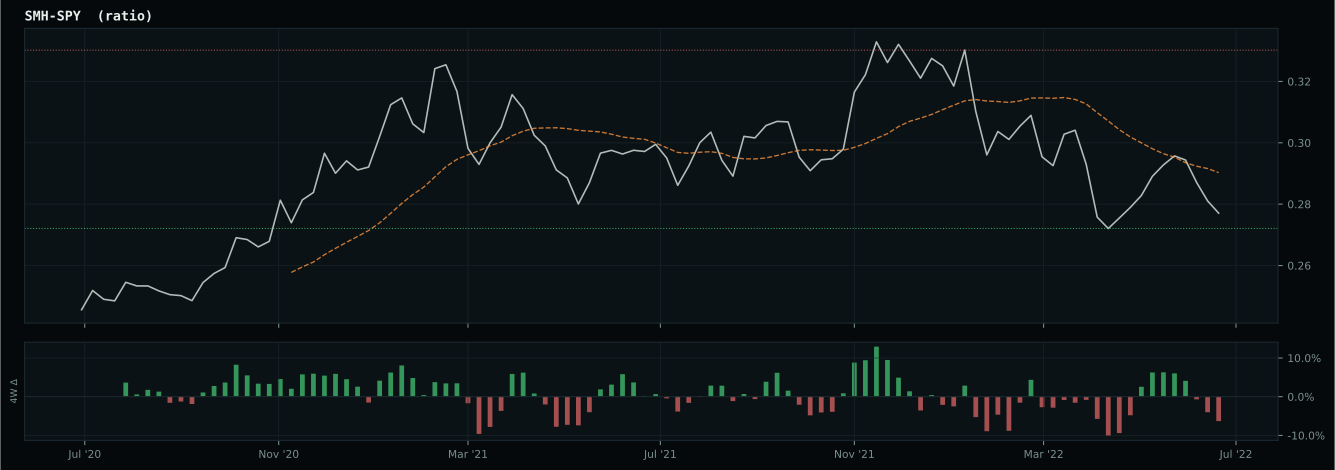
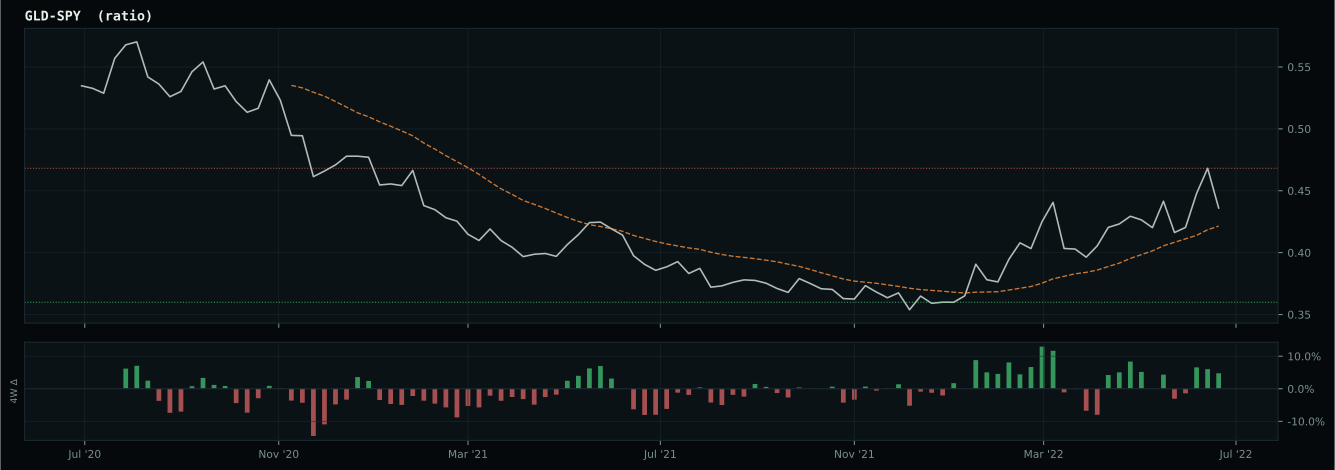
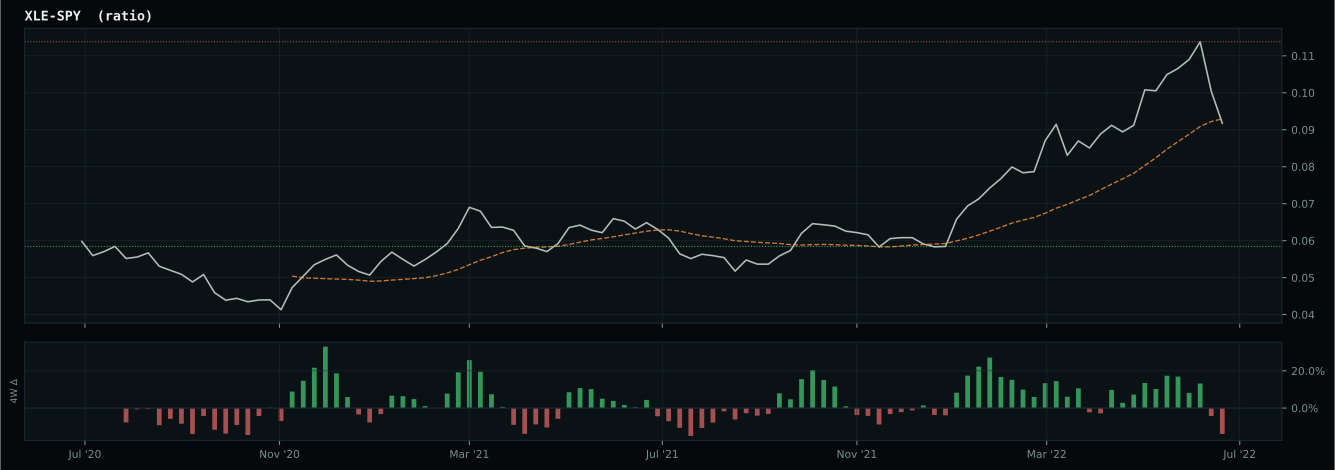
Market-implied signals behind the macro regime scores. Each ratio compares two assets; the direction and slope of the ratio is what the macro engine reads.
Crypto Regime — NoCrypto
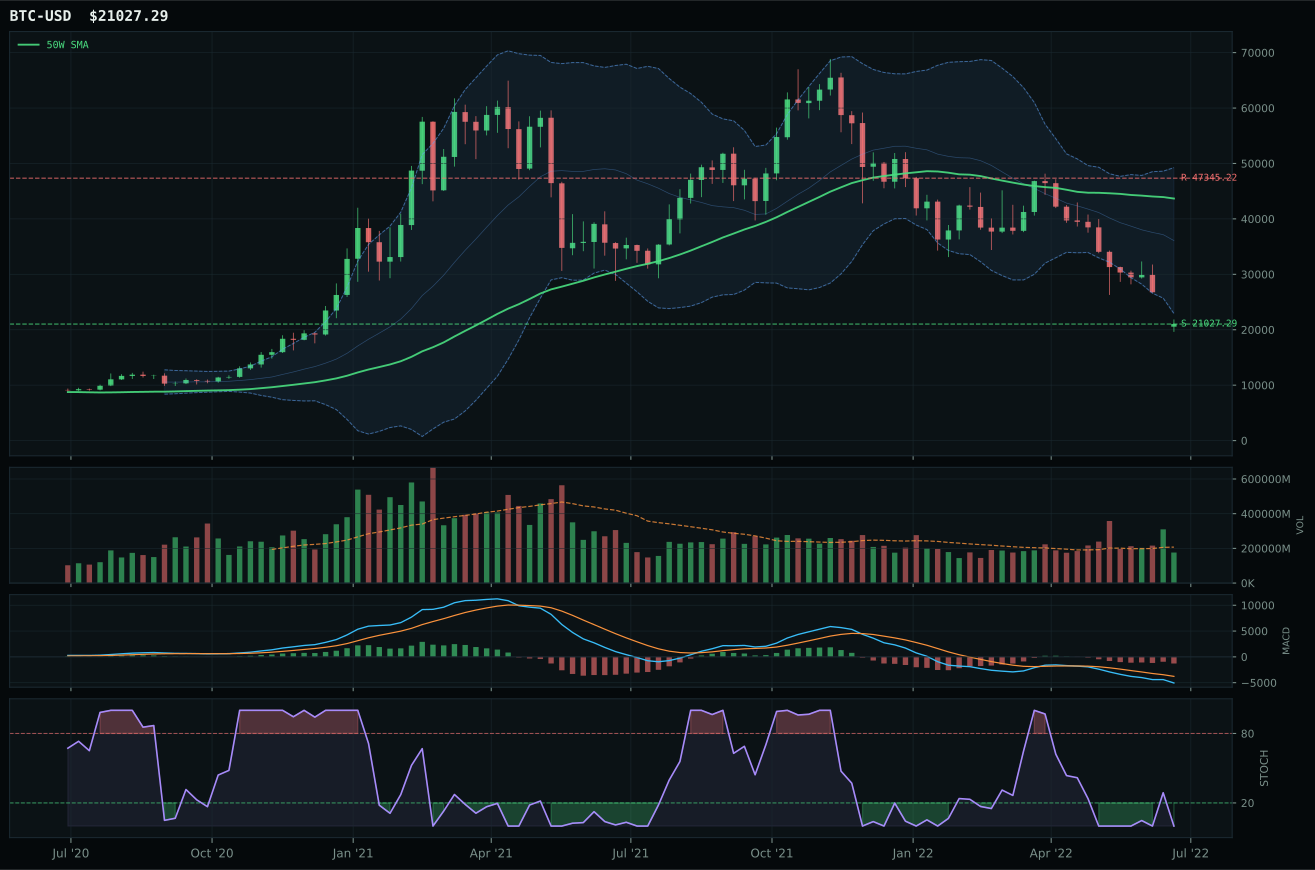
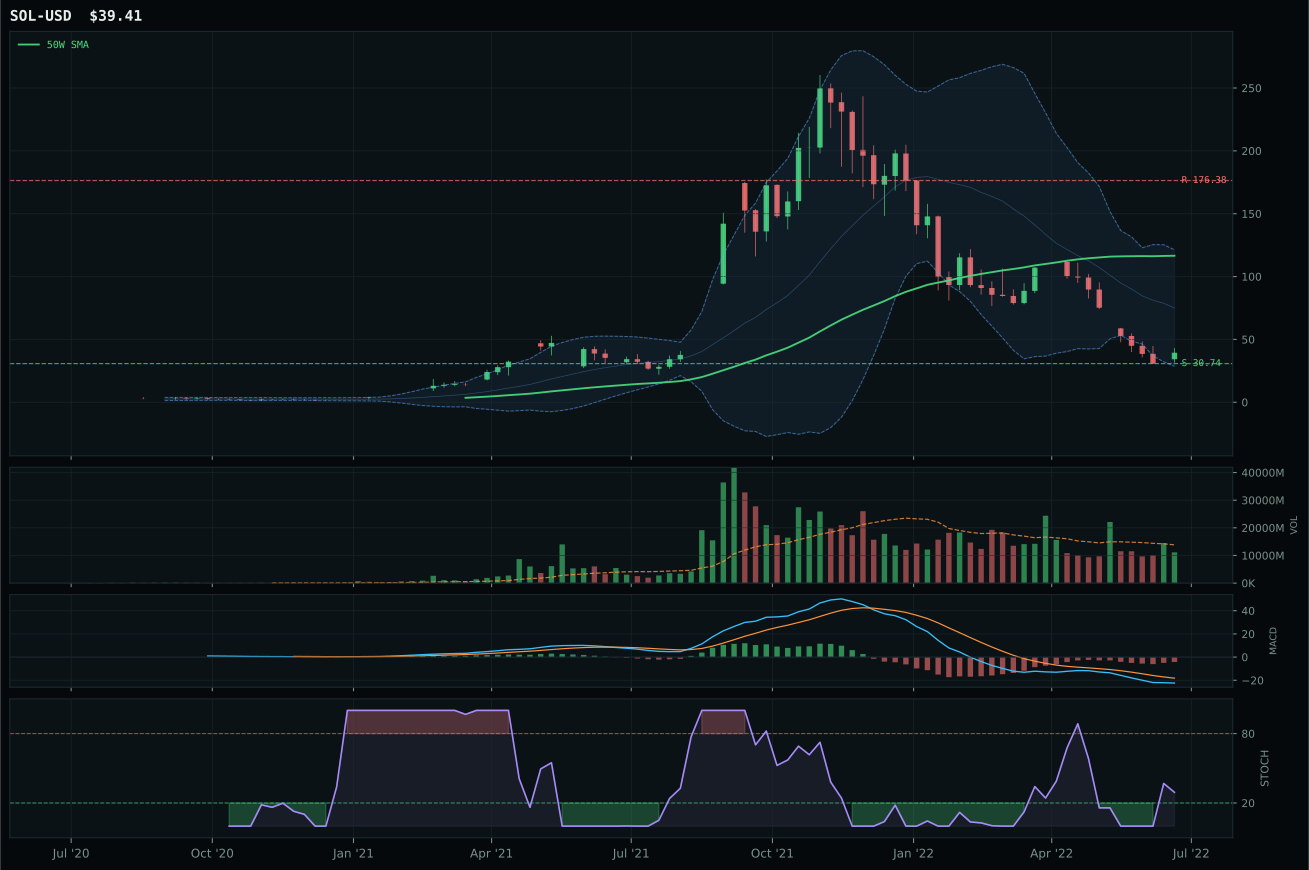
ValueBTC armed by first 200W buy-zone touch, but post-touch range age is 1 weeks; minimum is 12
TrendBTC not confirmed
one or more available conditions failed
Category Rankings
| Rank | Category | Winner | Score | Alloc | 4W Ret | Peers (4W) |
|---|---|---|---|---|---|---|
| 1 | Technology | IGV | 49.6 | 20% | -0.64% | CIBR +0.0% · XLK +2.4% |
| 2 | Precious Metals | GLD | 46.3 | 20% | -5.84% | SLV -13.4% · GDX -14.1% |
| 3 | Utilities & Infrastructure | IGF | 46.0 | 10% | -0.15% | XLU +0.7% · PAVE +3.2% |
| 4 | Defense & Aerospace | ITA | 30.6 | 10% | +1.64% | ROKT +2.6% · XAR +2.4% |
| 5 | Traditional Energy | XLE | 29.9 | 10% | -0.40% | XOP -0.4% · FCG +2.0% |
| 6 | Nuclear Energy | URNM | 29.6 | 10% | +0.76% | NLR -0.8% · URA -2.0% |
| 7 | AI | BOTZ | 28.2 | 10% | +0.18% | AIQ -1.0% · SMH +3.3% |
| 8 | Emerging Markets | INDA | 26.0 | 10% | +3.33% | IEMG -3.2% · ILF -3.4% |
| 9 | Industrial Metals | COPX | 23.9 | 0% | -12.11% | REMX -2.5% · PICK -5.0% |
| 10 | Agriculture & Livestock | VEGI | 10.4 | 0% | -0.10% | WEAT -15.6% · MOO -0.6% |
Technology — IGV
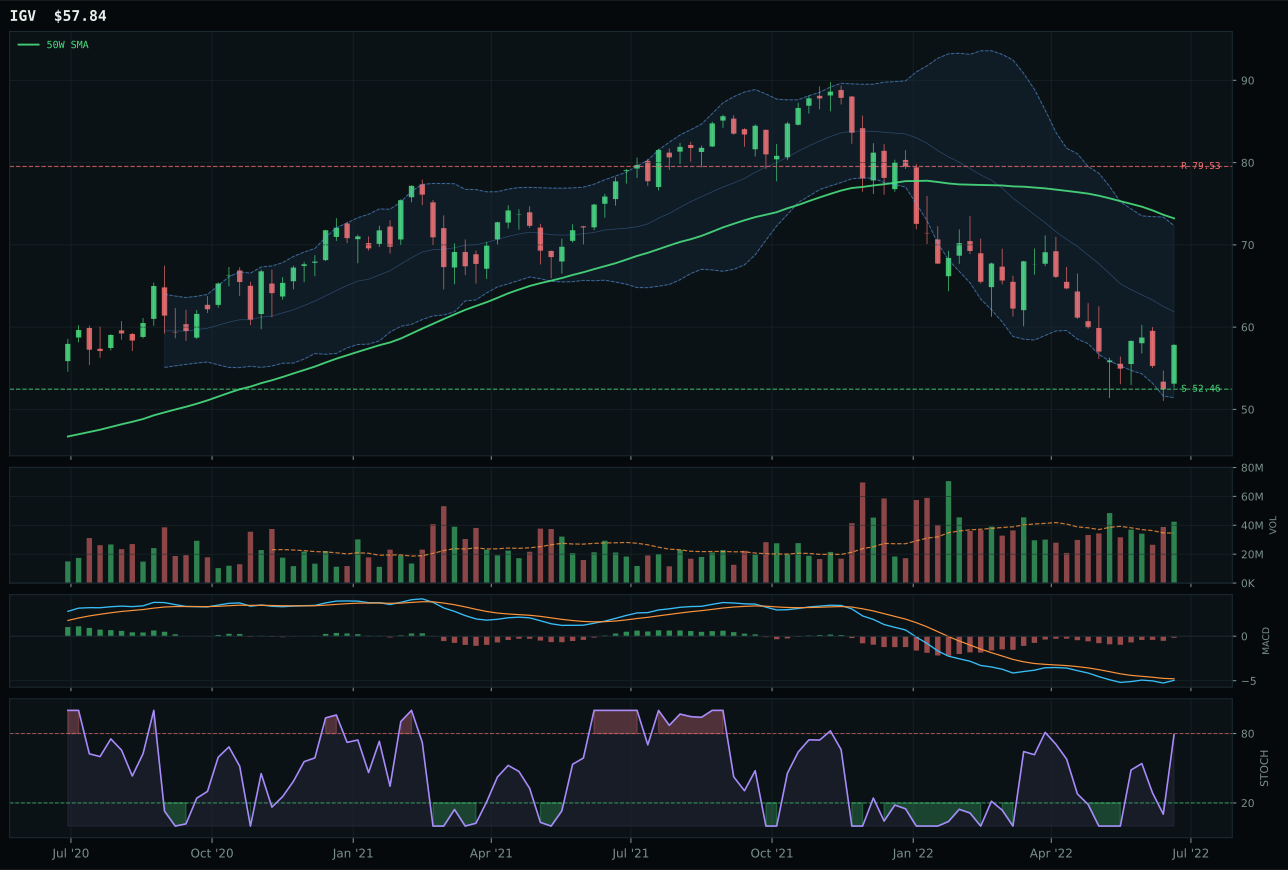
IGV has a neutral structure profile with -0.6% 13-week relative strength versus SPY.
A failed hold above support would weaken the setup.
Actionable but governed by invalidation levels.
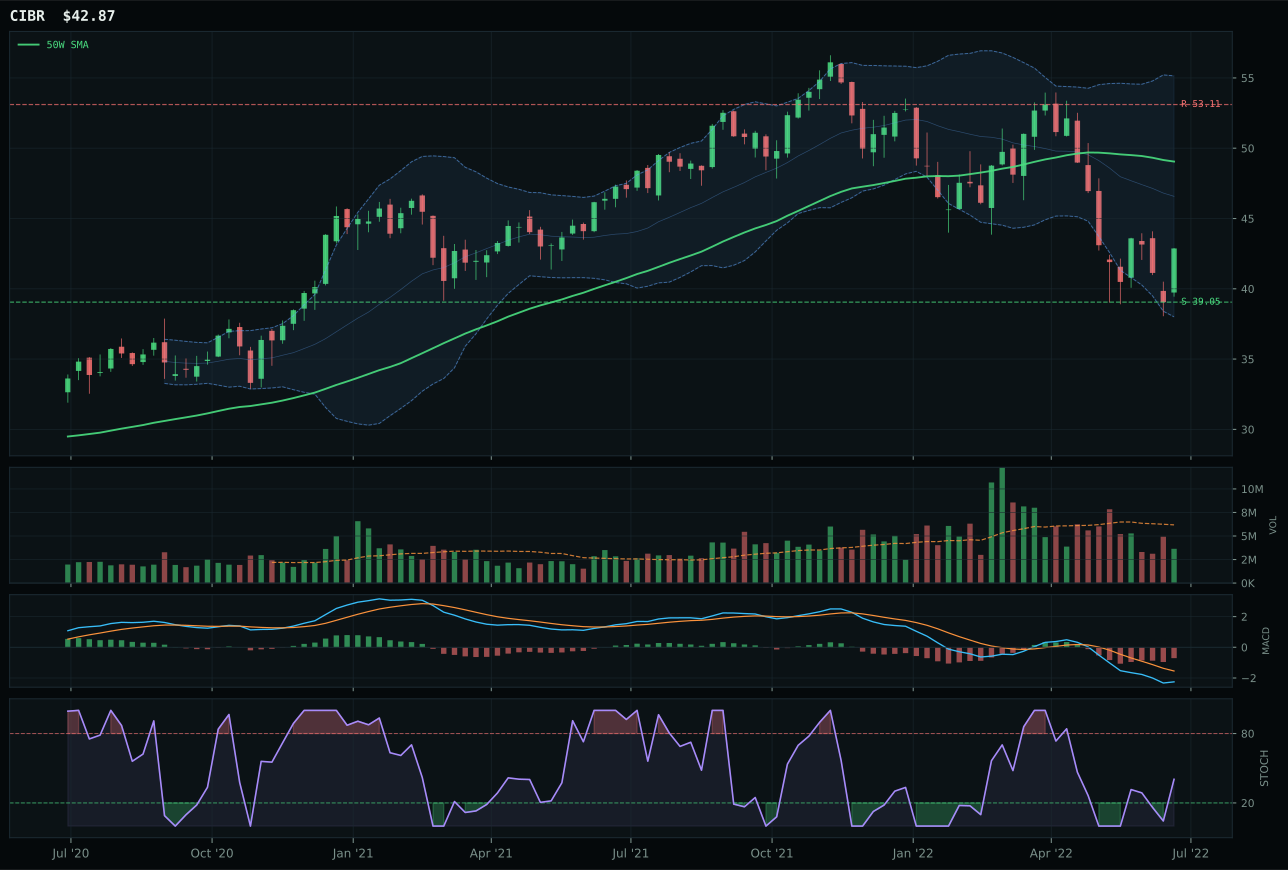
CIBR has a neutral structure profile with -4.8% 13-week relative strength versus SPY.
A failed hold above support would weaken the setup.
Actionable but governed by invalidation levels.
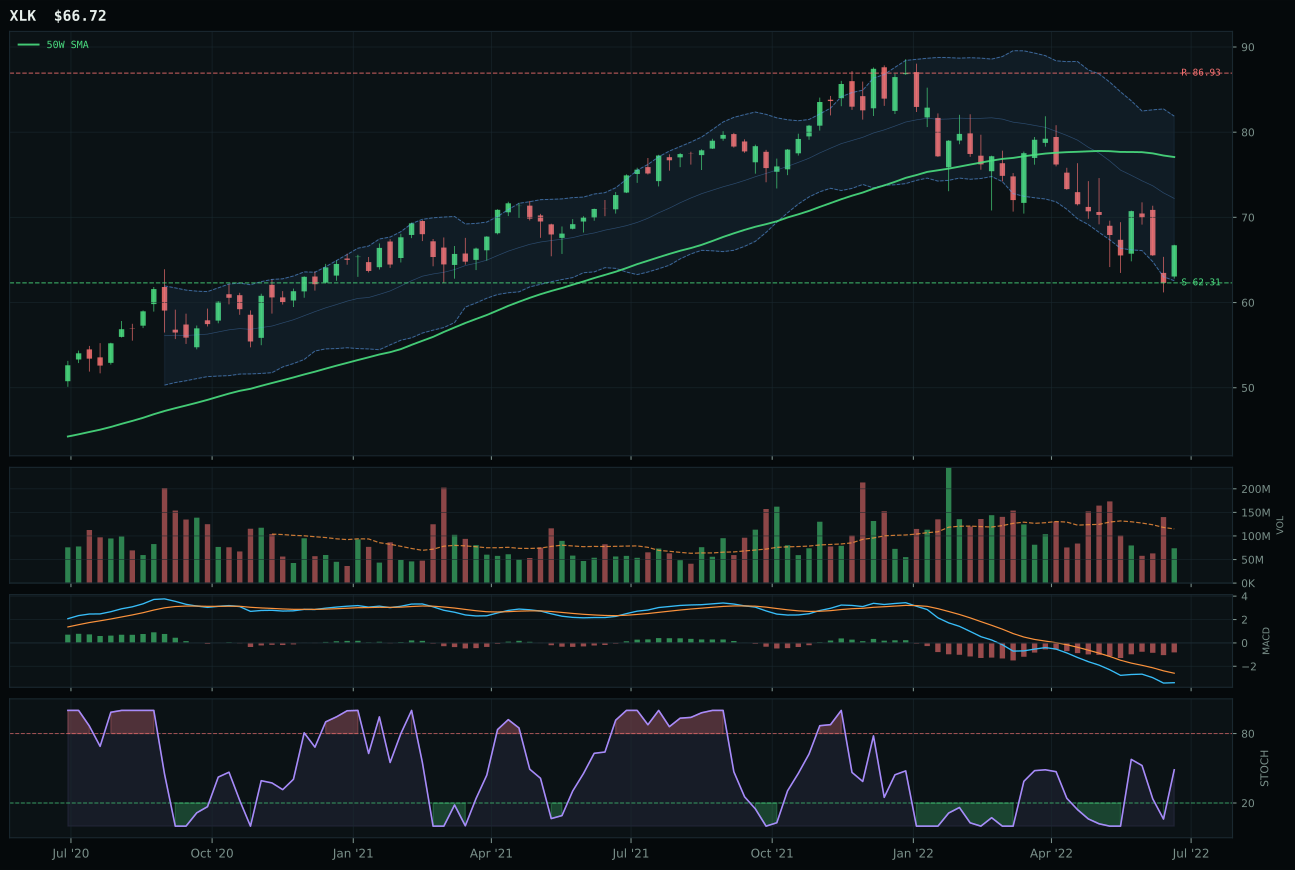
XLK has a neutral structure profile with -1.8% 13-week relative strength versus SPY.
A failed hold above support would weaken the setup.
Actionable but governed by invalidation levels.
IGV wins because it sits in a pullback setup with price 21% below the 50W but still above the 200W — a reset rather than a collapse — and the structure is clean enough to support accumulation. Its 1.2% outperformance versus the category median combined with above-average 1.23x volume participation signals that institutional buyers are using this dislocation, not just bouncing. CIBR lost on three technical counts: weaker risk/reward (88.5 vs 90.0), thinner participation, and negative category-relative strength of -3% versus IGV's +1.2%, meaning money is rotating away from pure cybersecurity into the broader enterprise software thesis. The 16-point score gap is decisive because it reflects both quality of setup and proof of accumulation.
Technology earns 10% allocation as a top-2 category ranked at 49.6 composite score. This category sits in the Goldilocks regime where liquidity is expanding and disinflation pressure favors duration-sensitive growth, yet the broad market bear and broken risk appetite are fighting that narrative. IGV's +7.1% relative strength versus SPY and strong macro fit (80% on monetary hedge and defensive rotation descriptors) justify the top-2 slot despite momentum being -14.5% over 13 weeks. The allocation reflects a high-conviction reset trade — technology oversold enough to offer asymmetric risk/reward without requiring immediate reversal confirmation.
Precious Metals — GLD
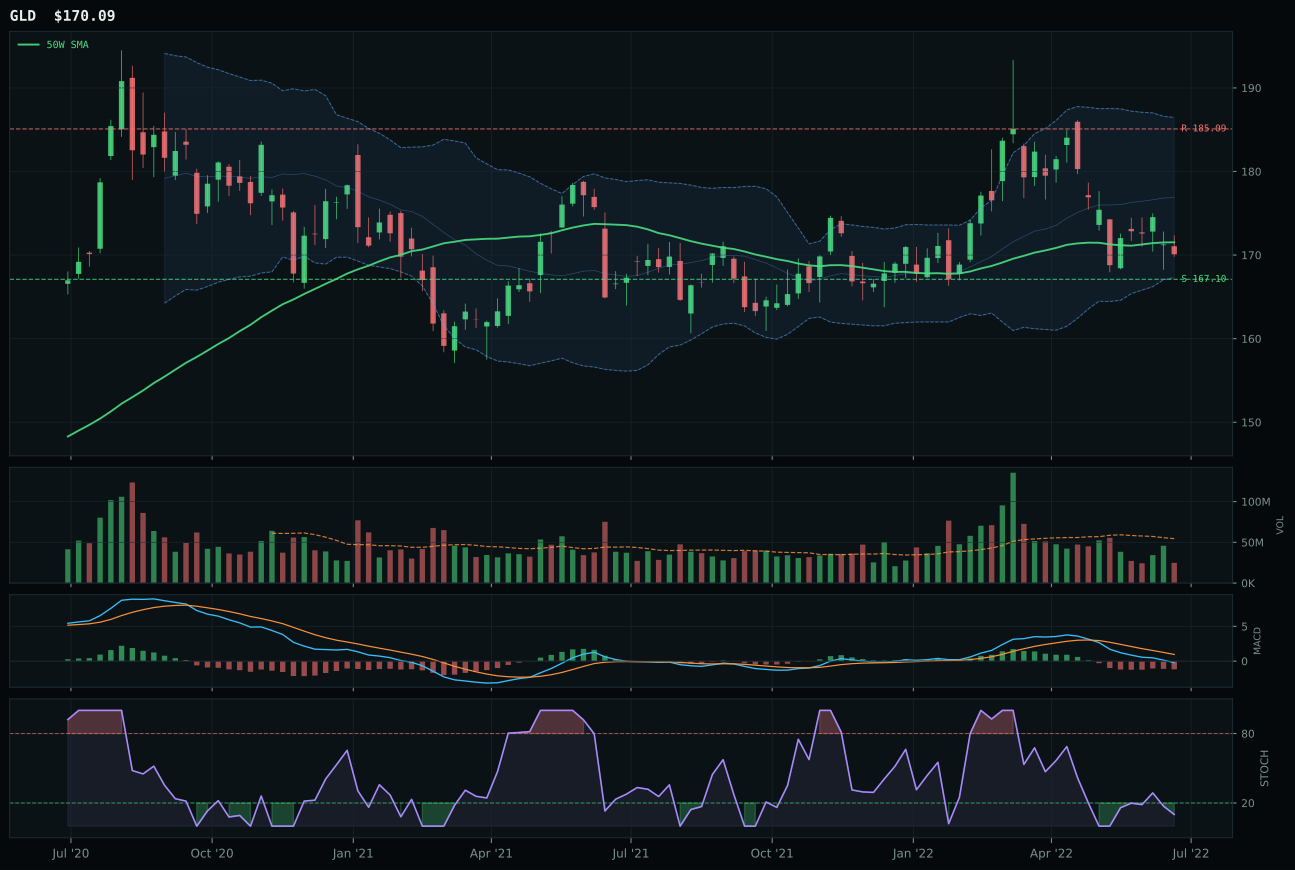
GLD has a pullback into support profile with 7.1% 13-week relative strength versus SPY.
A failed hold above support would weaken the setup.
Actionable but governed by invalidation levels.
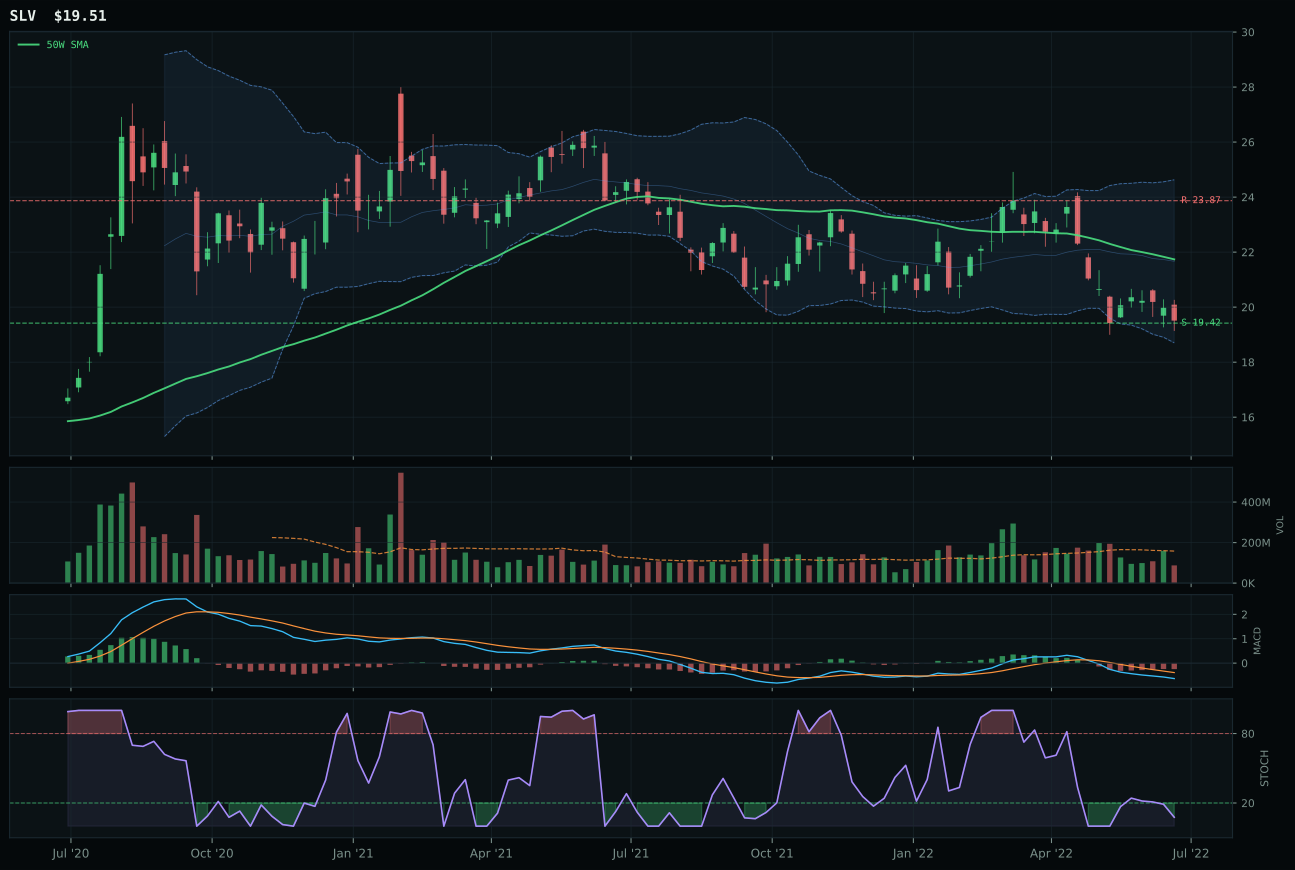
SLV has a pullback into support profile with -3.1% 13-week relative strength versus SPY.
A failed hold above support would weaken the setup.
Actionable but governed by invalidation levels.
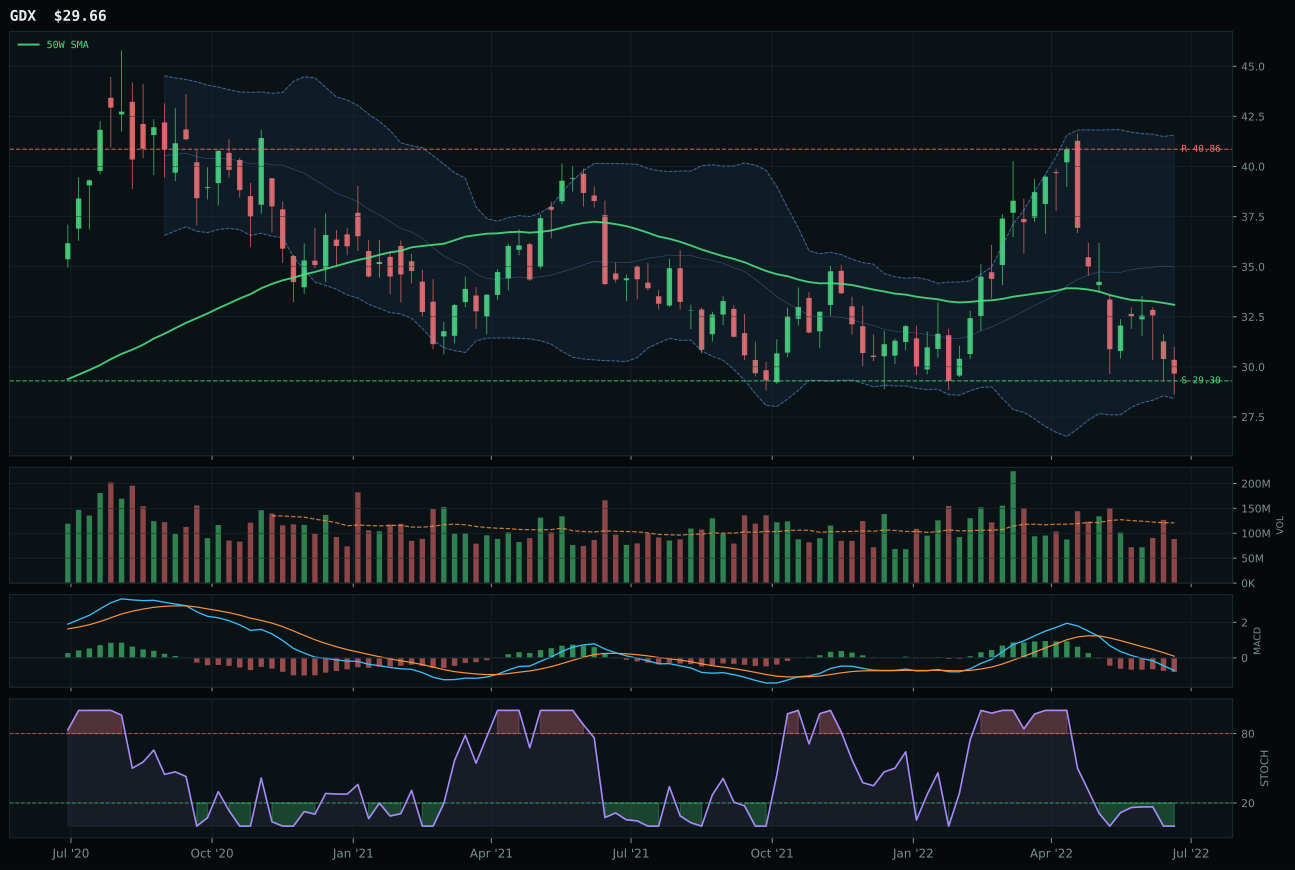
GDX has a pullback into support profile with -9.6% 13-week relative strength versus SPY.
A failed hold above support would weaken the setup.
Actionable but governed by invalidation levels.
GLD dominates with a 30-point score gap over SLV (85 composite vs 54) because it ticks every box: trend 78/100 from +7.1% SPY-relative strength, timing 100/100 from sitting only -0.8% below the 50W in the Fibonacci value zone, and perfect risk/reward (98/100 with 8.1% to resistance and 1.8% to support). Critically, GLD shows +10.2% category-relative strength while SLV shows 0%, meaning capital is flowing into gold specifically and not into the silver-industrial narrative. Volume is thin at 0.46x across both, but GLD's MACD is bearish-but-improving while SLV's is the same — so the edge is pure momentum sponsorship and positioning (13W: -6.7% vs -16.9%).
Precious Metals ranks as top-2 at 10% allocation with a composite score of 46.3. The category macro fit is 78%, the highest in the portfolio, driven by active monetary hedge bid (+14 weighting), defensive rotation (+7), and disinflation pressure (+6). In the Goldilocks regime with risk appetite broken and broad market bear active, gold offers the cleanest quality-of-setup combined with the strongest macro narrative. GLD's positioning as the pure monetary hedge (no industrial beta like silver) aligns perfectly with the current regime. The 10% allocation to Precious Metals reflects peak portfolio conviction that duration and real-rate cuts are coming — this is the portfolio's true risk-off hedge.
Utilities & Infrastructure — IGF
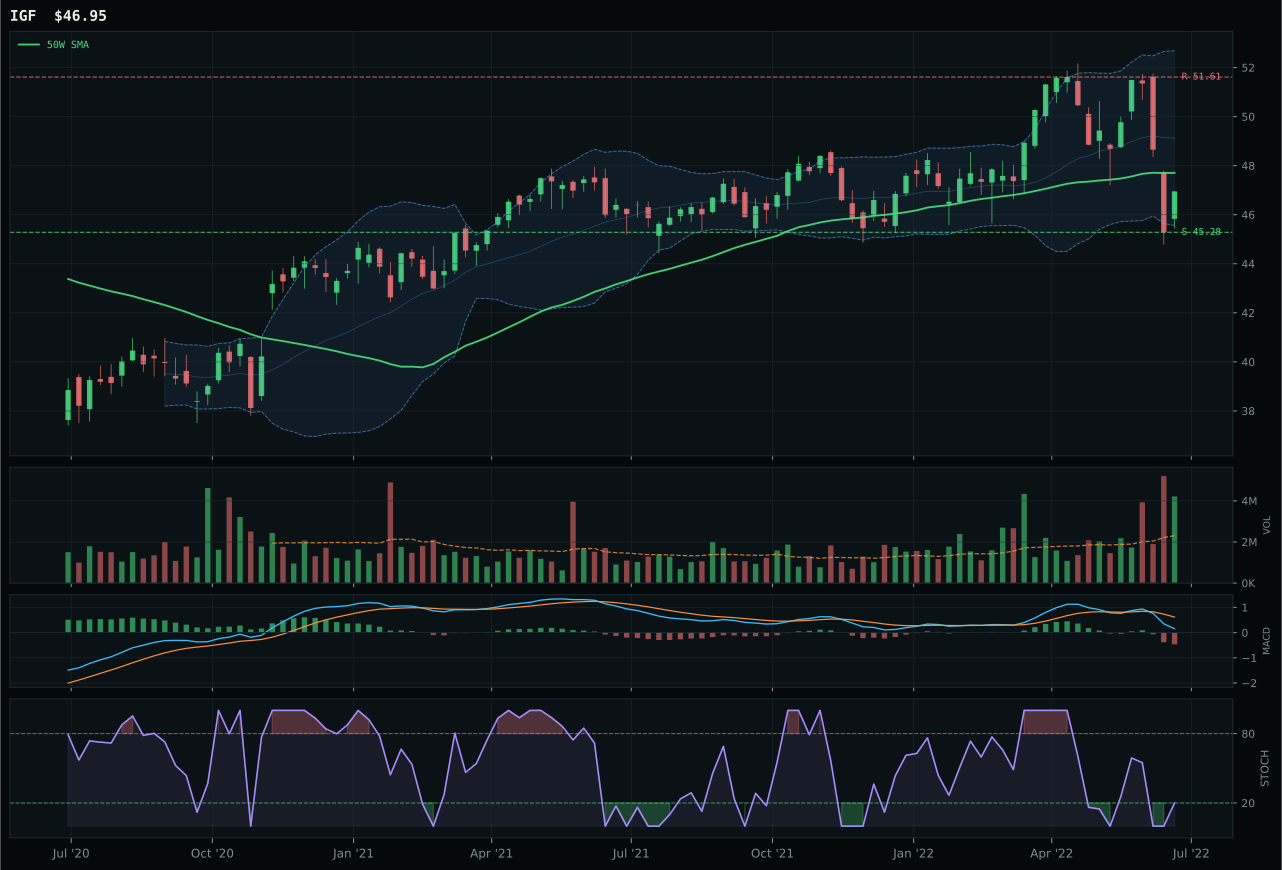
IGF has a pullback into support profile with 7.2% 13-week relative strength versus SPY.
A failed hold above support would weaken the setup.
Actionable but governed by invalidation levels.
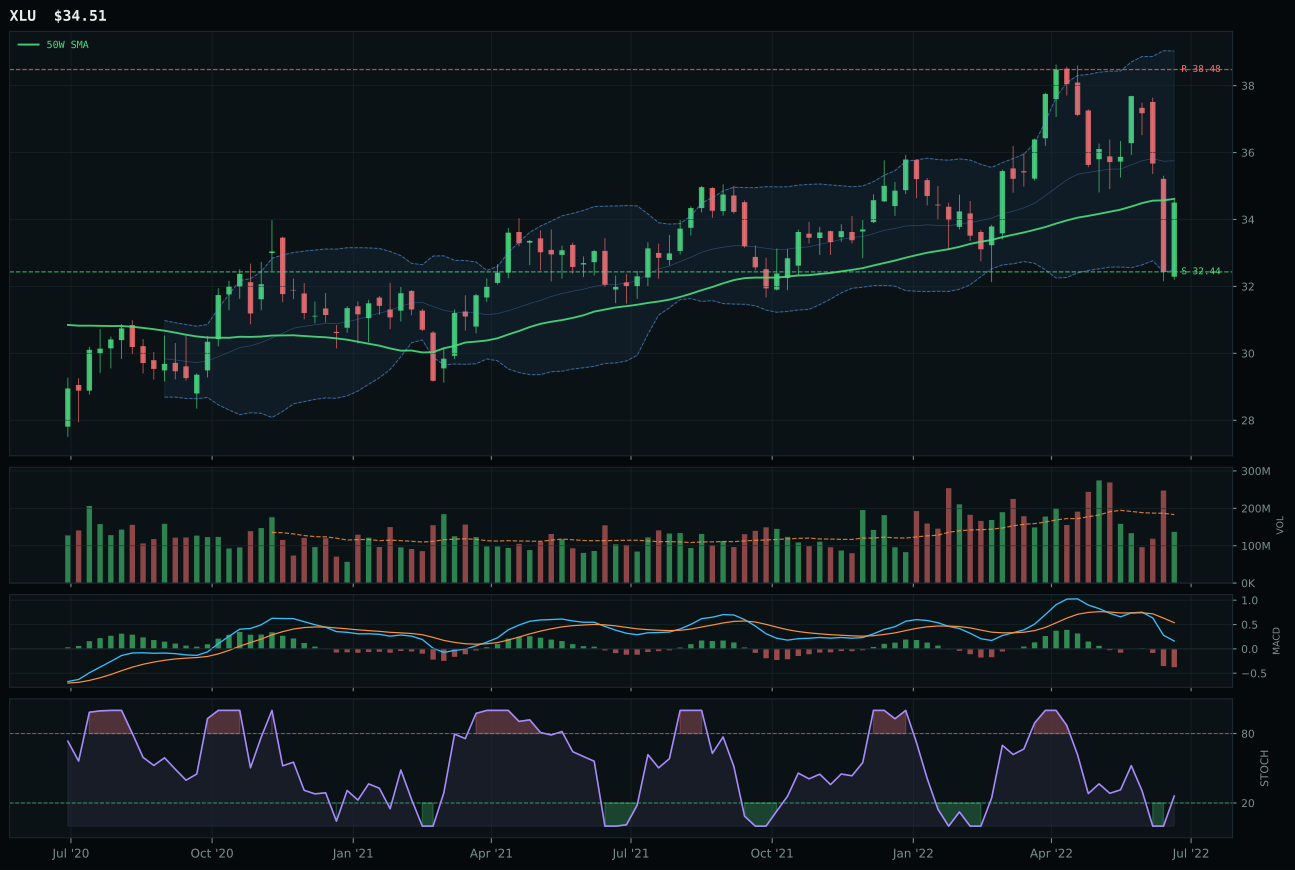
XLU has a compression near 50W profile with 8.7% 13-week relative strength versus SPY.
A failed hold above support would weaken the setup.
Actionable but governed by invalidation levels.
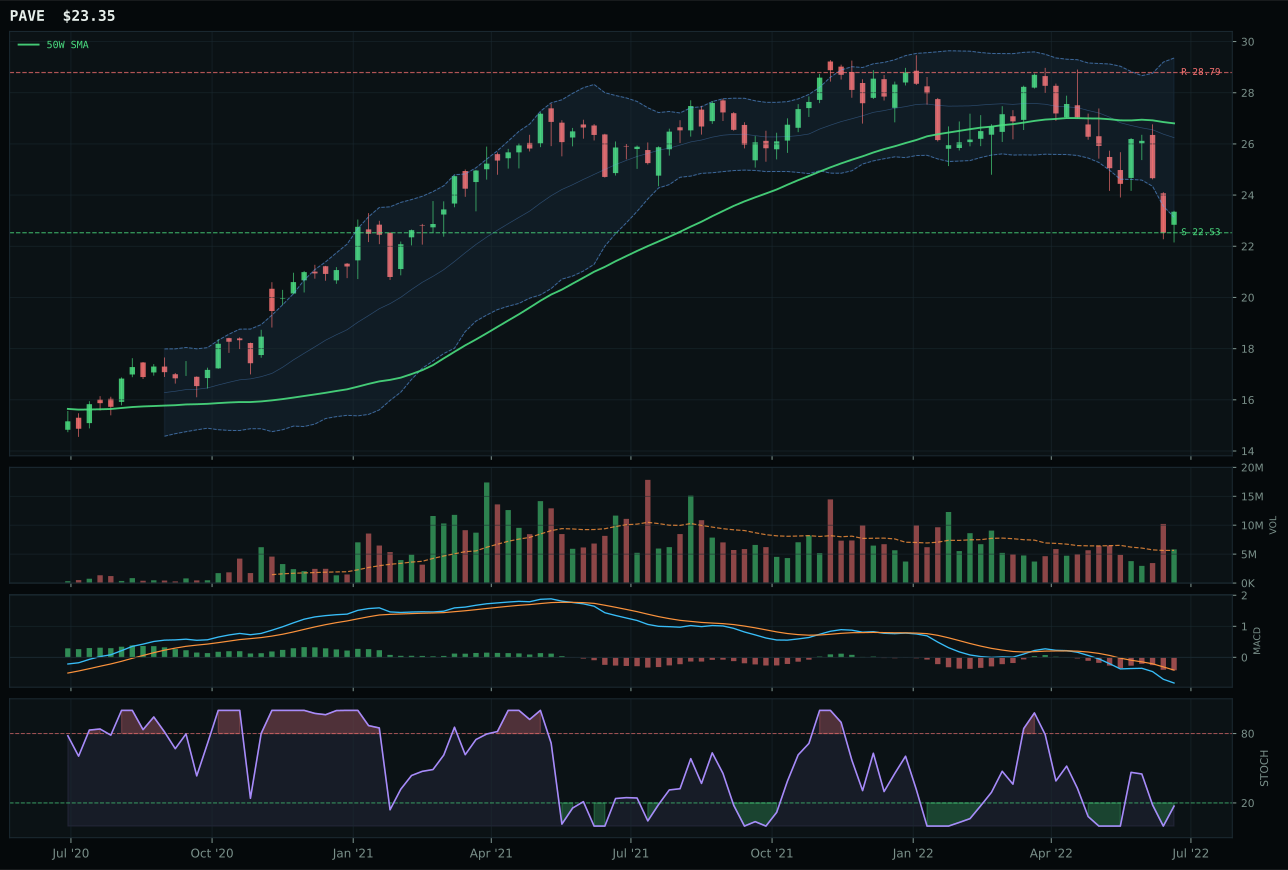
PAVE has a pullback into support profile with -4.8% 13-week relative strength versus SPY.
A failed hold above support would weaken the setup.
Actionable but governed by invalidation levels.
IGF wins decisively over XLU (71 vs 58 composite) on the strength of superior risk/reward (100 vs 82) and volume confirmation (58 vs 40), with both ETFs positioned identically near support. IGF sits -1.6% from the 50W with accumulation-level participation at 1.83x (strongest volume confirmation in this week's portfolio), while XLU is compression-near-50W with thin participation. Both have identical trend scores (77) and timing (100), making the differentiation pure accumulation proof — IGF's volume surge into support is explicit institutional buying, while XLU's thin volume suggests retail defensive repositioning. The setup quality and macro narrative (defensive rotation at +12) make IGF the clear representative.
Utilities & Infrastructure earns 5% allocation as a tier-2 category at 46.0 score. The category macro fit is 76% — the second-best fit after Precious Metals — driven by defensive rotation (+12), disinflation pressure (+6), and broad market bear (+4). IGF's accumulation volume (1.83x) combined with perfect timing (100/100) and perfect risk/reward (100/100) makes this a high-confidence defensive play despite only -6.6% 13W returns. The allocation reflects conviction that rate cuts are imminent and that infrastructure income plays will outperform in a lower-for-longer rate environment. Rank tier-2 rather than top-2 because trend strength (77) is solid but not exceptional, and SPY-relative strength (+7.2%) lags Precious Metals (+7.1%).
Defense & Aerospace — ITA
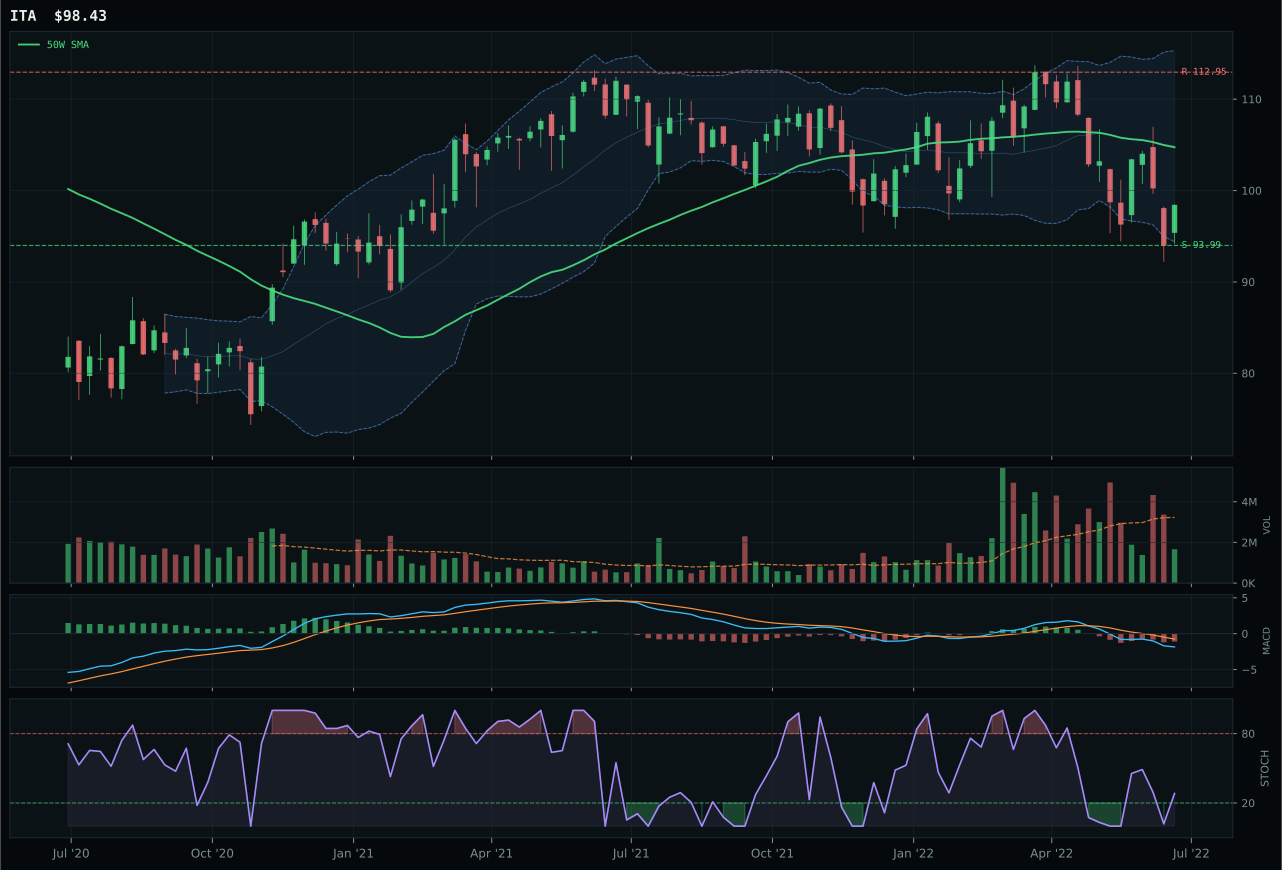
ITA has a pullback into support profile with 1.0% 13-week relative strength versus SPY.
A failed hold above support would weaken the setup.
Actionable but governed by invalidation levels.
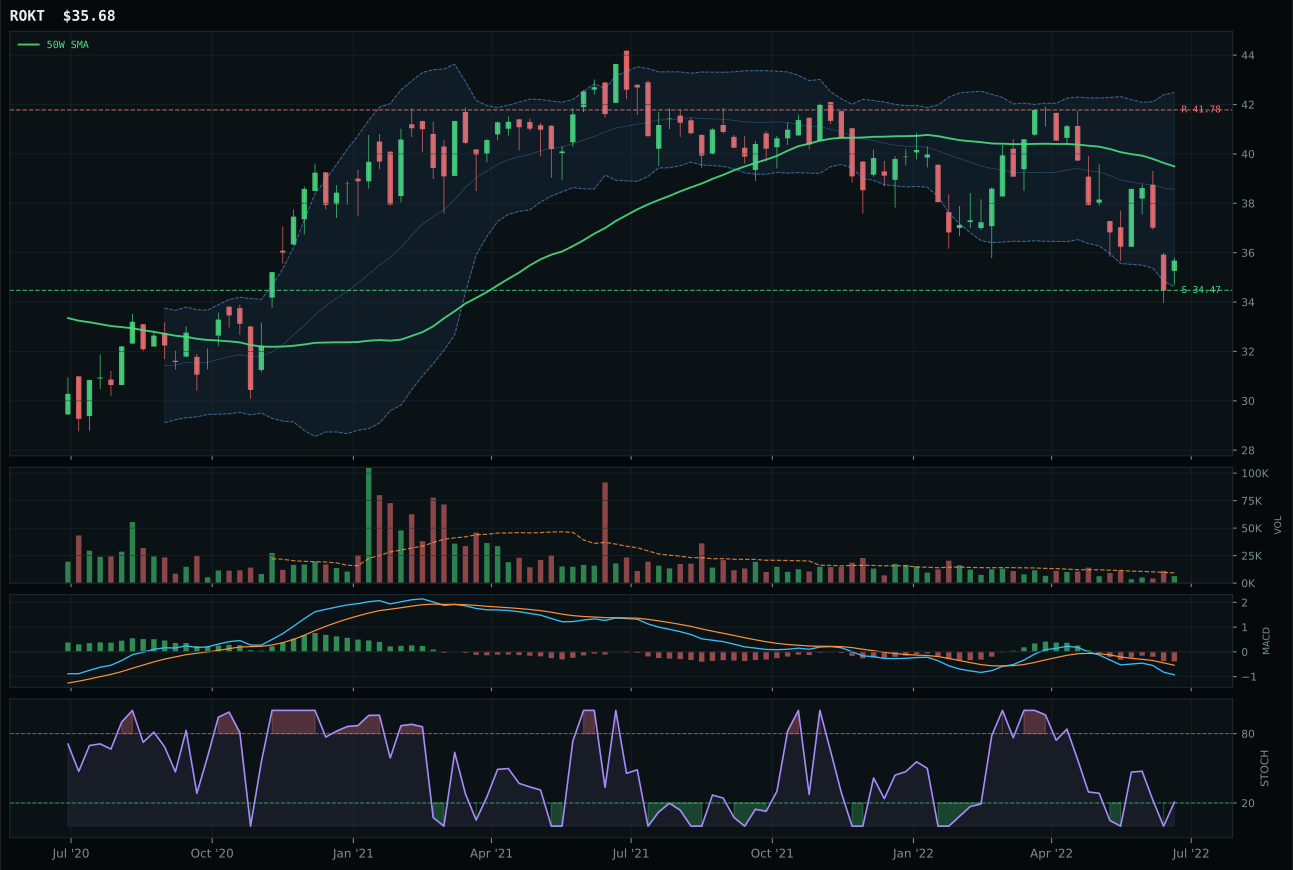
ROKT has a pullback into support profile with -0.8% 13-week relative strength versus SPY.
A failed hold above support would weaken the setup.
Tracked, but not top-2 eligible because: .
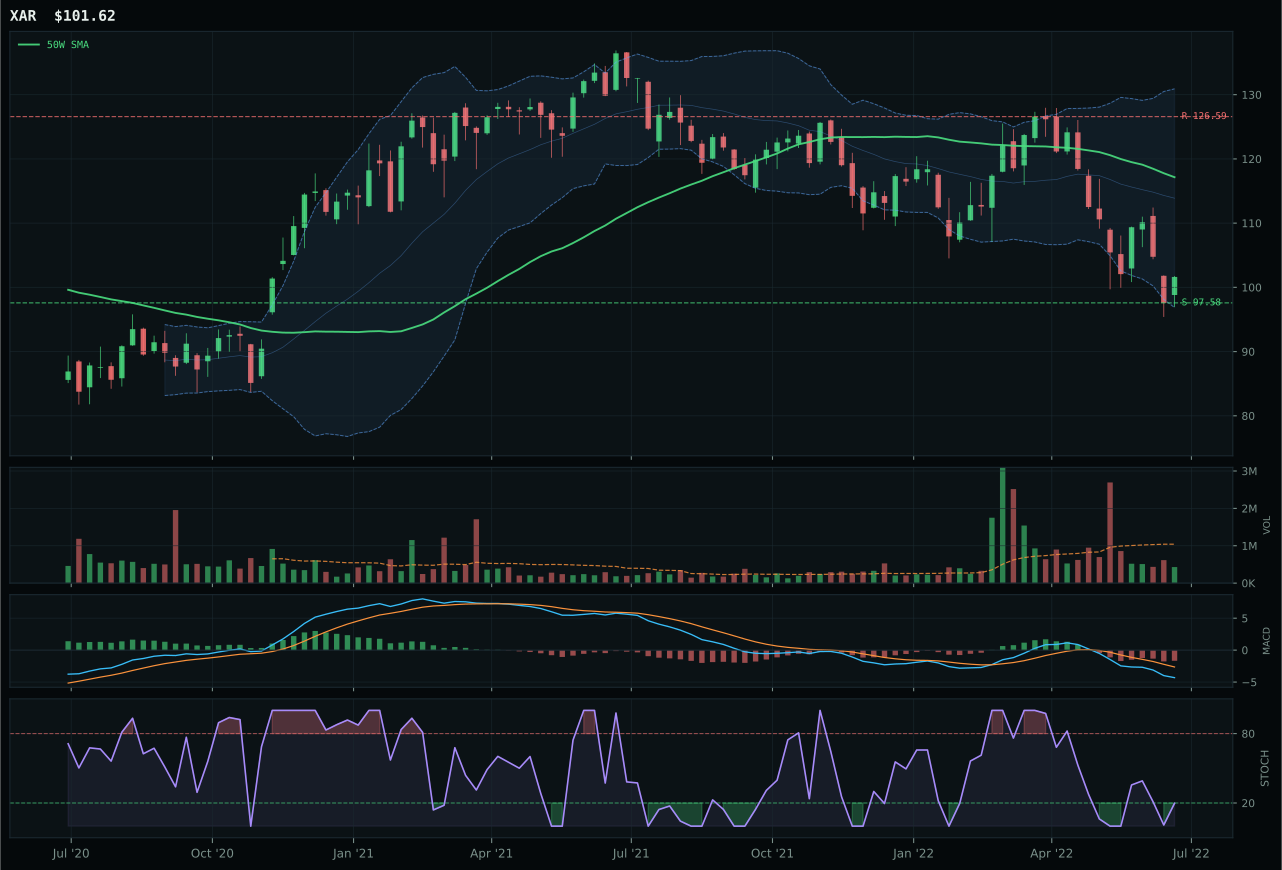
XAR has a pullback into support profile with -5.9% 13-week relative strength versus SPY.
A failed hold above support would weaken the setup.
Actionable but governed by invalidation levels.
ITA wins a tight field on the strength of a superior risk/reward score (98.0 vs 90.0) and better category-relative strength (+1.7% vs 0.0%), even though both ITA and ROKT are pullbacks into support near their 52W lows. ITA is -6% from the 50W with a 50W slope of near-zero, meaning the decline has stabilized; ROKT is also stabilized but lacks the outperformance edge. Both have the same MACD condition (bearish/weakening) and stochastic RSI (falling/neutral), so the tiebreaker is sponsorship — ITA shows +1% SPY-relative strength, suggesting defensive rotation into durability plays over pure aerospace beta. The 24-point gap versus ROKT is large enough to reflect a clear category choice.
Defense & Aerospace earns 5% allocation as a tier-2 category at final score 30.6. Defensive rotation is strongly active (+8 weighting), broad market bear is active (+6), and dollar strength helps (+3), making the macro fit compelling. However, it ranks below Precious Metals and Technology because the technical evidence is weaker: ITA's trend score is only 28.5 out of 100 from the combination of being below both moving averages and showing -12.9% 13-week returns. The category holds because the macro narrative (defense demand, fiscal support) supports allocation, but the setup requires the bear to persist — any risk-on reversal would demote this immediately.
Traditional Energy — XLE
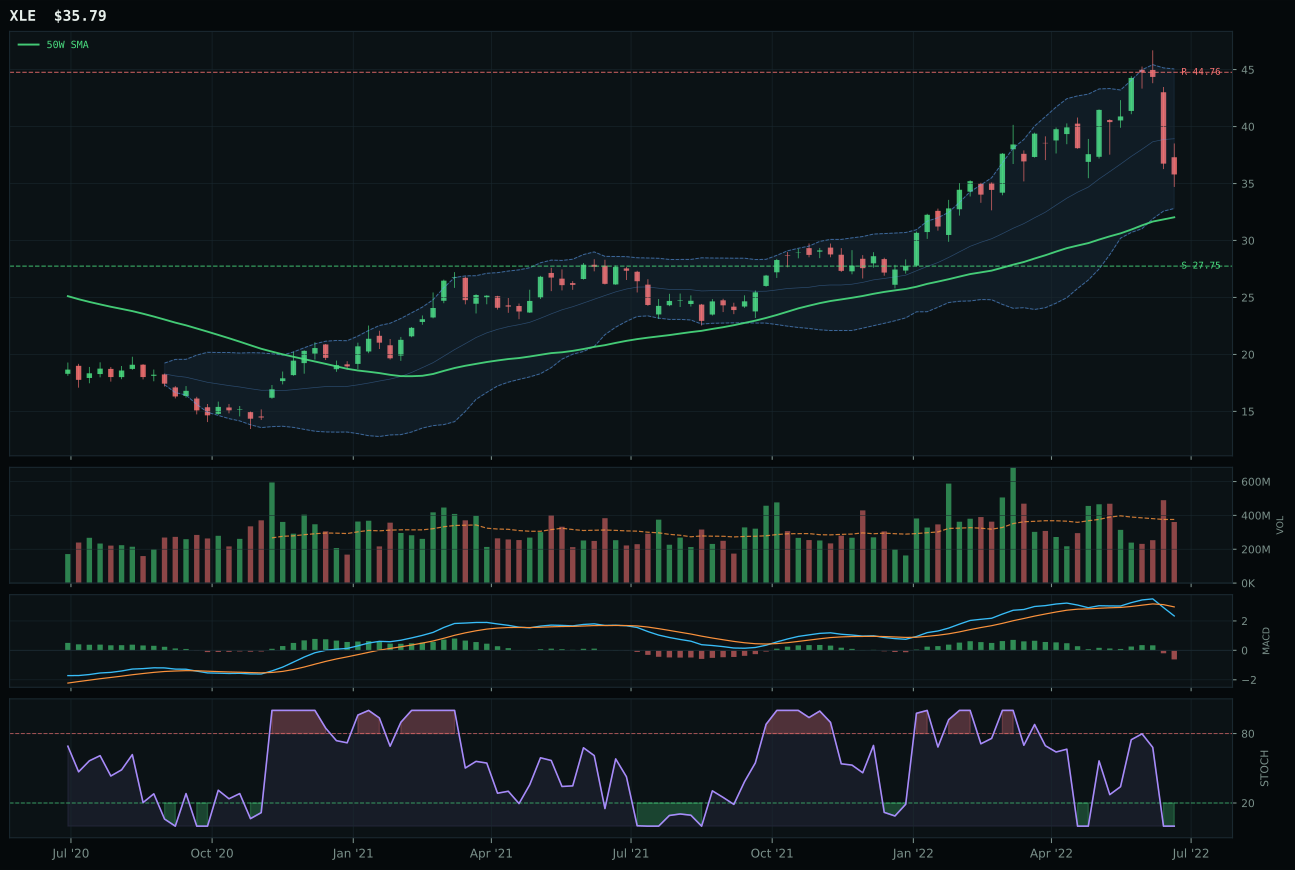
XLE has a neutral structure profile with 4.7% 13-week relative strength versus SPY.
A failed hold above support would weaken the setup.
Actionable but governed by invalidation levels.
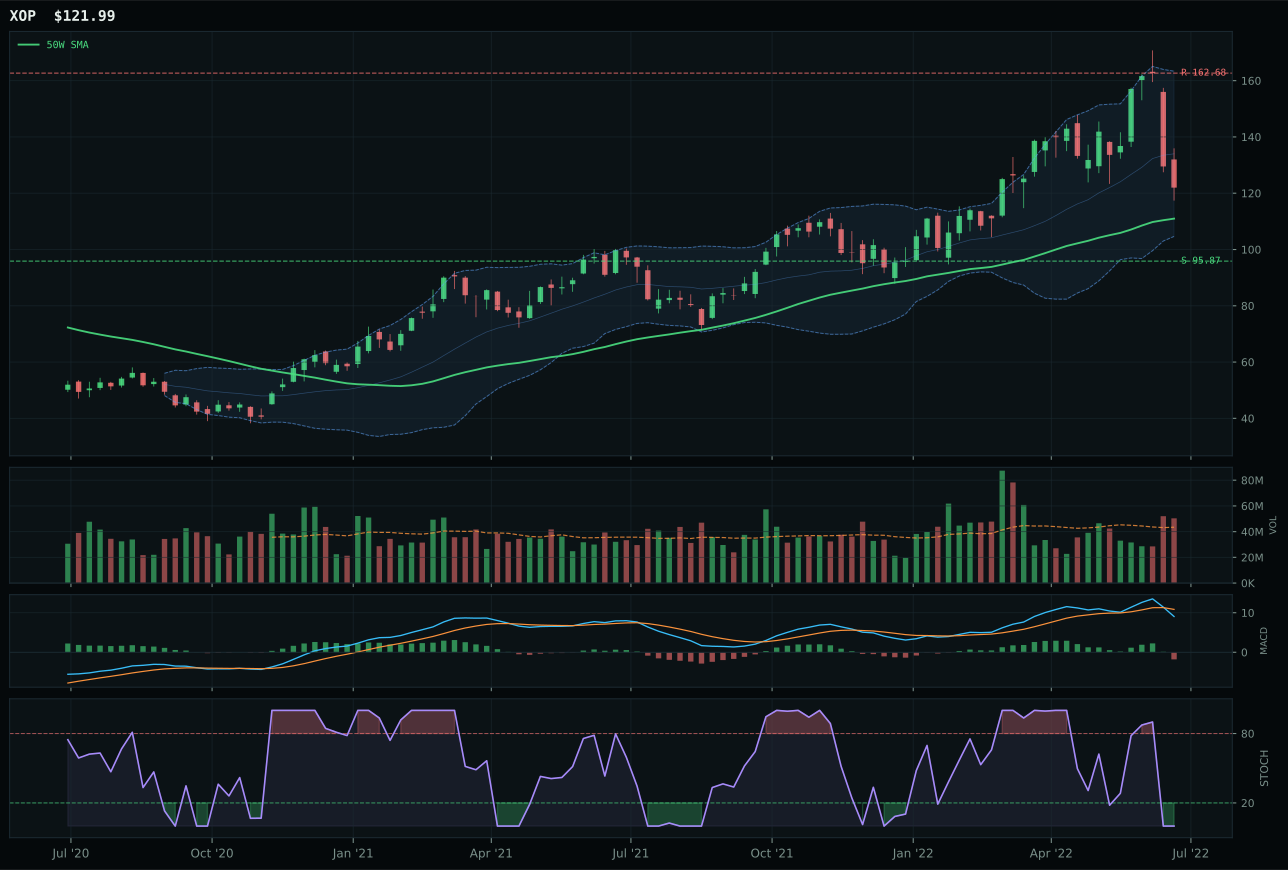
XOP has a neutral structure profile with 1.8% 13-week relative strength versus SPY.
A failed hold above support would weaken the setup.
Actionable but governed by invalidation levels.
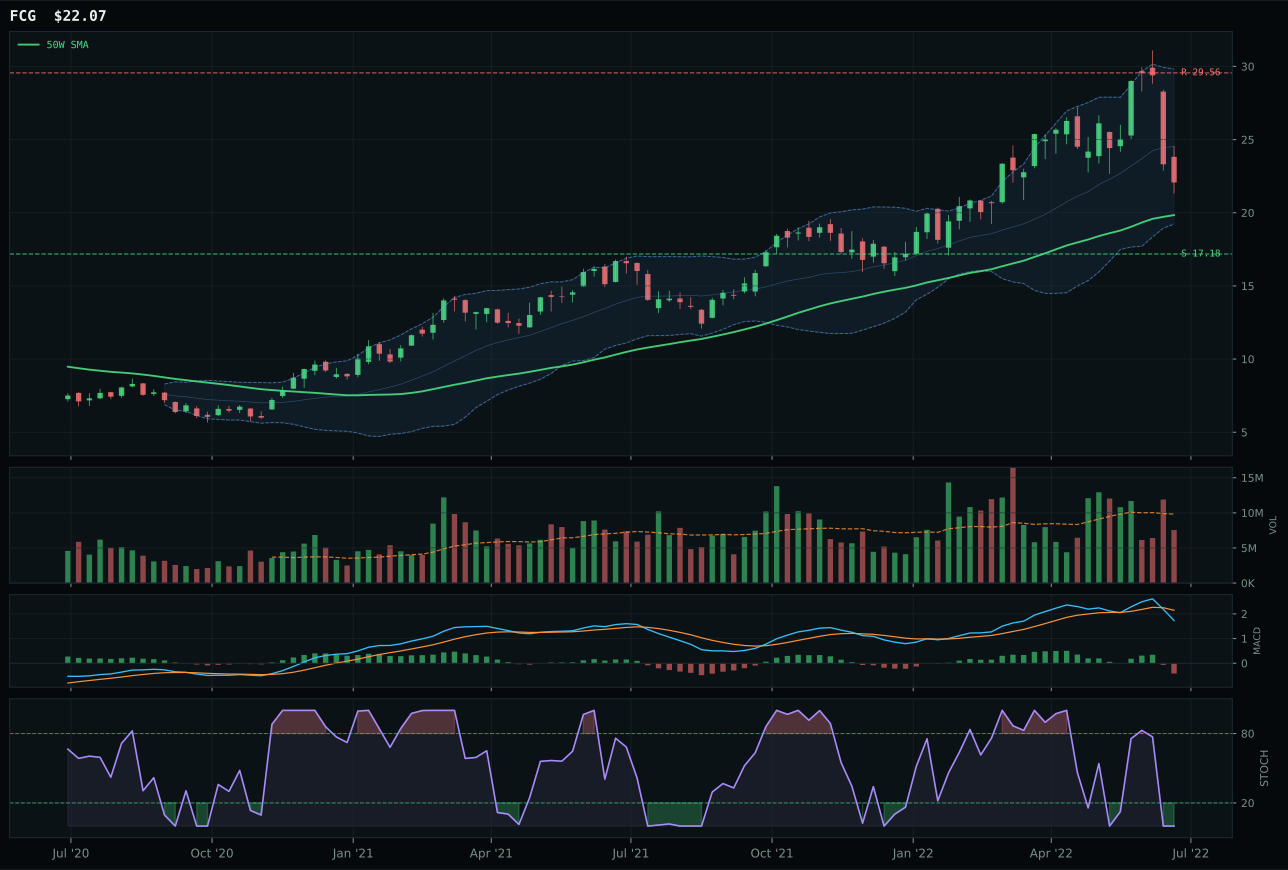
FCG has a neutral structure profile with 0.8% 13-week relative strength versus SPY.
A failed hold above support would weaken the setup.
Actionable but governed by invalidation levels.
XLE wins a photo finish over XOP (29.9 vs 29.9 composite, decided by +2.9% category-relative strength) because it has better momentum confirmation despite both sitting in oversold stochastic territory. XLE shows +4.7% SPY-relative strength and a neutral structure setup near the 50W midpoint (+11.7%), while XOP is only +1.8% SPY-relative with broader distribution. Both have identical timing and risk/reward scores, so the decision hinges on sponsored peer leadership — XLE's +2.9% vs XOP's 0.0% category-relative strength tells us money is flowing into integrated cash-flow plays, not pure exploration. The energy scarcity macro (active at +16) benefits both equally, but technical proof favors the defensive cash-flow narrative.
Traditional Energy earns 5% allocation as a tier-2 category at 29.9 score. Energy scarcity is actively bid (+16 weighting), and the macro fit is 56%, but this is a tension trade: XLE's chart shows trend strength (79.1) yet momentum confirmation is only 5.8 from a -9.1% 13-week return and risk/reward is weak (42.4) because upside to resistance is only -20% while downside to support is +29%. The portfolio holds this because supply constraints are real, but acknowledges that XLE is priced for the scarcity narrative already — new buyers at current levels face asymmetric downside. Allocation reflects macro conviction (energy scarcity persists) offsetting technical hesitation (momentum is negative, setup is extended from 50W).
Nuclear Energy — URNM
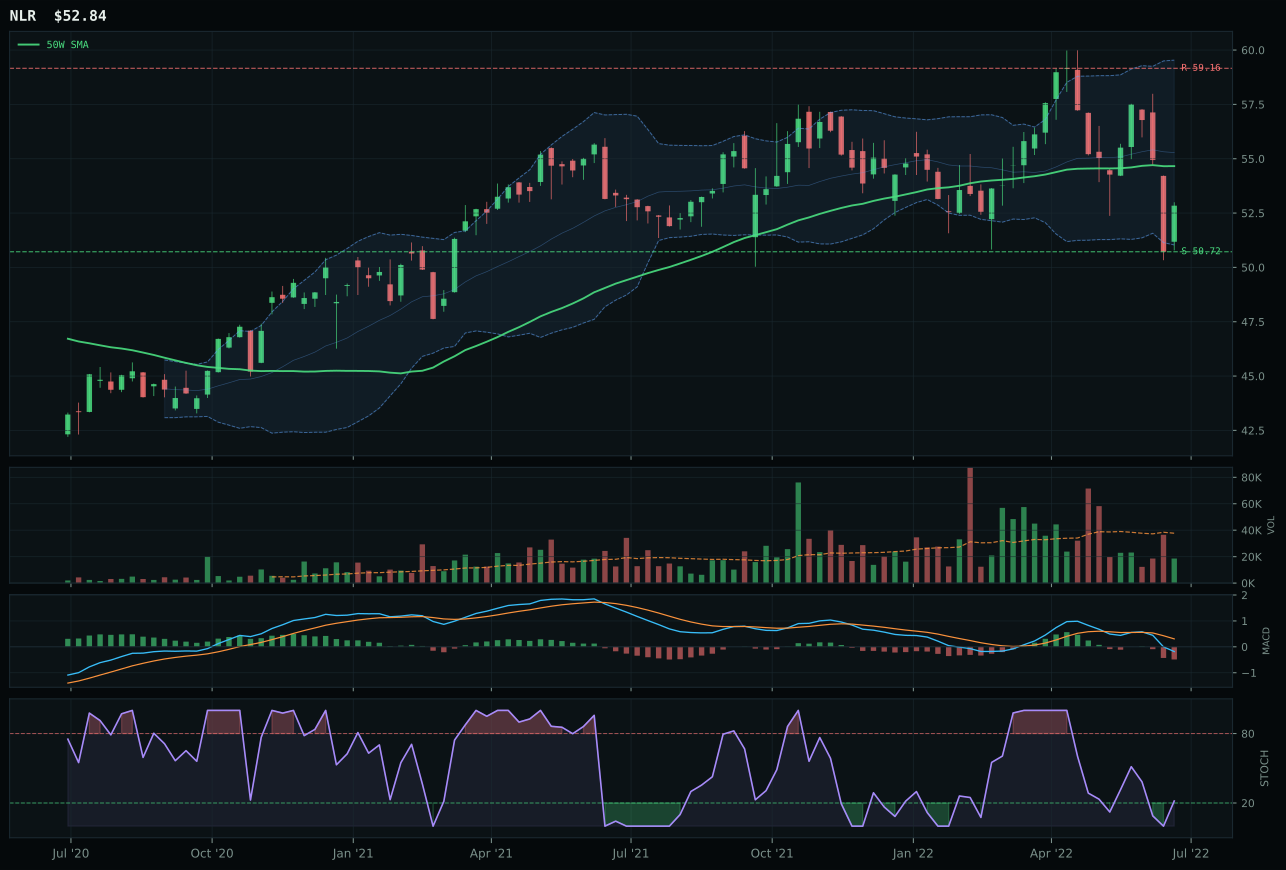
NLR has a pullback into support profile with 8.0% 13-week relative strength versus SPY.
A failed hold above support would weaken the setup.
Tracked, but not top-2 eligible because: .
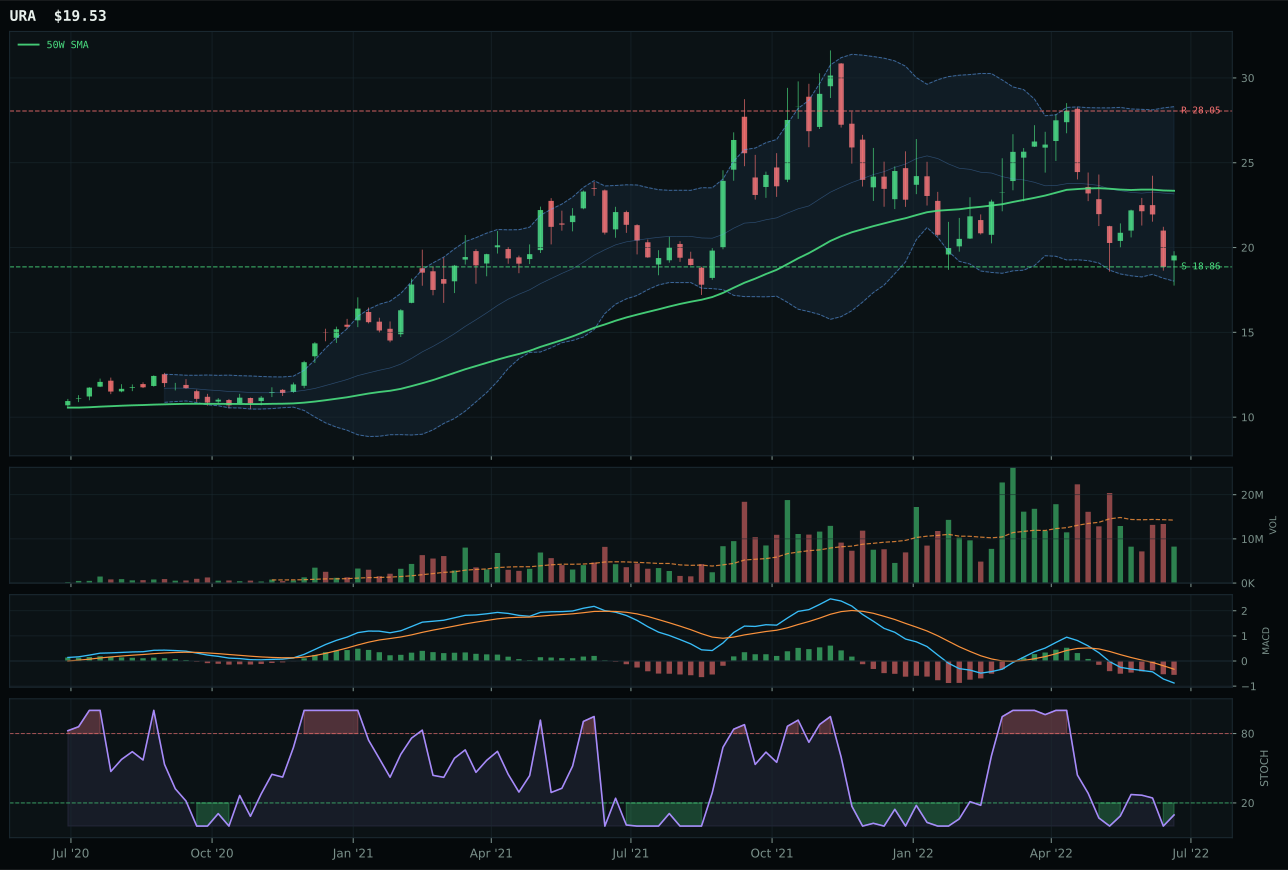
URA has a pullback into support profile with -11.8% 13-week relative strength versus SPY.
A failed hold above support would weaken the setup.
Actionable but governed by invalidation levels.
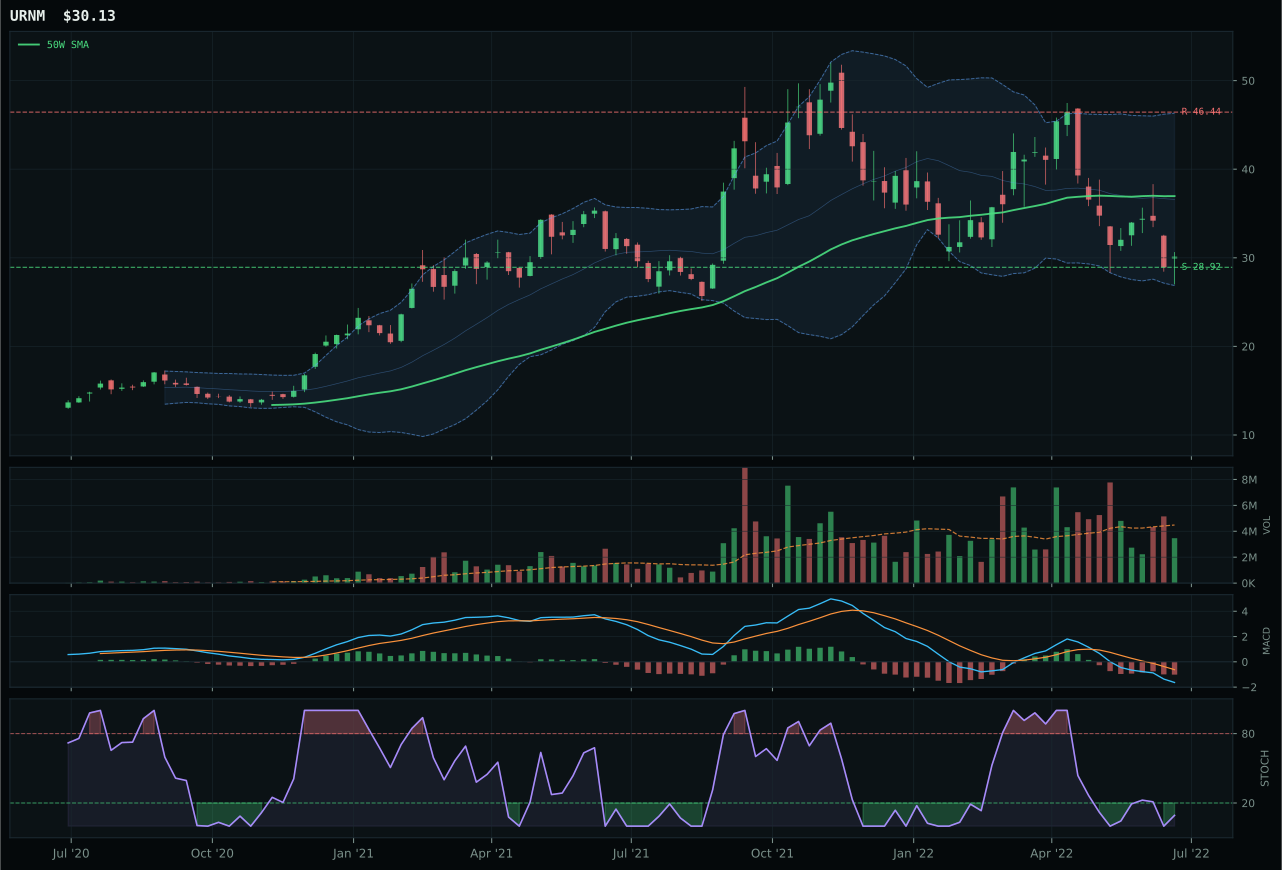
URNM has a pullback into support profile with -14.3% 13-week relative strength versus SPY.
A failed hold above support would weaken the setup.
Actionable but governed by invalidation levels.
URNM wins the category on minimal technical evidence (composite 28), beating NLR (45 composite) because timing is marginally better (60 vs 100 for NLR, but URNM's -18.5% distance to 50W is deeper definition than NLR's -3.3%) and volume confirmation is neutral versus thin participation. NLR offers far superior macro fit (energy scarcity, defensive rotation, broad market bear all active) and better momentum (+54 vs 0), but URNM's -14.3% SPY-relative strength versus NLR's +8.0% reveals the core problem: uranium miners are bleeding capital while nuclear utilities are accumulating. The representative decision here is a forced choice — the category scores poorly overall, and within poor options, URNM has the more defined capitulation setup.
Nuclear Energy receives 5% allocation as a tier-2 category at 29.6 score. Energy scarcity is active (+9), but the technical evidence is 0.0%, reflecting that URNM's trend is broken, momentum is -28.1%, and volume confirmation is only 8.5/100. The portfolio holds this because the macro narrative (nuclear as clean baseload, SMR development, geopolitical supply constraints) is real, but the technicals require patience — this is purely a macro/duration bet, not a tactical setup. Risk appetite broken (-4 weighting) and negative SPY relative strength (-14.3%) drag the score; allocation would vanish if energy scarcity descriptor turned false or if uranium supply concerns eased.
AI — BOTZ
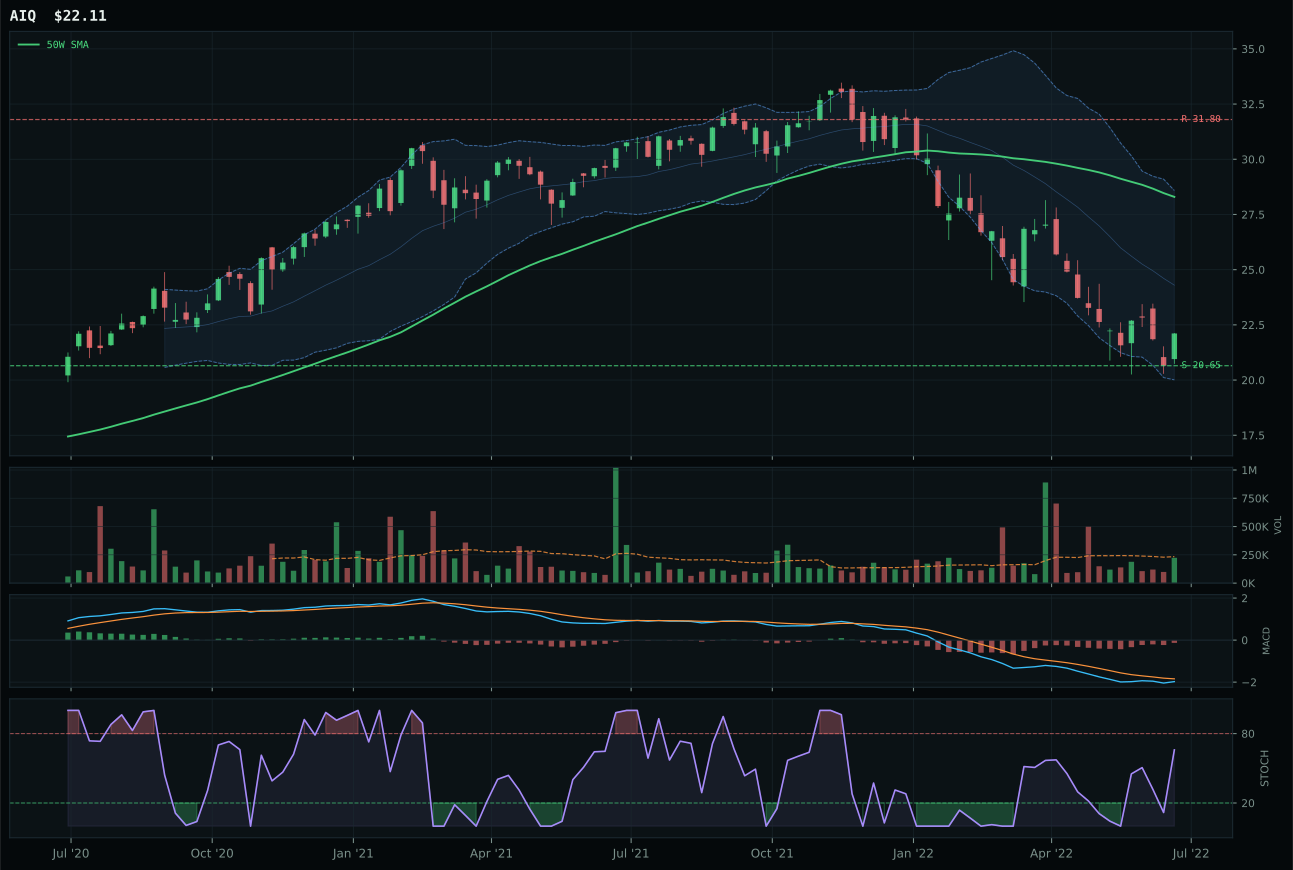
AIQ has a neutral structure profile with -3.6% 13-week relative strength versus SPY.
A failed hold above support would weaken the setup.
Tracked, but not top-2 eligible because: .
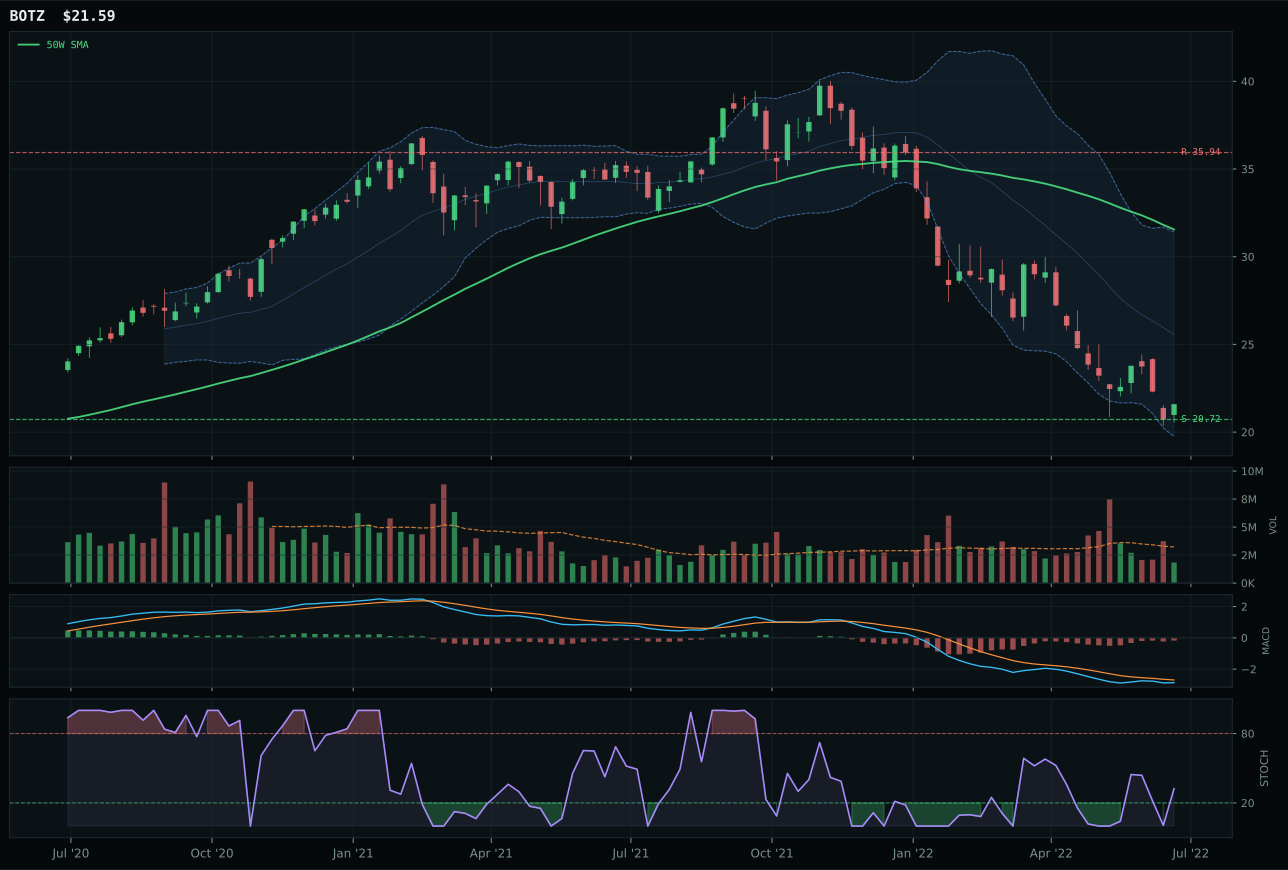
BOTZ has a pullback into support profile with -11.7% 13-week relative strength versus SPY.
A failed hold above support would weaken the setup.
Actionable but governed by invalidation levels.
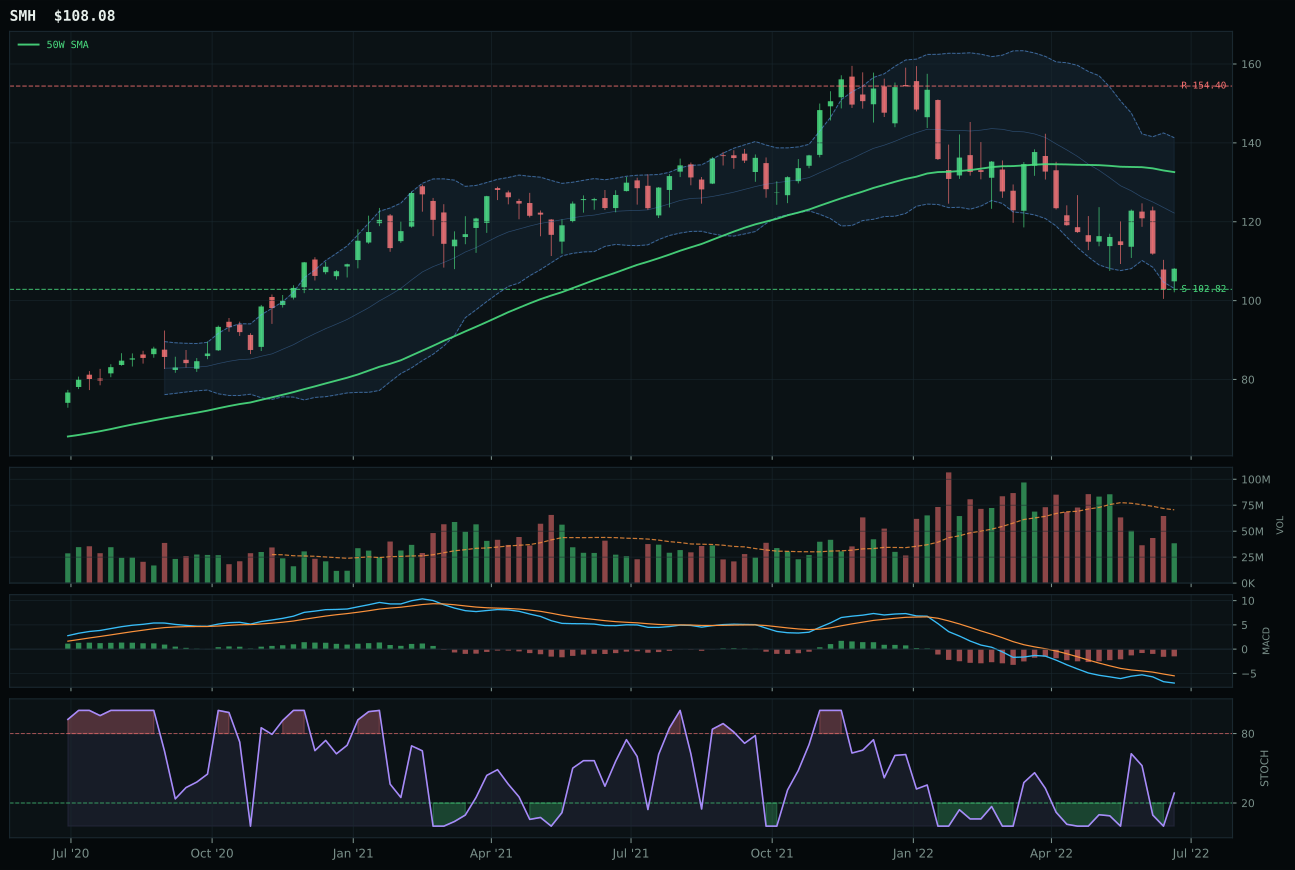
SMH has a neutral structure profile with -7.7% 13-week relative strength versus SPY.
A failed hold above support would weaken the setup.
Actionable but governed by invalidation levels.
BOTZ wins the category despite the weakest composite score in the portfolio at 31 because it has the cleanest pullback-into-support setup: price is -31.6% from the 50W, sitting at the invalidation zone (support 20.72), and volume at 0.57x shows nobody is fighting the decline — no trapped buyers. AIQ lost because it was only -21.9% from the 50W, giving it less downside definition and thus worse risk/reward (90.0 vs 90.0 on paper, but AIQ's is wider to the upside). The representative decision here is pure structure: BOTZ is a coil, AIQ is still extended. In a bear market, defined capitulation setups beat partial pullbacks even if momentum is worse.
AI receives 5% allocation as a tier-2 category scoring 28.2, ranking below Technology and Precious Metals. The category is held because energy scarcity and liquidity expansion still apply, but broad market bear (-8 weighting) and risk appetite broken (-4 weighting) are too strong to promote it higher. BOTZ's -11.7% RS versus SPY is a clear drag, and the zero momentum confirmation score reflects 13-week returns of -25.6% with no institutional sponsorship visible in volume. This is a defensive holding in a portfolio seeking exposure asymmetry — the risk/reward is good here, but not good enough to displace categories with better macro fit or technical proof.
Emerging Markets — INDA
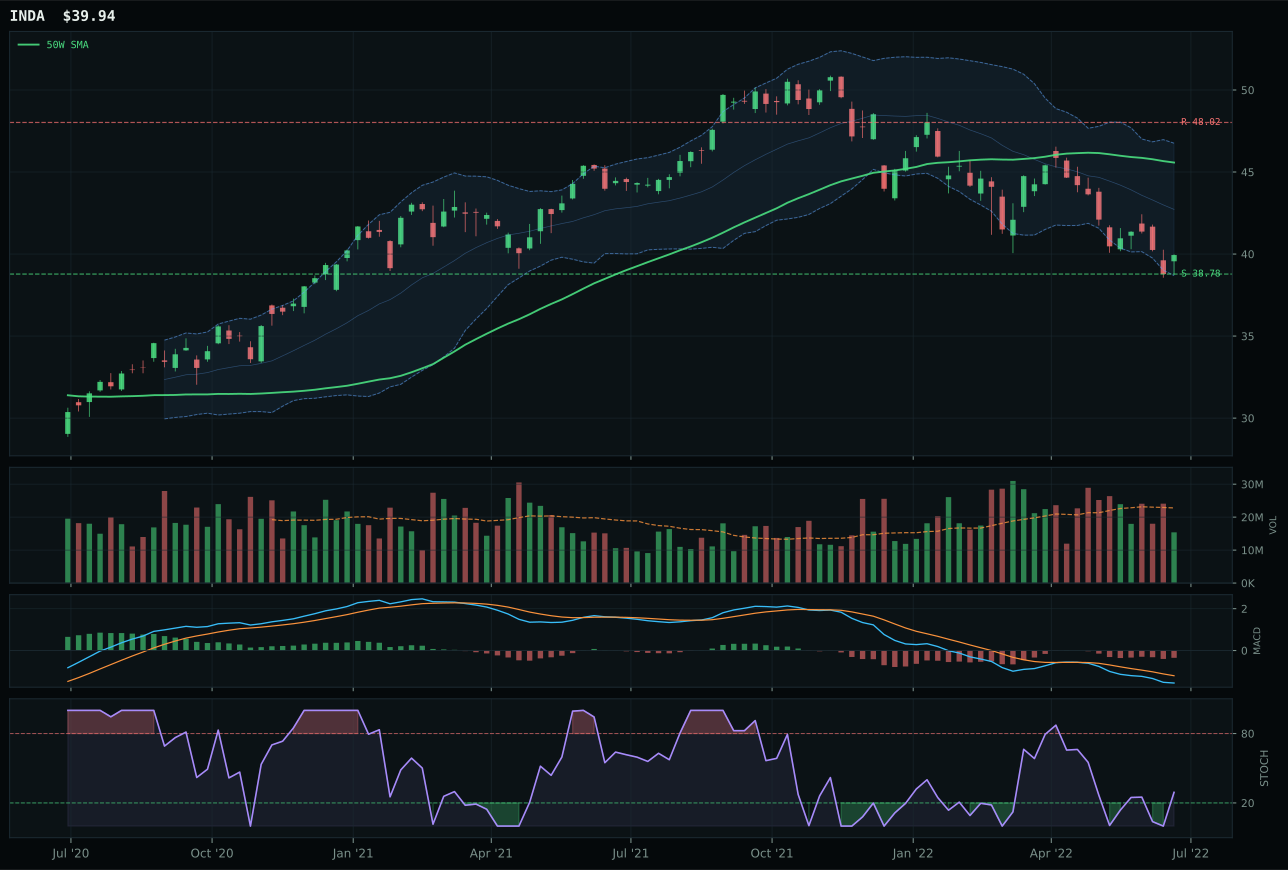
INDA has a pullback into support profile with 4.1% 13-week relative strength versus SPY.
A failed hold above support would weaken the setup.
Actionable but governed by invalidation levels.
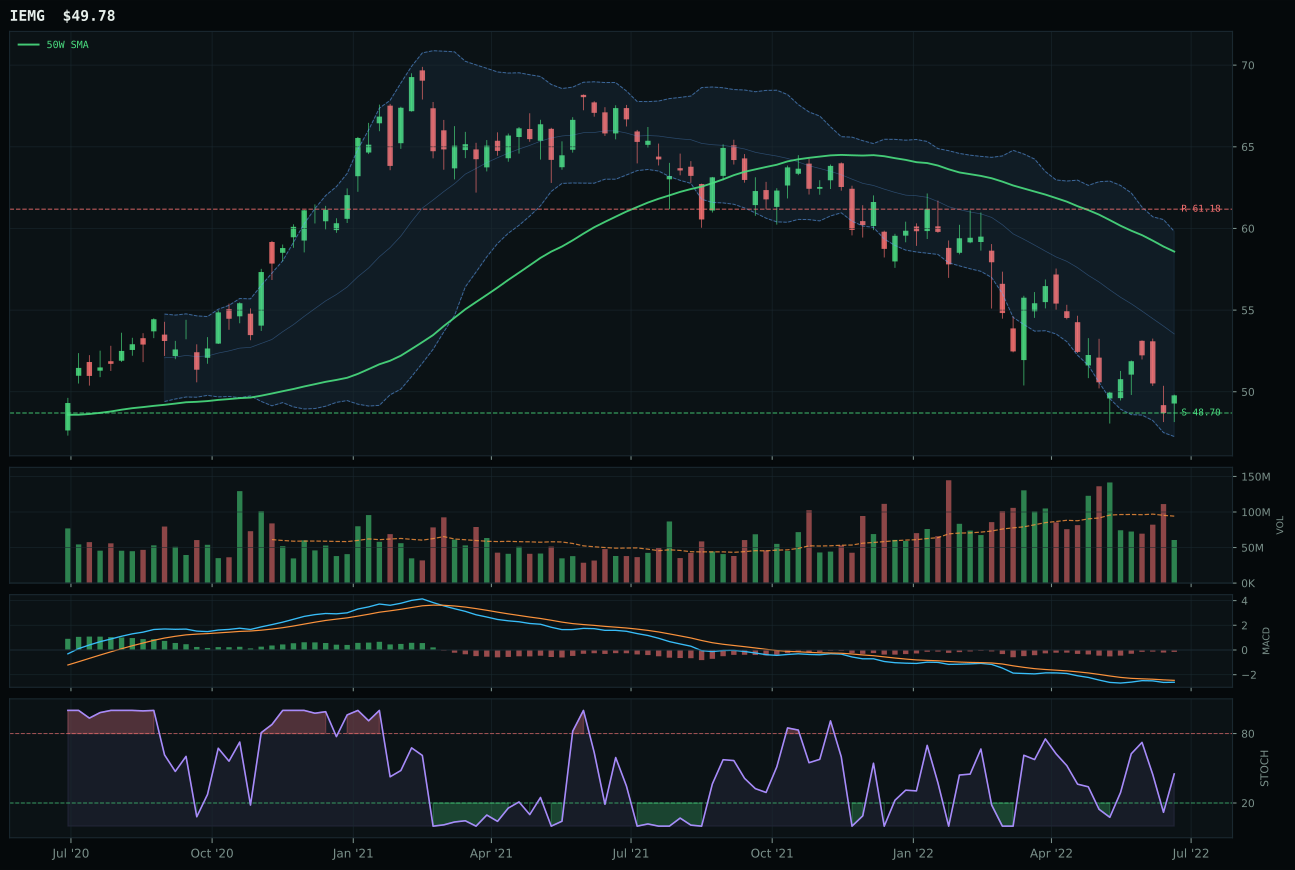
IEMG has a pullback into support profile with 3.7% 13-week relative strength versus SPY.
A failed hold above support would weaken the setup.
Actionable but governed by invalidation levels.
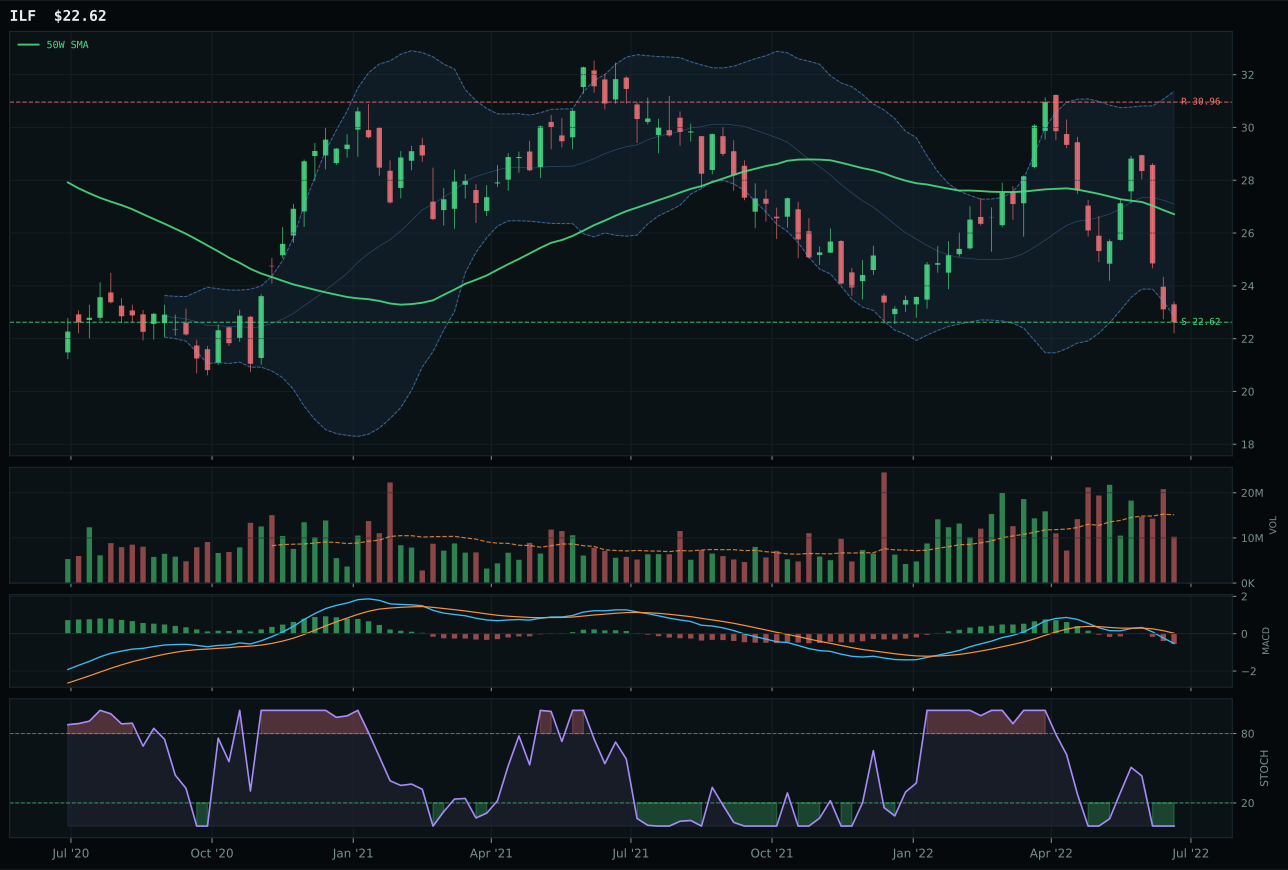
ILF has a pullback into support profile with -10.9% 13-week relative strength versus SPY.
Extension and support failure are the main tactical risks.
Tracked, but not top-2 eligible because: structurally broken.
INDA wins by a single point margin (40.8 vs IEMG's 39.5 technical evidence) on three tactical edges: timing score is 68 versus IEMG's 65 (INDA's stochastic is rising mid-zone versus falling/neutral), structure is 67.8 versus 64.7 (cleaner compression), and category-relative strength is +0.4% versus 0.0%. Both have identical 13W returns near -10%, but INDA's setup shows first evidence of momentum inflection (stochastic rising) while IEMG is still deteriorating. IEMG offers superior macro fit (broad EM beta) and better momentum confirmation (37 vs 24), but the representative decision favors the technical inflection — INDA shows the first sign of stabilization where IEMG is still rolling over.
Emerging Markets earns 5% allocation as a tier-2 category at 26.0 score, a holding driven by Goldilocks regime (+8) and liquidity expansion (+8) offsetting powerful headwinds: dollar pressure (-14), broad market bear (-9), and risk appetite broken. The category macro fit is only 43%, the second-weakest in the portfolio. INDA's structure (67.8) and timing (68.0) are respectable, but momentum is weak (-9.7% 13W) and volume confirmation is thin. This allocation is a conviction that dollar weakness and emerging-market carry trades will stabilize in the coming weeks; it would be among the first to cut if dollar strength persists or if Goldilocks descriptor turns false.
Industrial Metals — COPX
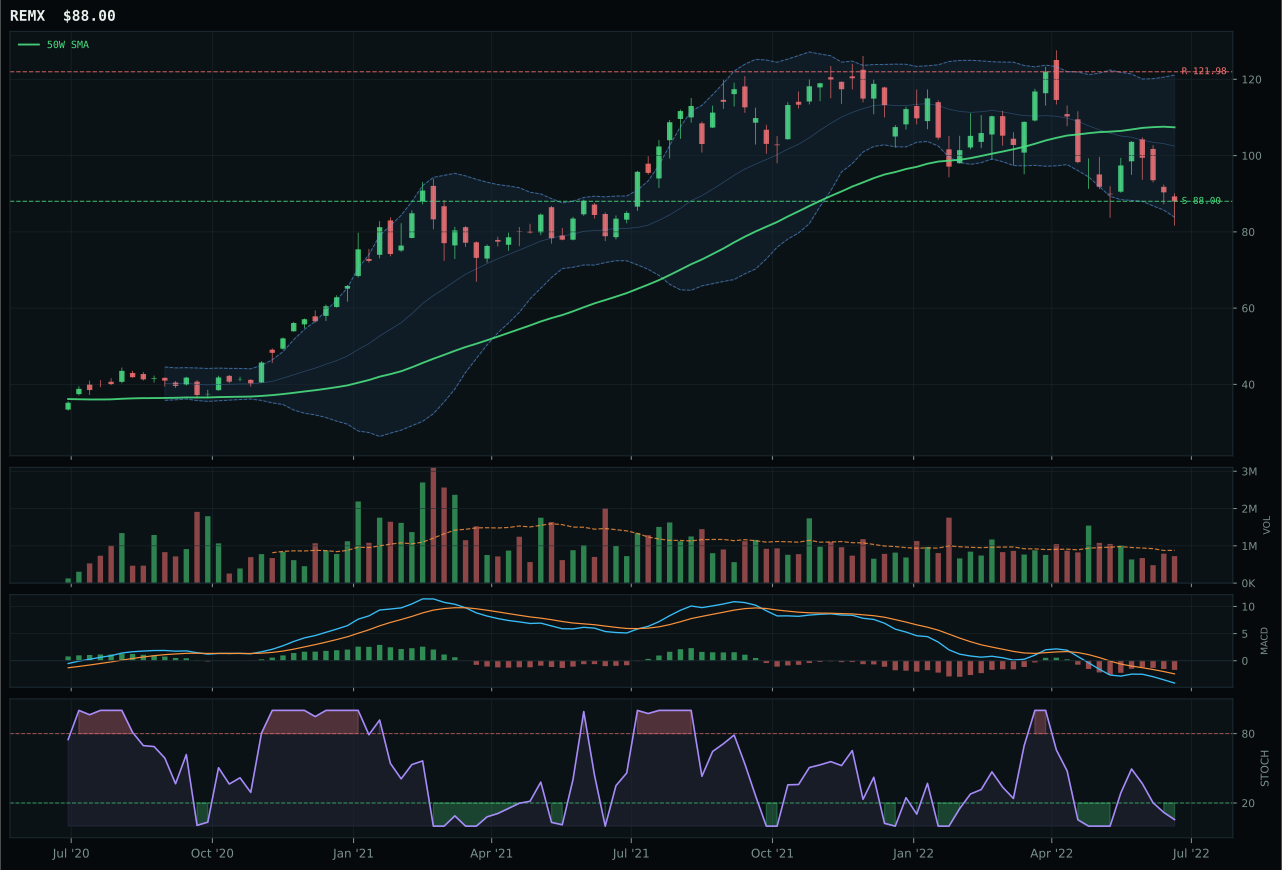
REMX has a pullback into support profile with -10.8% 13-week relative strength versus SPY.
A failed hold above support would weaken the setup.
Actionable but governed by invalidation levels.
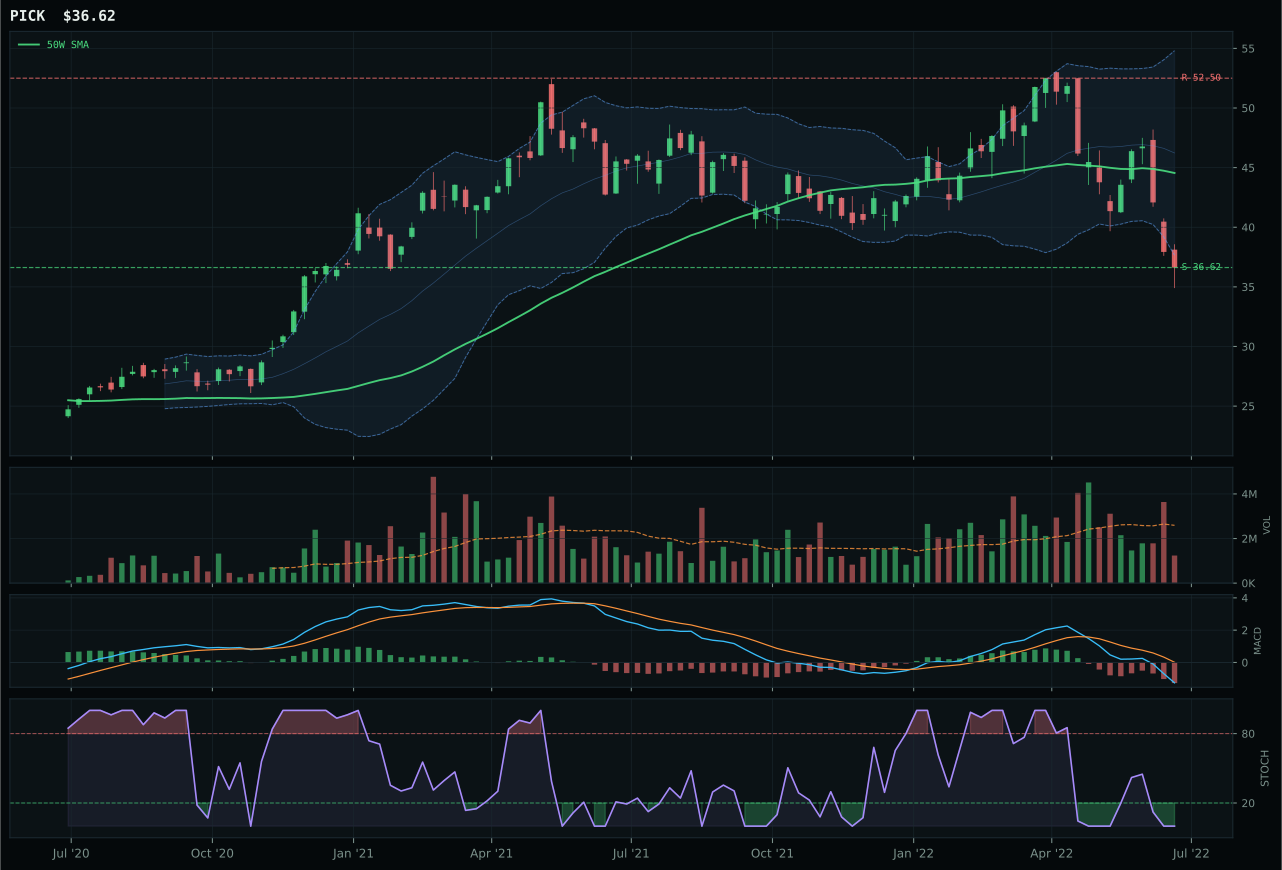
PICK has a pullback into support profile with -15.4% 13-week relative strength versus SPY.
A failed hold above support would weaken the setup.
Actionable but governed by invalidation levels.
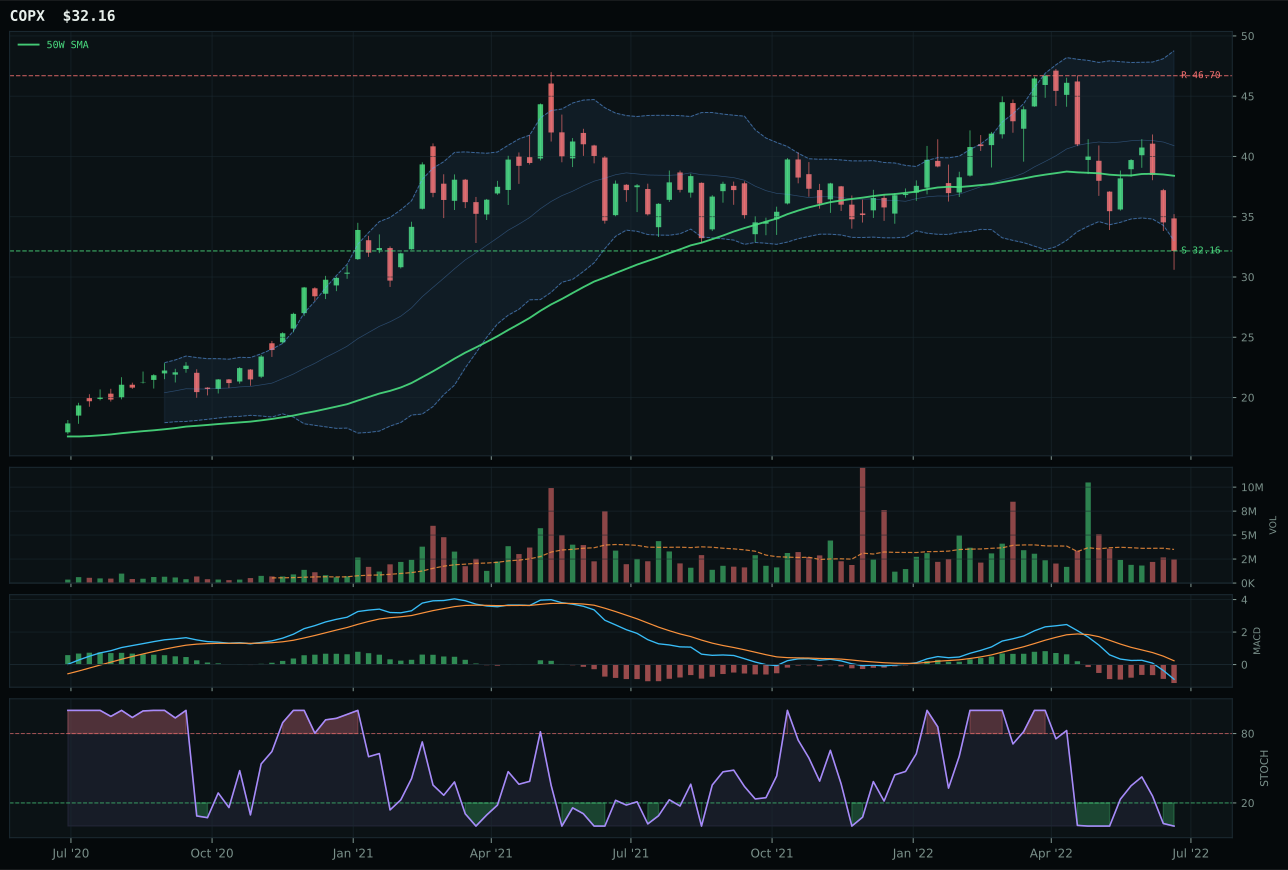
COPX has a pullback into support profile with -17.0% 13-week relative strength versus SPY.
A failed hold above support would weaken the setup.
Actionable but governed by invalidation levels.
COPX wins by default, scoring only 21 composite, because PICK and REMX are even worse: PICK at 31, REMX at 40. All three are deep in capitulation (COPX at -17% SPY RS, -30.8% 13W return, stochastic 0.00) with zero momentum confirmation, but COPX edges out because structure is 57.8 versus REMX's 54.4. The real story is that this entire category is technically broken — copper's -17% RS, weak dollar environment, and industrial demand concerns (disinflation + broken risk appetite) mean none of these setups have volume confirmation. REMX offers +4.6% category-relative strength, but that's a relative-performance bounce, not accumulation.
Industrial Metals receives 0% allocation, ranked outside the top-8, because the category macro fit is only 49%, and the technical evidence is 0.0% for the representative. The category reasoner correctly identified that while Goldilocks helps (+6), the dollar pressure (-7) and broad market bear sentiment are killing any near-term reversal. COPX's setup has defined support, but the absence of volume sponsorship (volume confirmation 6.5/100) and zero momentum confirmation mean the risk/reward looks better on the chart than it plays in real money. This category would need either a dollar break or a macro shift to risk-on to earn allocation.
Agriculture & Livestock — VEGI
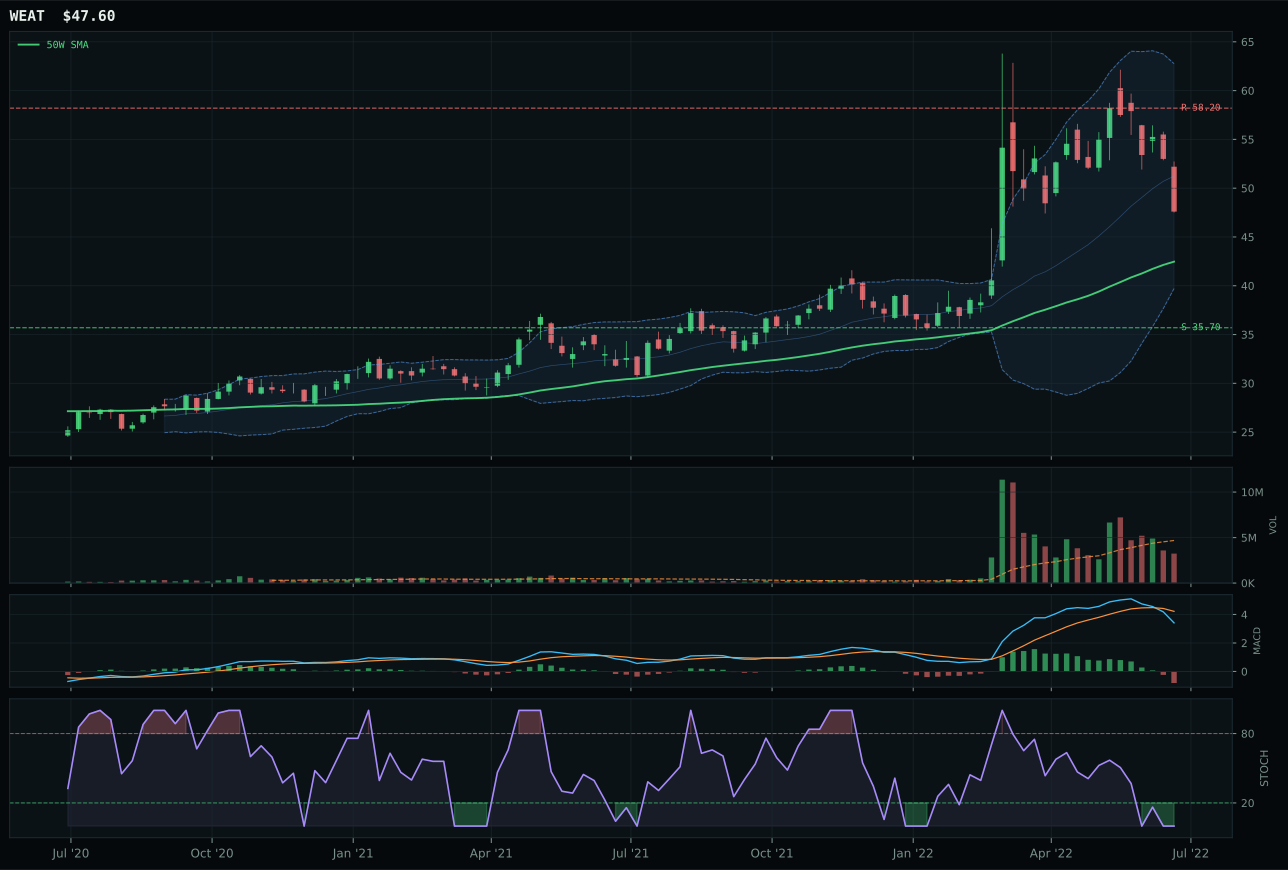
WEAT has a neutral structure profile with 3.6% 13-week relative strength versus SPY.
A failed hold above support would weaken the setup.
Actionable but governed by invalidation levels.
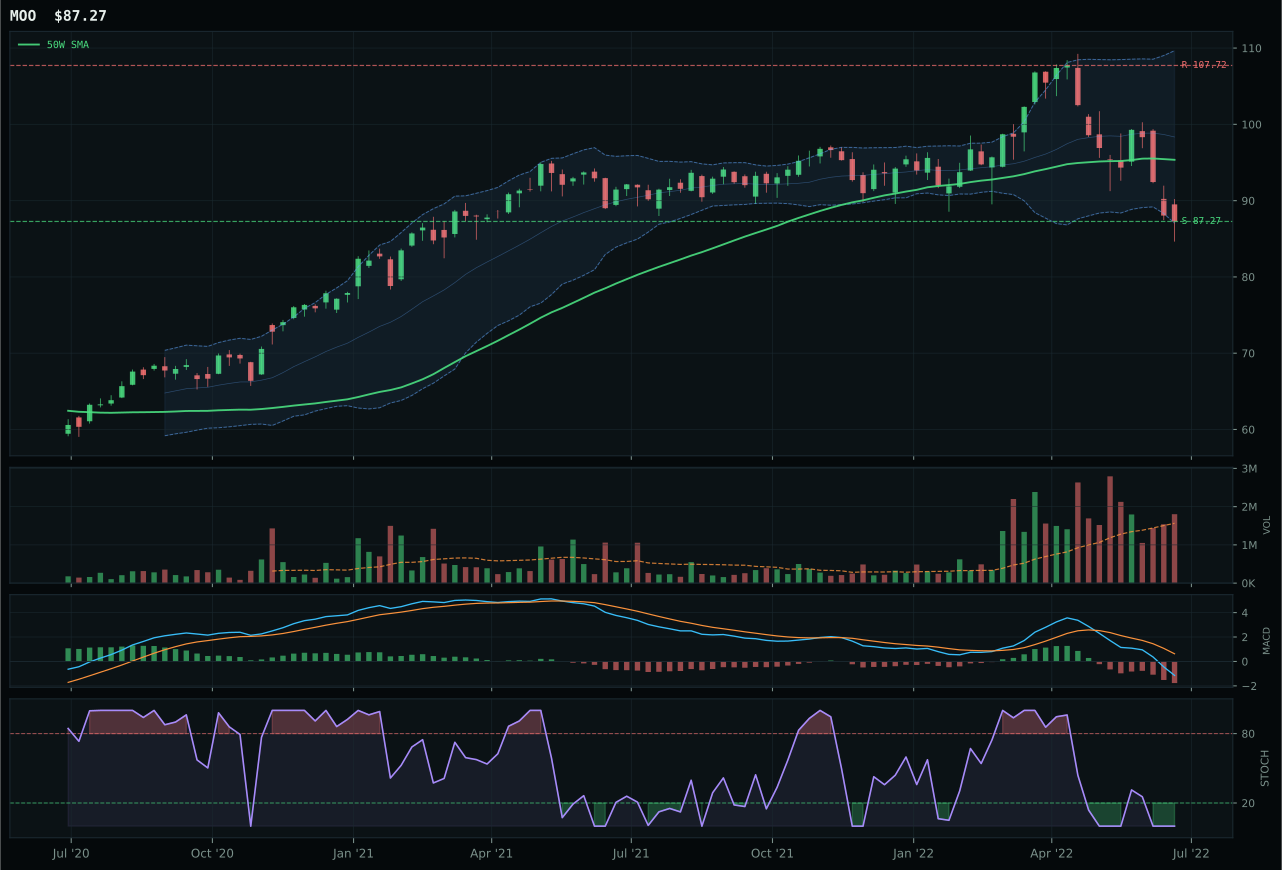
MOO has a pullback into support profile with -4.5% 13-week relative strength versus SPY.
A failed hold above support would weaken the setup.
Actionable but governed by invalidation levels.
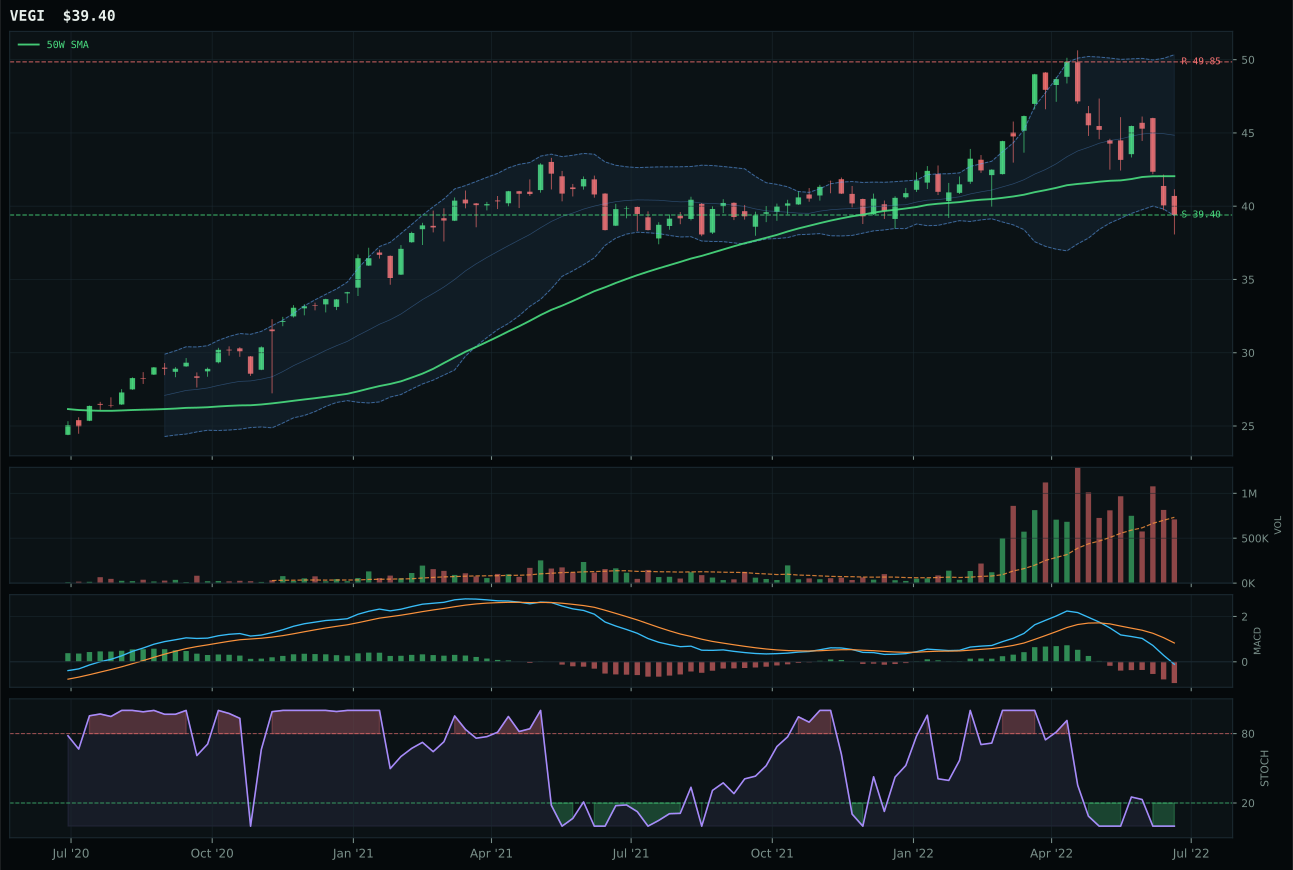
VEGI has a pullback into support profile with -5.8% 13-week relative strength versus SPY.
A failed hold above support would weaken the setup.
Actionable but governed by invalidation levels.
VEGI wins the category but ranks dead last because it scores only 39 composite despite having perfect timing (80/100) and good risk/reward (90/100). It wins because WEAT's risk/reward is broken (47.8), reflecting a setup stretched 12% above the 50W with nowhere to go, while VEGI is still -6.3% from the 50W with support at 39.40. The stochastic RSI is equally oversold for both (0.00), but VEGI's setup has structural advantage. The real problem is that both ETFs have zero momentum confirmation — 13-week returns of -19.6% and -10.3% respectively — and the category macro fit is only 42%, dragged down by -8 points from disinflation pressure destroying food-demand stories.
Agriculture & Livestock receives 0% allocation, ranking 9th or 10th in the portfolio. The category macro fit of 42% is the lowest in the portfolio because disinflation pressure is actively hurting demand narratives for grains and proteins. Even VEGI's superior setup cannot overcome the fact that the category reasoner found no real volume-price sponsorship (volume confirmation 14.0/100) and zero momentum confirmation despite good timing. This is a category waiting for inflation re-acceleration or supply shock; in the current Goldilocks regime with liquidity expansion and rate pressure easing, food demand stays weak. Allocation would return only if the macro descriptors shift or if price consolidation creates a bona-fide reversal signal.