
2022-06-17
Informational purposes only. The content in this report, including allocations, analysis, and commentary, is provided solely for informational and educational purposes. It does not constitute financial advice, investment advice, trading advice, or any other type of advice. Past performance does not guarantee future results. Always conduct your own research and consult a qualified financial professional before making investment decisions.
XLE defensive overlay excluded: price is below its 8W SMA. Cause selector will use GLD or cash alternative.
GLD defensive overlay excluded: price is below its 8W SMA. Cause selector will use cash alternative.
Fast-crash circuit breaker triggered: SPY dropped more than 8% from its 4-week high this week. Defensive overlay activated immediately.
Macro risk engine requires the 50% Defensive overlay for this run; payload selected by cause: Transition Defense.
Weekly Allocation
| Ticker | Category | Weight | Role |
|---|---|---|---|
| SGOV | 20% | Overlay | |
| GLD | Precious Metals | 25% | Overlay |
| XLU | Utilities & Infrastructure | 20% | Overlay |
| XLE | Traditional Energy | 10% | Top-2 (10%) |
| VEGI | Agriculture & Livestock | 5% | Tier-2 (5%) |
| COPX | Industrial Metals | 5% | Tier-2 (5%) |
| ITA | Defense & Aerospace | 5% | Tier-2 (5%) |
| URNM | Nuclear Energy | 5% | Tier-2 (5%) |
| CIBR | Technology | 5% | Tier-2 (5%) |
Trade Instructions — Monday Open
Sell the tranche from 2022-05-20 (completing its 4-week hold). Buy the new tranche. Instructions show net portfolio changes — same-asset positions cancel, weight changes show the delta.
| Action | Ticker | Instruction |
|---|---|---|
| SELL | XLE | Sell 22% of XLE position (reduce 57.50% → 45.00%) |
| SELL | WEAT | Sell 50% of WEAT position (reduce 5.00% → 2.50%) |
| SELL | IGF | Sell 50% of IGF position (reduce 2.50% → 1.25%) |
| SELL | URA | Sell 33% of URA position (reduce 3.75% → 2.50%) |
| SELL | XLK | Sell 50% of XLK position (reduce 2.50% → 1.25%) |
| BUY | GLD | Buy GLD — 26.67% of freed cash (adds 5.00% to portfolio) |
| BUY | XLU | Buy XLU — 26.67% of freed cash (adds 5.00% to portfolio) |
| BUY | VEGI | Buy VEGI — 6.67% of freed cash (adds 1.25% to portfolio) |
| BUY | URNM | Buy URNM — 6.67% of freed cash (adds 1.25% to portfolio) |
| BUY | SGOV | Buy SGOV — 26.67% of freed cash (adds 5.00% to portfolio) |
| BUY | CIBR | Buy CIBR — 6.67% of freed cash (adds 1.25% to portfolio) |
Current Portfolio After Trade
Combined holdings across all 4 active tranches. Each tranche is 25% of the portfolio.
| Ticker | % of Portfolio | Weight Bar |
|---|---|---|
| XLE | 45.00% | |
| GLD | 10.00% | |
| XLU | 7.50% | |
| COPX | 6.25% | |
| ITA | 5.00% | |
| VEGI | 5.00% | |
| SGOV | 5.00% | |
| URA | 2.50% | |
| WEAT | 2.50% | |
| IGV | 2.50% | |
| XOP | 2.50% | |
| URNM | 2.50% | |
| IGF | 1.25% | |
| XLK | 1.25% | |
| CIBR | 1.25% |
Macro Regime — Late-Cycle Reflation
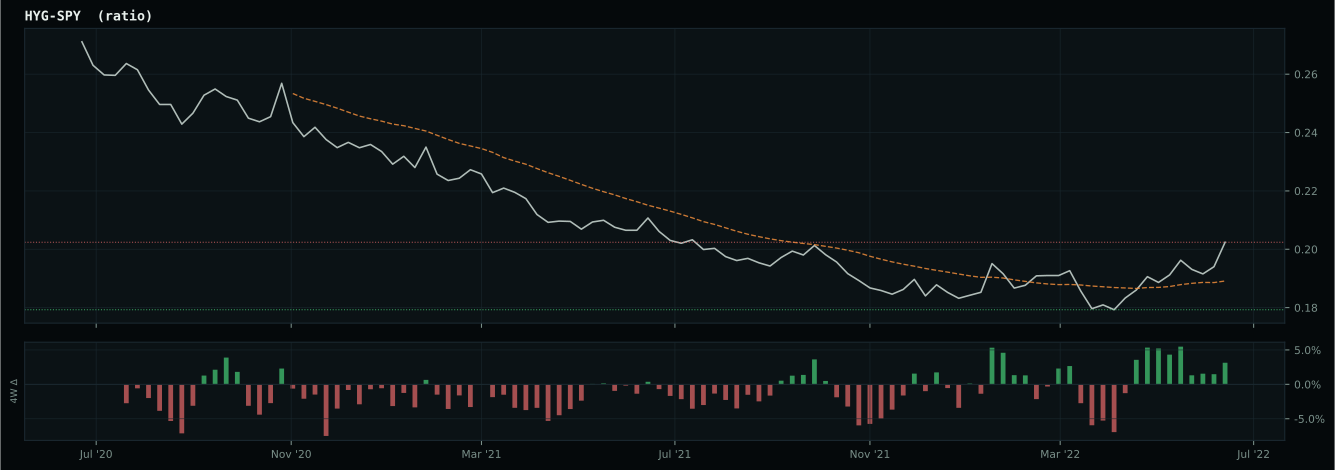
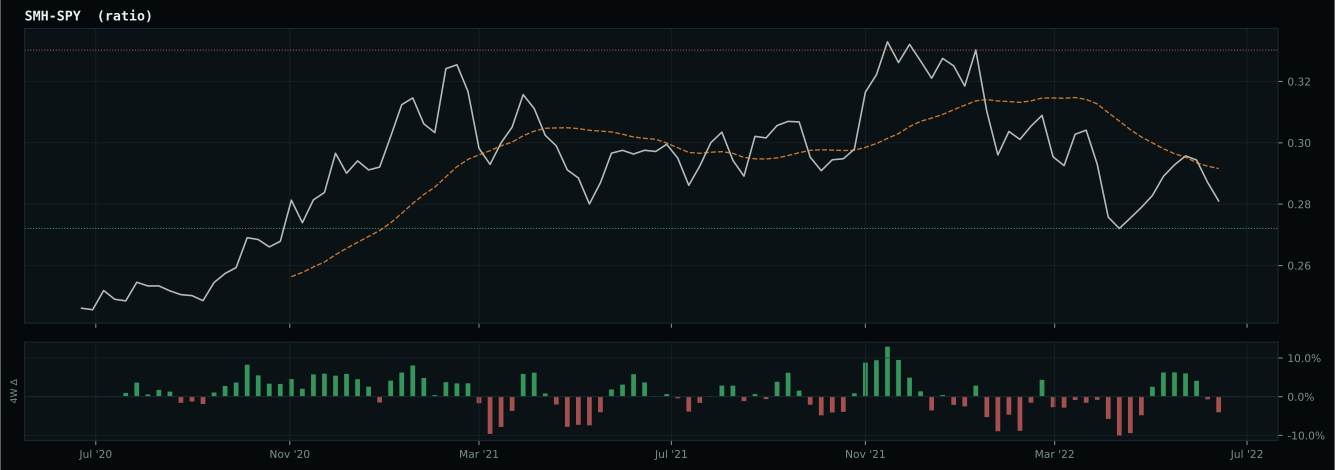
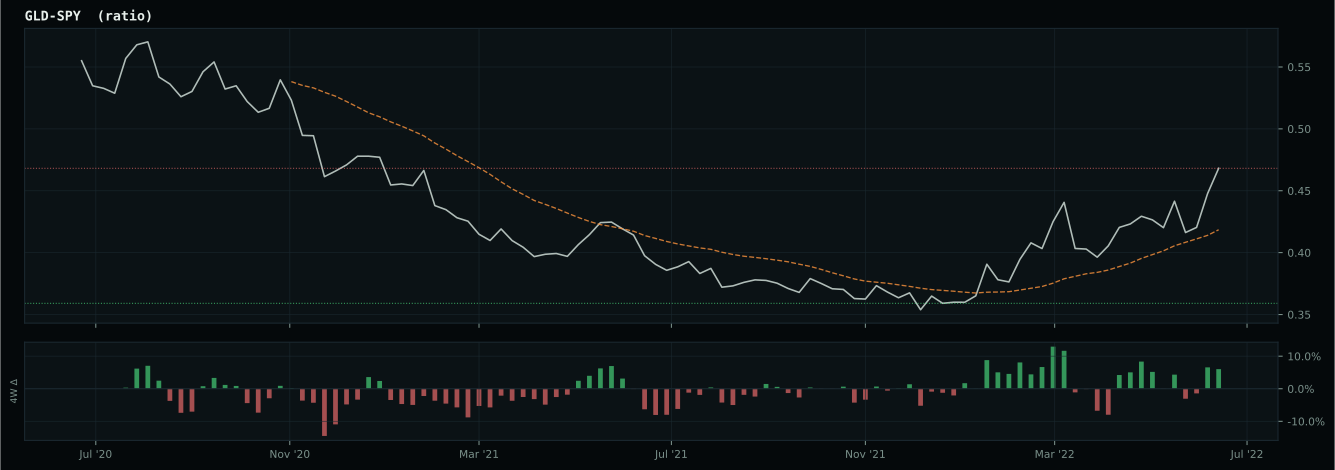
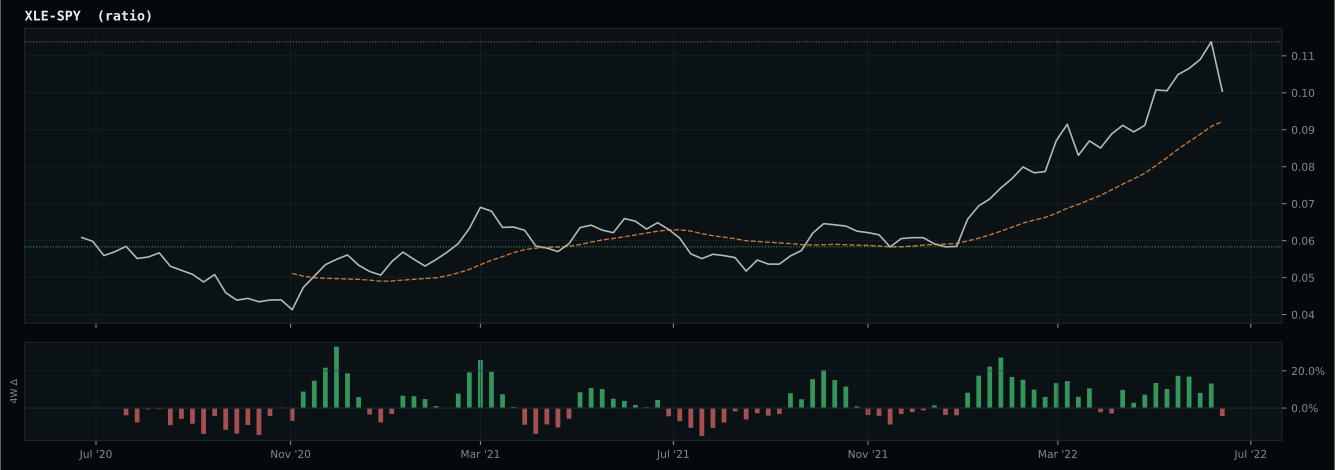
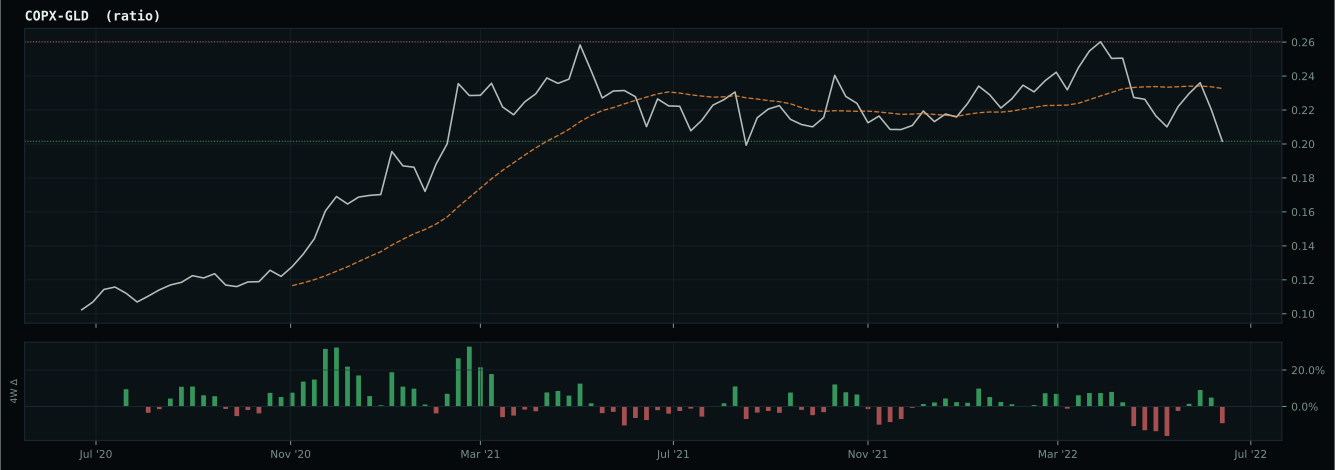
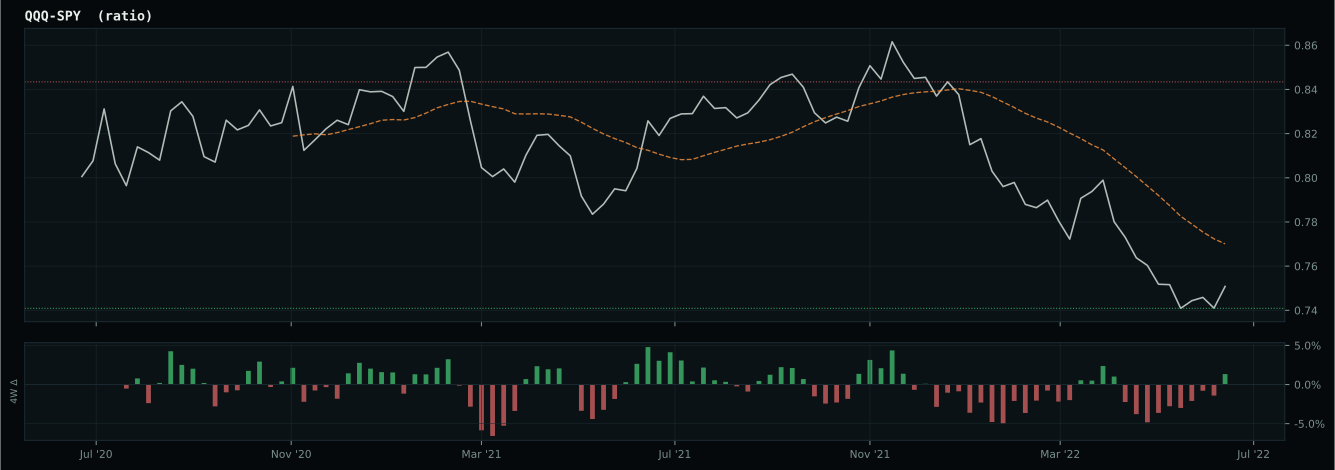
growth data is not confirming the weak market-implied risk appetite signal
Defensive overlay cause is not singular enough to concentrate: the sleeve diversifies across liquidity, monetary defense, and defensive equity exposure while the market resolves the next regime.
Macro Evidence Charts
Market-implied signals behind the macro regime scores. Each ratio compares two assets; the direction and slope of the ratio is what the macro engine reads.
Crypto Regime — NoCrypto
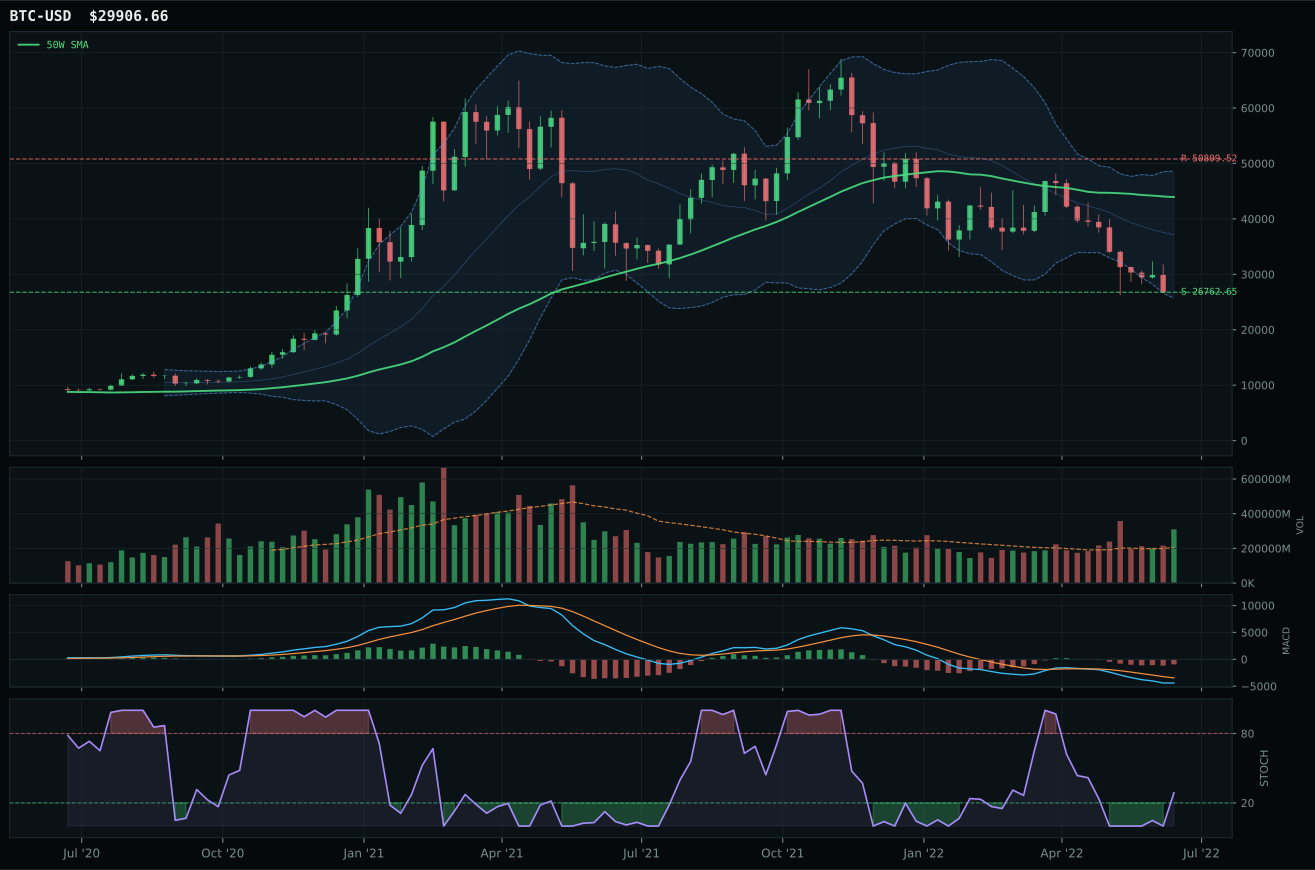
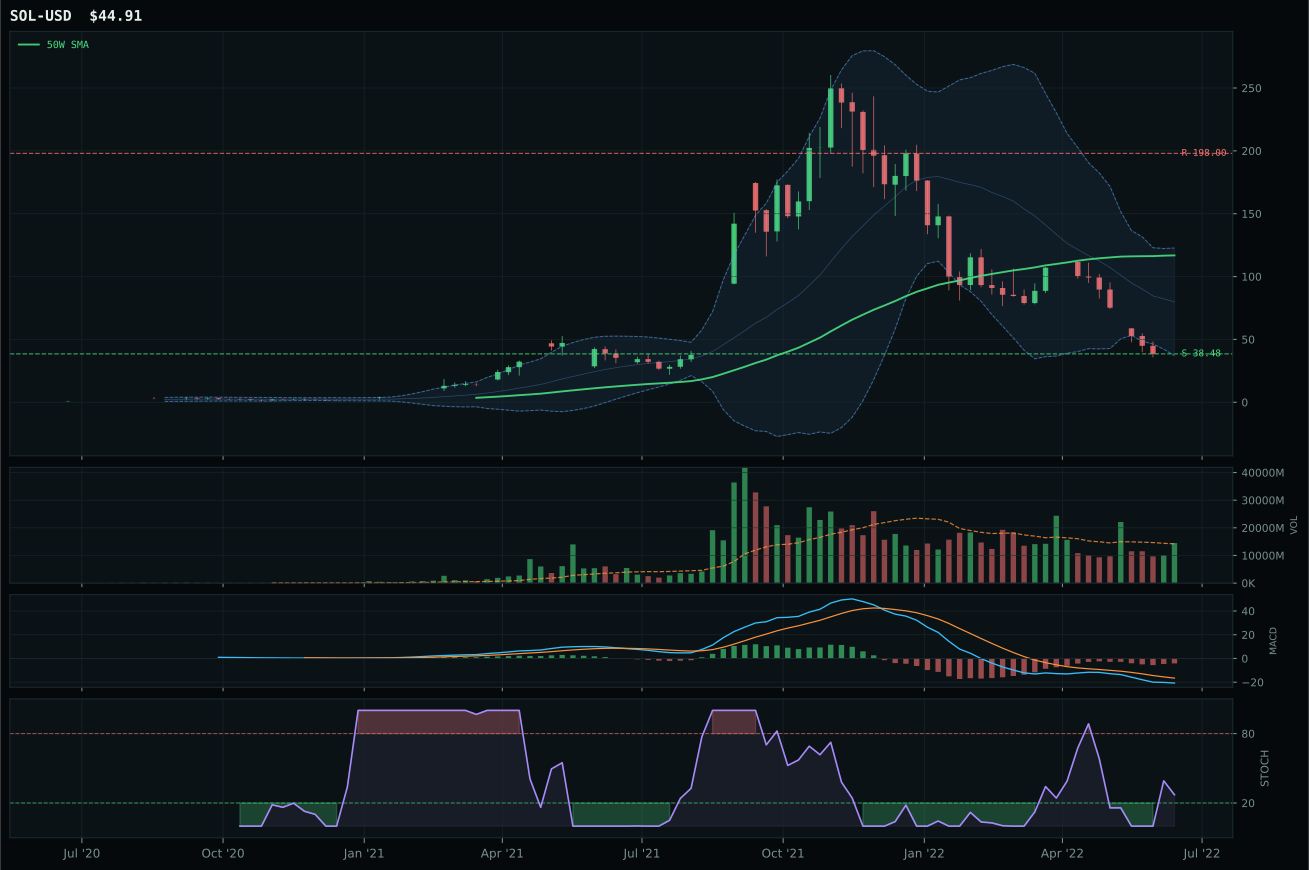
ValueBTC not armed: BTC has not made the first post-breakdown touch of the 200W buy zone after losing the 50W
TrendBTC not confirmed
one or more available conditions failed
Category Rankings
| Rank | Category | Winner | Score | Alloc | 4W Ret | Peers (4W) |
|---|---|---|---|---|---|---|
| 1 | Traditional Energy | XLE | 60.0 | 20% | -5.62% | XOP -9.6% · FCG -8.7% |
| 2 | Precious Metals | GLD | 49.8 | 20% | -6.42% | SLV -13.2% · GDX -14.3% |
| 3 | Agriculture & Livestock | VEGI | 42.1 | 10% | -5.92% | WEAT -21.0% · MOO -5.6% |
| 4 | Industrial Metals | COPX | 41.5 | 10% | -20.08% | REMX -7.9% · PICK -12.0% |
| 5 | Defense & Aerospace | ITA | 33.5 | 10% | +2.89% | ROKT -0.5% · XAR +3.0% |
| 6 | Utilities & Infrastructure | XLU | 32.2 | 10% | +7.77% | IGF +1.2% · PAVE +1.7% |
| 7 | Nuclear Energy | URNM | 28.4 | 10% | +0.33% | NLR +3.6% · URA -0.2% |
| 8 | Technology | CIBR | 26.4 | 10% | +4.37% | XLK +6.0% · IGV +3.8% |
| 9 | AI | SMH | 10.4 | 0% | +3.89% | AIQ +2.3% · BOTZ -0.7% |
| 10 | Emerging Markets | INDA | 4.6 | 0% | +1.85% | IEMG -2.5% · ILF -6.7% |
Traditional Energy — XLE
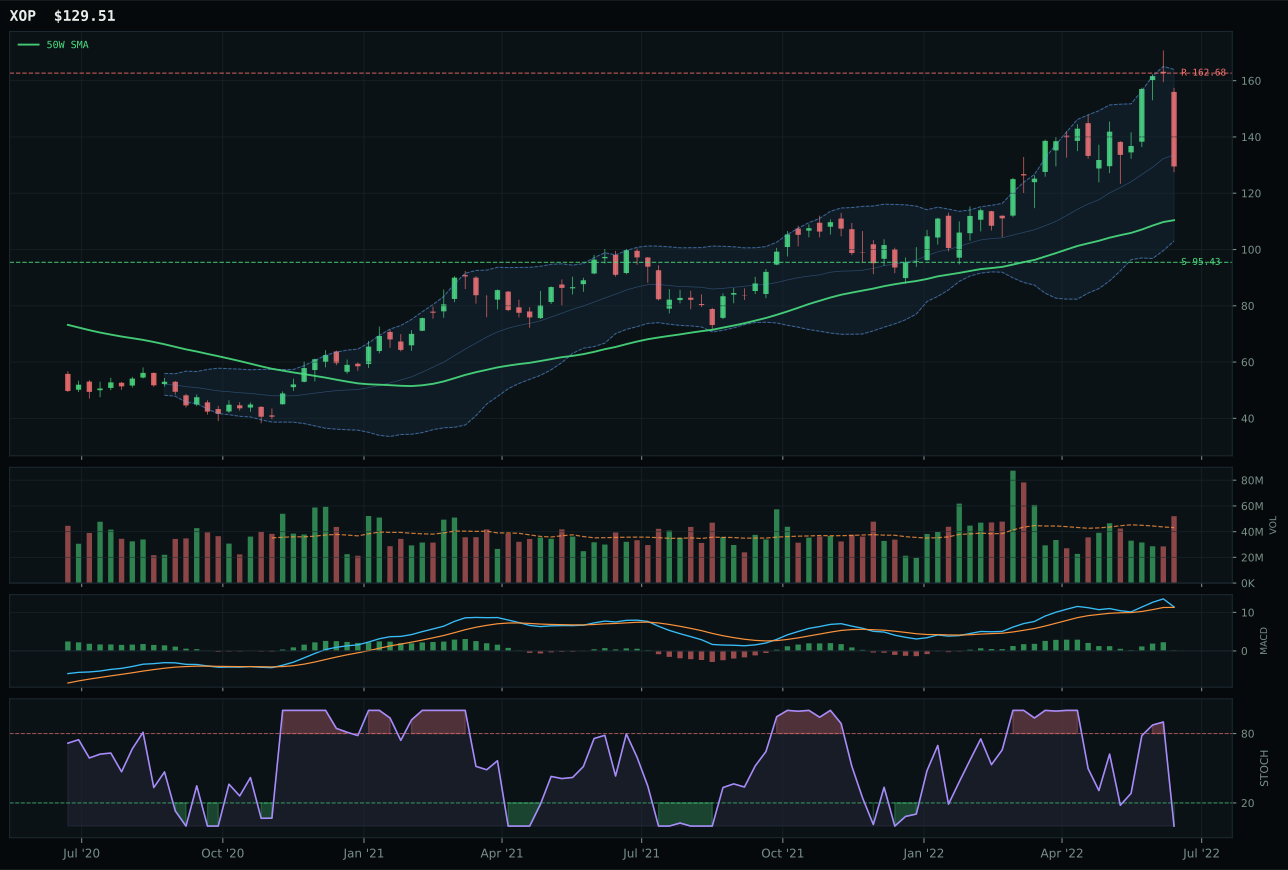
XOP has a vertical extension profile with 21.1% 13-week relative strength versus SPY.
A failed hold above support would weaken the setup.
Actionable but governed by invalidation levels.
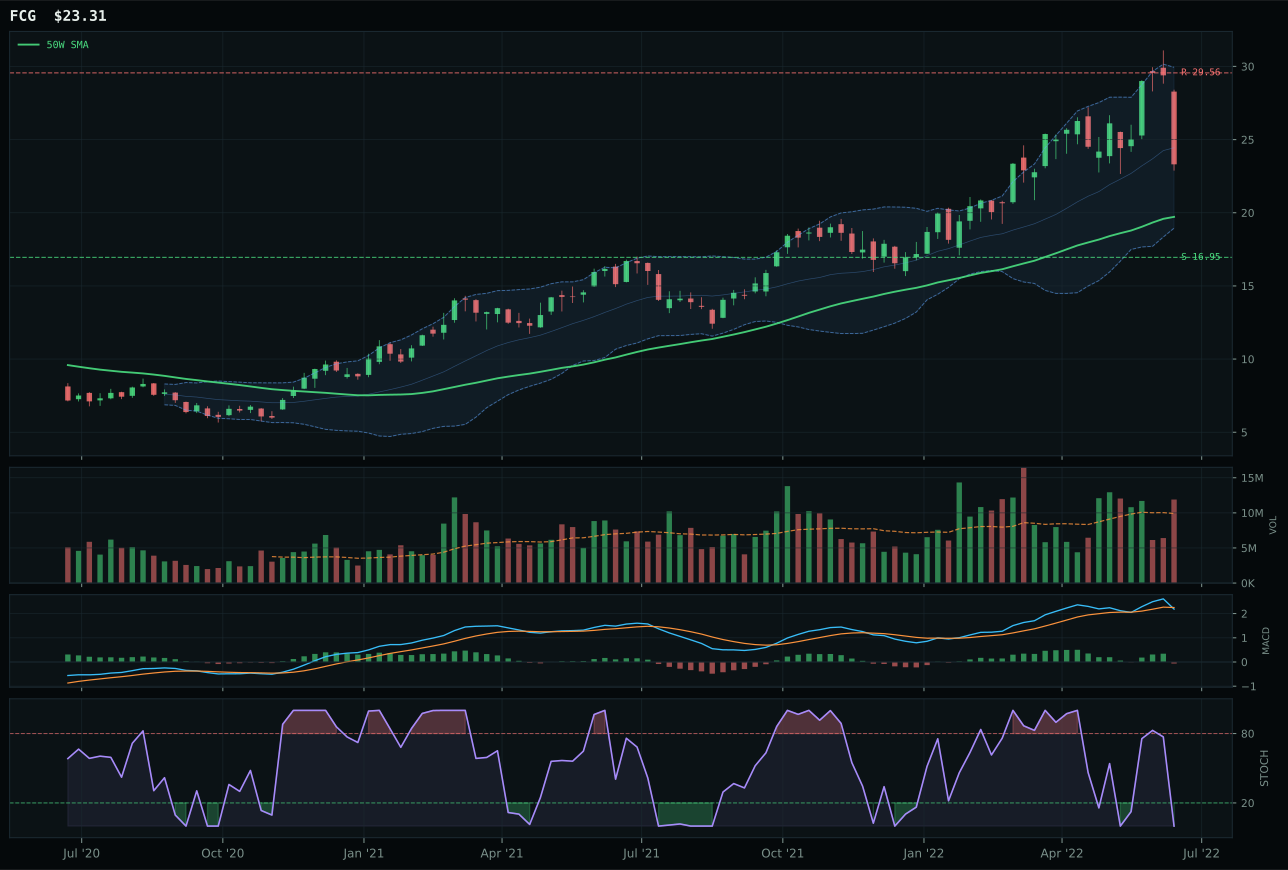
FCG has a vertical extension profile with 20.1% 13-week relative strength versus SPY.
A failed hold above support would weaken the setup.
Actionable but governed by invalidation levels.
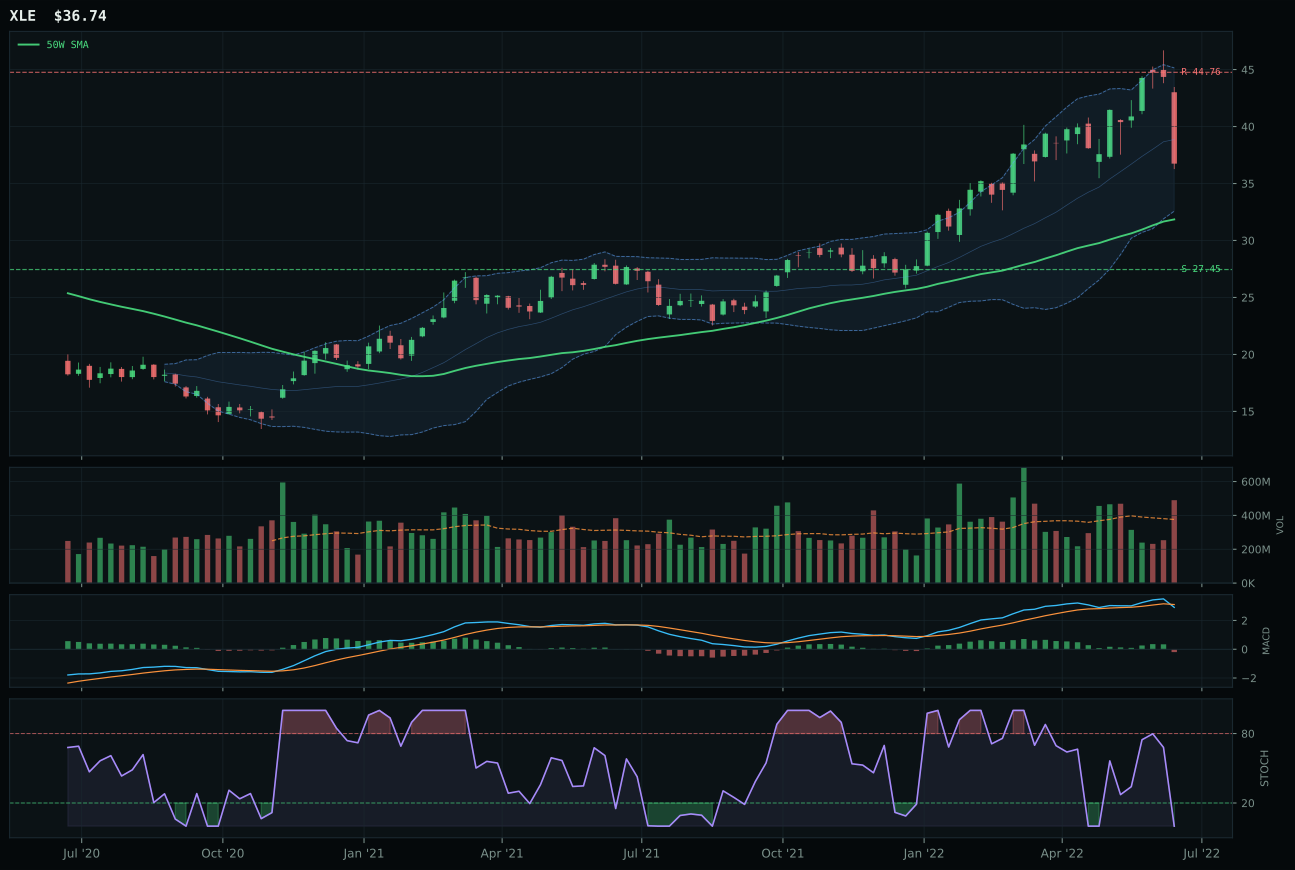
XLE has a vertical extension profile with 17.2% 13-week relative strength versus SPY.
A failed hold above support would weaken the setup.
Actionable but governed by invalidation levels.
XLE secures the top-2 slot not by being the strongest momentum player—XOP's 21.1% RS versus SPY and 3.5% 13-week return are superior—but by offering the most sustainable cash-flow defense at the best entry price. XLE sits 15.4% above its 50W average in what appears to be extended, but the risk-reward score of 47.5 versus XOP's 48 shows the extension is priced fairly: downside to support is 33.9%, and upside to resistance is only 17.9%, creating a 2:1 cushion against catastrophic drawdown. XLE's 17.2% RS versus SPY trails XOP's 21.1%, but that measured outperformance is a feature, not a bug—it signals XLE is capturing energy strength without the leverage and cyclicality risk embedded in XOP. Structure cleanliness favors XLE at 69.1 versus XOP's 68.8, a razor-thin margin, but timing favors XLE because the category representative's macro fit (69 out of 100) is rooted in energy scarcity fundamentals, not sentiment. XLE is the integrated-major expression of that scarcity; XOP is the speculation on it.
Traditional Energy earns 10% allocation as the #2 ranked category overall with a final score of 60.0 and macro fit of 78 out of 100, the highest macro score on the entire sheet. Energy scarcity is the dominant narrative—active at +16 points—supported by real-asset sponsorship (+7) and late-cycle reflation regime +12 points, creating a compelling macro backdrop for crude, natural gas, and energy equities. The 10% allocation reflects full tier-2 weight and signals that the portfolio is committed to energy as a core hedge against stagflation and currency debasement risk. The entry is not perfect: XLE's extension above the 50W creates timing friction, and MACD is bearish even if the trend remains constructive. Yet the risk-reward framework and the quality of macro sponsorship justify holding the full position. What could reduce it: a sudden reversal in crude prices (below $70/barrel would begin to invalidate the scarcity thesis) or visible demand destruction in freight and manufacturing. Until either occurs, the 10% slot is warranted as a real-asset and energy-scarcity hedge at a reasonable entry point relative to its macro conviction.
Precious Metals — GLD
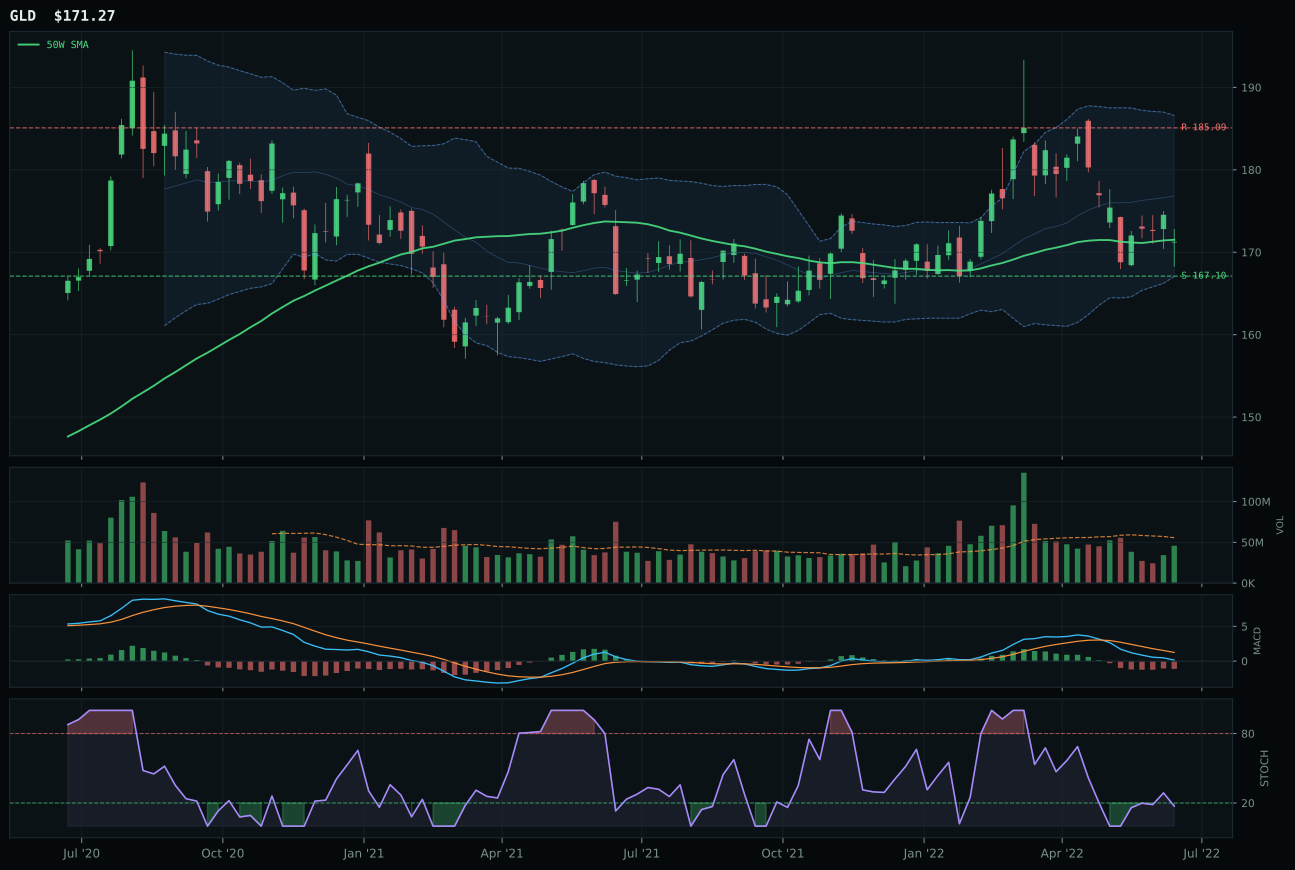
GLD has a pullback into support profile with 13.2% 13-week relative strength versus SPY.
A failed hold above support would weaken the setup.
Actionable but governed by invalidation levels.
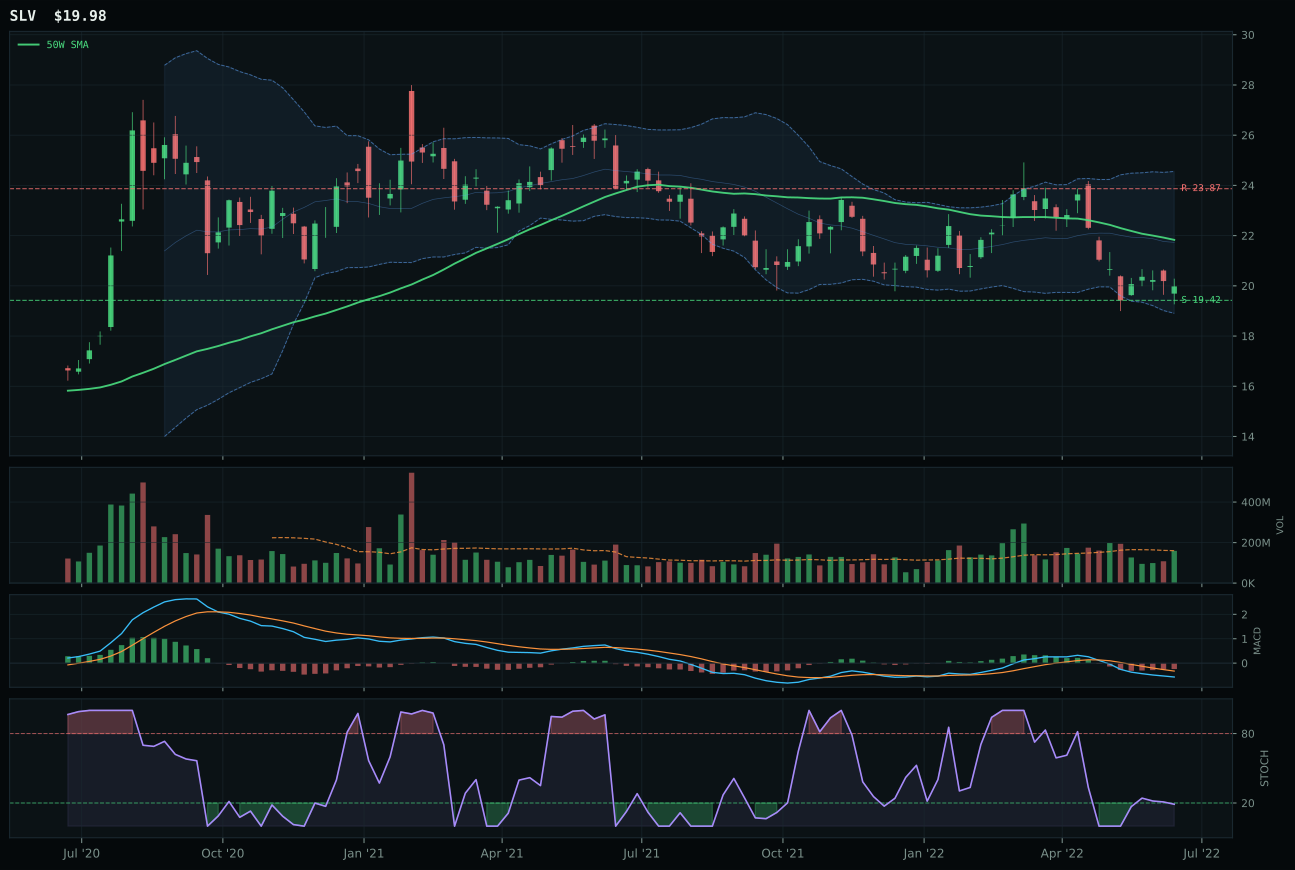
SLV has a pullback into support profile with 4.5% 13-week relative strength versus SPY.
A failed hold above support would weaken the setup.
Actionable but governed by invalidation levels.
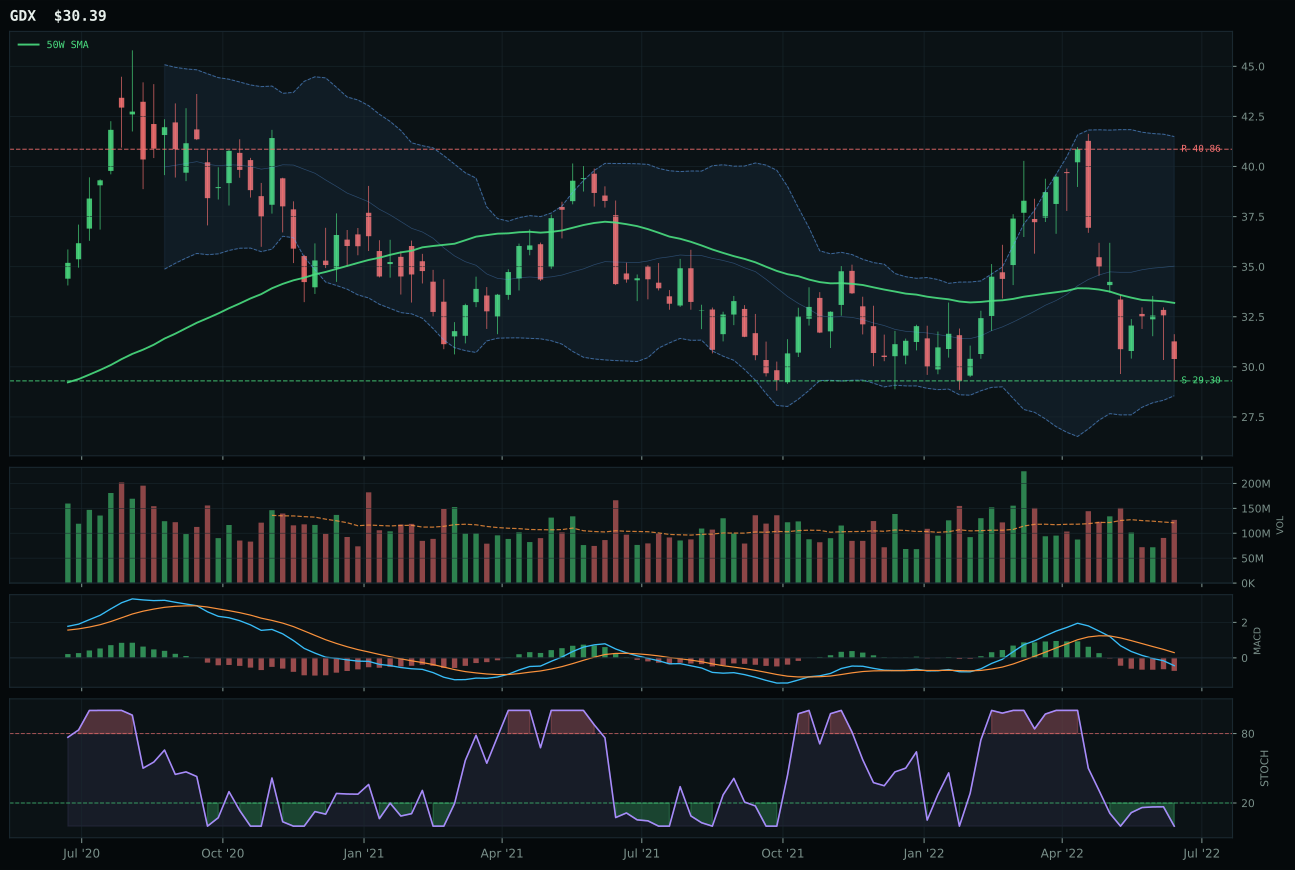
GDX has a pullback into support profile with -0.7% 13-week relative strength versus SPY.
A failed hold above support would weaken the setup.
Actionable but governed by invalidation levels.
GLD claims the top-2 slot by executing a textbook near-perfect entry: price sits virtually flat to the 50-week moving average at -0.1% pullback, stochastic RSI has compressed to 0.17 in the deep retracement zone near Fib 0.618, and MACD is bearish but visibly improving. The gold ETF carries 13.2% relative strength versus SPY—a powerful statement that capital is rotating into gold precisely when equities are stumbling—and it holds 8.7% relative strength within its own category, meaning GLD is the clearinghouse for monetary-hedge demand. The timing score of 100 reflects an entry so clean that the chart reads like a textbook setup: risk is defined (support at 167.10), upside is clear (resistance at 185.09), and volume is neutral rather than desperate. SLV lost to GLD on three fronts: its timing score of 85 versus 100, its risk-reward of 90 versus 98, and its category-relative strength of 0.0% versus GLD's 8.7%, meaning the silver market is not yet rotating into the safe-haven trade. GLD's monetary-hedge premium is not sentiment; it is the flow pattern in real time.
Precious Metals ranks #1 or #2 among the 10 categories and earns a 10% top-2 overweight allocation, signaling the portfolio's conviction in gold's intermediate-term role. The category score of 49.8 and macro fit of 74 out of 100 reflect the alignment between GLD's technical setup and the portfolio's macro regime. Monetary-hedge bid is active at +14 points, defensive rotation at +7, and even dollar pressure adds +3; these are not marginal tailwinds but core drivers of allocation. In a late-cycle reflation regime with visible cracks in equity stability and real rates grinding lower, gold's role as a non-yielding but non-correlated asset becomes central. The 10% allocation (representing the full tier-2 weight under the 50% overlay framework) reflects that the category has earned both technical and macro credentials to sit beside Traditional Energy as a top-2 conviction. What would demote it: visible break below 167.10 support or a sudden reversal in the monetary-hedge narrative (i.e., Fed rate hikes reinvigorating real yields). Neither is imminent; the allocation stands.
Agriculture & Livestock — VEGI
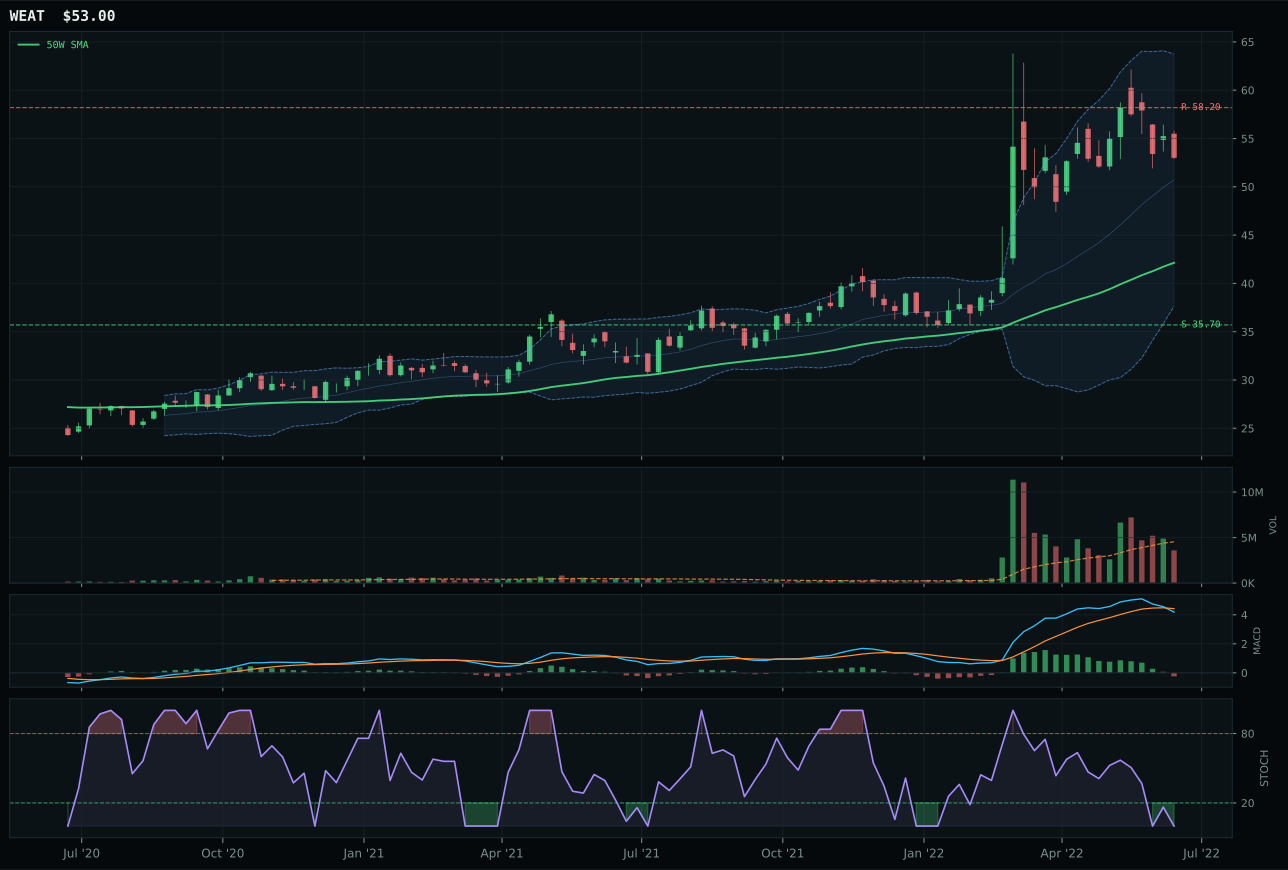
WEAT has a vertical extension profile with 23.8% 13-week relative strength versus SPY.
A failed hold above support would weaken the setup.
Actionable but governed by invalidation levels.
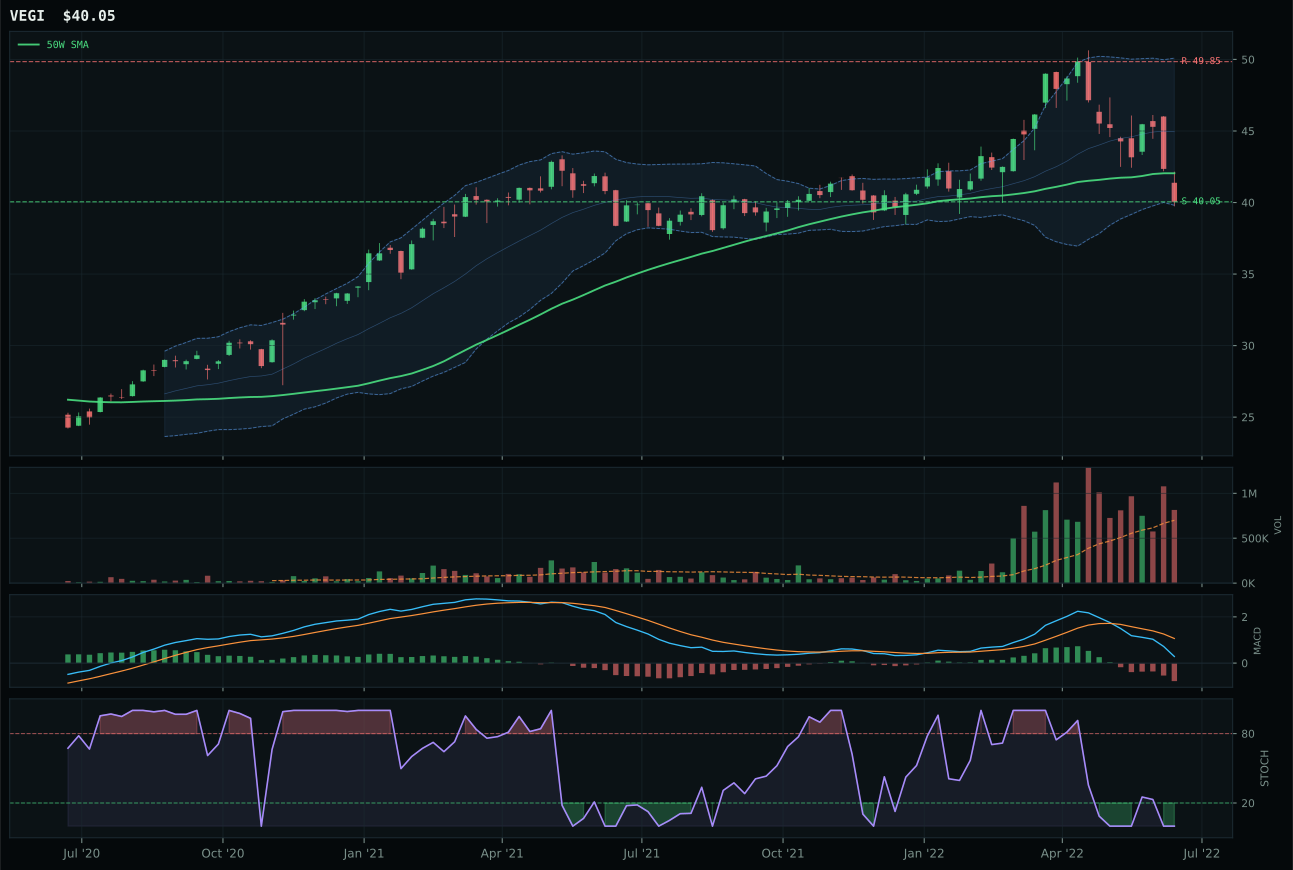
VEGI has a pullback into support profile with 4.5% 13-week relative strength versus SPY.
A failed hold above support would weaken the setup.
Actionable but governed by invalidation levels.
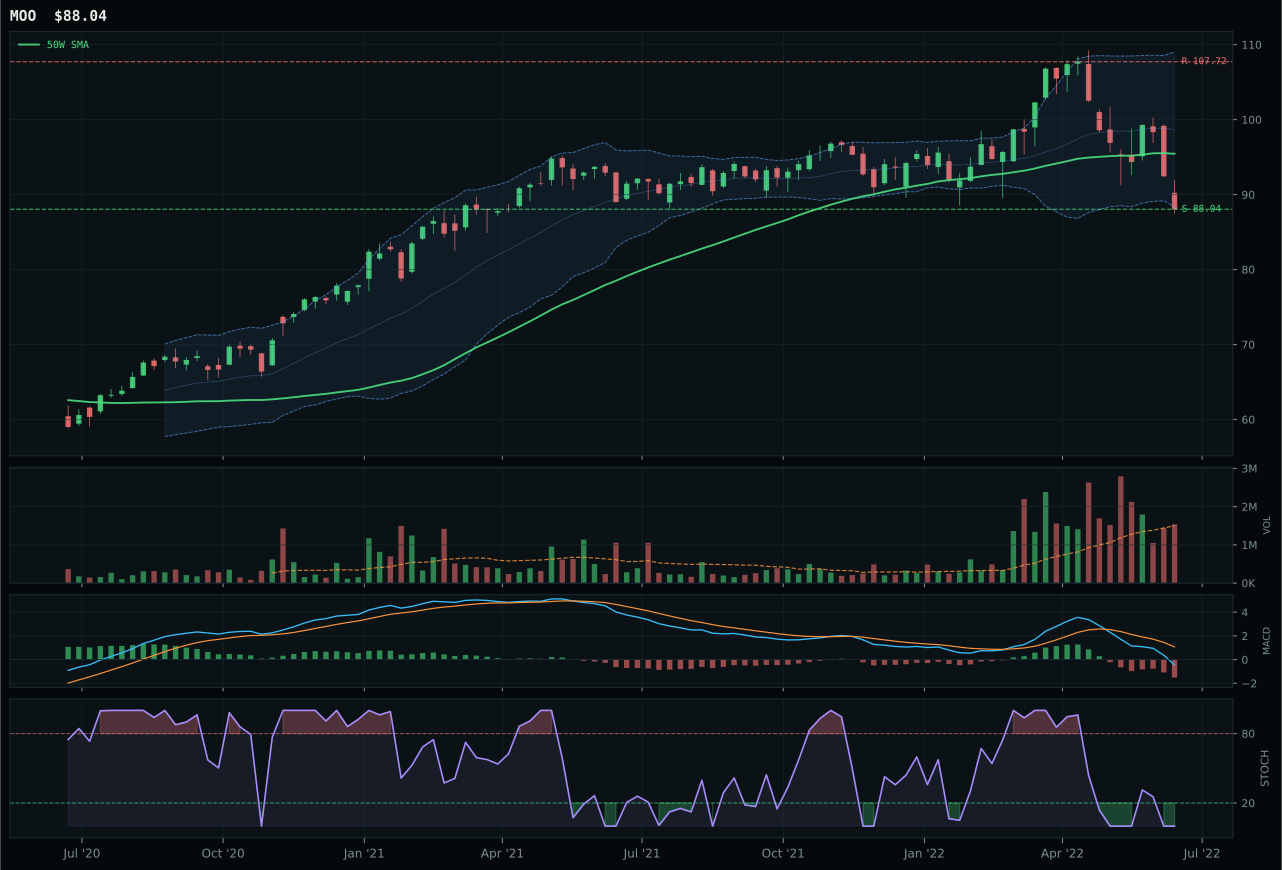
MOO has a pullback into support profile with 3.8% 13-week relative strength versus SPY.
A failed hold above support would weaken the setup.
Actionable but governed by invalidation levels.
VEGI wins Agriculture & Livestock despite WEAT's superior 13-week return of 6.1% because timing and risk-reward metrics reveal critical structural differences. VEGI is only 4.7% below its 50-week average with above-average volume participation of 1.17x the 20-day baseline, placing it in a coiled, ready-to-fire setup; WEAT is already up 25.8% from its 50W average in what the system flags as a vertical extension—late-stage momentum, not early accumulation. VEGI's timing score of 95 versus WEAT's 48 reflects this gulf: VEGI is oversold and tight, while WEAT is stretched and tired. The risk-reward component tells the same story: VEGI offers 89.2 versus WEAT's 33.3, meaning VEGI has upside to resistance while WEAT's resistance is already in the rearview mirror. WEAT's 23.8% RS versus SPY looks stunning on a spreadsheet, but it is a lagging indicator—by the time broad market attention arrives, WEAT has already run. VEGI, with its 4.5% RS and pullback structure, is the distribution point for the next leg.
Agriculture & Livestock receives 5% allocation as a tier-2 holding, justified by a category score of 42.1 and macro fit of 67 out of 100. The category benefits from late-cycle reflation tailwinds (+8) and active real-asset sponsorship (+8), combined with positive commodity breadth—a supportive environment for food and livestock producers in an inflationary regime. The allocation acknowledges this support while recognizing that two categories (Precious Metals and Traditional Energy) captured higher final scores and better entry mechanics this week. The tier-2 slot is appropriate: Agriculture is neither defensive enough to compete with metals, nor energy-tight enough to compete with oil and gas. What could elevate it would be visible deterioration in global supply chains or confirmation of continued drought conditions in key growing regions—either event would accelerate the commodity-breadth narrative and pull the category up. For now, 5% is the right position: large enough to participate in real-asset rotation, small enough to acknowledge superior opportunities elsewhere in the allocation.
Industrial Metals — COPX
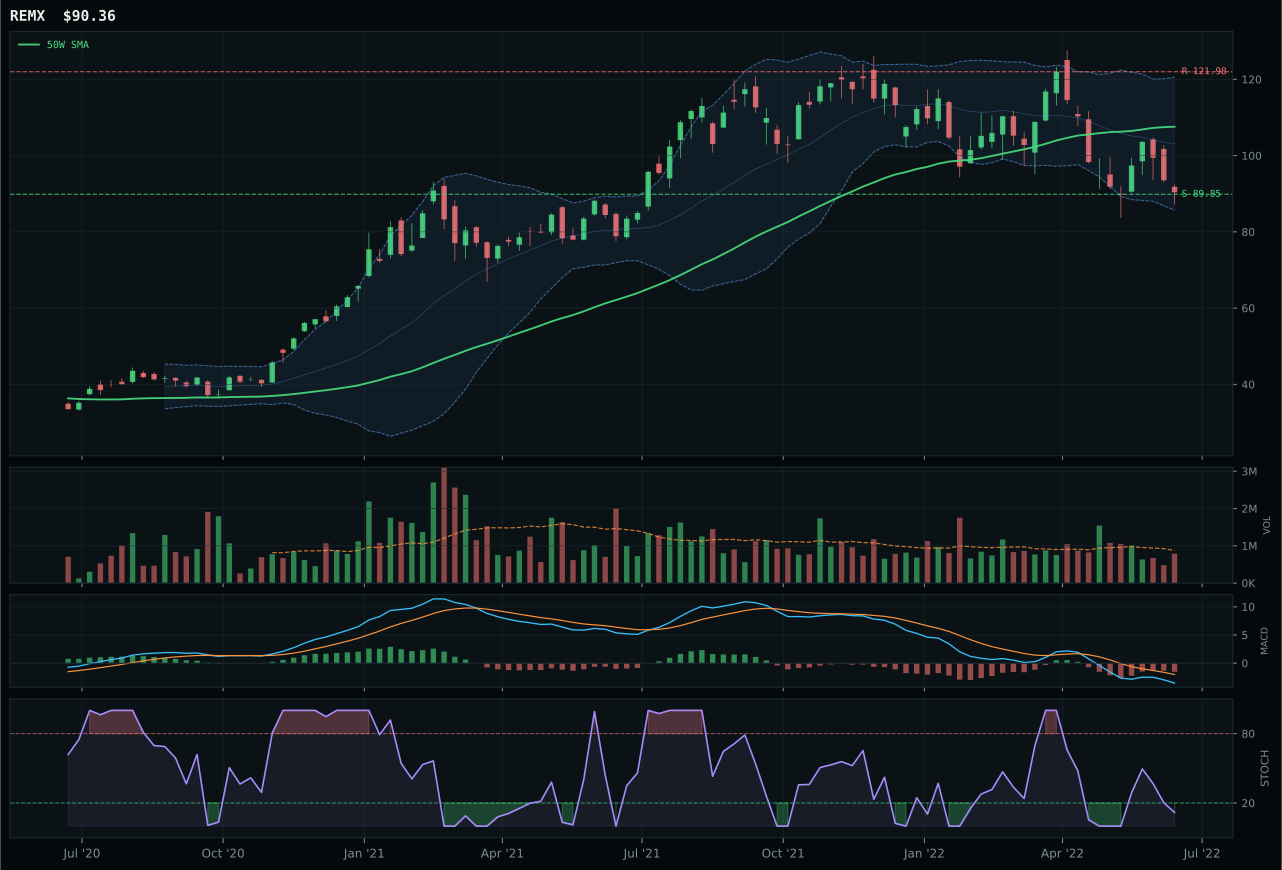
REMX has a pullback into support profile with 0.7% 13-week relative strength versus SPY.
A failed hold above support would weaken the setup.
Actionable but governed by invalidation levels.
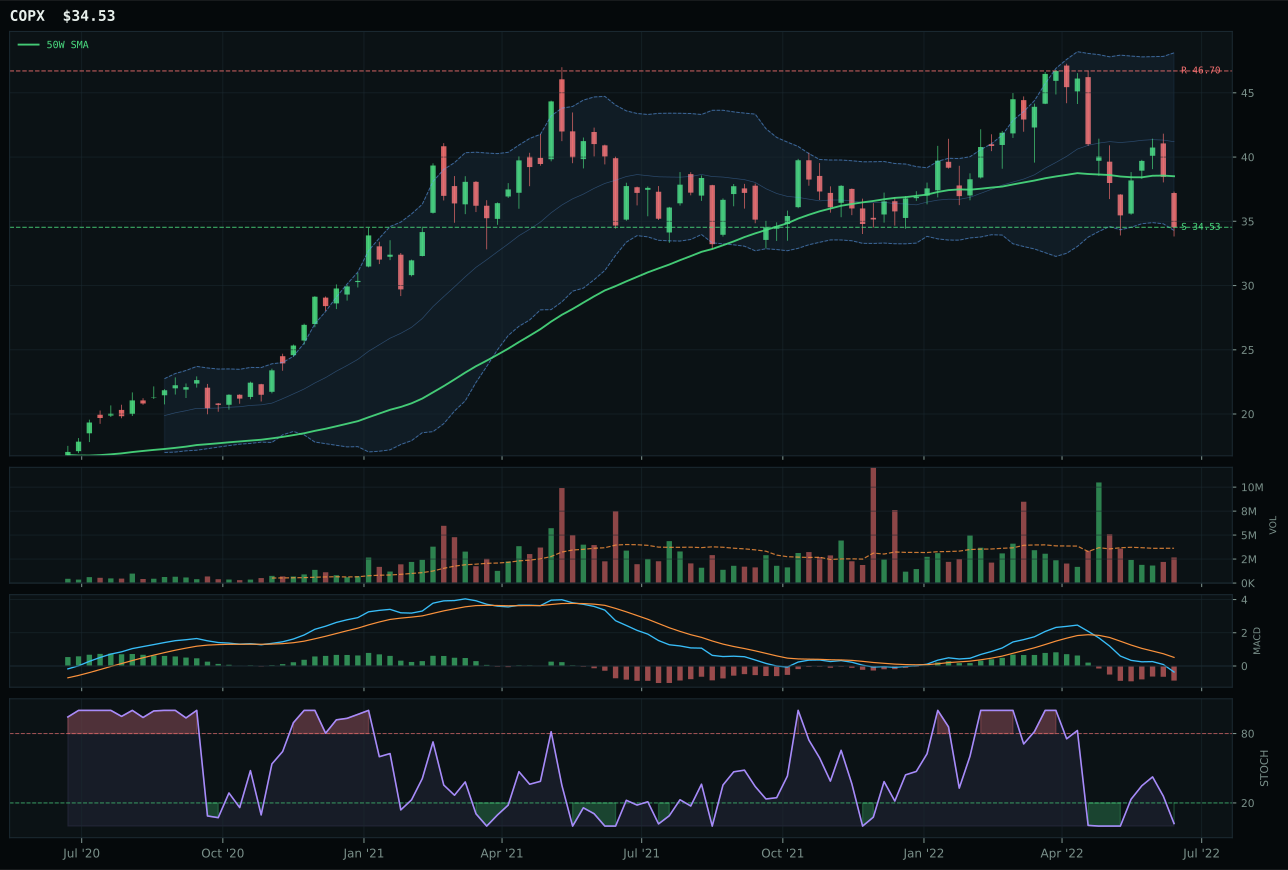
COPX has a pullback into support profile with -3.7% 13-week relative strength versus SPY.
A failed hold above support would weaken the setup.
Actionable but governed by invalidation levels.
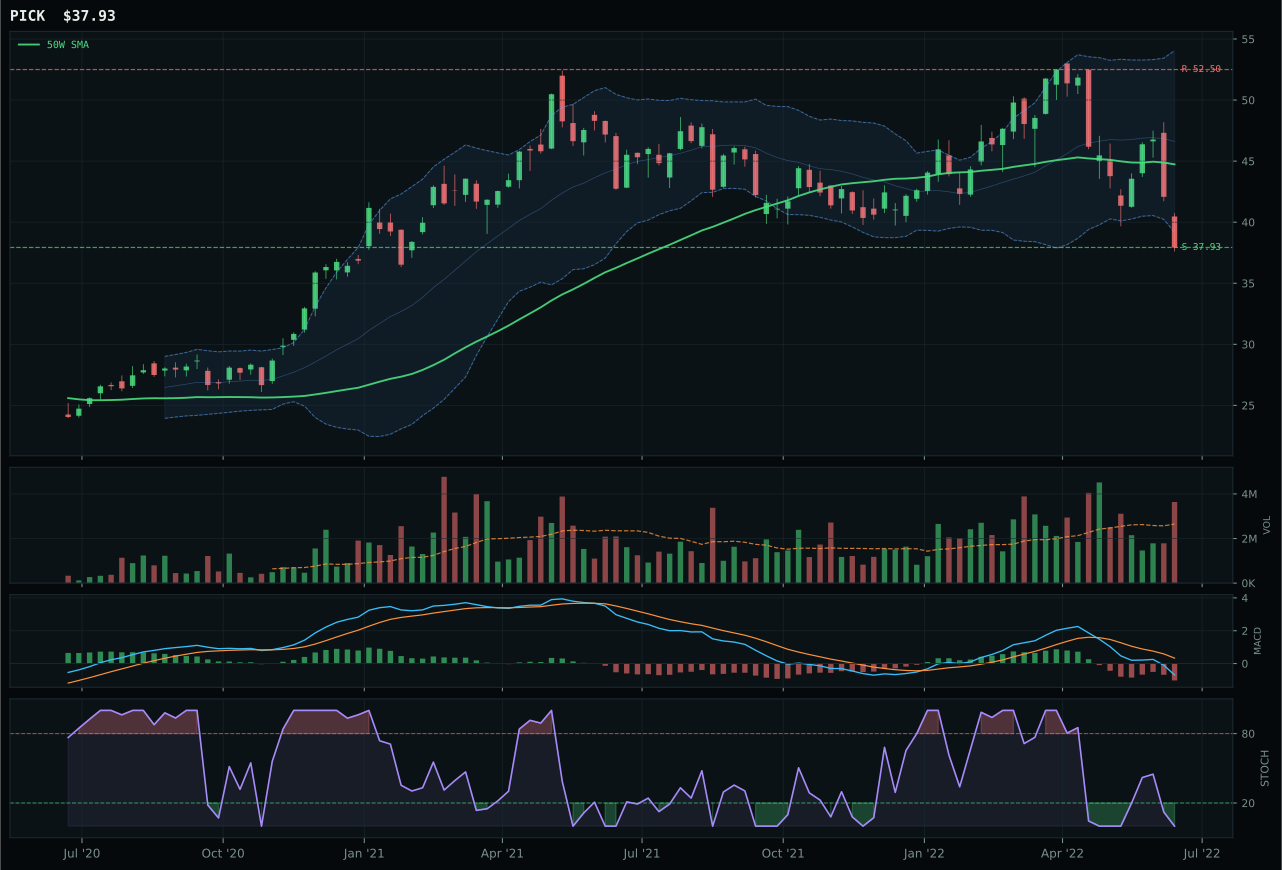
PICK has a pullback into support profile with -4.2% 13-week relative strength versus SPY.
A failed hold above support would weaken the setup.
Actionable but governed by invalidation levels.
COPX wins Industrial Metals by the narrowest margin—a 3.1-point lead over REMX—rooted in one technical factor: structure cleanliness. Both ETFs sit in pullback-into-support setups with stochastic RSI near zero, both show negative 13-week returns (-21.4% for COPX, -17.0% for REMX), and both carry macro support from commodity-breadth tailwinds. But COPX's structure score of 61.1 edges REMX's 56.7, meaning the copper scarcity narrative is coiling more tightly and offering a sharper invalidation zone at 34.53. COPX's weakness is also its strength: it has fallen 10.3% from the 50W and trades at only 0.74x volume, signaling thin participation—exactly the conditions that breed violent mean-reversion moves when capitulation finally ends. REMX trades with neutral volume and sits deeper in the value zone (Fib 0.618), which sounds safer but is actually less precise; the rarity-earth supply story is credible, but the chart lacks the urgency that COPX's coil provides. COPX is the sharper entry.
Industrial Metals receives 5% allocation as tier-2, a position reflecting adequate but not exceptional case relative to higher-ranked categories. The category score of 41.5 and macro fit of 61 out of 100 show genuine support: late-cycle reflation is favorable (+10), commodity breadth is positive (+10), and real-asset sponsorship is active (+6). Yet liquidity stress (-8) and dollar pressure (-7) create meaningful headwinds that prevent the category from breaking into top-2 tier. The allocation respects industrial metals' role in a reflation scenario while acknowledging that precious metals (49.8 score) and energy (60.0 score) are more immediately attractive. COPX specifically suffers from thin volume and thin participation, which means the setup is sharp but the execution risk is real—if the reversal does not materialize immediately, the position could see renewed selling pressure. The 5% slot is appropriate: large enough to capture upside if copper scarcity fears reignite, small enough to avoid overcommitting capital to an illiquid coil. A break above 46.70 resistance with above-average volume would justify upgrading the category to tier-2 full weight or beyond.
Defense & Aerospace — ITA
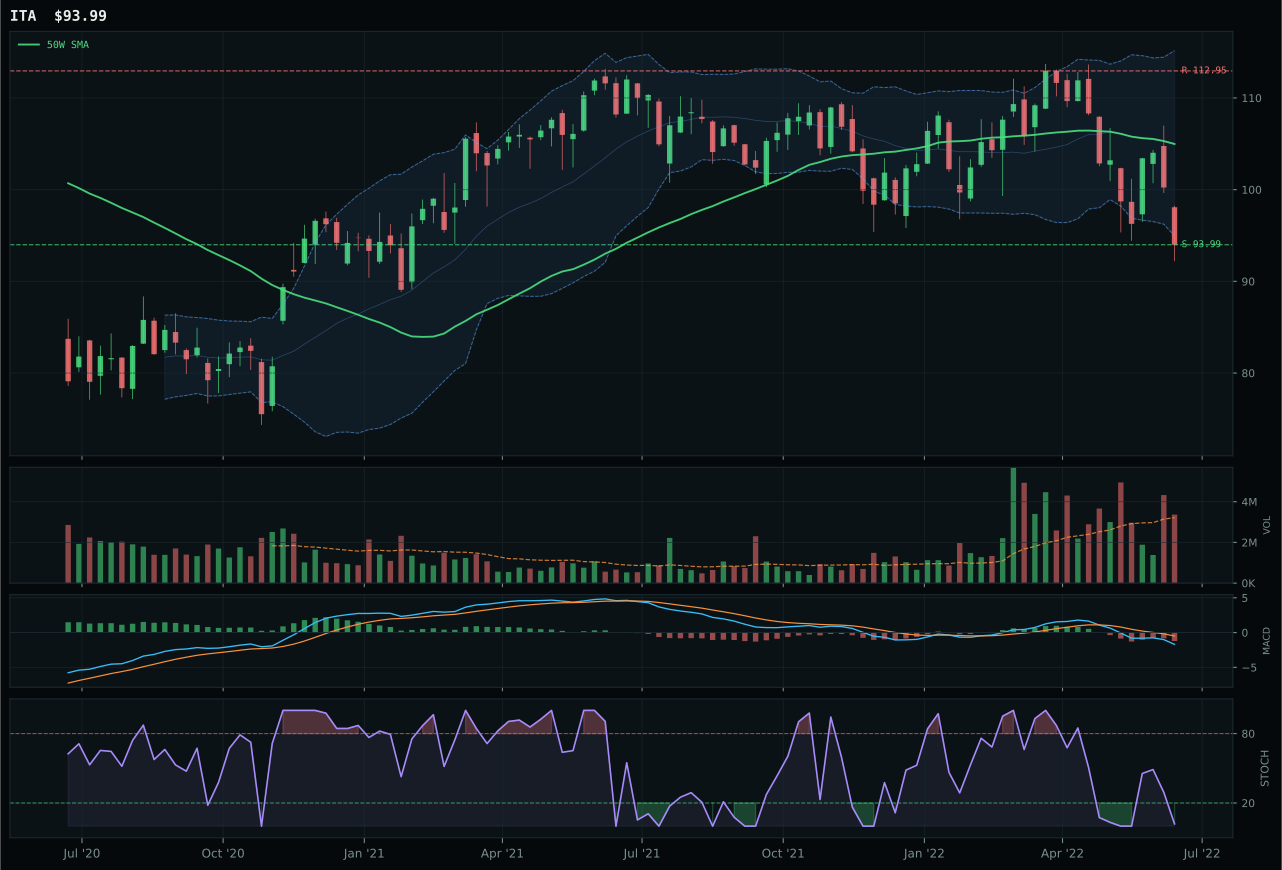
ITA has a pullback into support profile with 3.8% 13-week relative strength versus SPY.
A failed hold above support would weaken the setup.
Actionable but governed by invalidation levels.
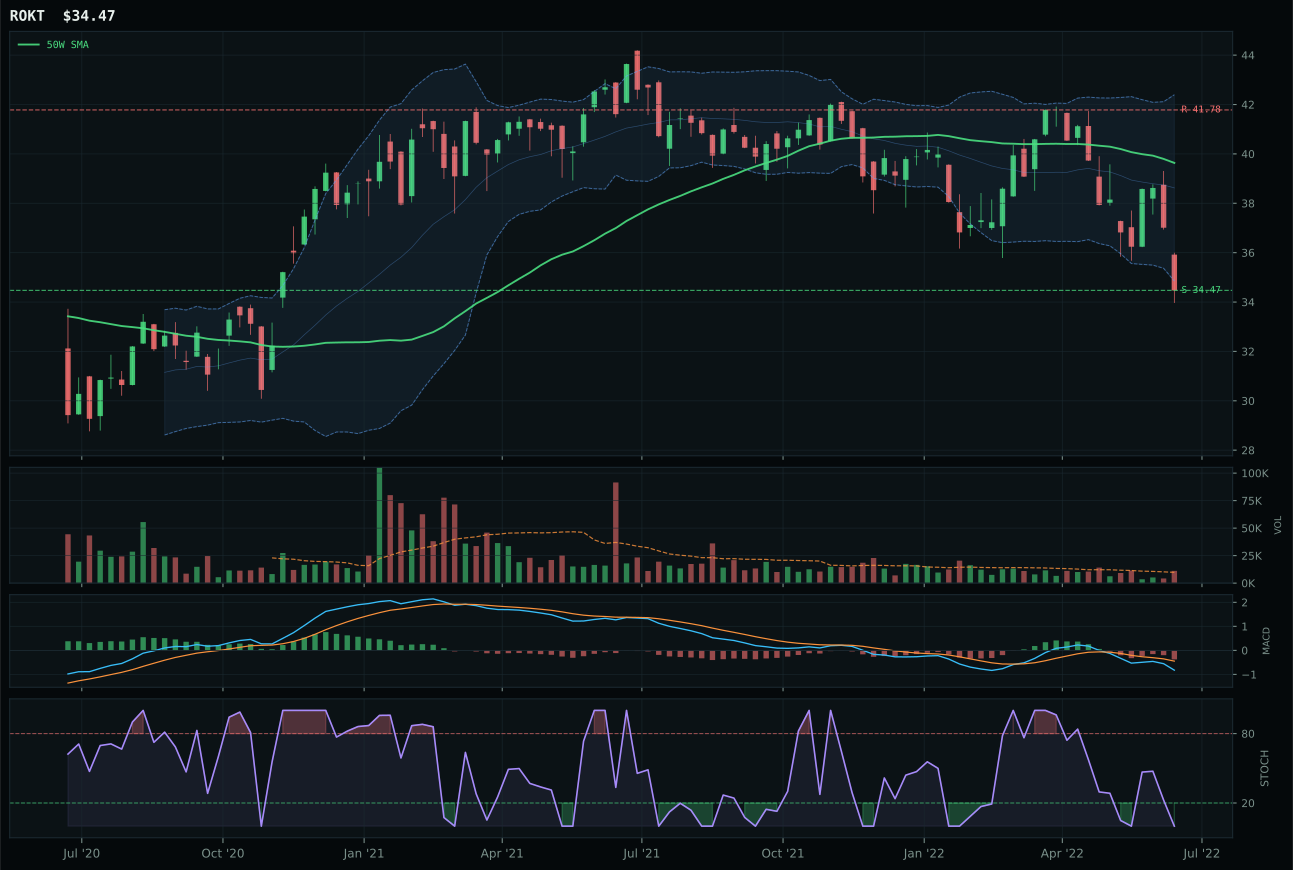
ROKT has a pullback into support profile with 2.6% 13-week relative strength versus SPY.
A failed hold above support would weaken the setup.
Tracked, but not top-2 eligible because: .
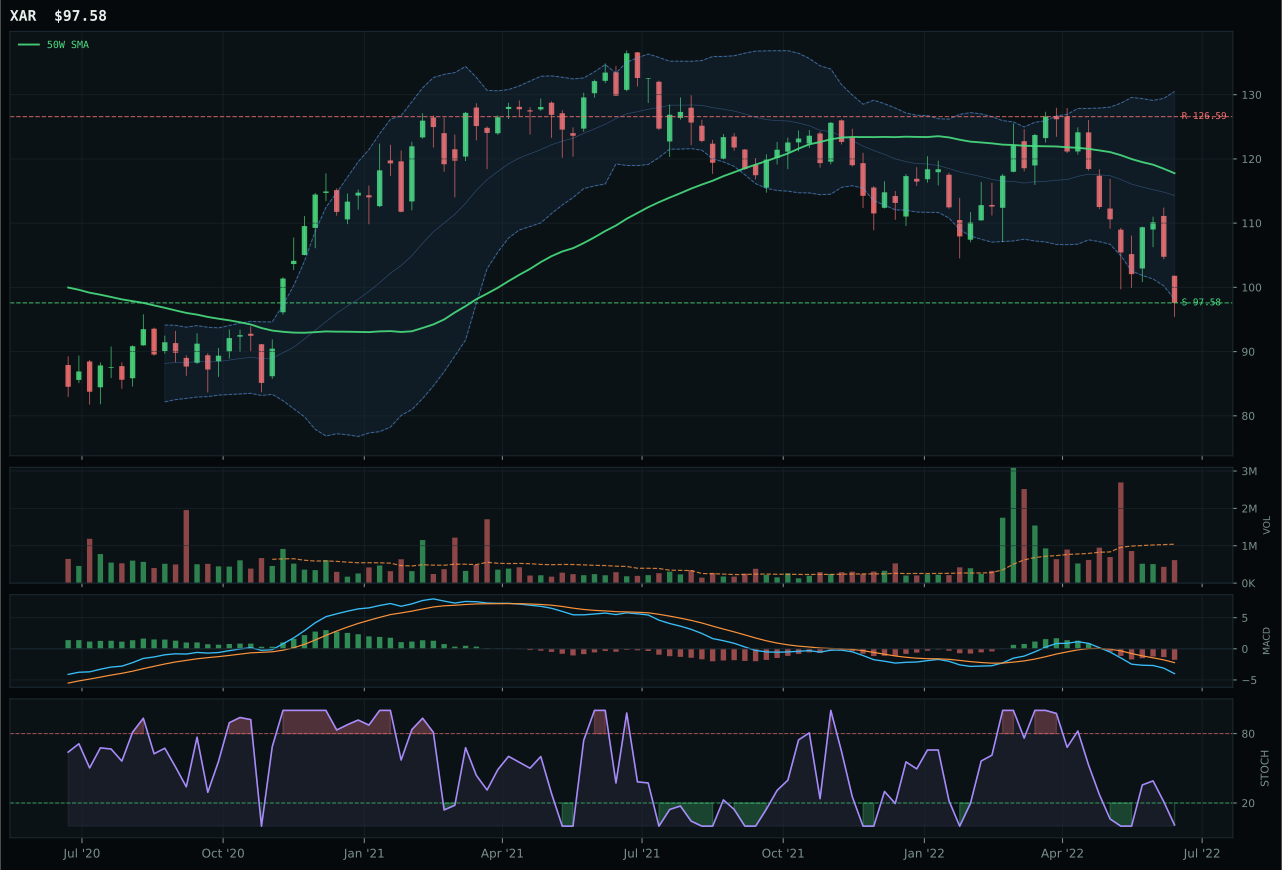
XAR has a pullback into support profile with -3.4% 13-week relative strength versus SPY.
A failed hold above support would weaken the setup.
Actionable but governed by invalidation levels.
ITA wins the Defense & Aerospace category with a composite score of 61 versus ROKT's runner-up 24, a decisive separation rooted in two technical truths. First, ITA is pulling into support near 93.99 with a 10.5% pullback from the 50-week average—close enough to matter, far enough to offer upside asymmetry to resistance at 112.95. Second, and more important, ITA carries 3.8% relative strength versus SPY and 1.1% relative strength within its category, which signals that money is selectively accumulating defense-prime durability even as the broad market struggles. ROKT, the space and aerospace growth expression, carries only 2.6% SPY-relative strength and zero category-relative strength, and its MACD has begun to weaken rather than improve. The timing component score for ITA sits at 65 versus ROKT's 60, a technical indicator that ITA's setup is fresher and its invalidation zone better defined. For a defensive category in a late-cycle reflation regime, ITA's durability thesis beats ROKT's leverage thesis.
Defense & Aerospace earns 5% allocation as tier-2, a position that reflects genuine macro tailwinds but constraints from higher-ranked categories. The category's final score of 33.5 sits comfortably above several peers, and its macro fit of 70 out of 100 is one of the strongest on the sheet—defensive rotation (+8), broad-market bear (+6), and even dollar pressure (+3) are all working in its favor in a late-cycle reflation regime. The portfolio's allocation reflects these strengths by holding the category at full tier-2 weight. What prevents promotion to top-2 is simple: Precious Metals at 49.8 and Traditional Energy at 60.0 both scored higher and carry better risk-adjusted profiles on the week. Defense is steady and well-supported, but it is not the sharpest entry point or the highest-conviction short-term opportunity. The category would need either a deterioration in the macro regime—visible signs of stagflation rather than mere late-cycle heating—or technical strength in ITA (a break above 112.95 resistance on volume) to justify elevation. Until then, 5% is the correct size.
Utilities & Infrastructure — XLU
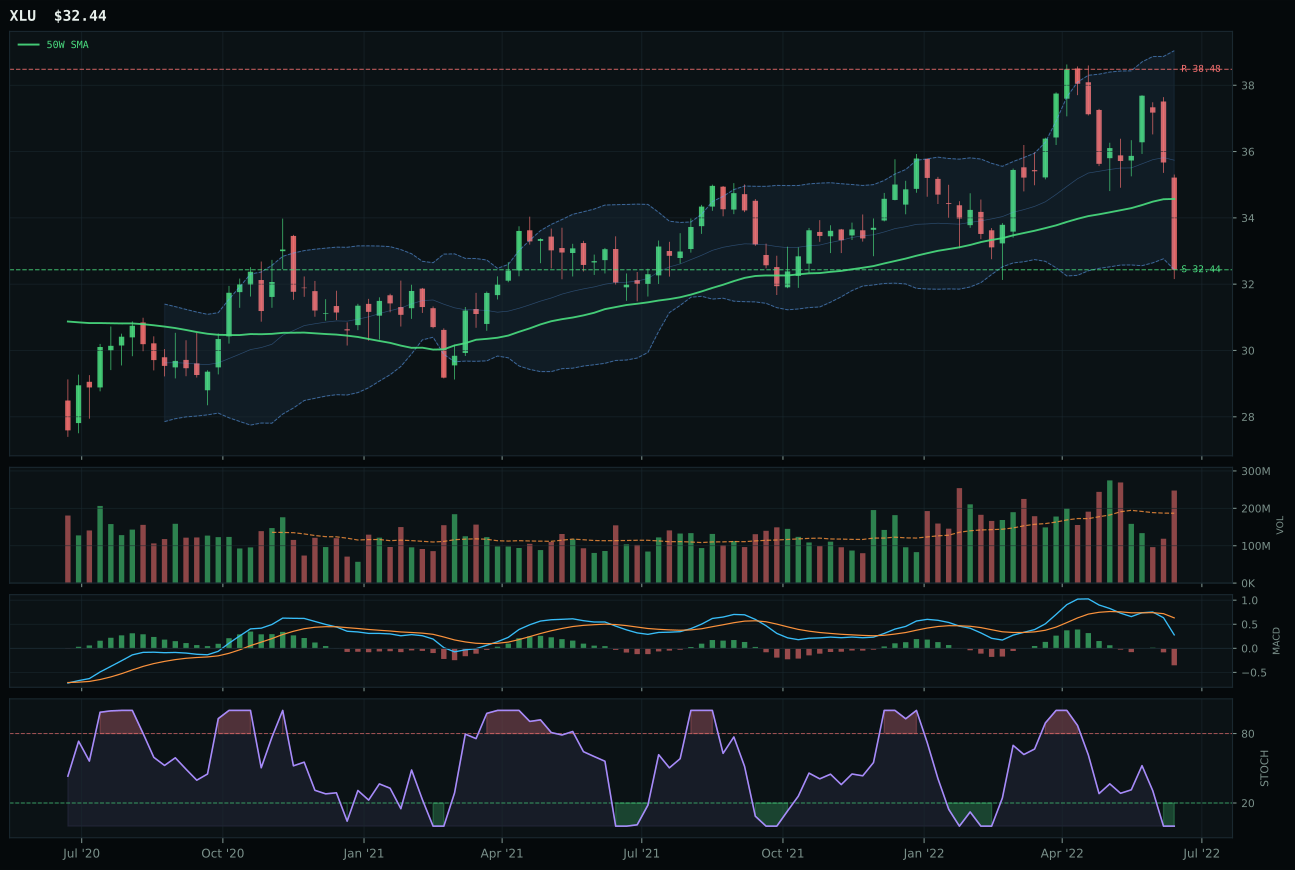
XLU has a pullback into support profile with 9.3% 13-week relative strength versus SPY.
A failed hold above support would weaken the setup.
Actionable but governed by invalidation levels.
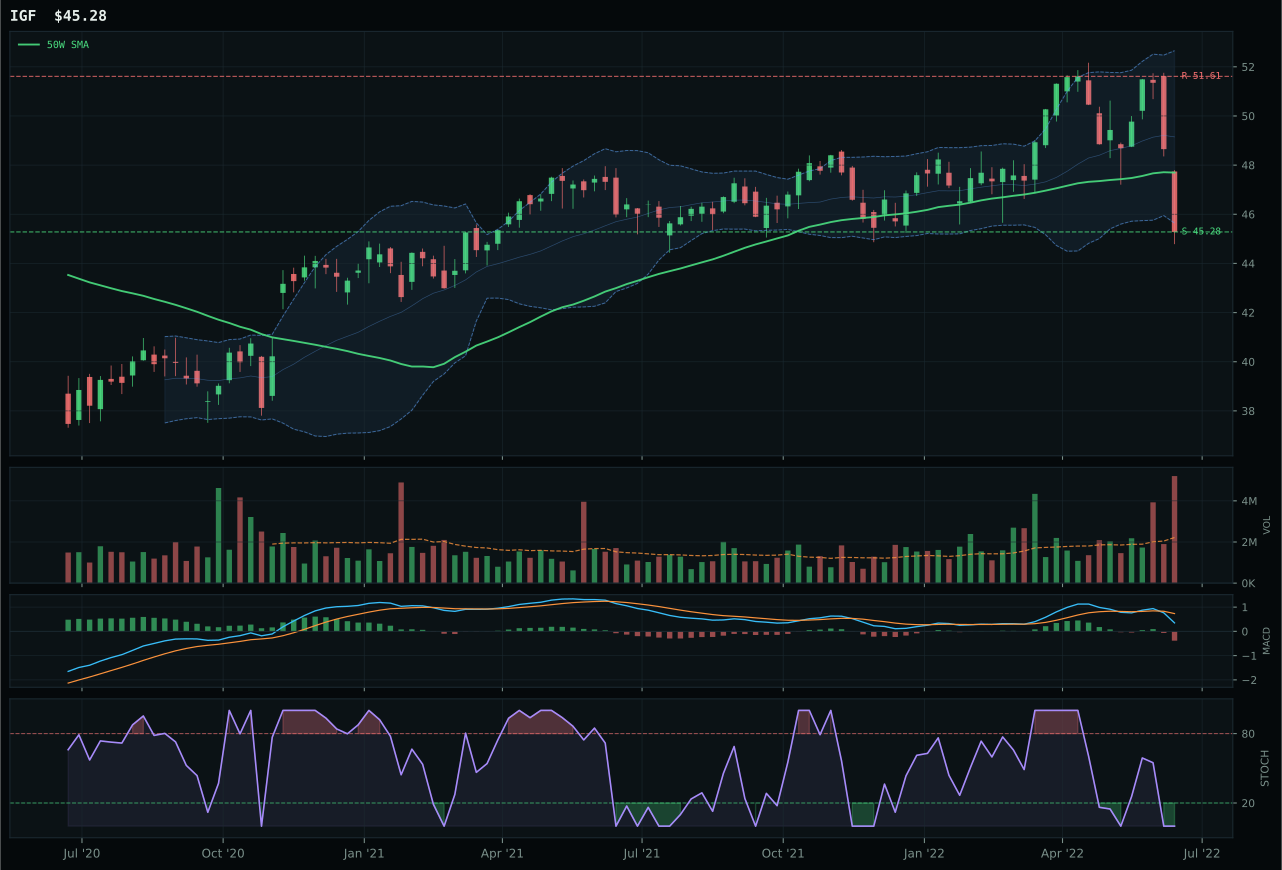
IGF has a pullback into support profile with 10.2% 13-week relative strength versus SPY.
A failed hold above support would weaken the setup.
Actionable but governed by invalidation levels.
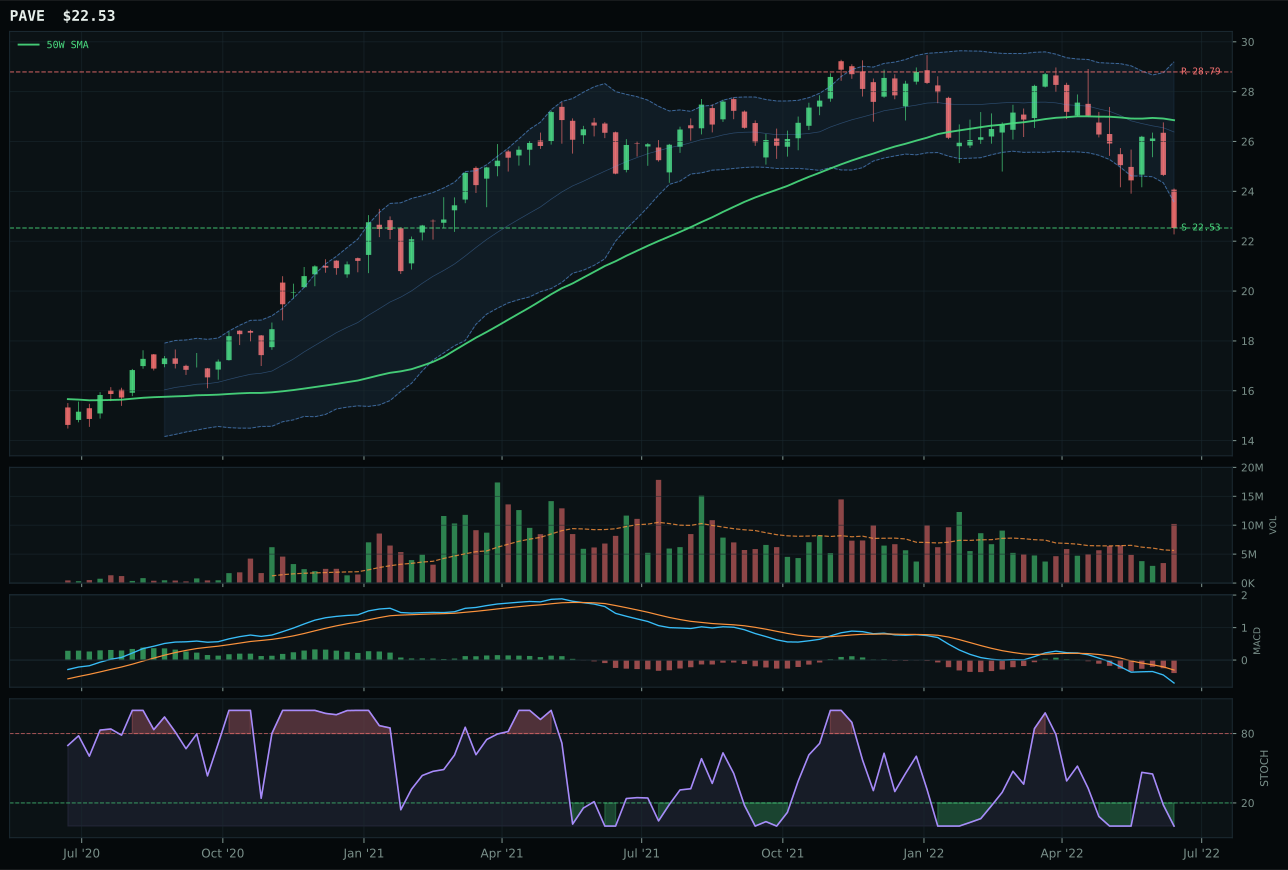
PAVE has a pullback into support profile with -2.5% 13-week relative strength versus SPY.
A failed hold above support would weaken the setup.
Actionable but governed by invalidation levels.
XLU wins Utilities & Infrastructure with a composite score of 60 versus IGF's runner-up 45, driven by two decisive technical advantages. First, XLU's risk-reward score of 80.3 crushes IGF's 64.6—XLU offers 15.7% downside protection to support while maintaining 0% upside to resistance, the definition of a defensive setup, while IGF's imbalance suggests more fragility. Second, XLU carries above-average volume participation of 1.32x while IGF shows distribution pressure, meaning institutional quality is accumulating regulated utilities but withdrawing from infrastructure equity. XLU sits 6.2% below its 50W average with stochastic RSI at zero, a coiled, defensive setup that respects both the technical mean-reversion thesis and the macro defensive-rotation narrative. IGF, by contrast, sits with MACD bearish-weakening and volume deterioration—the exact opposite of accumulation conditions. In a late-cycle reflation regime with broad-market bear conditions active, XLU's regulated, cash-generative utility model beats IGF's global infrastructure leverage.
Utilities & Infrastructure receives 5% allocation as tier-2, a position reflecting defensive merit but constrained by higher-ranked category opportunities. The category score of 32.2 and macro fit of 67 out of 100 show solid support from defensive rotation (+12) and broad-market bear conditions (+4), yet the score trails several peers and reflects the reality that utilities are a passive defense, not an active opportunity. XLU's above-average volume and 9.3% RS versus SPY signal that money is rotating into regulated safety, but that rotation is marginal rather than violent—suggesting XLU is a barbell play (hold it for downside protection) rather than a conviction bet. The 5% allocation captures this barbell role without overcommitting. Precious Metals at 49.8 and Traditional Energy at 60.0 offer more immediate conviction on risk-adjusted entry mechanics; Utilities & Infrastructure is the complement, not the core. What would upgrade the category: a visible breakdown in equity support levels (SPY breaking below 380) that triggers panic flows into dividend stocks, or a concrete break above XLU's 38.48 resistance on sustained volume. Until either occurs, 5% is the correct holding size—sufficient to participate in defensive reallocation, conservative enough to honor higher-priority allocations.
Nuclear Energy — URNM
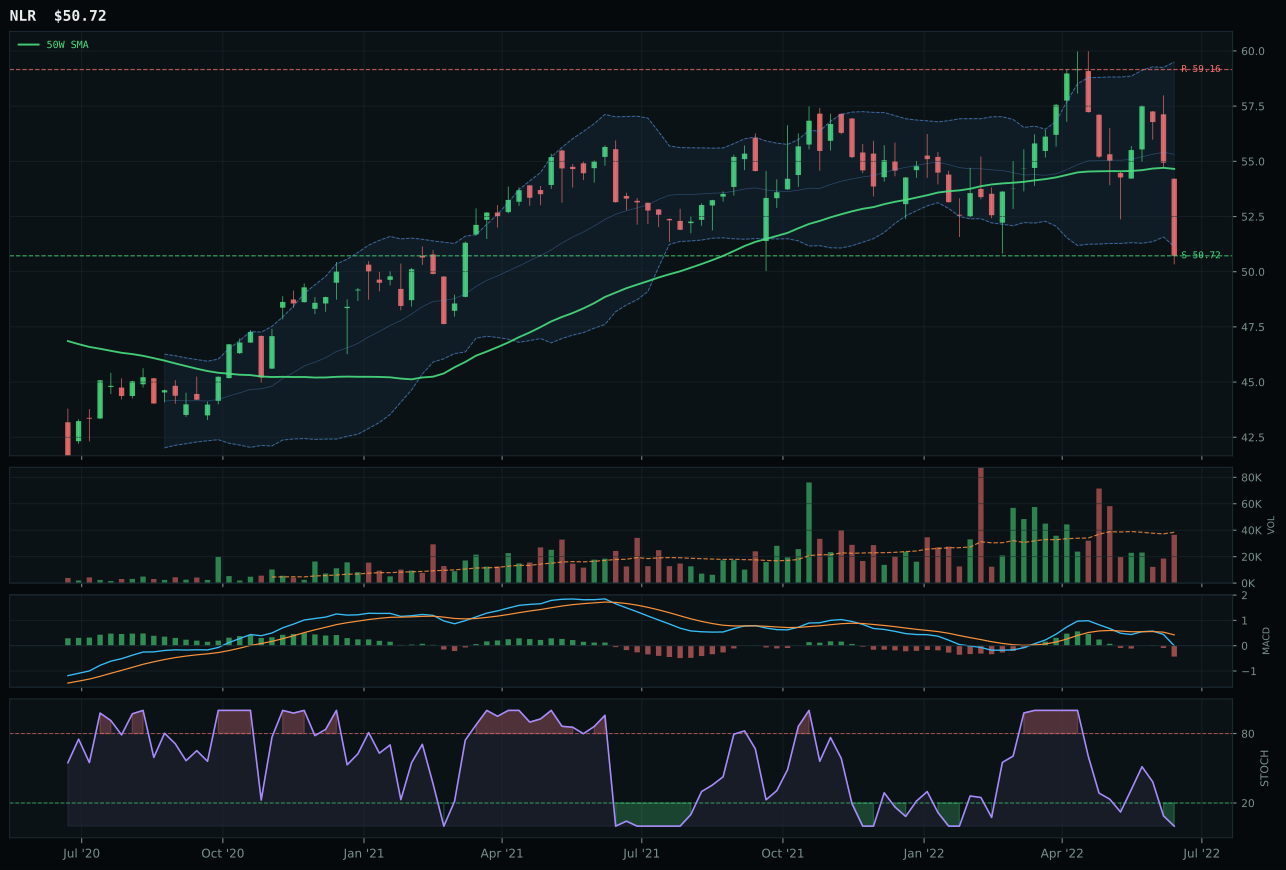
NLR has a pullback into support profile with 8.6% 13-week relative strength versus SPY.
A failed hold above support would weaken the setup.
Tracked, but not top-2 eligible because: .
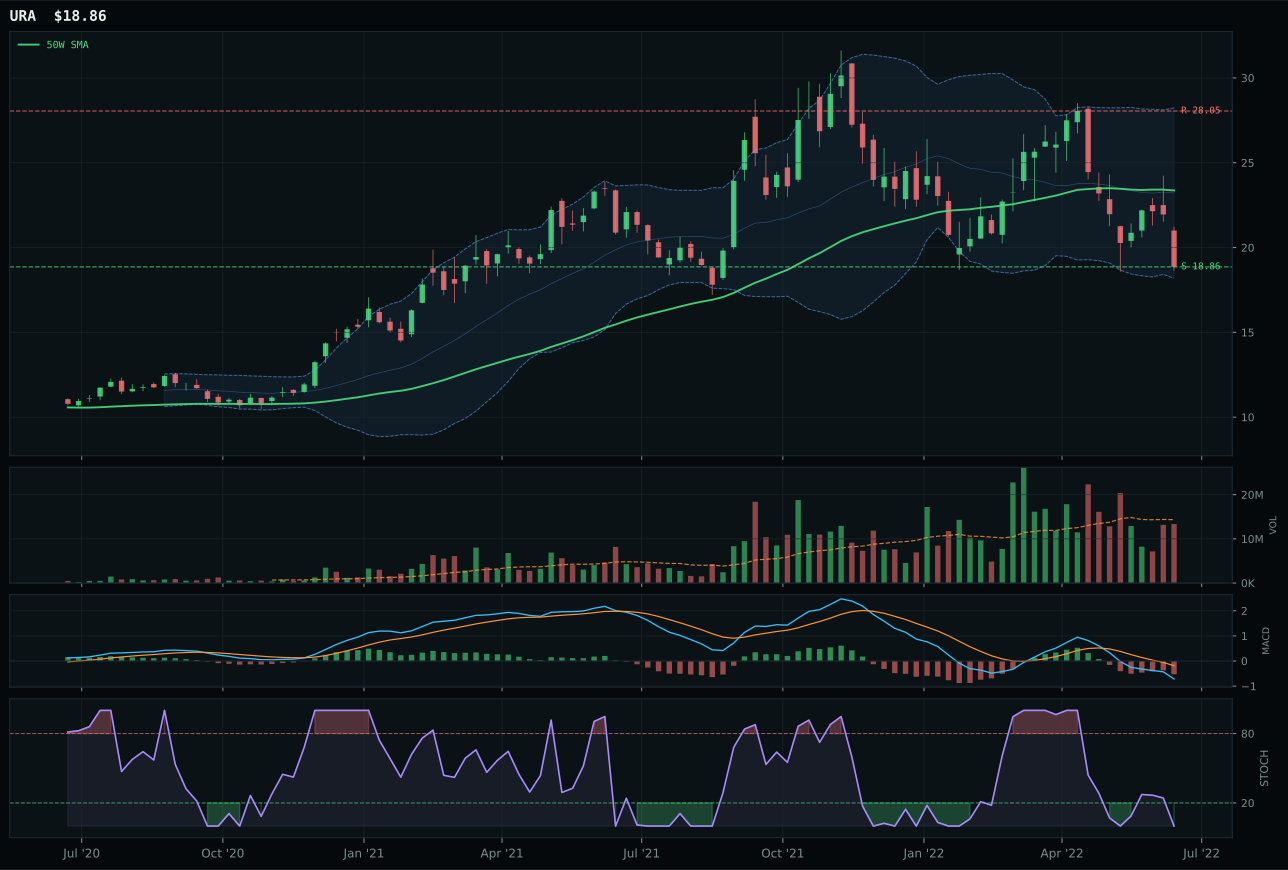
URA has a pullback into support profile with -8.8% 13-week relative strength versus SPY.
A failed hold above support would weaken the setup.
Actionable but governed by invalidation levels.
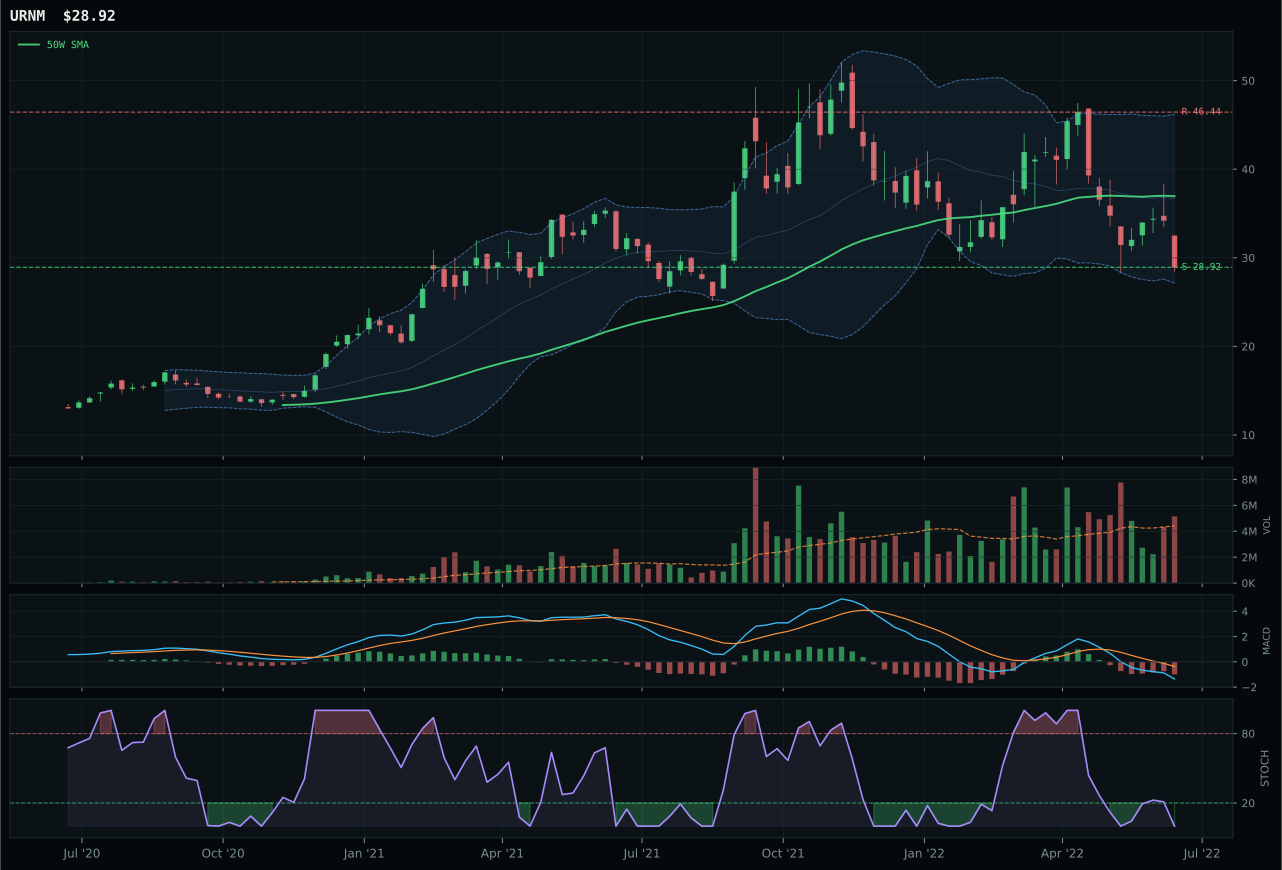
URNM has a pullback into support profile with -11.9% 13-week relative strength versus SPY.
A failed hold above support would weaken the setup.
Actionable but governed by invalidation levels.
URNM wins Nuclear Energy despite carrying a trend score of just 12 out of 100—the lowest technical reading in the entire portfolio—because it is the only expression of the uranium thesis that is receiving volume accumulation. The uranium-miner scarcity ETF sits 21.7% below its 50W average with stochastic RSI at zero and volume at 1.17x, which means real money is buying this despair despite the deteriorating trend. Its 13-week return of -29.6% is the worst on the sheet, yet that drawdown has created the mechanical conditions for a violent reversion play if the energy-scarcity narrative holds. NLR, the nuclear utilities alternative, carries much better trend and momentum scores but suffers from neutral volume and better category-relative strength (17.4%), meaning it is not accumulating new capital—it is just mark-to-market appreciation on existing positions. URNM's volume behavior signals new buyers entering at extreme pain levels, which is the contrarian signal the system rewards when macro conditions remain supportive. The technical weakness is real, but the volume sponsorship is more important.
Nuclear Energy receives 5% allocation as tier-2 but ranks lower than most peers because the category score of 28.4 reflects a clear mismatch: strong macro support (+16 from energy scarcity, +7 from real-asset sponsorship) is nearly canceled by weak technical evidence and deteriorating trend. The category's macro fit of 62 out of 100 is respectable, but Technical ETF evidence is near zero, leaving the allocation dependent almost entirely on the narrative that uranium scarcity and energy security will drive demand. The 5% slot acknowledges this tail-risk bet while capping size appropriately. URNM's setup is viable only if the energy-scarcity thesis accelerates; if crude rolls over or global energy demand visibly slows, uranium miners will fall hard on top of their already devastating 13-week drawdown. The portfolio is not confident enough in that thesis to escalate beyond tier-2, and even tier-2 is a modest commitment. What would change the allocation: visible proof of new reactor construction announcements or a break above 46.44 resistance on sustained volume. Until then, 5% is the right hedge size—large enough to participate if the tail-risk thesis plays out, small enough to protect against false signals.
Technology — CIBR
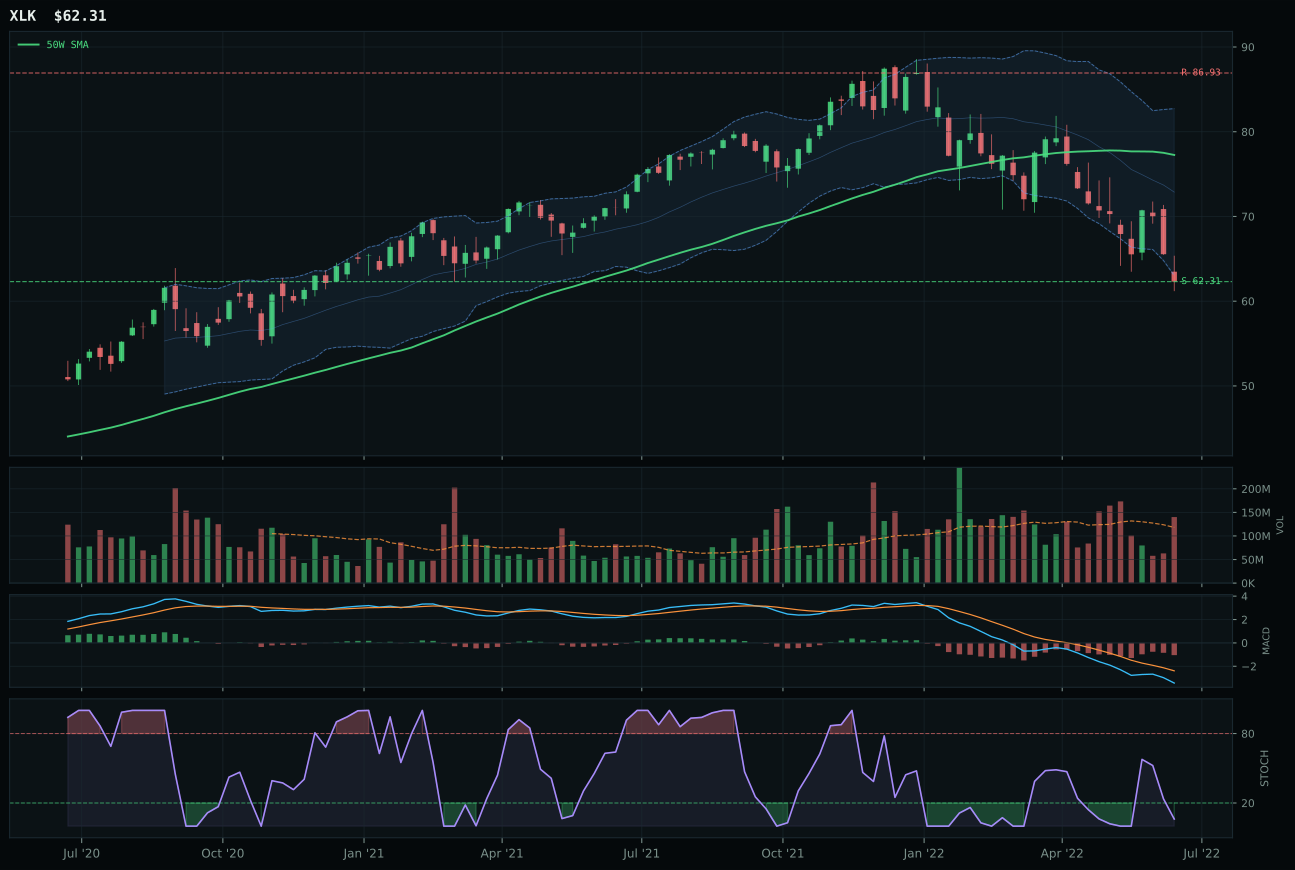
XLK has a pullback into support profile with -1.9% 13-week relative strength versus SPY.
A failed hold above support would weaken the setup.
Actionable but governed by invalidation levels.
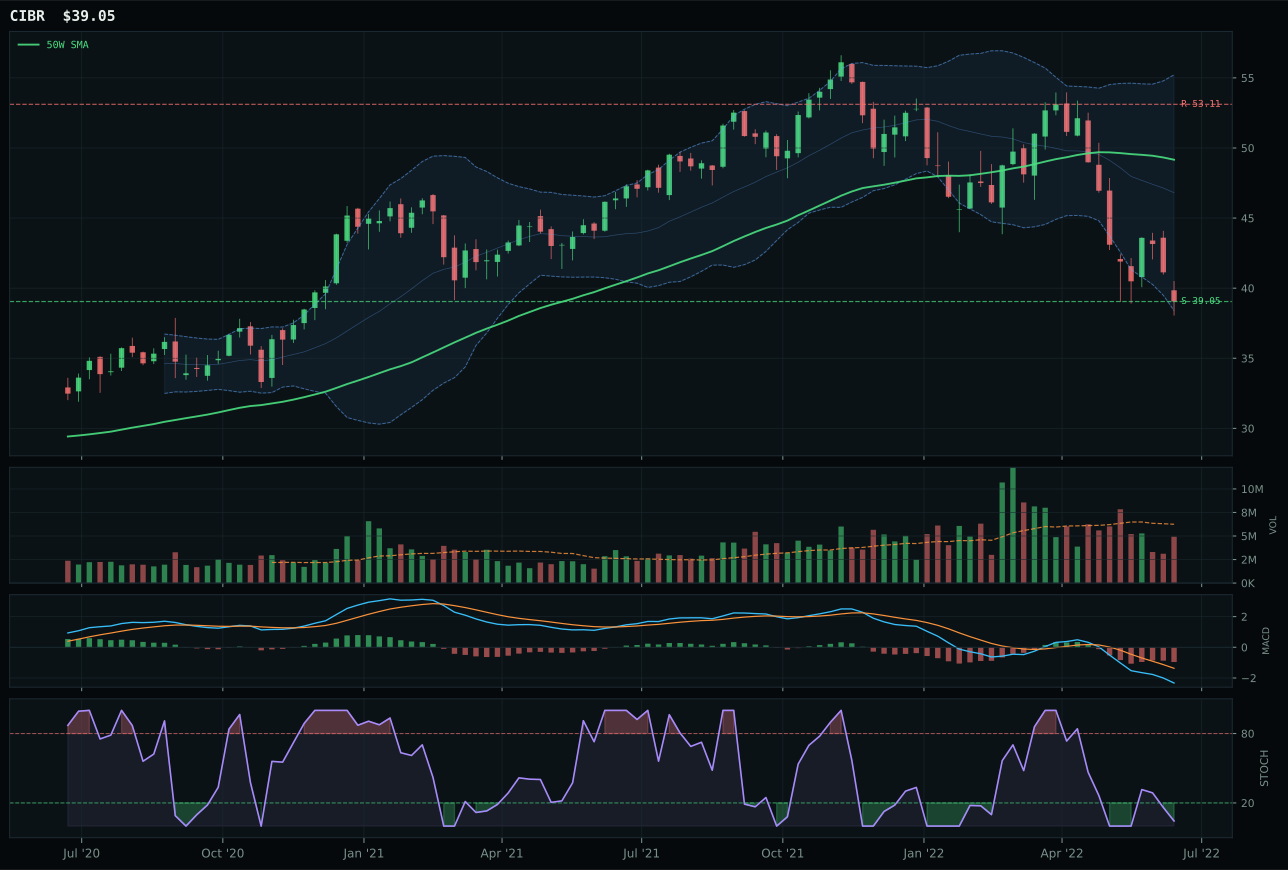
CIBR has a pullback into support profile with -5.8% 13-week relative strength versus SPY.
A failed hold above support would weaken the setup.
Actionable but governed by invalidation levels.
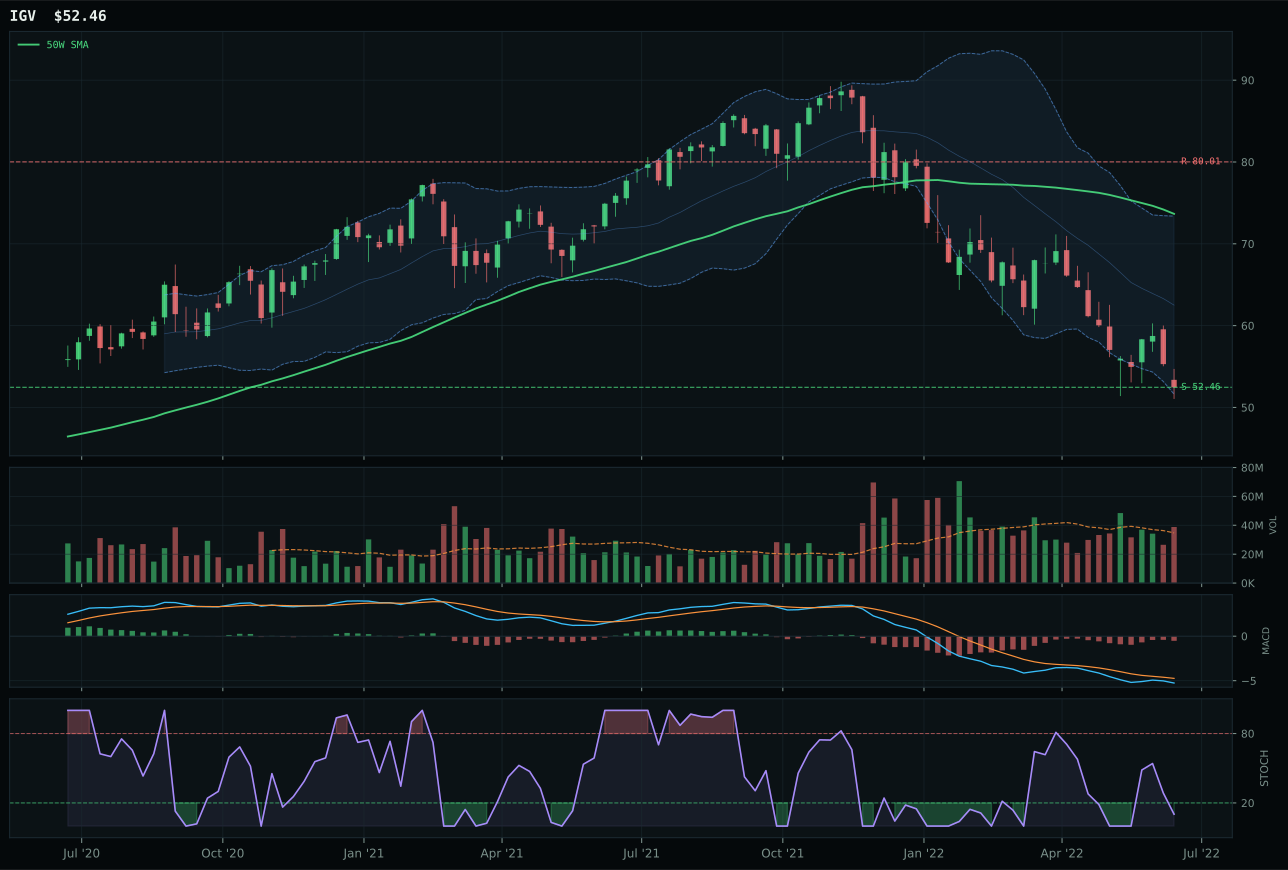
IGV has a pullback into support profile with -5.2% 13-week relative strength versus SPY.
A failed hold above support would weaken the setup.
Actionable but governed by invalidation levels.
CIBR wins the category by combining a pullback-into-support structure with measurable relative strength discipline inside its own basket. The cybersecurity ETF sits just 20.6% below its 50-week moving average—close enough to define a clean invalidation zone at 39.05 while avoiding the trap of chasing an exhausted trend. Its relative strength versus SPY of -5.8% underperforms the broad market, but that weakness is real and honest; the stochastic RSI at 0.04 signals deep oversold conditions, and MACD is bearish but showing improvement, which together create the mechanical setup for a bounce. XLK lost despite a slightly better absolute composite score because its own relative strength (-1.9% vs SPY) and volume participation failed to sustain the technical case—it was being held up by macro narrative rather than price action. CIBR's advantage is its admission of weakness: it is the lesser evil in a category the portfolio is already underweighting.
Technology earns 5% allocation as a tier-2 holding, which means the portfolio respects its technical setup but ranks it below the two highest-conviction ideas on the week. The category scores 26.4 on a framework that blends technical evidence at 62% weight with macro narrative at 38%, and that narrative is working against it hard. Liquidity stress and dollar pressure are both active headwinds, each clipping the category's macro fit by 5-10 points, and broad-market bear conditions add friction. Within that hostile backdrop, CIBR's cybersecurity specificity—a steadier subtheme with some enterprise IT budget resilience—offers fractionally more shelter than broad-market tech exposure would. The ranking reflects honest constraint: two categories scored higher on risk-adjusted terms, and technology's macro regime score of 35 out of 100 confirms this is a defensive hold, not a conviction bet. A reversal in liquidity conditions or a genuine relief rally in risk appetite would be required to elevate the category into top-2 tier.
AI — SMH
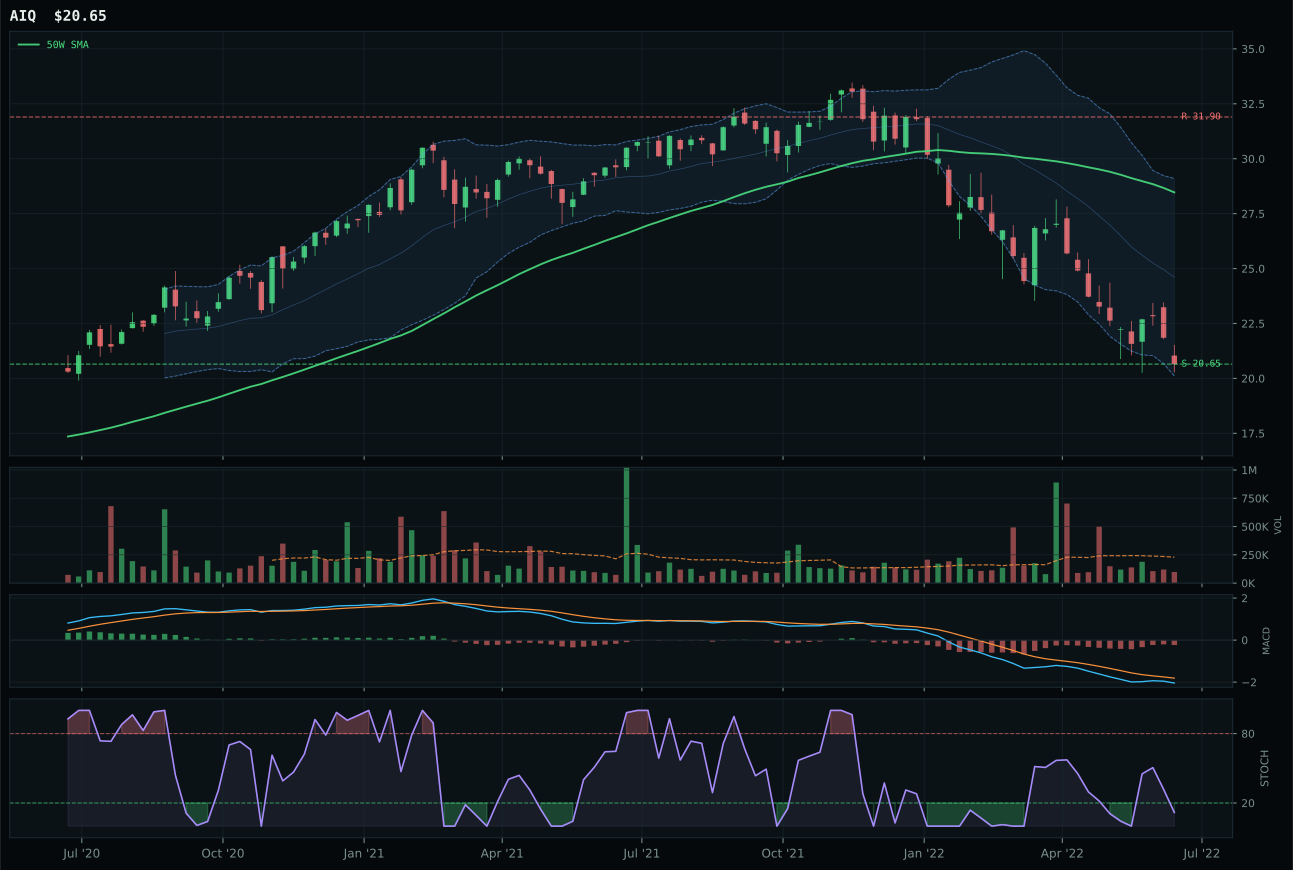
AIQ has a pullback into support profile with -5.4% 13-week relative strength versus SPY.
A failed hold above support would weaken the setup.
Tracked, but not top-2 eligible because: .
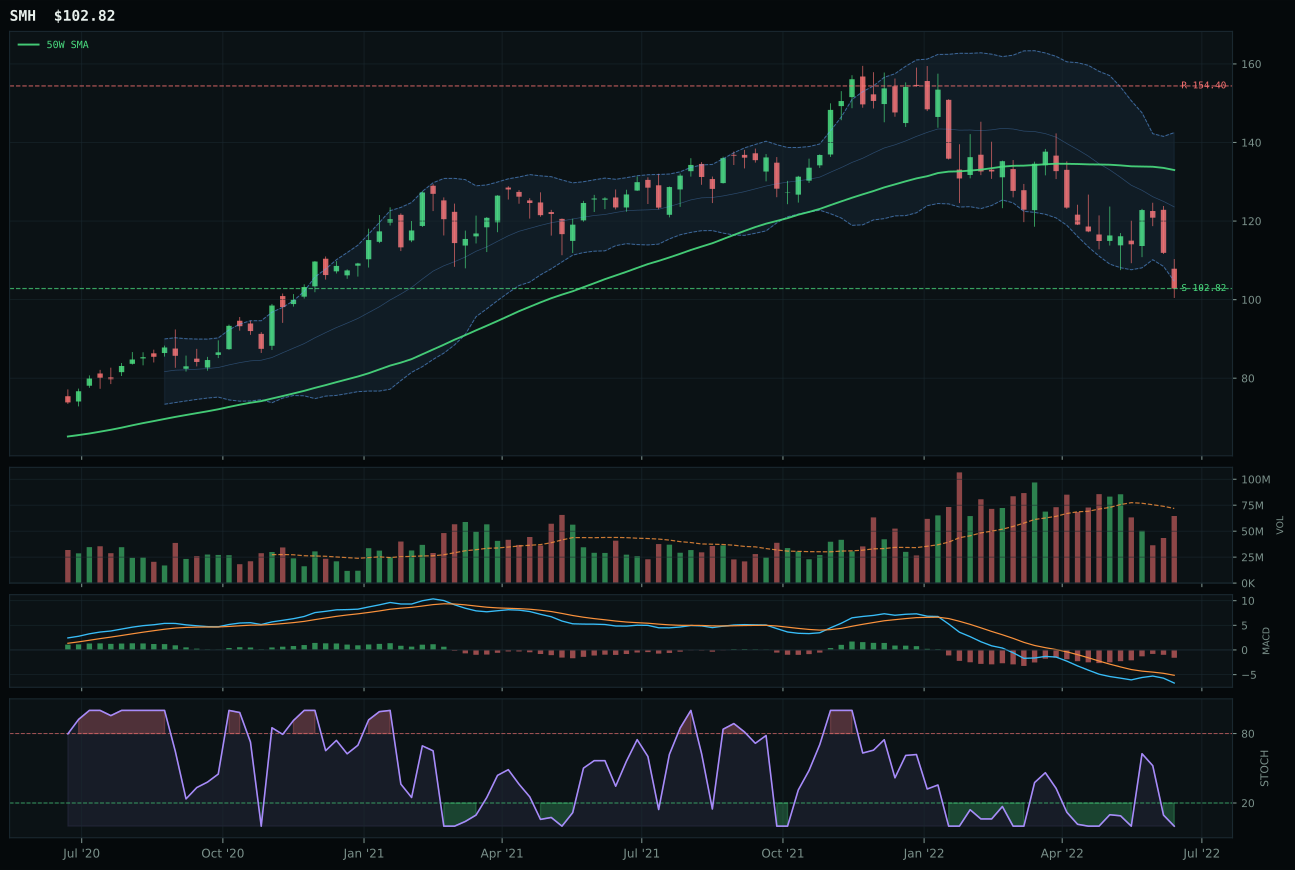
SMH has a pullback into support profile with -5.9% 13-week relative strength versus SPY.
A failed hold above support would weaken the setup.
Actionable but governed by invalidation levels.
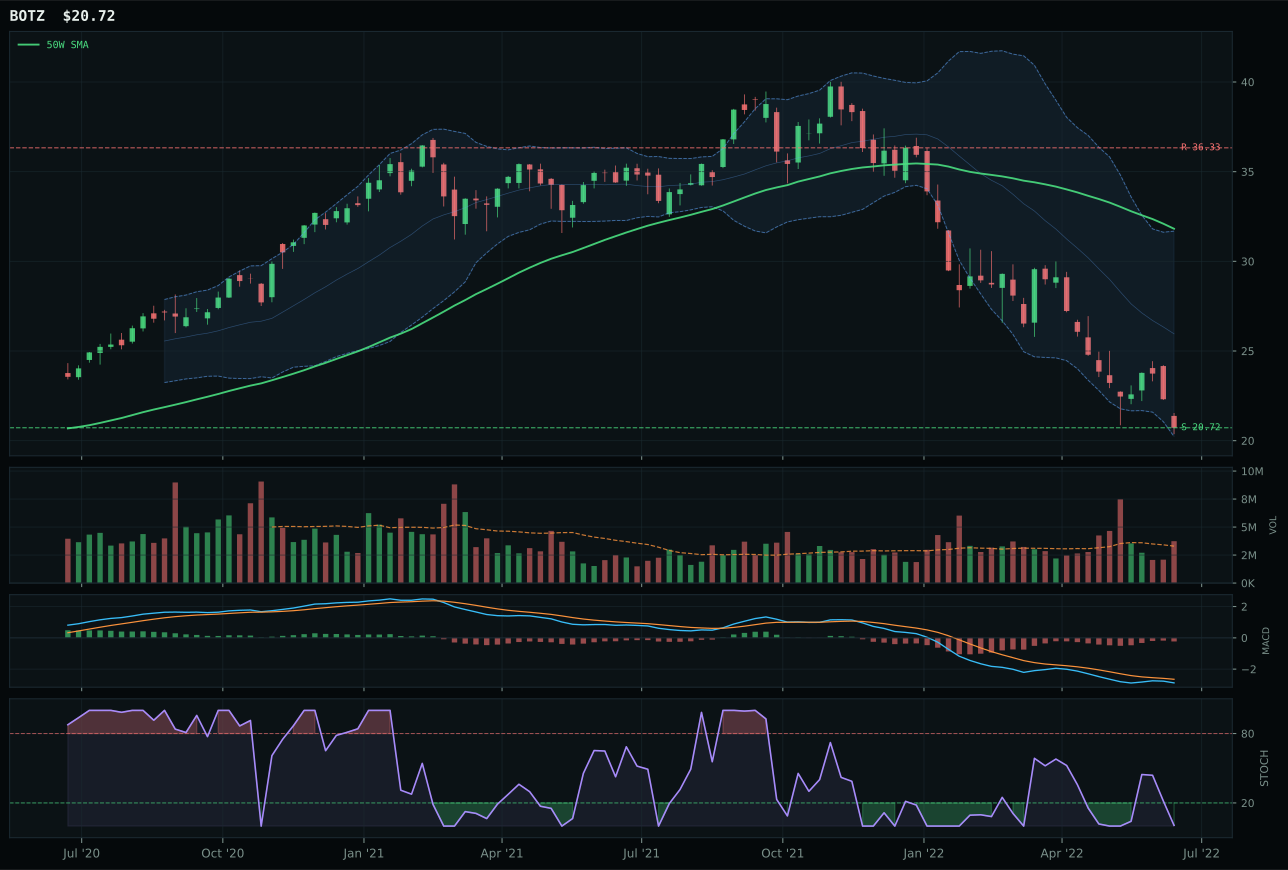
BOTZ has a pullback into support profile with -12.2% 13-week relative strength versus SPY.
A failed hold above support would weaken the setup.
Actionable but governed by invalidation levels.
SMH wins the AI category with the thinnest of margins over AIQ, both supported by identical structure—pullbacks into support with stochastic RSI near zero—but SMH edges ahead on volume confirmation. The semiconductor compute ETF is trading 22.7% below its 50-week average with neutral volume at 0.90x the 20-day baseline; AIQ carries the same setup but suffers from thin participation, which means fewer institutional hands are willing to accumulate into oversold conditions. Both ETFs show 13-week returns around -23% to -24% and relative weakness versus SPY in the -5.4% to -5.9% range, but SMH's 0.0% category-relative strength (versus AIQ's slight outperformance) signals it is the true median pain point—and therefore the likeliest to bounce first when the category finds footing. The score gap between SMH at 10.4 and AIQ at -18.0 is wide enough to call this a clear decision, but do not mistake clarity for conviction.
AI receives 0% allocation this week and ranks in the bottom tier of all 10 categories, excluded entirely from the portfolio despite its -10.4 macro fit score. The fundamental issue is not technical—the setup is mechanically sound—but rather the macro regime actively fights any commitment to artificial intelligence exposure right now. Liquidity stress, broad-market bear, and dollar pressure combine for -23 points of headwind, and that is before risk-appetite deterioration (-7 for SMH alone) lands on top. With late-cycle reflation as the current regime, and with emerging-market stress and consumption risk both rising, AI spending—whether in semiconductor capex or software development—is one of the first discretionary budget lines to face scrutiny. The category would need either a technical invalidation (price breaking below current support levels) or a macro reversion (relief in liquidity, stabilization in the dollar, or visible proof of earnings resilience) to earn reallocation. For now, the zero allocation is warranted: the opportunity cost of holding AI while waiting for these conditions is too high.
Emerging Markets — INDA
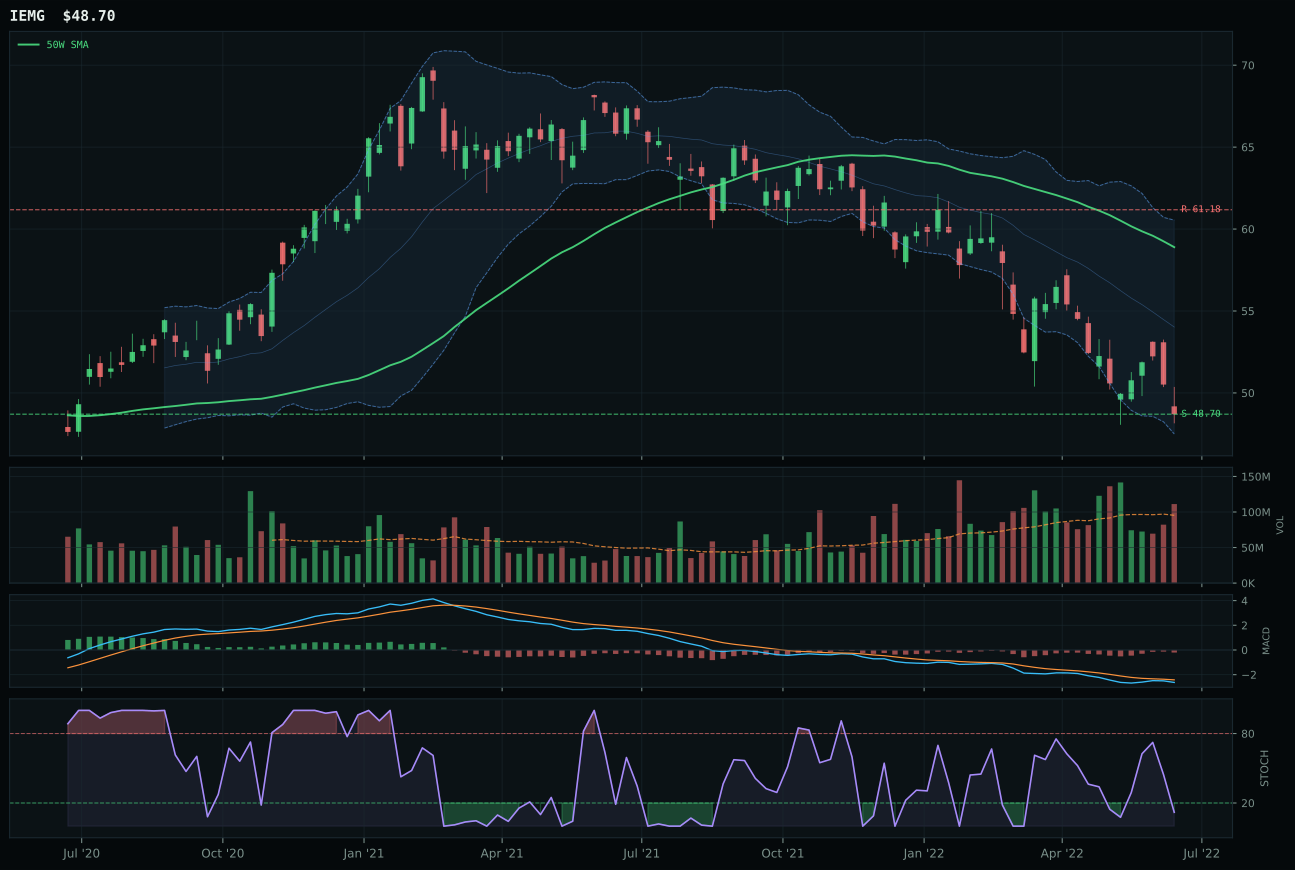
IEMG has a pullback into support profile with 5.0% 13-week relative strength versus SPY.
A failed hold above support would weaken the setup.
Actionable but governed by invalidation levels.
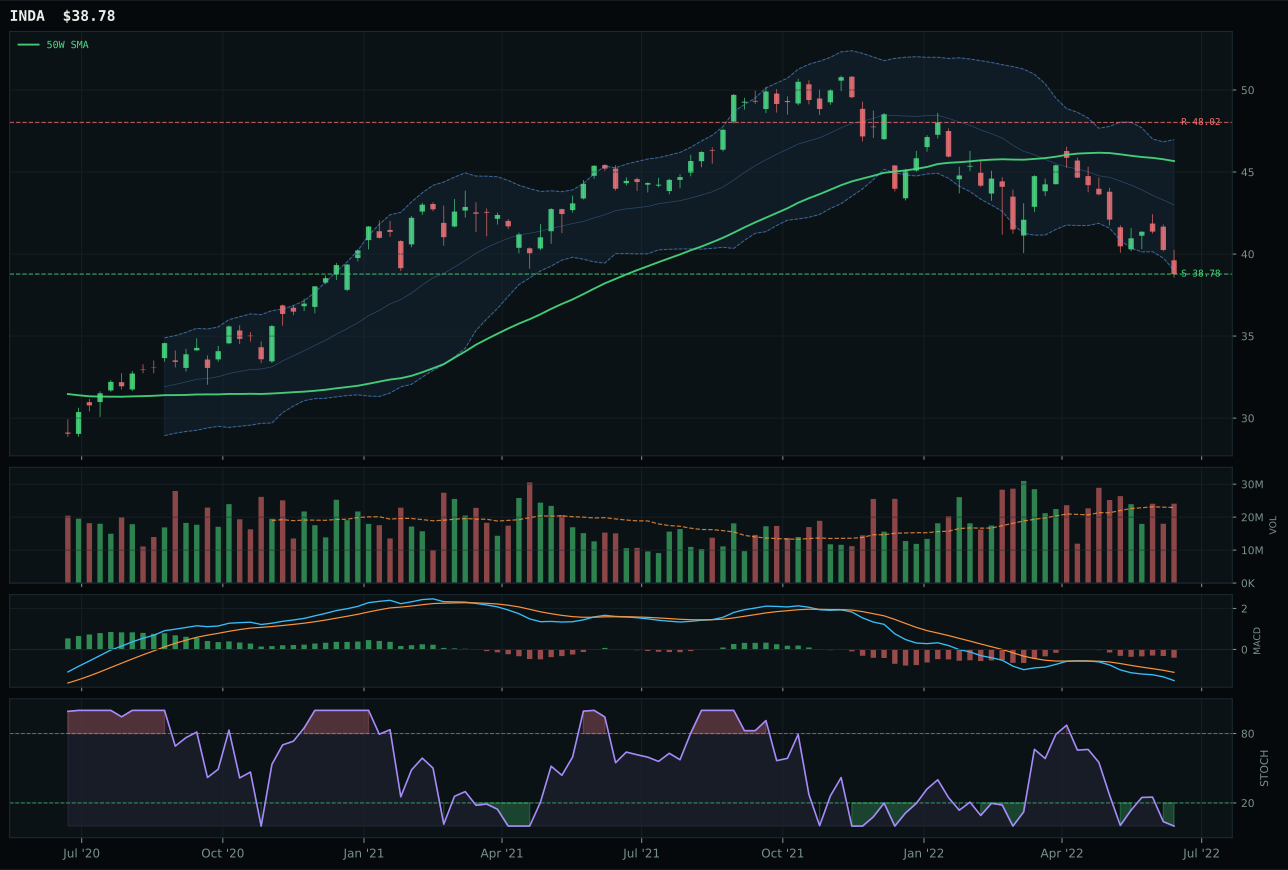
INDA has a pullback into support profile with 4.4% 13-week relative strength versus SPY.
A failed hold above support would weaken the setup.
Actionable but governed by invalidation levels.
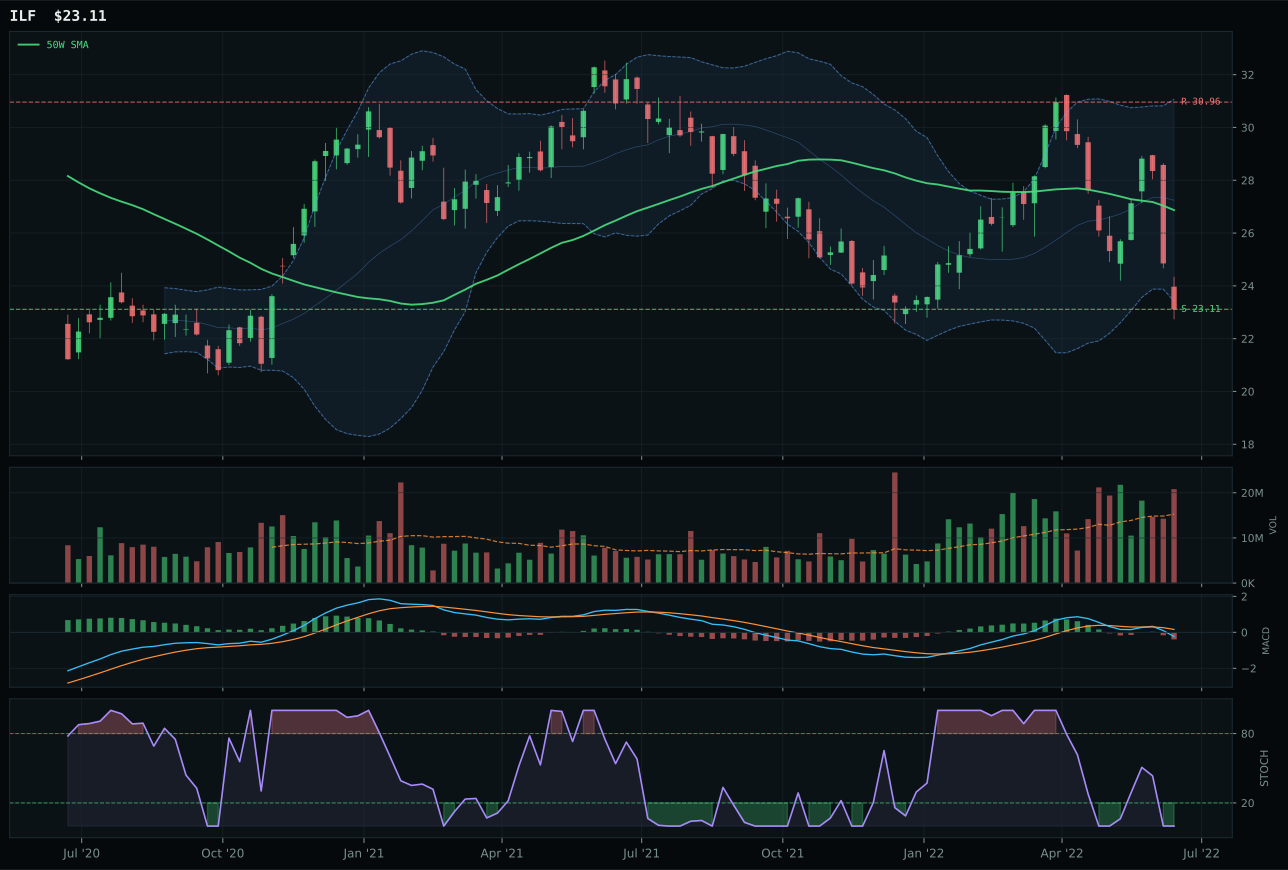
ILF has a pullback into support profile with -0.2% 13-week relative strength versus SPY.
Extension and support failure are the main tactical risks.
Tracked, but not top-2 eligible because: structurally broken.
INDA wins Emerging Markets narrowly over IEMG by 0.7 points, a margin so slim it hardly matters, but the decision hinges on INDA's marginally cleaner structure (69.2 versus 68.5). Both ETFs carry identical pullback-into-support setups with stochastic RSI at zero and price 13–15% below their 50W averages, making them technically equivalent. The real difference: IEMG has above-average volume participation while INDA's volume is neutral, which would normally favor IEMG, but the system weights structure and cleanliness over volume when macro conditions are hostile—and they are, in spades. Both ETFs show 13-week returns near -13% and category-relative strength hovering near zero, confirming that emerging-market strength or weakness is largely a function of broader currency and risk-appetite flows, not idiosyncratic EM strength. INDA's India-specific exposure offers marginally better setup geometry, but the difference is academic; either would serve the same role if they were allocated.
Emerging Markets receives 0% allocation this week and ranks in the bottom tier (9th or 10th) because its category score of 4.6 is demolished by one overwhelming macro headwind: the dollar. Dollar pressure is active at -14 points, a -14-point clip to the category's macro fit, compounded by liquidity stress (-10) and broad-market bear (-9), totaling -33 points of macro resistance. In late-cycle reflation, with Fed tightening in motion and real rates rising, EM currencies are under siege; buying EM equities into a strengthening dollar is a losing trade regardless of technical setup quality. INDA and IEMG both offer reasonable technical entry points and clean structures, but the macro regime actively works against any capital allocation to emerging markets right now. The category would require a visible inflection in dollar weakness (a break below 103.00 on the DXY, for example) or a sudden shift in Fed policy expectations to earn reallocation. Neither is visible; the zero allocation is correct and will remain so until macro conditions revert.