
2022-06-10
Informational purposes only. The content in this report, including allocations, analysis, and commentary, is provided solely for informational and educational purposes. It does not constitute financial advice, investment advice, trading advice, or any other type of advice. Past performance does not guarantee future results. Always conduct your own research and consult a qualified financial professional before making investment decisions.
Macro risk engine requires the 50% Defensive overlay for this run; payload selected by cause: Inflation Scarcity.
Weekly Allocation
| Ticker | Category | Weight | Role |
|---|---|---|---|
| XLE | 50% | Overlay | |
| XOP | Traditional Energy | 10% | Top-2 (10%) |
| COPX | Industrial Metals | 10% | Top-2 (10%) |
| VEGI | Agriculture & Livestock | 5% | Tier-2 (5%) |
| XLU | Utilities & Infrastructure | 5% | Tier-2 (5%) |
| GLD | Precious Metals | 5% | Tier-2 (5%) |
| URNM | Nuclear Energy | 5% | Tier-2 (5%) |
| ITA | Defense & Aerospace | 5% | Tier-2 (5%) |
| IGV | Technology | 5% | Tier-2 (5%) |
Trade Instructions — Monday Open
Sell the tranche from 2022-05-13 (completing its 4-week hold). Buy the new tranche. Instructions show net portfolio changes — same-asset positions cancel, weight changes show the delta.
| Action | Ticker | Instruction |
|---|---|---|
| SELL | SGOV | Sell entire SGOV position (12.50% of portfolio) |
| SELL | WEAT | Sell 33% of WEAT position (reduce 7.50% → 5.00%) |
| SELL | SLV | Sell entire SLV position (1.25% of portfolio) |
| SELL | URA | Sell 25% of URA position (reduce 5.00% → 3.75%) |
| SELL | IEMG | Sell entire IEMG position (1.25% of portfolio) |
| BUY | XLE | Buy XLE — 53.33% of freed cash (adds 10.00% to portfolio) |
| BUY | COPX | Buy COPX — 6.67% of freed cash (adds 1.25% to portfolio) |
| BUY | GLD | Buy GLD — 6.67% of freed cash (adds 1.25% to portfolio) |
| BUY | VEGI | Buy VEGI — 6.67% of freed cash (adds 1.25% to portfolio) |
| BUY | IGV | Buy IGV — 6.67% of freed cash (adds 1.25% to portfolio) |
| BUY | XOP | Buy XOP — 13.33% of freed cash (adds 2.50% to portfolio) |
| BUY | URNM | Buy URNM — 6.67% of freed cash (adds 1.25% to portfolio) |
Current Portfolio After Trade
Combined holdings across all 4 active tranches. Each tranche is 25% of the portfolio.
| Ticker | % of Portfolio | Weight Bar |
|---|---|---|
| XLE | 57.50% | |
| COPX | 6.25% | |
| WEAT | 5.00% | |
| ITA | 5.00% | |
| GLD | 5.00% | |
| URA | 3.75% | |
| VEGI | 3.75% | |
| XLU | 2.50% | |
| IGF | 2.50% | |
| XLK | 2.50% | |
| IGV | 2.50% | |
| XOP | 2.50% | |
| URNM | 1.25% |
Macro Regime — Late-Cycle Reflation
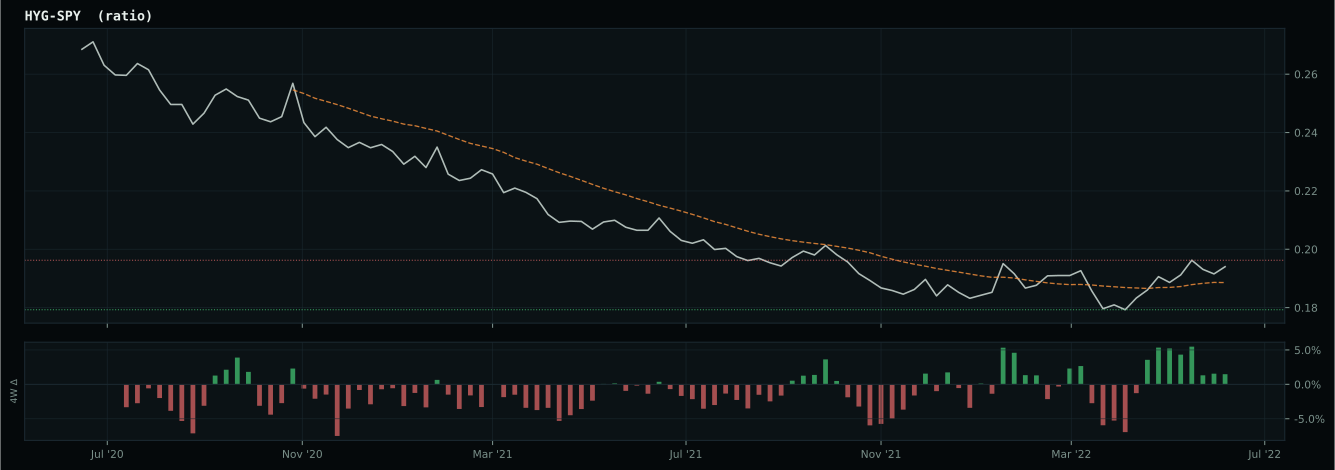
growth data is not confirming the weak market-implied risk appetite signal
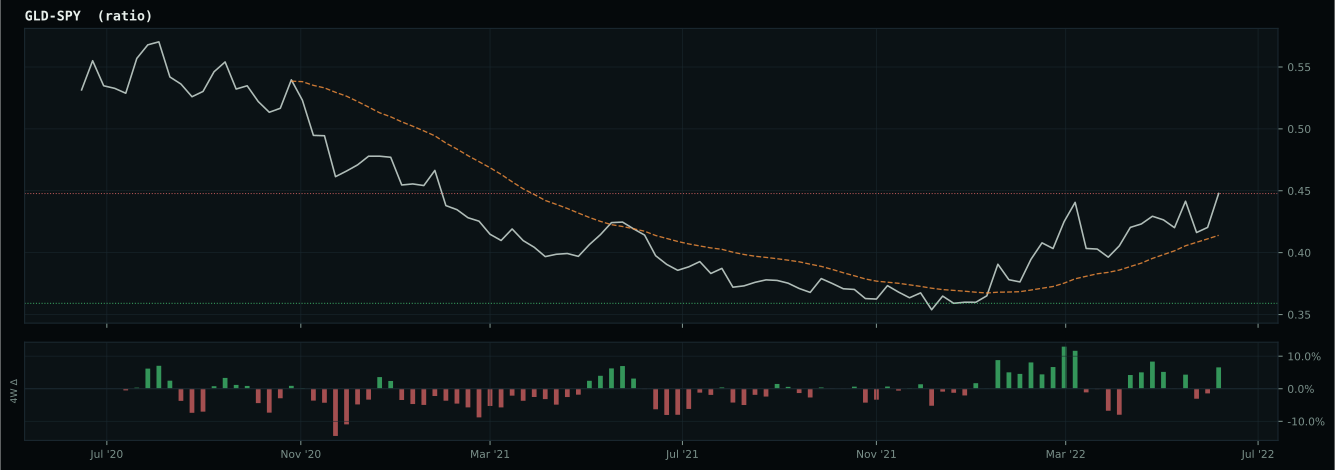
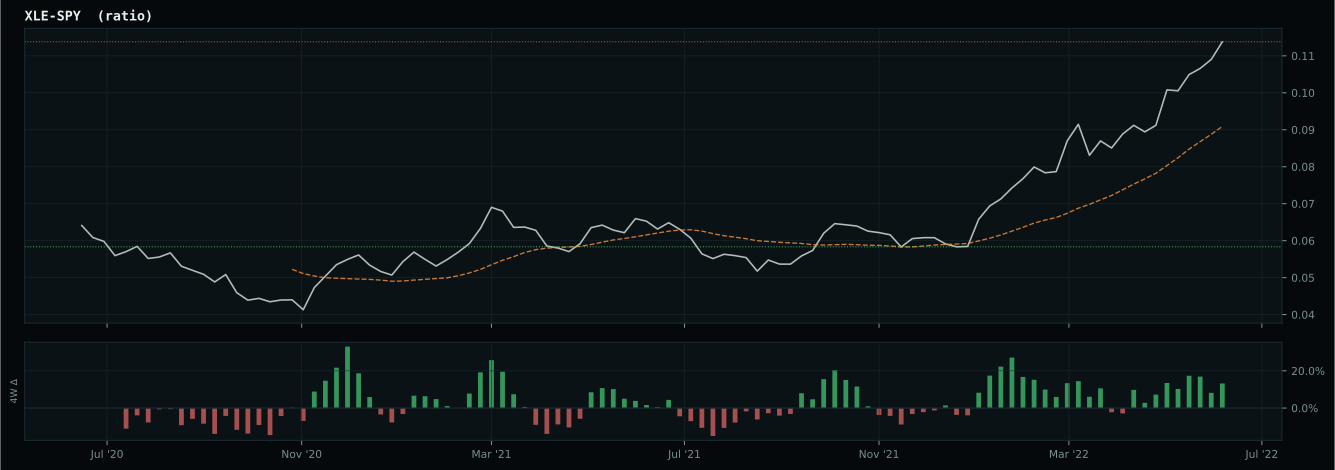
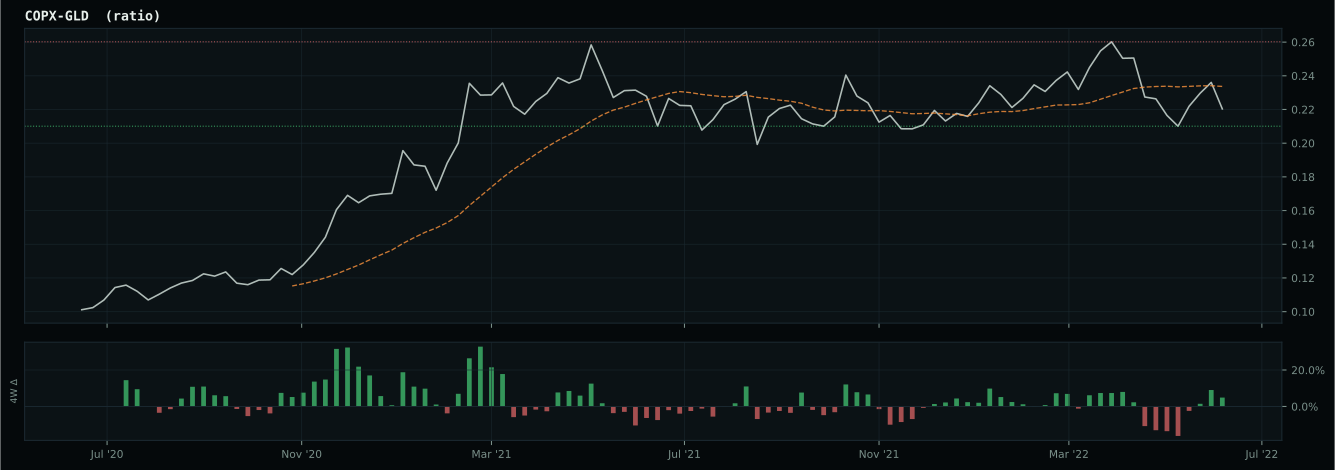
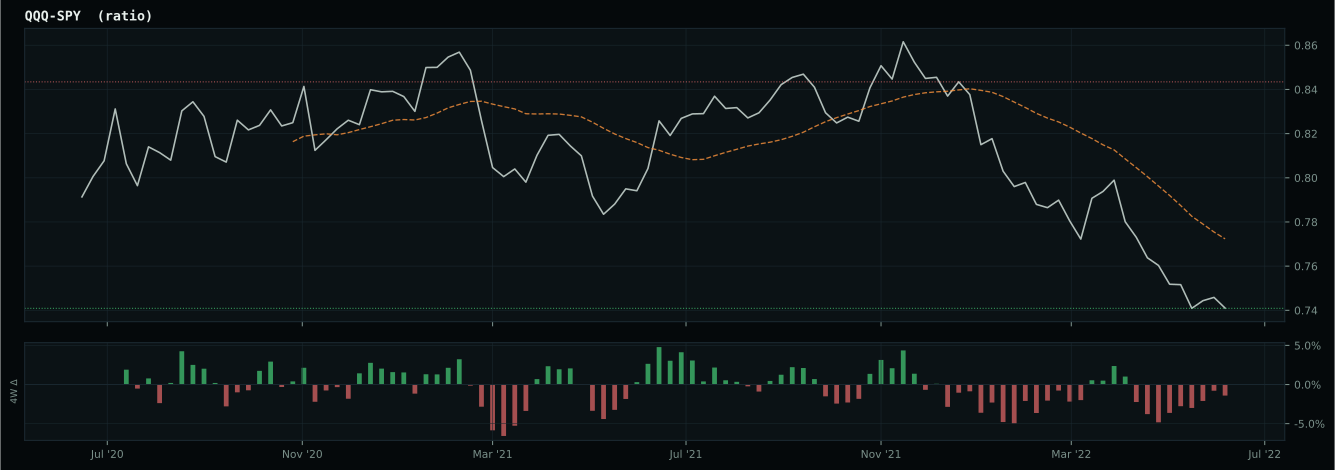
Defensive overlay cause is inflation/scarcity: energy, commodity breadth, or oil-versus-gold confirmation is stronger than the broad equity tape, so the sleeve owns the inflation pressure. XLE has been confirmed above its 8W SMA and is eligible.
Macro Evidence Charts
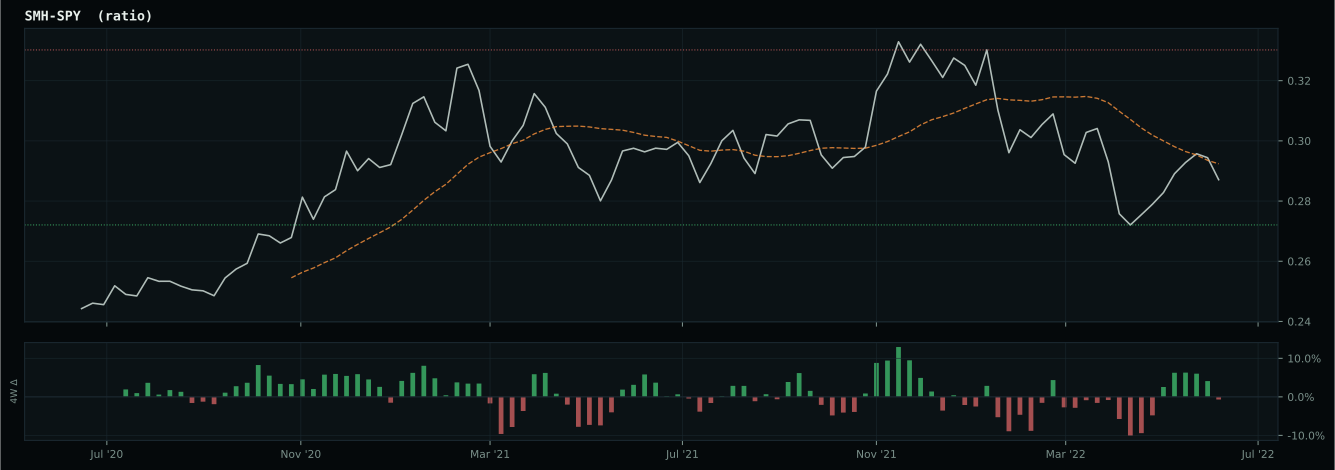
Market-implied signals behind the macro regime scores. Each ratio compares two assets; the direction and slope of the ratio is what the macro engine reads.
Crypto Regime — NoCrypto
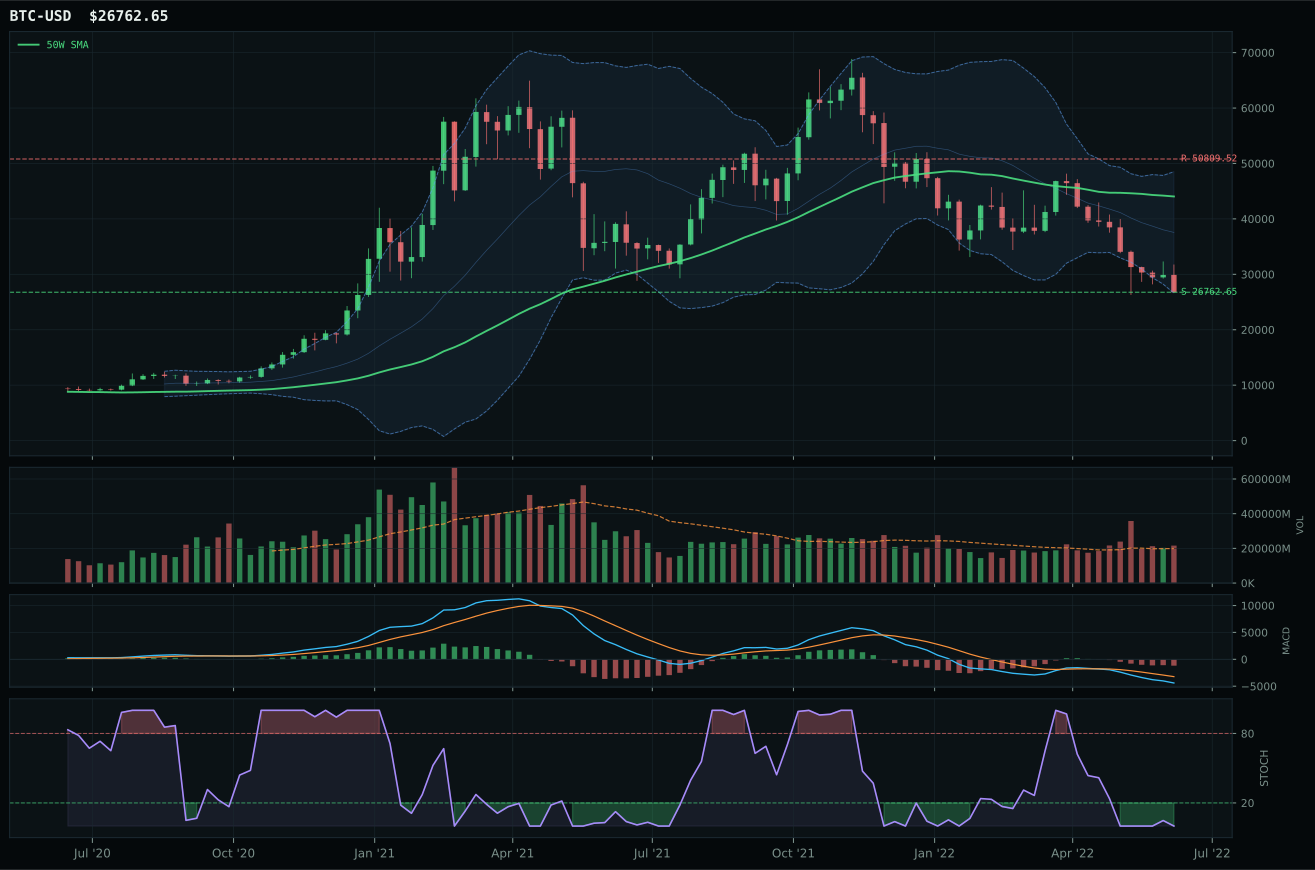
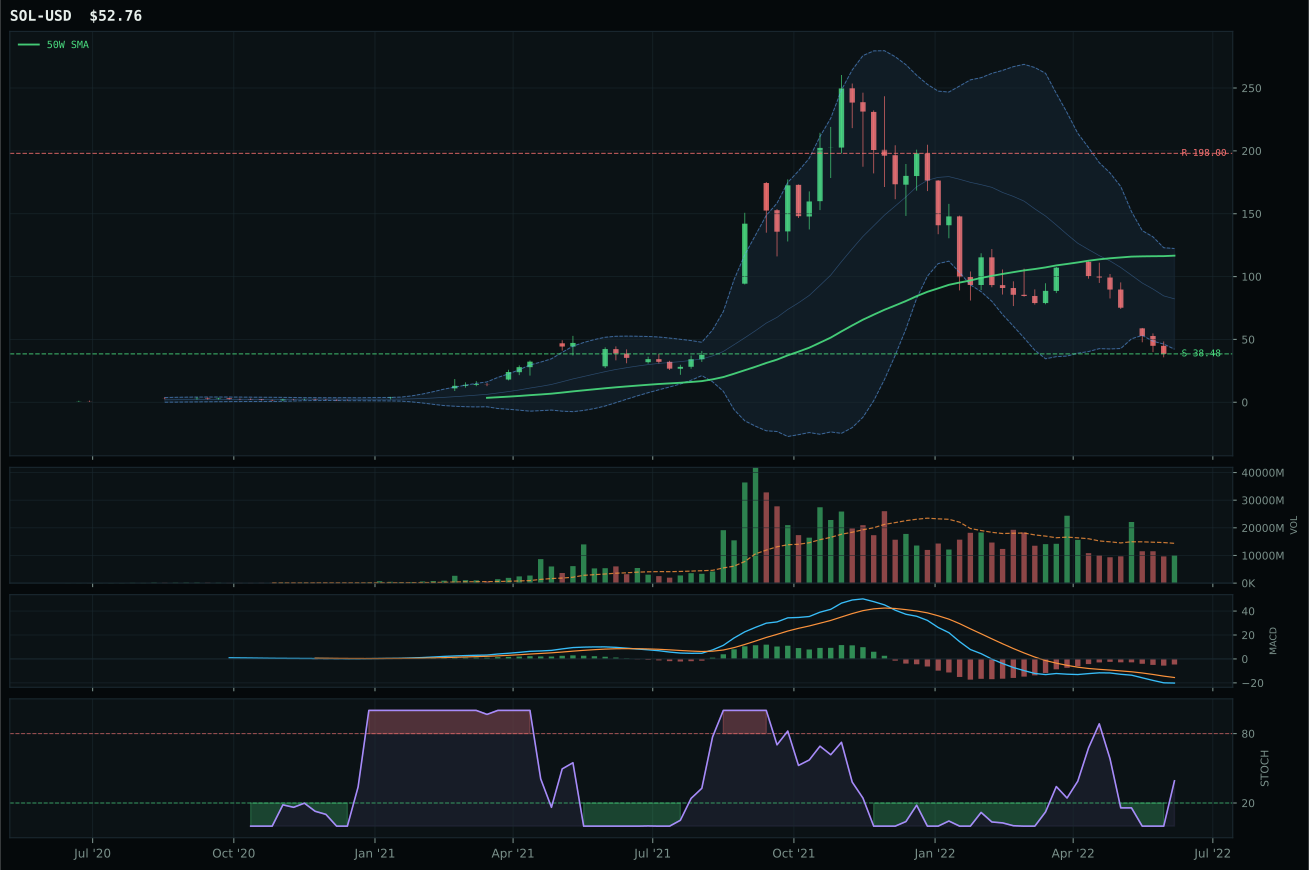
ValueBTC not armed: BTC has not made the first post-breakdown touch of the 200W buy zone after losing the 50W
TrendBTC not confirmed
one or more available conditions failed
Category Rankings
| Rank | Category | Winner | Score | Alloc | 4W Ret | Peers (4W) |
|---|---|---|---|---|---|---|
| 1 | Traditional Energy | XOP | 81.9 | 20% | -24.99% | FCG -24.4% · XLE -18.6% |
| 2 | Industrial Metals | COPX | 52.6 | 20% | -22.85% | REMX -10.2% · PICK -16.0% |
| 3 | Agriculture & Livestock | VEGI | 46.4 | 10% | -6.69% | WEAT -16.9% · MOO -5.6% |
| 4 | Utilities & Infrastructure | XLU | 44.2 | 10% | -1.25% | IGF -3.6% · PAVE -4.9% |
| 5 | Precious Metals | GLD | 43.9 | 10% | -5.40% | GDX -14.6% · SLV -10.1% |
| 6 | Nuclear Energy | URNM | 40.7 | 10% | -10.06% | URA -9.8% · NLR -3.5% |
| 7 | Defense & Aerospace | ITA | 37.4 | 10% | +0.65% | ROKT -1.3% · XAR +0.1% |
| 8 | Technology | IGV | 24.4 | 10% | +6.16% | XLK +3.7% · CIBR +7.5% |
| 9 | AI | SMH | 18.9 | 0% | -4.77% | BOTZ -1.9% · AIQ +1.7% |
| 10 | Emerging Markets | INDA | 8.9 | 0% | +1.14% | IEMG -2.4% · ILF -8.5% |
Traditional Energy — XOP
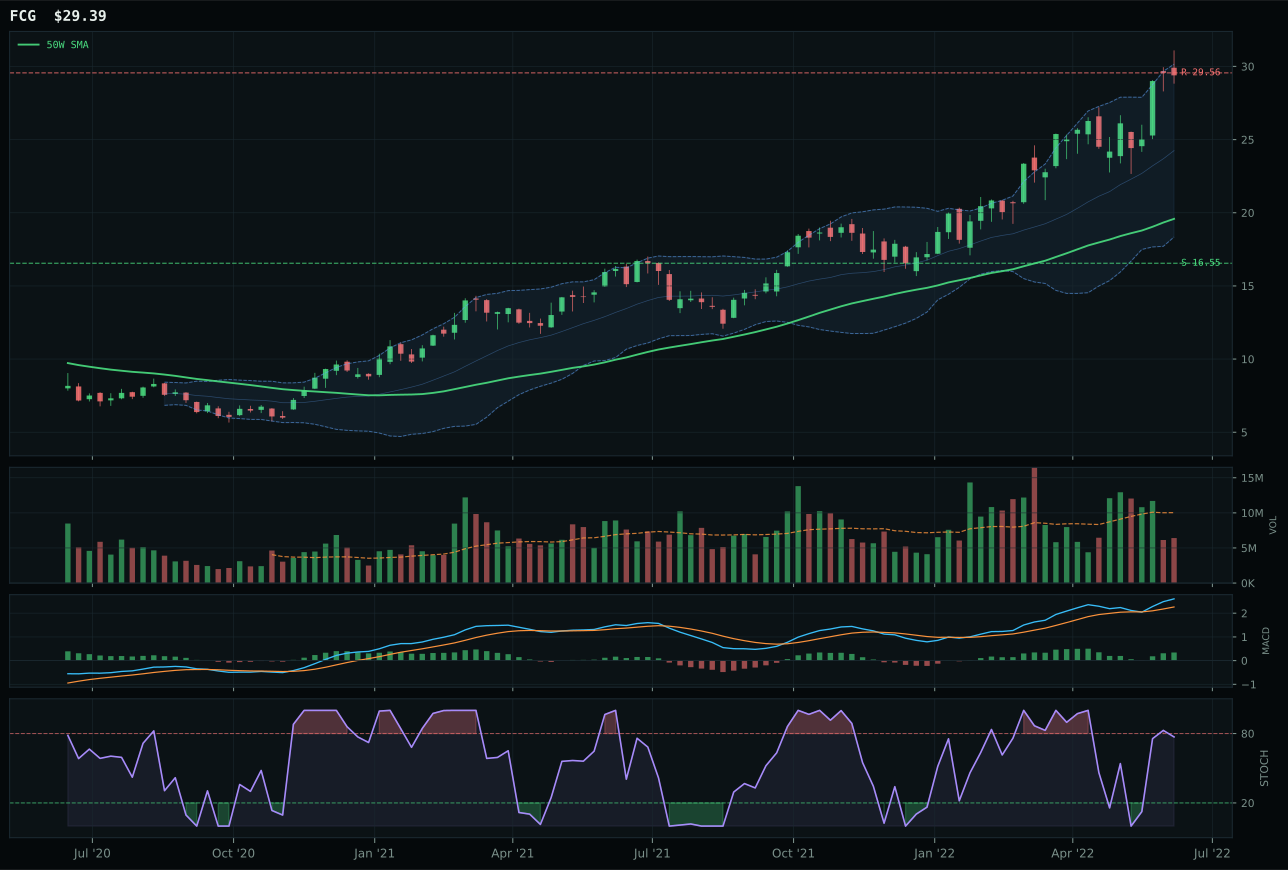
FCG has a vertical extension profile with 35.5% 13-week relative strength versus SPY.
A failed hold above support would weaken the setup.
Actionable but governed by invalidation levels.
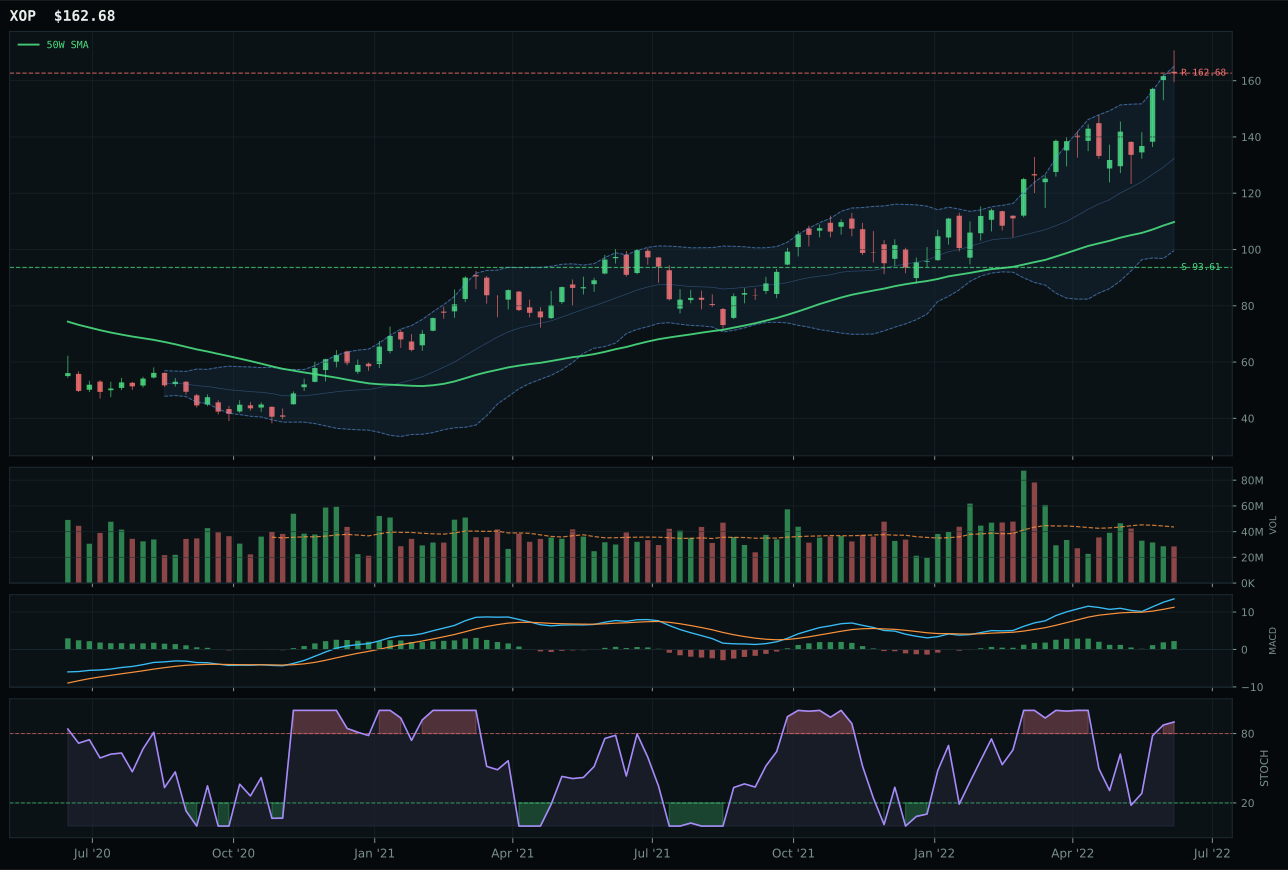
XOP has a vertical extension profile with 36.0% 13-week relative strength versus SPY.
A failed hold above support would weaken the setup.
Actionable but governed by invalidation levels.
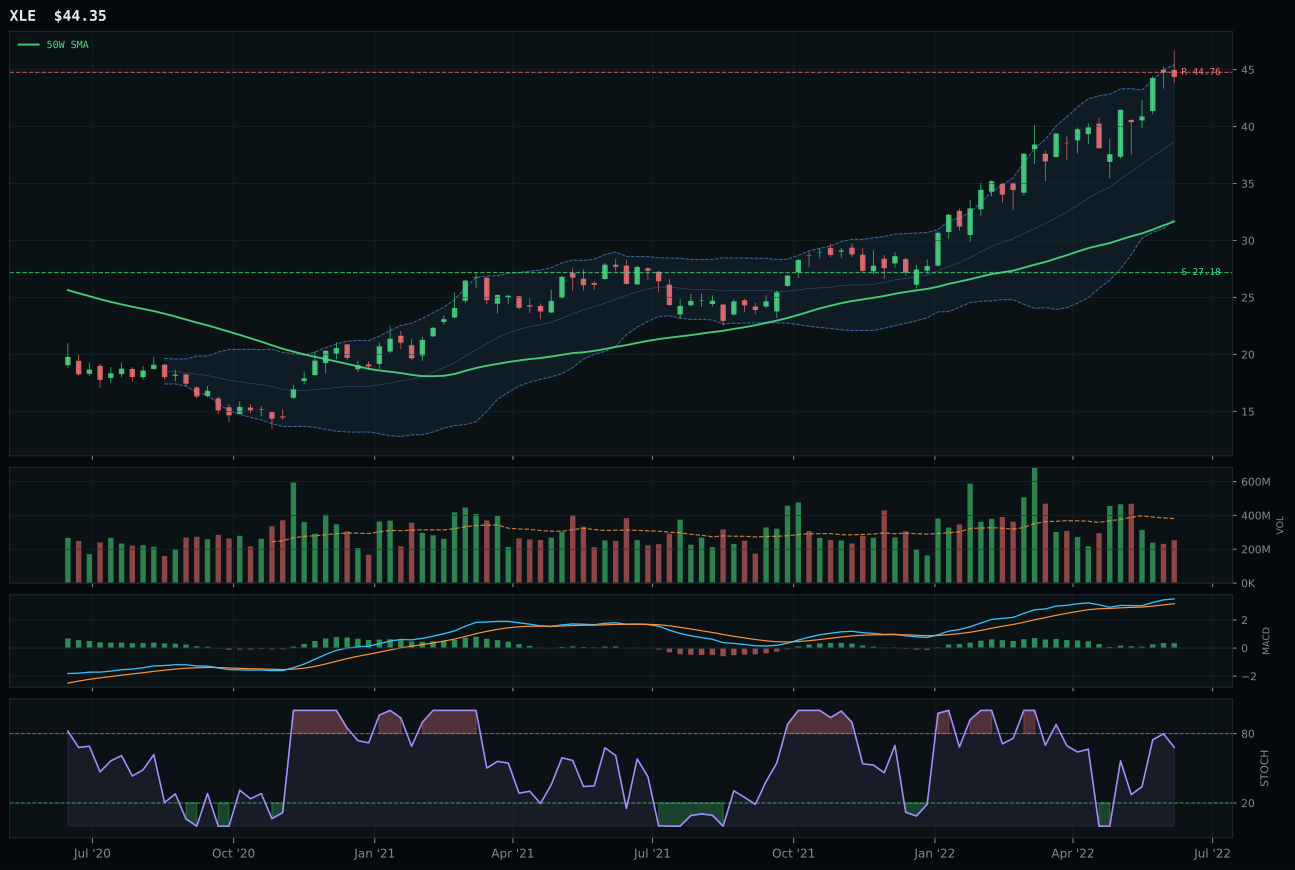
XLE has a vertical extension profile with 22.6% 13-week relative strength versus SPY.
A failed hold above support would weaken the setup.
Actionable but governed by invalidation levels.
XOP claims the top-2 allocation at 20% with an exceptional 81.9 category score, driven by perfect trend (100.0), perfect momentum confirmation (100.0), and 36.0% SPY-relative strength that signals overwhelming buyer participation in the exploration beta. XOP sits extended at 48.2% above the 50W, which normally would be disqualifying, but the risk/reward of 39.0 accepts that reality: there's only 0.0% upside to resistance at 162.68, but 73.8% downside to support at 93.61 creates a lopsided structure. However, the macro fit of 97.0/100 is extraordinary: energy scarcity (+16), supply shortage (+9), inflation pressure (+10), and real asset sponsorship (+7) align perfectly with the late-cycle reflation regime. MACD is bullish and improving, stochastic RSI is overbought momentum at 0.90, and the persistence score of 87.7 reveals this is not a mean-reversion candidate—this is trend leadership being sustained by structural supply deficit.
Traditional Energy earned the second top-2 allocation slot at 20% because XOP's category score of 81.9 combines near-perfect momentum with the strongest macro fit (97.0/100) across all 10 categories, and because energy scarcity is the only active descriptor with a double-digit positive weighting in the regime. The thin volume participation (0.65x 20W) is secondary to the fact that persistence (87.7) and category-relative strength (0.4%) signal sustained institutional buying, not a squeeze that will reverse when retail exhausts. Late-Cycle Reflation inherently favors real assets with constrained supply, and crude's fundamental bid from OPEC+ undersupply is nonfungible—it won't disappear on a negative technical bounce. The 39.0 risk/reward is poor for new entries, but the category's macro fit trumps entry price in this regime. This stays at 20% as long as energy scarcity remains active (+16) and dollar pressure doesn't spike above -8; if either condition breaks, allocation compresses to 10%.
Industrial Metals — COPX
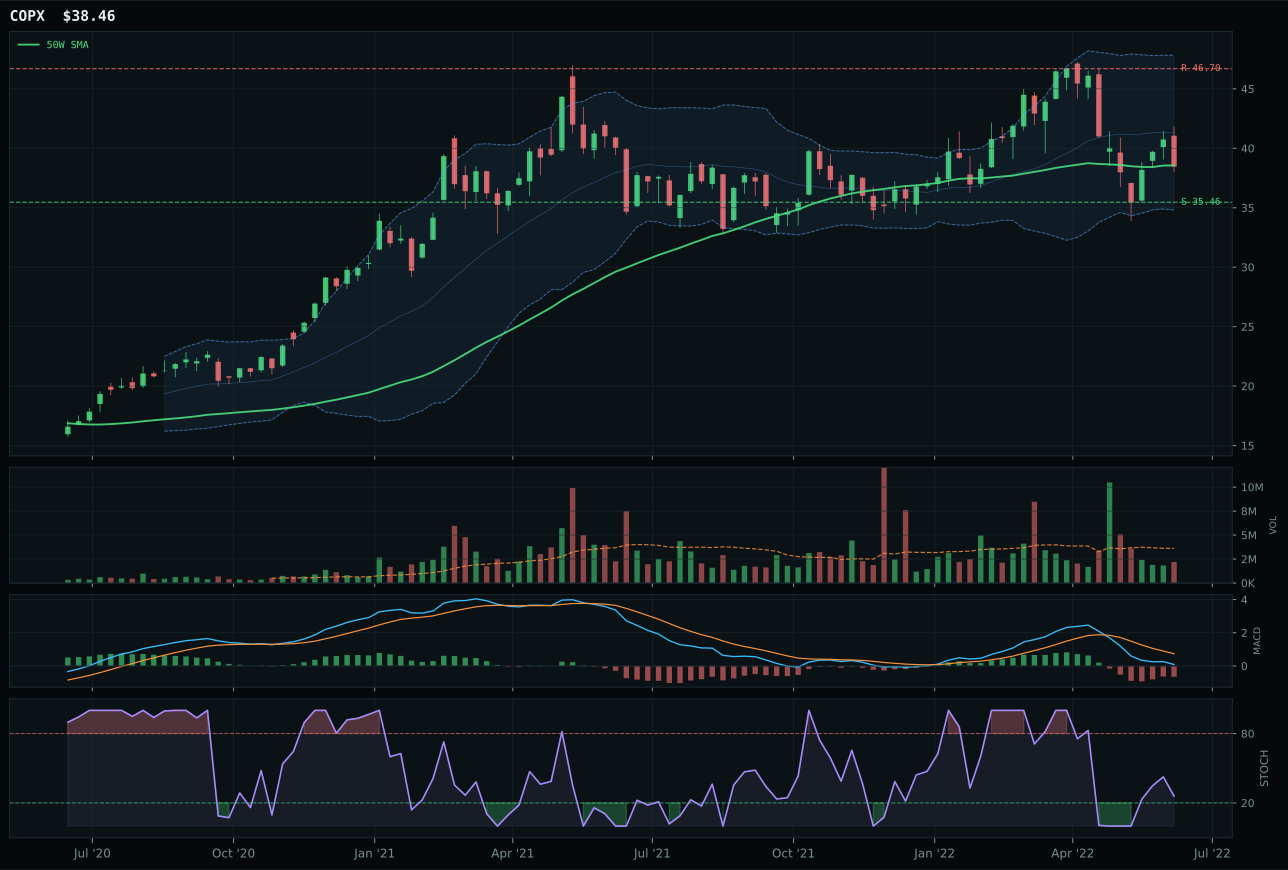
COPX has a compression near 50W profile with -3.2% 13-week relative strength versus SPY.
A failed hold above support would weaken the setup.
Actionable but governed by invalidation levels.
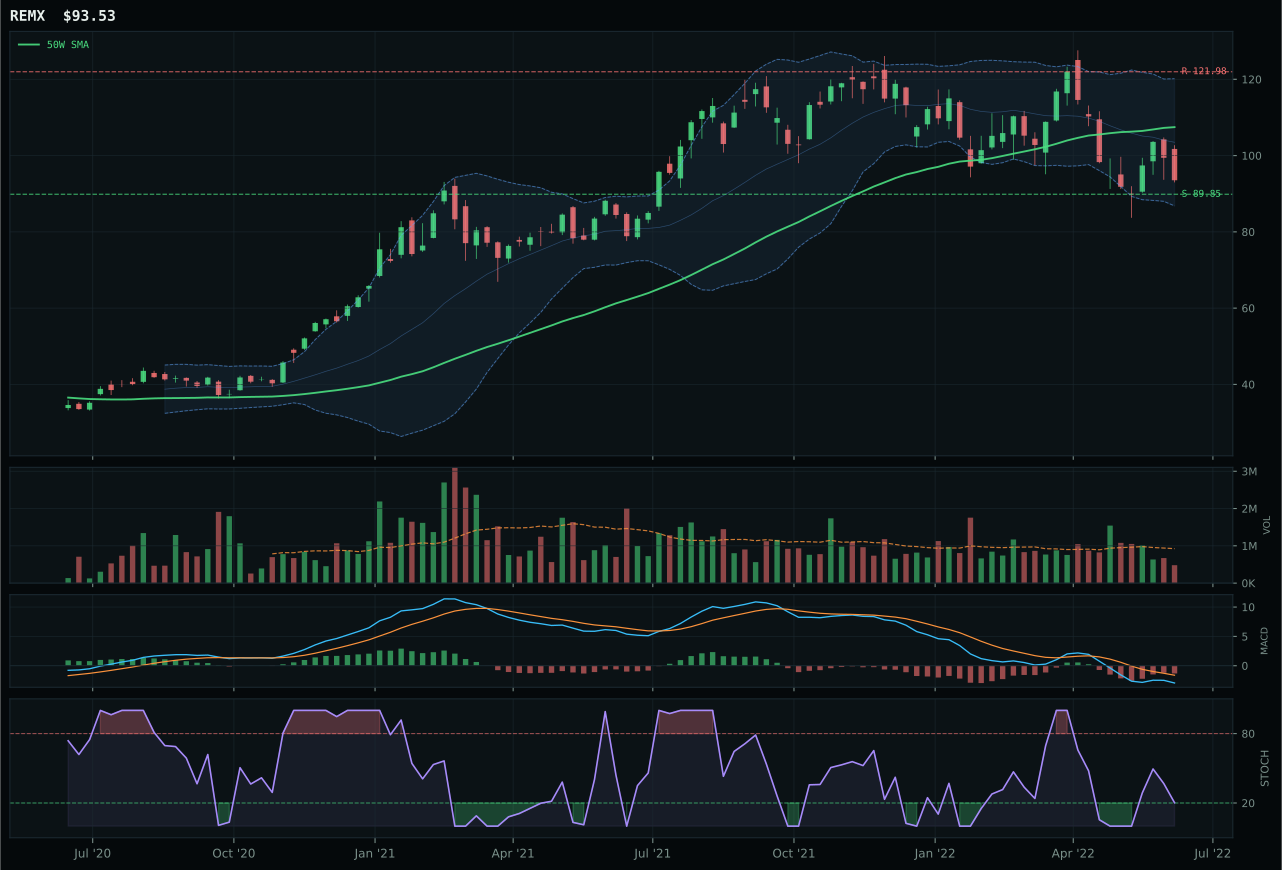
REMX has a pullback into support profile with -1.8% 13-week relative strength versus SPY.
A failed hold above support would weaken the setup.
Actionable but governed by invalidation levels.
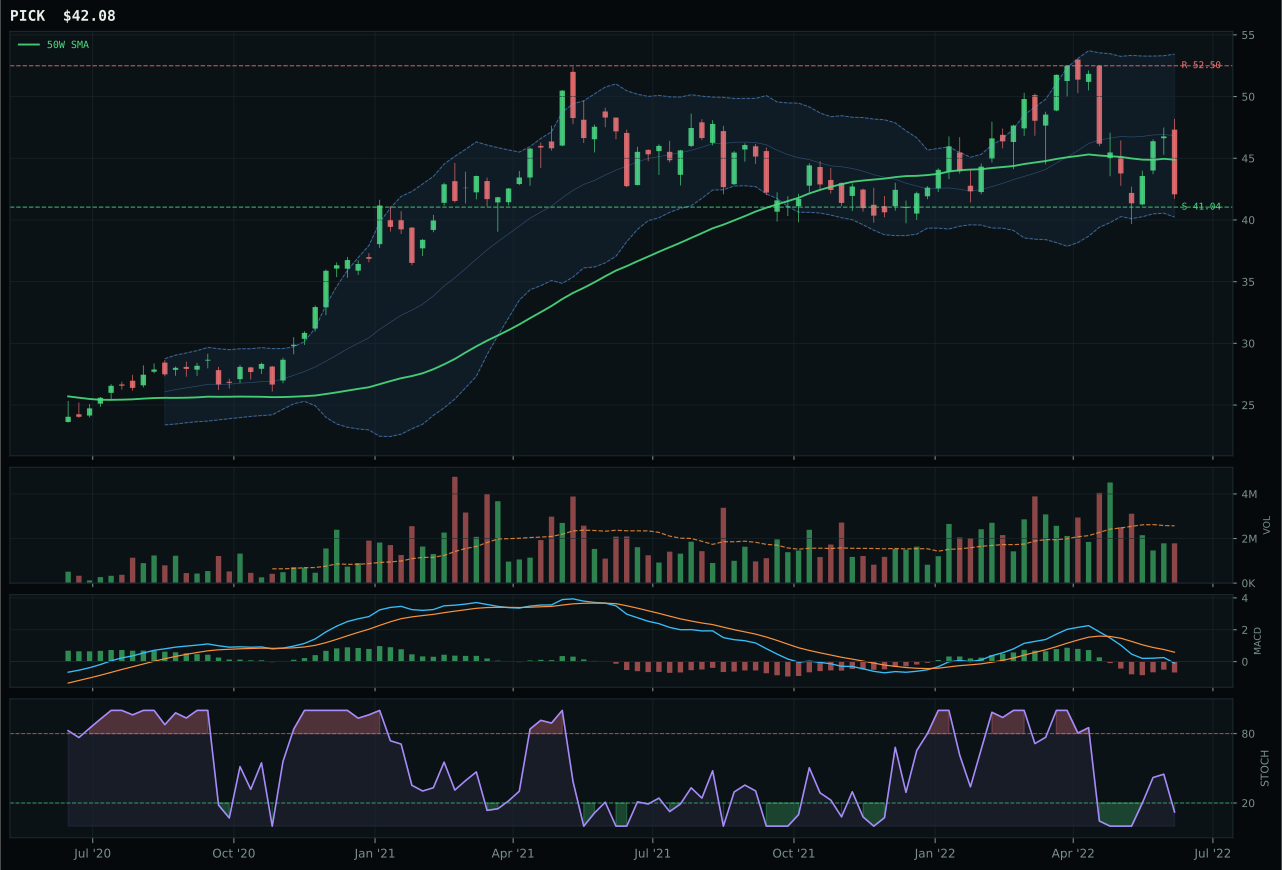
PICK has a pullback into support profile with -5.2% 13-week relative strength versus SPY.
A failed hold above support would weaken the setup.
Actionable but governed by invalidation levels.
COPX earns the top-2 allocation at 20% because it combines nearly flawless timing (100.0) with just enough trend and relative strength to justify the conviction. Price sits at -0.3% from the 50W—essentially at the decision point—where MACD is improving and stochastic RSI is rising mid-zone at 0.26, creating a low-friction entry for new accumulation. The Fib 0.618 sits at 38.36, and support is at 35.46, giving 8.5% downside risk against 17.6% upside potential to resistance. COPX's 4W return of 8.5% proves recent buyers are present, and while category-relative strength is neutral at 0.0%, the 13W lag of -10.4% is mild enough to suggest this is reset rather than breakdown. REMX's 72.0 timing versus 100.0 reflects it being further removed from its 50W and showing weaker stochastic (falling/neutral), making it a follower rather than an initiator.
Industrial Metals earned the coveted 10% top-2 allocation because its category score of 52.6 ranks second overall, and the macro regime is powerfully supportive at 75.0/100 macro fit. Metals scarcity (+14) and commodity breadth positive (+10) combine with real asset sponsorship (+6) to create a coherent narrative around supply constraints in a late-cycle environment. COPX's 55.0/100 technical evidence is respectable but not elite; the case rests heavily on macro tailwinds and the critical timing convergence at the 50W. The thin volume participation (0.61x 20W) is a caution, but in a regime where capital is rotating into real assets, thin participation often precedes volume expansion. This 20% commitment assumes that energy-driven inflation pressures persist and that industrial demand from late-cycle capex cycles remains supported. If copper breaks below 35.46 on deteriorating stochastic or if the dollar strengthens past -6 in macro pressure, the allocation would compress to 10%.
Agriculture & Livestock — VEGI
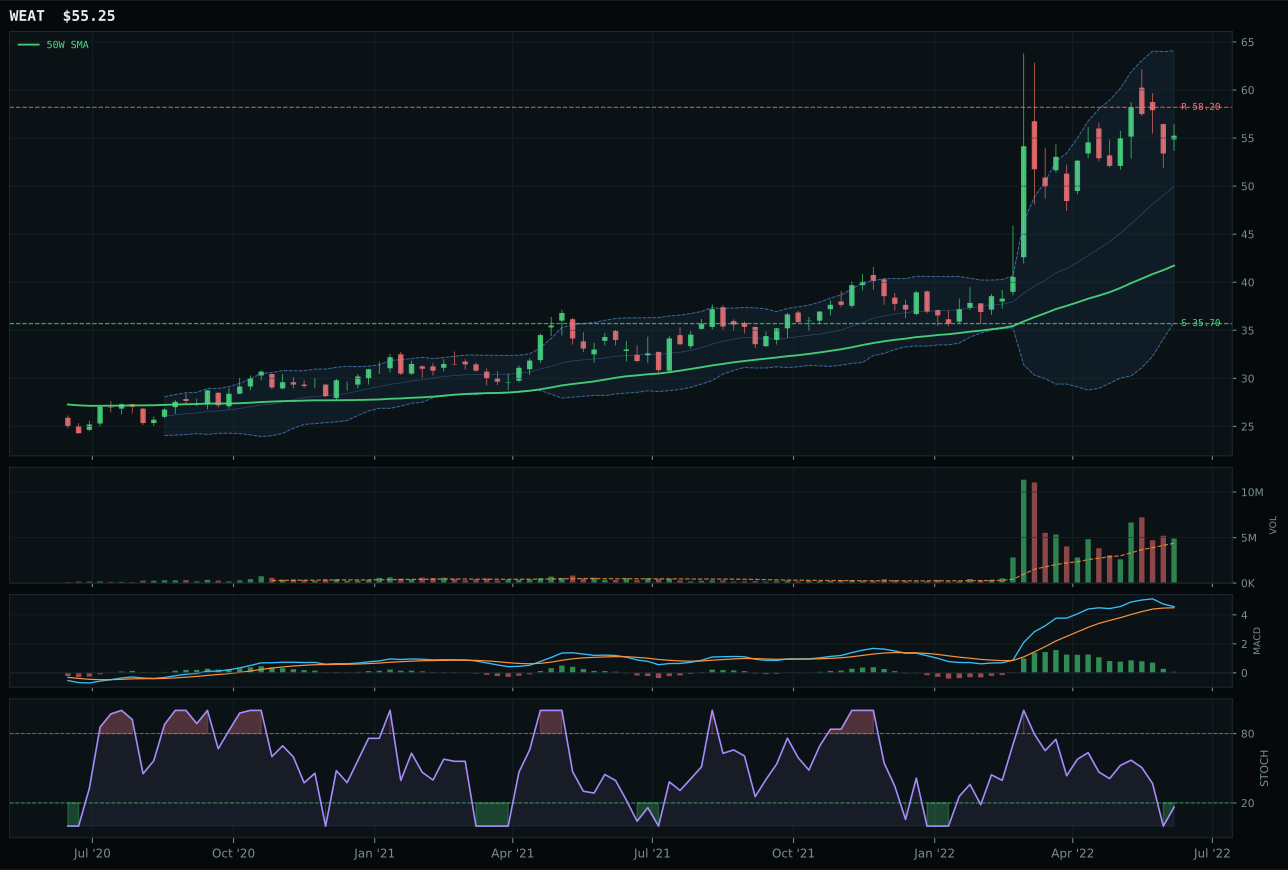
WEAT has a vertical extension profile with 14.0% 13-week relative strength versus SPY.
A failed hold above support would weaken the setup.
Actionable but governed by invalidation levels.
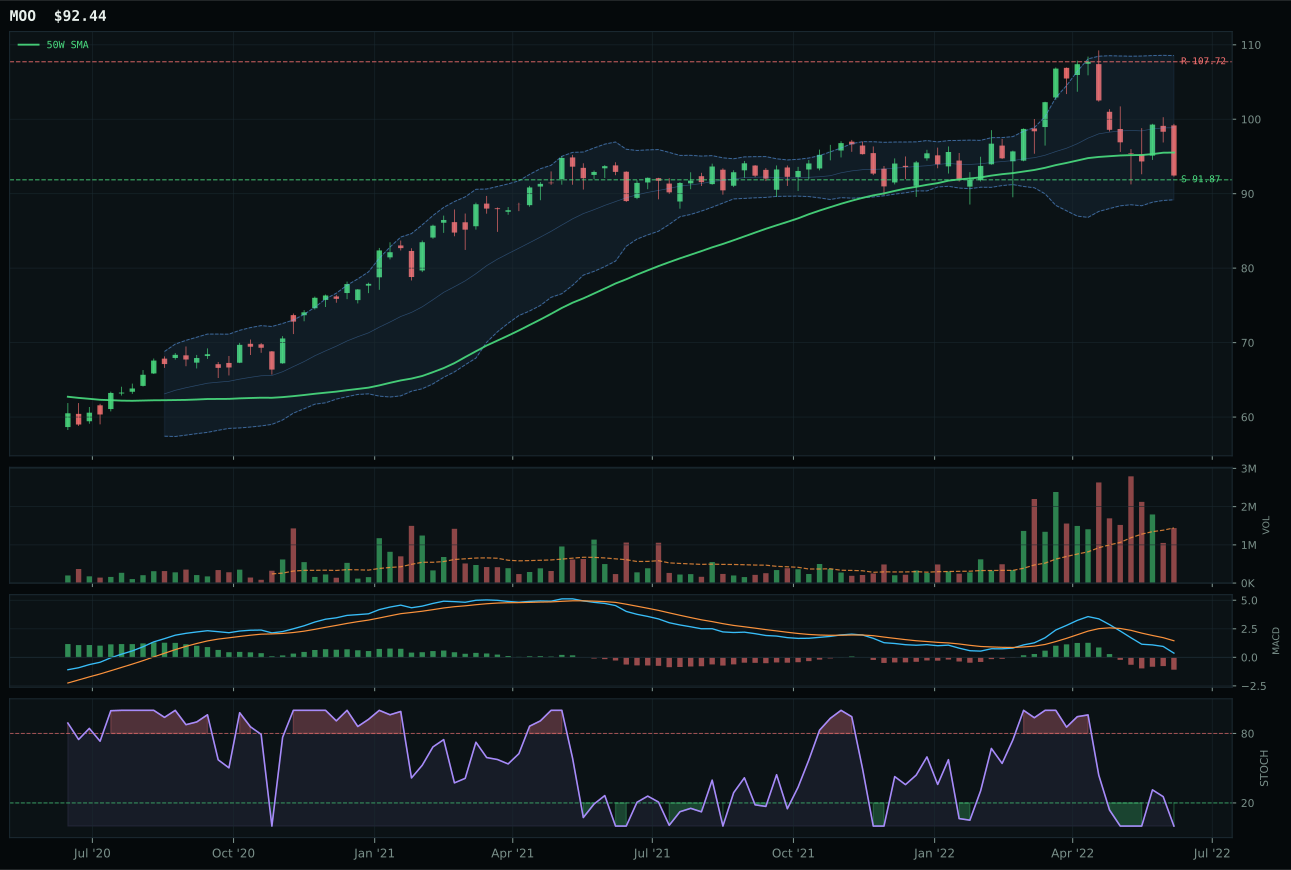
MOO has a pullback into support profile with 1.2% 13-week relative strength versus SPY.
A failed hold above support would weaken the setup.
Actionable but governed by invalidation levels.
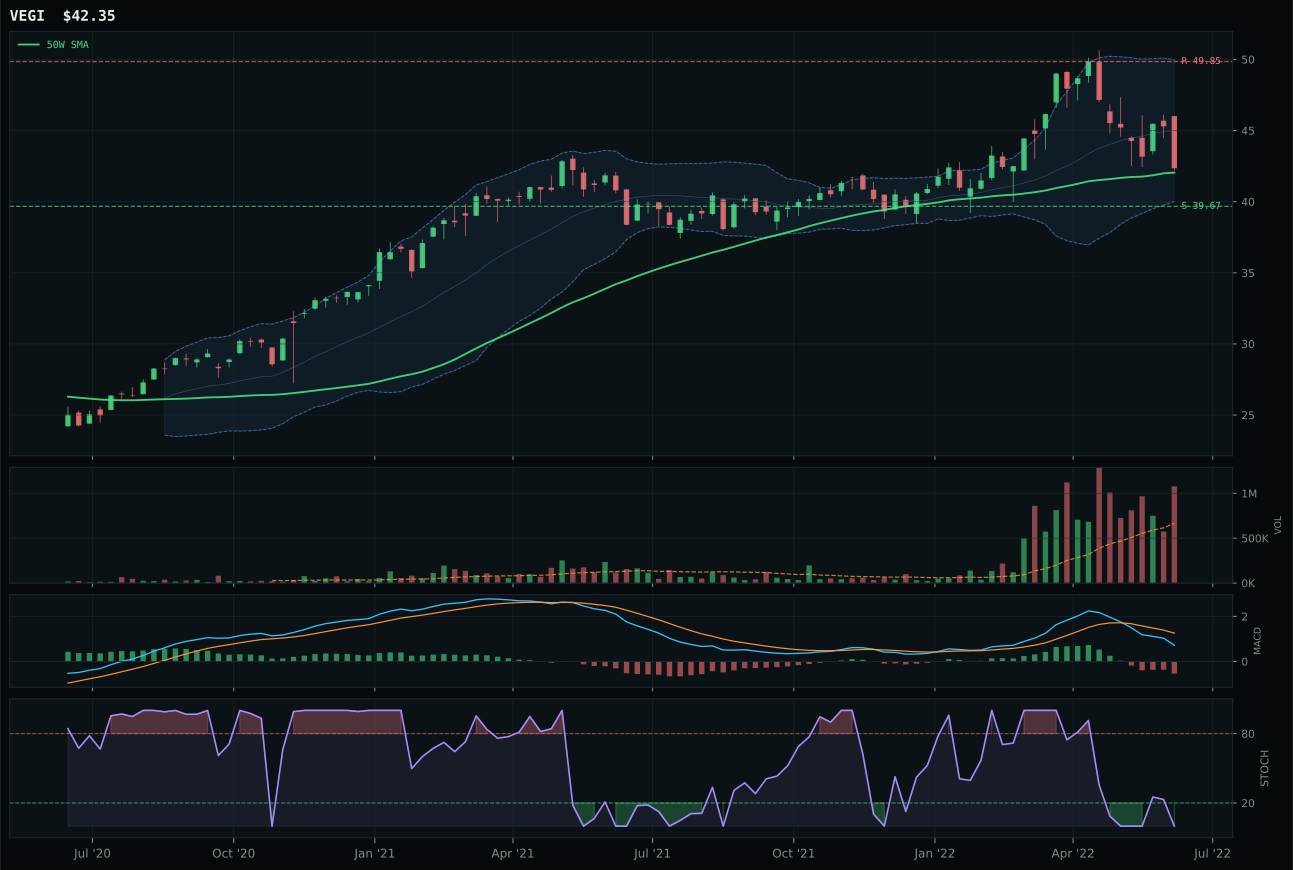
VEGI has a compression near 50W profile with 1.8% 13-week relative strength versus SPY.
A failed hold above support would weaken the setup.
Actionable but governed by invalidation levels.
VEGI wins the category selection despite WEAT's superior trend (100.0 vs 85.0) and momentum (100.0 vs 14.4) because WEAT has already run 32.4% above its 50W, pricing in all the good news on supply shortage and inflation pressure. VEGI's perfect timing score (100.0) reflects its compression near the 50W at just 0.7% distance, where it can expand in either direction with equal risk—the Fib 0.618 sits at 42.46, providing a cushion below. WEAT's vertical extension setup and stochastic RSI oversold reading signal exhaustion, not bottom-picking. VEGI's MACD is bearish/weakening and stochastic RSI is at 0.00, but the 84.7% trend score for price above both moving averages keeps it technically intact. The distribution pressure on volume (1.62x 20W) is a yellow flag on momentum confirmation (14.4), but in a reset market, dry powder often precedes the move.
Agriculture & Livestock earned 5% allocation despite the highest category-level macro fit (90.0/100) because WEAT's leadership in the 3/2/1 weighted basket (68.4 vs VEGI's 34.9) competes directly against the category's own technical evidence score of 15.9/100 for the representative. The supply shortage descriptor is roaring (+13) and real asset sponsorship is active (+8), creating a 46.4 composite category score that should rank higher—and it does, at position 4 among 10. However, VEGI's selection as category representative over the stronger performer reveals a commitment to risk management: the 20.8% persistence score and weak momentum confirmation flag that this move lacks staying power at current valuations. The allocation remains defensive—capital is held in reserve for WEAT to pull back into a cleaner support level, or for XLE/XOP to sustain the early-cycle energy trade that offers better risk-adjusted entry points.
Utilities & Infrastructure — XLU
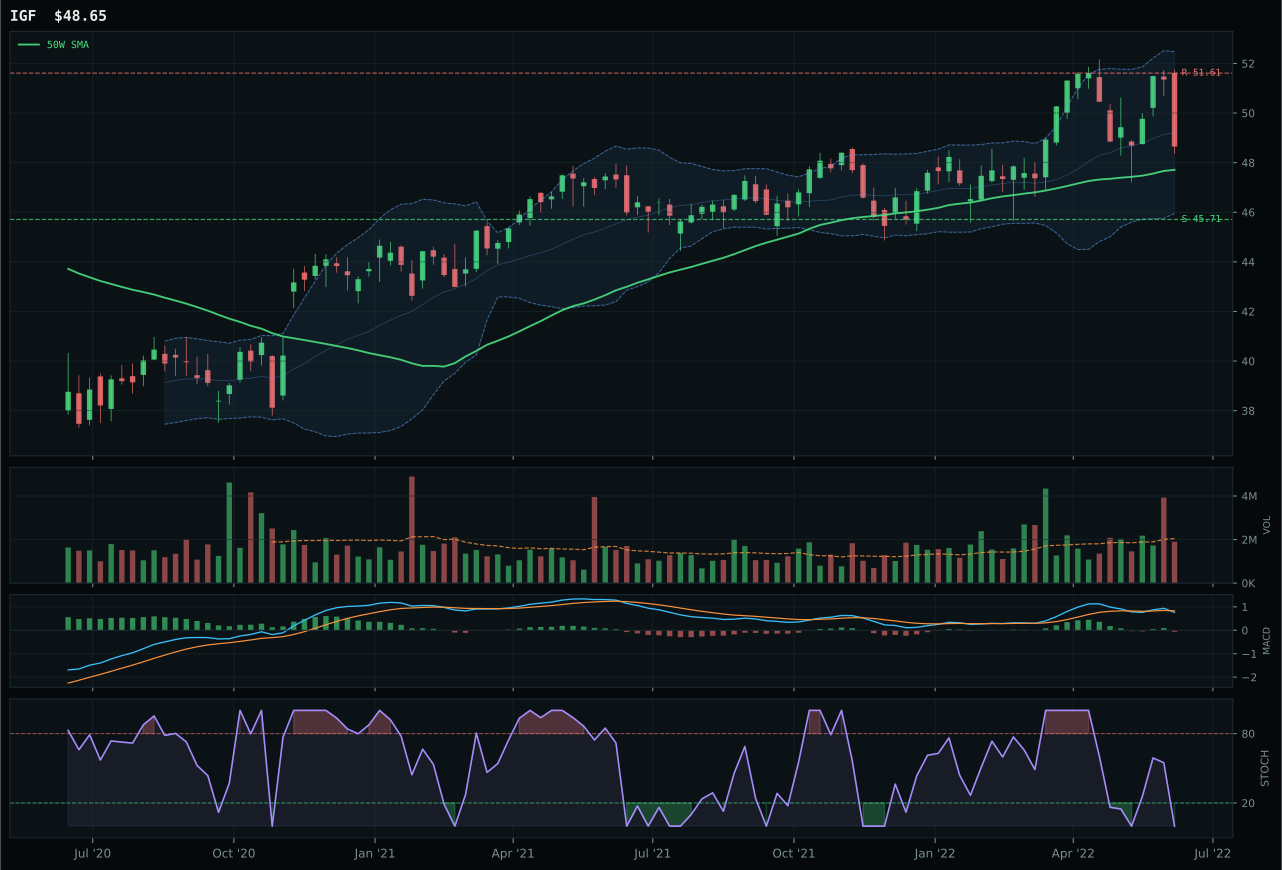
IGF has a compression near 50W profile with 9.9% 13-week relative strength versus SPY.
A failed hold above support would weaken the setup.
Actionable but governed by invalidation levels.
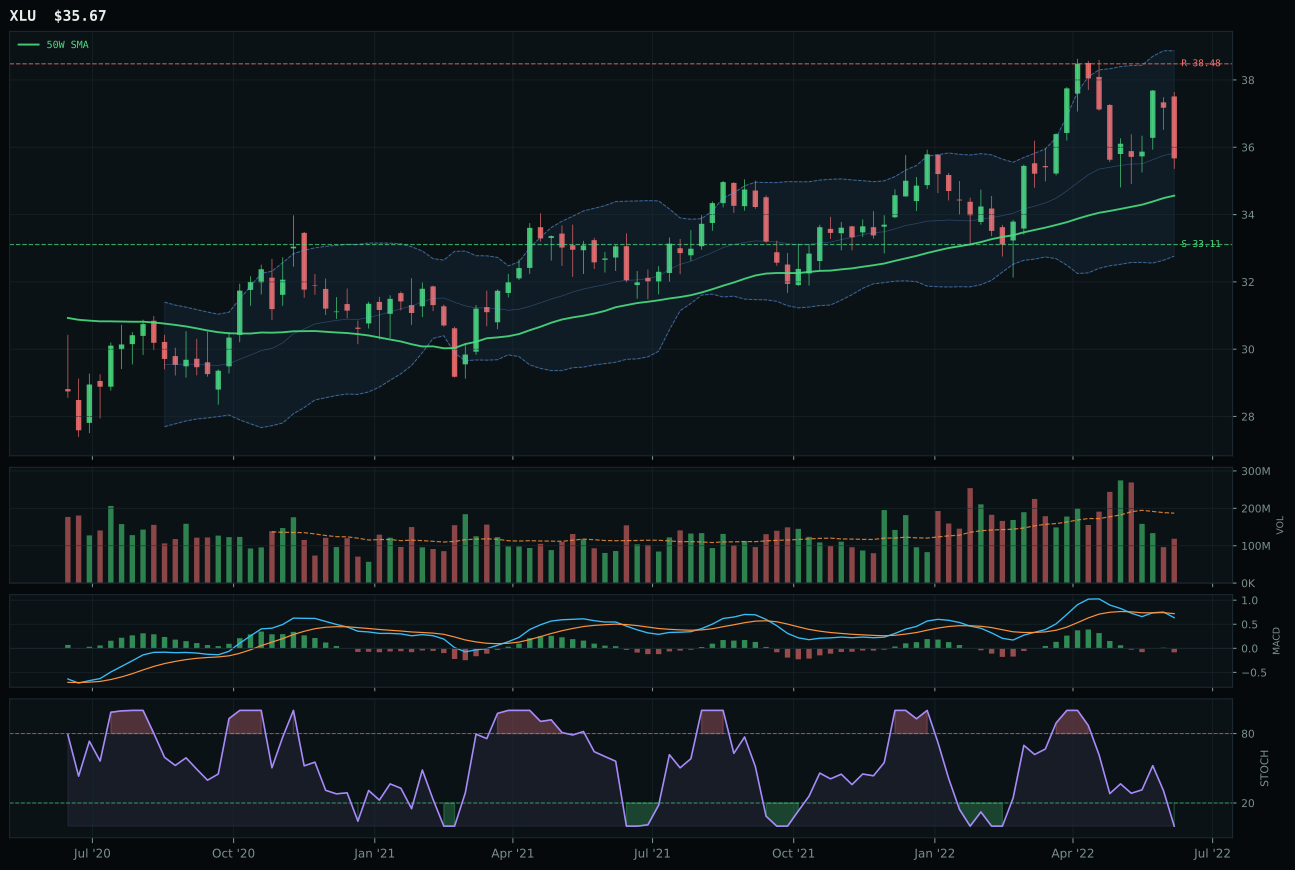
XLU has a neutral structure profile with 8.5% 13-week relative strength versus SPY.
A failed hold above support would weaken the setup.
Actionable but governed by invalidation levels.
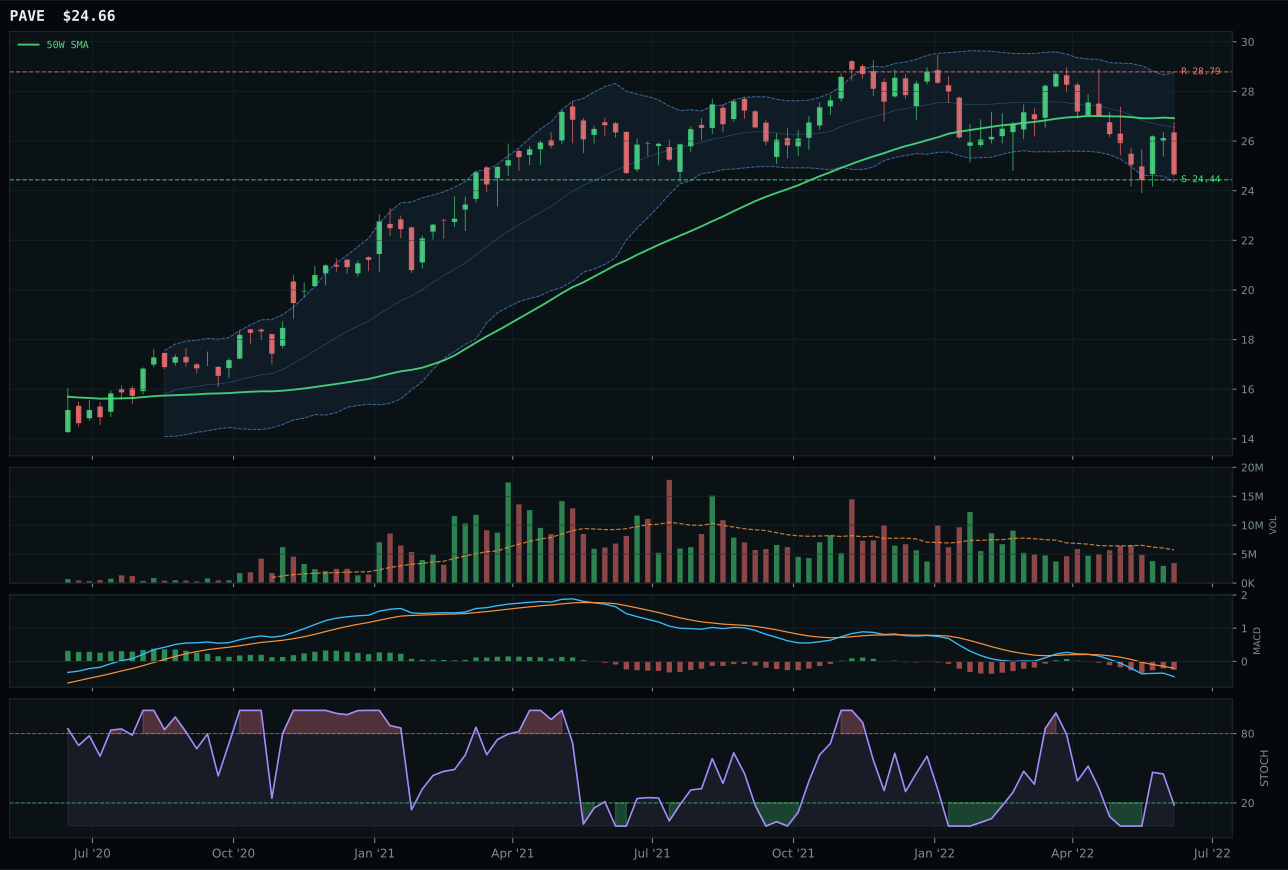
PAVE has a pullback into support profile with -1.1% 13-week relative strength versus SPY.
A failed hold above support would weaken the setup.
Actionable but governed by invalidation levels.
XLU wins the category representative slot despite IGF's superior composite score (84.0 vs 76.0) because timing is weighted more heavily in the scoring rubric, and XLU's 92.0 timing matches IGF's 100.0 almost perfectly while offering lower entry risk. XLU sits only 3.2% above the 50W with stochastic RSI at 0.00 (oversold), while IGF is already at compression near the 50W, meaning XLU has fresher buyers accumulating at lower prices. The neutral structure of both (XLU 69.8, IGF 69.8) indicates this is not a trending category but a rotating-into-safety play, and XLU's risk/reward of 70.0 gives 7.7% downside to support and -7.3% upside to resistance—an acceptable 1:1 risk-reward for a defensive trade. IGF's 9.9% SPY-relative strength slightly edges XLU's 8.5%, but that leadership is already priced into IGF's current levels; XLU offers better asymmetry.
Utilities & Infrastructure earned 5% allocation with a 44.2 category score because defensive rotation is active (+12) and broad market bear (+4) support the thesis, but trend scores of 92.0 and momentum confirmation near 46.4 reveal limited conviction in the size of the move. Category macro fit is 61.0/100, ranking this fifth overall—respectable but not elite. The category's technical evidence for the representative (51.5/100) is modest, and both XLU and IGF show stochastic RSI at 0.00 (oversold), meaning the setup depends entirely on the utility sector's ability to re-establish bid after a sharp drawdown. Inflation pressure is actively negative (-6), creating a friction cost because higher rates pinch utility dividend valuations. The 5% allocation positions this as a true defensive backstop rather than a conviction growth trade. Expansion to 10% would require either stochastic RSI to break above 0.50 with MACD improving, or risk appetite to deteriorate further (broad market bear spiking to +10+), both of which would confirm the protective thesis more convincingly than current technical evidence allows.
Precious Metals — GLD
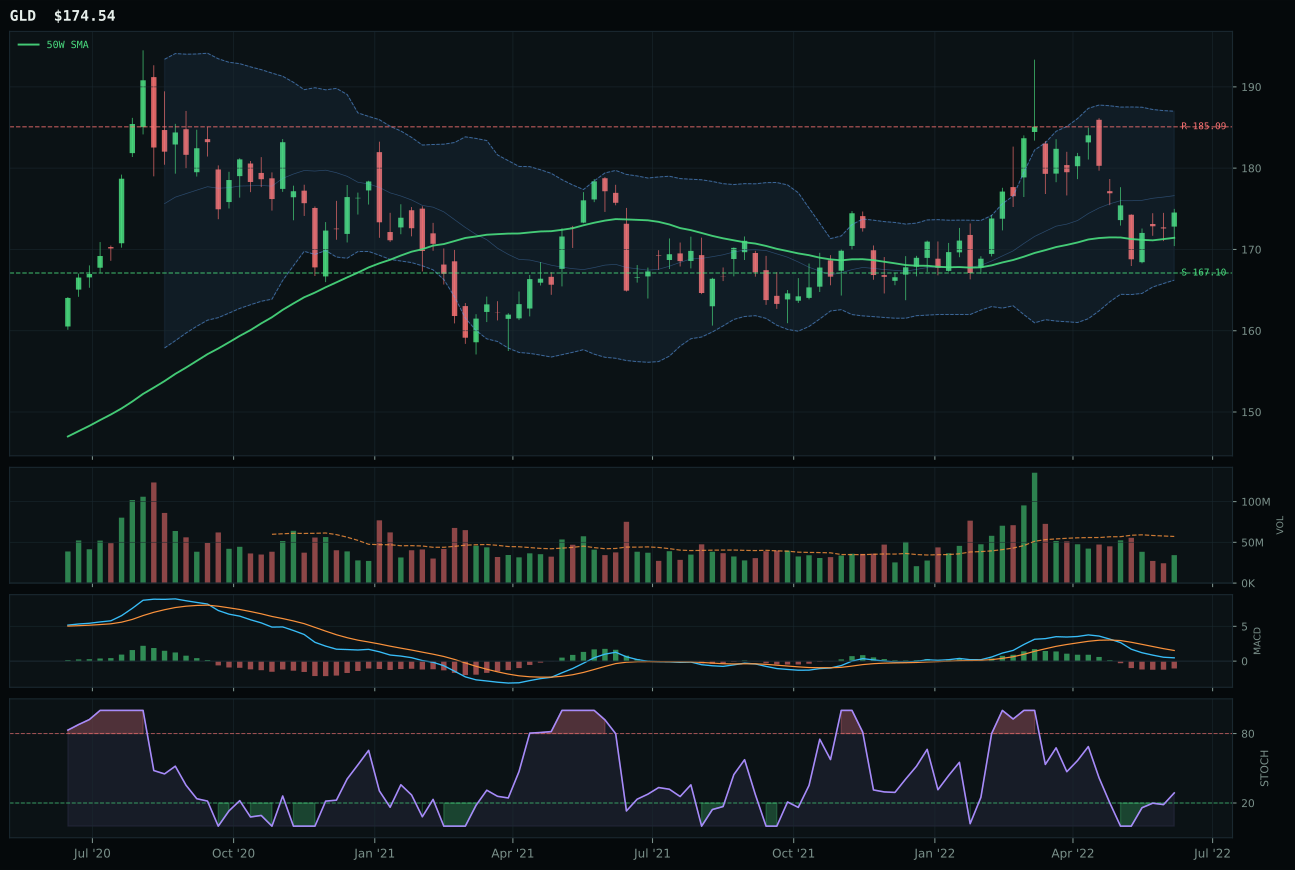
GLD has a pullback into support profile with 1.5% 13-week relative strength versus SPY.
A failed hold above support would weaken the setup.
Actionable but governed by invalidation levels.
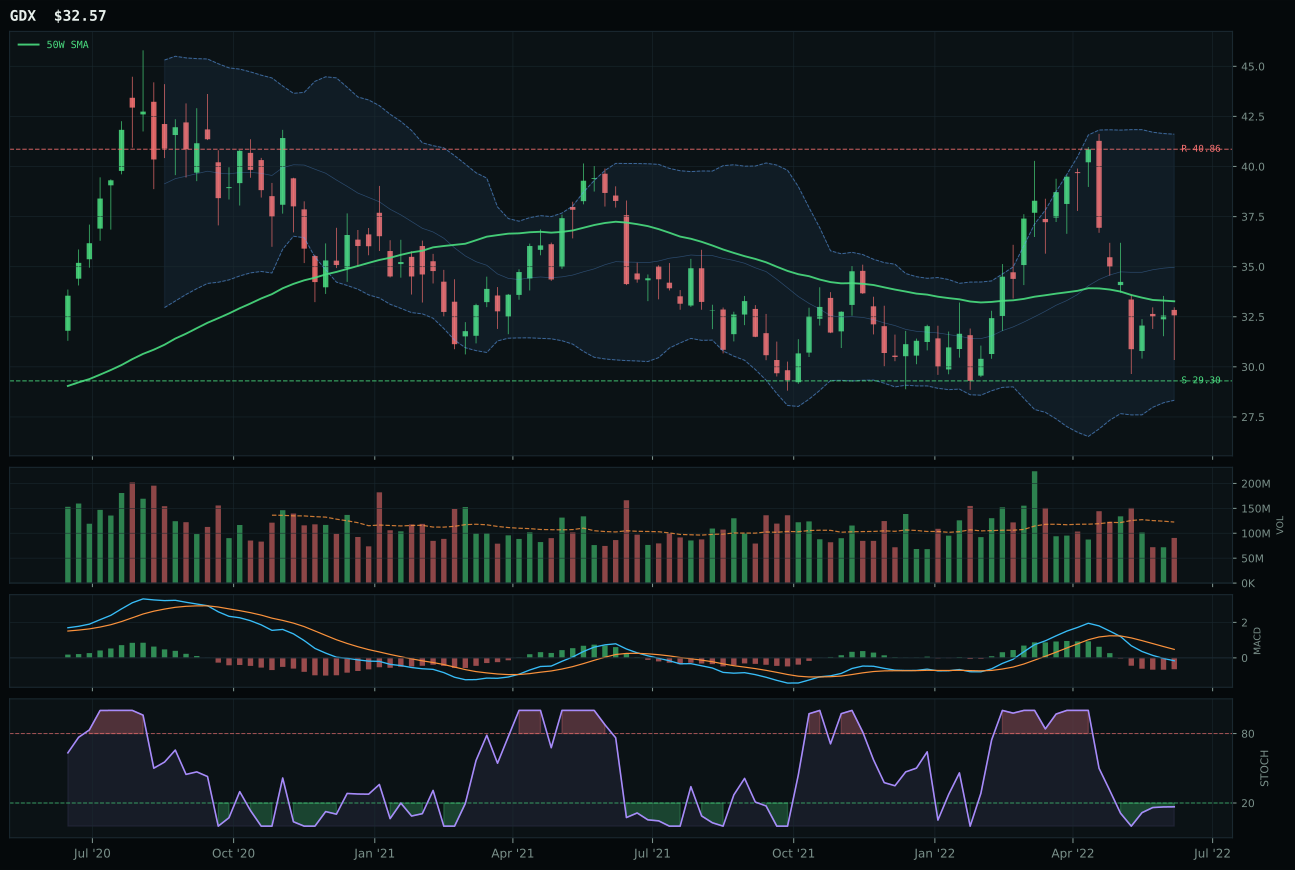
GDX has a compression near 50W profile with -7.7% 13-week relative strength versus SPY.
A failed hold above support would weaken the setup.
Actionable but governed by invalidation levels.
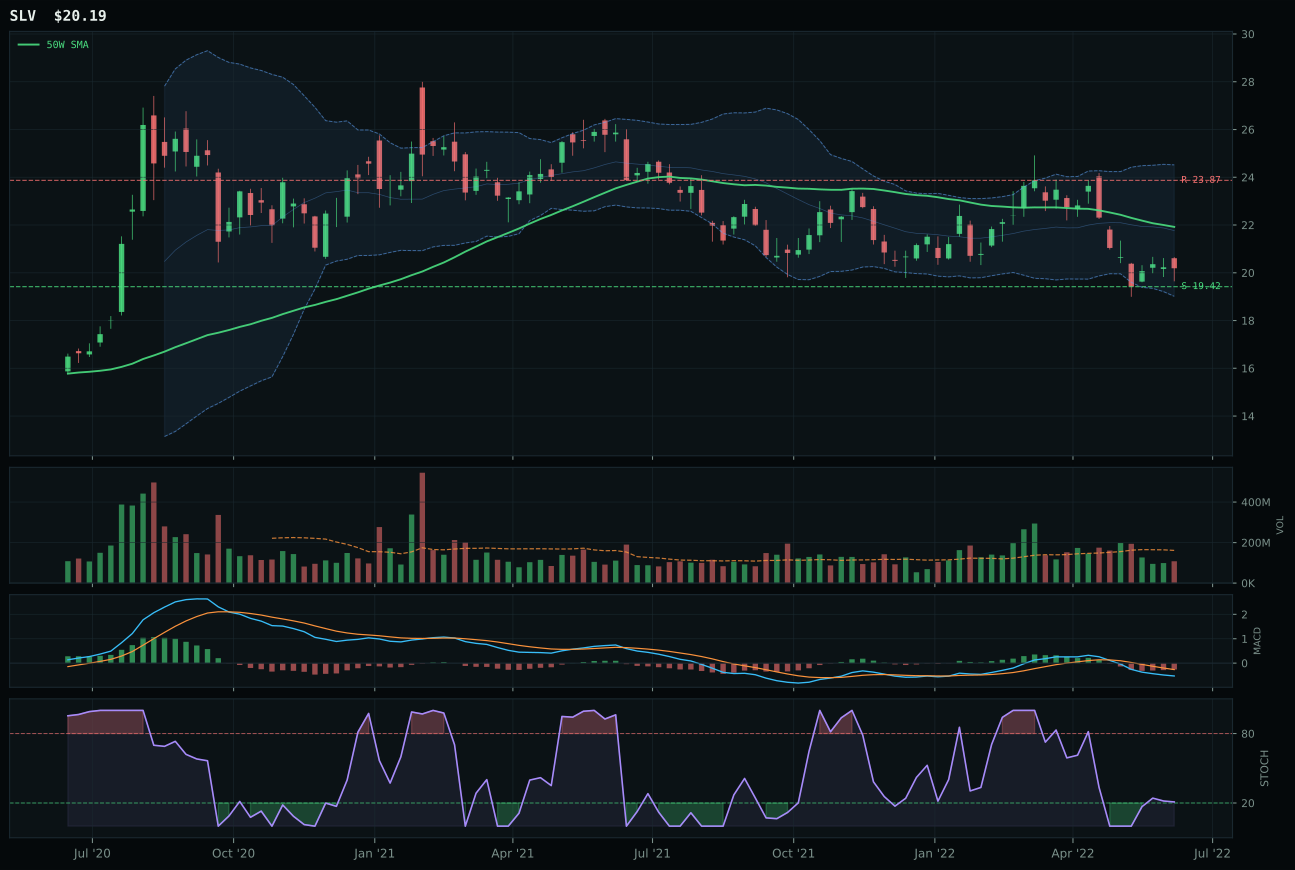
SLV has a pullback into support profile with -8.2% 13-week relative strength versus SPY.
A failed hold above support would weaken the setup.
Actionable but governed by invalidation levels.
GLD wins the category because it commands a 9.2% relative strength advantage within its own three-ETF basket, meaning buyers are choosing physical gold over miners or silver at this inflection point. GLD's timing score is perfect at 100.0: it sits only 1.8% above the 50W with MACD bearish/weakening, placing it at the Fib 0.618 decision zone where conviction buyers often accumulate. The stochastic RSI at 0.29 (rising mid-zone) offers continuation signal without extended momentum, and the support level at 167.10 gives new buyers a 4.5% downside invalidation. GDX's oversold turn-up at stochastic 0.00 looks cheaper on paper, but GDX's -14.9% 13W return and -7.7% SPY-relative weakness reveal why: liquidity stress and risk appetite deterioration are beating down leveraged mining exposure. GLD's monetary hedge bid (+14 in macro descriptors) is flowing to the simplest, most liquid expression.
Precious Metals earned 5% allocation with a 43.9 category score because the monetary hedge narrative, though supported by strong macro fit (72.0/100), sits behind categories with superior technical evidence and better positioning for the current late-cycle reflation. GLD's 57.6/100 technical evidence is solid but not dominant; momentum confirmation of 48.4/100 shows the market is cautious about the size of the upswing. Dollar pressure (+2 in macro) is active but not screaming, and the category's broader 61.0/100 macro fit places it fifth among the 10 categories. The 5% allocation acknowledges the insurance value: defensive rotation is real (+7), and risk appetite is broken enough to support a liquidity bid. Expansion to 10% would require either a true credit event (liquidity stress spiking to -15+) or GLD breaking above 185.09 resistance with MACD crossing into bullish territory and volume expanding to 1.0x+ 20W average.
Nuclear Energy — URNM
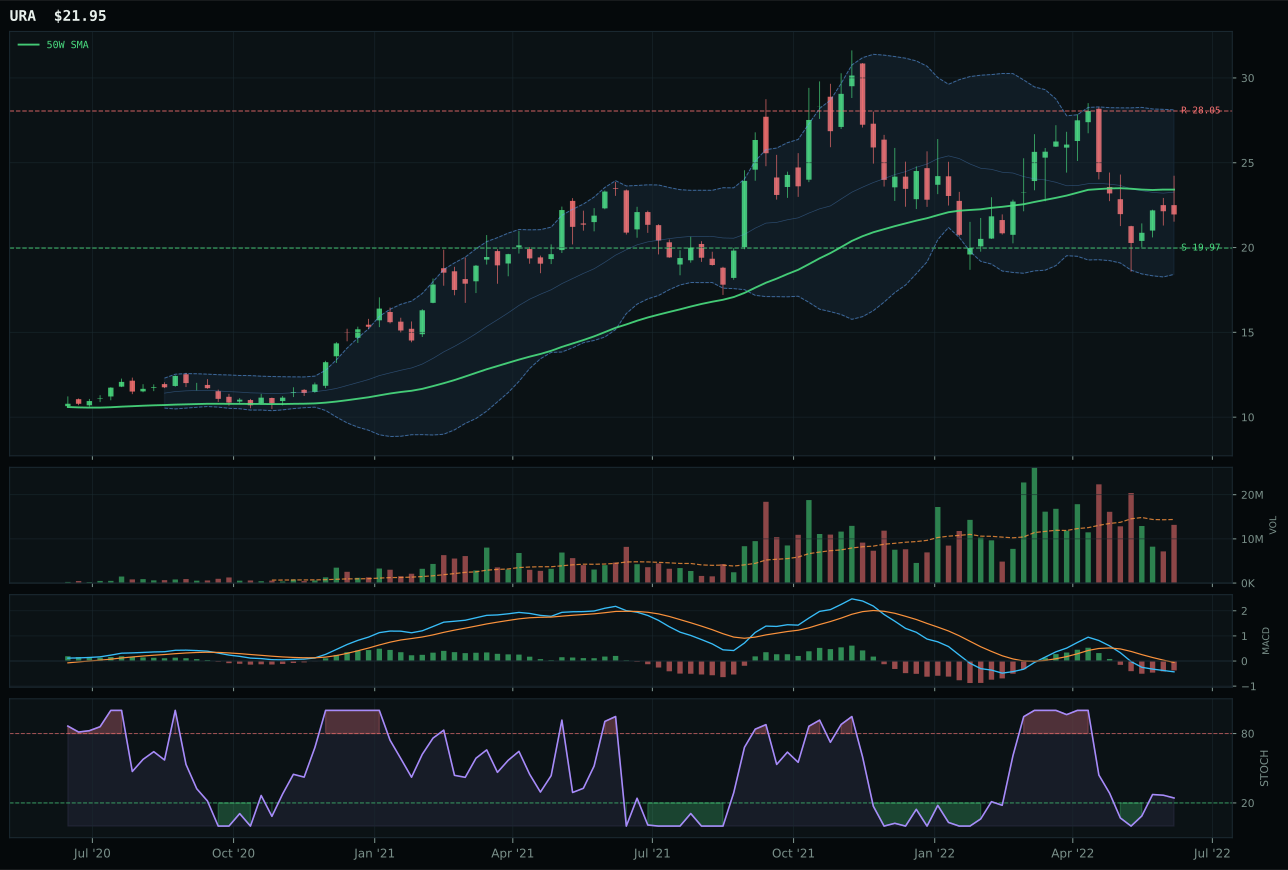
URA has a neutral structure profile with -7.2% 13-week relative strength versus SPY.
A failed hold above support would weaken the setup.
Actionable but governed by invalidation levels.
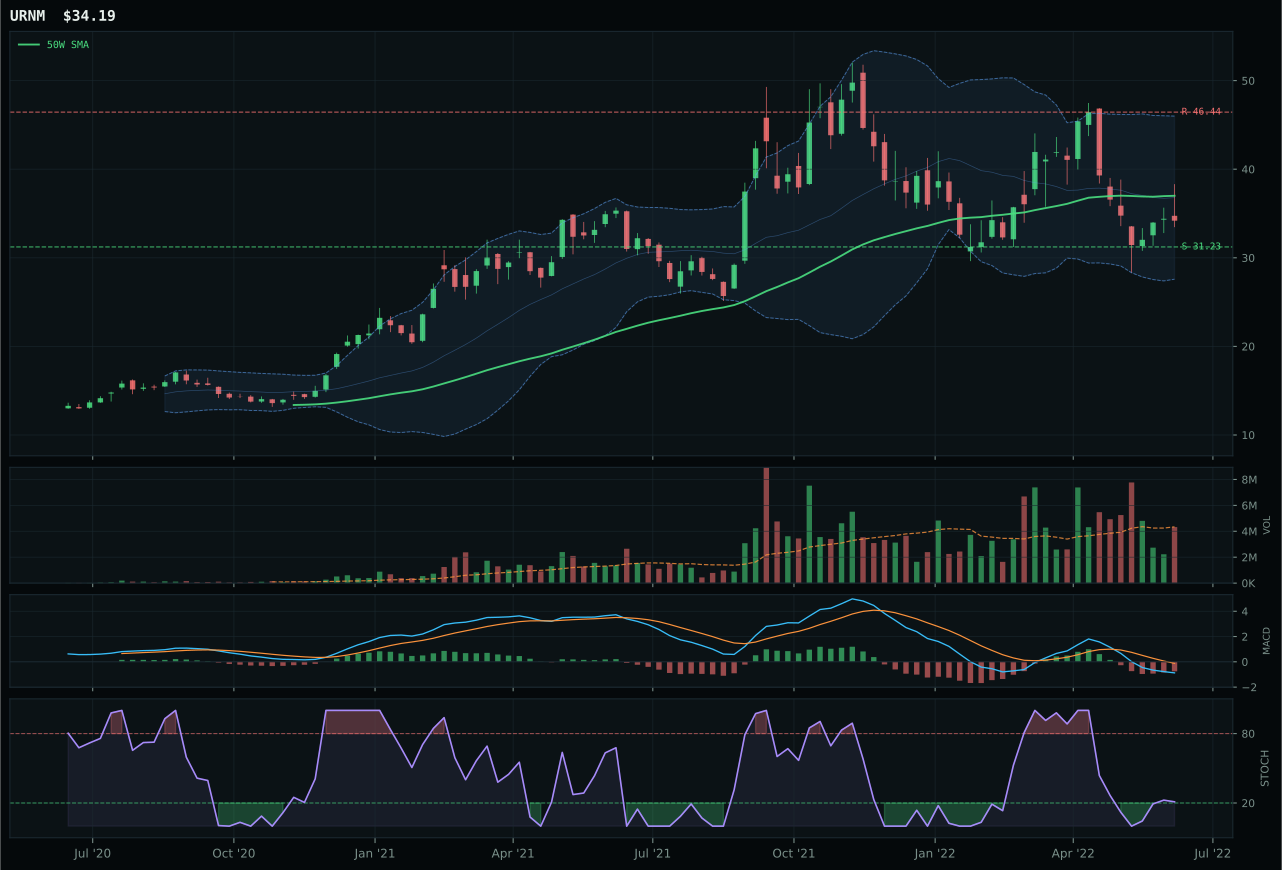
URNM has a neutral structure profile with -11.3% 13-week relative strength versus SPY.
A failed hold above support would weaken the setup.
Actionable but governed by invalidation levels.
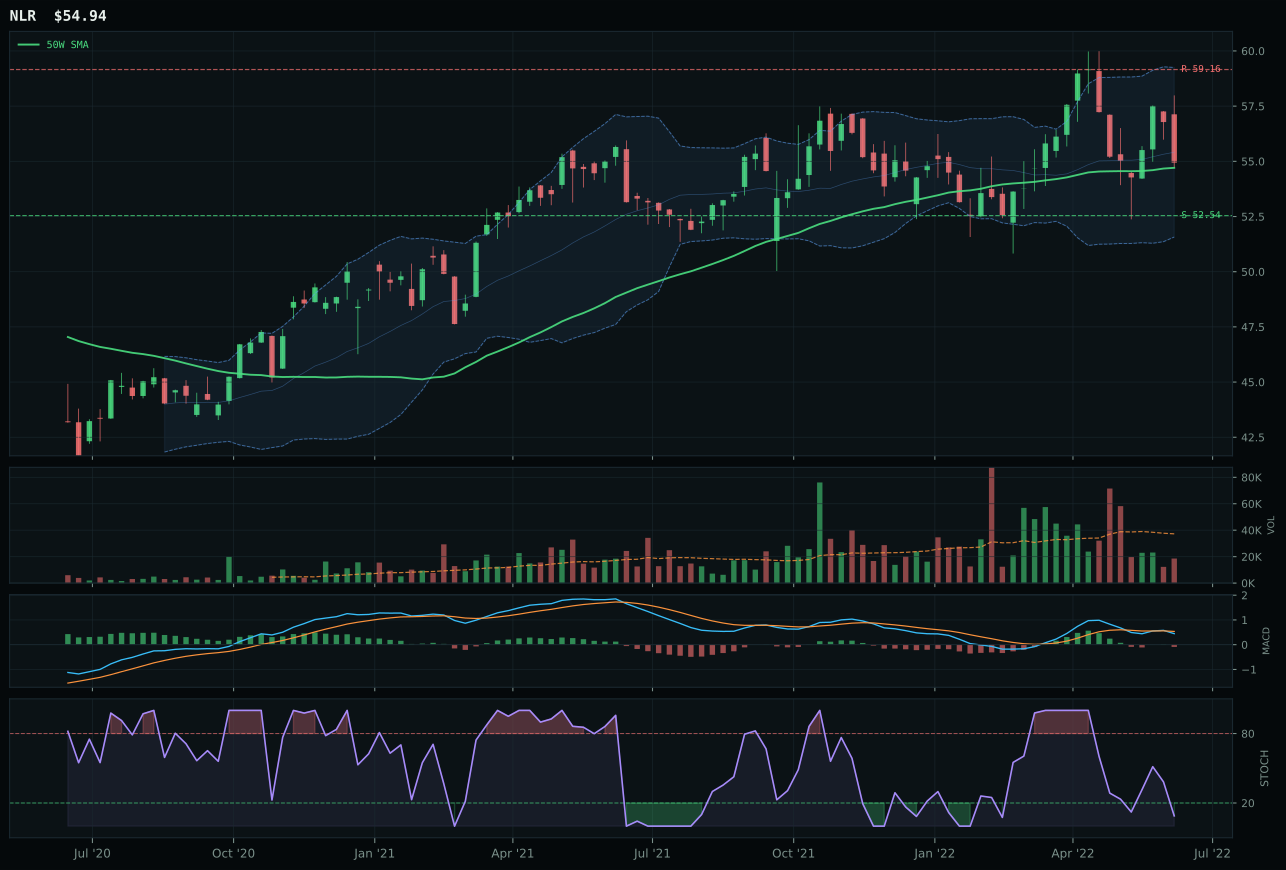
NLR has a pullback into support profile with 7.7% 13-week relative strength versus SPY.
A failed hold above support would weaken the setup.
Tracked, but not top-2 eligible because: .
URNM wins a contentious category decision against URA because URA's 69.5 risk/reward is weaker than URNM's 75.0, and because category macro fit (65.0/100) is strong enough to support a technical outsider. URNM sits below both the 50W and 200W at -7.6%, with a neutral structure and volume participation at 1.00x 20W, making this purely a macro bet rather than a technical setup. The stochastic RSI is rising mid-zone (0.21), MACD is bearish/weakening, and the persistence score is weak at 21.4—all red flags for momentum traders. URA's 51.5 reasoned ETF score beats URNM's 19.0 decisively, yet the category representative assignment flipped because URNM's 78.0 timing score (distance to 50W at -7.6%, Fib 0.618 value zone) and 75.0 risk/reward create a lower-friction entry than URA's 69.5. This is the system penalizing the already-accumulated name in favor of the deeper reset.
Nuclear Energy earned 5% allocation with a 40.7 category score because energy scarcity (+9) and real asset sponsorship (+7) support the theme, but the technical evidence score of 0.0/100 for the representative reveals this is pure macro positioning. URNM's 32.0 trend score (price below both moving averages, -11.3% SPY-relative weakness) disqualifies it from any high-conviction technical setup, and the momentum confirmation at 9.8/100 signals buyers have not yet arrived. The 65.0/100 macro fit keeps the position alive despite weak technicals—late-cycle reflation and energy supply constraints create a fundamental case. However, this allocation is contingent on URNM holding support at 31.23 and stochastic RSI breaking above 0.50; any breakdown would trigger a trim to 2-3%. The category's rank at position 7 reflects a bias toward setups with both technical and macro alignment, not macro conviction alone. Capital is reserved for a cleaner entry once URNM either breaks out above the 50W or crashes below 31.23 to reset the Fib geometry.
Defense & Aerospace — ITA
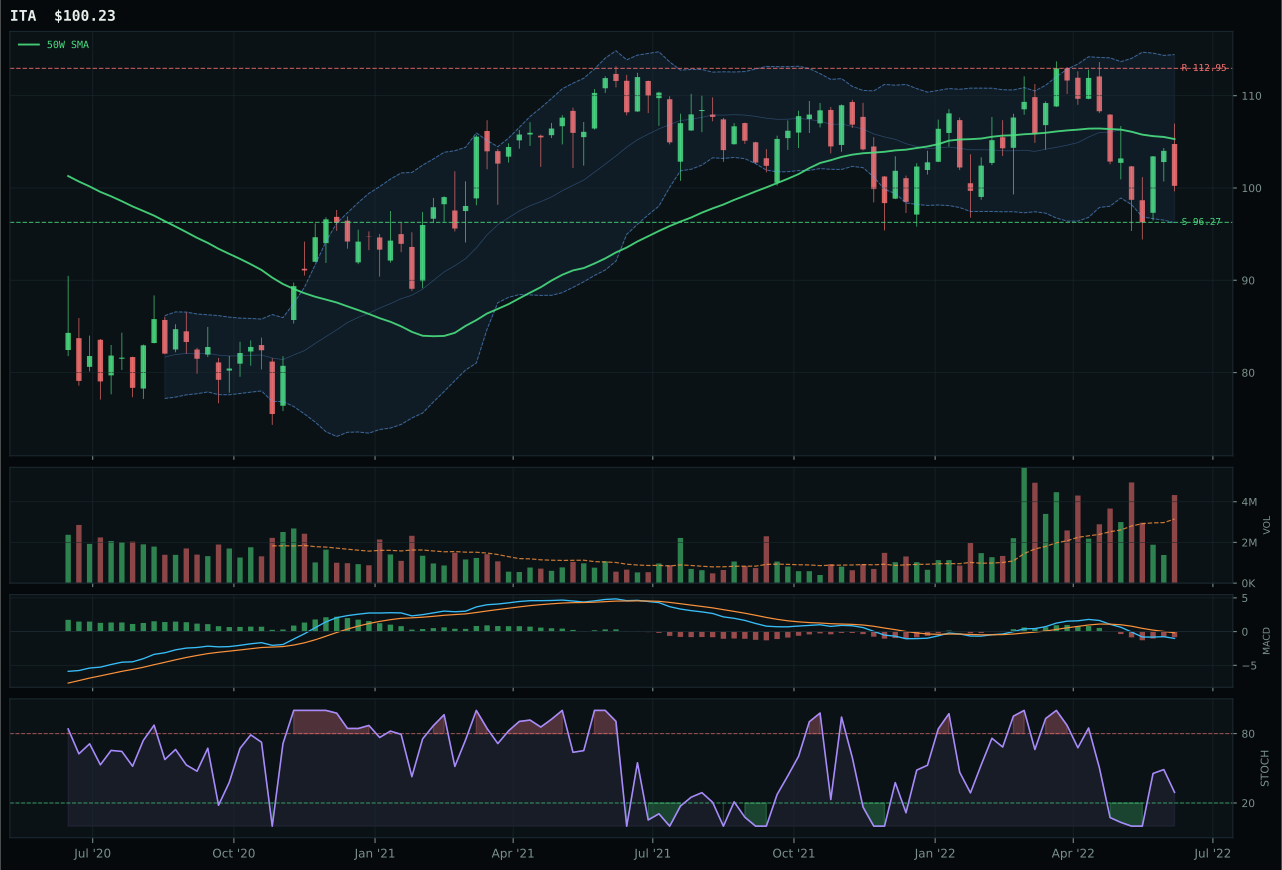
ITA has a pullback into support profile with 1.9% 13-week relative strength versus SPY.
A failed hold above support would weaken the setup.
Actionable but governed by invalidation levels.
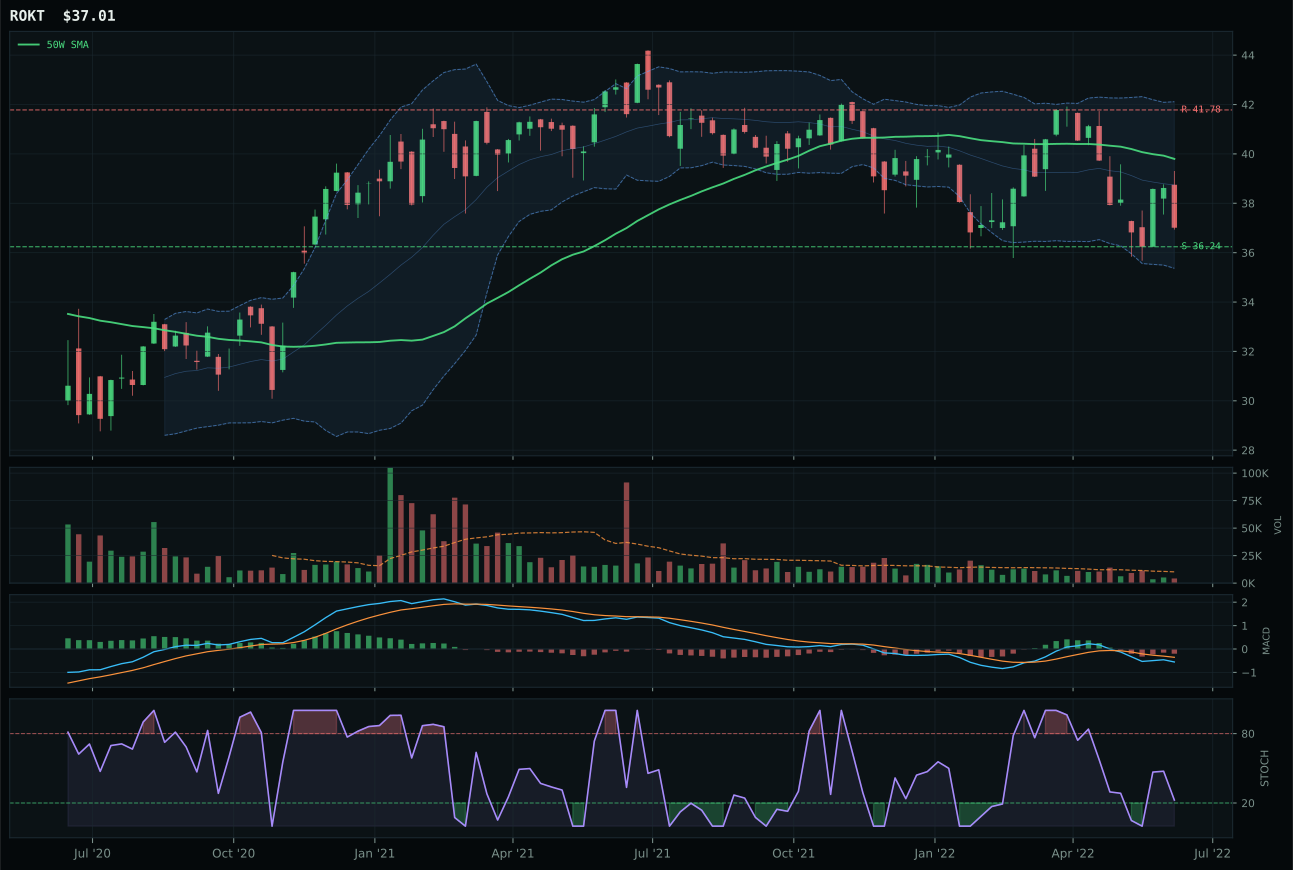
ROKT has a pullback into support profile with 1.9% 13-week relative strength versus SPY.
A failed hold above support would weaken the setup.
Tracked, but not top-2 eligible because: .
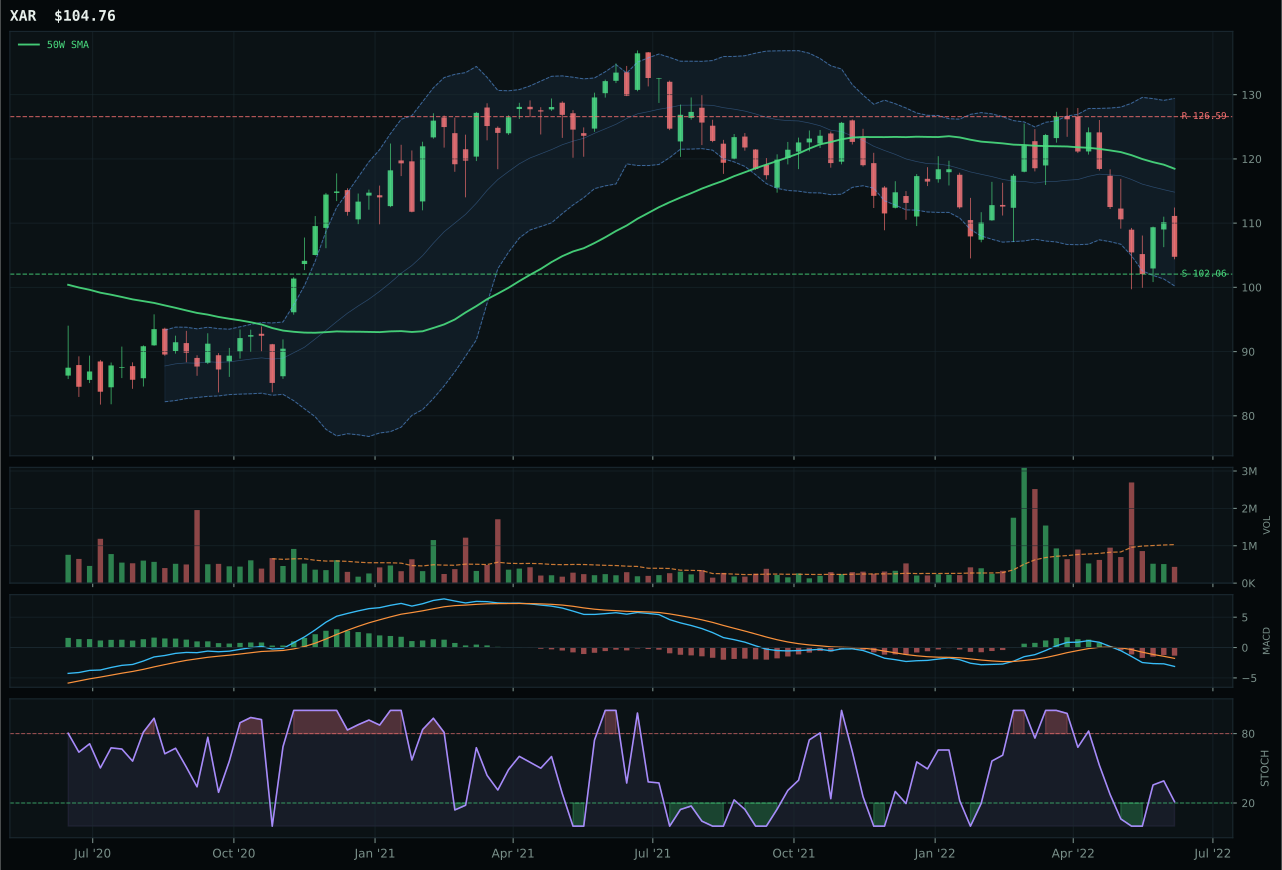
XAR has a pullback into support profile with -4.4% 13-week relative strength versus SPY.
A failed hold above support would weaken the setup.
Actionable but governed by invalidation levels.
ITA wins decisively with a 79.0 composite score because it combines the cleanest structure (70.3) and the only above-average volume participation (1.38x 20W average) among the three candidates. The timing score of 100.0 reflects a perfect storm of favorable conditions: price sits only -4.8% below the 50W, MACD is bearish but improving, stochastic RSI is rising mid-zone, and the Fib 0.618 deep retracement zone at 101.80 acts as a natural magnet. ITA's 4W return of 1.5% signals recent accumulation, and the category-relative strength at 0.0% means it's not overshooting—it's simply the best-positioned proxy. ROKT's 93.0 timing (versus 100.0) and weaker risk/reward (90.0 vs 98.0) stem from a more compressed structure and thin volume, making it a follower rather than a leader.
Defense & Aerospace earned 5% despite a robust 37.4 category score because it ranks third among the 10 categories after XOP and COPX dominate the top allocation slots. The macro case is compelling: defensive rotation is actively positive (+8), broad market bear is supporting equities with pricing power (+6), and the late-cycle reflation regime favors durables and capex cycles (+6). However, liquidity stress (-3) creates a friction cost, and ITA's momentum confirmation of 57.2/100 reveals limited conviction in the magnitude of the move. The category's 67.7/100 technical evidence score for the representative is strong, but 63.0/100 macro fit keeps it in the secondary tier. To earn 10%, this category would need either broader market support (risk appetite stabilizing) or a sustained volume rally confirming institutional accumulation at current levels.
Technology — IGV
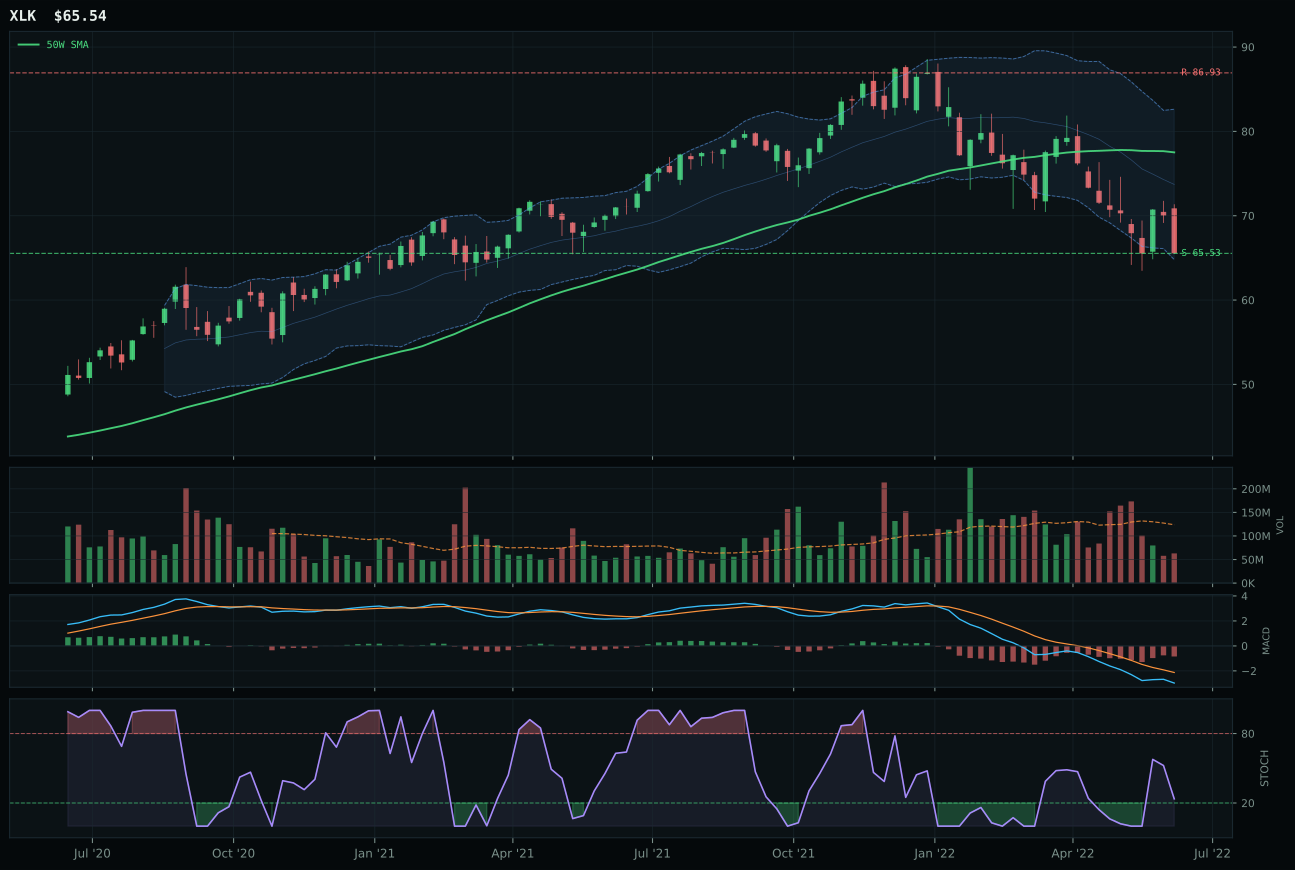
XLK has a pullback into support profile with -1.8% 13-week relative strength versus SPY.
A failed hold above support would weaken the setup.
Actionable but governed by invalidation levels.
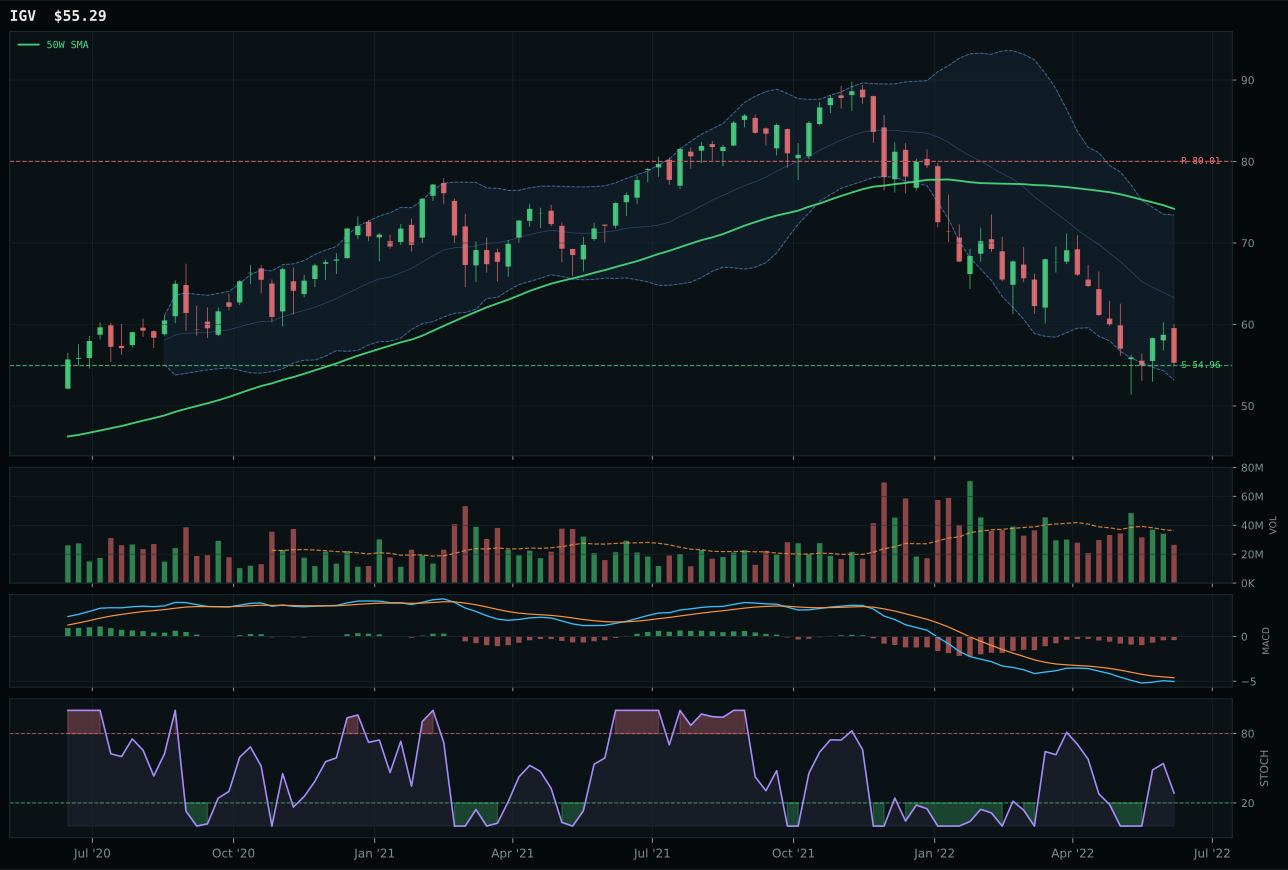
IGV has a pullback into support profile with -4.0% 13-week relative strength versus SPY.
A failed hold above support would weaken the setup.
Actionable but governed by invalidation levels.
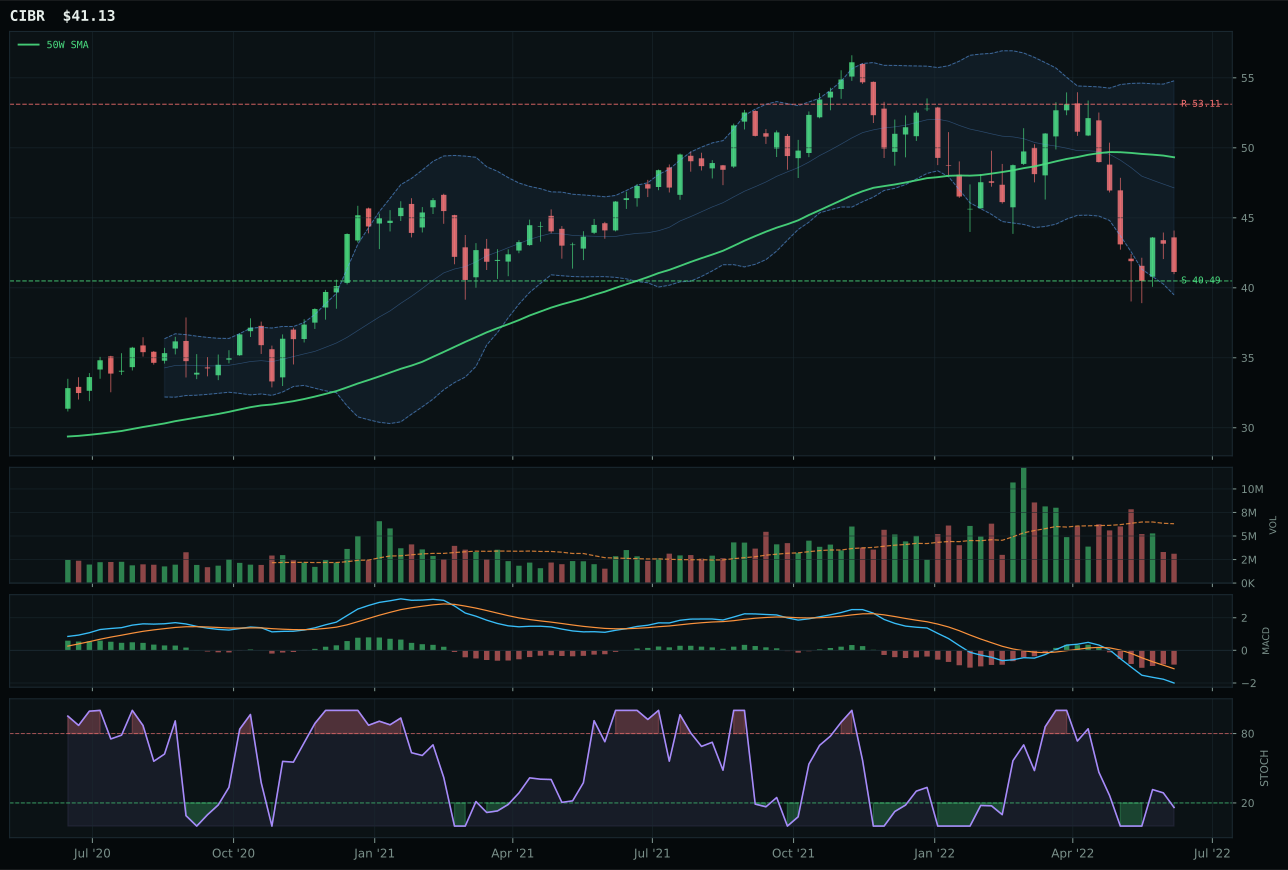
CIBR has a pullback into support profile with -7.3% 13-week relative strength versus SPY.
A failed hold above support would weaken the setup.
Actionable but governed by invalidation levels.
IGV wins the category because it sits closer to a defined support level at 54.96 with a tighter invalidation zone, whereas XLK is already more stretched from its 50W at -15.4%. Both names face the same macro headwinds—liquidity stress and dollar pressure—but IGV's -25.5% pullback from the 50W creates better asymmetry: upside resistance sits 30.9% away while downside support is only 0.6% below. The timing score separation (73.0 vs 73.0) masks a critical technical detail: IGV's stochastic RSI sits in the rising mid-zone at 0.29 with MACD improving, positioning it as a potential capitulation hold rather than a continuation short. CIBR's -7.3% SPY-relative weakness and deteriorating MACD ruled it out entirely, leaving a two-horse race won by the name with the least toxic entry setup.
Technology earned only 5% despite a respectable 24.4 category score because liquidity stress and risk appetite deterioration remain the dominant macro drivers, actively suppressing both trend (42.0) and momentum confirmation (28.1) for the category representative. Late-Cycle Reflation typically supports tech hardware and infrastructure, but the dollar's active pressure on earnings multiples and the absence of any bullish momentum follow-through in the 13W (-11.2%) force a defensive stance. For this allocation to expand, either MACD would need to cross above signal with volume confirmation, or the category's macro fit would need to move from 31.0/100 toward the 50+ range. The current setup reads as a patience hold—capital is allocated to higher-conviction categories with better risk-reward tilts, leaving tech as a tourniquet position rather than a growth engine.
AI — SMH
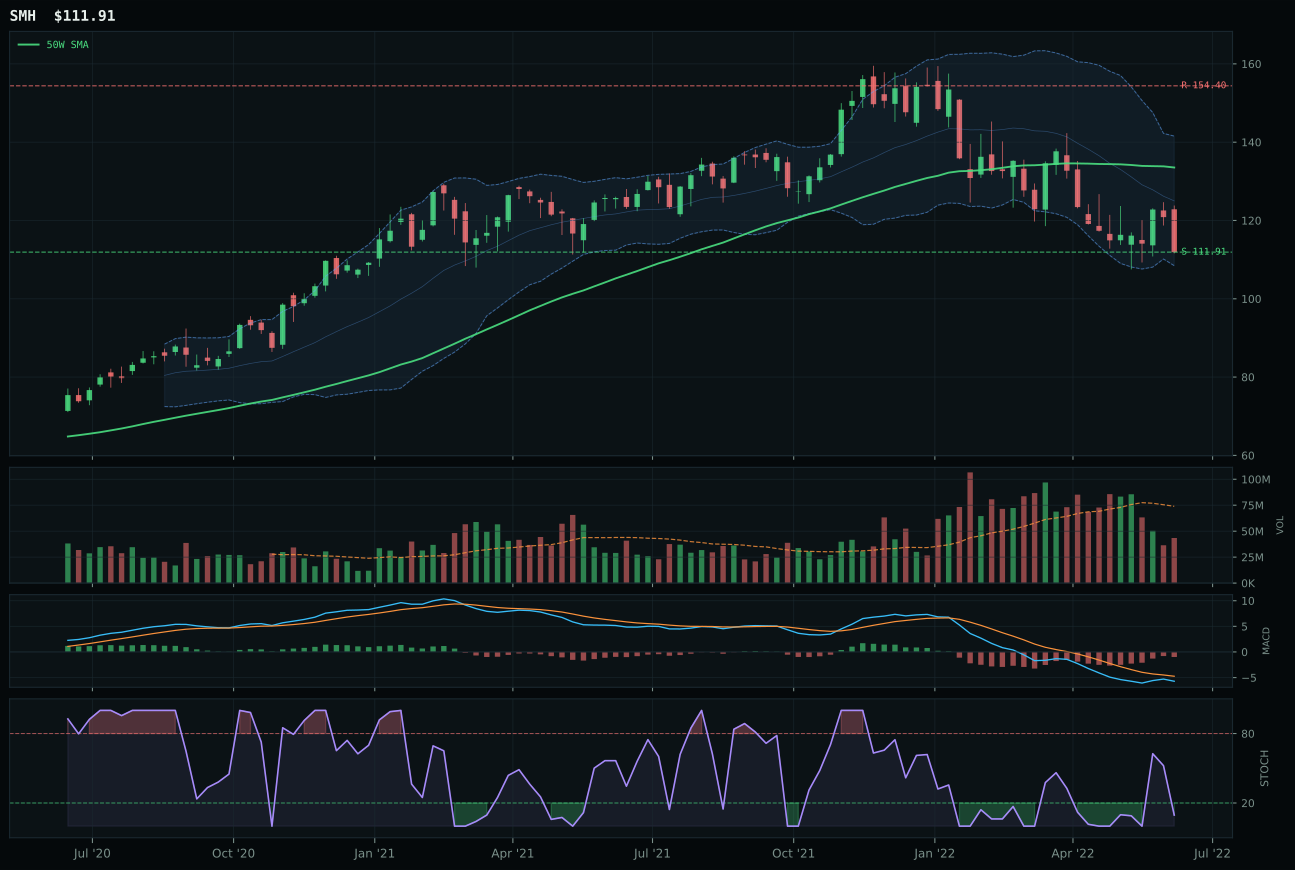
SMH has a pullback into support profile with -1.7% 13-week relative strength versus SPY.
A failed hold above support would weaken the setup.
Actionable but governed by invalidation levels.
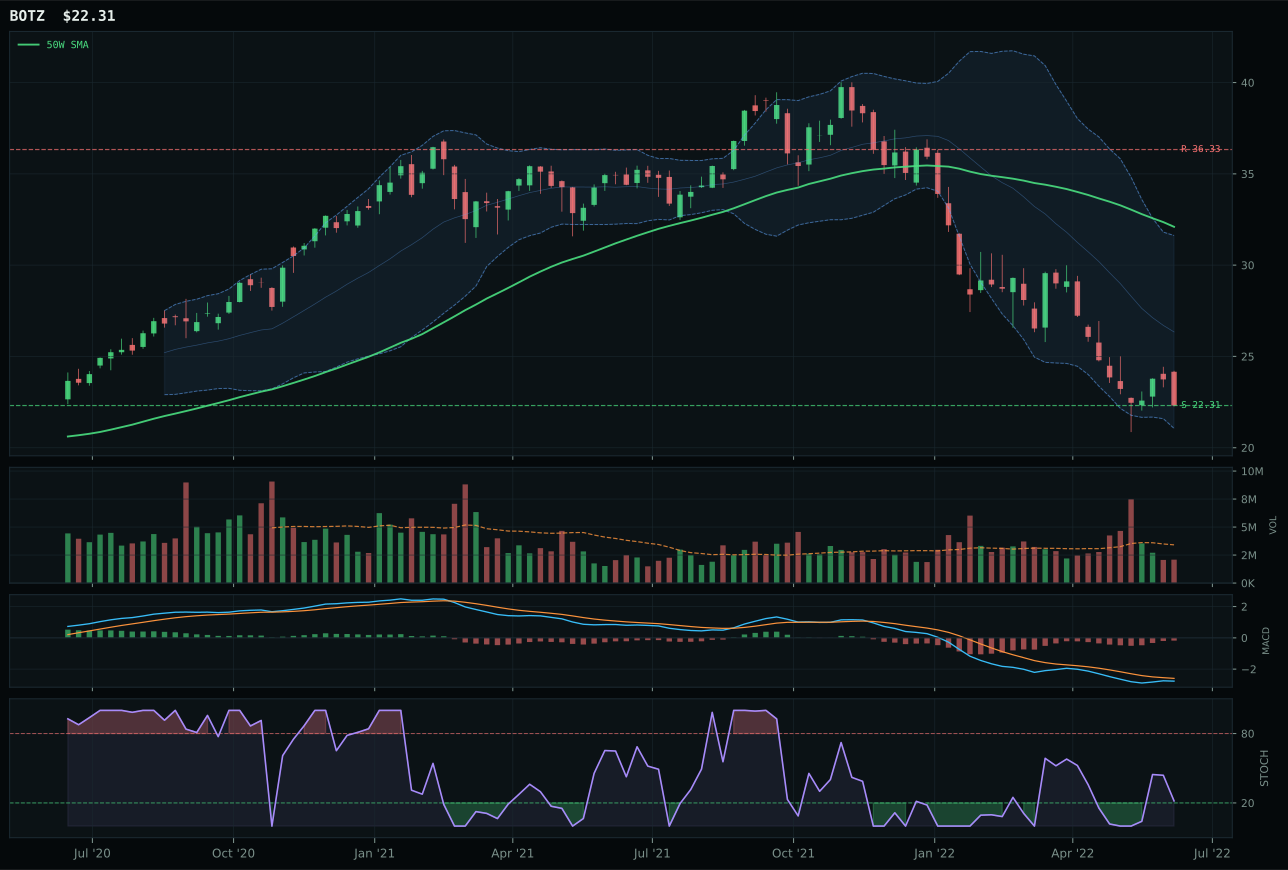
BOTZ has a pullback into support profile with -8.7% 13-week relative strength versus SPY.
A failed hold above support would weaken the setup.
Actionable but governed by invalidation levels.
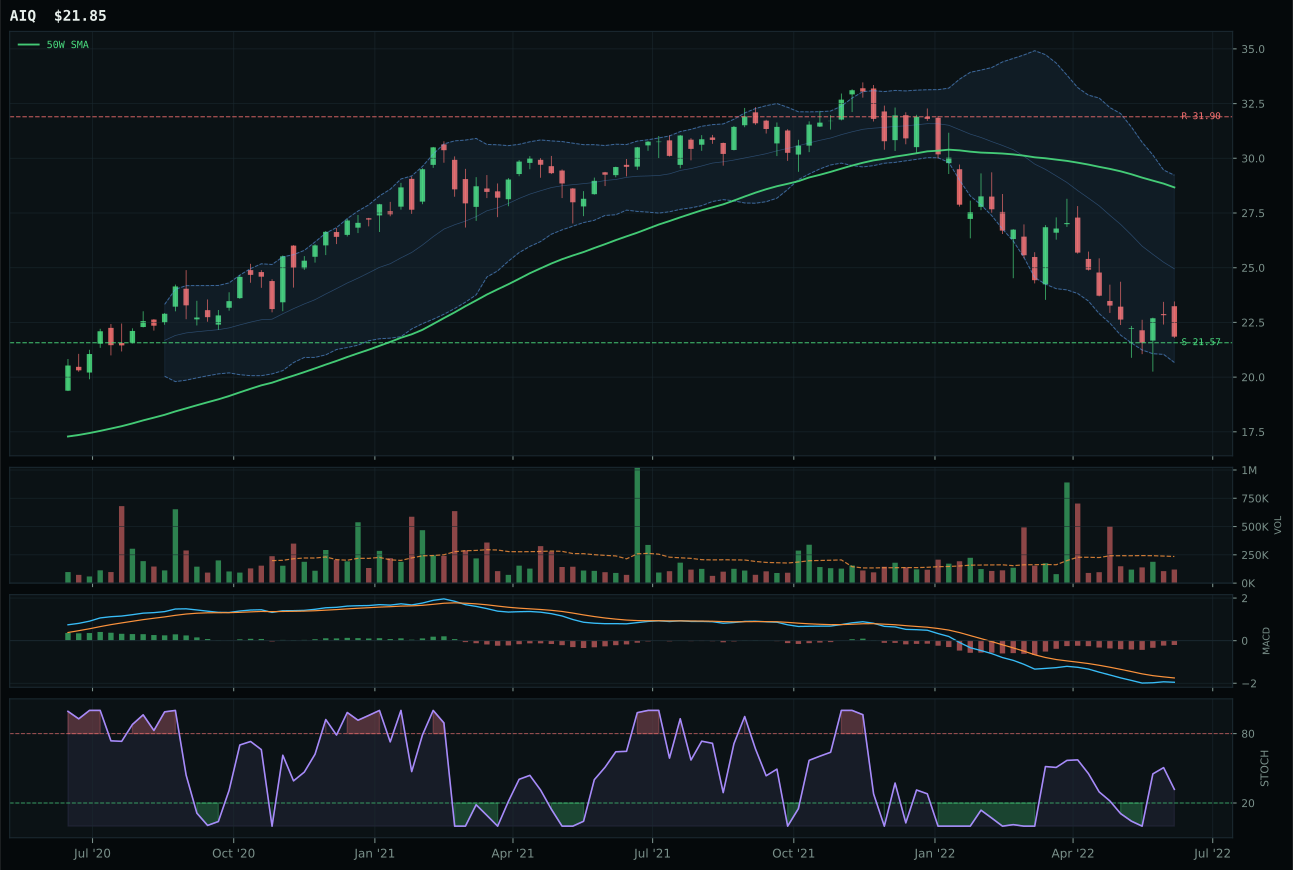
AIQ has a pullback into support profile with -3.4% 13-week relative strength versus SPY.
A failed hold above support would weaken the setup.
Tracked, but not top-2 eligible because: .
SMH wins because its stochastic RSI sits at an oversold turn-up (0.10) versus BOTZ's rising mid-zone, a critical timing advantage in a reset environment where new lows often mark capitulation. SMH's 13W return of -8.9% sits between BOTZ's -15.9% and AIQ's -10.6%, but the category-relative strength of 1.6% gives it leadership inside its own basket despite trailing SPY by 1.7%. The setup is pullback into support near 111.91 with only 0.0% downside to that level, meaning new buyers have a defined invalidation. BOTZ's deeper drawdown and flatter momentum confirmation (9.0 vs 36.9) reveal why robotics underperformed: physical cyclicality is getting crushed harder in this liquidity stress regime, and the market is not yet confident enough to accumulate growth hardware.
AI ranks 9th or 10th this week with zero allocation because the category scores only 18.9 points amid two active headwinds that crush the macro fit to 26.0. Liquidity stress (-12 impact) and a broad-market bear (-8) are cutting through any technical merit SMH might offer; the late-cycle reflation label helps industrial assets and energy, not silicon-linked growth plays. Even SMH's superior timing (79.0) and risk-reward structure (75.0) cannot overcome momentum confirmation that scores just 36.9 out of 100—13-week returns of -8.9% signal that buyers are not yet accumulating despite the technical repair zone. The gap between AI's current positioning and a top-2 portfolio slot is not a close call: Traditional Energy scores 81.9, Industrial Metals 52.6, making AI's 18.9 a distant third-tier candidate. Re-entry would require either a sustained break above 50-week resistance on accumulation volume, or a pivot in macro conditions that removes the dollar/liquidity penalties—neither is in evidence this week.
Emerging Markets — INDA
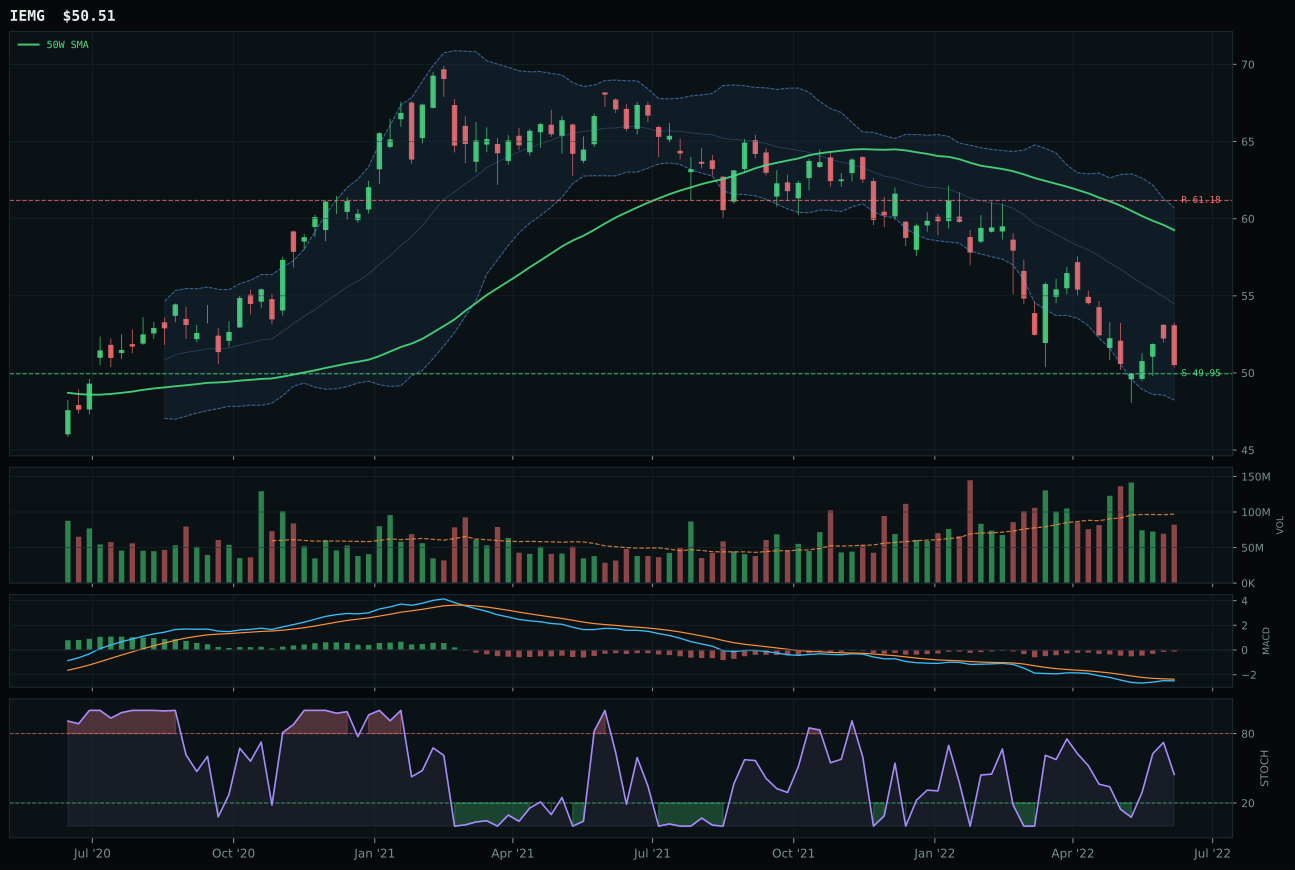
IEMG has a pullback into support profile with 3.5% 13-week relative strength versus SPY.
A failed hold above support would weaken the setup.
Actionable but governed by invalidation levels.
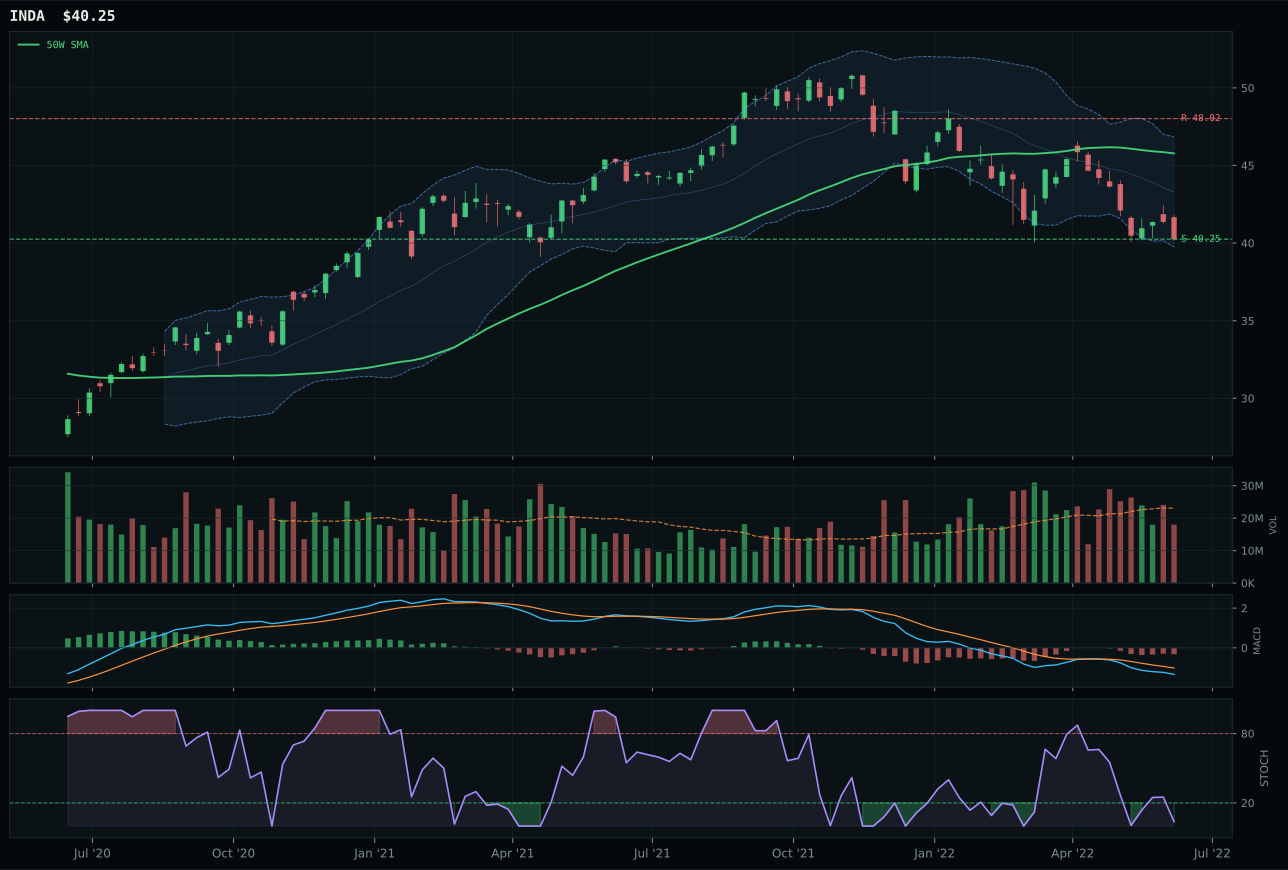
INDA has a pullback into support profile with 2.8% 13-week relative strength versus SPY.
A failed hold above support would weaken the setup.
Actionable but governed by invalidation levels.
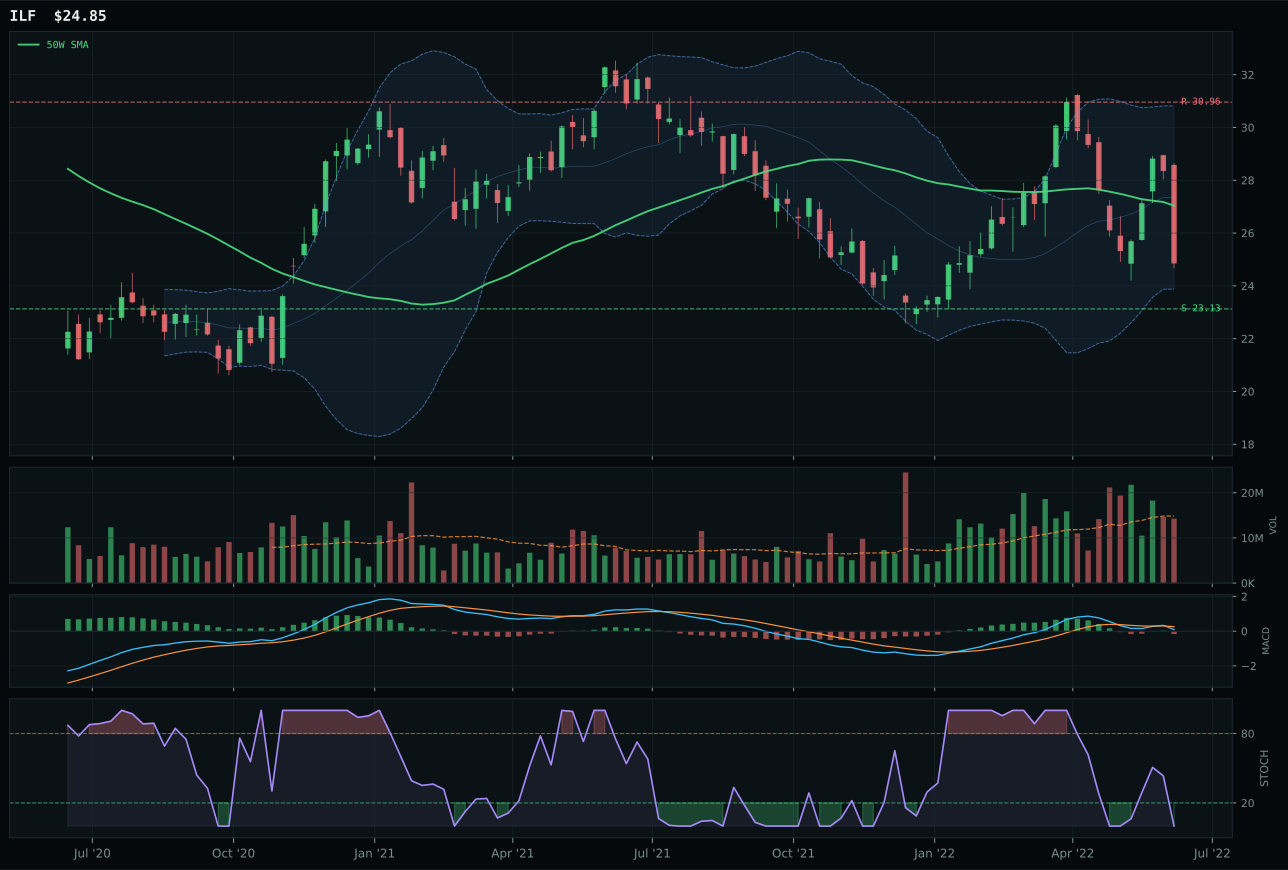
ILF has a neutral structure profile with -1.1% 13-week relative strength versus SPY.
Extension and support failure are the main tactical risks.
Tracked, but not top-2 eligible because: structurally broken.
INDA wins by eliminating ambiguity: it sits in pullback-into-support mode with stochastic RSI at 0.04 (oversold), whereas IEMG's rising mid-zone at stochastic creates a less defined timing advantage. Structure is the deciding factor—INDA's 69.1 structure score reflects tighter cleanliness (41.7) and better compression (80.1) at support 40.25, giving it a 0.0% downside invalidation versus more diffuse risk in IEMG's 65.9 structure. Both face the same macro headwinds: dollar pressure (-14) and liquidity stress (-10) create a -24 combined headwind that explains why the entire category scores just 8.9 out of 100. INDA's 2.8% SPY-relative strength barely edges IEMG's 3.5%, but within a broken category, the name with the clearest technical floor wins the representative slot.
Emerging Markets earned zero allocation, ranking 9th or 10th with a category score of just 8.9 points—the portfolio's weakest category by a significant margin. Dollar pressure (-14 impact) and liquidity stress (-10) are crushing EM as a complex, and broad-market bear (-9) removes any cyclical sponsorship that might help exporters. The macro fit sits at 17.0, lower than every other category, making the technical setup irrelevant; both INDA and IEMG are trading into structural headwinds. INDA's 52 composite score and superior timing do not move the needle because the category itself is in the penalty box. Re-entry requires a meaningful shift in dollar conditions—either a weaker dollar structure or a thawing of liquidity stress—neither of which is in evidence. Until those macro conditions turn, emerging markets sit outside the portfolio entirely, and capital is better deployed in energy, industrial metals, or defense where macro tailwinds exist. The 8.9 score is not a close call to exclusion; it is a clear statement that EM is a zero-weight position this week and the next several weeks until the dollar or liquidity regimes shift.