
2022-06-03
Informational purposes only. The content in this report, including allocations, analysis, and commentary, is provided solely for informational and educational purposes. It does not constitute financial advice, investment advice, trading advice, or any other type of advice. Past performance does not guarantee future results. Always conduct your own research and consult a qualified financial professional before making investment decisions.
GLD defensive overlay excluded: price is below its 8W SMA. Cause selector will use cash alternative.
Macro risk engine requires the 50% Defensive overlay for this run; payload selected by cause: Inflation Scarcity.
Weekly Allocation
| Ticker | Category | Weight | Role |
|---|---|---|---|
| XLE | Traditional Energy | 60% | Overlay |
| VEGI | Agriculture & Livestock | 10% | Top-2 (10%) |
| COPX | Industrial Metals | 5% | Tier-2 (5%) |
| IGF | Utilities & Infrastructure | 5% | Tier-2 (5%) |
| URA | Nuclear Energy | 5% | Tier-2 (5%) |
| ITA | Defense & Aerospace | 5% | Tier-2 (5%) |
| GLD | Precious Metals | 5% | Tier-2 (5%) |
| IGV | Technology | 5% | Tier-2 (5%) |
Trade Instructions — Monday Open
Sell the tranche from 2022-05-06 (completing its 4-week hold). Buy the new tranche. Instructions show net portfolio changes — same-asset positions cancel, weight changes show the delta.
| Action | Ticker | Instruction |
|---|---|---|
| SELL | SGOV | Sell 50% of SGOV position (reduce 25.00% → 12.50%) |
| SELL | WEAT | Sell 25% of WEAT position (reduce 10.00% → 7.50%) |
| SELL | XLK | Sell 33% of XLK position (reduce 3.75% → 2.50%) |
| BUY | XLE | Buy XLE — 76.92% of freed cash (adds 12.50% to portfolio) |
| BUY | VEGI | Buy VEGI — 15.38% of freed cash (adds 2.50% to portfolio) |
| BUY | IGV | Buy IGV — 7.69% of freed cash (adds 1.25% to portfolio) |
Current Portfolio After Trade
Combined holdings across all 4 active tranches. Each tranche is 25% of the portfolio.
| Ticker | % of Portfolio | Weight Bar |
|---|---|---|
| XLE | 47.50% | |
| SGOV | 12.50% | |
| WEAT | 7.50% | |
| COPX | 5.00% | |
| ITA | 5.00% | |
| URA | 5.00% | |
| GLD | 3.75% | |
| XLK | 2.50% | |
| IGF | 2.50% | |
| XLU | 2.50% | |
| VEGI | 2.50% | |
| SLV | 1.25% | |
| IEMG | 1.25% | |
| IGV | 1.25% |
Macro Regime — Late-Cycle Reflation
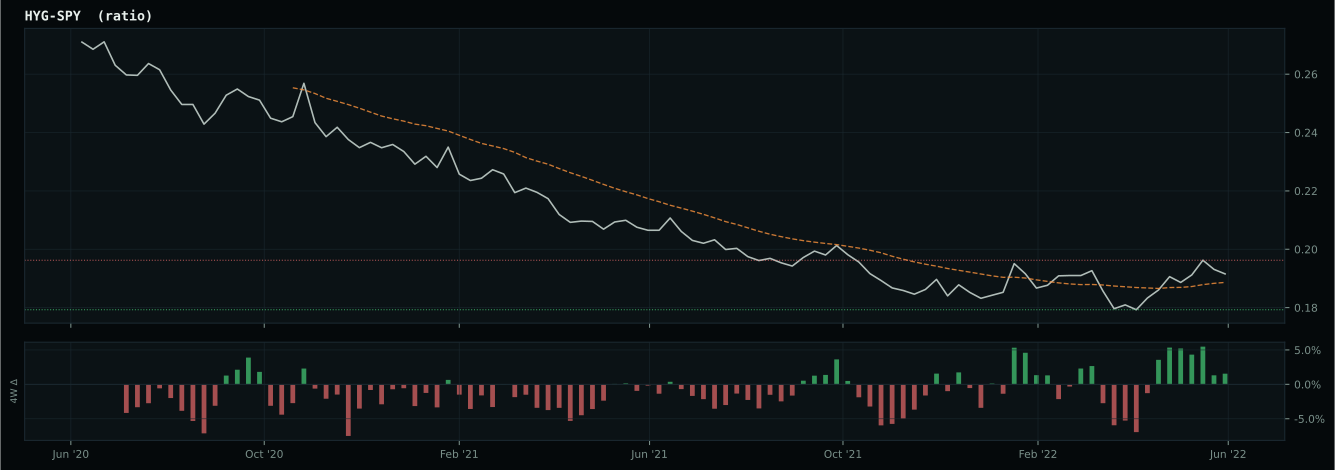
growth data is not confirming the weak market-implied risk appetite signal
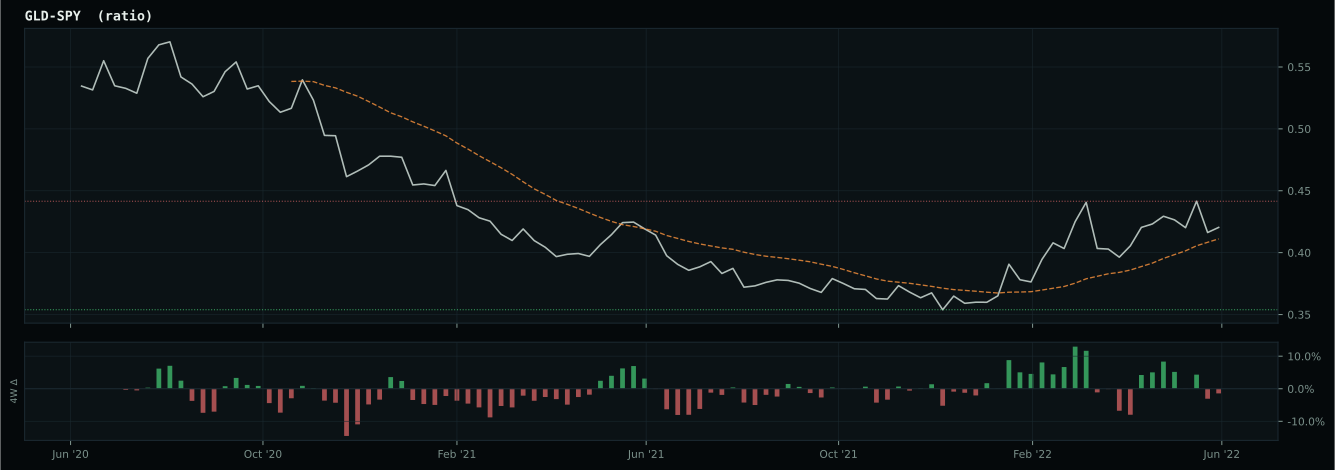
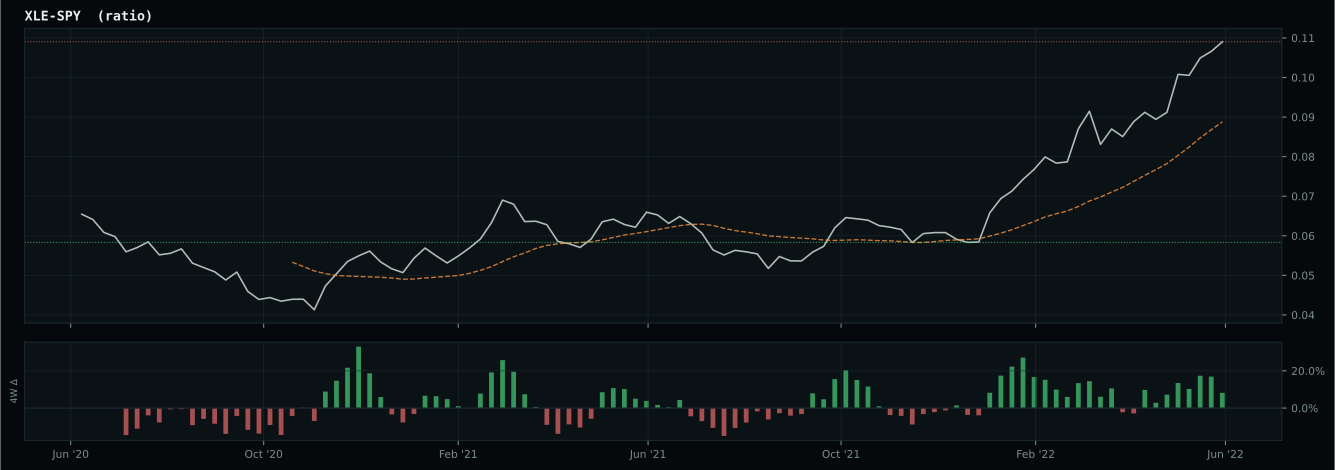
Defensive overlay cause is inflation/scarcity: energy, commodity breadth, or oil-versus-gold confirmation is stronger than the broad equity tape, so the sleeve owns the inflation pressure. XLE has been confirmed above its 8W SMA and is eligible.
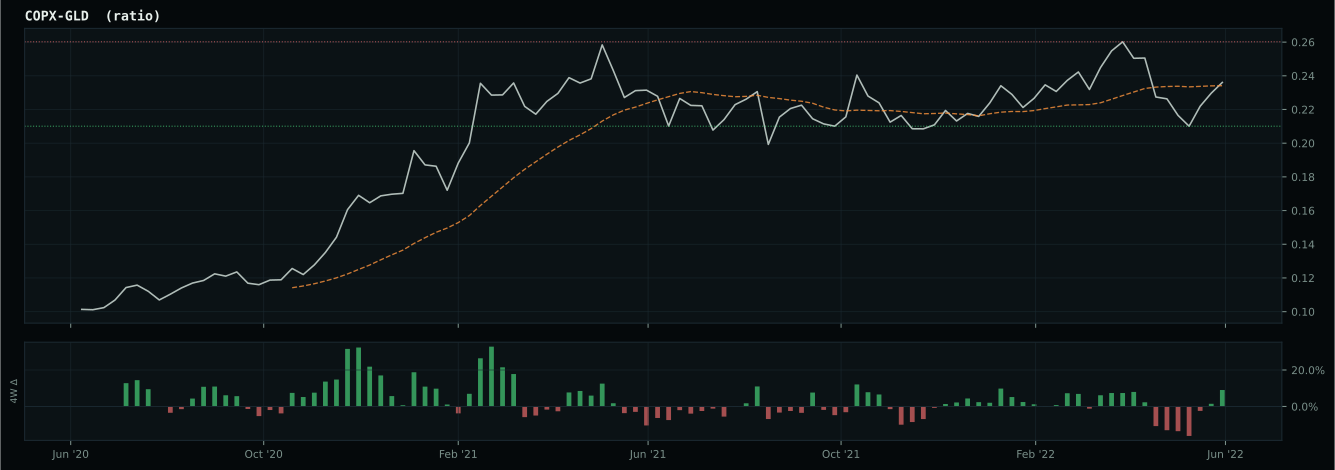
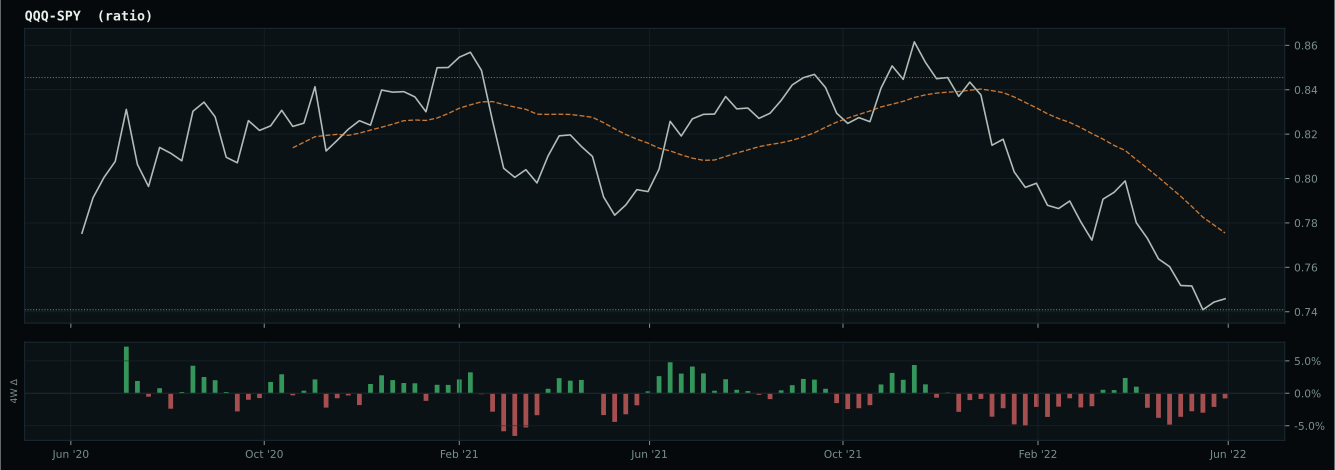
Macro Evidence Charts
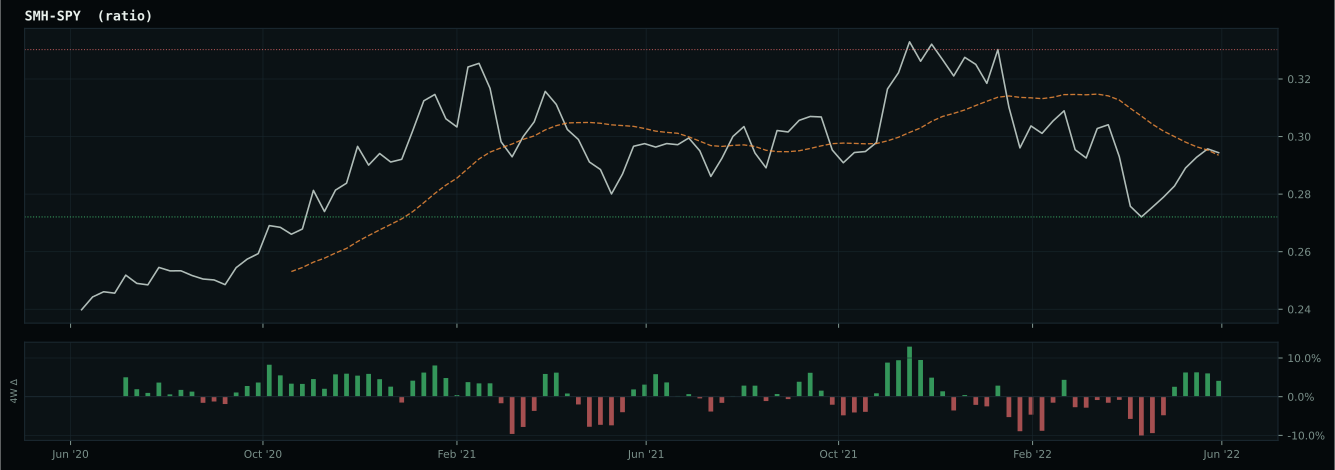
Market-implied signals behind the macro regime scores. Each ratio compares two assets; the direction and slope of the ratio is what the macro engine reads.
Crypto Regime — NoCrypto
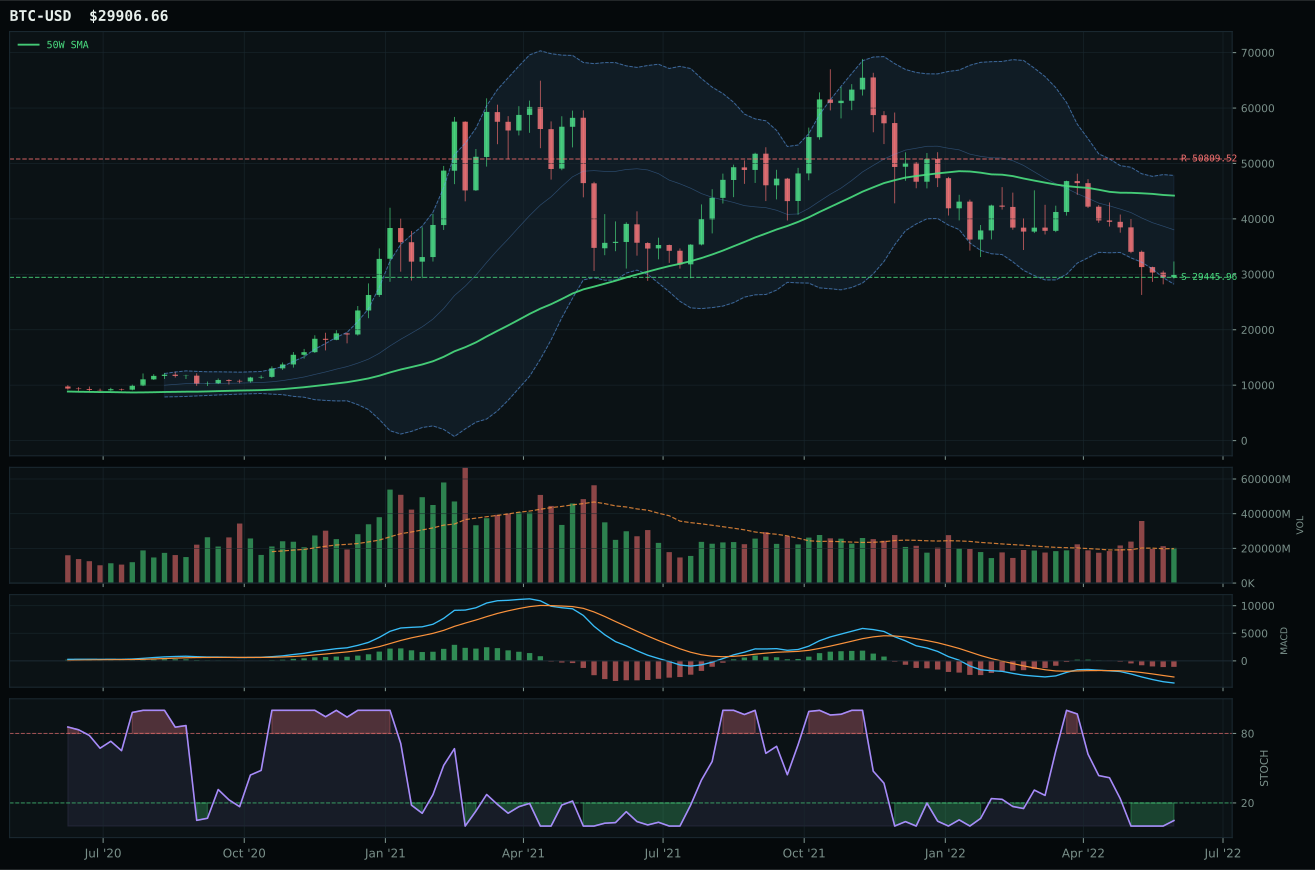
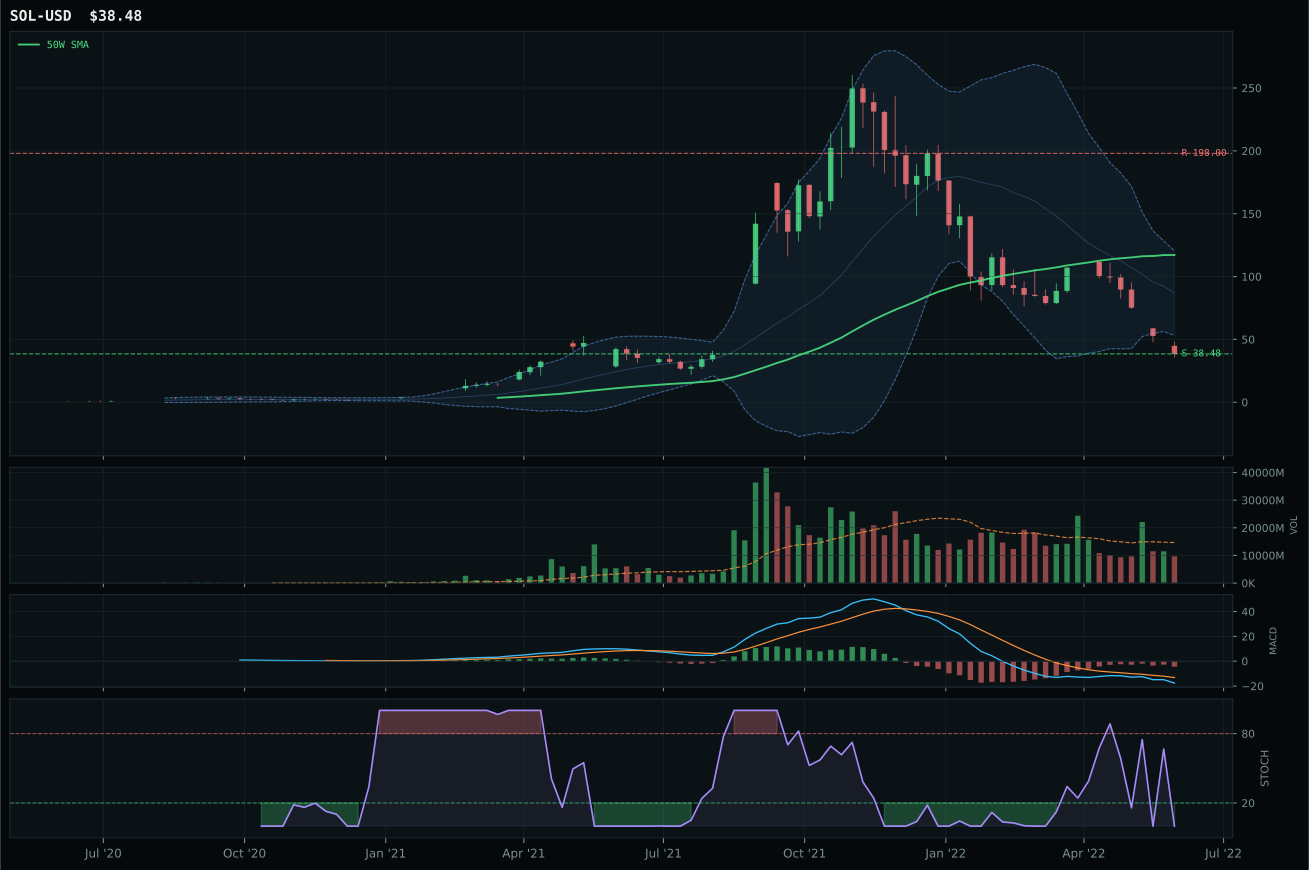
ValueBTC not armed: BTC has not made the first post-breakdown touch of the 200W buy zone after losing the 50W
TrendBTC not confirmed
one or more available conditions failed
Category Rankings
| Rank | Category | Winner | Score | Alloc | 4W Ret | Peers (4W) |
|---|---|---|---|---|---|---|
| 1 | Traditional Energy | XLE | 81.6 | 20% | -20.97% | XOP -28.0% · FCG -28.1% |
| 2 | Agriculture & Livestock | VEGI | 64.0 | 20% | -16.45% | MOO -14.3% · WEAT -20.9% |
| 3 | Industrial Metals | COPX | 53.0 | 10% | -29.98% | REMX -17.3% · PICK -28.3% |
| 4 | Utilities & Infrastructure | IGF | 52.0 | 10% | -9.88% | XLU -4.4% · PAVE -14.4% |
| 5 | Nuclear Energy | URA | 37.8 | 10% | -18.40% | URNM -18.2% · NLR -6.0% |
| 6 | Defense & Aerospace | ITA | 36.2 | 10% | -5.48% | ROKT -11.4% · XAR -9.7% |
| 7 | Precious Metals | GLD | 32.3 | 10% | -3.26% | GDX -15.7% · SLV -12.5% |
| 8 | Technology | IGV | 26.2 | 10% | -9.36% | XLK -11.3% · CIBR -7.2% |
| 9 | AI | SMH | 20.5 | 0% | -22.27% | BOTZ -16.8% · AIQ -11.6% |
| 10 | Emerging Markets | ILF | 14.3 | 0% | -23.58% | IEMG -10.2% · INDA -6.3% |
Traditional Energy — XLE
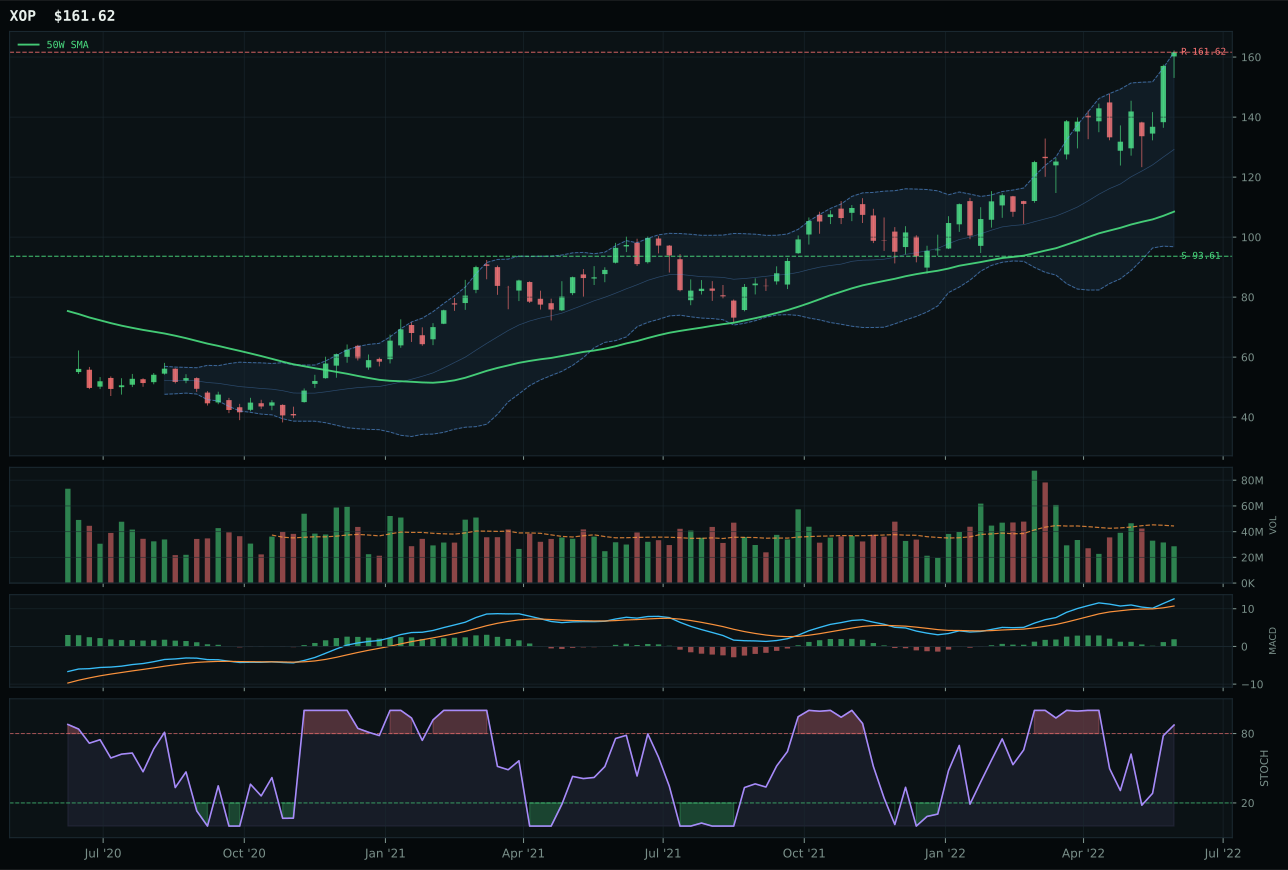
XOP has a vertical extension profile with 34.3% 13-week relative strength versus SPY.
A failed hold above support would weaken the setup.
Actionable but governed by invalidation levels.
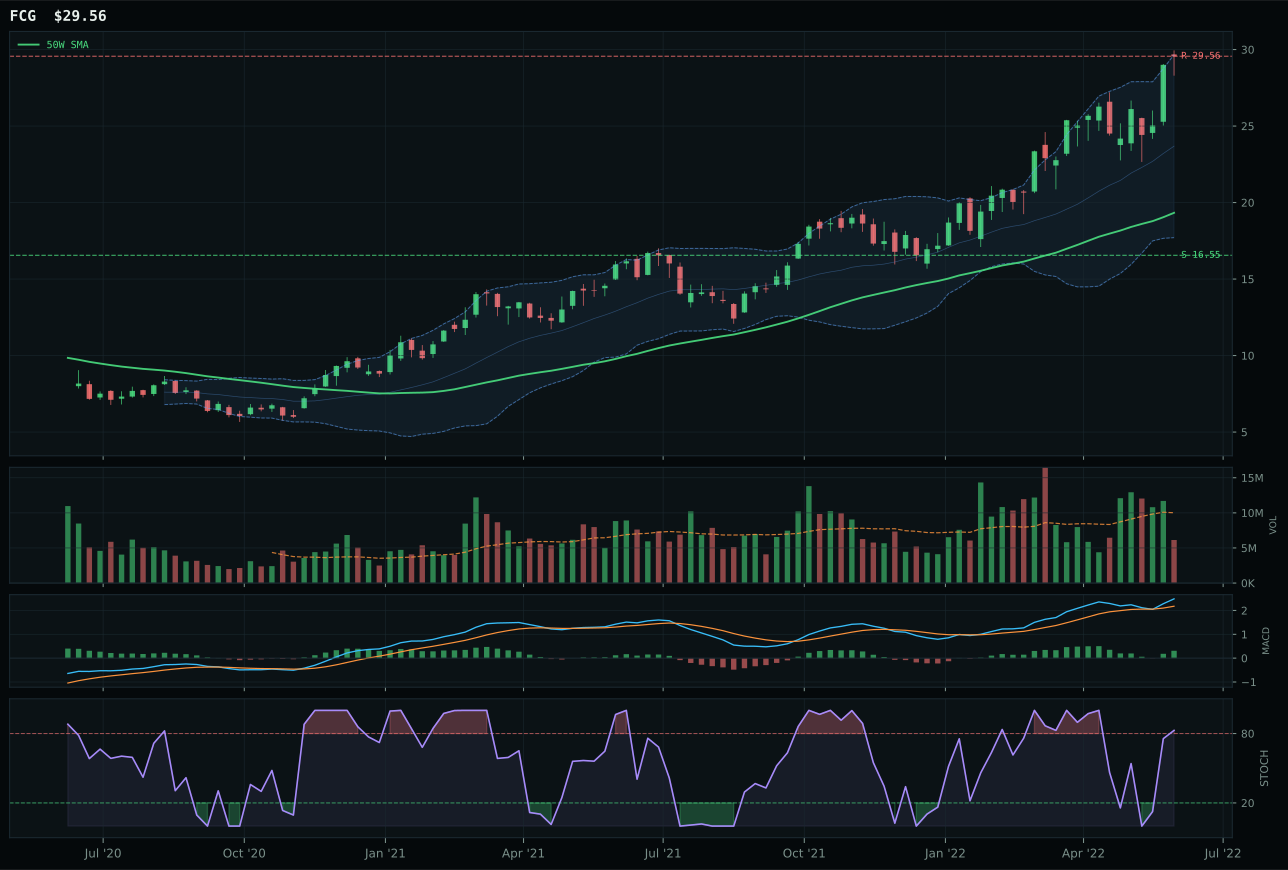
FCG has a vertical extension profile with 31.6% 13-week relative strength versus SPY.
A failed hold above support would weaken the setup.
Actionable but governed by invalidation levels.
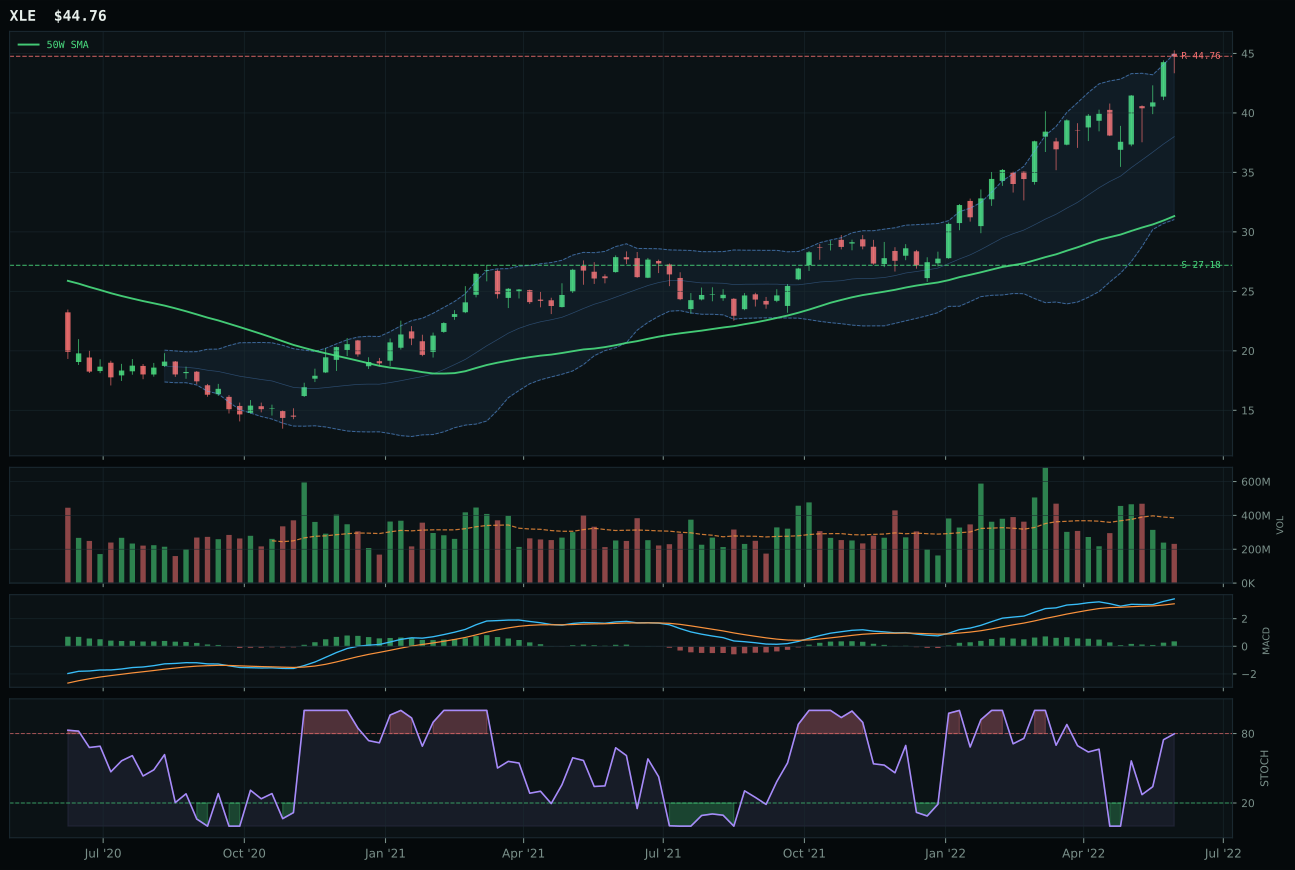
XLE has a vertical extension profile with 24.0% 13-week relative strength versus SPY.
A failed hold above support would weaken the setup.
Actionable but governed by invalidation levels.
XLE's top-2 selection rests on a perfect trend score (100.0) powered by a 24.0% relative strength advantage over SPY—a number that means every month for thirteen weeks, energy buyers have bid XLE higher than the broad market. The chart is extended at 42.9% above the 50W, which normally would trigger risk management, but the supporting evidence is overwhelming: 13W return of positive 19.0%, 26W return of positive 62.3%, MACD bullish and improving, stochastic RSI rising into mid-zone from lows. XOP lost the slot not because its momentum (100 vs XLE's 100) was inferior, but because its extension was deeper (48.9% above 50W) and its timing was worse (37.0 vs XLE's 53.0)—XOP sits in overbought momentum territory while XLE is in rising mid-zone, a subtle but critical distinction when positioning within a category where all members are performing well. Volume sponsorship is thin across all three, but XLE has the most efficient entry-exit mechanics.
Traditional Energy's 10% allocation reflects the portfolio's thesis that late-cycle reflation with active energy scarcity creates the highest-conviction opportunity set available. The category macro fit of 97.0 is the highest score across all ten categories—energy scarcity active, inflation pressure active, supply shortage active, real asset sponsorship active—and XLE's technical evidence of 61.9 is solid enough that the macro tailwind can drive allocation. The extended chart (42.9% above 50W) is not a disqualifier because supply-side constraints are structural and buyers are not betting on mean reversion to the 50W but on new highs driven by sustained undersupply. The 10% weight reflects the single conviction that crude oil and integrated energy cash flow will remain the highest-conviction allocation in a late-cycle reflation regime, even as valuation extremes must eventually matter.
Agriculture & Livestock — VEGI
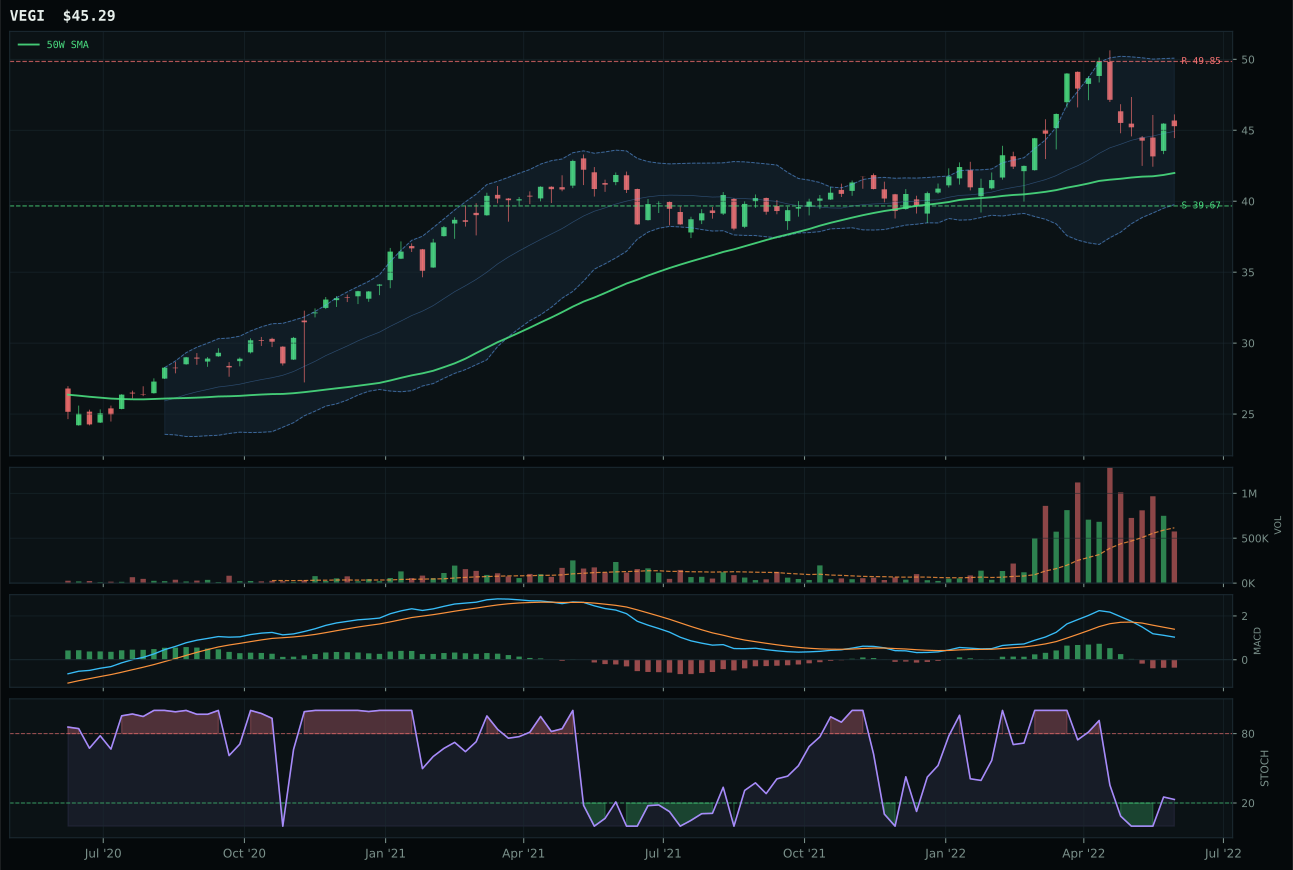
VEGI has a neutral structure profile with 6.9% 13-week relative strength versus SPY.
A failed hold above support would weaken the setup.
Actionable but governed by invalidation levels.
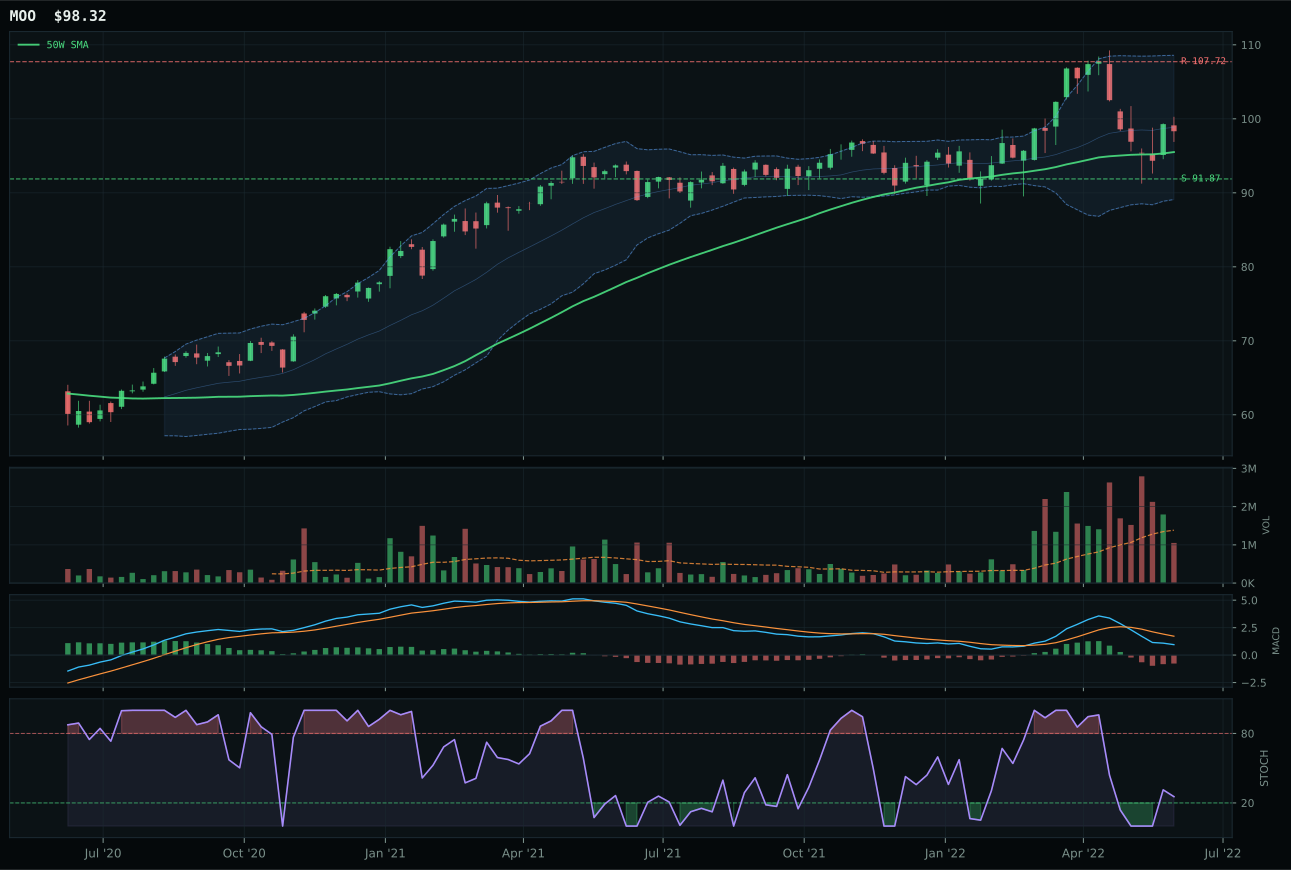
MOO has a compression near 50W profile with 4.6% 13-week relative strength versus SPY.
A failed hold above support would weaken the setup.
Actionable but governed by invalidation levels.
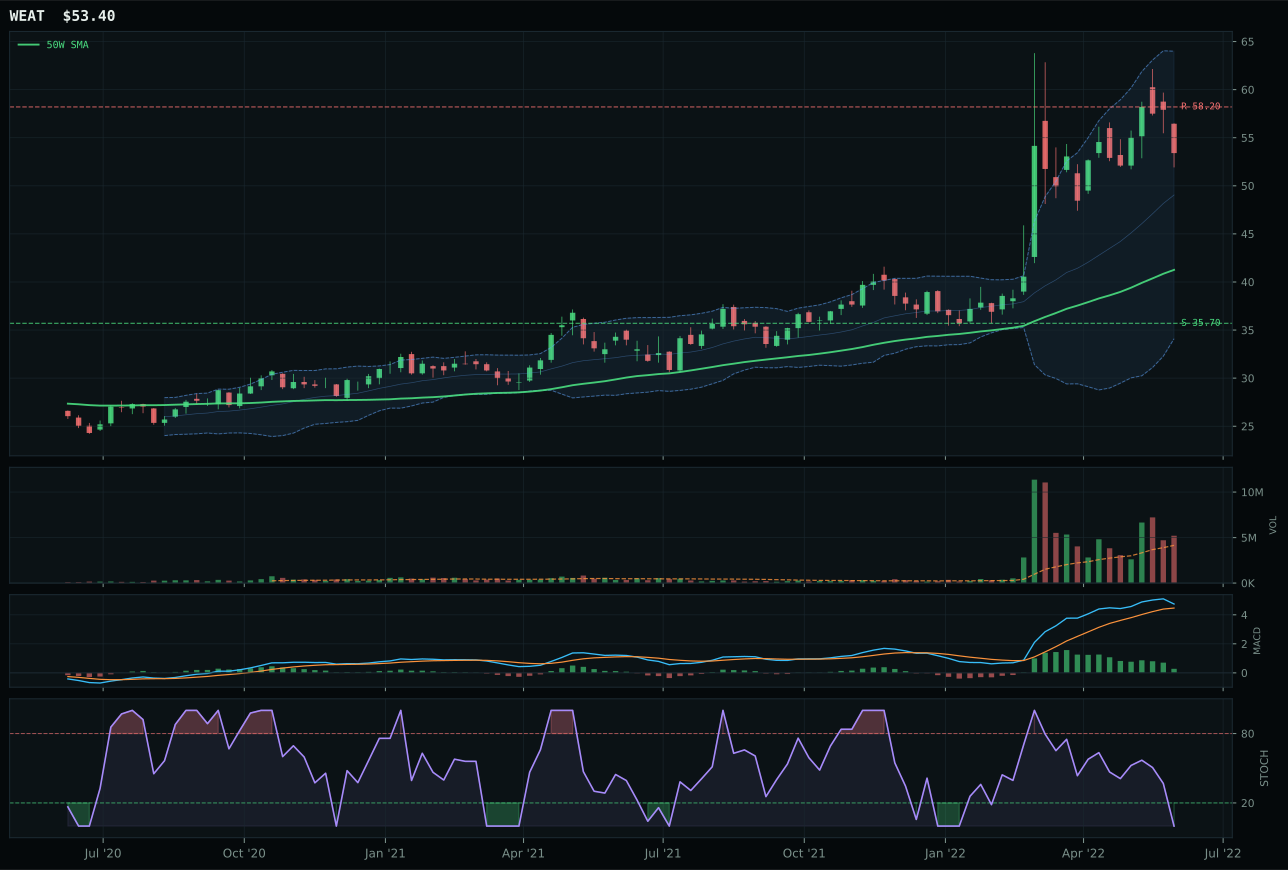
WEAT has a vertical extension profile with 3.6% 13-week relative strength versus SPY.
A failed hold above support would weaken the setup.
Actionable but governed by invalidation levels.
VEGI claimed the top-2 slot not because it is screaming higher, but because it is the only agricultural expression with price above the 50W, RS above SPY positive, and rising stochastic at a subdued level (0.23) that leaves room for accumulation. The 7.9% distance from the 50W combined with positive 13W return of 1.9% and positive 26W return of 15.2% tells a story of quiet accumulation over three months of broad-market distress. Category-relative strength of positive 2.3% versus MOO's 0.0% reveals VEGI is the preferred vehicle, and the macro sponsor is crystal clear: supply shortage active, inflation pressure active, commodity breadth positive, and real asset sponsorship all push the category score to 90.0. MOO's timing is actually superior (100.0 vs VEGI's 85.0) and its setup is tighter (compression near 50W), but VEGI's cleaner Fibonacci positioning (Fib 0.382 vs MOO's broader decision zone) and stronger SPY-relative behavior granted it the category crown.
Agriculture & Livestock earned the second 10% allocation slot on a category score of 64.0—a dominant macro fit of 90.0 pushed it above several technically sharper categories that suffer under current regime conditions. Late-Cycle Reflation explicitly helps this exposure, supply-chain shortages are structural not cyclical, and inflation pressure directly benefits agricultural producers with pricing power. The setup is not extended—VEGI sits comfortably below resistance and above support—which means entry risk is low and hold duration is likely measured in months, not weeks. VEGI competes directly with XLE and VEGI for the two top-2 slots, and it won that competition by offering inflation-hedge durability alongside energy-peer momentum, making it a natural hedge to the 60% XLE concentration.
Industrial Metals — COPX
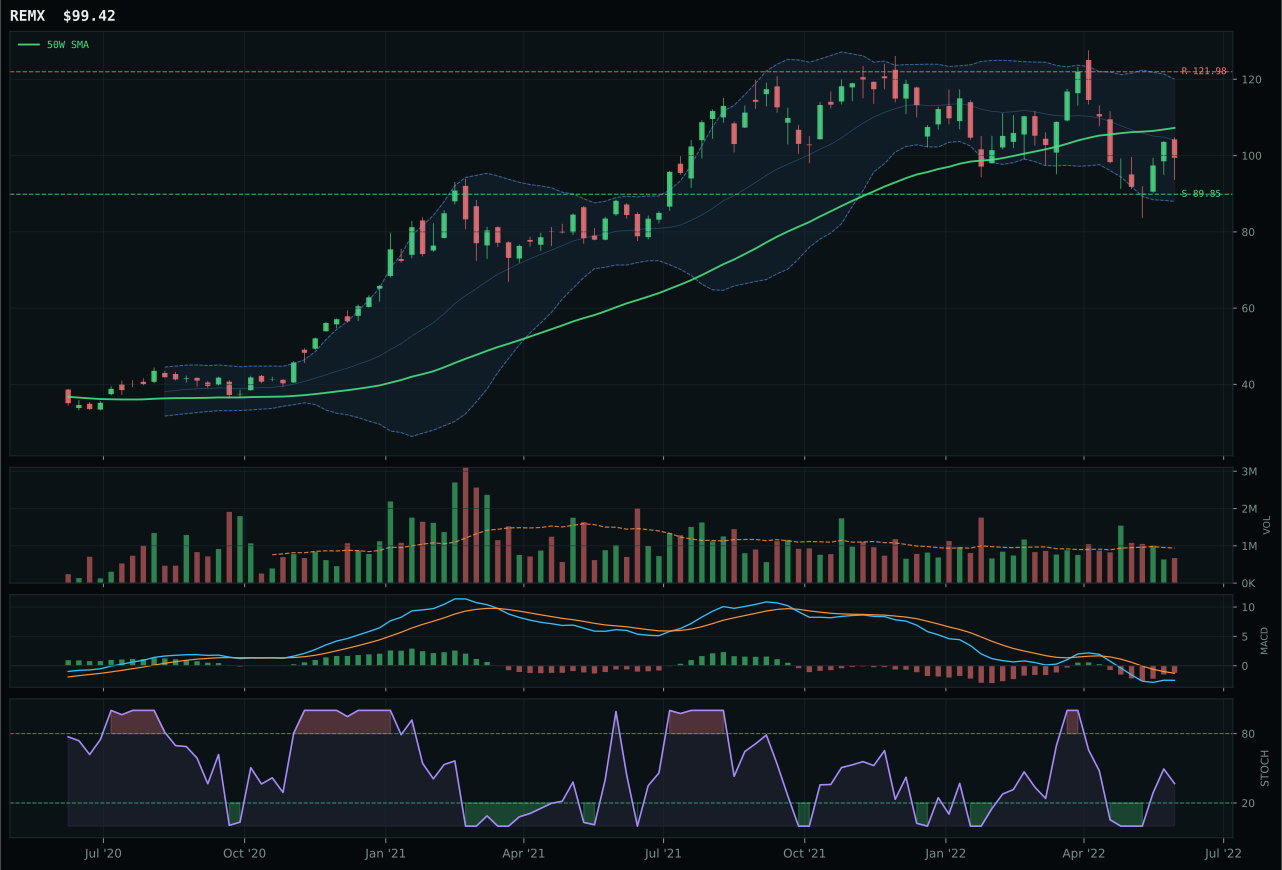
REMX has a neutral structure profile with -0.5% 13-week relative strength versus SPY.
A failed hold above support would weaken the setup.
Actionable but governed by invalidation levels.
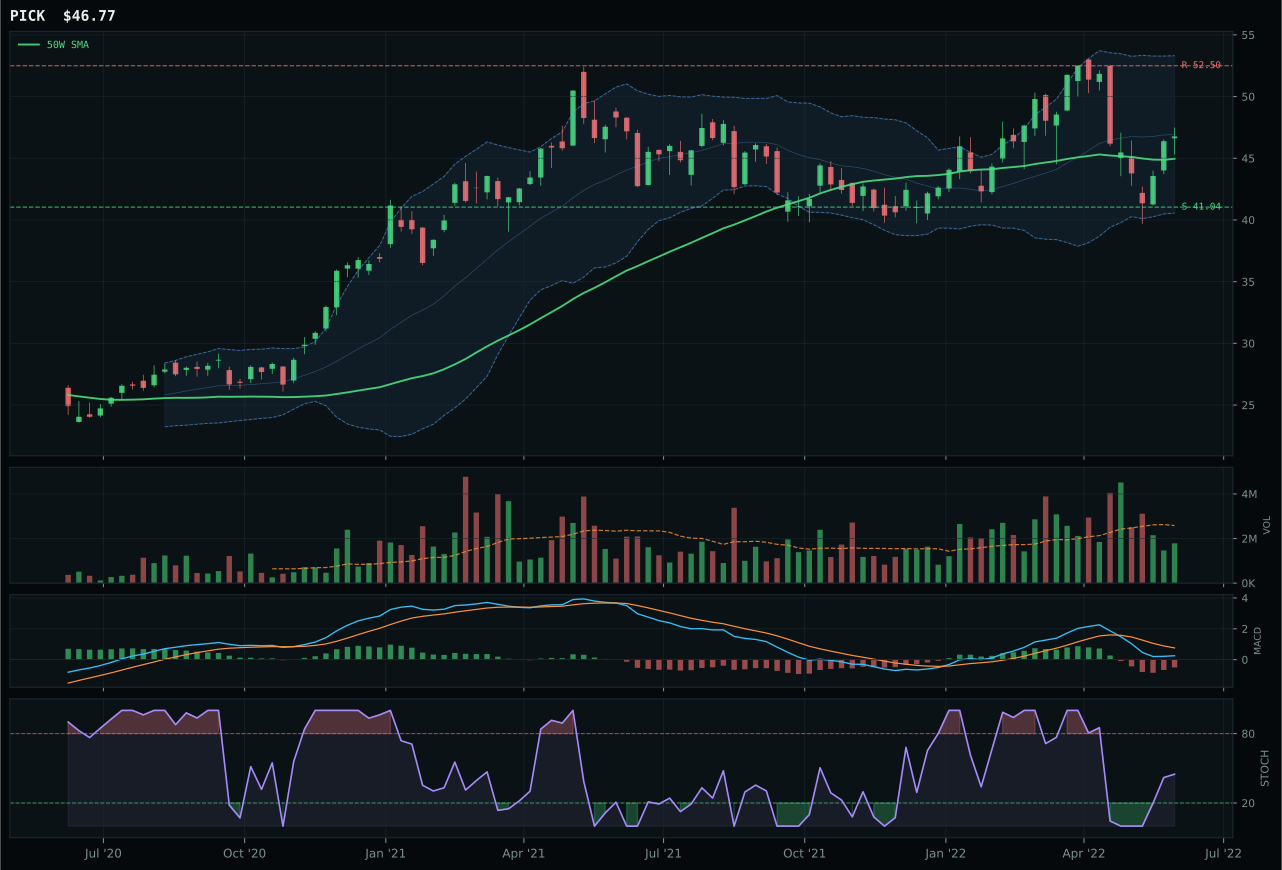
PICK has a neutral structure profile with -1.1% 13-week relative strength versus SPY.
A failed hold above support would weaken the setup.
Actionable but governed by invalidation levels.
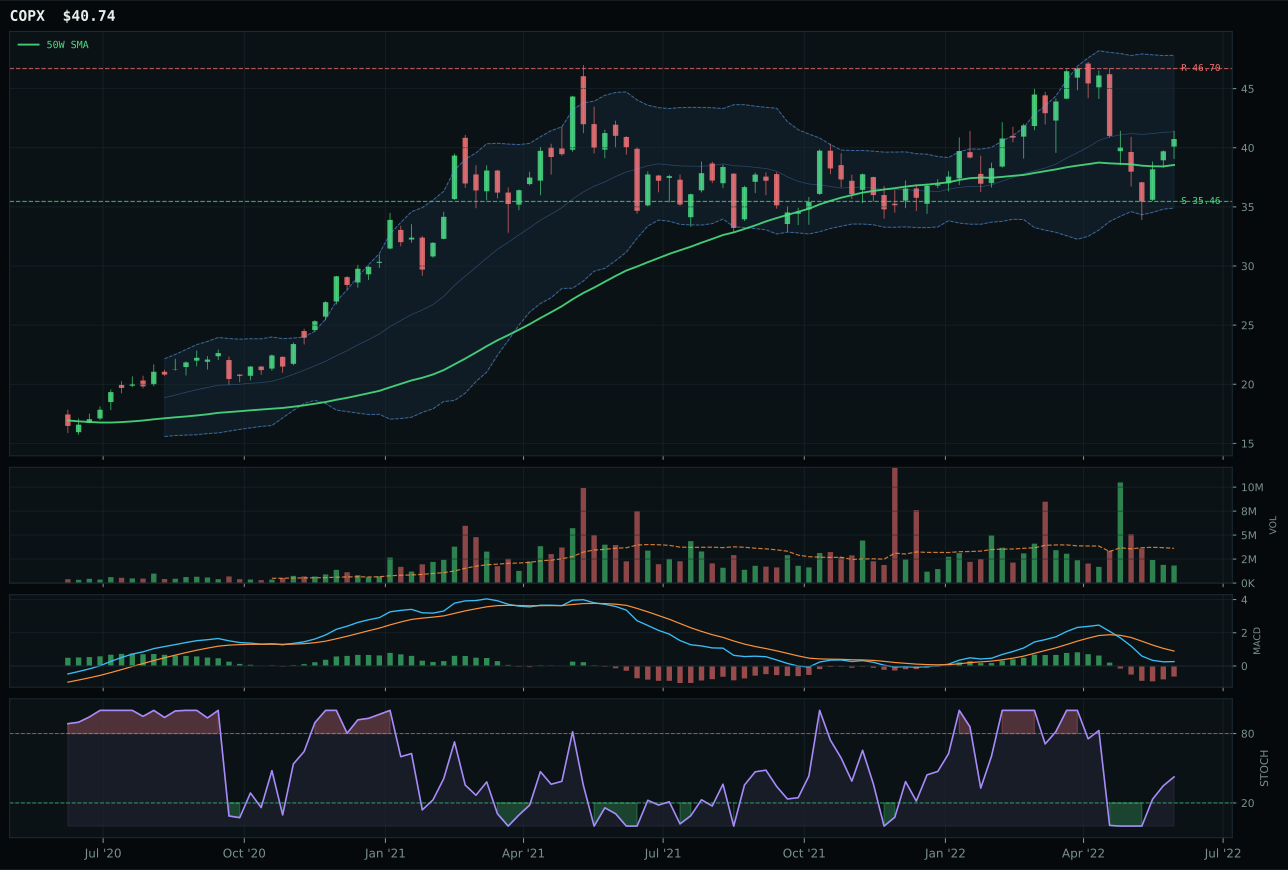
COPX has a neutral structure profile with -3.4% 13-week relative strength versus SPY.
A failed hold above support would weaken the setup.
Actionable but governed by invalidation levels.
COPX won the industrial metals decision despite not being the highest ranked in the category basket—a testament to how much the representative ETF selection depends on the macro narrative. REMX had superior trend mechanics (77 trend score) and PICK had perfect timing (100 vs COPX's 85), but COPX's 68.1 structure score and its explicit copper-scarcity thesis aligned better with the macro drivers currently active in the category. Copper sits 5.7% above the 50W in the Fibonacci 0.500 decision zone, MACD is bearish but not collapsing, and the setup has room to extend upward if supply constraints maintain their grip on pricing. The tightest element is COPX's negative category-relative strength at negative 2.4%, which reveals that on a pure technical basis, REMX and PICK are actually outperforming it—COPX won on macro fit, not on relative strength purity.
Industrial metals earned 5% because while the macro fit is excellent (75.0—tied for the highest environmental score), the representative ETF's internal technical evidence scored only 31.1, which is the second-lowest in the allocation table. The category itself benefits from metals scarcity active, commodity breadth positive, and real asset sponsorship, but COPX is primarily a copper trade, and copper's macro tailwind is real but not as durable as energy's supply crisis or agriculture's structural shortage. The category would deserve 10% if REMX or PICK were the representative (both have superior trend evidence), but COPX's slight technical weakness relative to peers keeps allocation conservative. This is a swing-candidate category: if energy demand remains resilient and supply-chain tightness persists, COPX could move to 10% within four weeks.
Utilities & Infrastructure — IGF
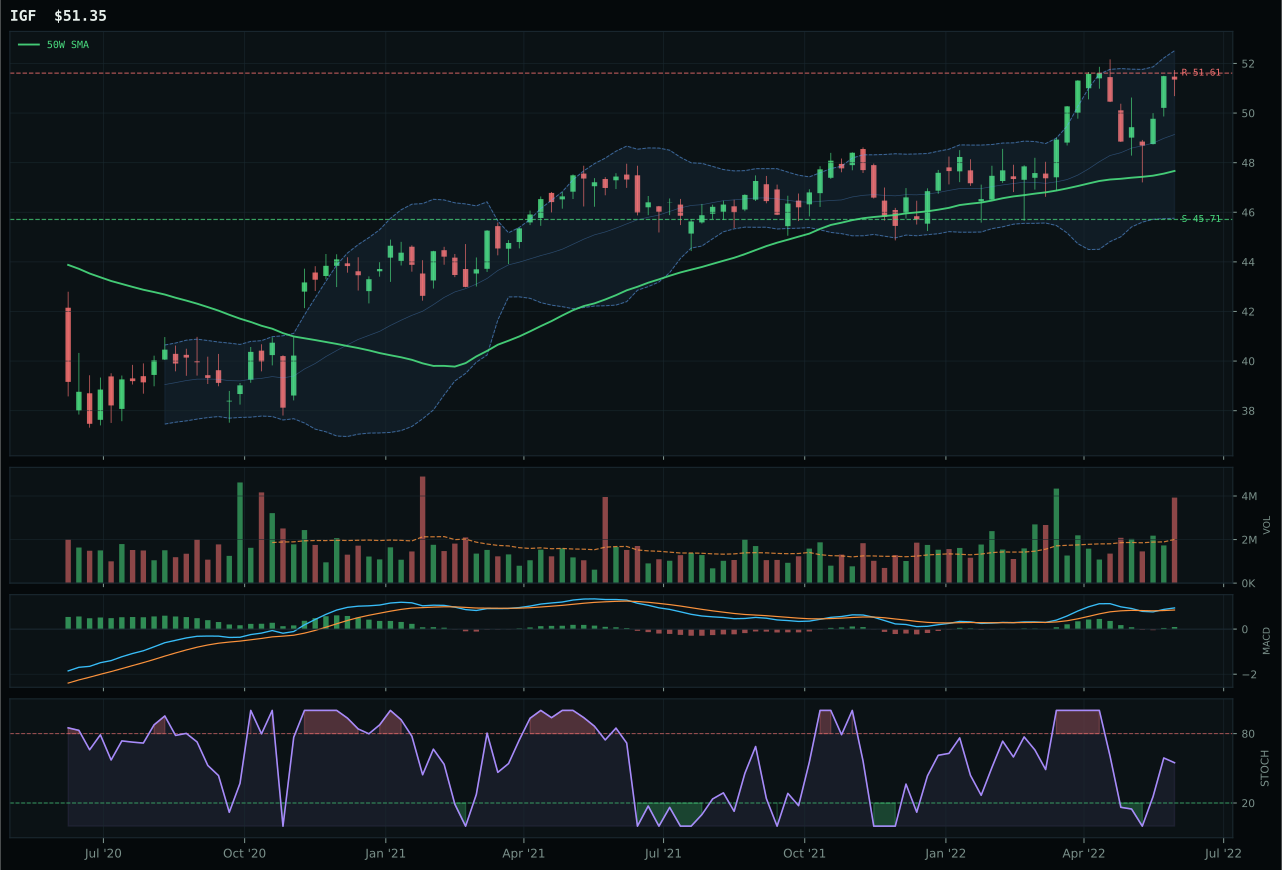
IGF has a neutral structure profile with 12.9% 13-week relative strength versus SPY.
A failed hold above support would weaken the setup.
Actionable but governed by invalidation levels.
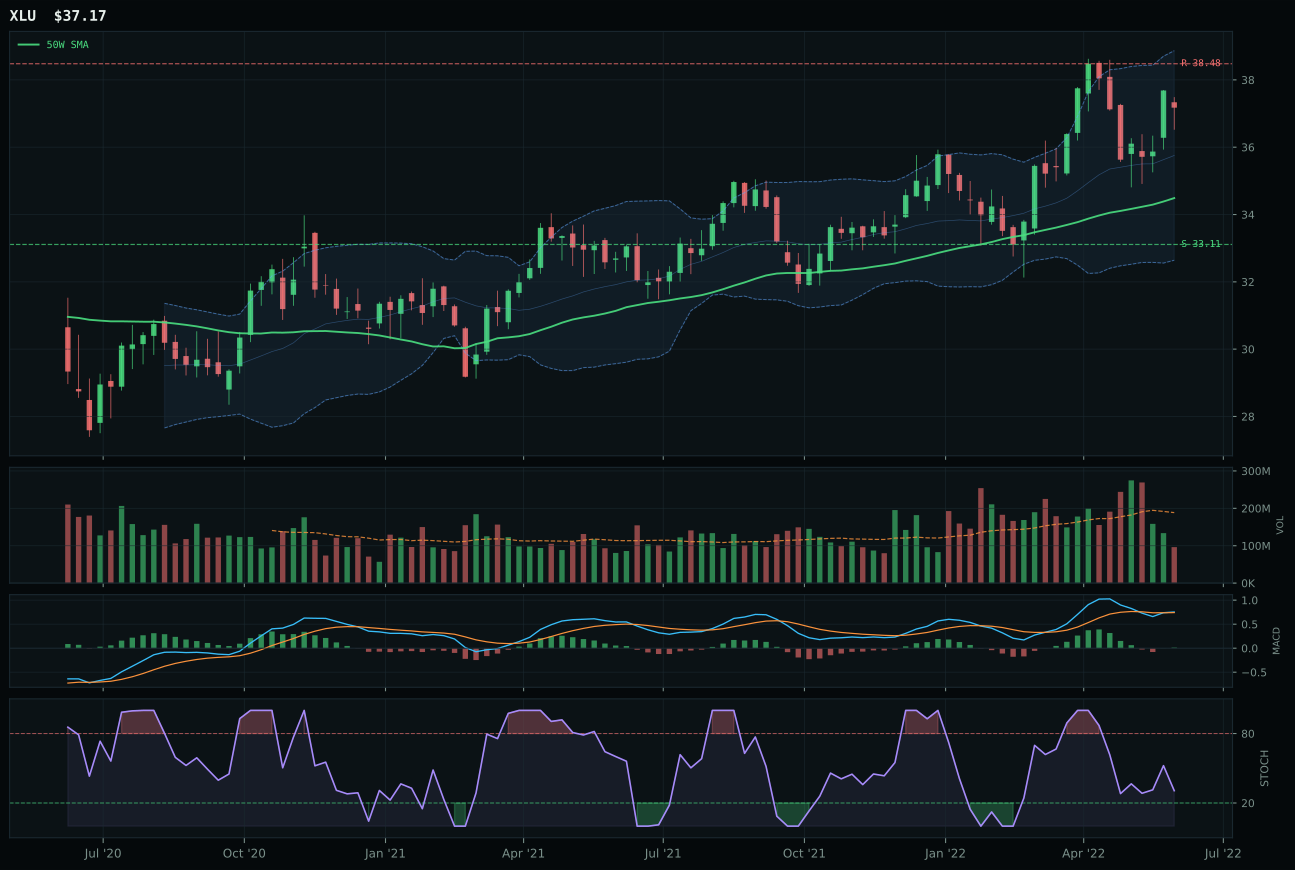
XLU has a neutral structure profile with 9.9% 13-week relative strength versus SPY.
A failed hold above support would weaken the setup.
Actionable but governed by invalidation levels.
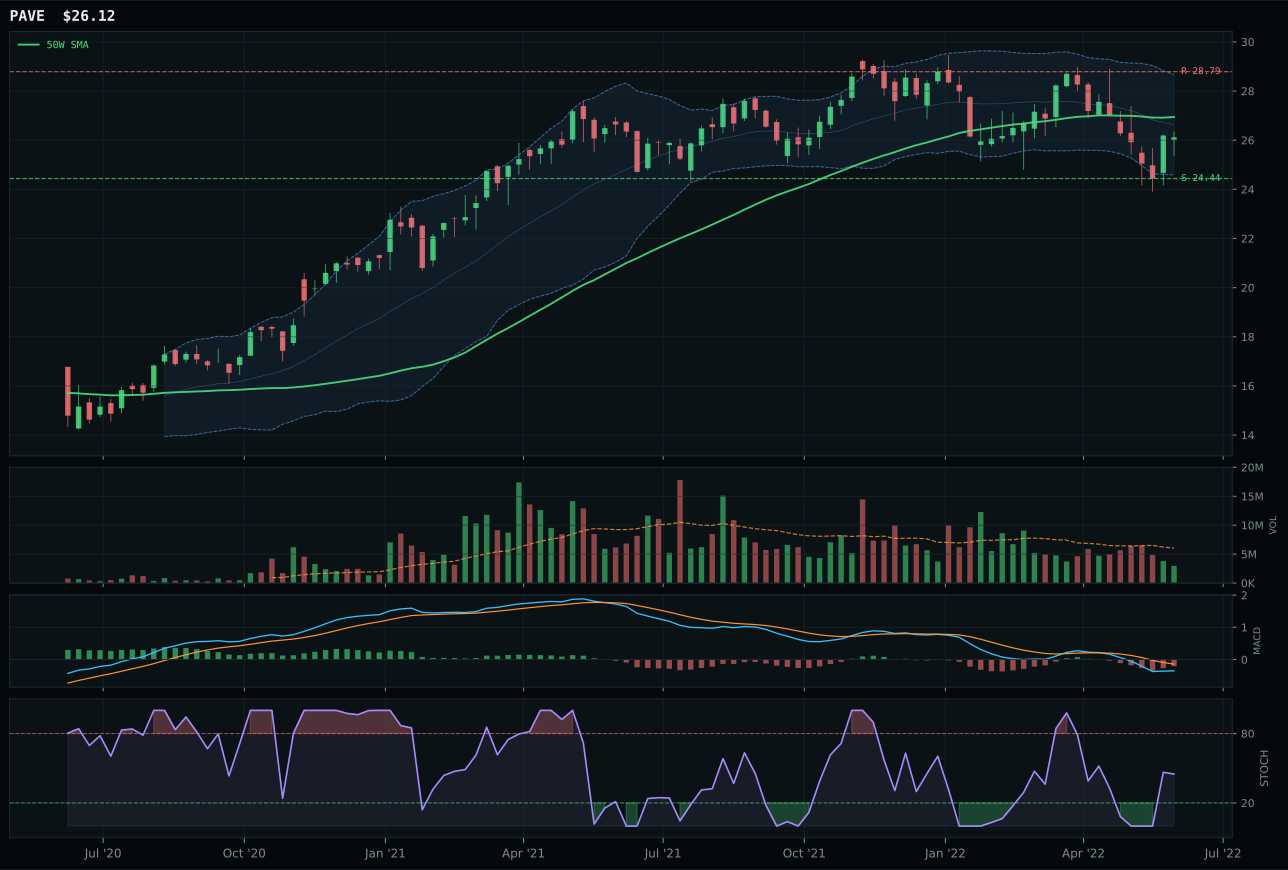
PAVE has a neutral structure profile with 1.2% 13-week relative strength versus SPY.
A failed hold above support would weaken the setup.
Actionable but governed by invalidation levels.
IGF defeated XLU for the utilities crown through two decisive technical advantages: timing score of 83.0 versus XLU's 78.0, and MACD condition that is bullish and improving versus XLU's bullish but flattening. Both chart setups are strong—price above 50W, RS positive, stochastic rising from mid-zone—but IGF occupies the upper retracement/momentum zone (Fib 0.236) while XLU sits in the same Fibonacci level with flatter 50W slope, giving IGF more upside room before exhaustion. Category-relative strength of positive 3.0% versus XLU's 0.0% reveals IGF is gaining tactical fund flow, and volume at 1.96x average (distribution pressure) indicates active institutional buying, not passive indexing. Structure is neutral across both, but IGF's cleanliness score of 66.7 versus XLU's 72.5 is a small gap relative to the 5-point timing edge and the cleaner MACD confirmation.
Utilities & infrastructure earned only 5% despite IGF's solid setup because its macro fit of 47.0 is the weakest among all allocated categories except emerging markets, and it cannot overcome the defensive-rotation tailwind that is actually helping the category. IGF is an infrastructure income play that benefits from defensive rotation, but it does not benefit from inflation pressure (negative 4 points) or from the energy/commodity tailwinds driving the top-2 categories. The category's 52.0 score ranks seventh among ten, above only Emerging Markets, Nuclear, AI, and Technology—all of which have stronger macro headwinds. IGF would earn 10% if either broad-market volatility forced capital into defensive yielding assets, or if inflation pressure moderated enough to reduce the rate-risk premium in utilities. Until then, the 5% slot reflects a position that is technically sound but strategically mismatched to current regime priorities.
Nuclear Energy — URA
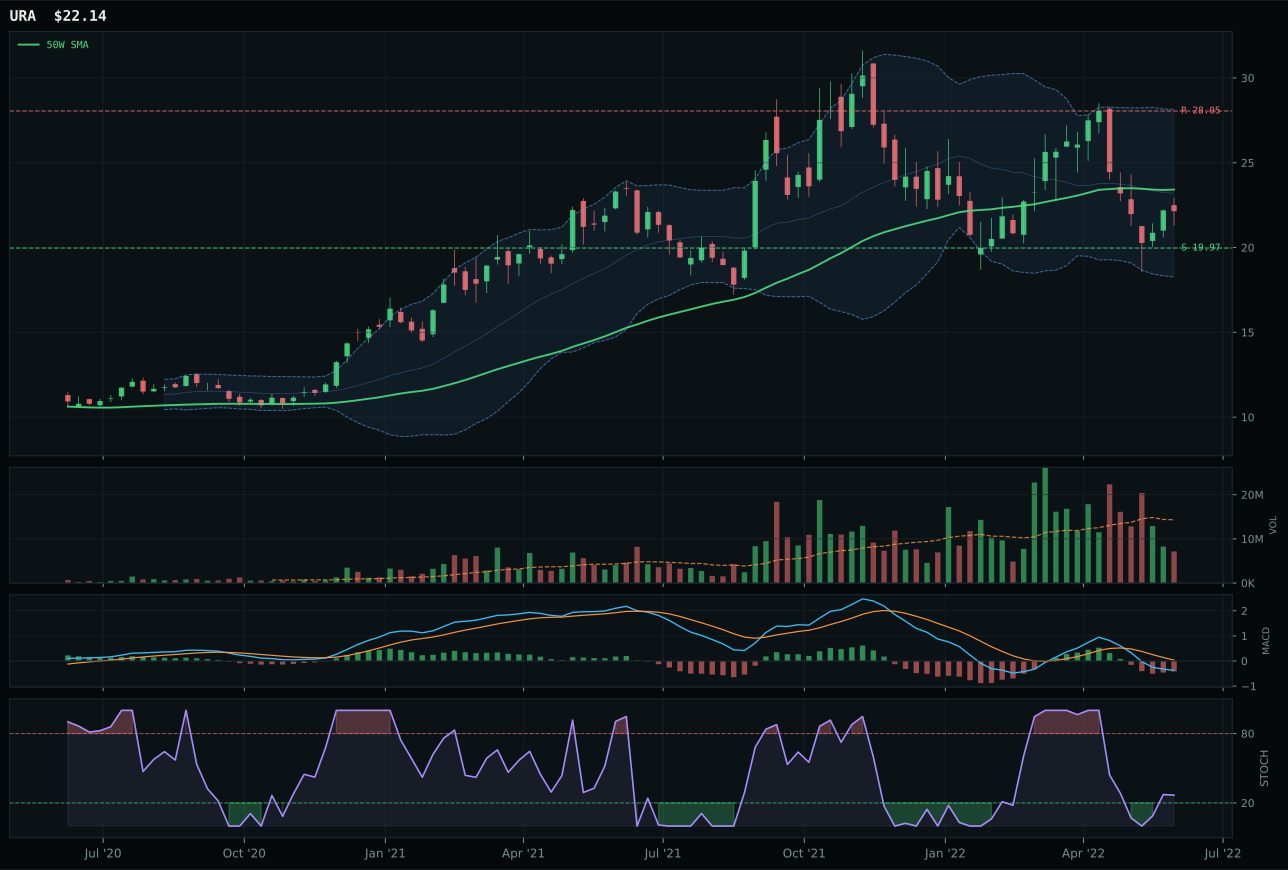
URA has a neutral structure profile with 0.1% 13-week relative strength versus SPY.
A failed hold above support would weaken the setup.
Actionable but governed by invalidation levels.
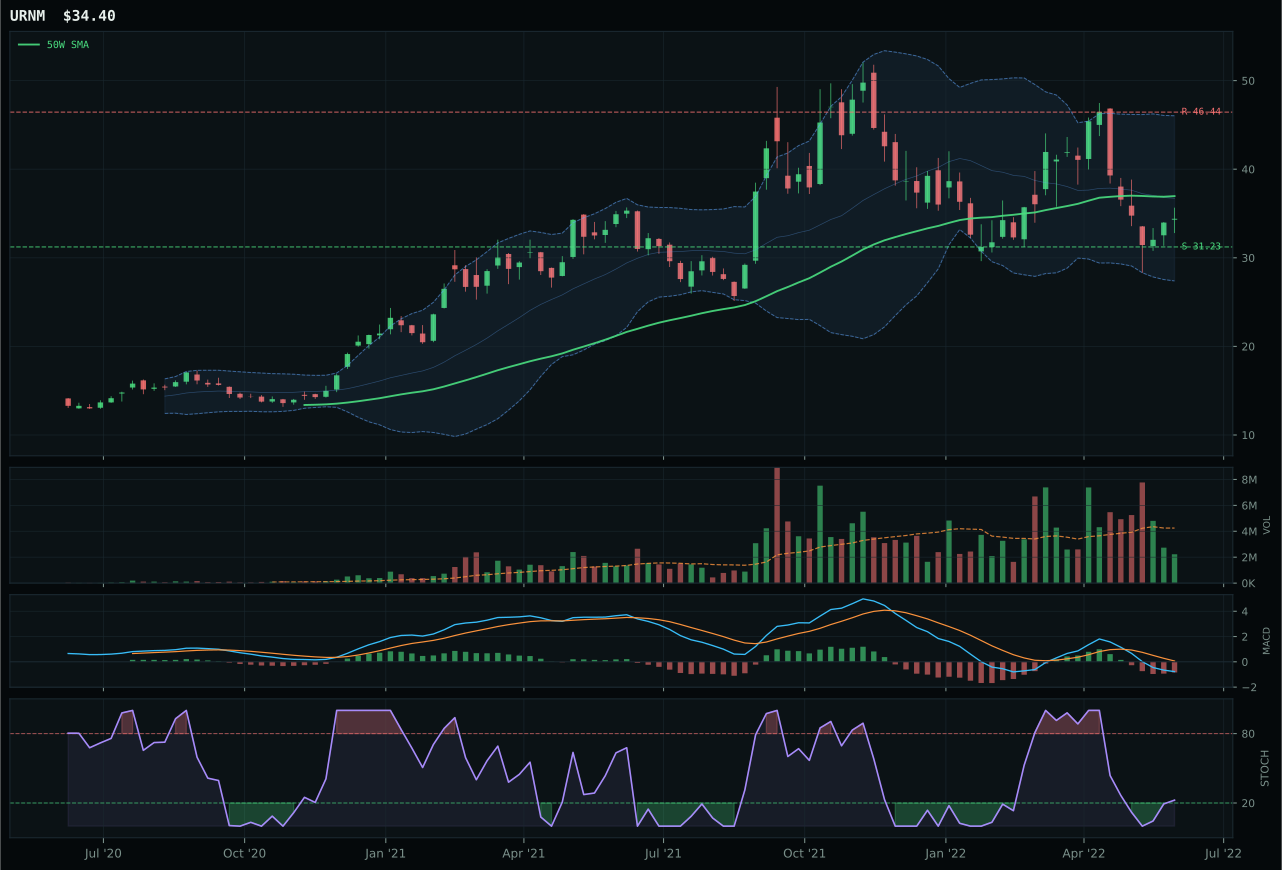
URNM has a neutral structure profile with 0.5% 13-week relative strength versus SPY.
A failed hold above support would weaken the setup.
Actionable but governed by invalidation levels.
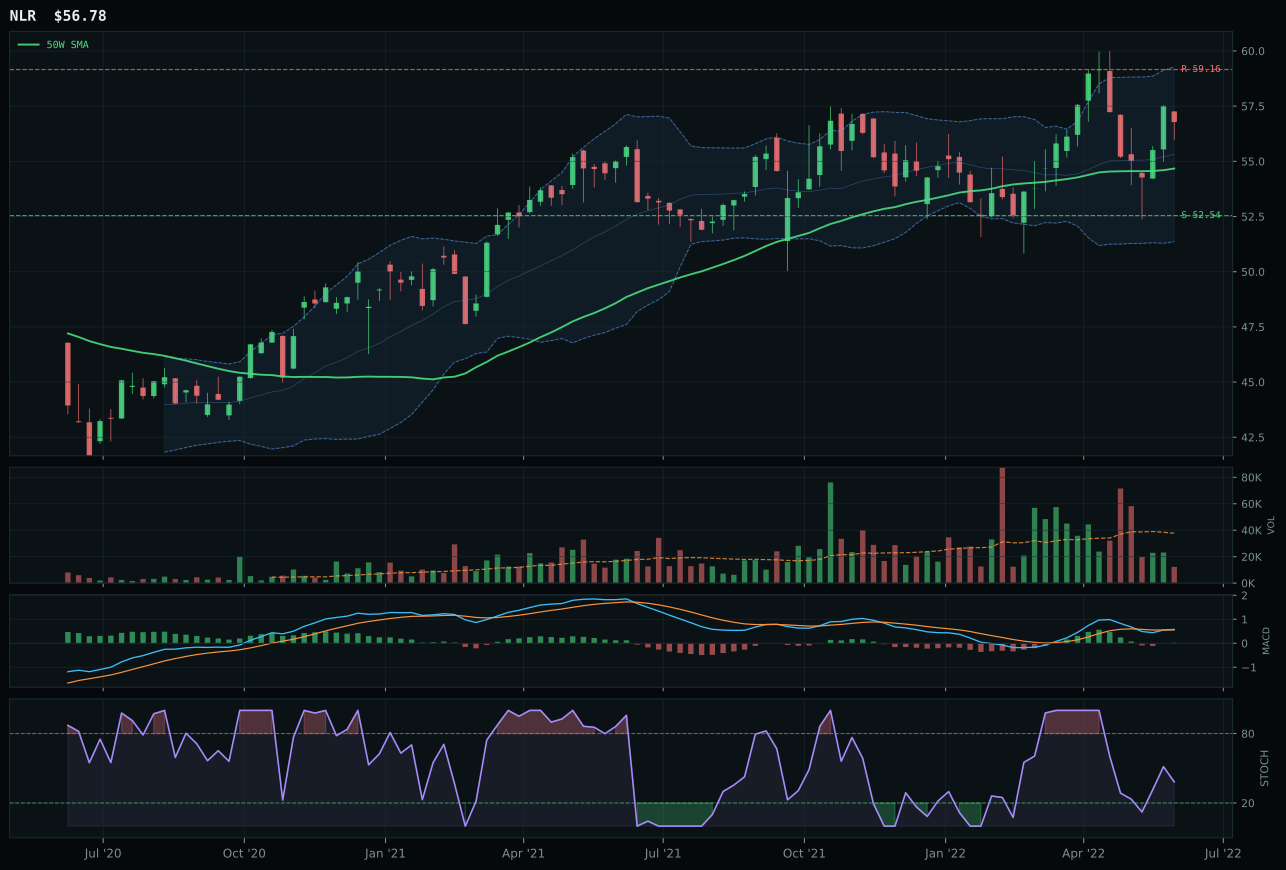
NLR has a neutral structure profile with 10.6% 13-week relative strength versus SPY.
A failed hold above support would weaken the setup.
Tracked, but not top-2 eligible because: .
URA won the nuclear category by holding the technical middle ground between NLR's explosive momentum and URNM's cautious timing. Price sits 5.5% below the 50W in the Fibonacci 0.618 deep-value zone, MACD is bearish/weakening, and stochastic RSI is rising mid-zone at 0.27—this is early-stage reversal mechanics, not yet confirmed but positioned for upside if buyers defend support. The 85.0 timing score reflects a setup where distance-to-50W, Fibonacci level, and stochastic all point to early-reversal probability without overbought extremes. NLR's 100.0 trend score and 96.0 momentum score are legitimate, but they come with the cost of being extended (upside to resistance only 0.0%), which makes NLR a "fade the strength" position that requires precise exit discipline. URA offers a cleaner risk/reward profile with less extended positioning, which wins in a thin-liquidity environment where slippage and whipsaws punish aggressive entry timing.
Nuclear energy earned only 5% despite URA's reasonable setup because the category macro fit of 65.0 is respectable but subordinate to the dominant narratives powering energy, agriculture, and industrial metals. Energy scarcity is active and real asset sponsorship is present, but uranium's thesis relies on longer-duration assumptions about power generation and energy transition that cannot compete with the immediate supply-shortage tailwinds in crude oil and agricultural commodities. URA's technical evidence score of 11.4 is the lowest in the representative ETF universe, a reflection of weak trend and momentum confirmation that pushes the category down the allocation ladder. For nuclear to move to 10%, we would need either a price shock in crude oil that makes uranium cost-competitive for power generation, or explicit government policy mandates that drive immediate demand—neither is signaling in current market behavior.
Defense & Aerospace — ITA
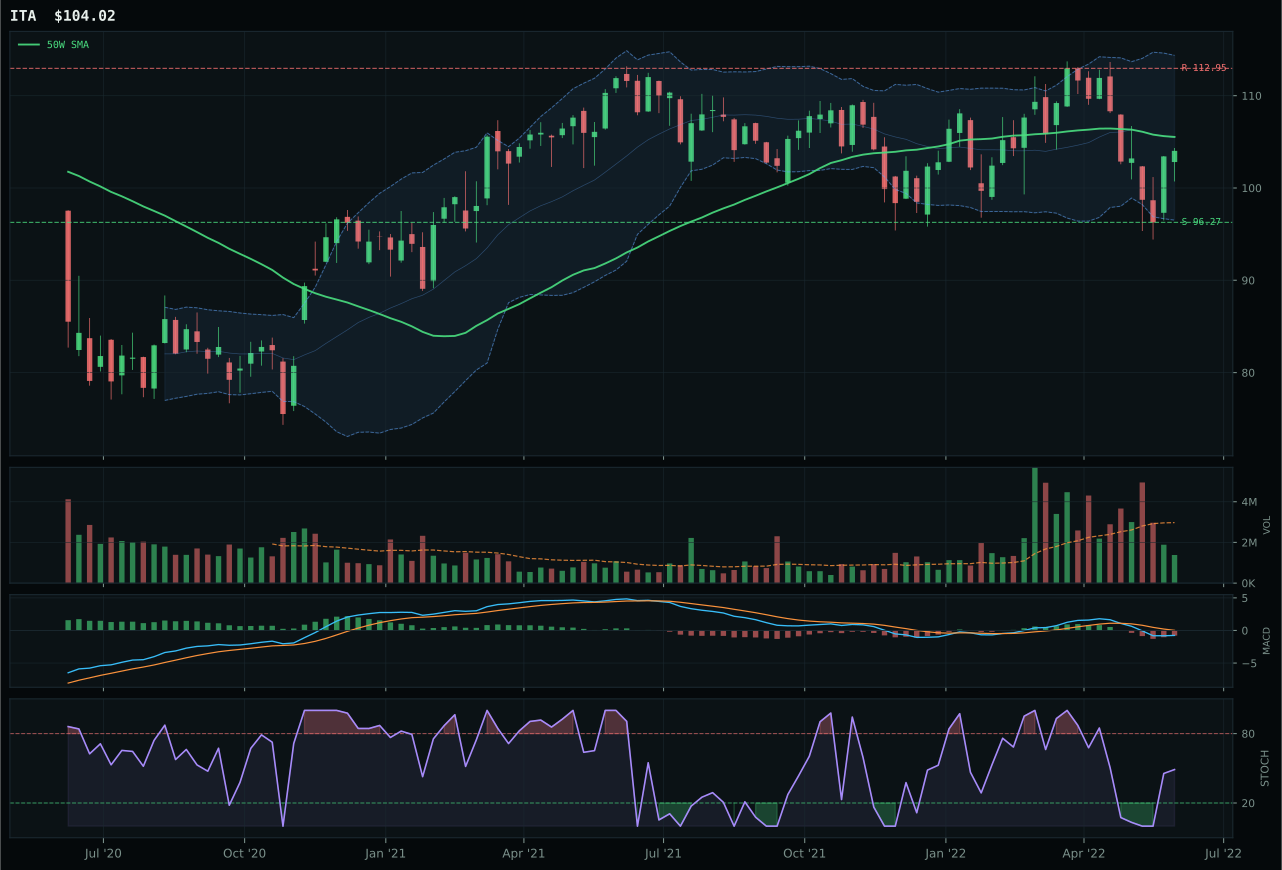
ITA has a compression near 50W profile with 0.1% 13-week relative strength versus SPY.
A failed hold above support would weaken the setup.
Actionable but governed by invalidation levels.
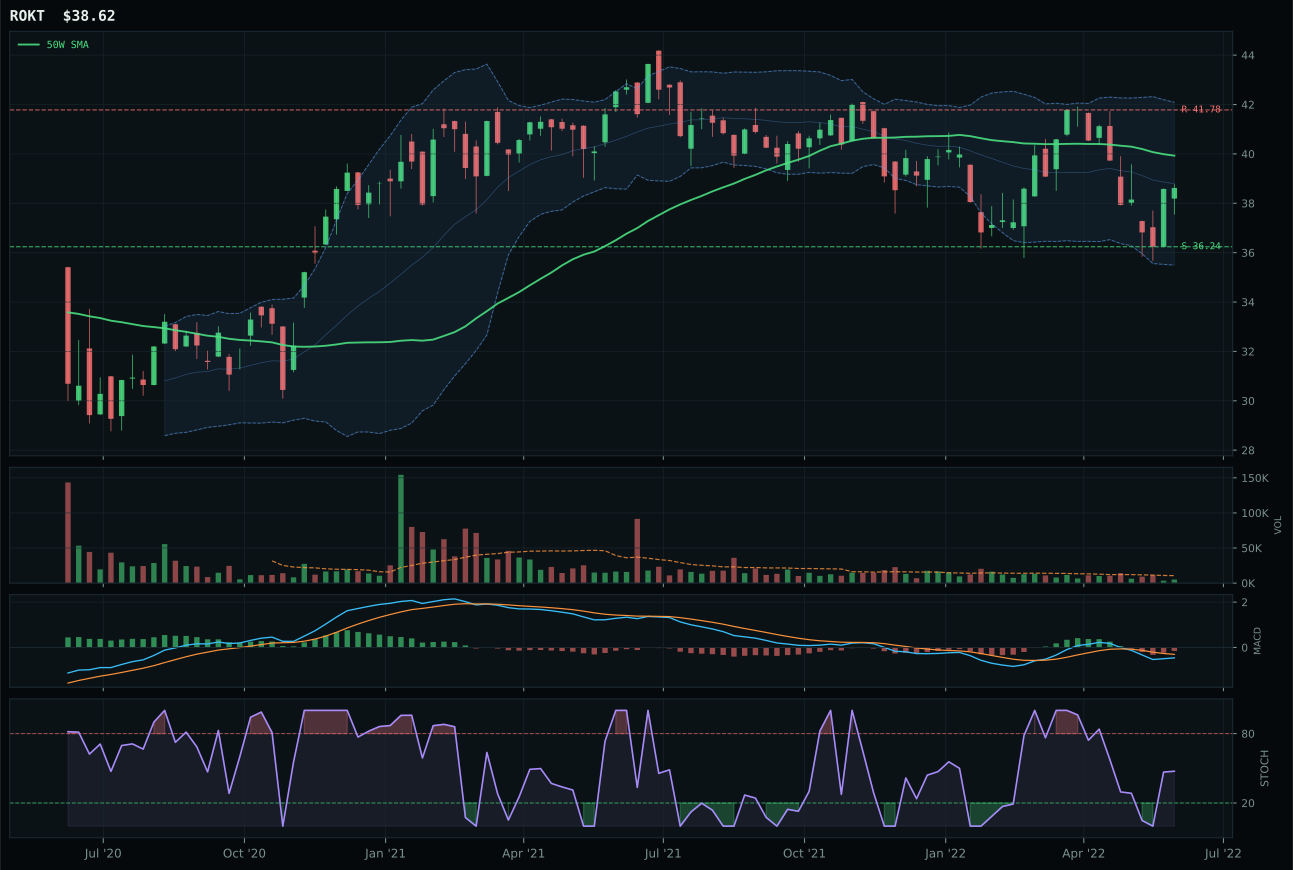
ROKT has a neutral structure profile with 1.7% 13-week relative strength versus SPY.
A failed hold above support would weaken the setup.
Tracked, but not top-2 eligible because: .
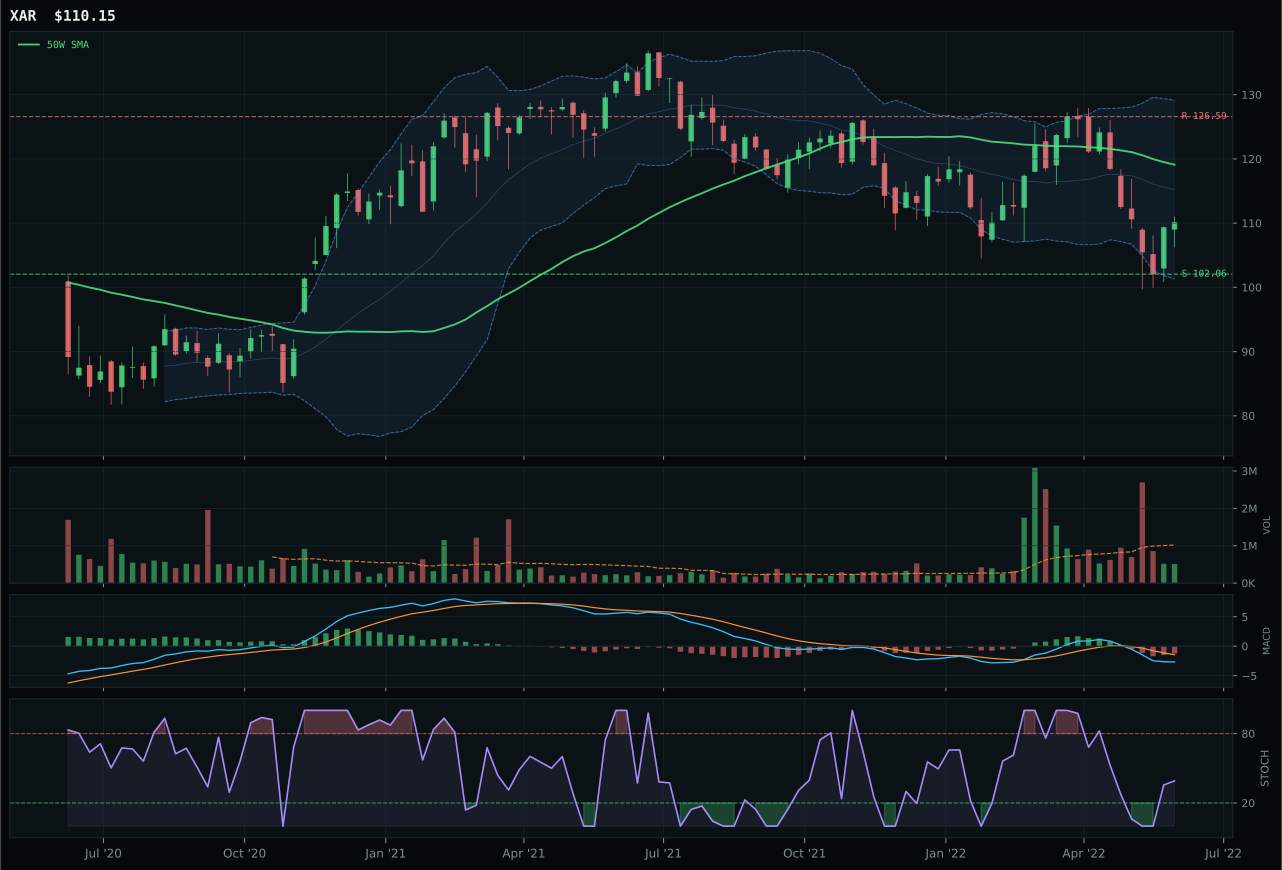
XAR has a neutral structure profile with -4.8% 13-week relative strength versus SPY.
A failed hold above support would weaken the setup.
Actionable but governed by invalidation levels.
ITA owns this category on the back of a perfect timing score (100.0)—a legitimate perfect mark reserved for setups where the Fibonacci level, MACD, stochastic, and distance-to-50W all align without contradiction. The chart sits in the Fib 0.500 middle-decision zone, just 1.4% below the 50W, which means any bounce has immediate resistance overhead to prove itself real. Structure is compressing (75.2 compression score), which prepares the chart for expansion in either direction, but the bias is constructive because 50W slope is flat, not negative. ROKT lost the decision not on relative strength or setup shape, but on a weaker timing score of 93.0—ROKT sits too deep in the repair zone (Fib 0.618) where additional downside is still possible even if unlikely. ITA's compression near the 50W gives it a defined invalidation point, which is worth 7 points in a risk-managed framework.
Defense & Aerospace earned 5% despite a respectable 36.2 score because the category macro fit (70.0) is elevated but not elevated enough to break the top two. Defensive rotation is genuinely active and broad-market bear conditions favor quality, but these tailwinds are insufficient against the raw technical dominance of energy (97.0 macro fit) and agriculture (90.0 macro fit). ITA has the mechanical setup for a reversal bounce, but the bounce would be tactical within a longer-term bear, not the beginning of a new uptrend. Reallocation to 10% or 20% would require either a cessation of broad-market selling pressure or a specific catalyst in the defense supply chain that would drive independent relative strength—neither is present in current conditions.
Precious Metals — GLD
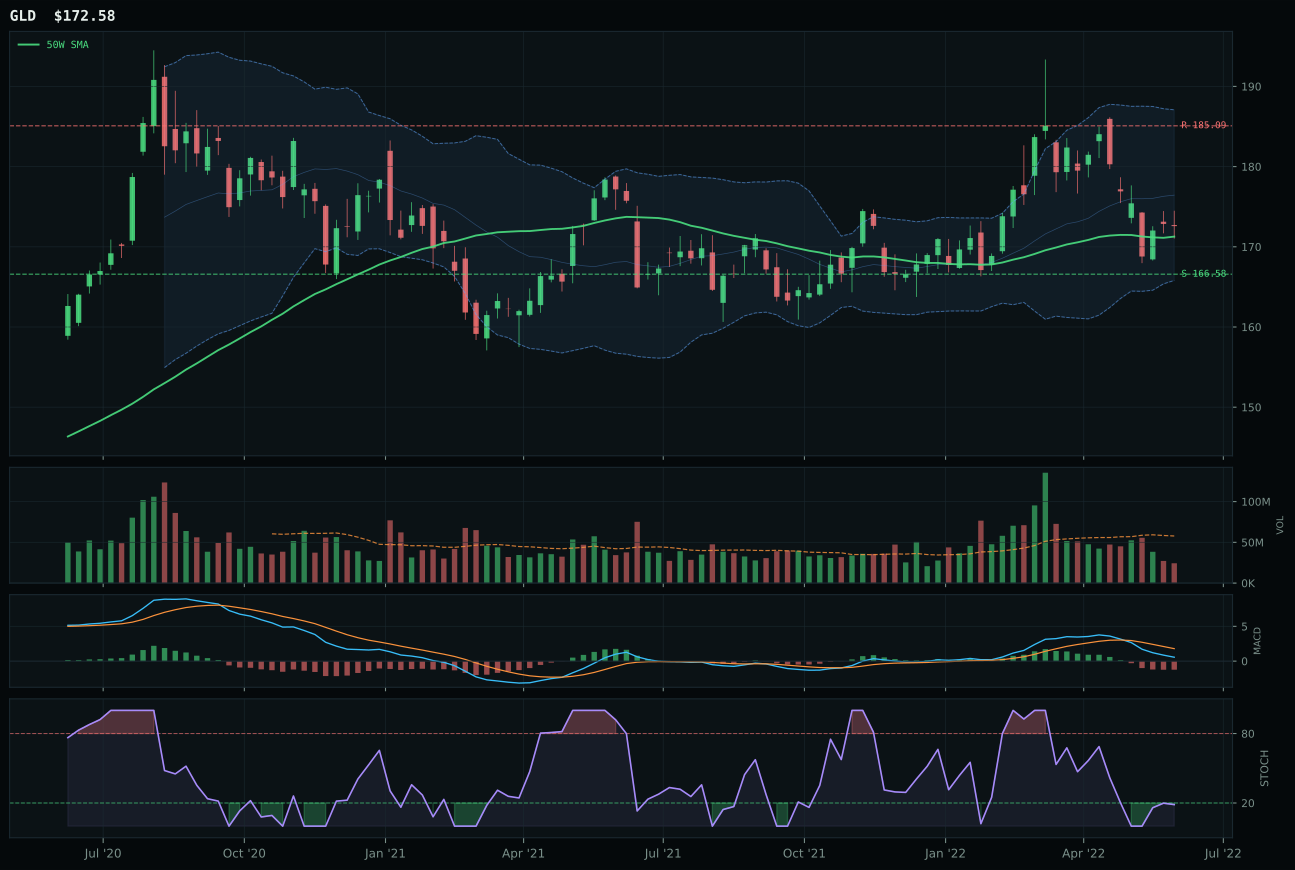
GLD has a pullback into support profile with -1.0% 13-week relative strength versus SPY.
A failed hold above support would weaken the setup.
Actionable but governed by invalidation levels.
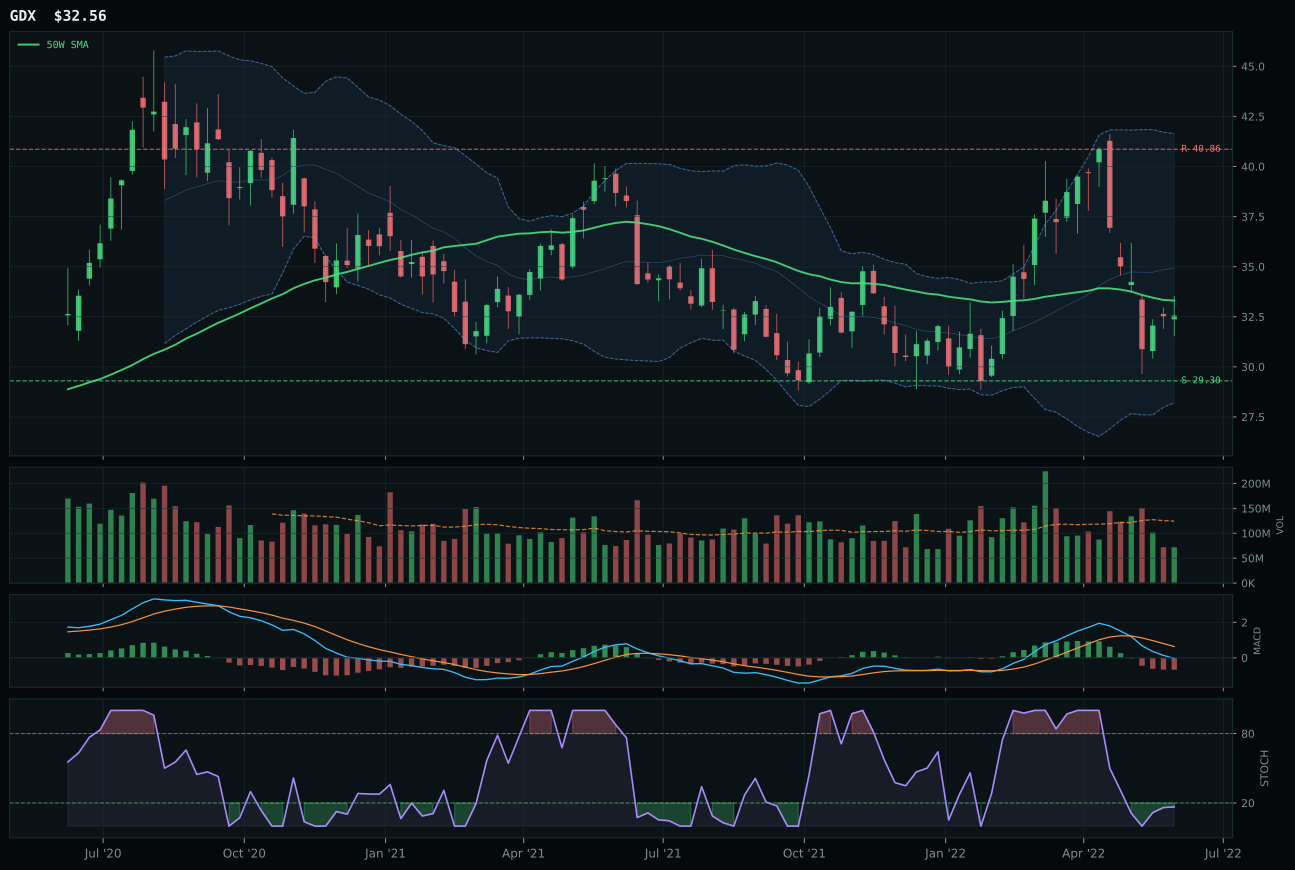
GDX has a compression near 50W profile with -7.9% 13-week relative strength versus SPY.
A failed hold above support would weaken the setup.
Actionable but governed by invalidation levels.
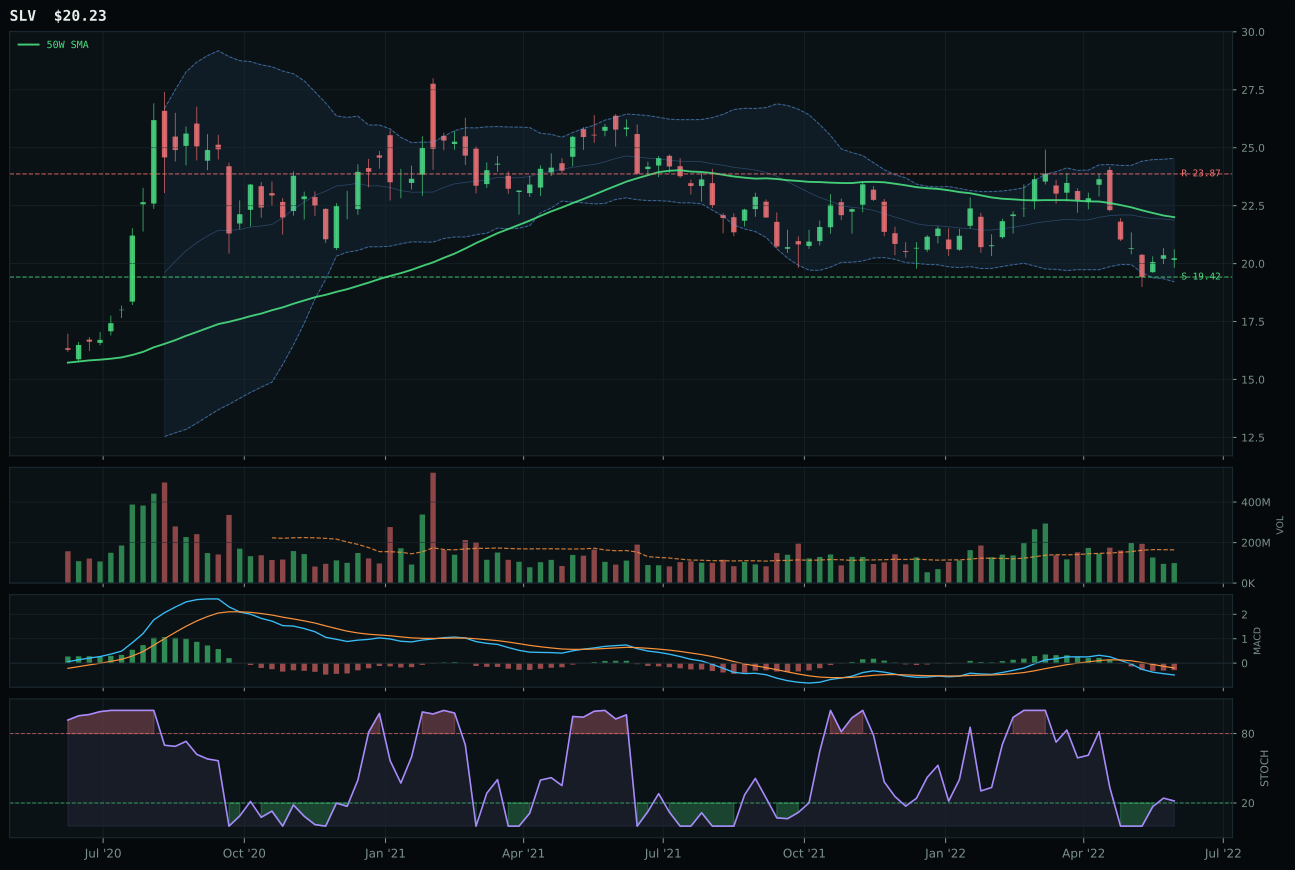
SLV has a pullback into support profile with -9.4% 13-week relative strength versus SPY.
A failed hold above support would weaken the setup.
Actionable but governed by invalidation levels.
GLD clinched this category on a perfect timing score (100.0) achieved through an ideal convergence of technical references: price sits 0.8% above the 50W (barely clipped), stochastic RSI is oversold turning up from 0.19, MACD is bearish but stabilizing, and the chart occupies the Fibonacci 0.618 deep-value zone where mean reversion is statistically highest-probability. The pullback into support near 166.58 gives the setup a defined invalidation area, which is worth points in any risk-adjusted framework. GDX lost decisively on risk/reward (62.9 vs GLD's 86.8)—miners are leveraged instruments sitting in deeper repair zones where additional capitulation is still possible, while GLD itself is the monetary hedge that has already absorbed the near-term fear premium. Category-relative strength tells the full story: GLD at positive 6.9% versus GDX at 0.0% reveals institutional preference for the pure commodity vehicle over the leveraged equity expression.
Precious metals earned only 5% despite GLD's sound reversal setup because the macro regime is not yet permission for a full flight-to-safety rally. Defensive rotation is active and dollar pressure is present, but neither is strong enough to override the inflation-driven commodity breadth that is channeling capital into agriculture and energy instead. The category's 32.3 score reflects a 60.0 macro fit that is respectable but not dominant—risk appetite isn't fully broken, so gold is a hedge not a conviction. GLD would graduate to 10% if either broad-market capitulation accelerated (forcing true flight-to-safety) or if the US dollar showed sustained weakness that would unlock carry trades. Until then, 5% is appropriate scale for a position that is tactically sound but strategically early.
Technology — IGV
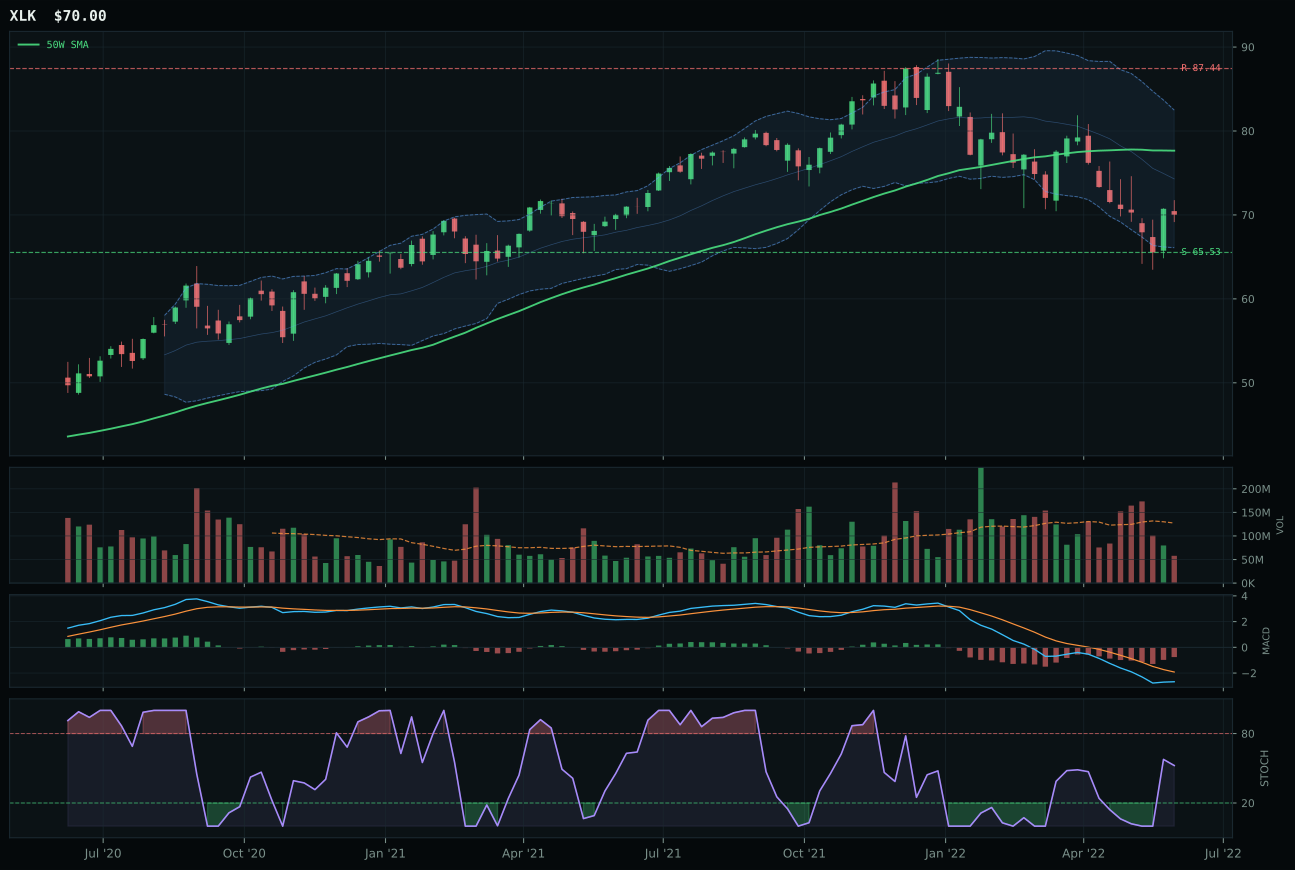
XLK has a neutral structure profile with -1.5% 13-week relative strength versus SPY.
A failed hold above support would weaken the setup.
Actionable but governed by invalidation levels.
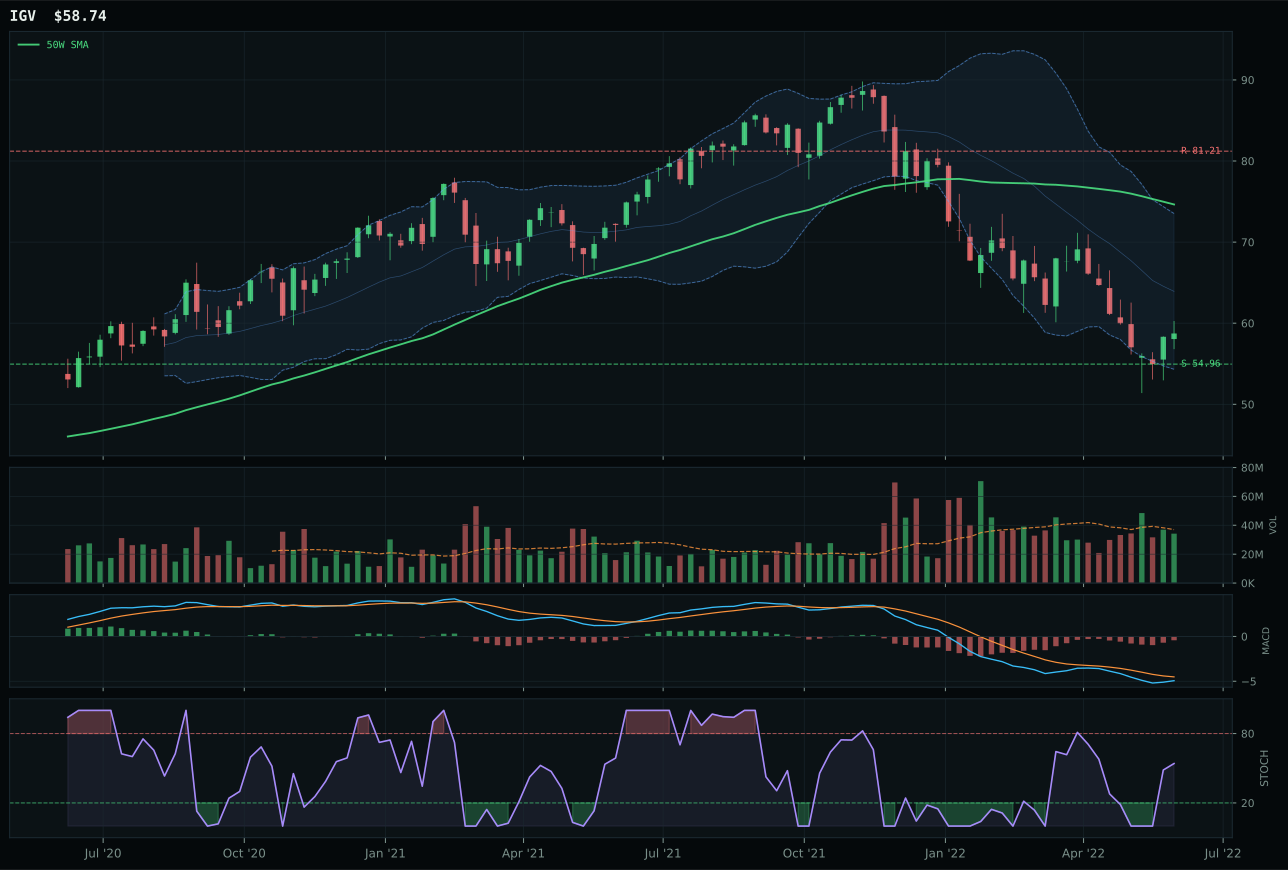
IGV has a neutral structure profile with -5.6% 13-week relative strength versus SPY.
A failed hold above support would weaken the setup.
Actionable but governed by invalidation levels.
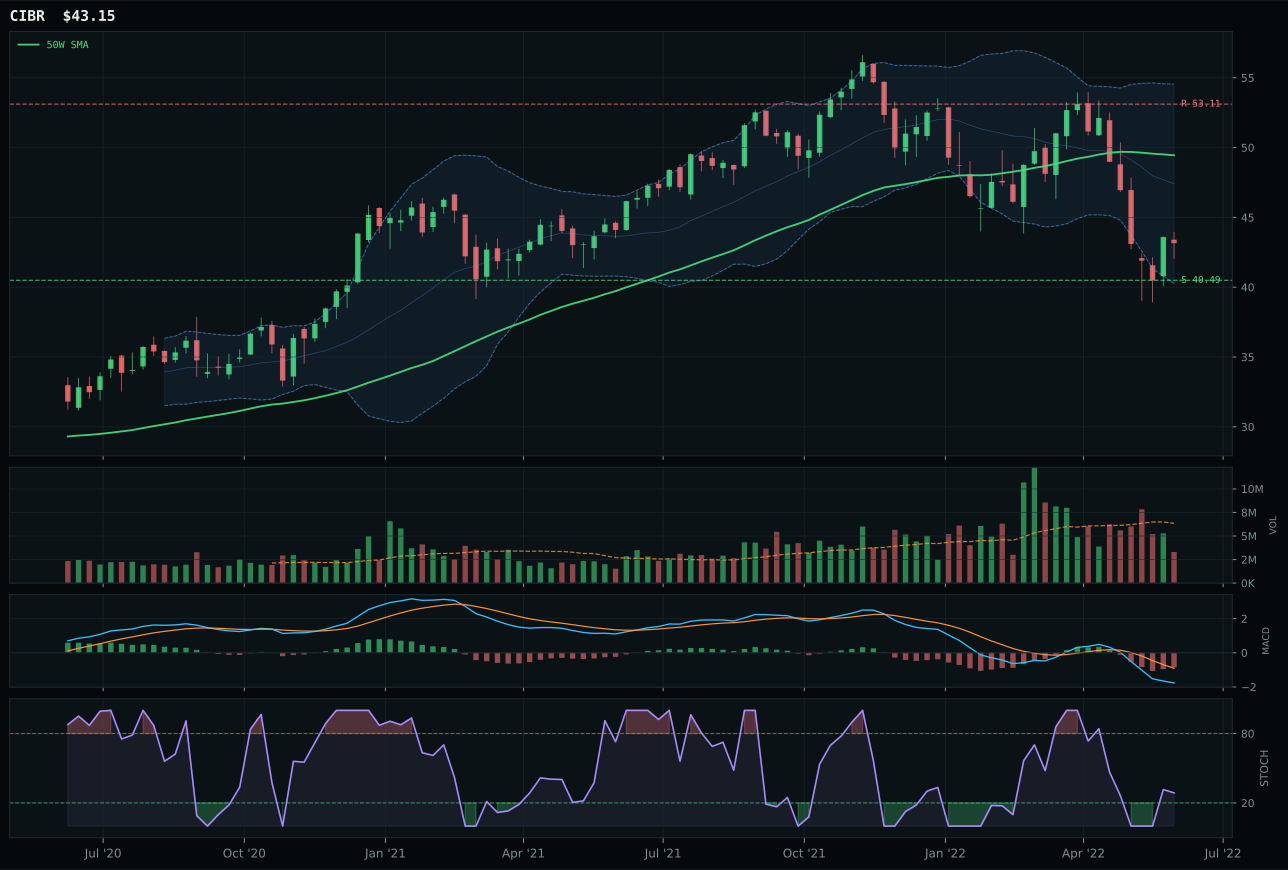
CIBR has a neutral structure profile with -8.2% 13-week relative strength versus SPY.
A failed hold above support would weaken the setup.
Actionable but governed by invalidation levels.
IGV captured the category by sitting in genuine reset territory—below the 50W but safely above the 200W—where the technical setup demands proof rather than promise. The 21.3% pullback from the 50W combined with neutral volume at 0.92x average creates the kind of coil that rewards patient entry, not desperate buyers. MACD is bearish but stabilizing and stochastic RSI is rising from mid-zone, signaling early reversal mechanics without yet breaking into confirmation territory. Category-relative strength of 0.0% versus the median reveals IGV is neither lagging nor leading its peers, but its cleaner structure (62.5 vs XLK's 62.0) and flatter 50W slope (-0.5% vs XLK's more negative trajectory) gave it the edge. XLK failed to clear the decisive hurdle: it trades closer to the 50W at only 9.9% drawdown, meaning every new long entry is arriving into a less-worn support level, which carries higher false-break risk.
Technology earned only 5% allocation despite its neutral technical posture because the macro regime is actively hostile to duration-sensitive growth. Liquidity stress and dollar pressure combined subtract 14 points from the category's macro score, and the current reflation narrative privileges real assets and energy over software and silicon. The category's 26.2 final score ranks it outside the top tier not because of execution failure but because the market's fund flows are punishing any exposure that requires multiple-expansion into a tightening-cycle environment. This is tactical underweight, not structural disbelief—if liquidity conditions ease or dollar pressure reverses, IGV's reset setup would immediately become a legitimate accumulation candidate.
AI — SMH
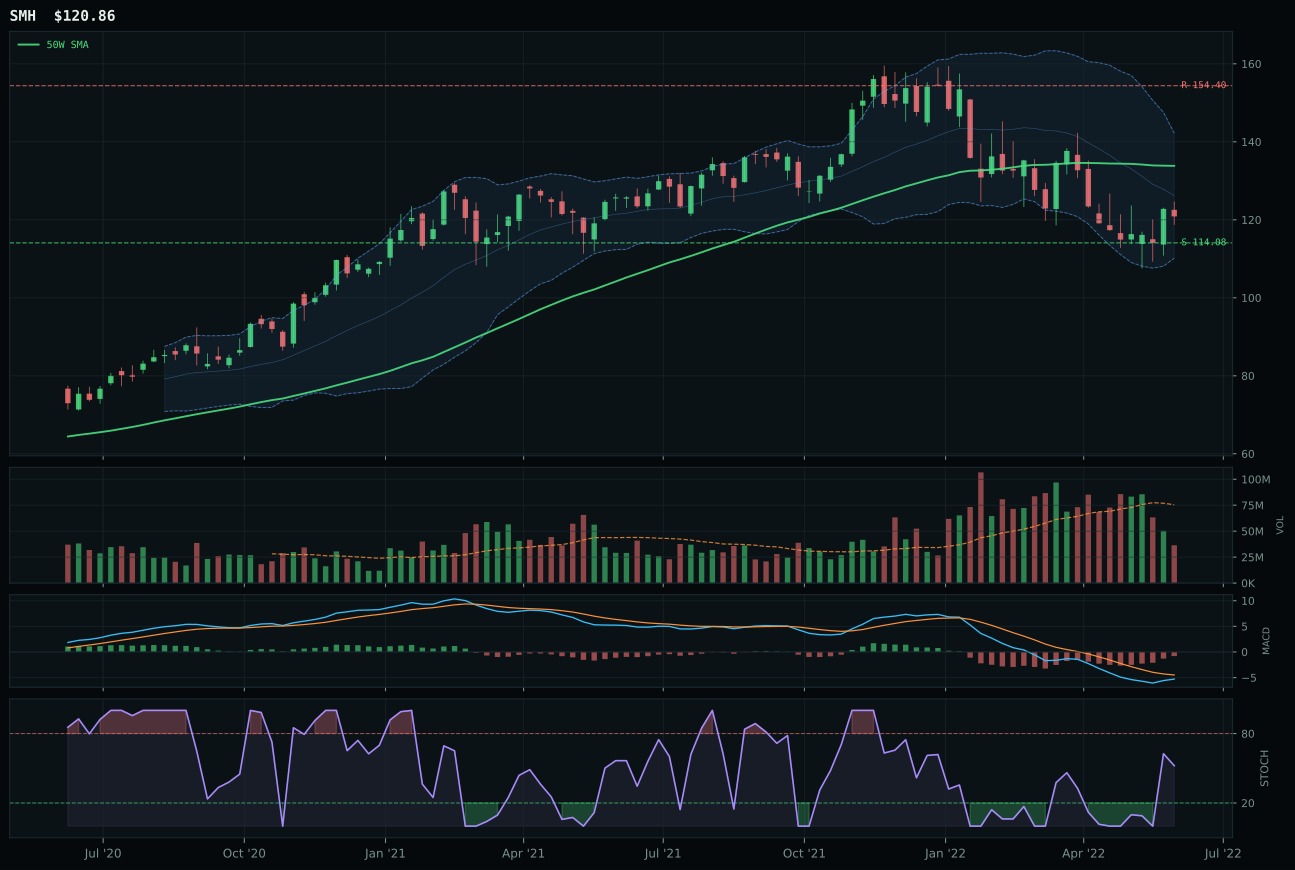
SMH has a neutral structure profile with -0.3% 13-week relative strength versus SPY.
A failed hold above support would weaken the setup.
Actionable but governed by invalidation levels.
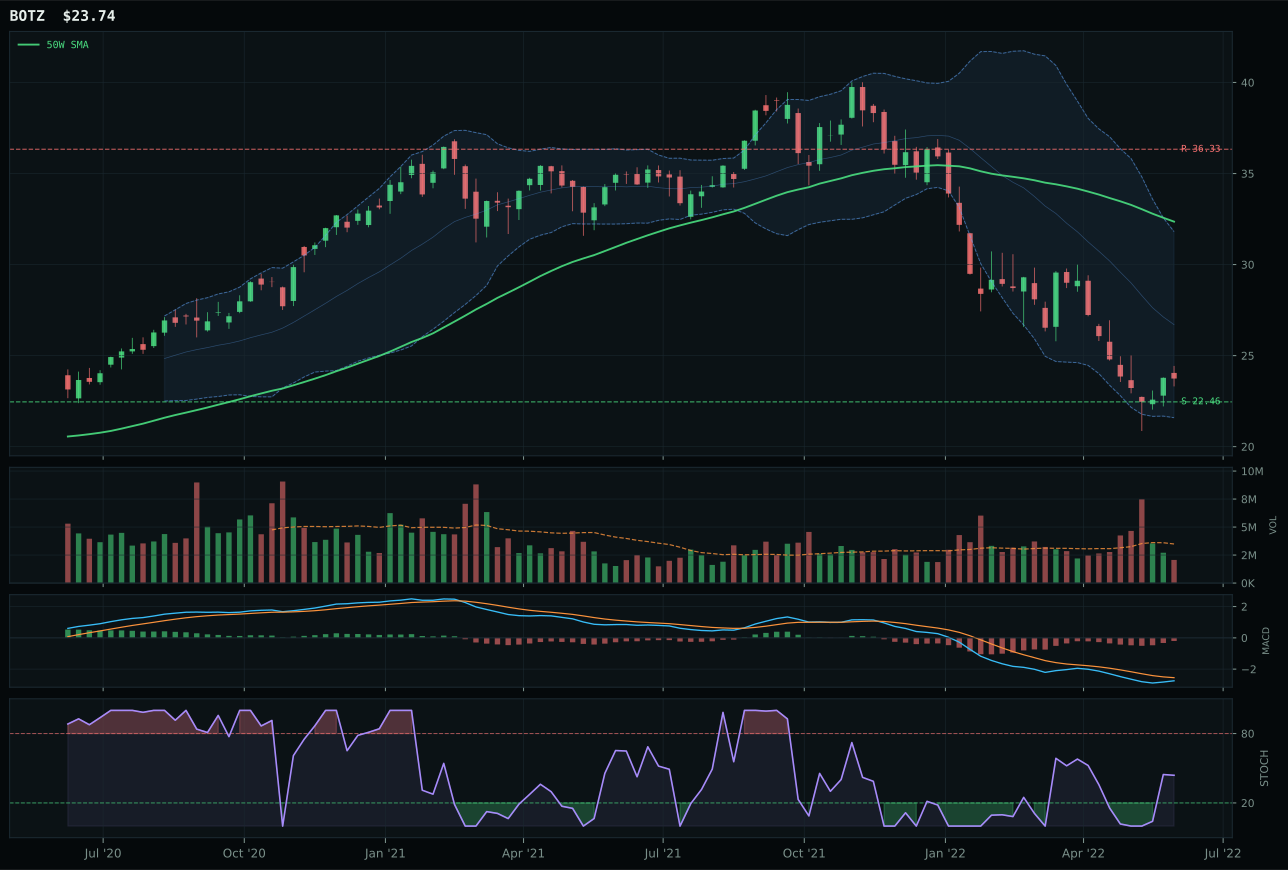
BOTZ has a neutral structure profile with -10.5% 13-week relative strength versus SPY.
A failed hold above support would weaken the setup.
Actionable but governed by invalidation levels.
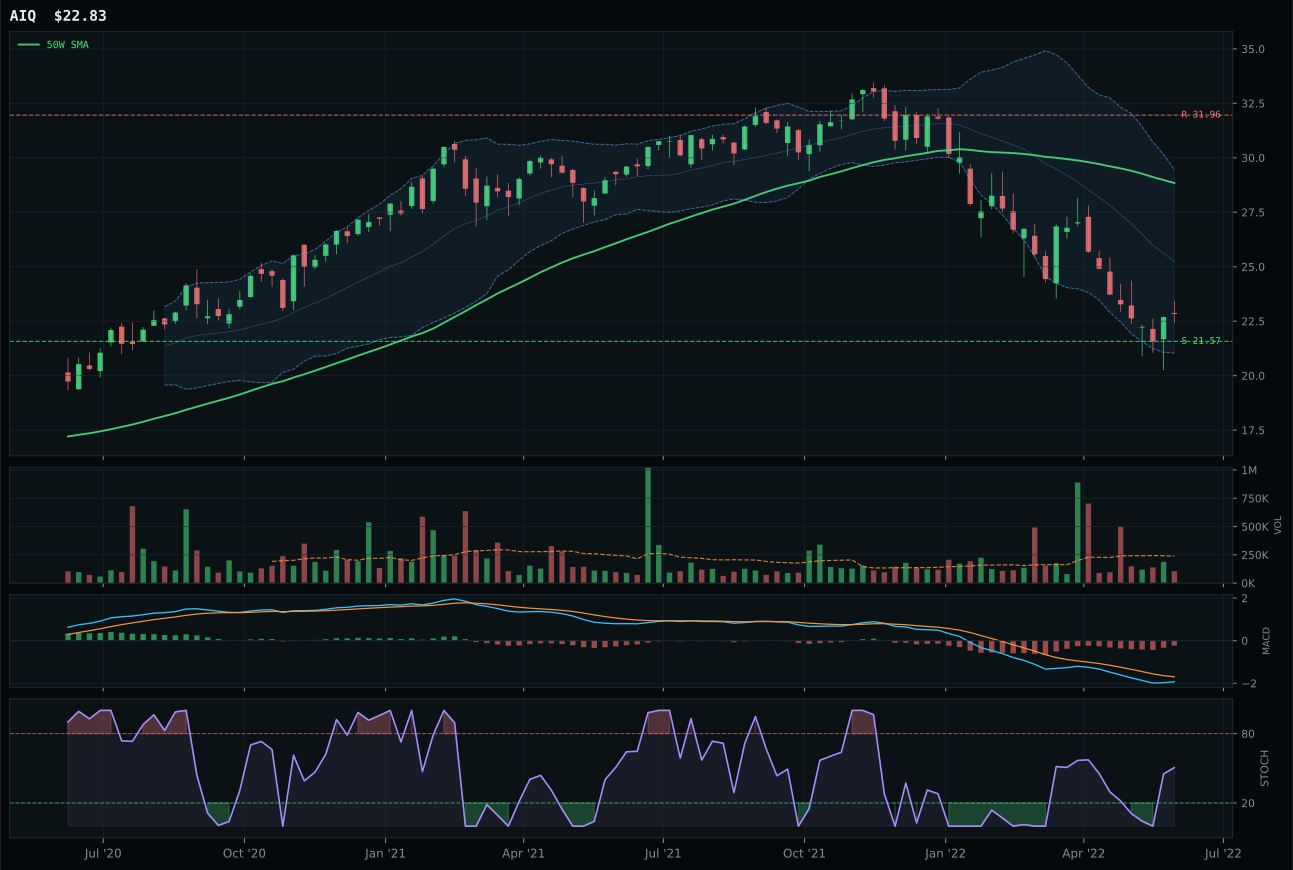
AIQ has a neutral structure profile with -5.7% 13-week relative strength versus SPY.
A failed hold above support would weaken the setup.
Tracked, but not top-2 eligible because: .
SMH wins the AI category on timing and relative strength purity, not momentum braggadocio. Semiconductors sit 9.7% below the 50W in the deep value zone of the Fibonacci band—exactly the distance that separates "bought-out panic" from "serious support." The 13W return of negative 5.3% appears weak until you examine category-relative strength at positive 5.4%, meaning SMH is actually the only AI expression holding its ground against BOTZ's catastrophic negative 15.5% thirteen-week return. BOTZ's timing score of 63.0 versus SMH's 90.0 reflects a simple chart reality: BOTZ sits deeper in the repair zone where repair can still fail, while SMH occupies the Fibonacci 0.786 area where mean reversion mechanics are most potent. Volume is thin across the board, but SMH's sector sponsorship (compute, chips, earnings resilience) is structurally superior to robotics' execution risk.
AI scored 20.5 and ranked ninth or tenth, earning zero allocation because macro fit at 26.0 reflects active broad-market bear (-8) and liquidity stress (-12) that overwhelm technical recovery signals. The category cannot compete for capital when both risk appetite and capital availability are broken; even SMH's superior timing score of 90.0 cannot override the macro reality that semiconductor demand cycles with growth, and growth is under pressure in this late-cycle reflation regime. SMH would need to break above the 50W on volume and hold above it for two weeks to rebuild credibility, but current breadth deterioration and persistent thin participation suggest such a recovery is months away, not weeks. This category sits in the penalty box until either the macro regime shifts or technical conviction emerges on the daily chart.
Emerging Markets — ILF
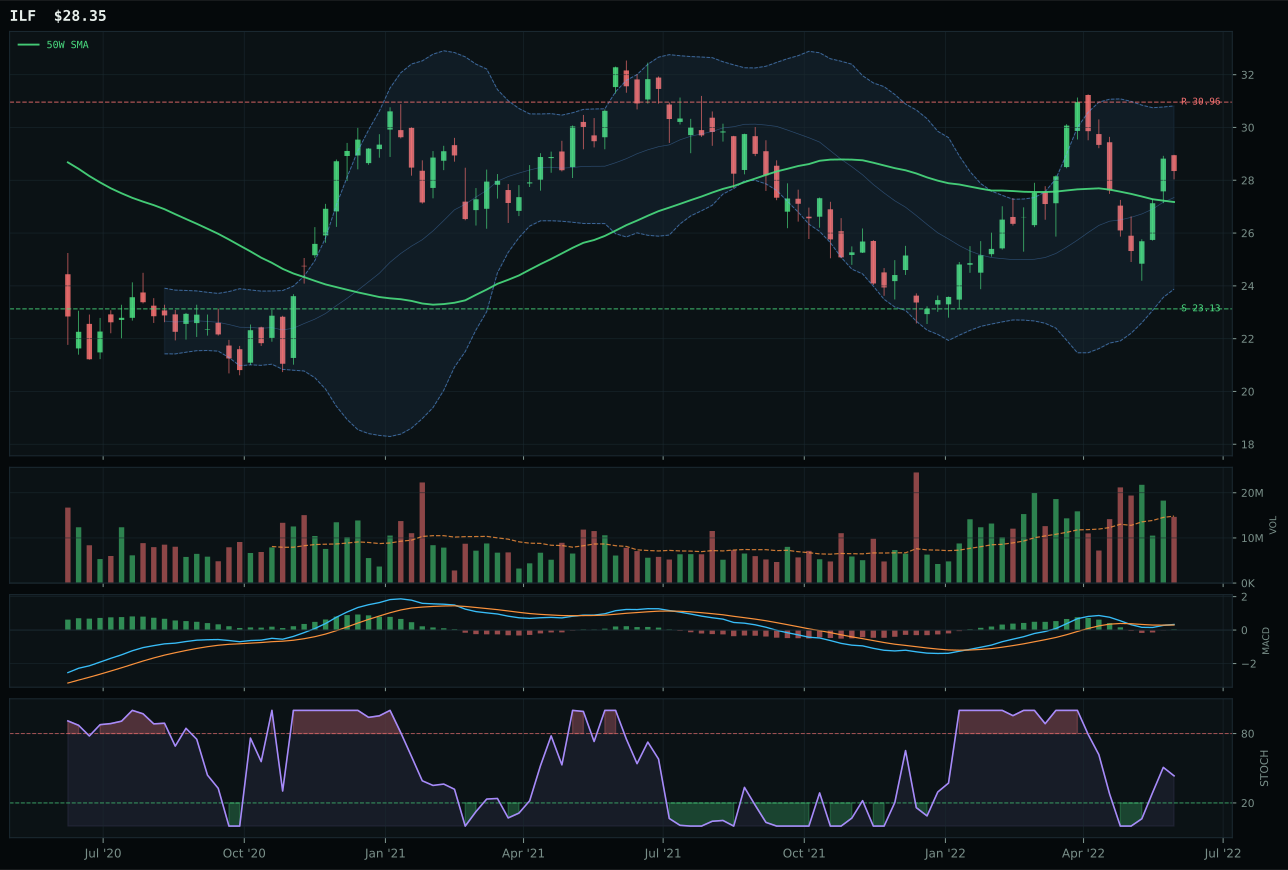
ILF has a neutral structure profile with 8.0% 13-week relative strength versus SPY.
A failed hold above support would weaken the setup.
Actionable but governed by invalidation levels.
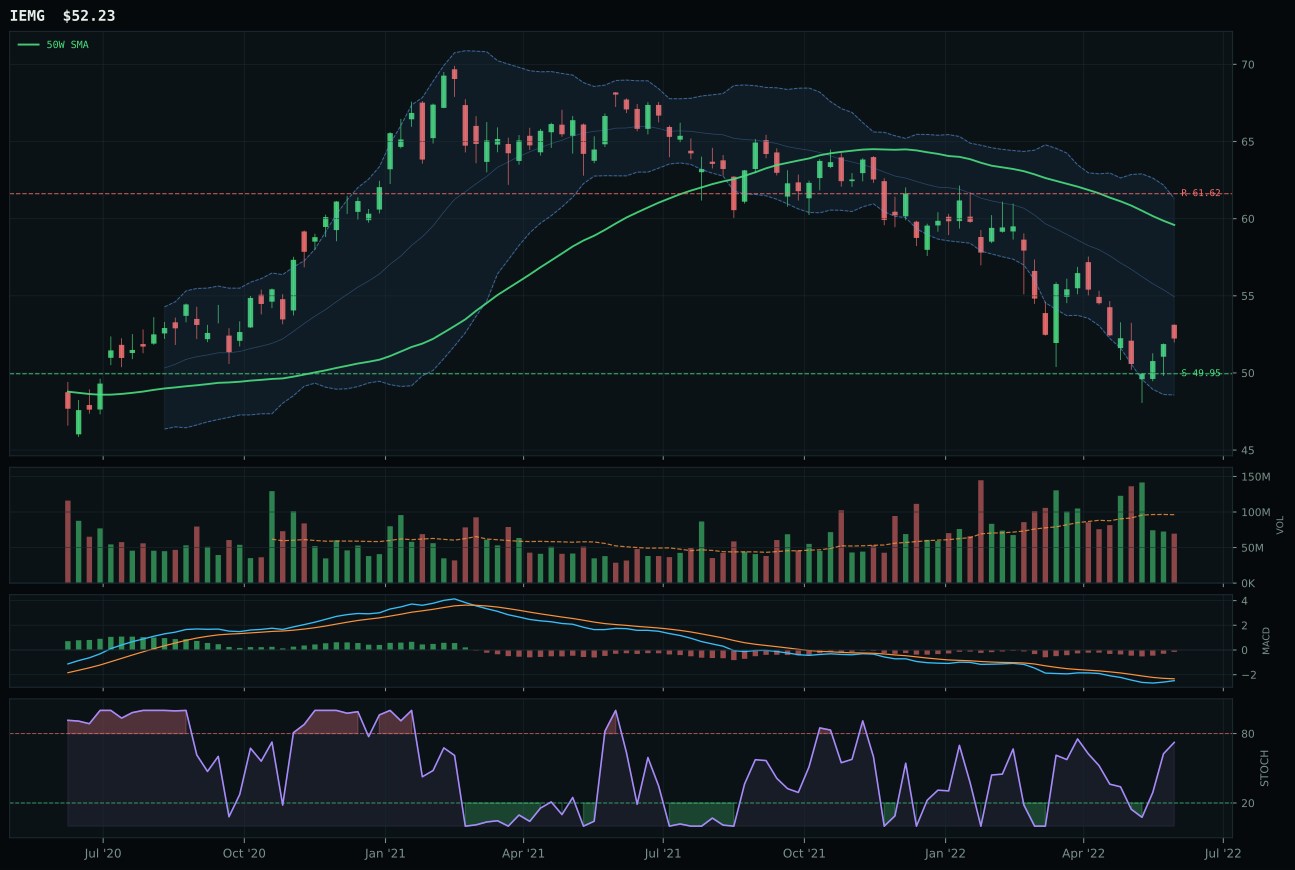
IEMG has a pullback into support profile with 0.3% 13-week relative strength versus SPY.
A failed hold above support would weaken the setup.
Actionable but governed by invalidation levels.
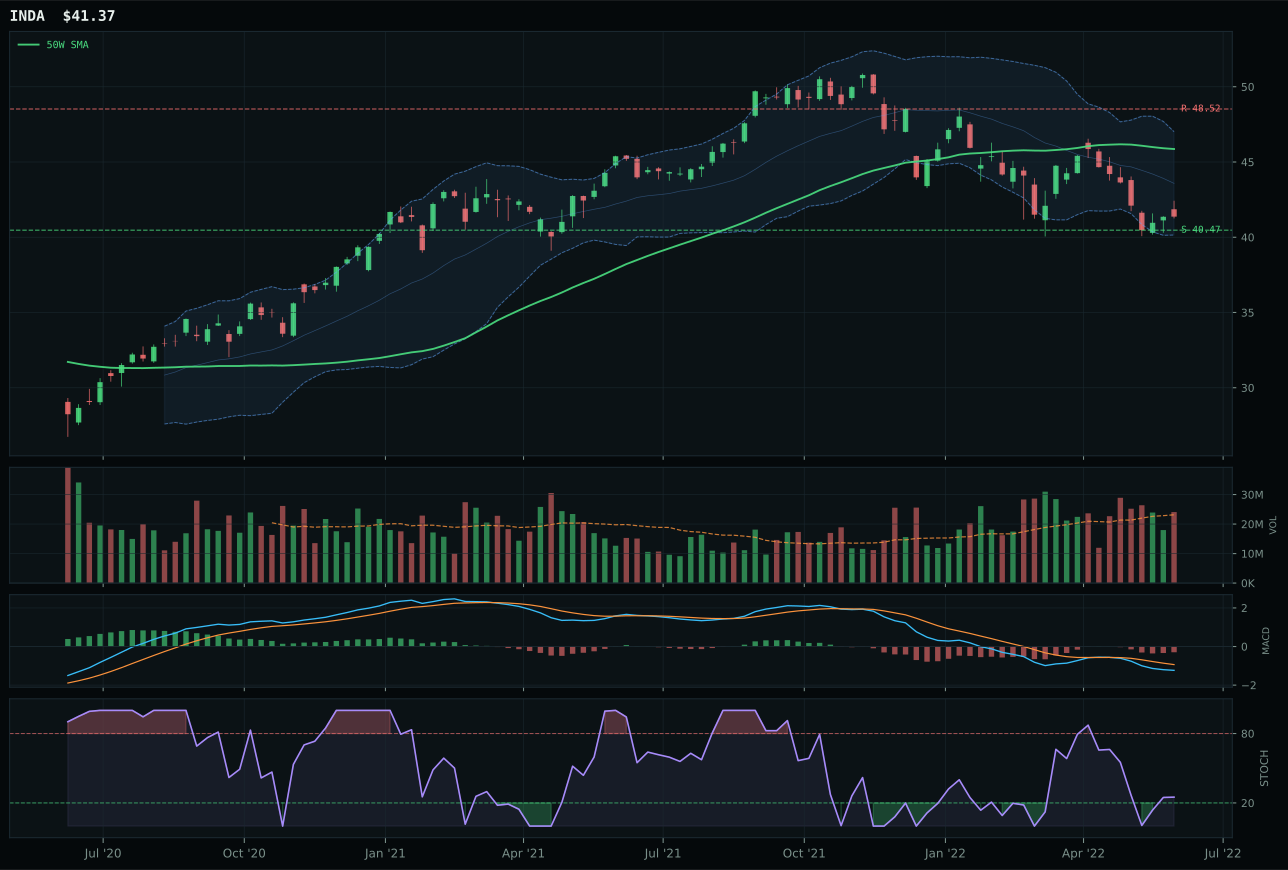
INDA has a pullback into support profile with 4.7% 13-week relative strength versus SPY.
A failed hold above support would weaken the setup.
Actionable but governed by invalidation levels.
ILF claimed the emerging markets category through technical excellence that would normally guarantee a top-2 slot, were the macro regime not so decisively against it. The chart displays bullish momentum (100.0 momentum score, positive 12.0% four-week return) with rising MACD and improving stochastic, and price sits just 4.3% above the 50W in the Fibonacci 0.382 decision zone—a compact setup with room to extend. Category-relative strength of positive 3.3% versus IEMG's negative 4.4% reveals ILF is the fund-flow favorite, and its neutral volume at 0.99x average (versus IEMG's thin participation) suggests accumulation rather than panic liquidation. IEMG failed on timing (73.0 vs ILF's 98.0), structural cleanliness (66.7 vs 69.7), and MACD confirmation (bearish but improving versus bullish and improving)—every technical reference favored ILF's Latin America beta.
Emerging Markets scored 14.3 and earned zero allocation, ranking ninth or tenth, because macro fit collapses to 17.0 due to active dollar pressure (-14) and liquidity stress (-10) that make this category structurally headwind-resistant in the current regime. Despite ILF's excellent technical setup and bullish MACD, the category-level macro fit is so poor that even the best chart cannot justify allocation. Late-cycle reflation with strong dollar dynamics directly penalizes emerging-market currencies and risk appetite. ILF's bullish setup would warrant attention in a different macro environment, but currently it is fighting structural headwinds that overwhelm technical conviction. For this category to earn allocation, either the dollar would need to weaken sharply or emerging-market specific catalysts would need to emerge that override global liquidity constraints. Until then, capital is better allocated to real assets and energy where macro and technicals align.