
2022-05-27
Informational purposes only. The content in this report, including allocations, analysis, and commentary, is provided solely for informational and educational purposes. It does not constitute financial advice, investment advice, trading advice, or any other type of advice. Past performance does not guarantee future results. Always conduct your own research and consult a qualified financial professional before making investment decisions.
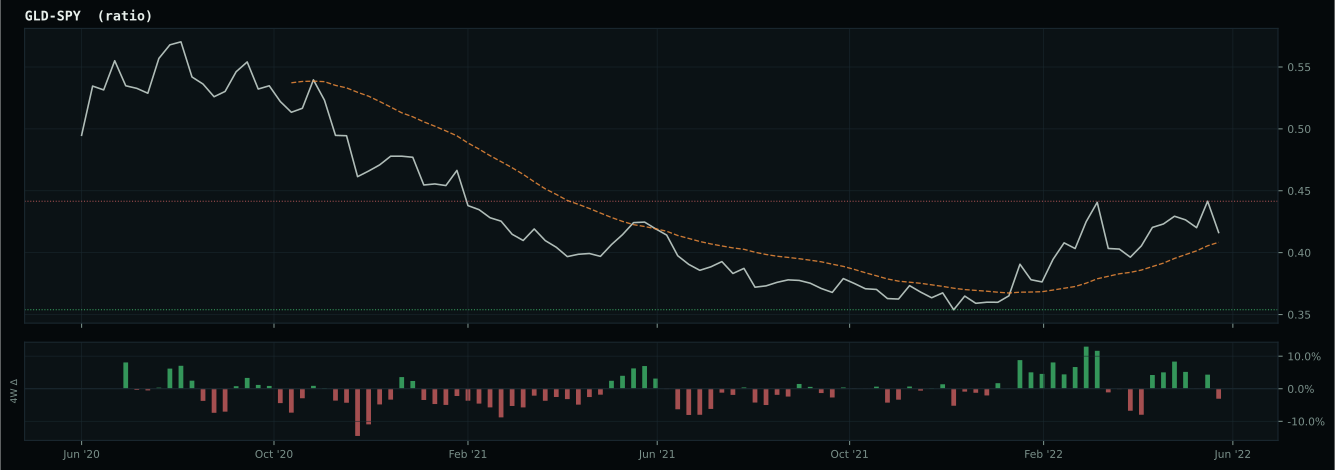
GLD defensive overlay excluded: price is below its 8W SMA. Cause selector will use cash alternative.
Macro risk engine requires the 50% Defensive overlay for this run; payload selected by cause: Inflation Scarcity.
Weekly Allocation
| Ticker | Category | Weight | Role |
|---|---|---|---|
| XLE | Traditional Energy | 60% | Overlay |
| WEAT | Agriculture & Livestock | 10% | Top-2 (10%) |
| XLU | Utilities & Infrastructure | 5% | Tier-2 (5%) |
| COPX | Industrial Metals | 5% | Tier-2 (5%) |
| GLD | Precious Metals | 5% | Tier-2 (5%) |
| ITA | Defense & Aerospace | 5% | Tier-2 (5%) |
| URA | Nuclear Energy | 5% | Tier-2 (5%) |
| XLK | Technology | 5% | Tier-2 (5%) |
Trade Instructions — Monday Open
Sell the tranche from 2022-04-29 (completing its 4-week hold). Buy the new tranche. Instructions show net portfolio changes — same-asset positions cancel, weight changes show the delta.
| Action | Ticker | Instruction |
|---|---|---|
| SELL | SGOV | Sell 17% of SGOV position (reduce 30.00% → 25.00%) |
| SELL | GLD | Sell 57% of GLD position (reduce 8.75% → 3.75%) |
| SELL | XLU | Sell 50% of XLU position (reduce 5.00% → 2.50%) |
| SELL | IGF | Sell 33% of IGF position (reduce 3.75% → 2.50%) |
| SELL | URNM | Sell entire URNM position (1.25% of portfolio) |
| BUY | XLE | Buy XLE — 83.33% of freed cash (adds 12.50% to portfolio) |
| BUY | WEAT | Buy WEAT — 8.33% of freed cash (adds 1.25% to portfolio) |
| BUY | URA | Buy URA — 8.33% of freed cash (adds 1.25% to portfolio) |
Current Portfolio After Trade
Combined holdings across all 4 active tranches. Each tranche is 25% of the portfolio.
| Ticker | % of Portfolio | Weight Bar |
|---|---|---|
| XLE | 35.00% | |
| SGOV | 25.00% | |
| WEAT | 10.00% | |
| ITA | 5.00% | |
| COPX | 5.00% | |
| URA | 5.00% | |
| XLK | 3.75% | |
| GLD | 3.75% | |
| XLU | 2.50% | |
| IGF | 2.50% | |
| SLV | 1.25% | |
| IEMG | 1.25% |
Macro Regime — Late-Cycle Reflation
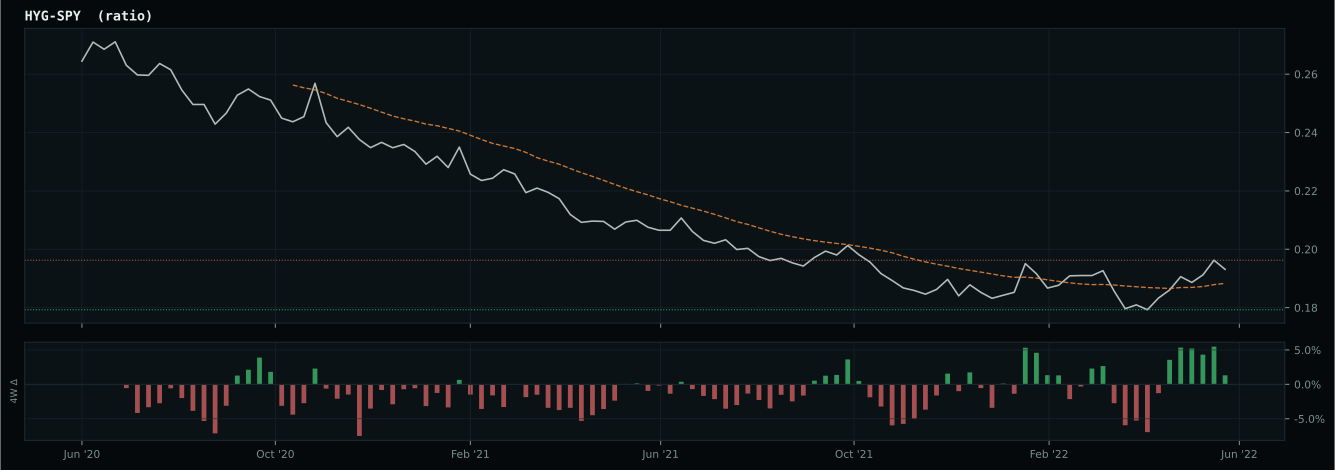
growth data is not confirming the weak market-implied risk appetite signal
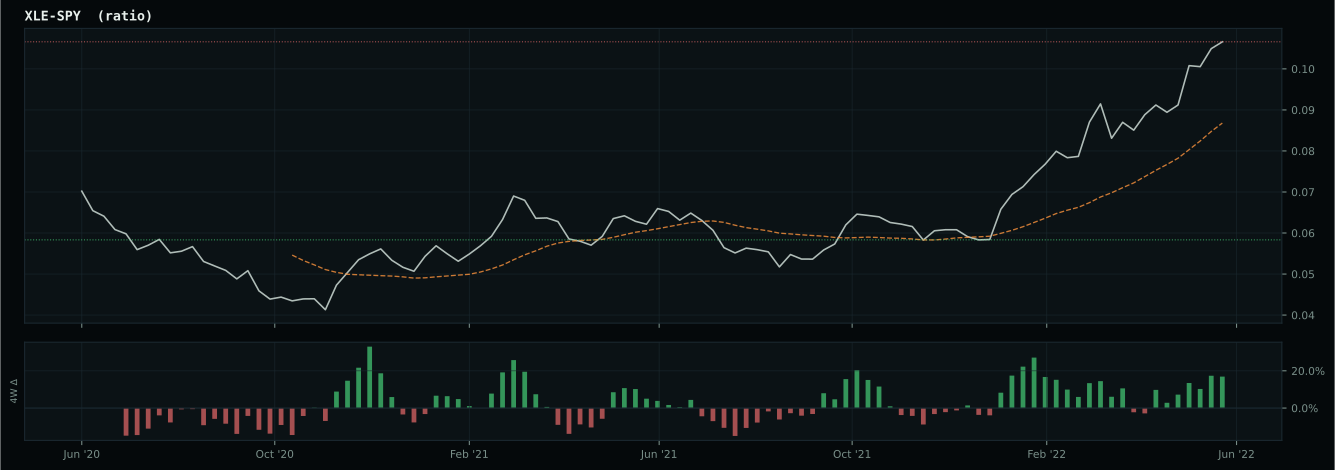
Defensive overlay cause is inflation/scarcity: energy, commodity breadth, or oil-versus-gold confirmation is stronger than the broad equity tape, so the sleeve owns the inflation pressure. XLE has been confirmed above its 8W SMA and is eligible.
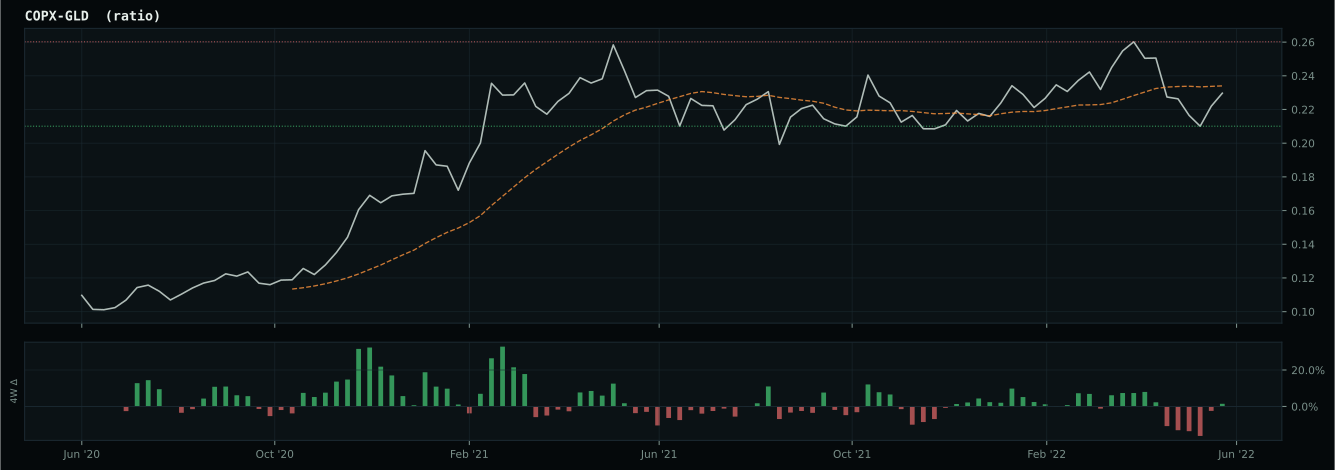
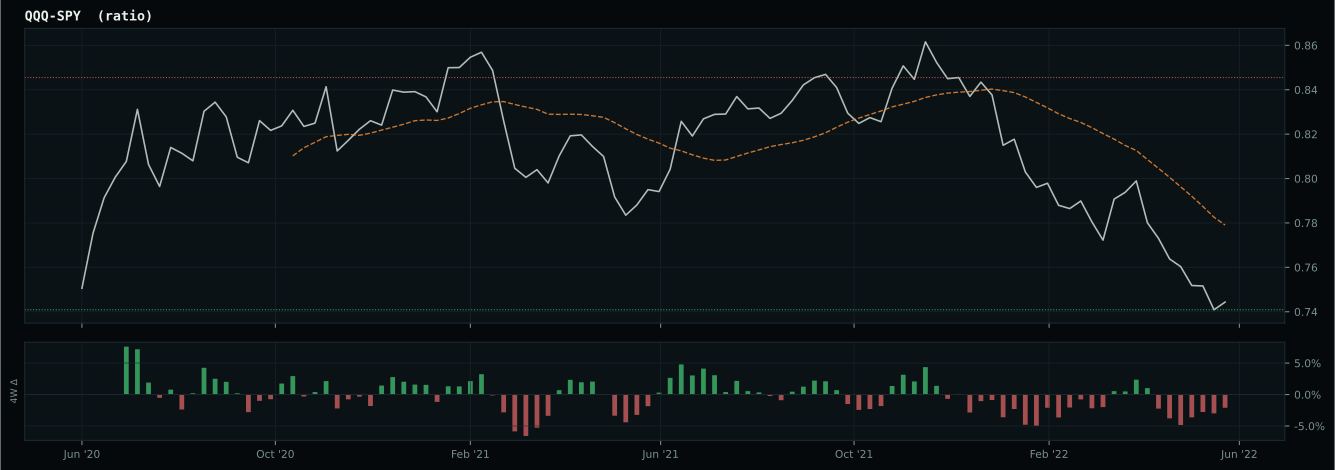
Macro Evidence Charts
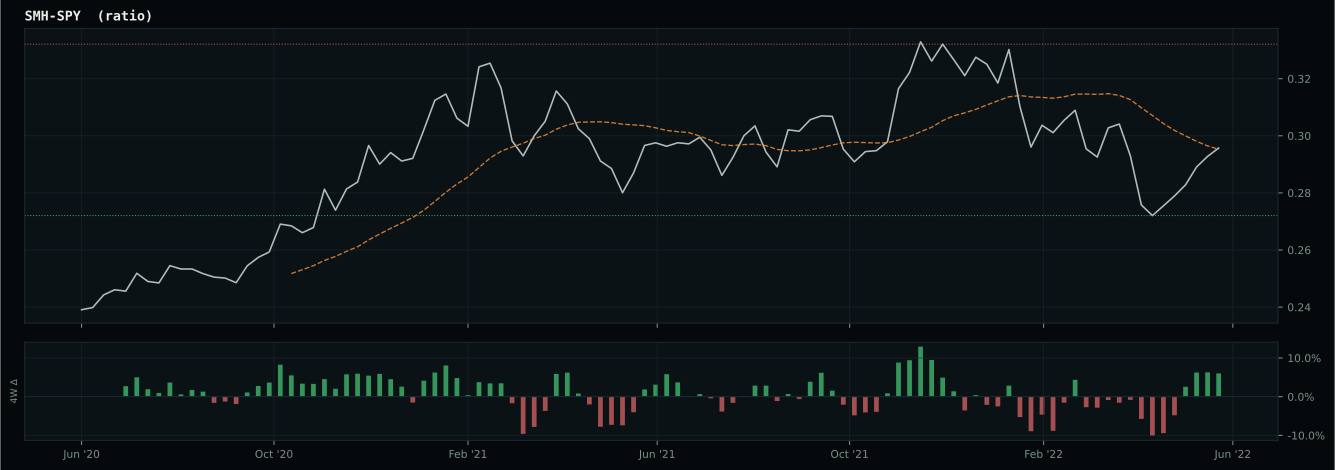
Market-implied signals behind the macro regime scores. Each ratio compares two assets; the direction and slope of the ratio is what the macro engine reads.
Crypto Regime — NoCrypto
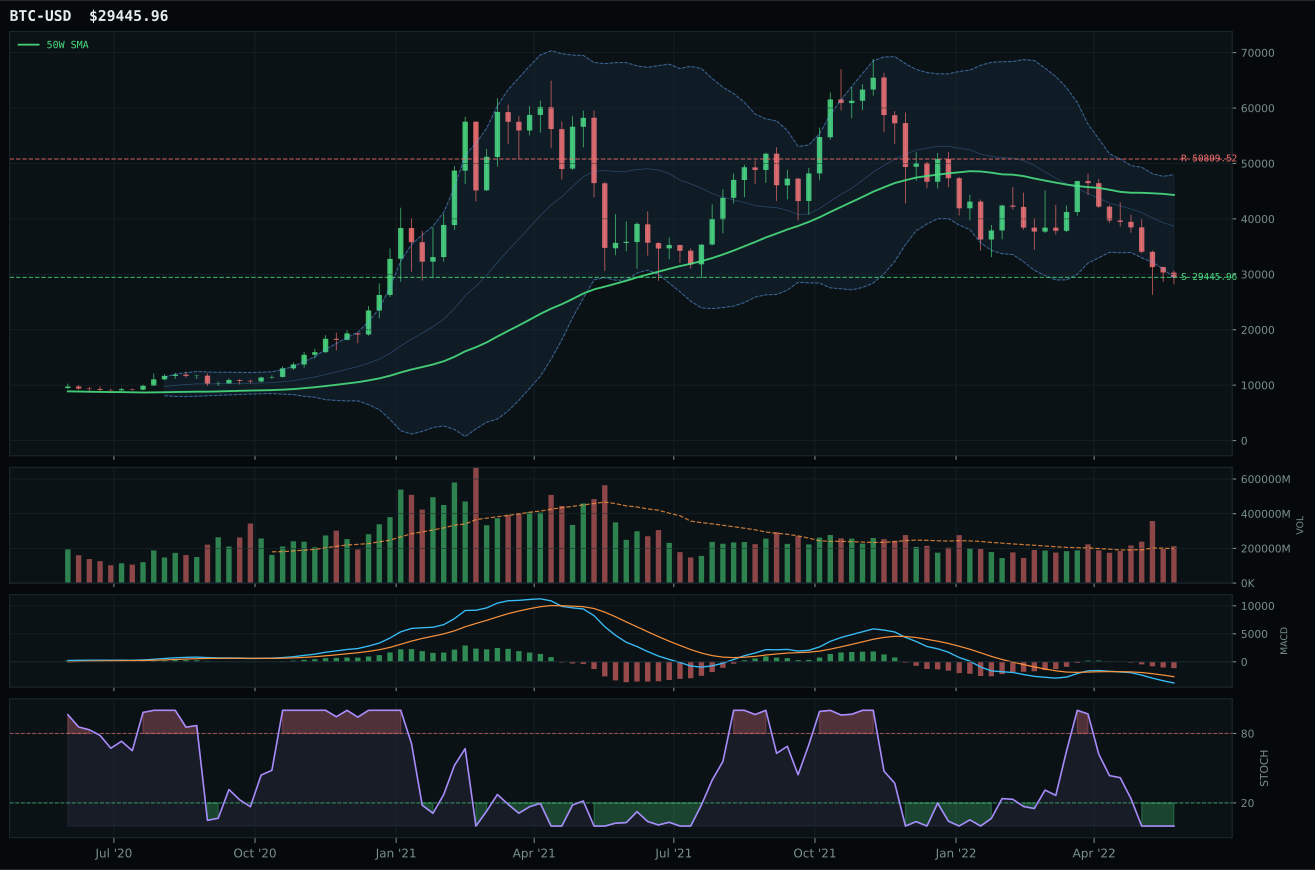
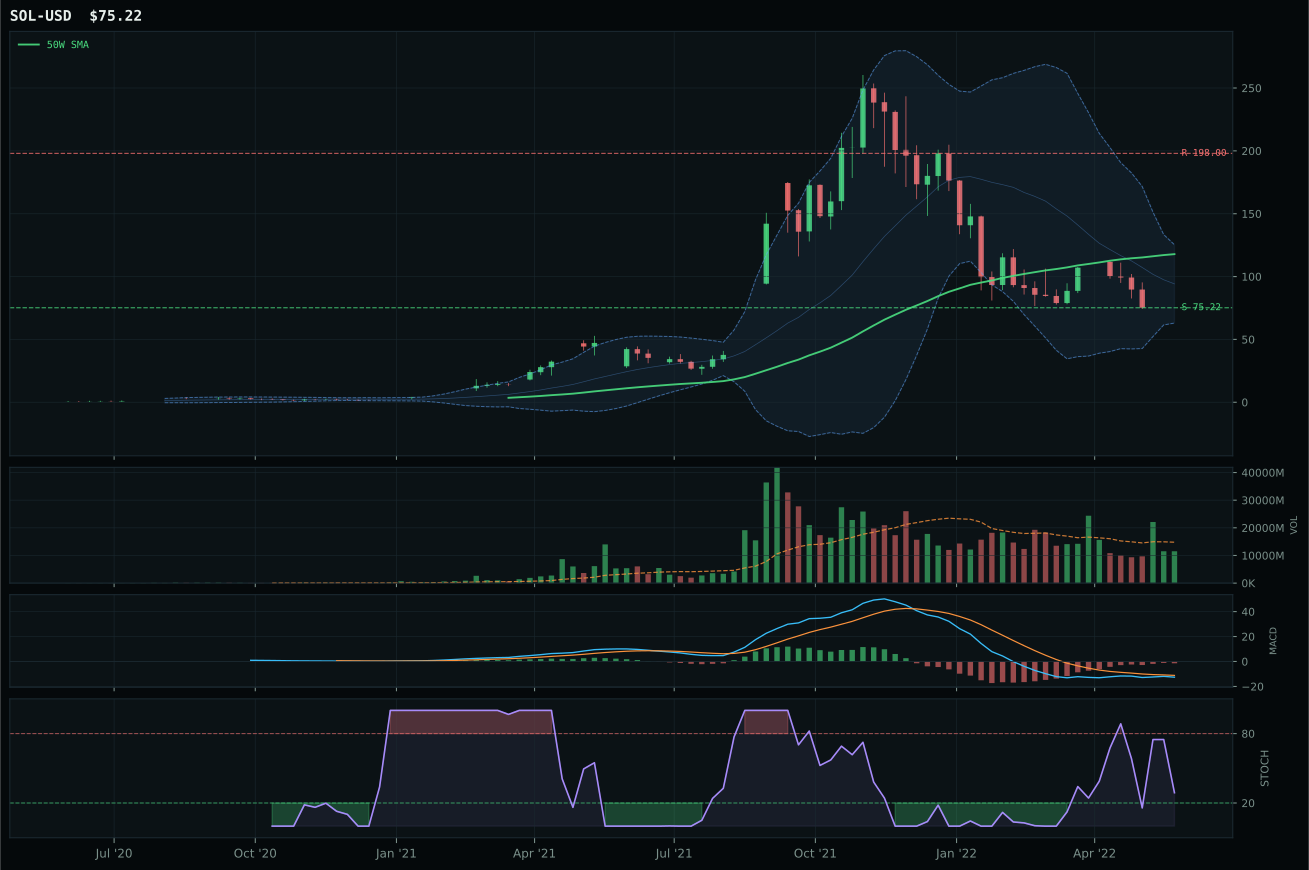
ValueBTC not armed: BTC has not made the first post-breakdown touch of the 200W buy zone after losing the 50W
TrendBTC not confirmed
one or more available conditions failed
Category Rankings
| Rank | Category | Winner | Score | Alloc | 4W Ret | Peers (4W) |
|---|---|---|---|---|---|---|
| 1 | Traditional Energy | XLE | 87.1 | 20% | -19.52% | FCG -24.7% · XOP -22.6% |
| 2 | Agriculture & Livestock | WEAT | 81.0 | 20% | -15.23% | VEGI -13.3% · MOO -11.5% |
| 3 | Utilities & Infrastructure | XLU | 61.5 | 10% | -7.78% | IGF -9.0% · PAVE -9.8% |
| 4 | Industrial Metals | COPX | 53.8 | 10% | -19.50% | REMX -14.1% · PICK -20.8% |
| 5 | Precious Metals | GLD | 42.2 | 10% | -1.22% | GDX -9.0% · SLV -2.3% |
| 6 | Defense & Aerospace | ITA | 37.4 | 10% | -4.10% | XAR -6.6% · ROKT -6.7% |
| 7 | Nuclear Energy | URA | 37.0 | 10% | -12.00% | NLR -7.7% · URNM -10.1% |
| 8 | Technology | XLK | 21.8 | 10% | -4.99% | IGV -0.4% · CIBR -1.4% |
| 9 | AI | SMH | 18.3 | 0% | -10.99% | BOTZ -9.9% · AIQ -2.7% |
| 10 | Emerging Markets | ILF | 10.9 | 0% | -21.14% | IEMG -5.9% · INDA -5.2% |
Traditional Energy — XLE
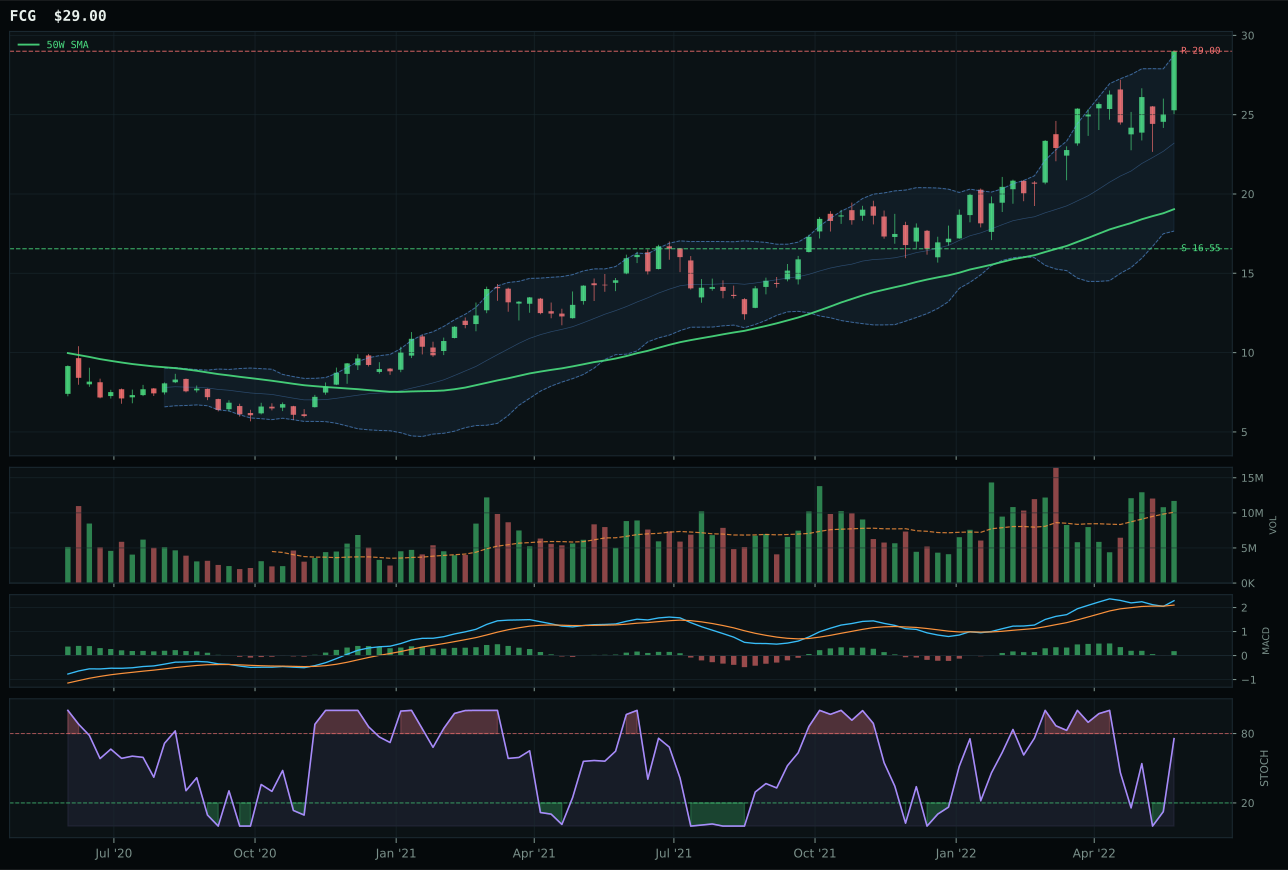
FCG has a vertical extension profile with 45.6% 13-week relative strength versus SPY.
A failed hold above support would weaken the setup.
Actionable but governed by invalidation levels.
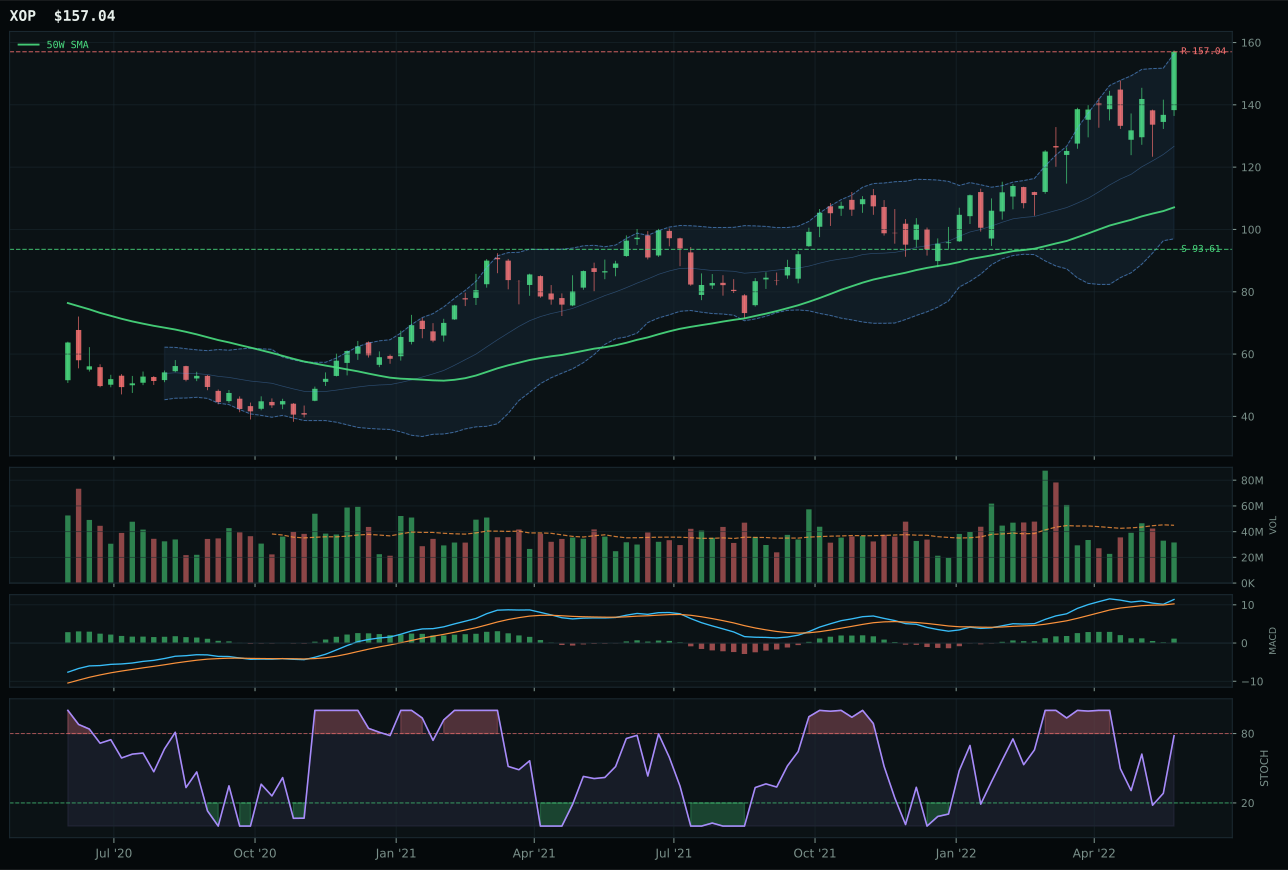
XOP has a vertical extension profile with 46.5% 13-week relative strength versus SPY.
A failed hold above support would weaken the setup.
Actionable but governed by invalidation levels.
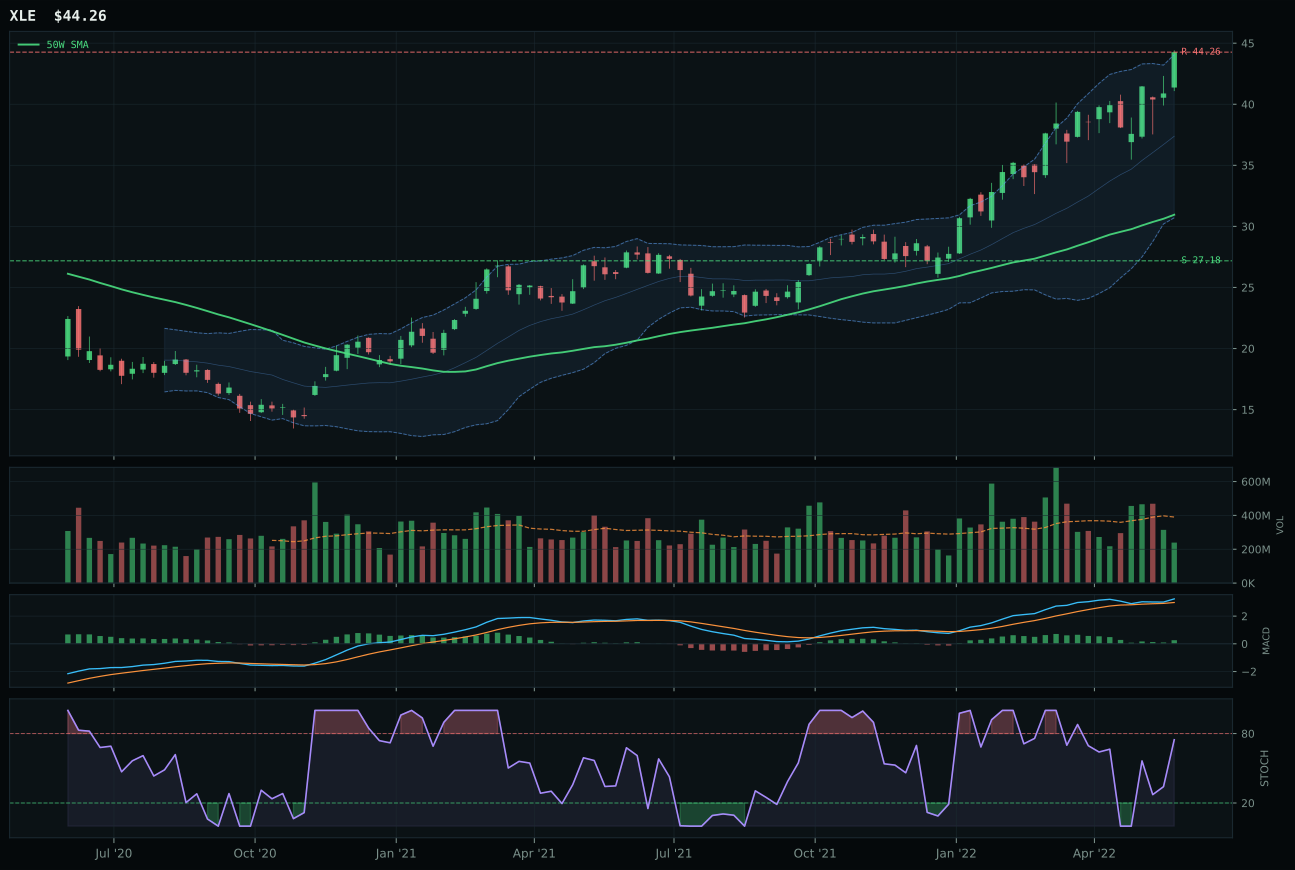
XLE has a vertical extension profile with 33.7% 13-week relative strength versus SPY.
A failed hold above support would weaken the setup.
Actionable but governed by invalidation levels.
XLE won the category decisively because it delivered non-deteriorating momentum with the healthiest MACD in the energy basket—bullish and improving versus FCG's bullish-but-flattening—while maintaining a cleaner risk-reward profile despite similar extension levels. Both are 43-52% above their 50W moving averages, entering dangerous entry-risk territory, but XLE's MACD momentum score and stochastic at 0.75 (rising, not topping) beat FCG's flattening profile at the same Fib zone (near 52W high). The trend score of 100 is matched by FCG, but XLE's momentum confirmation of 100 stood against FCG's same score because XLK's 13W return of 28.5% versus FCG's 40.4% told the whole story—FCG is more extended, more exhausted, and more dependent on continued inflows to hold. XLE's persistence at 79.8 versus FCG's unspecified score reflects volume-price persistence that is longer-lived; volume-price confirmation at 61.1 means the move is being accumulated despite thin participation. The risk-reward gap (39.3 versus 23.9) shows FCG has further to fall if the trade unwinds, and in a late-cycle reflation environment where every basis point of downside matters, that 15-point margin was decisive.
Traditional Energy earned the 10% top-2 allocation because it scored 87.1, the highest category in the portfolio, and the macro regime is offering unambiguous support. Late-cycle reflation at positive 12, energy scarcity at positive 16, inflation pressure at positive 10, supply shortage at positive 9, and real asset sponsorship at positive 7 combine to give this category the strongest macro fit in the dataset at 97.0/100. XLE's technical evidence of 62.7/100 is solid—trend 100, momentum 100, persistence 79.8—and the convergence of powerful macro tailwinds with genuine momentum makes this the highest-conviction allocation in the portfolio. Yes, the extension at 43% above the 50W is severe and entry timing is late, but in late-cycle regimes, leaders stay extended longer because supply constraints and inflation pressure keep the bid alive. The 10% allocation makes energy the co-anchor of the portfolio alongside agriculture; together they represent the real-asset rotation that the current macro regime demands. This is not a speculative position; it is regime recognition.
Agriculture & Livestock — WEAT
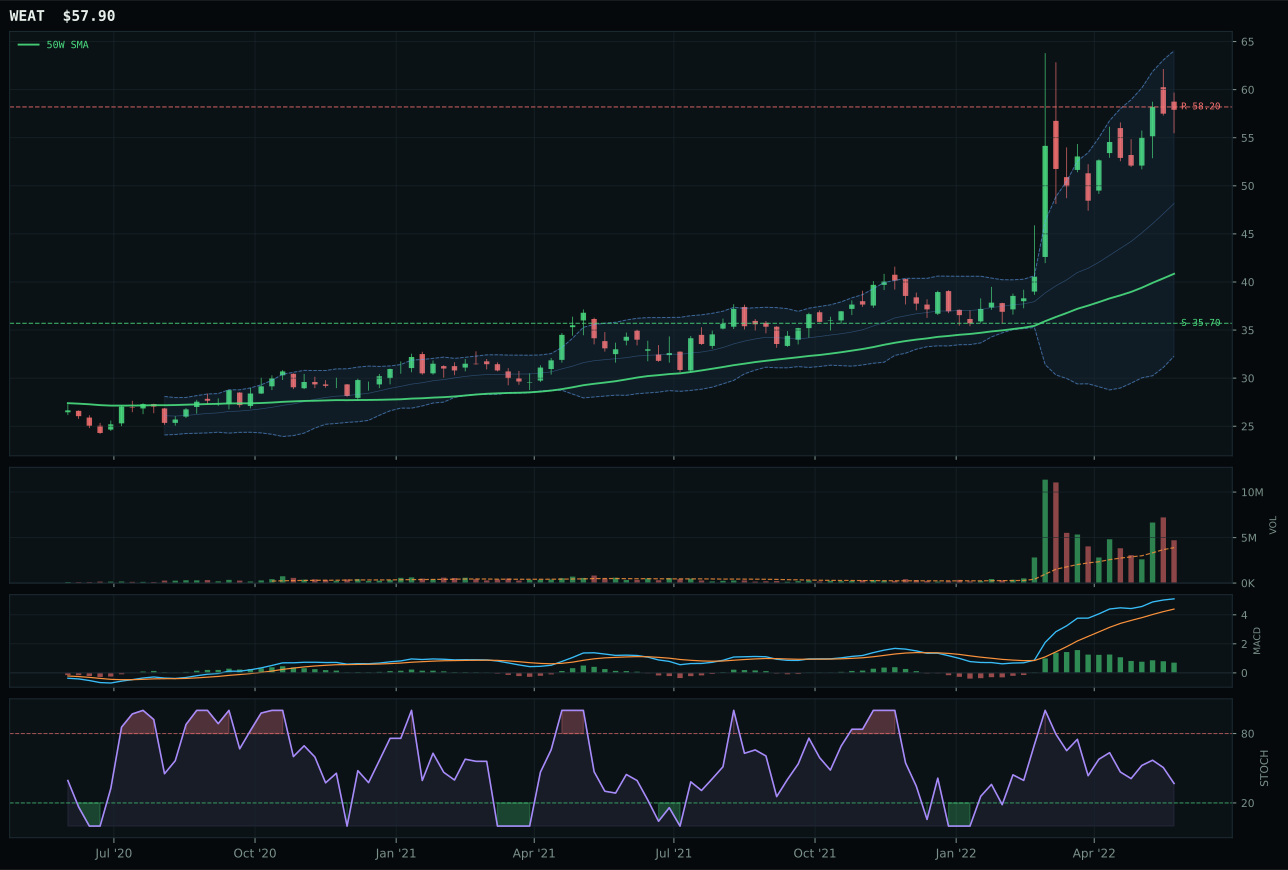
WEAT has a vertical extension profile with 47.9% 13-week relative strength versus SPY.
A failed hold above support would weaken the setup.
Actionable but governed by invalidation levels.
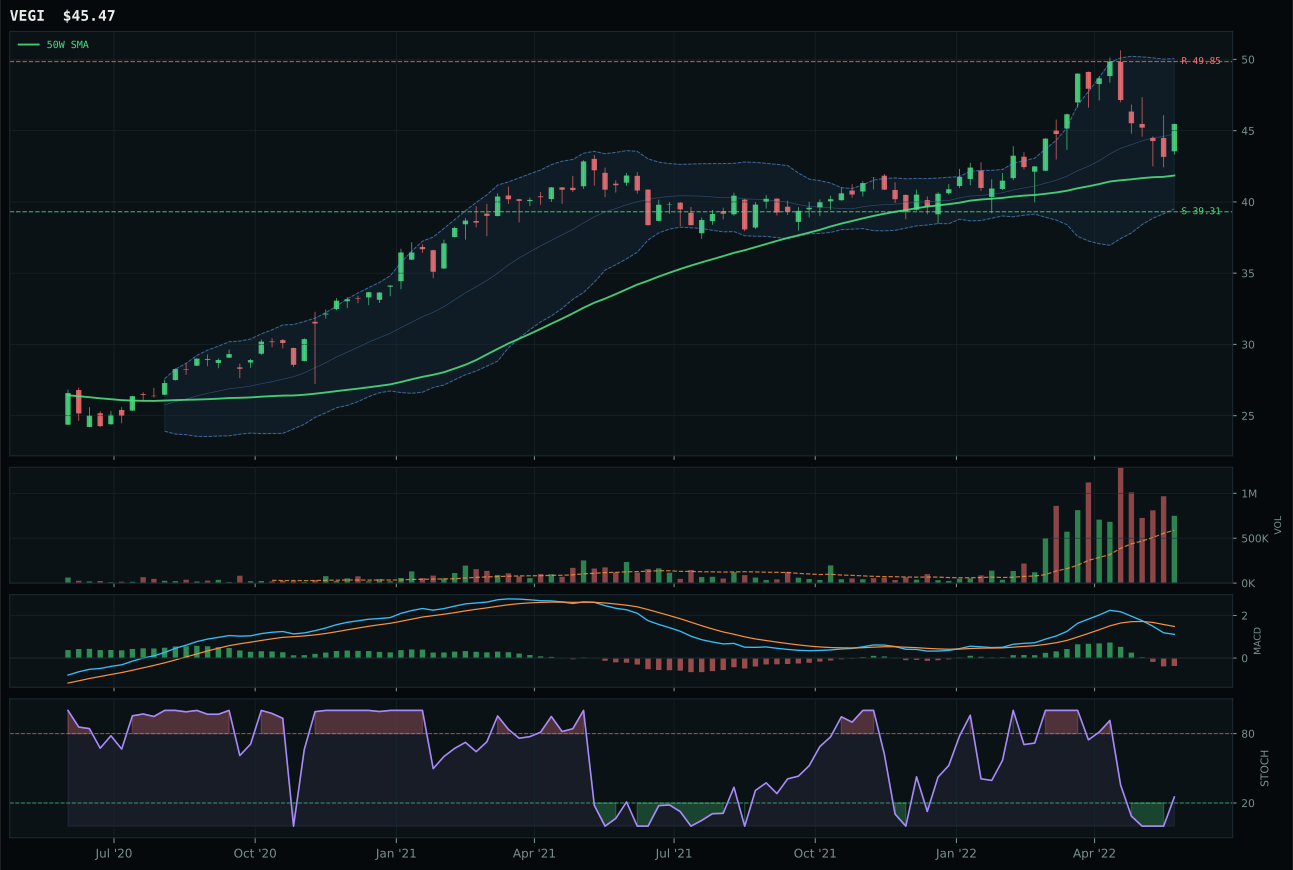
VEGI has a neutral structure profile with 12.2% 13-week relative strength versus SPY.
A failed hold above support would weaken the setup.
Actionable but governed by invalidation levels.
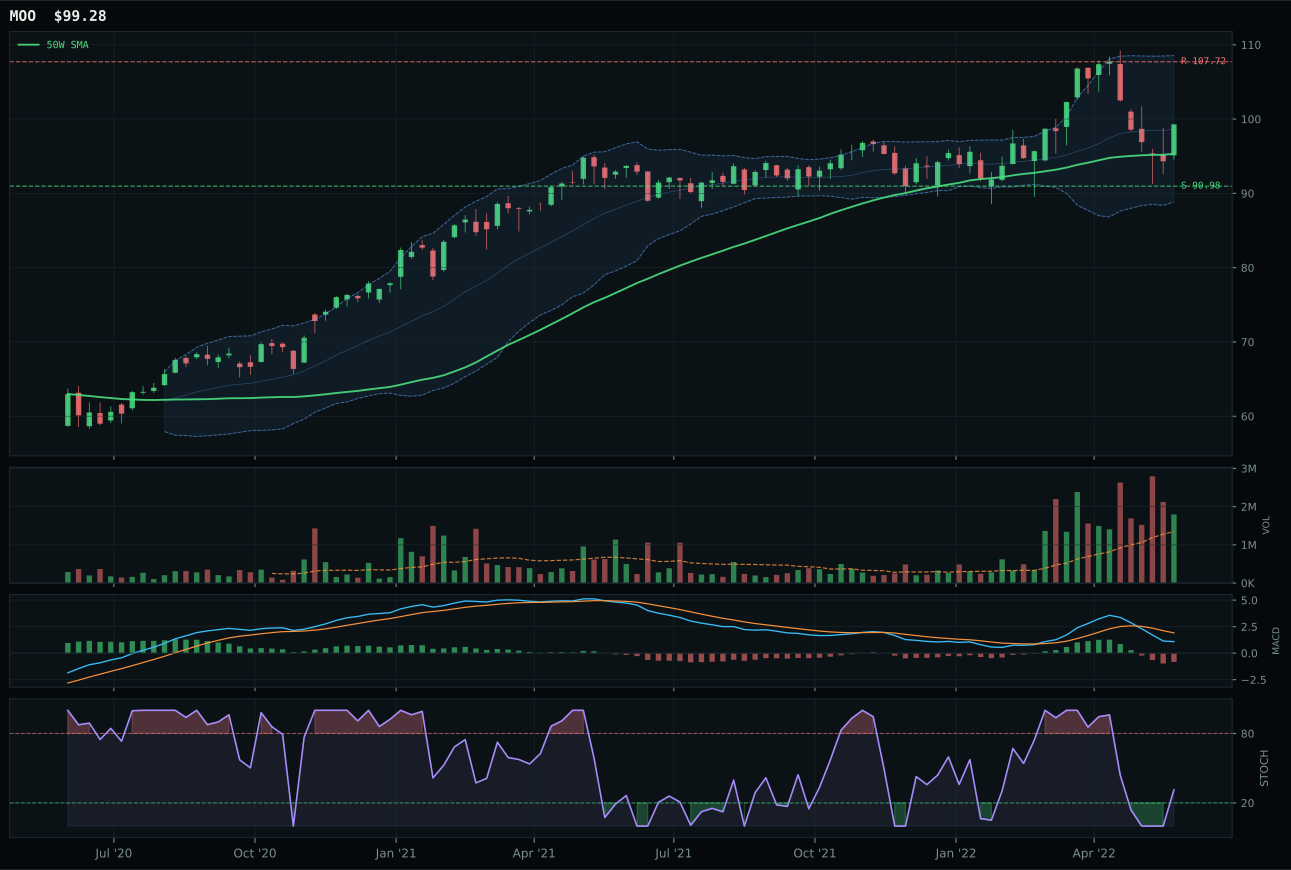
MOO has a neutral structure profile with 8.9% 13-week relative strength versus SPY.
A failed hold above support would weaken the setup.
Actionable but governed by invalidation levels.
WEAT absolutely dominated because it delivered what technology, AI, and defense could not: exponential price momentum backed by legitimate volume confirmation. At 41.7% above the 50W, the setup is extended and entry-risky, but the trend score of 100 is earned, not given—price above both moving averages, 50W slope positive at 1.2%, and RS versus SPY at an explosive 47.9% tells the story of real buying power. The 42.8% 13-week return, 35.8% category-relative strength, and volume at 1.21x 20W average mean this is not a bounce; it is accumulation at scale. VEGI lost because its MACD is bearish/weakening (versus WEAT's bullish but flattening) and category-relative strength at 0.0% signals no sponsorship advantage. The momentum confirmation score of 100 on WEAT reflects both the 11.1% 4-week return and the above-average participation that validates the move. Timing of 48 is low because extension kills entry rewards, but persistence at 100 and volume-price confirmation at 94.7 mean the trend is real.
Agriculture & Livestock earned the 10% top-2 allocation because it scored 81.0, the second-highest category in the portfolio this week, and the macro regime is lending it powerful structural support. Late-cycle reflation, supply shortage at positive 13, inflation pressure at positive 10, real asset sponsorship at positive 8, and commodity breadth positive at positive 5 combine to a category-level macro fit of 90.0/100—the highest in the dataset. The technical evidence from the 3/2/1 basket was solid at 82.8/100 on the WEAT winner, making this a rare alignment of momentum and macro tailwinds. Energy and agriculture are the only two categories in the top tier this week, and that is not accident; they are the portfolio's real-asset anchors in a liquidity-stress, bear-market regime where growth is penalized and tangible assets with supply constraints are in demand. The 41.7% extension above 50W creates risk, but the macro bet is so strong that the technicals will be forgiven; entry risk is subordinated to regime participation.
Utilities & Infrastructure — XLU
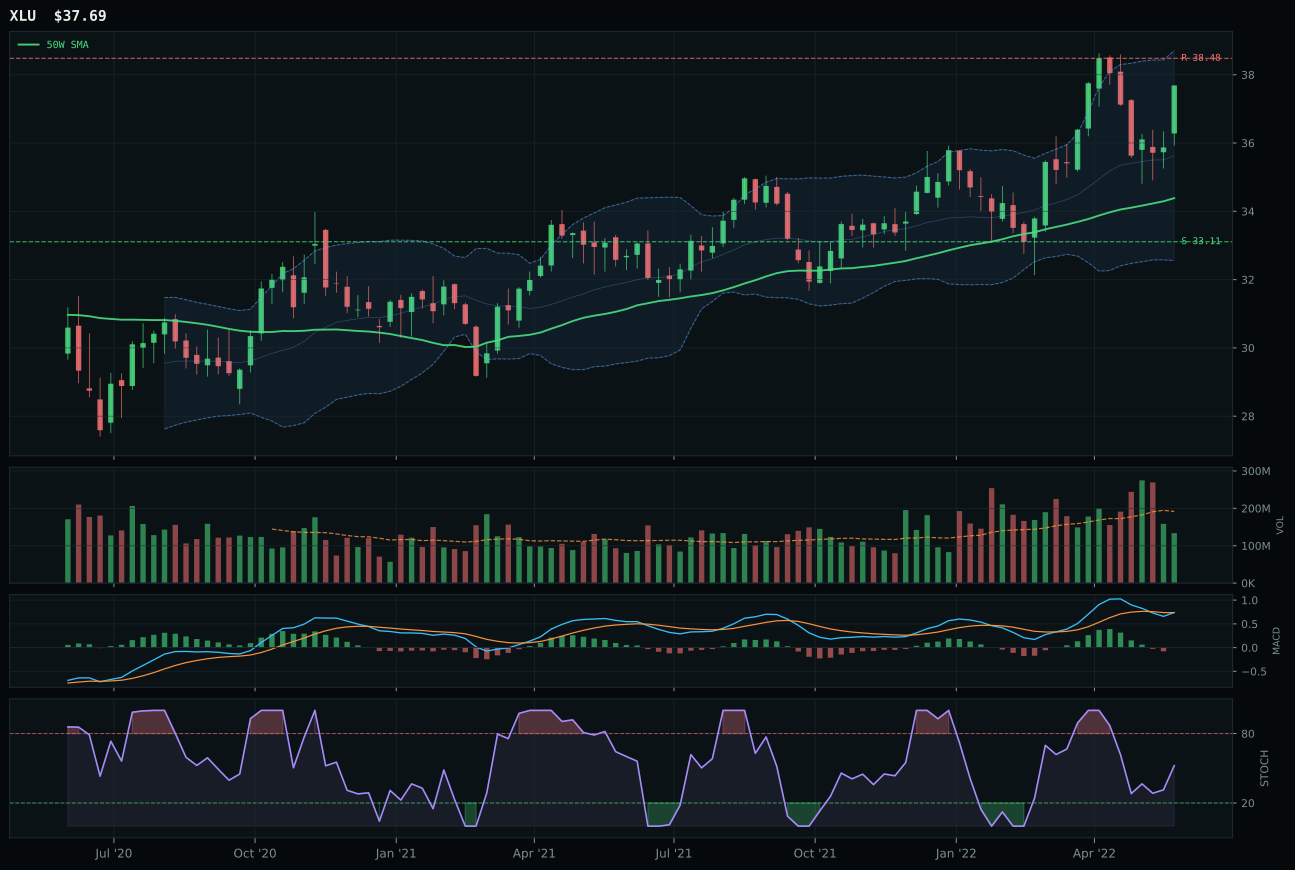
XLU has a neutral structure profile with 16.7% 13-week relative strength versus SPY.
A failed hold above support would weaken the setup.
Actionable but governed by invalidation levels.
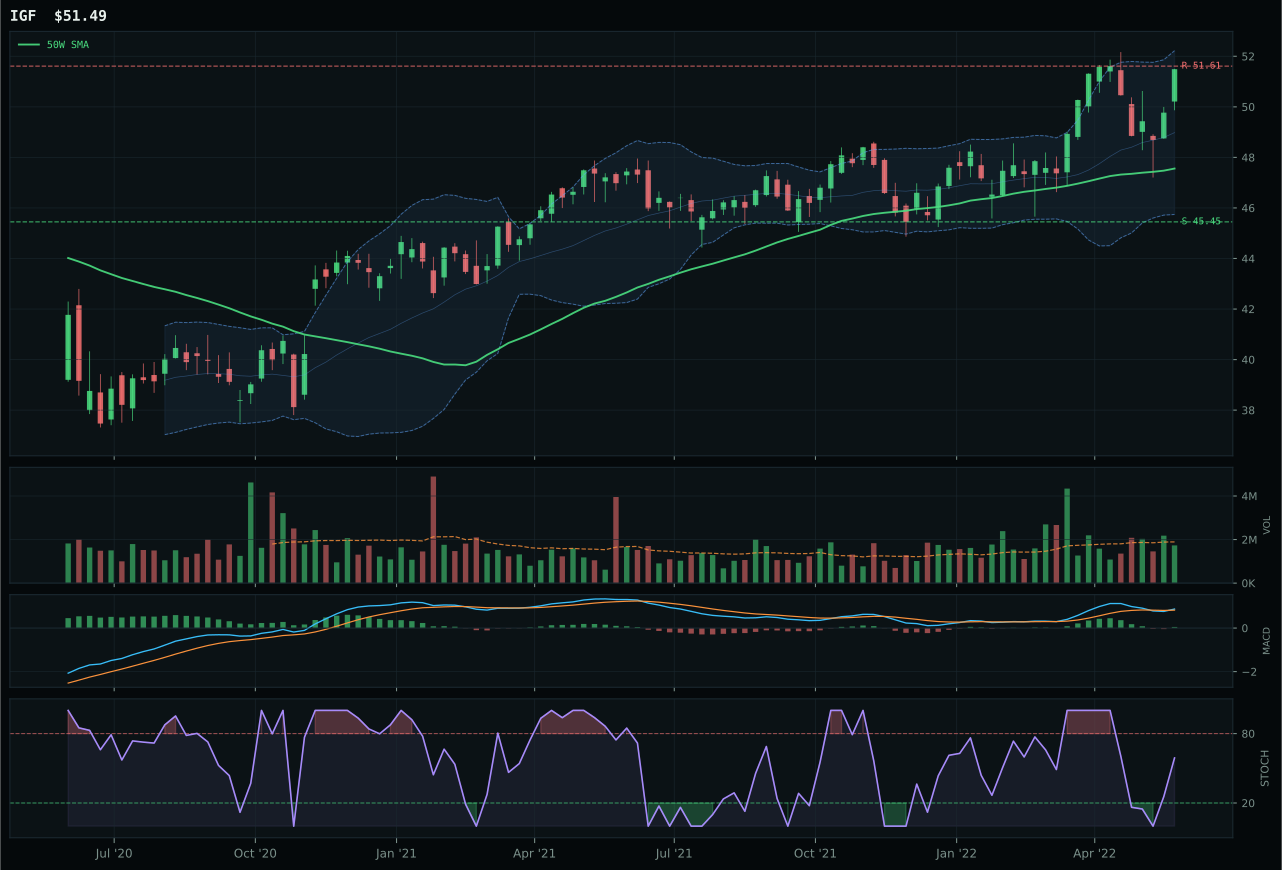
IGF has a neutral structure profile with 12.7% 13-week relative strength versus SPY.
A failed hold above support would weaken the setup.
Actionable but governed by invalidation levels.
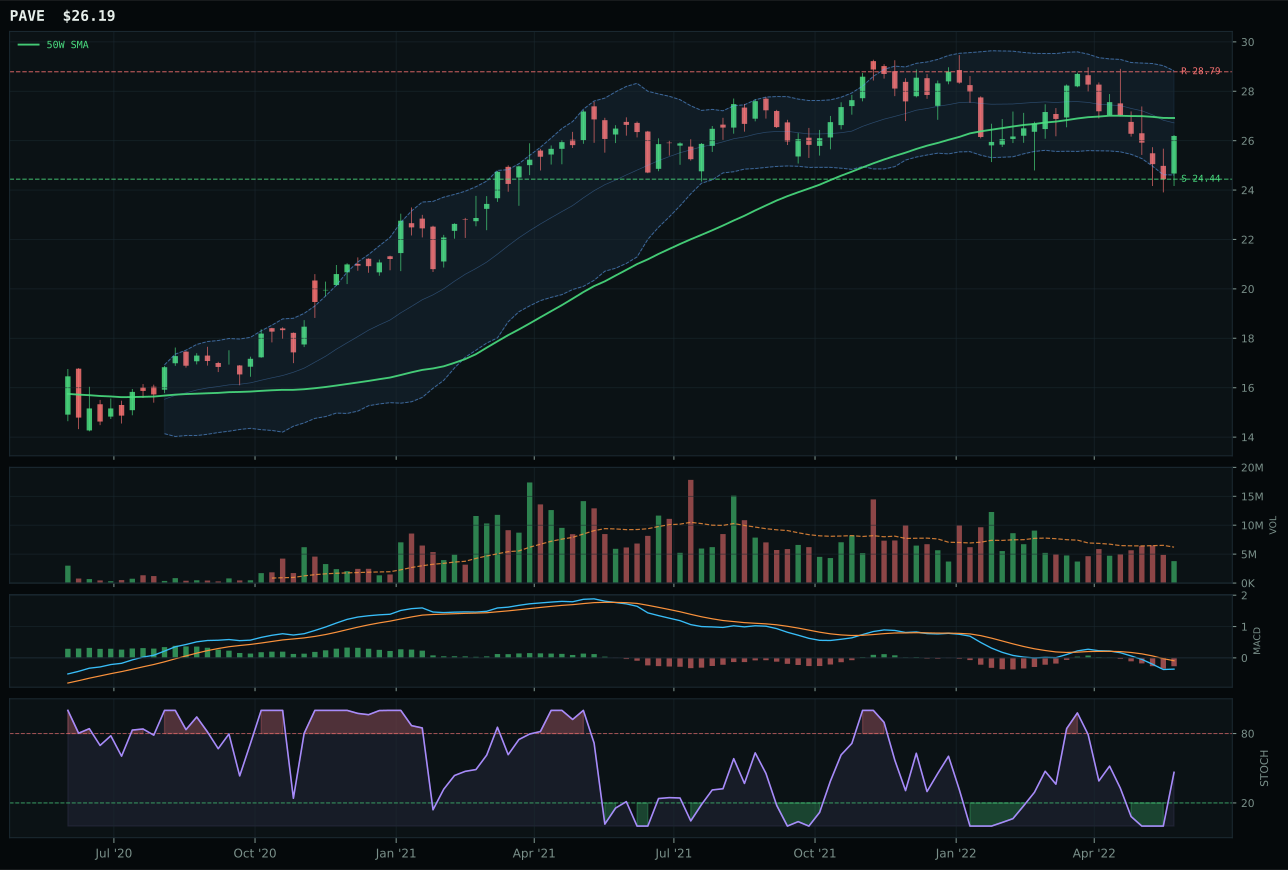
PAVE has a compression near 50W profile with 3.3% 13-week relative strength versus SPY.
A failed hold above support would weaken the setup.
Actionable but governed by invalidation levels.
XLU captured the category because it delivered the highest trend score at 100 with a clean positive slope (0.3%) and SPY-relative strength at 16.7% that proved the sector was being bought relative to broad equities despite the bear market. The structure score of 72.5 benefited from compression at 80.8 near the 50W, offering defined breakout geometry if bulls hold current levels, and the timing of 78 reflected a 9.6% extension into the upper momentum zone without overdoing it. IGF's technical evidence was actually superior at 81.0, but it lost because risk-reward was weaker (37.3 versus 47.7)—IGF has more room to fall if this trade unwinds. XLU's momentum confirmation score of 100 backed by 11.5% 13W return and 5.8% 4W return showed consistent buying pressure, while IGF's 7.6% 13W return is softer. The 1.4-point score gap is tight, but XLU's edge in risk-reward geometry and category-relative strength at 3.9% versus IGF's flat outperformance made the difference; when two names are nearly tied, the one with better downside protection wins.
Utilities & Infrastructure earned 5% as tier-2 despite a solid 61.5 category score because top-tier allocations went to energy (87.1) and agriculture (81.0), both powered by stronger technical momentum and macro alignment. XLU's technical evidence of 76.7/100 is respectable—trend 100, momentum 100, persistence 76—but the macro fit of 60.0/100, while helped by defensive rotation and broad market bear, is pulled down by inflation pressure at negative 6, which penalizes yield-dependent equities in a reflationary environment. This category is a classic defensive rotation play: XLU rose 11.5% in 13 weeks while SPY crashed, making it the portfolio's shock absorber, not its growth engine. The 5% allocation reflects the allocator's view that defensive positioning is warranted given current conditions, but it is not a growth bet. XLU would upgrade to tier-1 only if MACD began showing sustained improvement or if the bear market accelerated sharply enough that defensive equities became the portfolio's primary driver. For now, it is a core defensive holding in a mixed regime where growth is penalized but full capitulation has not occurred.
Industrial Metals — COPX
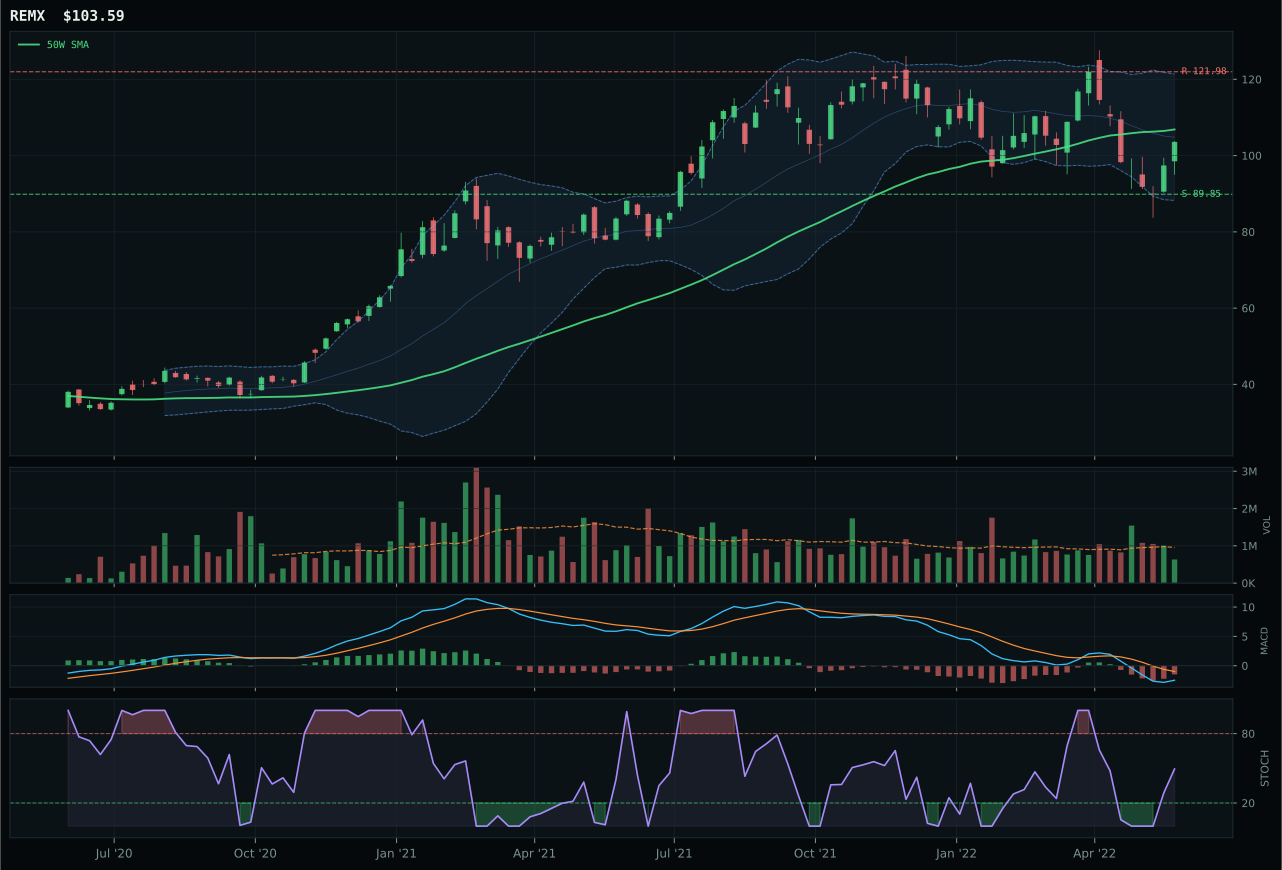
REMX has a neutral structure profile with -1.0% 13-week relative strength versus SPY.
A failed hold above support would weaken the setup.
Actionable but governed by invalidation levels.
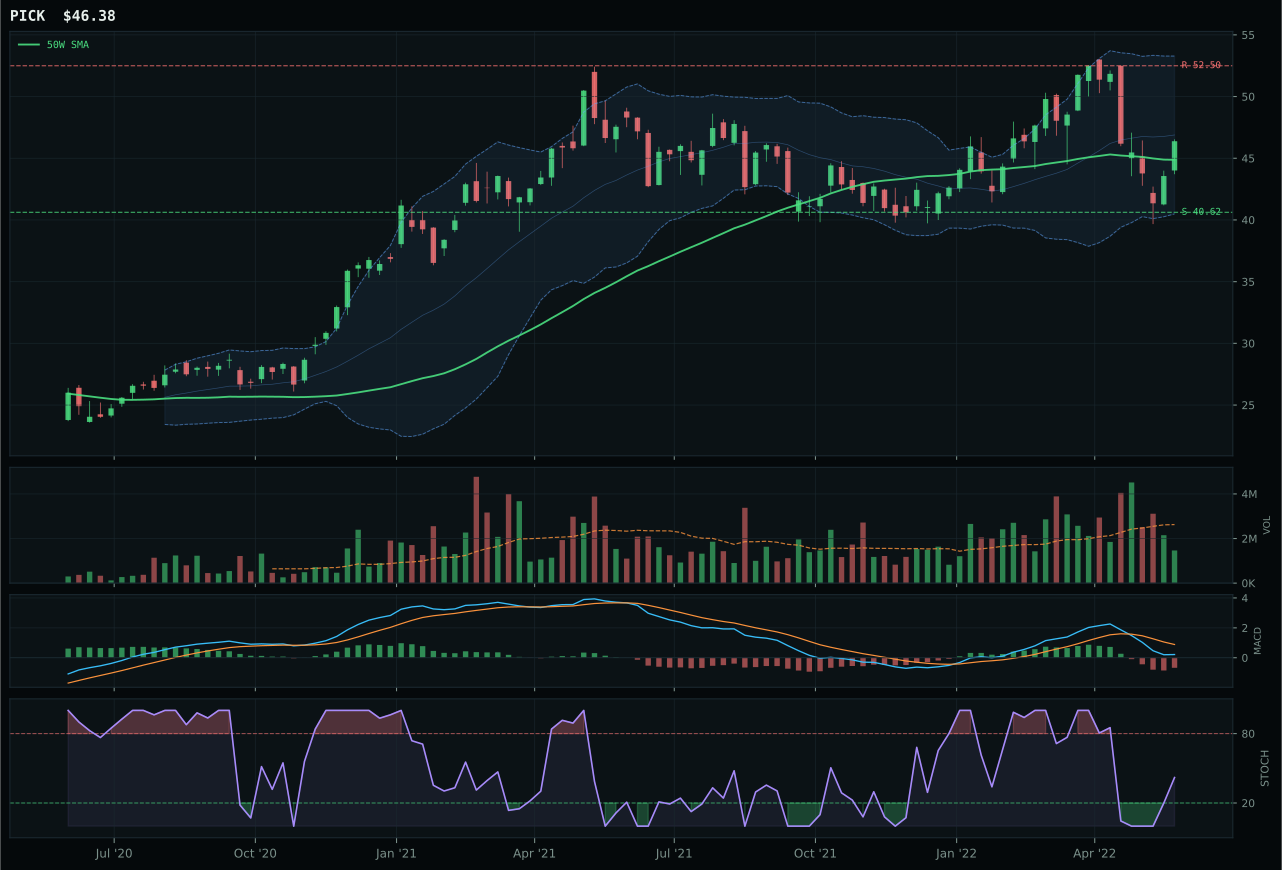
PICK has a neutral structure profile with 2.5% 13-week relative strength versus SPY.
A failed hold above support would weaken the setup.
Actionable but governed by invalidation levels.
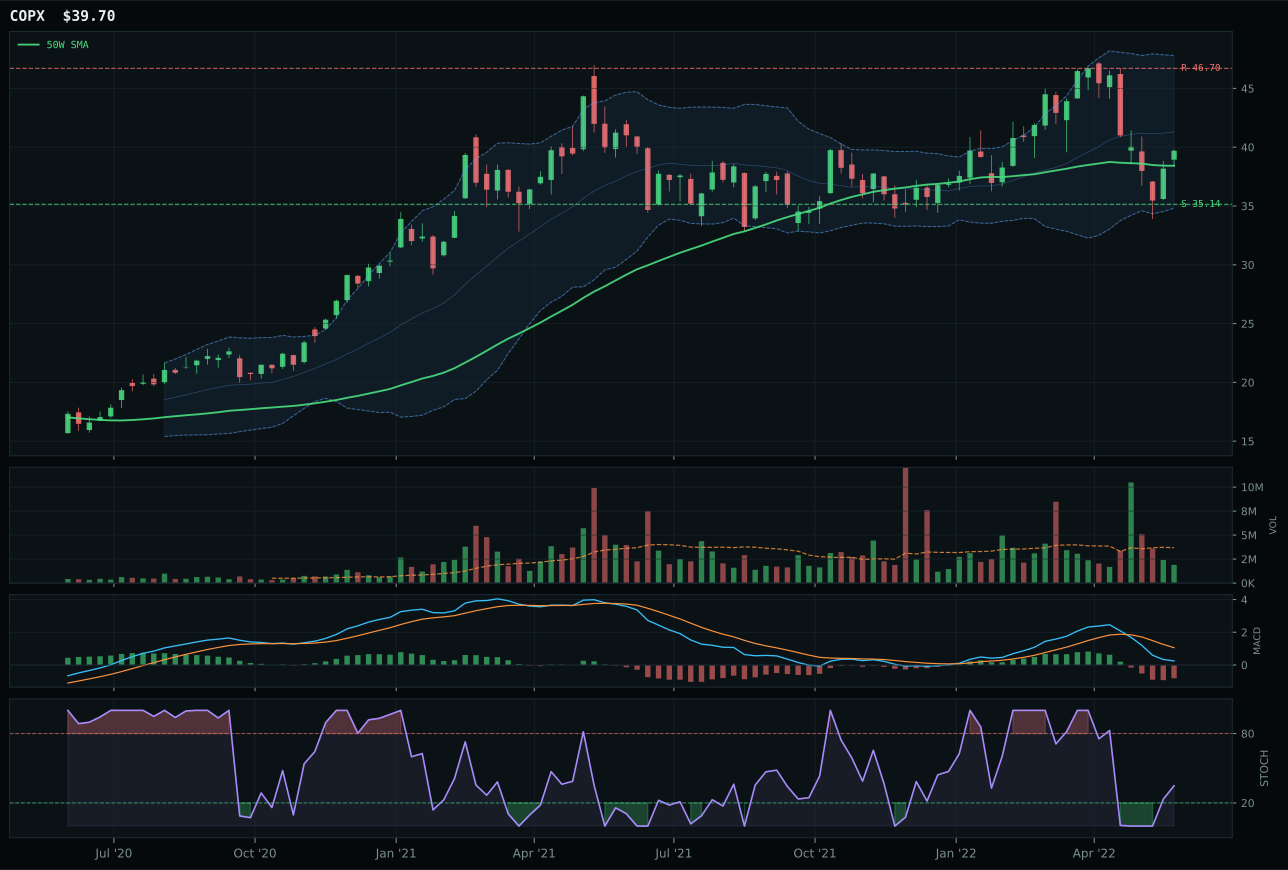
COPX has a neutral structure profile with -0.1% 13-week relative strength versus SPY.
A failed hold above support would weaken the setup.
Actionable but governed by invalidation levels.
COPX won because it delivered the cleanest timing setup on a pullback-into-support decision zone, with a distance-to-50W of 3.3% that offered minimal entry risk and a stochastic rising mid-zone at 0.35 that signaled room for upside without being extended. The timing score of 100 reflects convergence with Fibonacci 0.500 at 40.06, placing price at the exact decision point where accumulation can begin without commitment risk. REMX and PICK both had higher trend scores (77 and 76 respectively), but COPX's 71.9 trend coupled with superior timing beat the more extended alternatives. The trend score of 71.9 on COPX came from price above both moving averages, neutral 50W slope, and RS versus SPY flat at negative 0.1%, indicating neither sponsorship nor headwind. REMX's risk-reward was weaker at 55.8 versus 58.8, and PICK, while showing a 2.5% SPY-relative edge, sat in the same Fibonacci zone without the cleanliness advantage. The 4.5-point margin over REMX reveals this category is tightly competitive, but COPX's timing geometry was decisive.
Industrial Metals earned 5% as tier-2 despite a respectable 53.8 category score because the macro environment is mixed and technical momentum is weak. The category-level macro fit is 75.0/100—helped by late-cycle reflation at positive 10, metals scarcity at positive 14, and real asset sponsorship at positive 6—but liquidity stress at negative 8 is dragging the equation. COPX's technical evidence score of 44.7/100 is too low to push this into top-tier; momentum confirmation at 24.6 and volume-price confirmation at 36.9 show that the sector is not accumulating with conviction. This is a value entry into supply-constrained assets, not a breakout. The 5% slot is justified by the macro case for copper in a reflation environment and the timing clarity of the COPX setup, but it is a builder's position, not a leader's. If volume does not expand and momentum does not improve within 2-3 weeks, this allocation should be rotated into higher-quality setups. The thin participation at 0.51x is the key risk; if MACD rolls over while volume remains weak, the pullback-into-support thesis fails.
Precious Metals — GLD
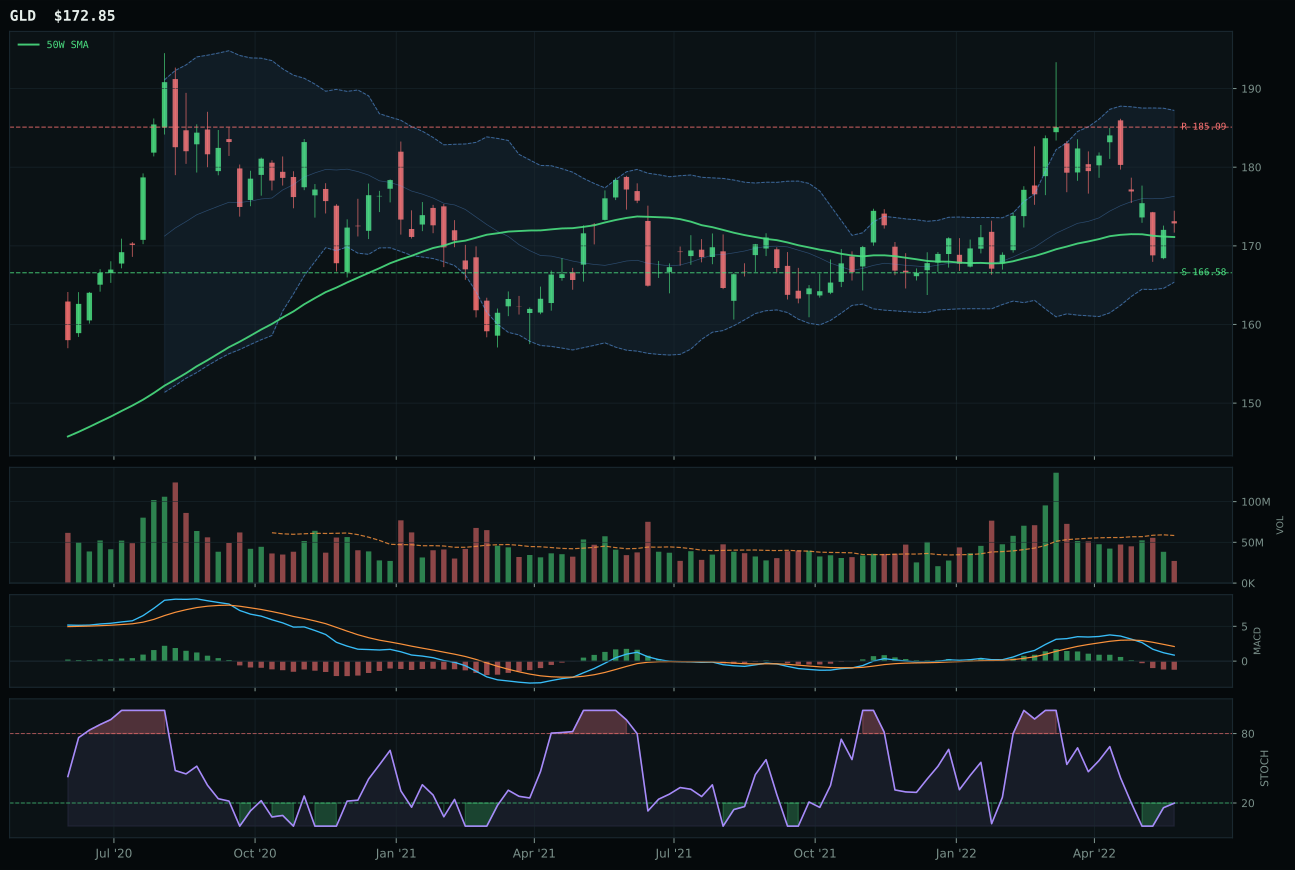
GLD has a pullback into support profile with 3.0% 13-week relative strength versus SPY.
A failed hold above support would weaken the setup.
Actionable but governed by invalidation levels.
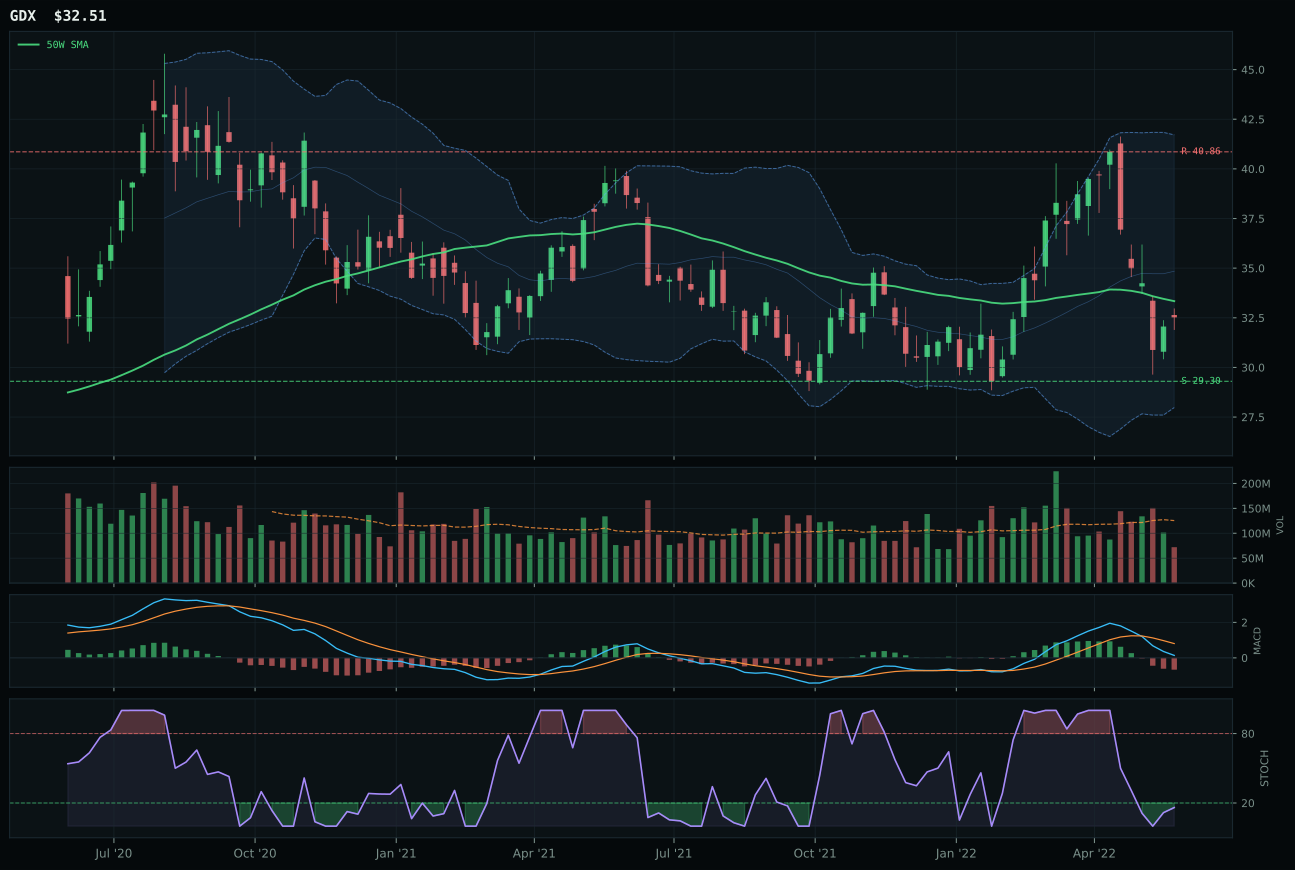
GDX has a compression near 50W profile with -0.3% 13-week relative strength versus SPY.
A failed hold above support would weaken the setup.
Actionable but governed by invalidation levels.
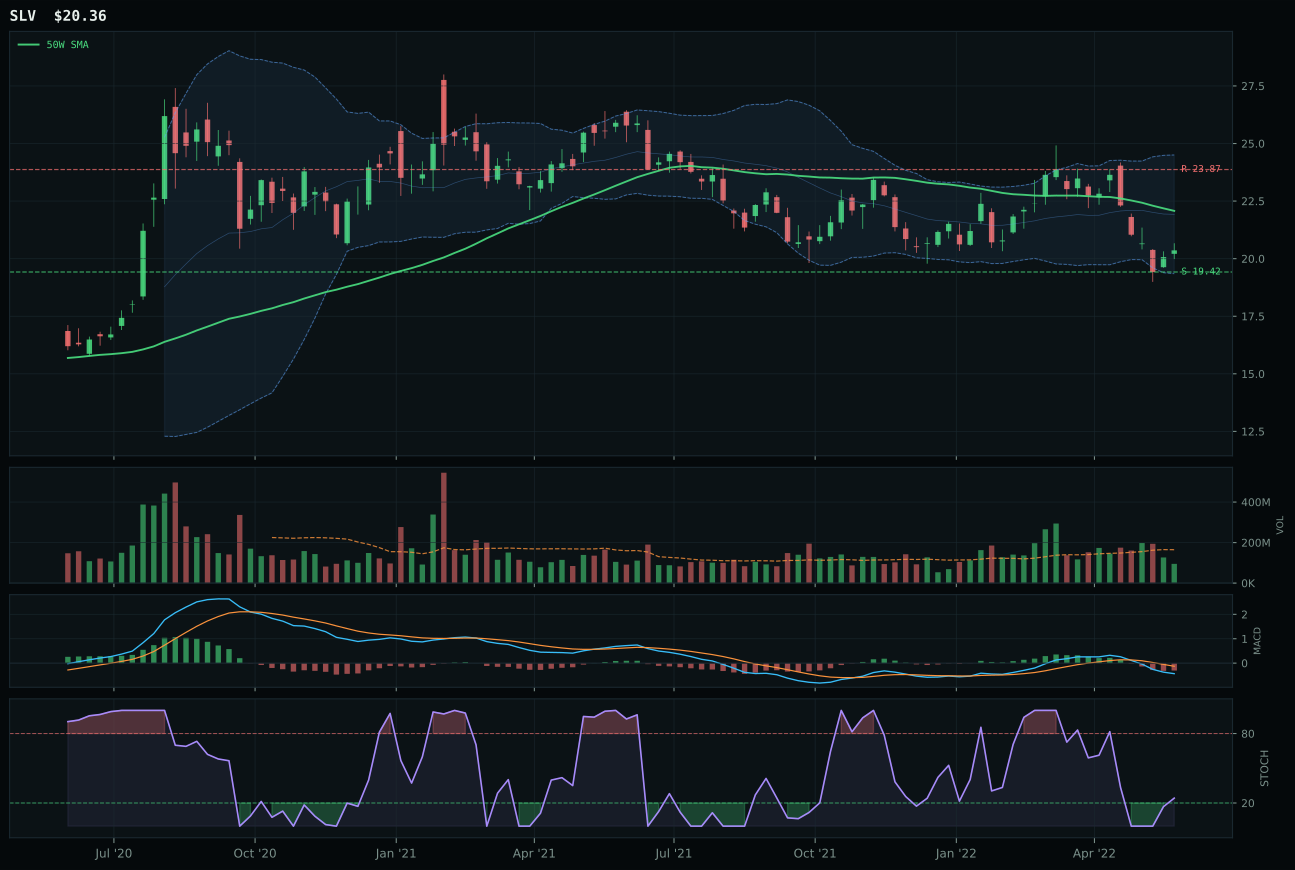
SLV has a pullback into support profile with -4.0% 13-week relative strength versus SPY.
A failed hold above support would weaken the setup.
Actionable but governed by invalidation levels.
GLD won because it offered the tightest timing entry—just 1.0% below the 50W with a stochastic oversold-turn-up at 0.20, placing price at the exact inflection zone where mean reversion becomes a high-probability setup. The timing score of 100 reflects the convergence of MACD bearish/weakening (bottoming) and Fibonacci deep-retracement value zone (0.618 at 173.14), creating a pullback-into-support structure that GDX failed to match. GLD's pullback setup with 70.5 structure quality beat GDX's compression-near-50W at 67.3, and the risk-reward gap of 84.6 versus 71.6 was decisive—84.6 means the 3.8% downside to 166.58 support is tiny relative to the upside to 185.09. GDX lost because of weaker structure and category-relative strength at flat versus GLD's 3.4%, and because miners are leveraged vehicles in a dollar-strong, liquidity-tight regime where the monetary hedge (pure gold) outperforms the equity play. The 32.5-point gap made this a landslide.
Precious Metals earned 5% as tier-2 because the macro fit at 74.0/100 was strong (monetary hedge bid at positive 14, defensive rotation at positive 7) but the technical evidence was moderate at 49.1/100, insufficient to crack top-two against energy and agriculture. GLD's trend score of 76.6 and timing of 100 are solid, but momentum confirmation at 40.2 and volume-price confirmation at 44.4 reveal that accumulation is restrained; this is a defensive rotation play, not a breakout. The 5% allocation makes sense as portfolio insurance against further liquidity stress and broad market deterioration—the active monetary hedge bid descriptor is working, and the stochastic oversold-turn-up on GLD offers a lower-risk entry than chasing stretched sectors. However, thin participation at 0.47x means conviction is not yet being tested; if this allocation is to graduate to tier-1, volume must expand and MACD must begin turning up, not just bottoming. For now, it is a hold to hedge, not a buy to lead.
Defense & Aerospace — ITA
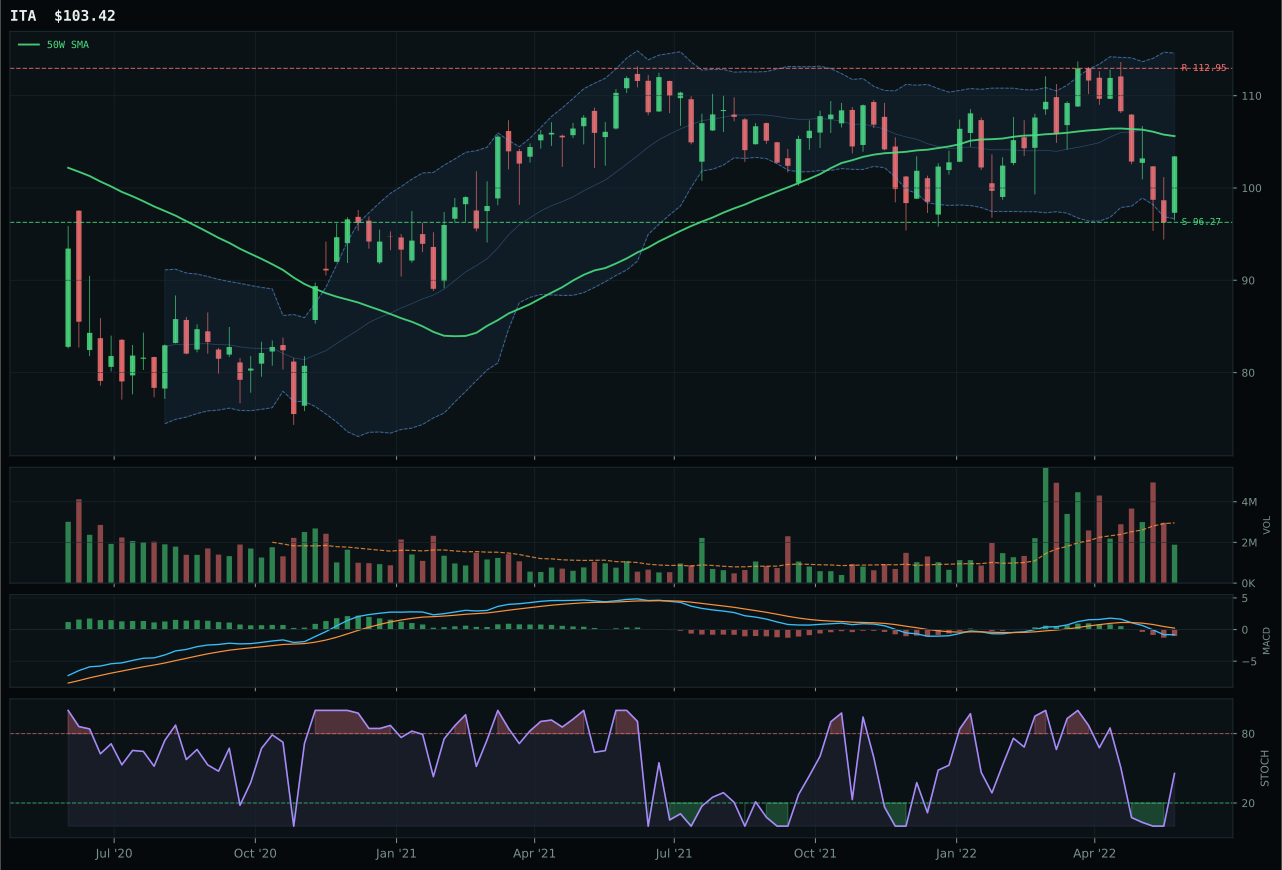
ITA has a compression near 50W profile with 1.2% 13-week relative strength versus SPY.
A failed hold above support would weaken the setup.
Actionable but governed by invalidation levels.
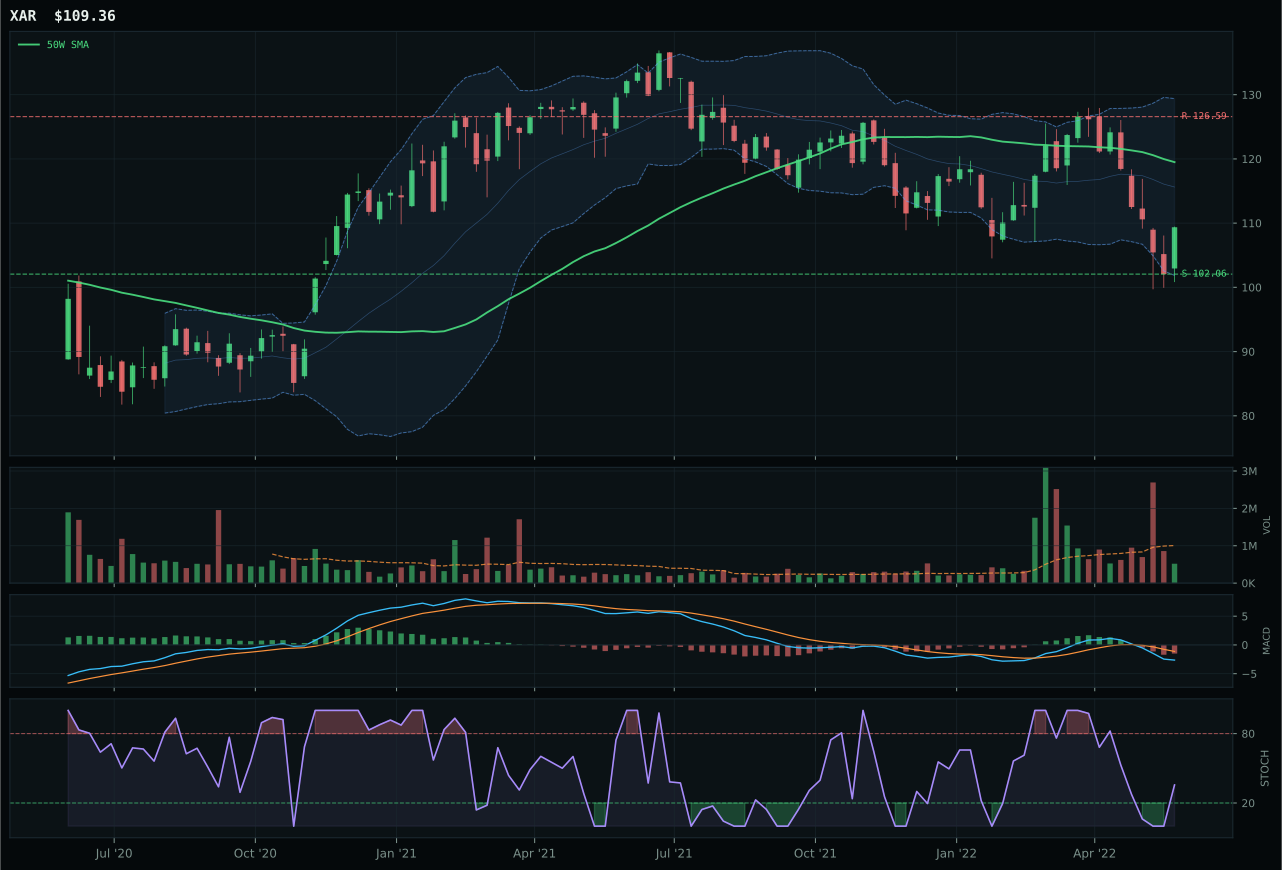
XAR has a neutral structure profile with -1.7% 13-week relative strength versus SPY.
A failed hold above support would weaken the setup.
Actionable but governed by invalidation levels.
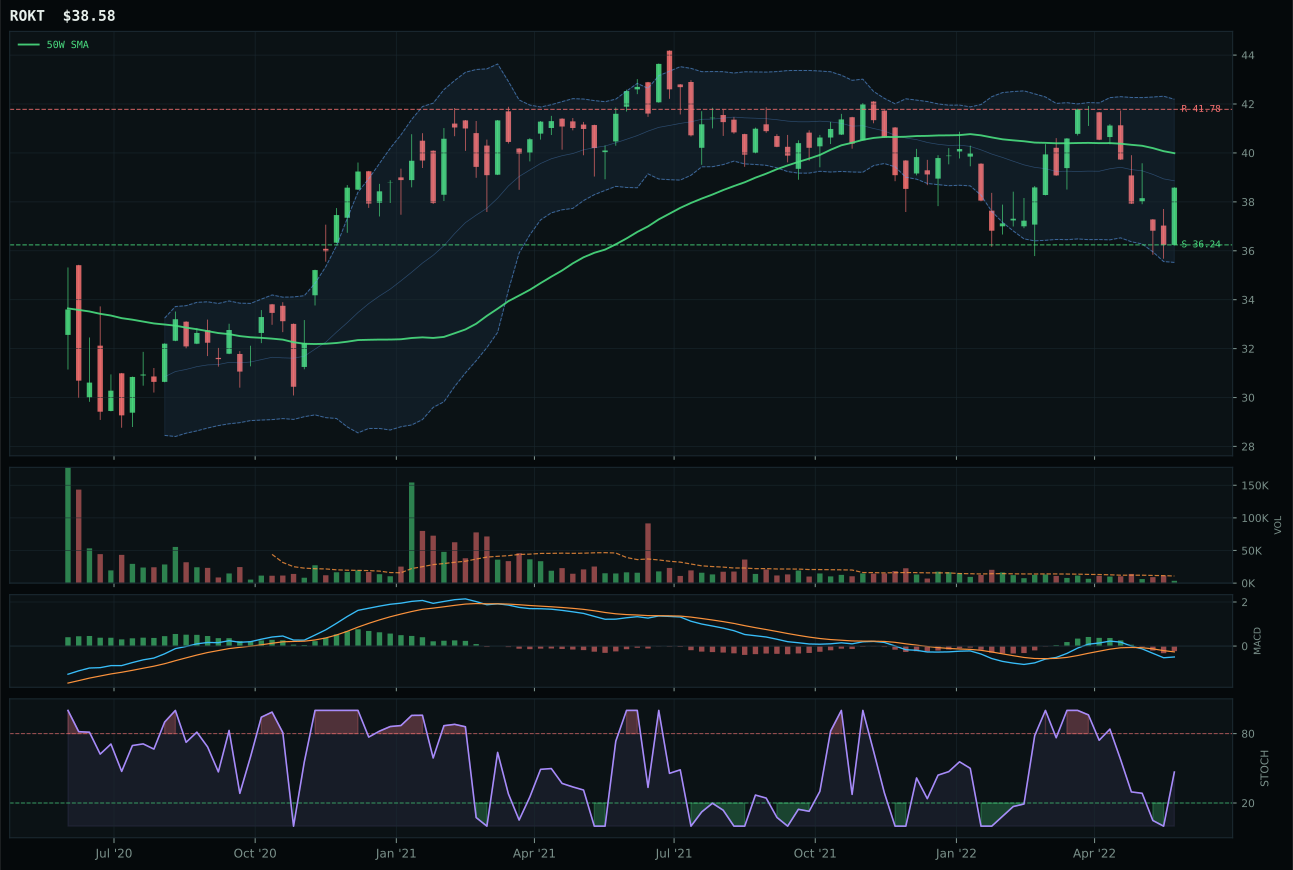
ROKT has a neutral structure profile with 5.1% 13-week relative strength versus SPY.
A failed hold above support would weaken the setup.
Tracked, but not top-2 eligible because: .
ITA won because it delivered a perfect-score timing setup—distance to 50W at negative 2.1%, exactly where pullbacks into compression become breakout opportunities, combined with a 100.0 timing score that reflected the Fibonacci zone, improving stochastic, and the prospect of range expansion if 96.27 support holds. The structure score of 65.8 benefited from compression near the 50W (73.3 compression ratio) rather than neutral sprawl, giving the setup a defined breakout level with risk management clarity. XAR lost on timing (85 versus 100), structure cleanliness (61.9 versus 65.8), and category-relative strength at negative 2.9% versus flat on ITA—subtle but cumulative disadvantages. Momentum confirmation at 30.5 is weak across the board, reflecting the sector's overall sluggishness, but ITA's superiority in placement near a decision point (Fib 0.500 at 104.06) gave it the edge when absolute momentum was not available. The 23.7-point score gap made this a clean category decision.
Defense & Aerospace earned 5% as tier-2 despite a solid 37.4 category score because two higher-ranking categories claimed the top-two slots. The macro fit here was actually strong at 70.0/100, driven by active defensive rotation, broad market bear, and late-cycle reflation conditions all favoring real assets and defensive equities—yet the technical evidence from the three-ETF basket (ITA, ROKT, XAR) was modest enough at 44.2/100 for ITA, the winner, that the combined score could not crack the top tier. This is instructive: macro can lift a category's rank, but weak technical sponsorship and thin volume (0.64x on ITA) keep it from overweight allocation when other categories show superior breadth and momentum. The positioning makes sense as a core defensive sleeve given the bear market setup, but the lack of volume follow-through and MACD weakness means this is a hold-not-add opportunity. It would upgrade to tier-1 if above-average participation returned and 50W slope began reversing higher.
Nuclear Energy — URA
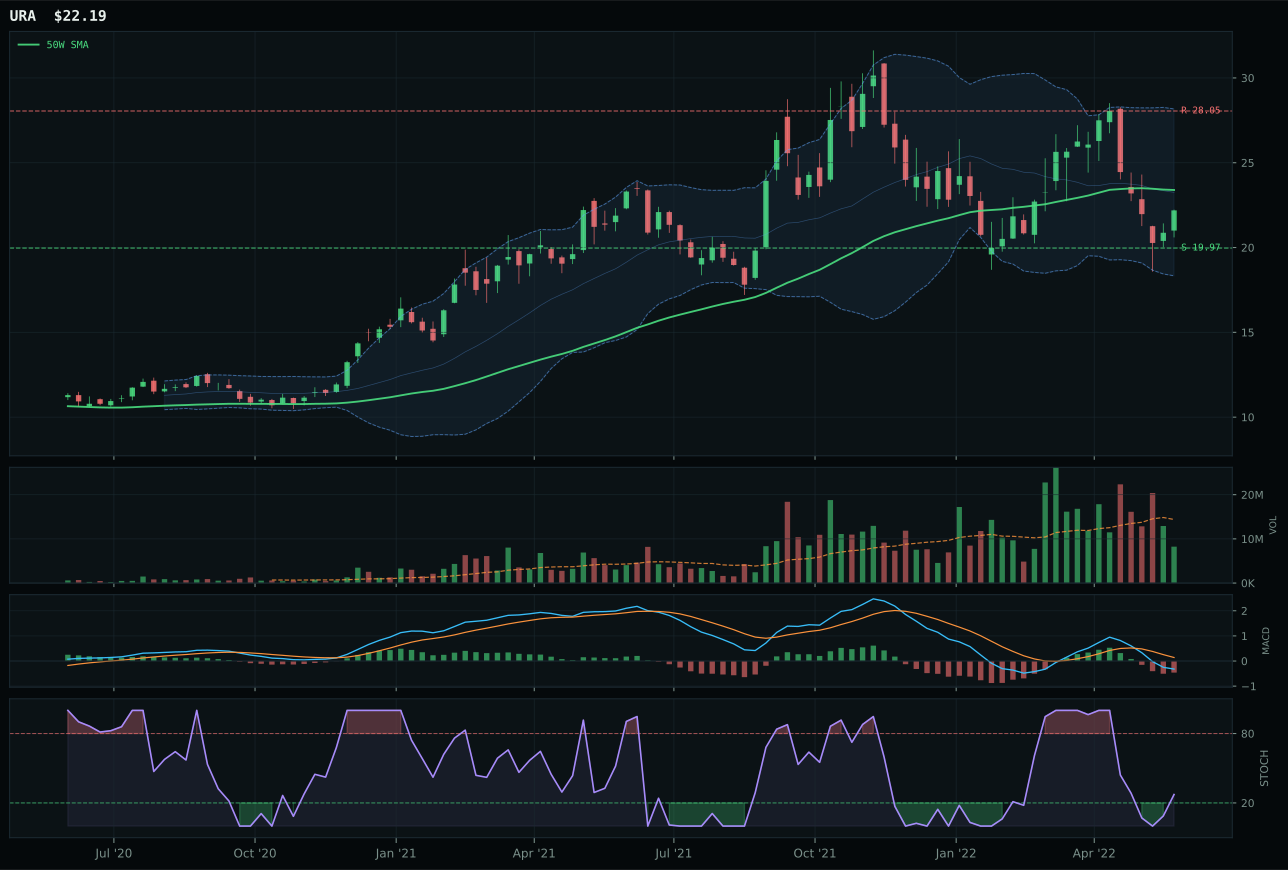
URA has a neutral structure profile with 2.8% 13-week relative strength versus SPY.
A failed hold above support would weaken the setup.
Actionable but governed by invalidation levels.
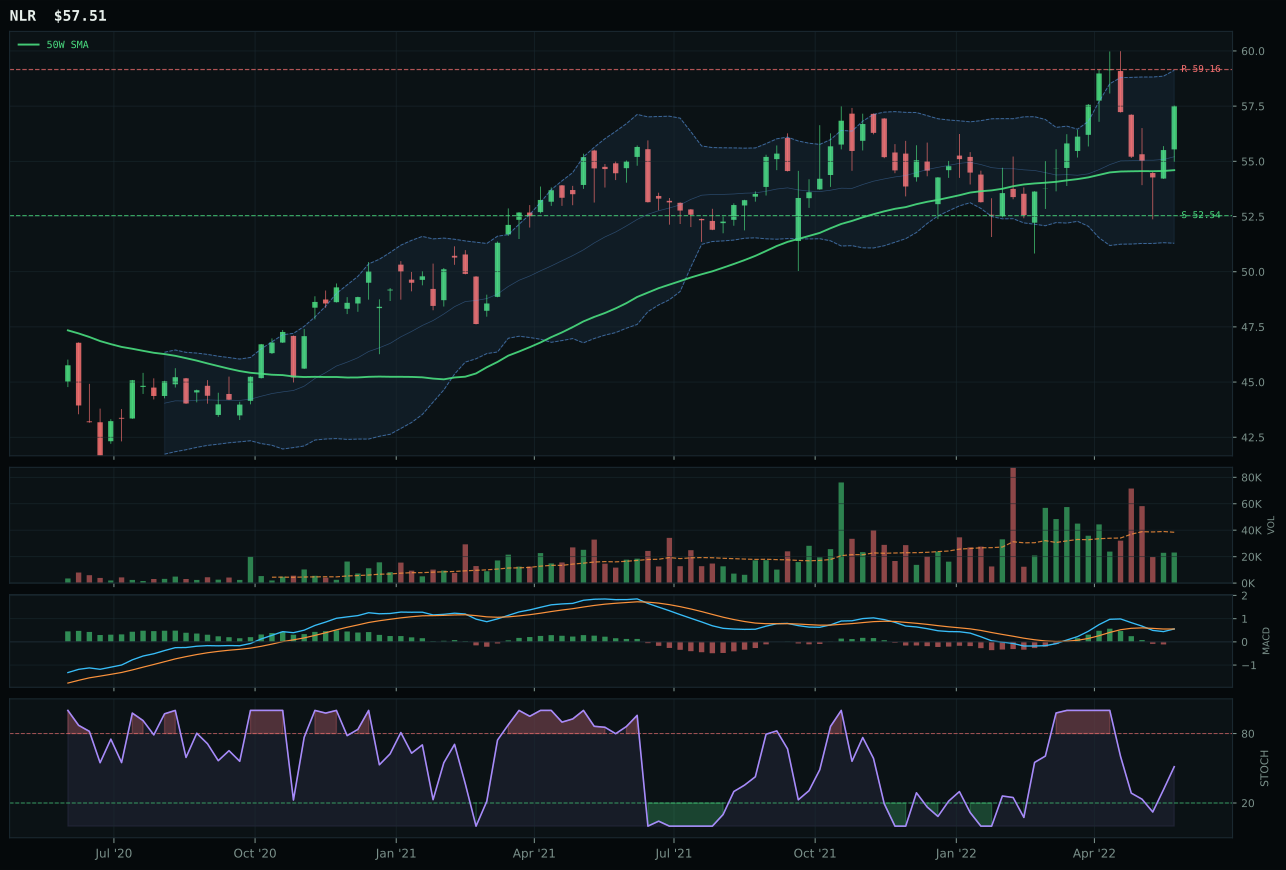
NLR has a neutral structure profile with 12.4% 13-week relative strength versus SPY.
A failed hold above support would weaken the setup.
Tracked, but not top-2 eligible because: .
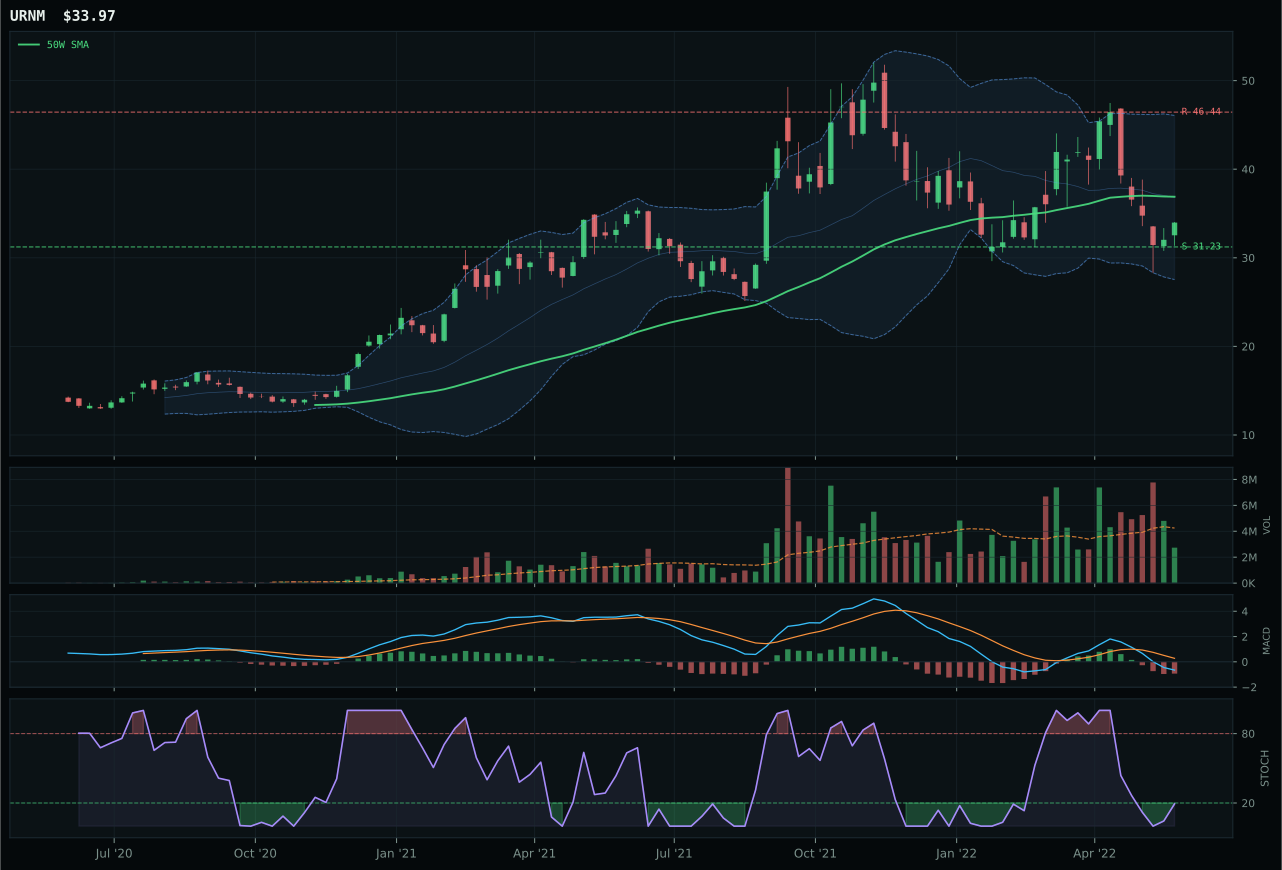
URNM has a neutral structure profile with 0.3% 13-week relative strength versus SPY.
A failed hold above support would weaken the setup.
Actionable but governed by invalidation levels.
URA won because it offered the superior timing geometry despite being down 2.3% on 13 weeks—a clean pullback-into-value setup with a 5.1% distance below the 50W that placed price near the Fibonacci deep-retracement zone (0.618 at 22.72) without requiring faith in a technical bounce. The timing score of 85 versus NLR's 78 reflected URA's position closer to the 50W support level where mean reversion becomes credible, while NLR's 5.3% extension above the 50W meant it was already paid for. NLR's momentum confirmation score of 100 looks compelling—it has positive 7.2% 13W return and positive RS versus SPY—but in a bear market with risk appetite broken, strength is a liability, not an asset. URA's 0.0% category-relative strength matched the median but offered a tighter entry, and its risk-reward at 71.8 versus NLR's 50.3 made the trade geometry much cleaner. The setup gap narrowed the win margin because neither name showed volume conviction, but URA's value-zone position beat NLR's momentum exhaustion.
Nuclear Energy earned 5% as tier-2 because the category scored 37.0, and while the macro fit was respectable at 65.0/100 (energy scarcity, real asset sponsorship, late-cycle reflation all positive), the technical evidence from the three-name basket was weak at 33.4/100 for the winner, URA. Momentum confirmation at 26.0 and volume-price confirmation at 35.4 on URA show that accumulation is tentative; this is a value hold, not a momentum builder. The macro case for nuclear is solid in a late-cycle, energy-scarce regime, but execution is missing. Unlike energy and agriculture, nuclear lacks the volume and momentum confirmation that would justify overweight. It stays at 5% as a diversified real-asset hedge within the broader energy/commodity allocation, but it would need to show volume expansion and MACD improvement to earn consideration for top-tier. The positioning reflects the allocator's view that nuclear is a long-term story (energy scarcity is real) but not a near-term catalyst, and in a regime where cash flow matters, that distinction keeps it from higher tiers.
Technology — XLK
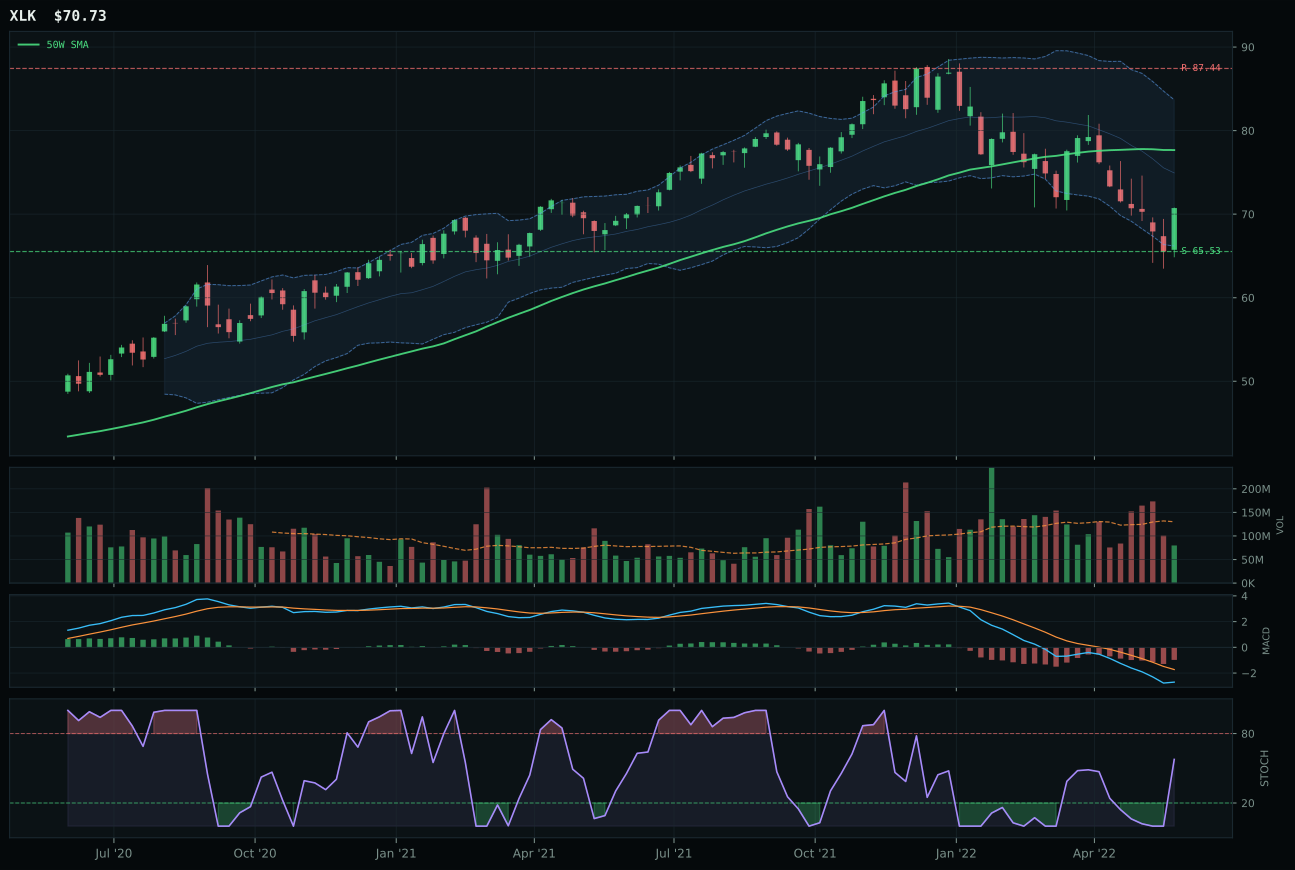
XLK has a neutral structure profile with -3.2% 13-week relative strength versus SPY.
A failed hold above support would weaken the setup.
Actionable but governed by invalidation levels.
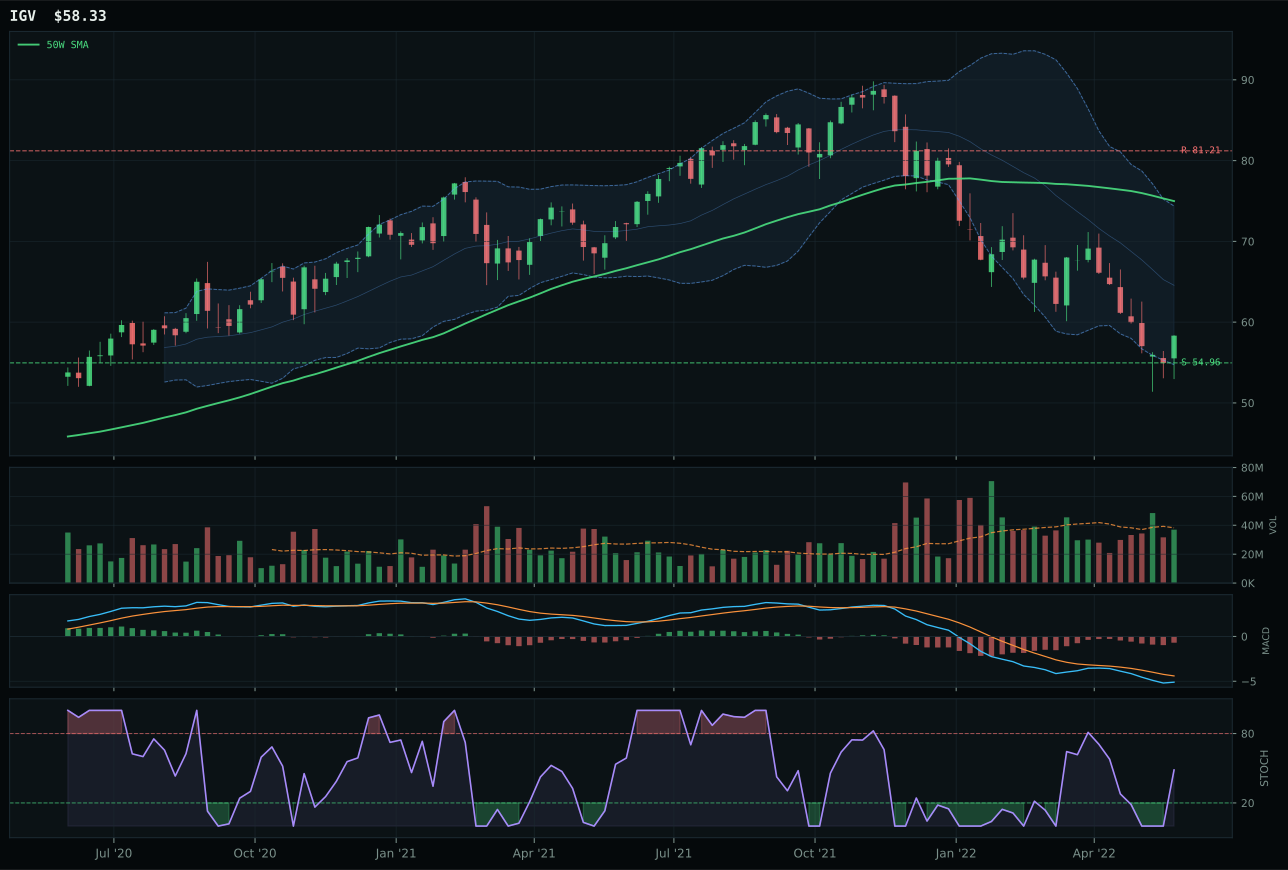
IGV has a neutral structure profile with -8.8% 13-week relative strength versus SPY.
A failed hold above support would weaken the setup.
Actionable but governed by invalidation levels.
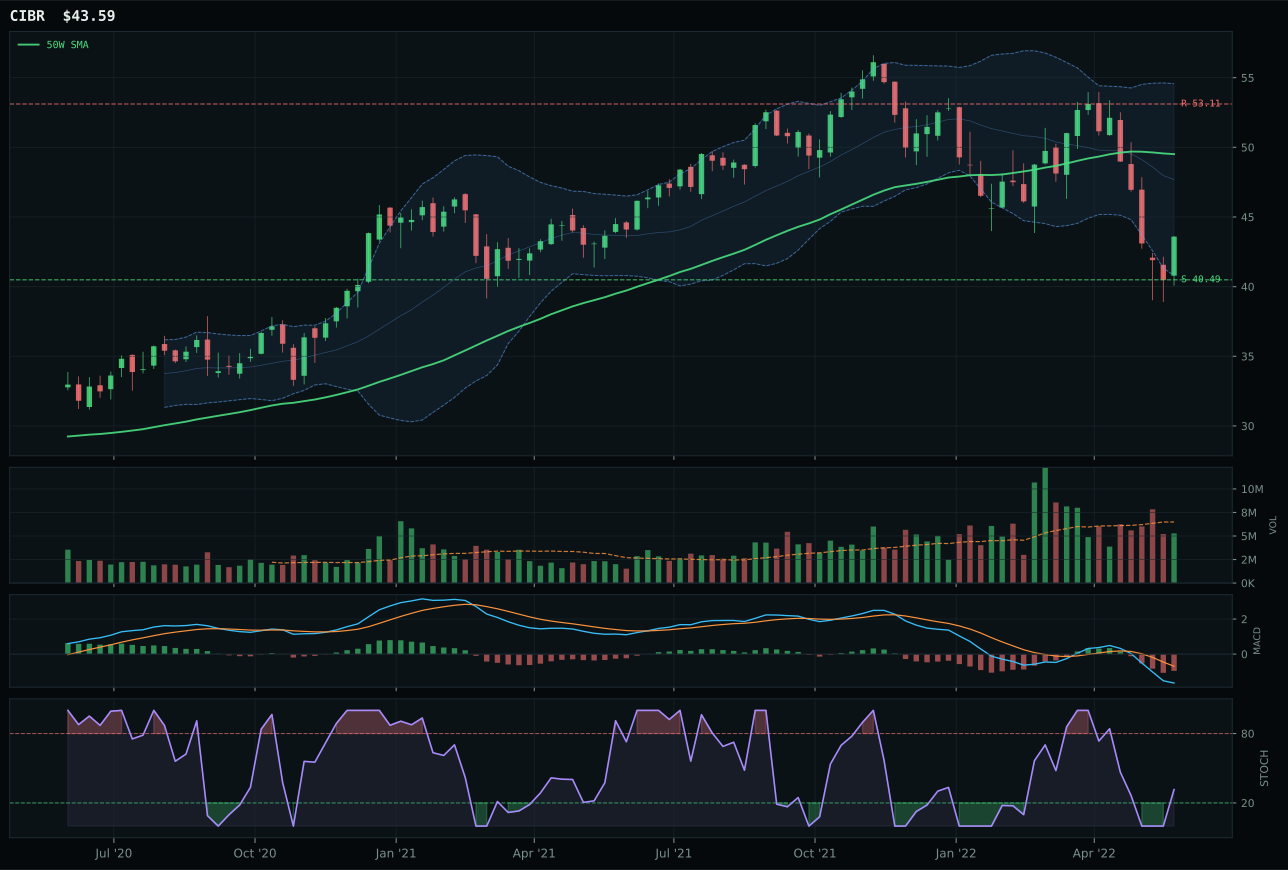
CIBR has a neutral structure profile with -5.5% 13-week relative strength versus SPY.
A failed hold above support would weaken the setup.
Actionable but governed by invalidation levels.
XLK captured the category because it delivered the cleanest reset among the three candidates, sitting 8.9% below the 50W while maintaining structural integrity above the 200W—a pullback, not a breakdown. The 2.3% category-relative strength versus IGV's negative 3.3% RS reveals which ETF is holding sponsorship inside the basket; XLK's timing score of 90 versus IGV's 58 reflects the difference between a stochastic rising into mid-zone with MACD beginning to improve and a setup that is weakening and deteriorating. Risk-reward was decisively better at XLK (96.3 versus 75.0), meaning the downside to support at 7.9% offers genuine protection while the move to 87.44 resistance is priced with enough room to make the asymmetry credible. Volume at 0.61x participation is thin but not rejecting, and the category-relative score gap of 43.4 points left no ambiguity about leadership.
Technology earned 5% allocation as tier-2, sitting outside the top-two cut despite a technically constructive setup because the macro regime and active descriptors penalized the entire category. Liquidity stress and dollar pressure were the primary headwinds, each scoring negative weights that compressed the category-level macro fit to just 31.0/100. The late-cycle reflation backdrop does not favor duration-exposed growth trades, and with broad market bear and risk-appetite deterioration active in the descriptor set, the allocator needed evidence of true accumulation rather than mere bounce potential. XLK's neutral structure and improving stochastic offer reasonable entry geometry, but without MACD confirmation or above-average volume participation, the case for overweighting proved insufficient against energy and agriculture names showing exponential strength. This tier-2 allocation would move to zero if 50W slope turns negative or if stochastic begins falling again; momentum confirmation at 37.5 is weak enough that persistence could evaporate quickly.
AI — SMH
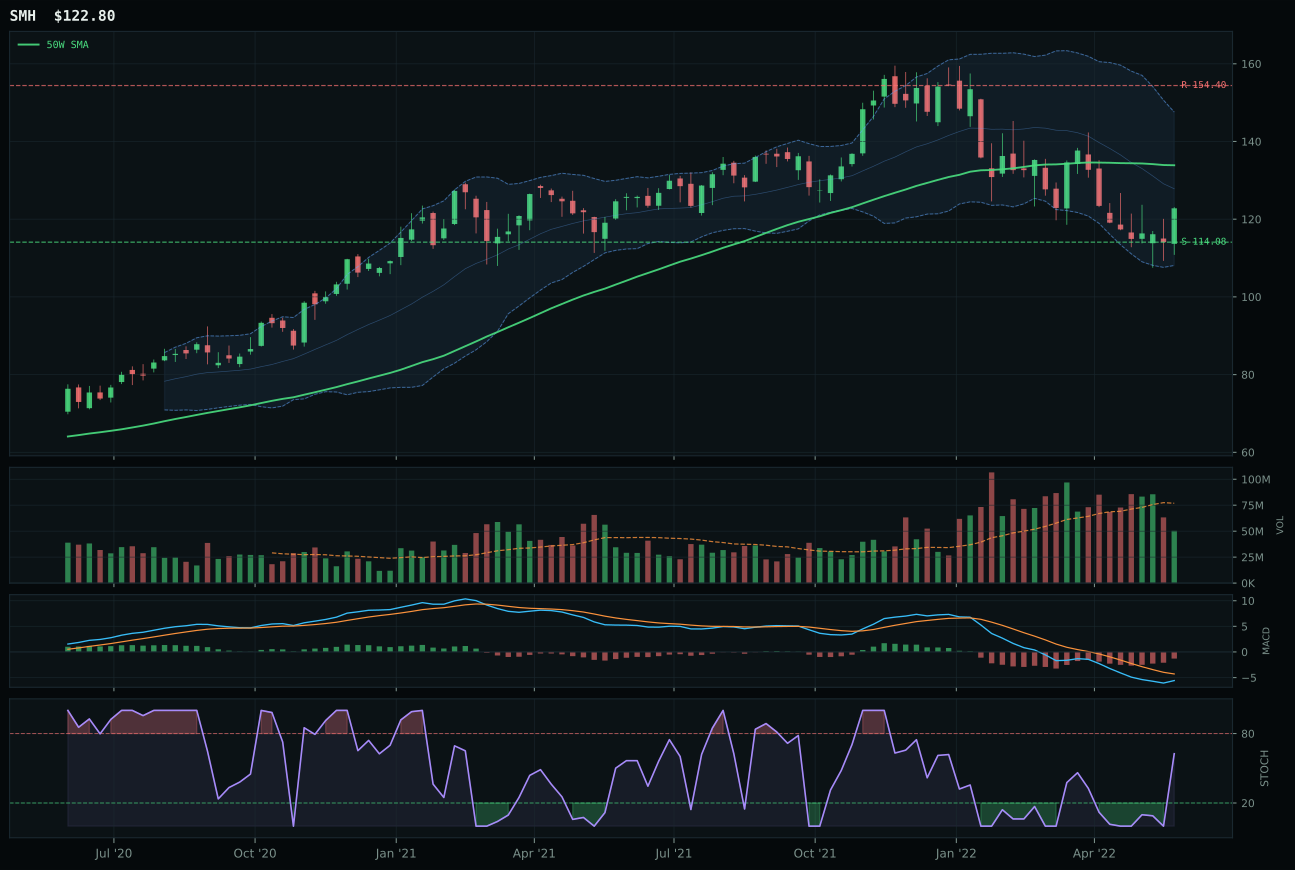
SMH has a neutral structure profile with -4.1% 13-week relative strength versus SPY.
A failed hold above support would weaken the setup.
Actionable but governed by invalidation levels.
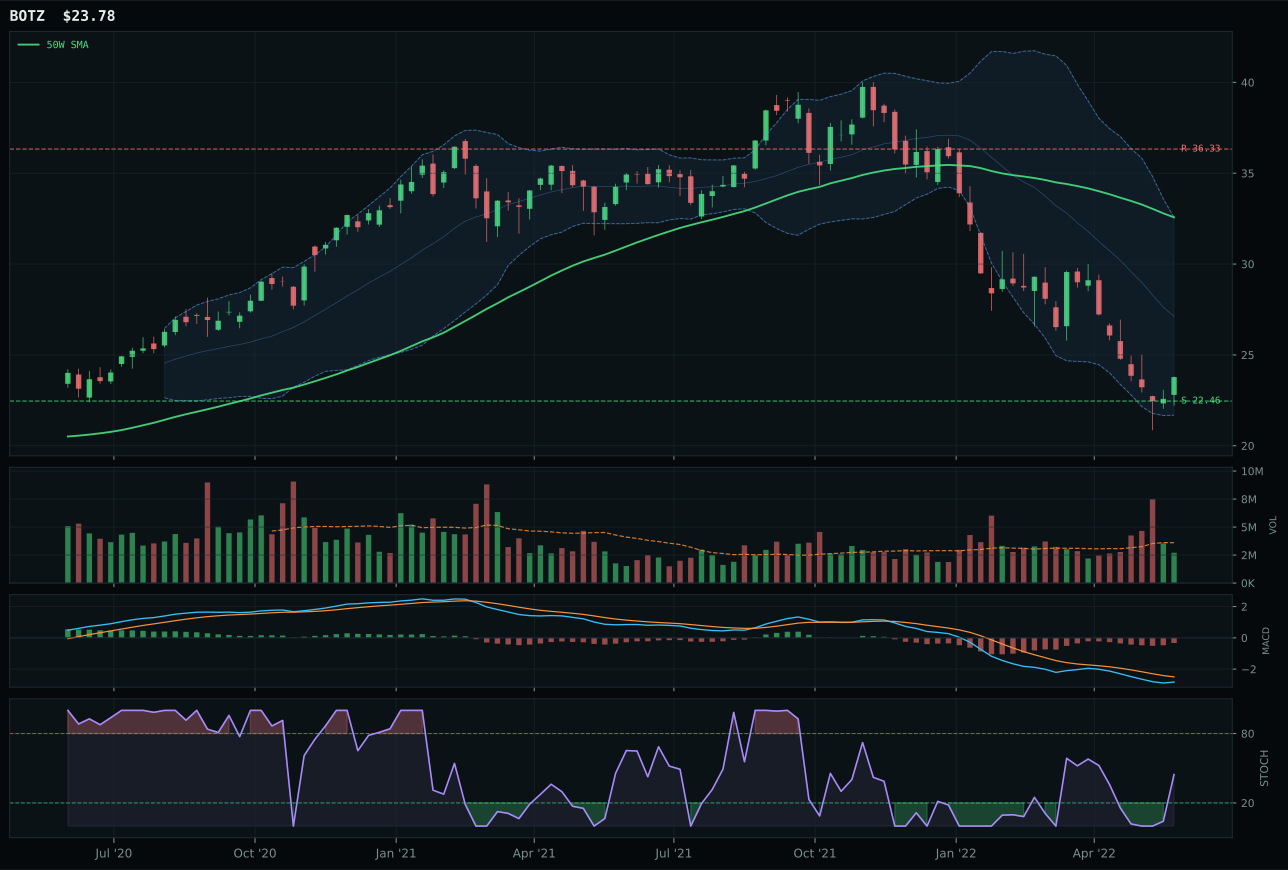
BOTZ has a neutral structure profile with -13.7% 13-week relative strength versus SPY.
A failed hold above support would weaken the setup.
Actionable but governed by invalidation levels.
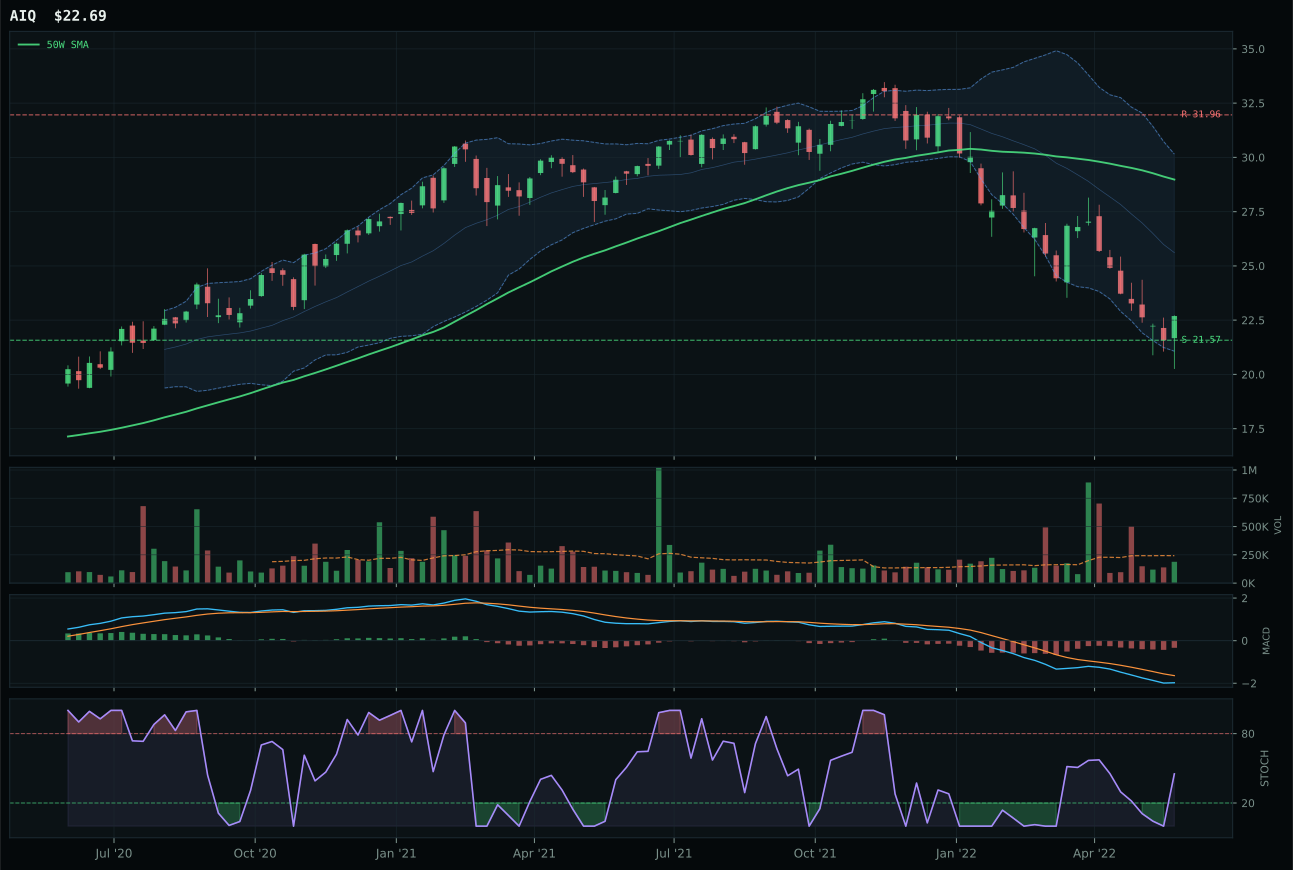
AIQ has a neutral structure profile with -10.0% 13-week relative strength versus SPY.
A failed hold above support would weaken the setup.
Tracked, but not top-2 eligible because: .
SMH won the category by out-timing BOTZ on a pullback setup that benefited from stronger four-week momentum (6.9% return versus BOTZ's negative trajectory) and 5.9 points of category-relative strength that proved decisive. Both sat below the 50W in value-zone Fibonacci levels, but SMH's timing score of 90 versus BOTZ's 63 reflected the distance-to-50W edge and a stochastic that was rising with less overhead resistance. The trend score favored SMH at 61.9 versus BOTZ's 33, driven by SPY-relative RS of negative 4.1% versus negative 13.7%—a meaningful gap that told the story: SMH is being held better by the current buyer set than robotics cyclicality plays. MACD bearish-but-improving on both, but BOTZ suffered from broader weakness in the AIQ proxy, which ranked below SMH in the reasoned proof order. The 30-point score gap left room for neither debate nor reinvestment.
AI received 0% allocation and ranked outside the eight-slot portfolio entirely because the macro regime is actively hostile to this category's secular narrative. The category-level macro fit stood at just 26.0/100, dragged down by liquidity stress at negative 12, broad market bear at negative 8, and dollar pressure at negative 4—each a material headwind in late-cycle reflation when capital is rotating away from speculative growth and toward real assets. SMH's technical setup, while sound on its own merit, could not overcome the structural market environment; even with a 54.2/100 technical evidence score, the 33.0/100 macro fit was too weak to justify portfolio inclusion. This category would require either a macro reset toward risk-on conditions or a rotation away from liquidity tightening before it earns a slot. Until then, the AI thesis remains compelling at the single-name level but is penalized as a portfolio holding by the current regime's descriptor profile.
Emerging Markets — ILF
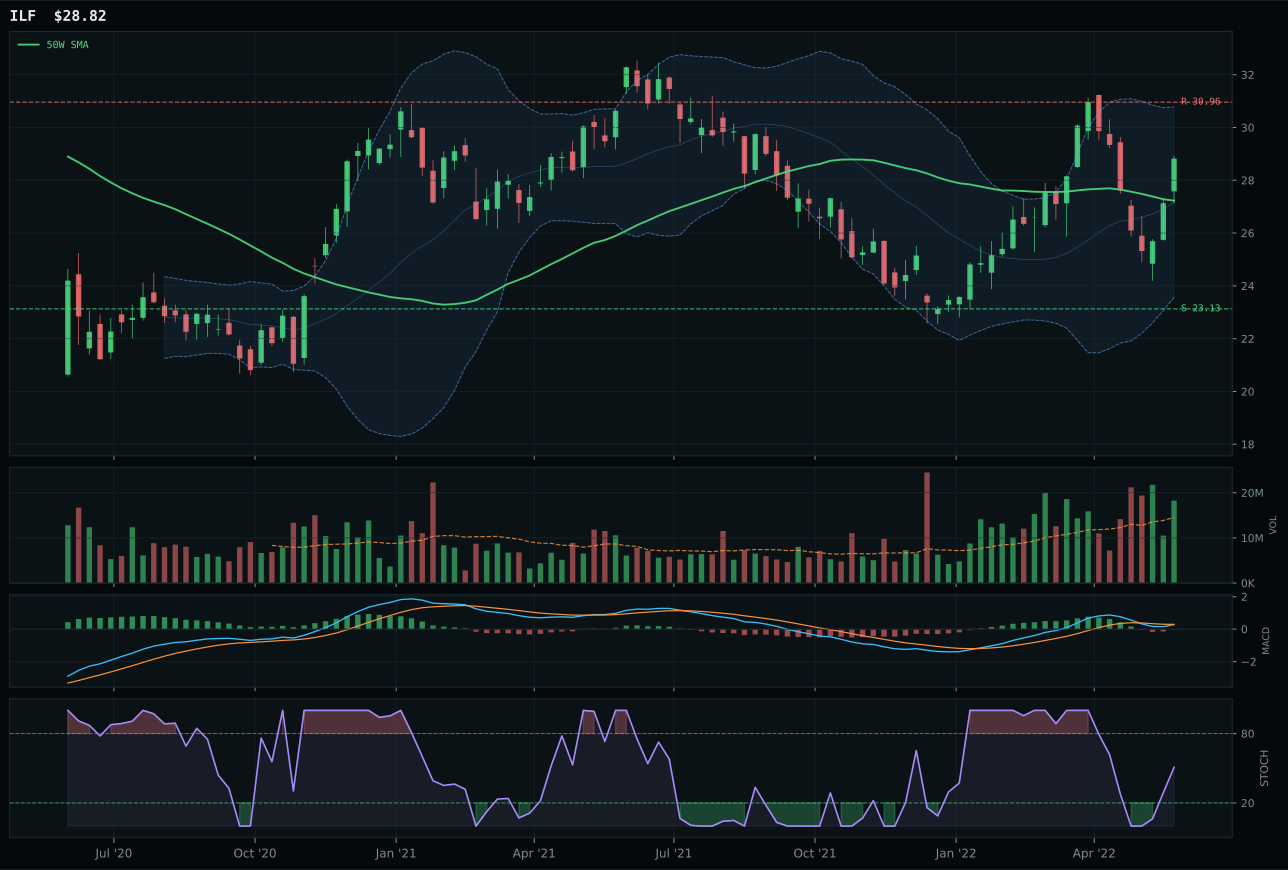
ILF has a neutral structure profile with 13.4% 13-week relative strength versus SPY.
A failed hold above support would weaken the setup.
Actionable but governed by invalidation levels.
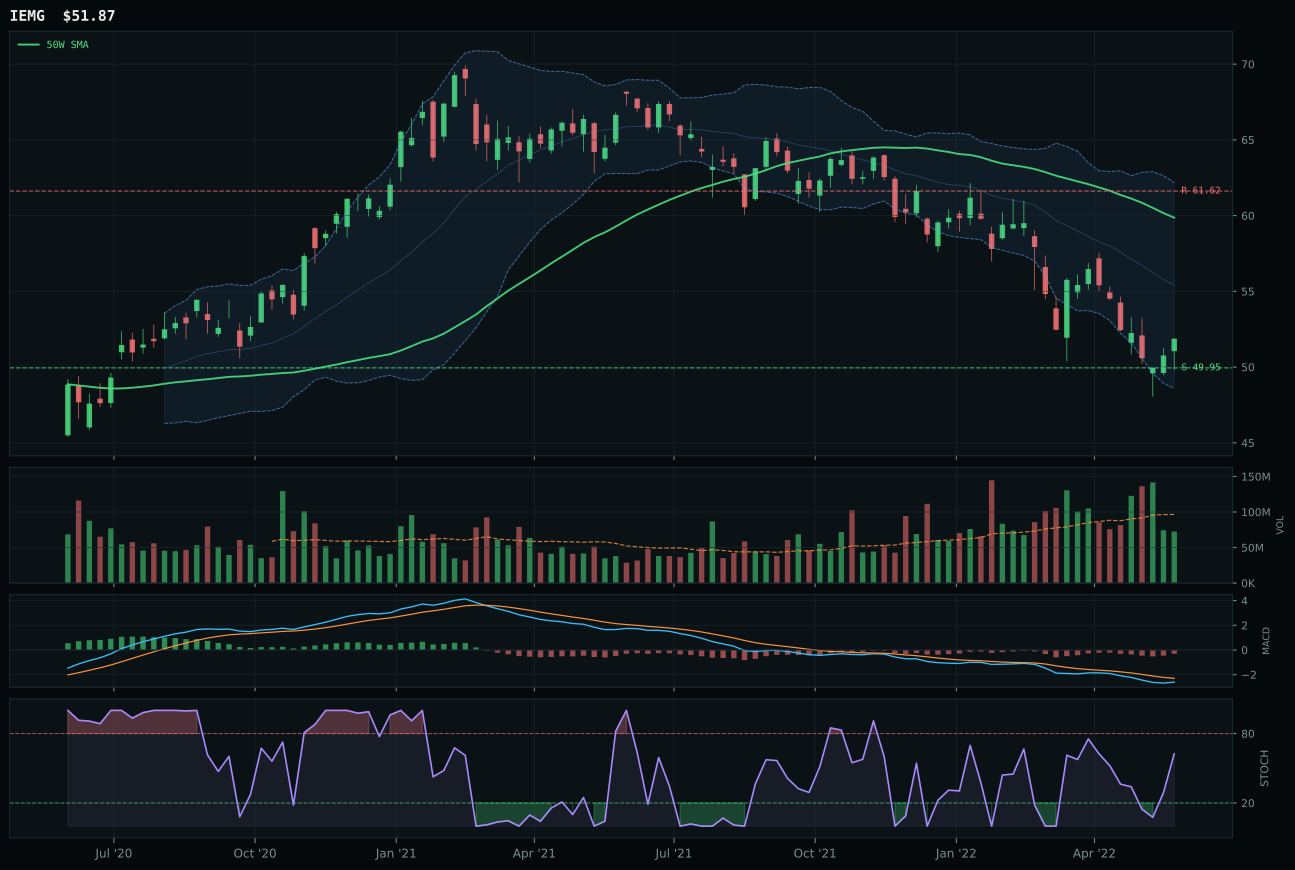
IEMG has a pullback into support profile with -5.3% 13-week relative strength versus SPY.
A failed hold above support would weaken the setup.
Actionable but governed by invalidation levels.
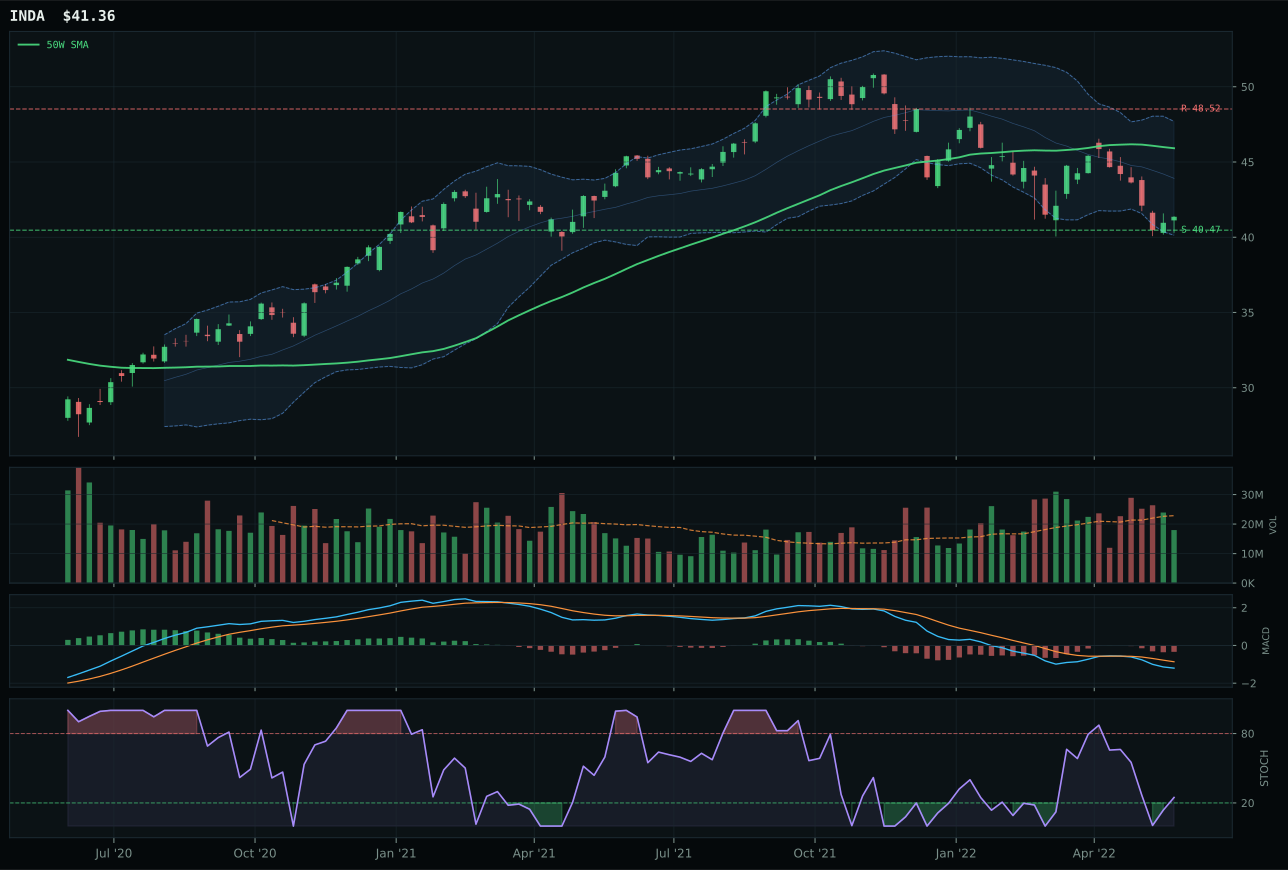
INDA has a pullback into support profile with -1.1% 13-week relative strength versus SPY.
A failed hold above support would weaken the setup.
Actionable but governed by invalidation levels.
ILF won the category despite Emerging Markets earning 0% allocation because it delivered superior volume participation (1.26x versus IEMG's neutral) and category-relative strength (14.5% versus IEMG's negative 4.2%) that proved decisive. Both are above their moving averages and showing positive momentum, but ILF's timing at 78 versus IEMG's 73 reflected the difference between a 5.8% distance to the 50W (upper momentum zone) and IEMG's sharper pullback (near 52W low). ILF's structure score of 72.3 beat IEMG's 65.5, and the 13W return of 8.3% with above-average participation meant accumulation was real, whereas IEMG's negative 10.5% 13W return with neutral volume showed rejection, not coiling. The momentum confirmation score of 100 on ILF versus 26 on IEMG was the key gap; Latin America commodity beta with 14.5% category outperformance is a legitimate trade, while broad emerging-market beta at negative 5.3% SPY-relative is just getting hit harder in a bear market. The 26.5-point score gap made this category decision clear.
Emerging Markets earned 0% allocation because the category scored just 10.9, and the macro regime is actively hostile to EM exposure. Dollar pressure at negative 14, liquidity stress at negative 10, and broad market bear at negative 9 compressed the category-level macro fit to just 17.0/100—the weakest in the dataset. ILF's strong technical case at 72.0/100 evidence cannot overcome structural dollar strength and capital flight; in late-cycle reflation with liquidity tightening, EM is where capital leaves first. Yes, ILF showed above-average participation and positive 13W momentum, but that is contrarian positioning—it is the one thing working in a broken category, not a catalyst for inclusion. This category would need a multi-week dollar weakness trade or an explicit reset in risk appetite before earning a portfolio slot. Until then, even the best EM name sits on the sideline because the regime does not permit the risk. The 0% allocation is not a technical rejection of ILF; it is a macro veto of the entire category.