
2022-05-20
Informational purposes only. The content in this report, including allocations, analysis, and commentary, is provided solely for informational and educational purposes. It does not constitute financial advice, investment advice, trading advice, or any other type of advice. Past performance does not guarantee future results. Always conduct your own research and consult a qualified financial professional before making investment decisions.
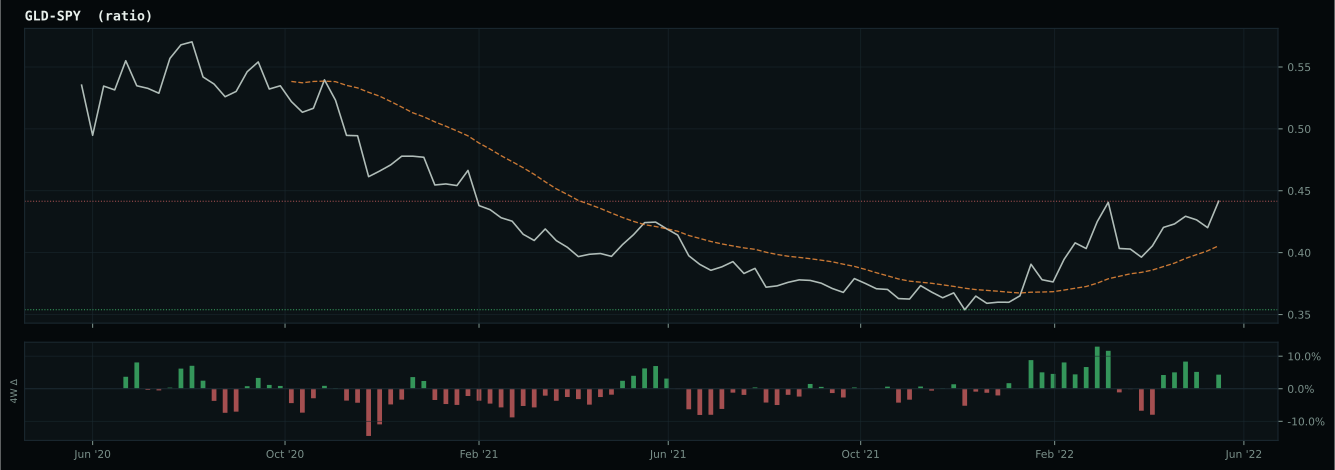
GLD defensive overlay excluded: price is below its 8W SMA. Cause selector will use cash alternative.
Fast-crash circuit breaker triggered: SPY dropped more than 8% from its 4-week high this week. Defensive overlay activated immediately.
Macro risk engine requires the 50% Defensive overlay for this run; payload selected by cause: Inflation Scarcity.
Weekly Allocation
| Ticker | Category | Weight | Role |
|---|---|---|---|
| XLE | Traditional Energy | 60% | Overlay |
| WEAT | Agriculture & Livestock | 10% | Top-2 (10%) |
| COPX | Industrial Metals | 5% | Tier-2 (5%) |
| IGF | Utilities & Infrastructure | 5% | Tier-2 (5%) |
| GLD | Precious Metals | 5% | Tier-2 (5%) |
| URA | Nuclear Energy | 5% | Tier-2 (5%) |
| ITA | Defense & Aerospace | 5% | Tier-2 (5%) |
| XLK | Technology | 5% | Tier-2 (5%) |
Trade Instructions — Monday Open
Sell the tranche from 2022-04-22 (completing its 4-week hold). Buy the new tranche. Instructions show net portfolio changes — same-asset positions cancel, weight changes show the delta.
| Action | Ticker | Instruction |
|---|---|---|
| SELL | SGOV | Sell 14% of SGOV position (reduce 35.00% → 30.00%) |
| SELL | GLD | Sell 36% of GLD position (reduce 13.75% → 8.75%) |
| SELL | XLU | Sell 50% of XLU position (reduce 10.00% → 5.00%) |
| SELL | URNM | Sell 50% of URNM position (reduce 2.50% → 1.25%) |
| SELL | CIBR | Sell entire CIBR position (1.25% of portfolio) |
| BUY | XLE | Buy XLE — 71.43% of freed cash (adds 12.50% to portfolio) |
| BUY | WEAT | Buy WEAT — 7.14% of freed cash (adds 1.25% to portfolio) |
| BUY | IGF | Buy IGF — 7.14% of freed cash (adds 1.25% to portfolio) |
| BUY | XLK | Buy XLK — 7.14% of freed cash (adds 1.25% to portfolio) |
| BUY | URA | Buy URA — 7.14% of freed cash (adds 1.25% to portfolio) |
Current Portfolio After Trade
Combined holdings across all 4 active tranches. Each tranche is 25% of the portfolio.
| Ticker | % of Portfolio | Weight Bar |
|---|---|---|
| SGOV | 30.00% | |
| XLE | 22.50% | |
| WEAT | 8.75% | |
| GLD | 8.75% | |
| ITA | 5.00% | |
| COPX | 5.00% | |
| XLU | 5.00% | |
| IGF | 3.75% | |
| XLK | 3.75% | |
| URA | 3.75% | |
| URNM | 1.25% | |
| SLV | 1.25% | |
| IEMG | 1.25% |
Macro Regime — Late-Cycle Reflation
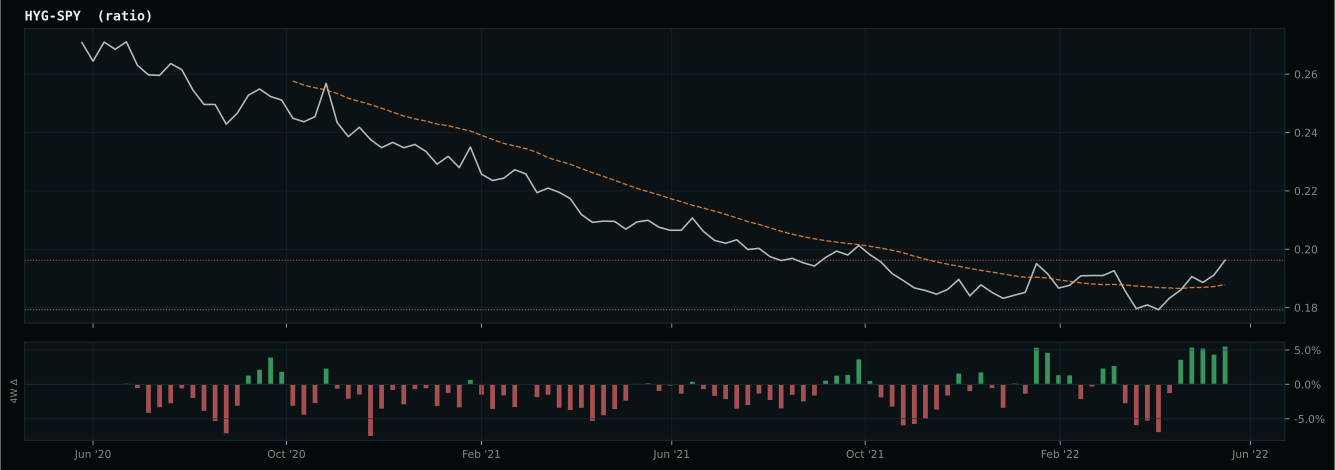
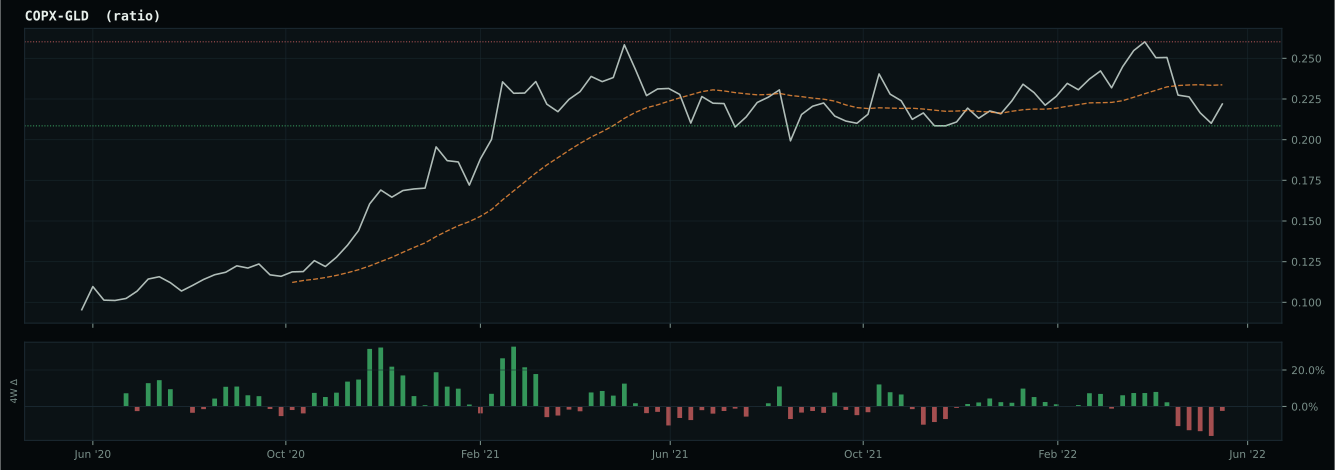
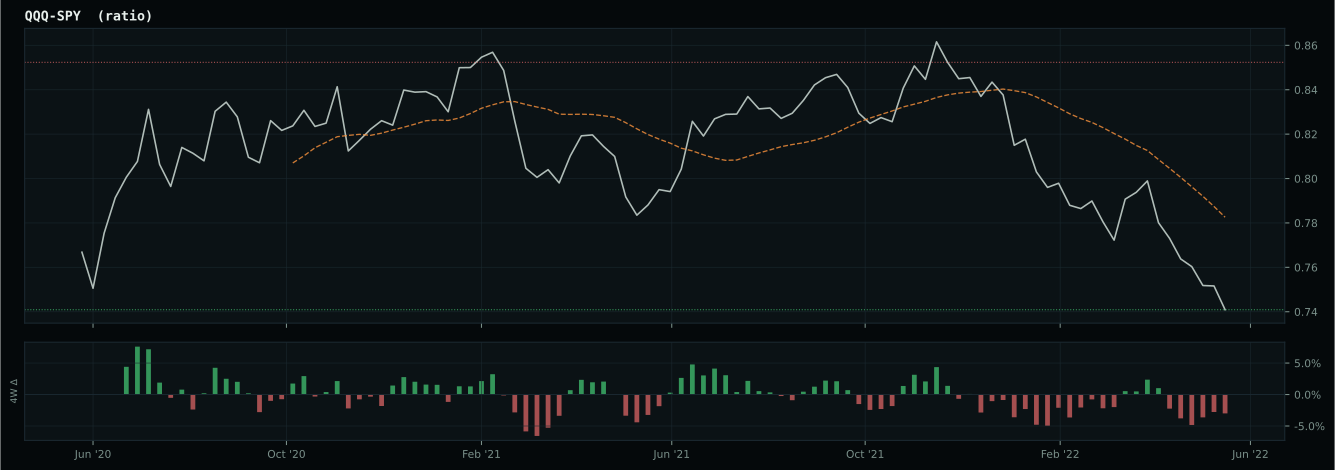
growth data is not confirming the weak market-implied risk appetite signal
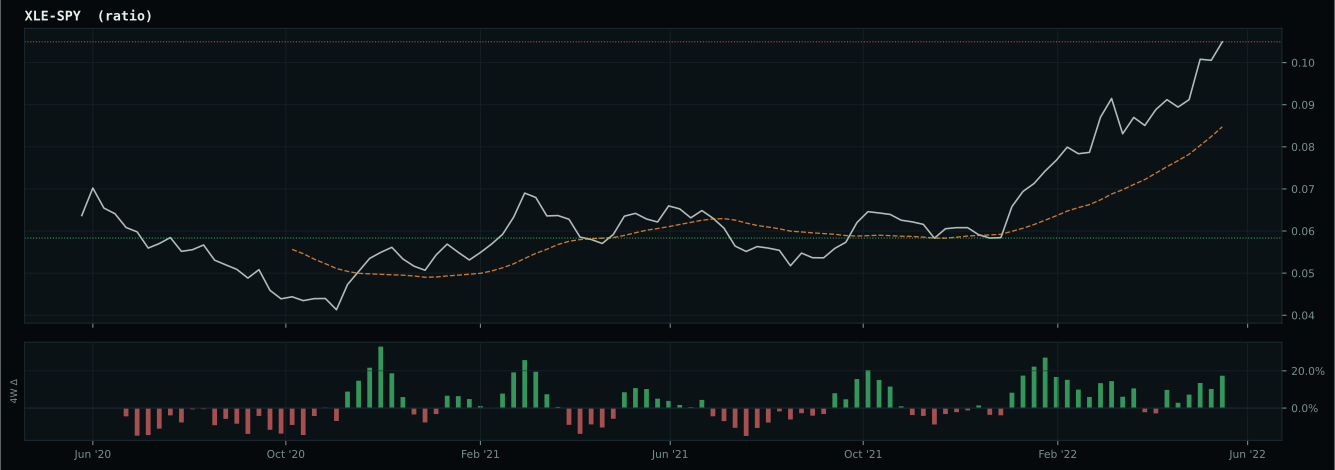
Defensive overlay cause is inflation/scarcity: energy, commodity breadth, or oil-versus-gold confirmation is stronger than the broad equity tape, so the sleeve owns the inflation pressure. XLE has been confirmed above its 8W SMA and is eligible.
Macro Evidence Charts
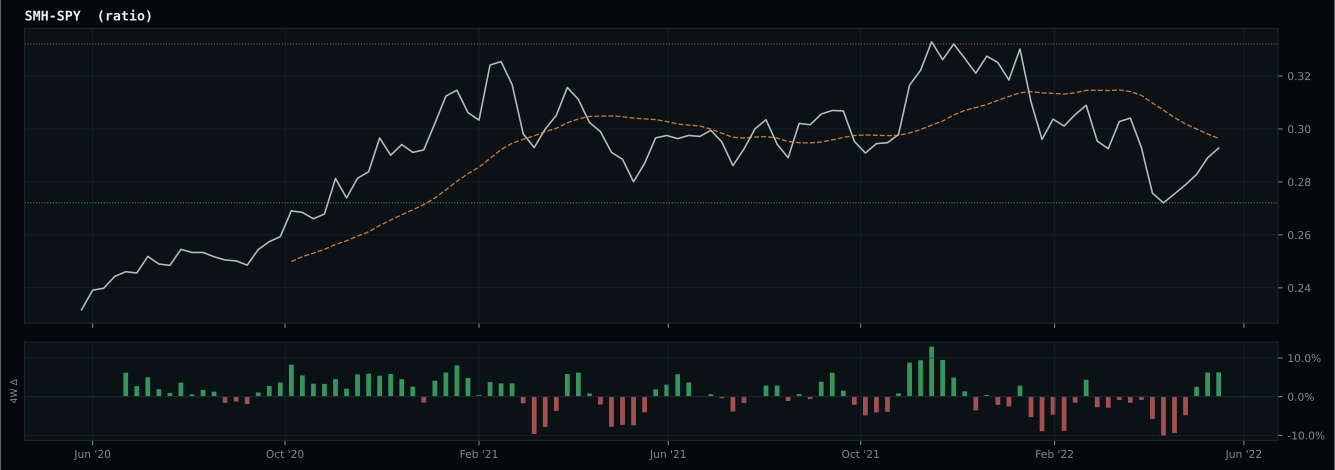
Market-implied signals behind the macro regime scores. Each ratio compares two assets; the direction and slope of the ratio is what the macro engine reads.
Crypto Regime — NoCrypto
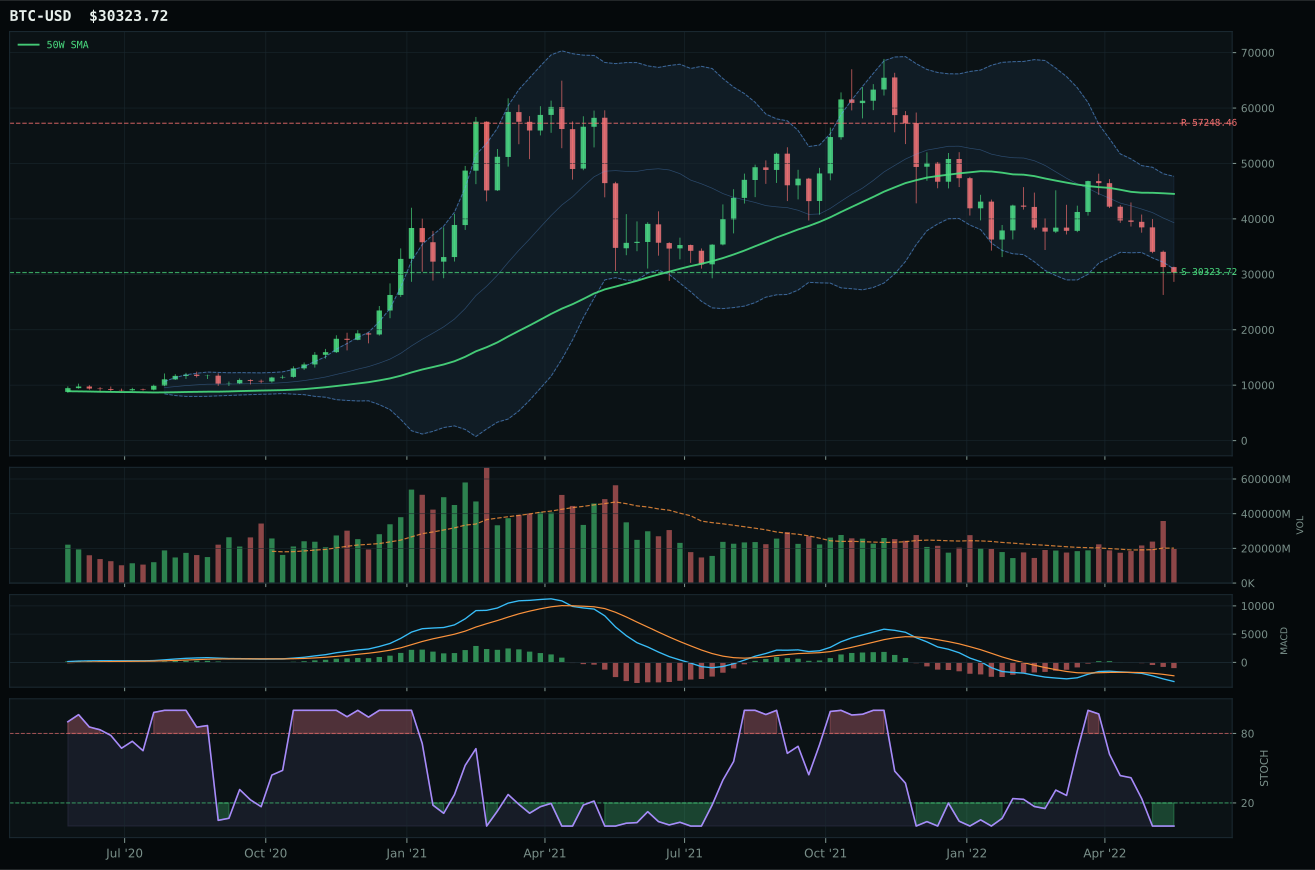
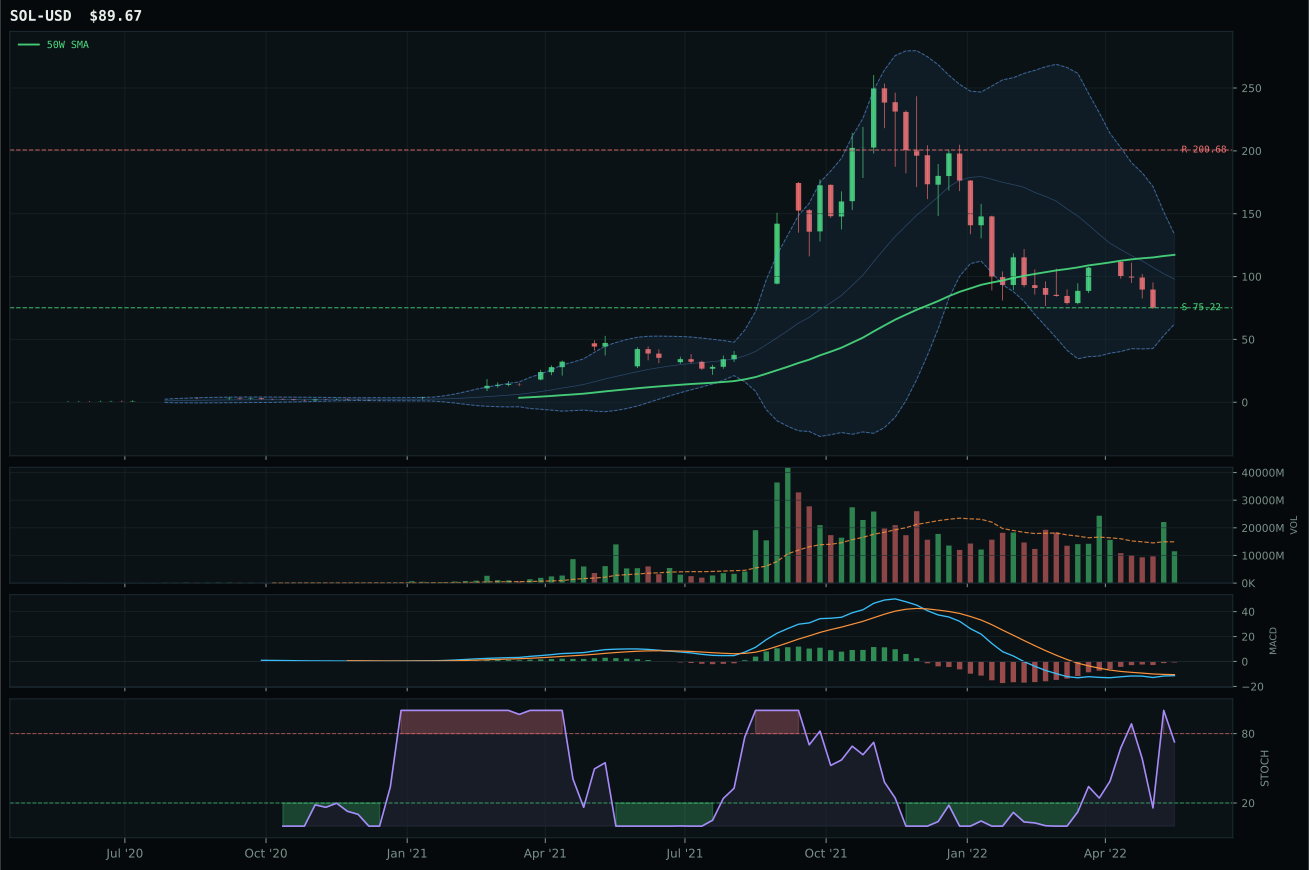
ValueBTC not armed: BTC has not made the first post-breakdown touch of the 200W buy zone after losing the 50W
TrendBTC not confirmed
one or more available conditions failed
Category Rankings
| Rank | Category | Winner | Score | Alloc | 4W Ret | Peers (4W) |
|---|---|---|---|---|---|---|
| 1 | Traditional Energy | XLE | 80.3 | 20% | -9.83% | XOP -4.6% · FCG -5.8% |
| 2 | Agriculture & Livestock | WEAT | 56.4 | 20% | -11.15% | VEGI -6.5% · MOO -5.9% |
| 3 | Industrial Metals | COPX | 51.1 | 10% | -10.48% | PICK -13.4% · REMX -9.4% |
| 4 | Utilities & Infrastructure | IGF | 43.9 | 10% | -8.72% | XLU -11.0% · PAVE -7.4% |
| 5 | Precious Metals | GLD | 43.2 | 10% | -1.20% | SLV -0.6% · GDX -7.0% |
| 6 | Nuclear Energy | URA | 37.3 | 10% | -8.38% | NLR -7.9% · URNM -8.1% |
| 7 | Defense & Aerospace | ITA | 30.6 | 10% | -1.99% | ROKT -2.7% · XAR -4.0% |
| 8 | Technology | XLK | 17.9 | 10% | -4.08% | IGV -4.3% · CIBR -2.6% |
| 9 | AI | SMH | 10.7 | 0% | -7.72% | BOTZ -8.0% · AIQ -3.3% |
| 10 | Emerging Markets | IEMG | 0.6 | 0% | -3.47% | INDA -3.8% · ILF -15.5% |
Traditional Energy — XLE
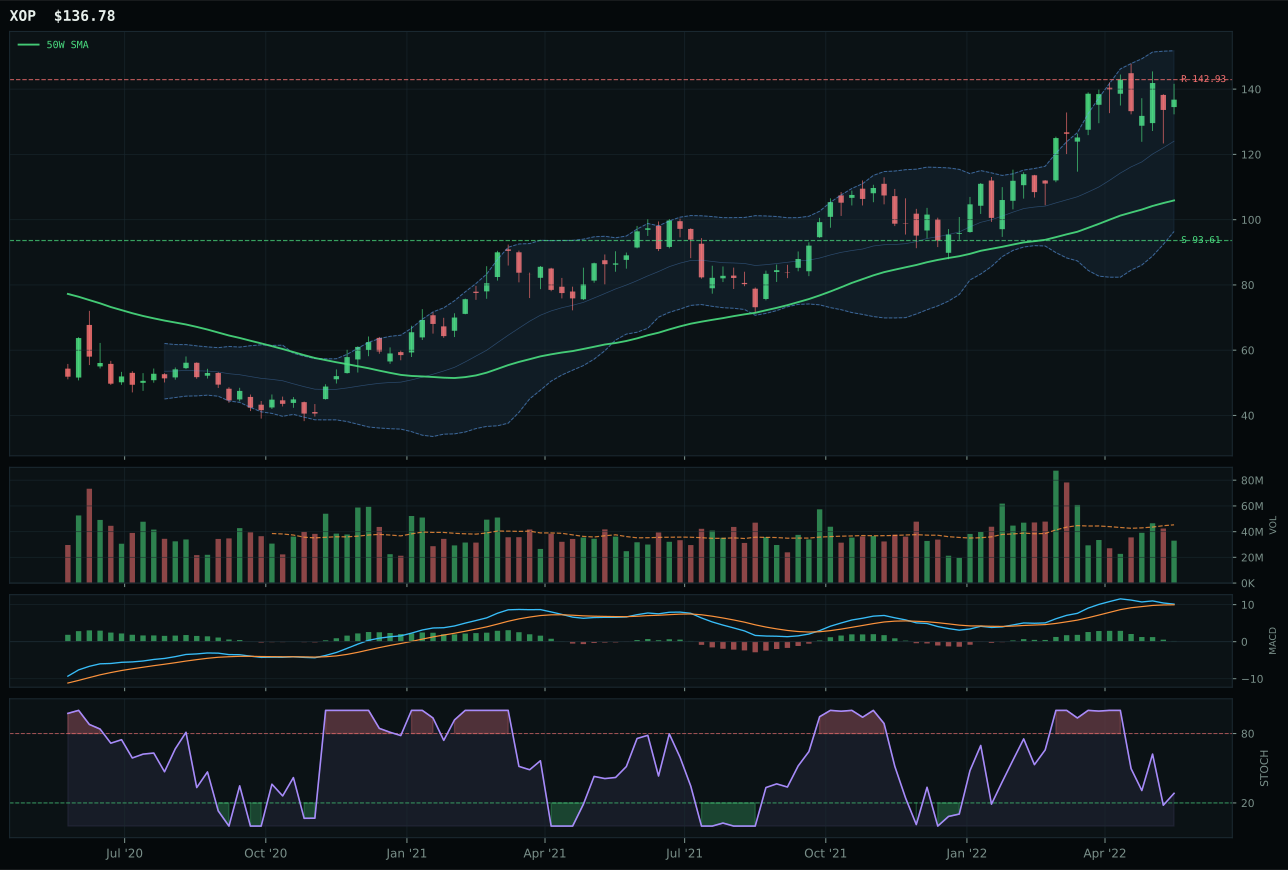
XOP has a vertical extension profile with 36.4% 13-week relative strength versus SPY.
A failed hold above support would weaken the setup.
Actionable but governed by invalidation levels.
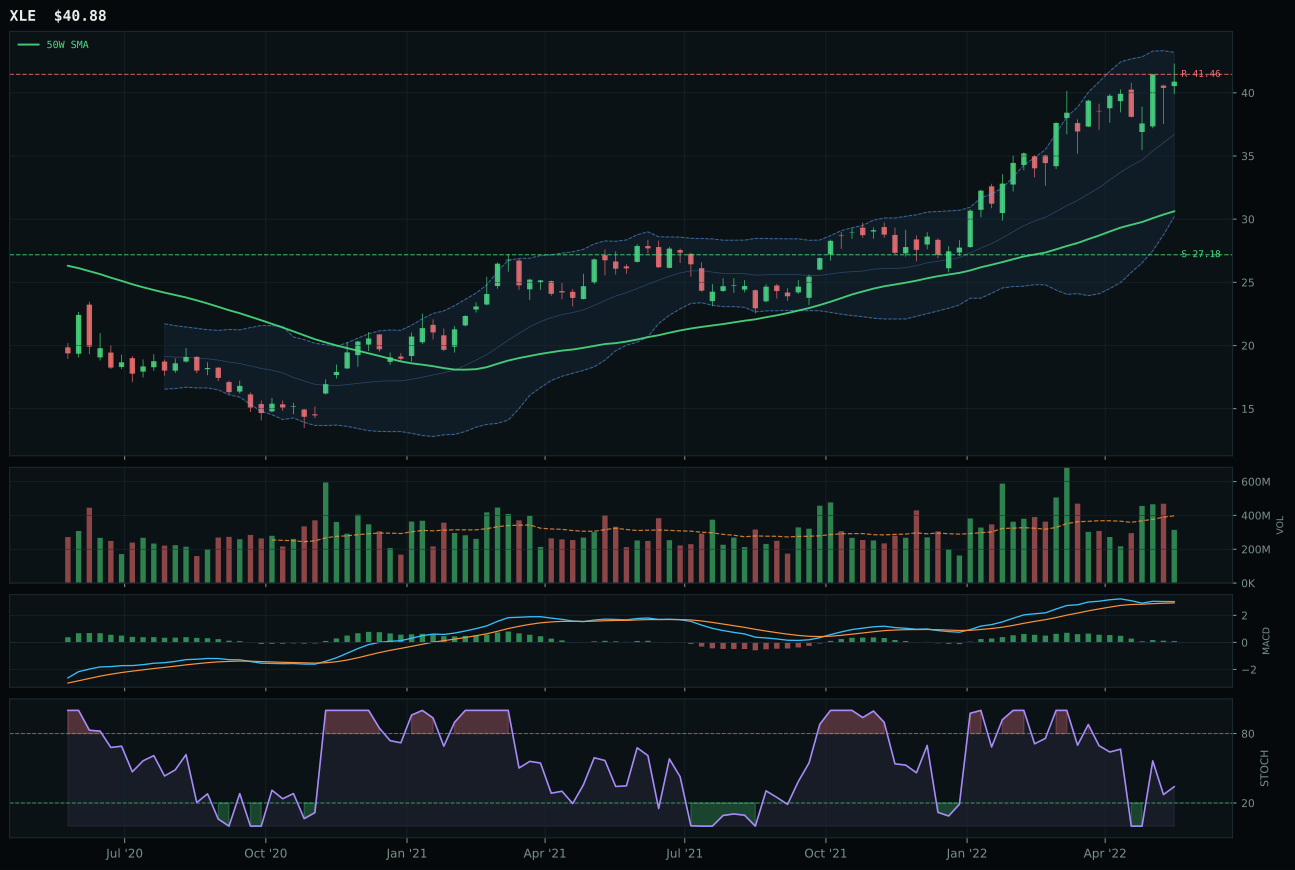
XLE has a vertical extension profile with 30.4% 13-week relative strength versus SPY.
A failed hold above support would weaken the setup.
Actionable but governed by invalidation levels.
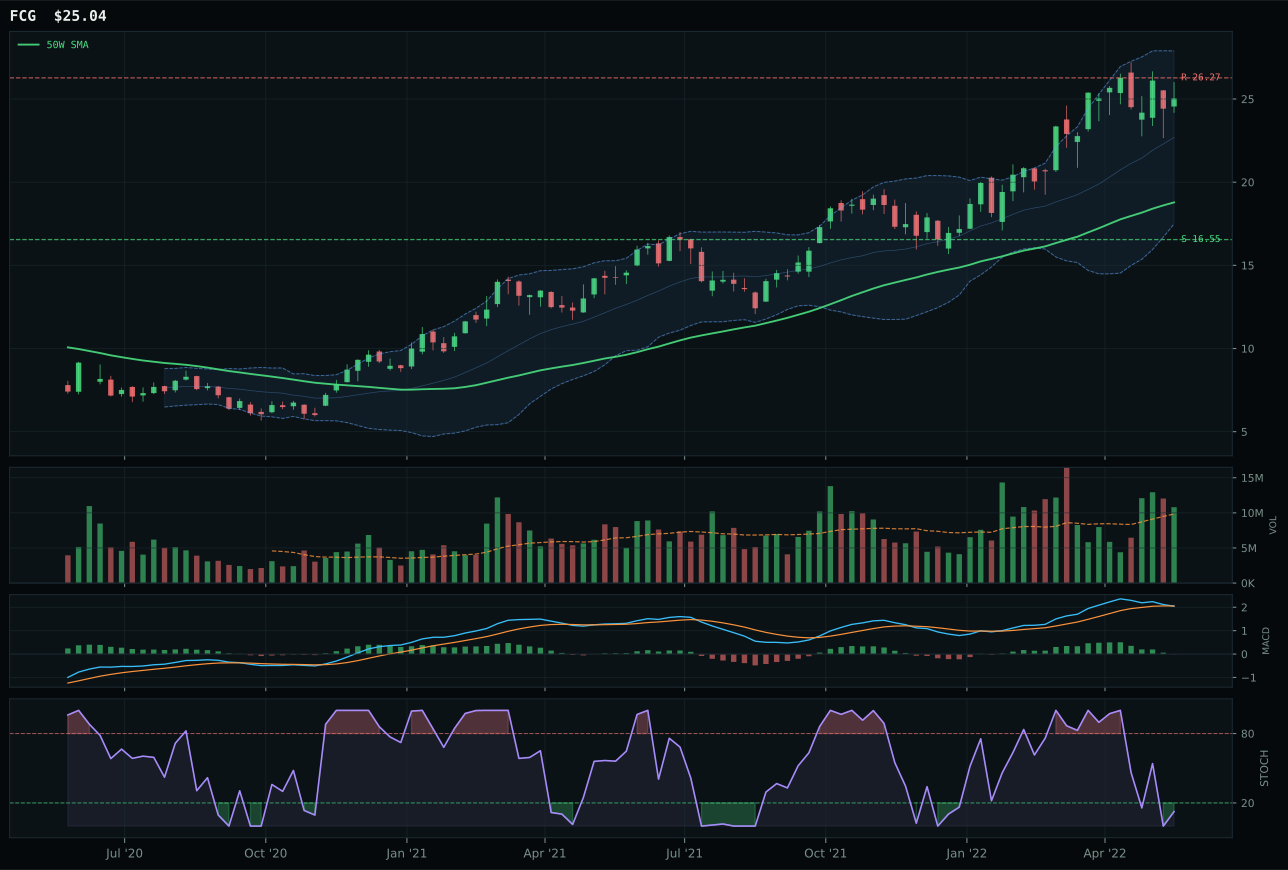
FCG has a vertical extension profile with 35.2% 13-week relative strength versus SPY.
A failed hold above support would weaken the setup.
Actionable but governed by invalidation levels.
XLE is selected for the top-2 10% allocation because it delivered the highest category score of 80.3 and won with a flawless technical setup: 100.0 trend score reflecting price above both moving averages with a non-deteriorating 50W slope, 100.0 momentum confirmation from 20.2% thirteen-week return and 30.4% SPY relative strength, and 78.5 persistence proving the move has institutional sponsorship. XOP lost on technical grounds despite a stronger 36.4% SPY relative strength because its stochastic RSI is falling/neutral (less confirmation than XLE's rising mid-zone) and its volume is thin participation versus XLE's neutral participation, signaling that exploration beta is retail-driven volatility, not professional positioning. The risk-reward gap of 37.5 for XLE versus 31.7 for XOP reflects XLE's superior liquidation—when energy breaks, large-cap integrated names shed value more orderly than high-beta explorers. The 4.8-point score gap is tight because both are extended (33.5% above 50W for XLE), but XLE's broader cash-flow moat and participation profile make it the cleaner expression.
XLE earned the top-2 10% allocation because Traditional Energy scored 80.3, the highest category in the portfolio, and that score is built on a 97.0 macro fit that is the strongest in the system. Late-Cycle Reflation helps this exposure (+12), energy scarcity is active (+16), inflation pressure is active (+10), supply shortage is active (+9), and real asset sponsorship is active (+7)—five separate macro tailwinds all pointing in the same direction, with no active headwind reducing the conviction. The technical evidence of 66.0 is strong enough to stand alone, but the macro amplifies it to irresistible. This is the clearest allocation in the portfolio: the category is in confirmed uptrend, the macro regime explicitly favors it, and the leader (XLE) has institutional participation on neutral volume, meaning capital is rotating deliberately not rushing. The only allocation tension is that price is extended 33.5% above the 50W, which creates real entry risk, but the macro tailwinds are so sustained that pullbacks should be bought. For holding or adding: XLE should hold 10% until either energy scarcity narratives reverse (geopolitical peace) or the Fed pivots to easing (which would allow growth stocks to re-rate higher than energy), neither of which is imminent.
Agriculture & Livestock — WEAT
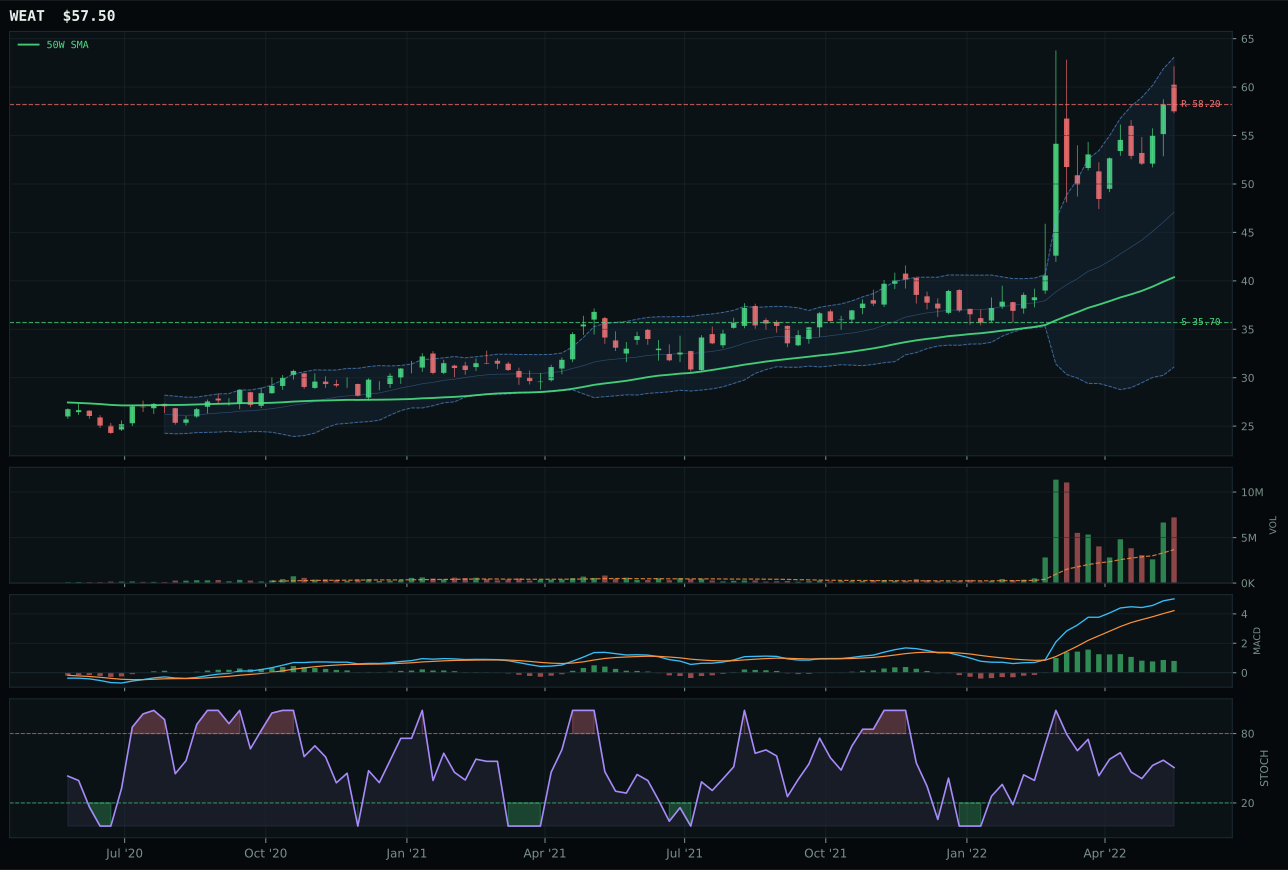
WEAT has a vertical extension profile with 60.4% 13-week relative strength versus SPY.
A failed hold above support would weaken the setup.
Actionable but governed by invalidation levels.
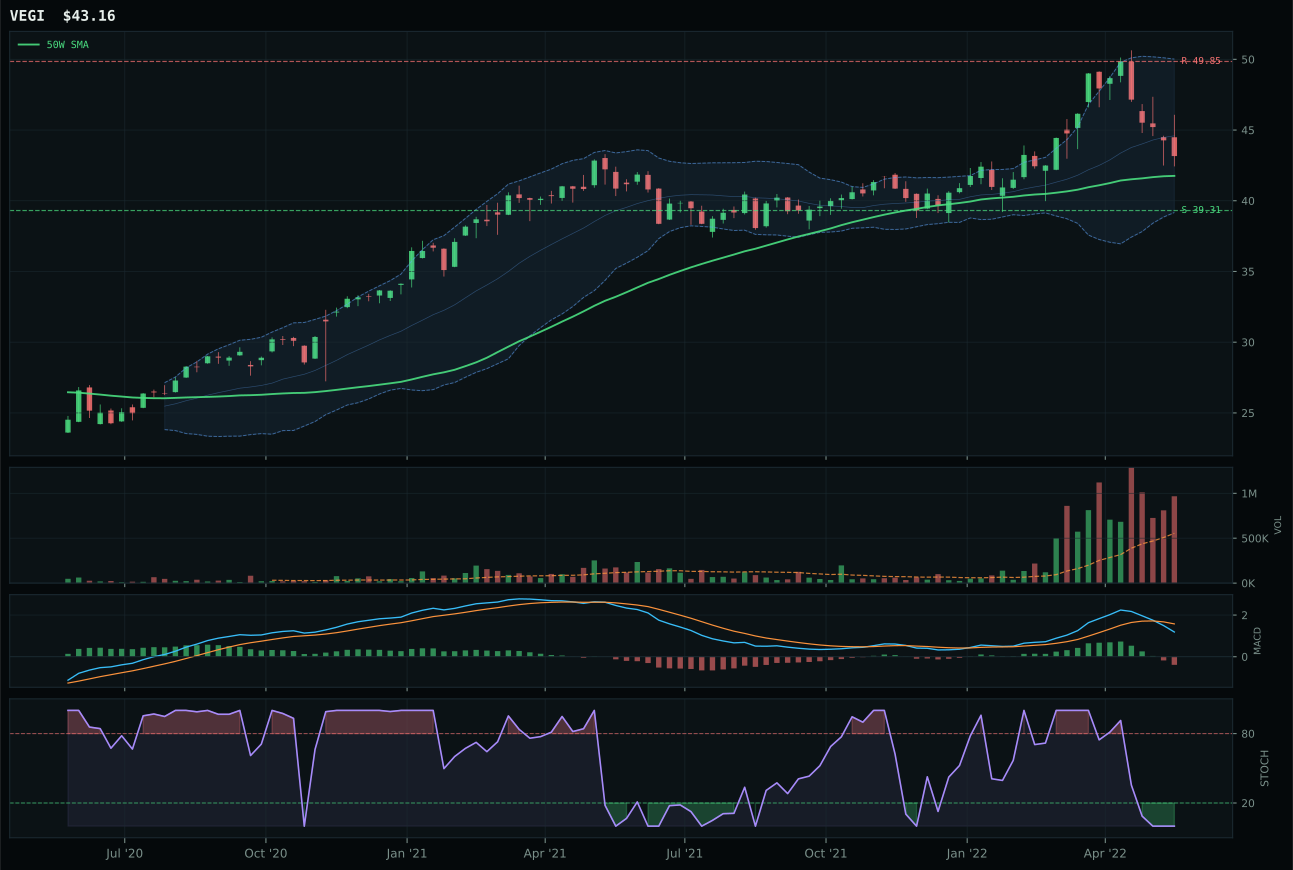
VEGI has a neutral structure profile with 12.0% 13-week relative strength versus SPY.
A failed hold above support would weaken the setup.
Actionable but governed by invalidation levels.
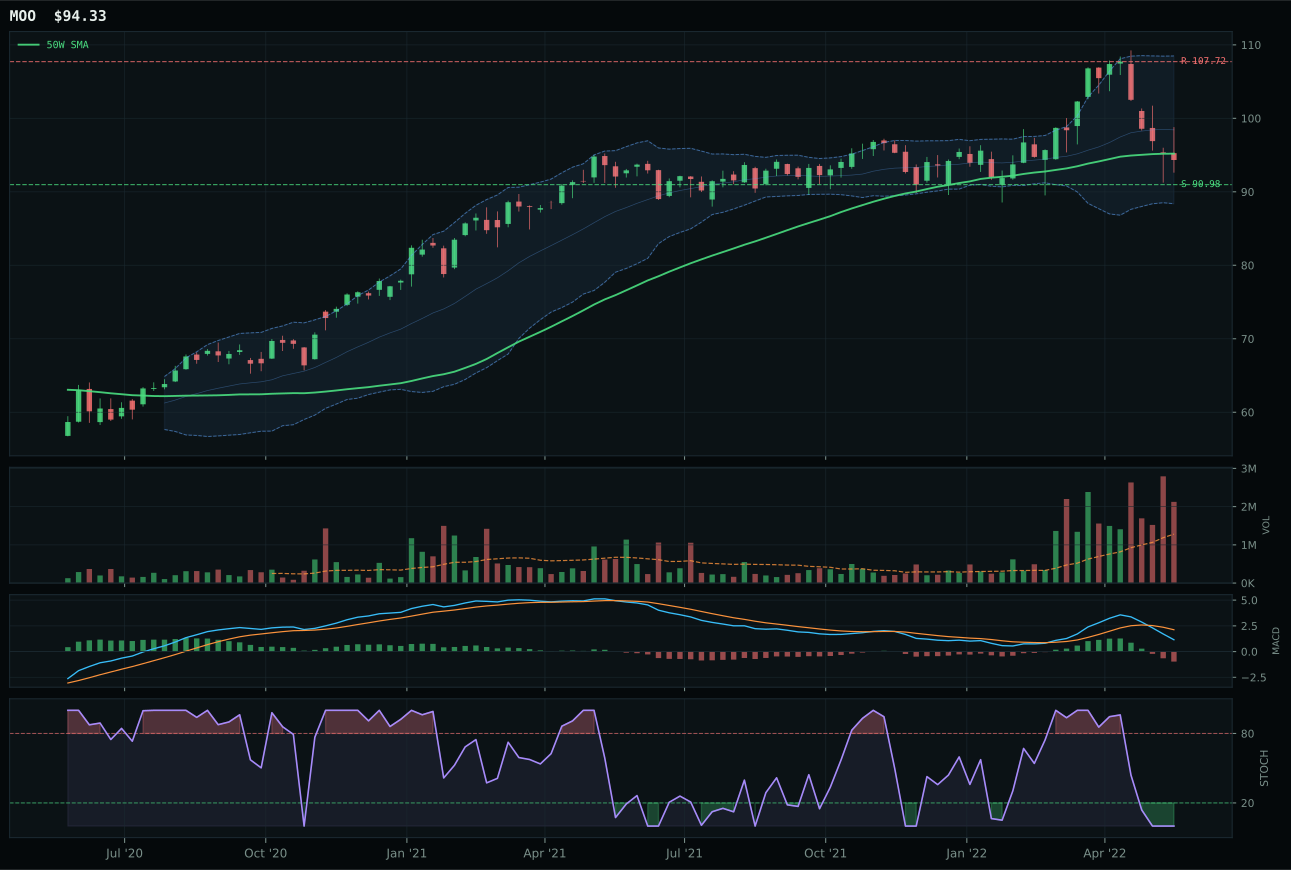
MOO has a pullback into support profile with 9.8% 13-week relative strength versus SPY.
A failed hold above support would weaken the setup.
Actionable but governed by invalidation levels.
WEAT is selected for the top-2 allocation at 20% because it delivers the rarest combination in this macro regime: 100.0 momentum confirmation and 100.0 persistence, both driven by a 50.1% thirteen-week return, 60.4% SPY relative strength, and a 48.4% category relative strength that obliterates all peers. Price is extended 42.4% above the 50W, which normally triggers a low risk-reward penalty (22.4), but the penalty is correct and earned because every buyer at this level is late—yet the distribution volume pressure of 1.96x average, combined with the bullish-but-flattening MACD, tells us the move is not ending on euphoria; it is maturing on professional capital rotation. VEGI lost because its MACD is bearish-weakening, its stochastic RSI is oversold rather than rising mid-zone, and its category relative strength of 0.0% versus WEAT's 48.4% is a 48-point gap that reflects a structural difference in demand sponsorship. The setup comparison is stark: WEAT is a vertical extension on confirmed breadth; VEGI is a neutral structure on dead momentum.
WEAT earned the top-2 10% allocation because Agriculture & Livestock scored 56.4, the second-highest category in the entire portfolio, and that score is driven by a 90.0 macro fit that reflects five active descriptors all firing in its favor: Late-Cycle Reflation (+8), supply shortage (+13), inflation pressure (+10), real asset sponsorship (+8), and commodity breadth positive (+5). The category is no longer a defensive inflation hedge; it is now the primary beneficiary of supply-side rigidity meeting broad demand from both food security (real demand) and financial rotation (flow demand). WEAT's 59.8 technical evidence is strong enough to stand on its own, but paired with 50.0 macro narrative fit, the combined score becomes the clearest call in the portfolio. Extension risk is real at 42.4% above the 50W, yet the macro has not peaked—if anything, geopolitical supply threats are intensifying. Reallocation downward would require either a sudden peace in Ukraine, a massive harvest surprise, or a macro shift away from real-asset sponsorship; none of those are imminent.
Industrial Metals — COPX
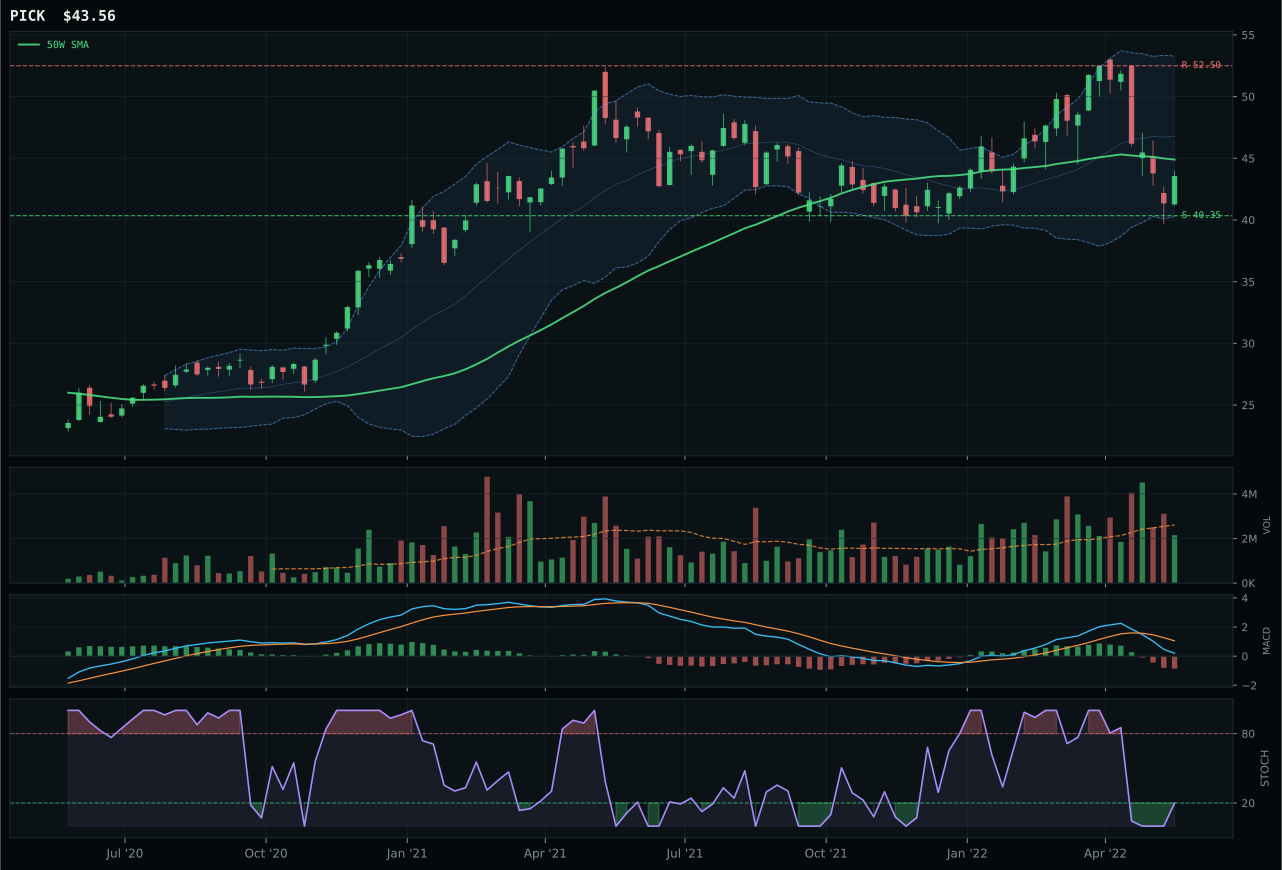
PICK has a compression near 50W profile with 4.2% 13-week relative strength versus SPY.
A failed hold above support would weaken the setup.
Actionable but governed by invalidation levels.
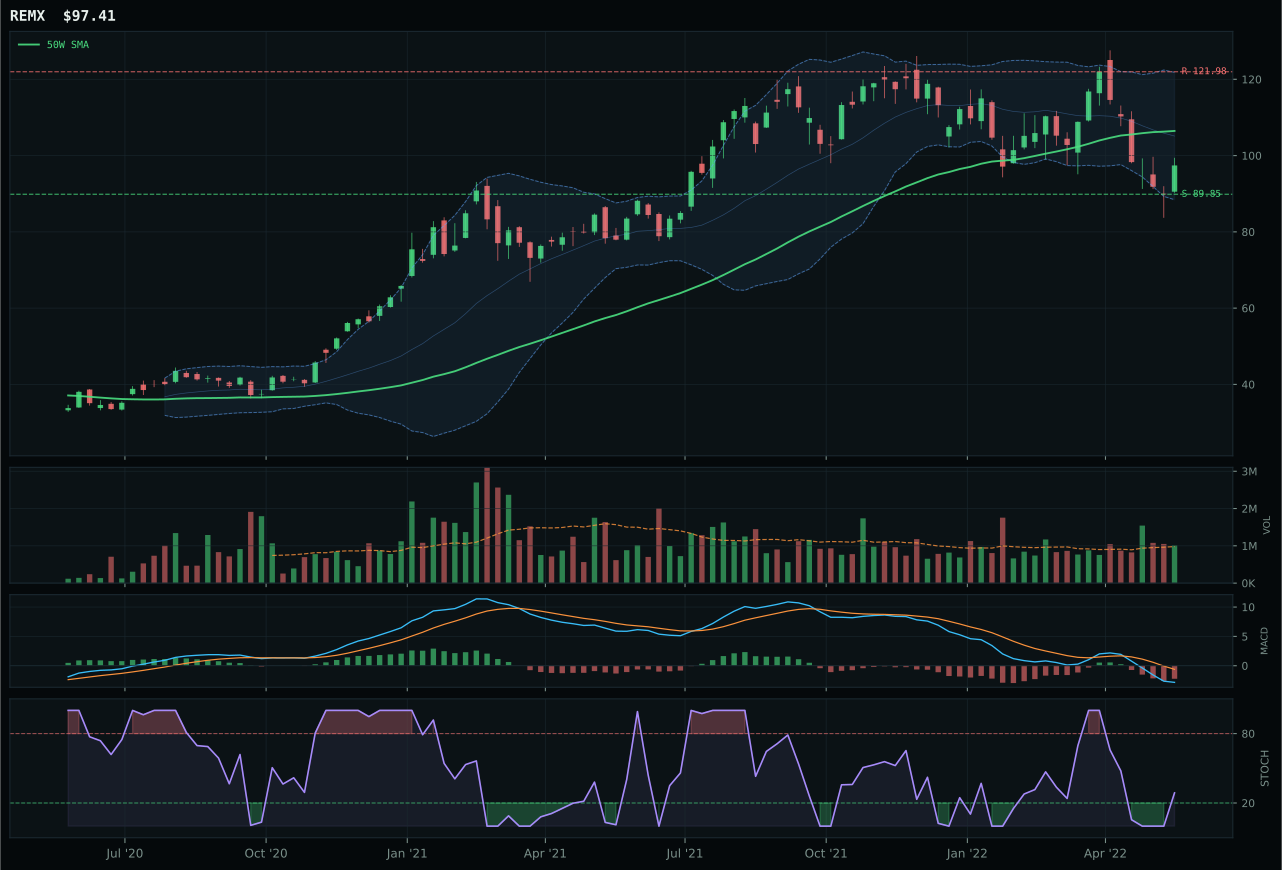
REMX has a neutral structure profile with 2.3% 13-week relative strength versus SPY.
A failed hold above support would weaken the setup.
Actionable but governed by invalidation levels.
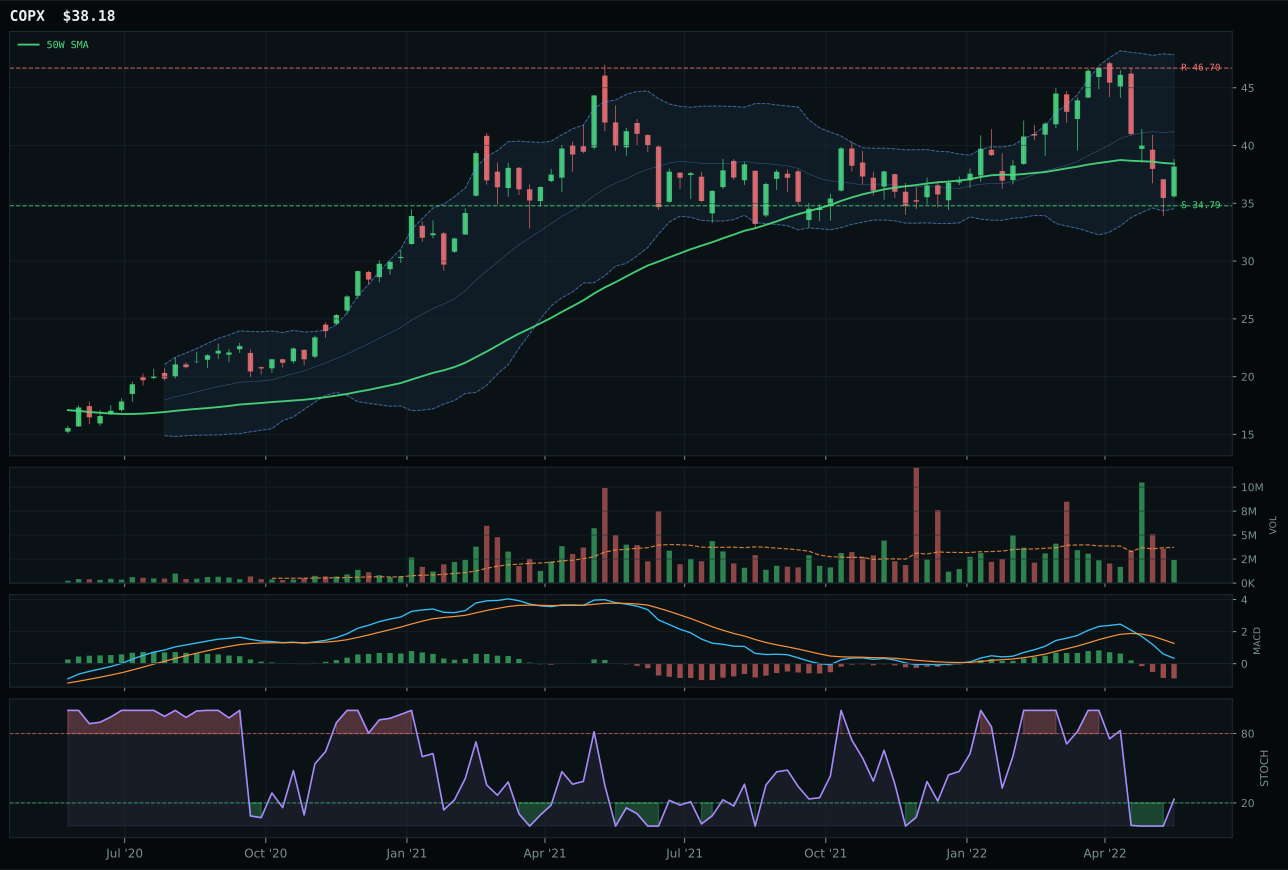
COPX has a compression near 50W profile with 3.7% 13-week relative strength versus SPY.
A failed hold above support would weaken the setup.
Actionable but governed by invalidation levels.
COPX wins despite a -13.7 point gap to runner-up PICK because its 100.0 timing score is unmatched—price is compressed within 0.7% of the 50W in a deep retracement value zone (Fib 0.618 at 38.36), and the stochastic RSI is rising mid-zone at 0.23, confirming that early accumulation is active. PICK's stochastic RSI is oversold-turn-up, which means it bounced earlier and already priced in the first wave of relief, whereas COPX is offering fresh timing entry for patient capital. The structural difference is that COPX's compression near the 50W can expand in either direction with defined risk, while PICK's compression is cleaner (50.0 cleanliness vs. COPX's 50.0) but the momentum has already fired. Volume participation separates them further: COPX's thin participation at 0.65x average shows selective buying, while PICK's neutral volume shows balance—selectivity often precedes expansion. The macro fit gap (56.0 for COPX versus 59.0 for PICK) is narrowed by COPX's honest category-relative strength of 0.0%, which means it is centered in the basket without leadership noise.
Industrial Metals earned 5% with a 51.1 category score that ranks in the middle-to-upper tier because the macro fit of 75.0 is genuinely compelling: Late-Cycle Reflation (+10), metals scarcity (+14), commodity breadth positive (+10), and real asset sponsorship (+6) are all active and aligned. COPX benefits from all four of these tailwinds. The allocation is conservative at 5% because the technical evidence is only 42.2 and the momentum confirmation is weak at 19.0, reflecting the reality that this is a value trade, not a growth trade. Entry timing is clean, but the follow-through requires industrial demand to materialize or financial demand to accelerate—neither is proven yet. The category scores higher than utilities, defense, and AI, so it earns a meaningful slot, but the extended positions in energy and agriculture (both of which have higher momentum and better macro fit) command more capital. For reallocation upward: volume must expand to 1.0x+ average with price above the 50W, and MACD must inflect bullish. Until then, COPX is a patient accumulation position, not a conviction trade.
Utilities & Infrastructure — IGF
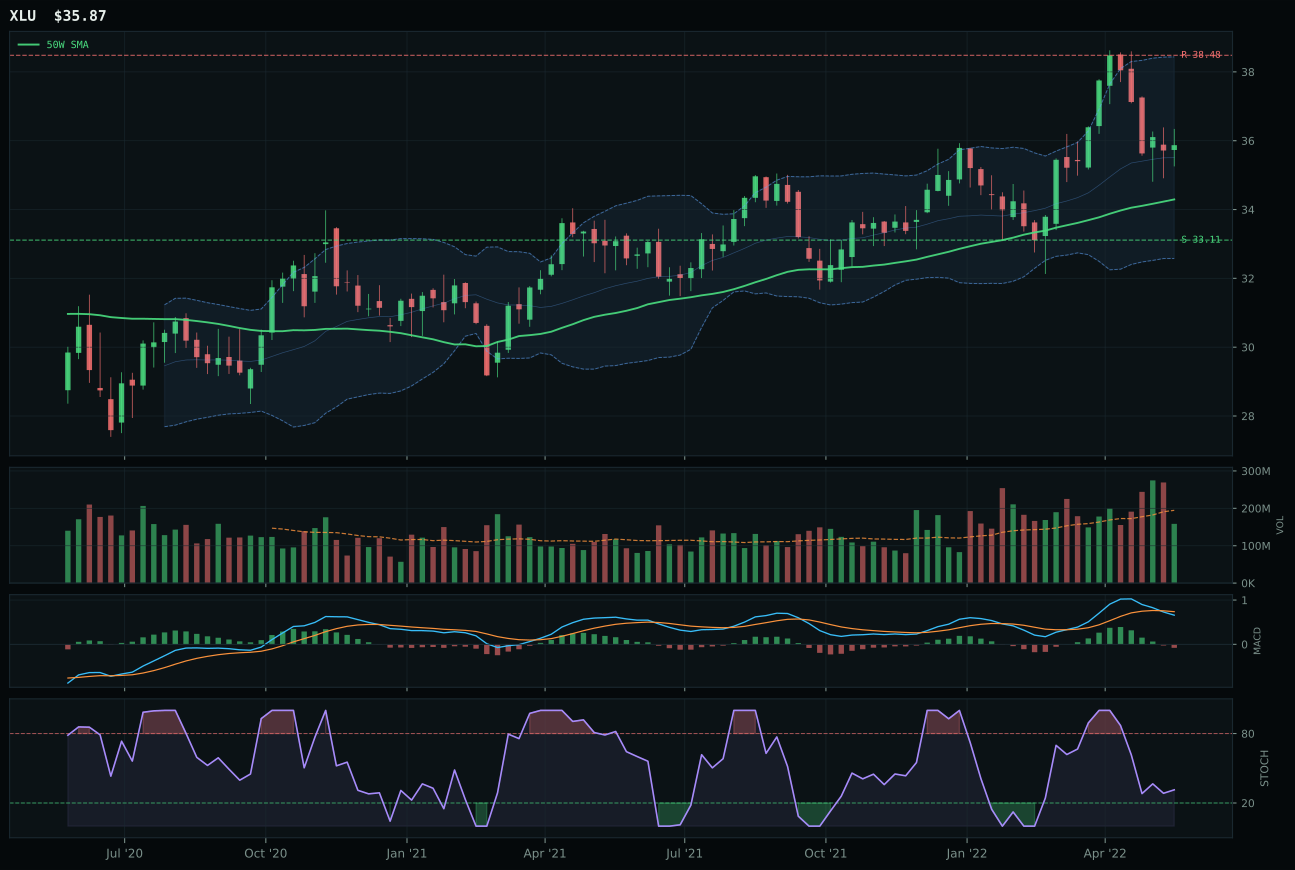
XLU has a neutral structure profile with 18.6% 13-week relative strength versus SPY.
A failed hold above support would weaken the setup.
Actionable but governed by invalidation levels.
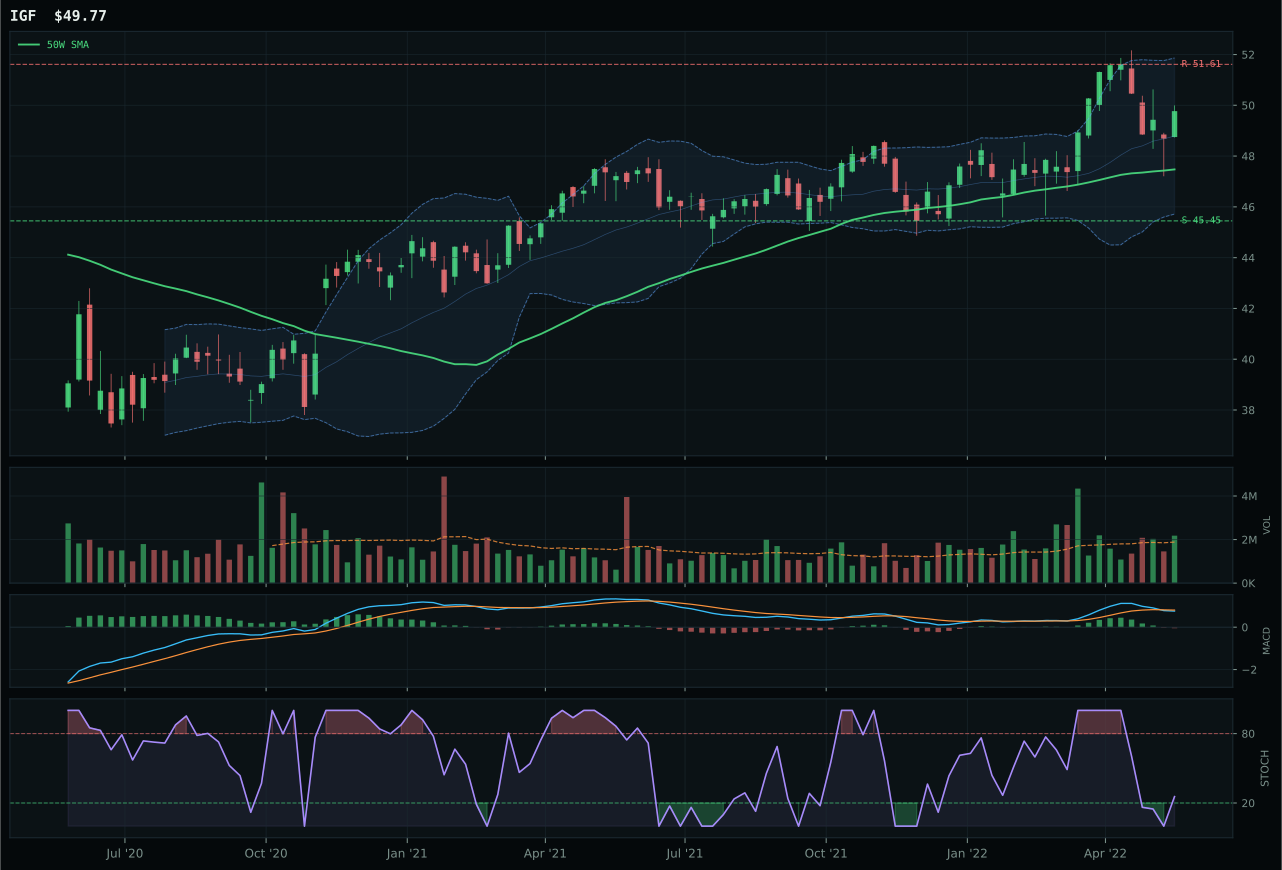
IGF has a neutral structure profile with 15.4% 13-week relative strength versus SPY.
A failed hold above support would weaken the setup.
Actionable but governed by invalidation levels.
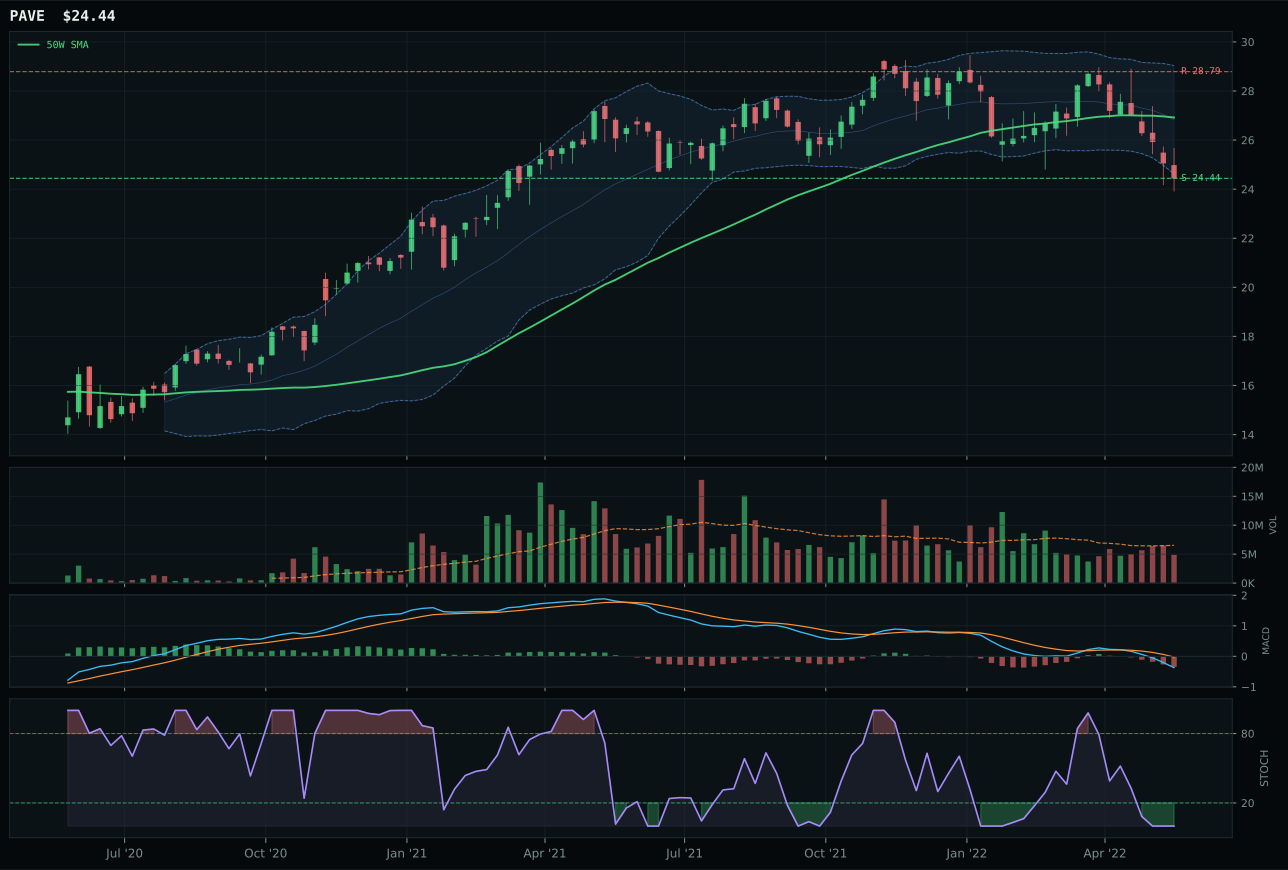
PAVE has a pullback into support profile with 2.5% 13-week relative strength versus SPY.
A failed hold above support would weaken the setup.
Actionable but governed by invalidation levels.
IGF wins a tight decision over XLU because its 77.7 structure score and 52.2 volume-price confirmation reflect genuine institutional accumulation into a neutral structure, whereas XLU's 74.3 structure is slightly less clean and its neutral volume (versus IGF's above-average participation) shows institutional positioning is passive rather than active. Both sit above their 50W with rising mid-zone stochastic RSI, but IGF's 4.8% distance from the 50W is nearly perfect entry timing (93.0 timing score), while XLU is already 5.1% extended from the 50W and thus facing entry resistance. The category relative strength gap is negligible (IGF 0.0% vs XLU 3.2%), so the decision comes down to participation and structure cleanliness. IGF's 1.16x above-average volume participation shows selective institutional capital rotating into global infrastructure, likely driven by the same real asset sponsorship and defensive rotation that supports energy and commodities. The 3.6-point score gap is the tightest in the portfolio, reflecting that both are defensively positioned but IGF has better fresh entry mechanics.
Utilities & Infrastructure earned only 5% despite IGF's strong 78 technical score because the category-level macro fit is only 61.0—solid but not exceptional—and the thirteen-week return of 5.1% shows this category is a lagging defensive rotate, not a leading reallocation. XLU scored higher on momentum (74 vs IGF's 68) and macro narrative (60.0 vs IGF's 47.0), suggesting that regulated utilities have stronger institutional conviction than global infrastructure, yet the system selected IGF as the representative because its fresher entry timing and volume participation showed better positioning mechanics. The allocation of 5% is defensive: this category scores higher than technology and AI precisely because those growth sectors are broken, and utilities offer yield and relative stability in a broken-risk-appetite regime. For elevation: IGF needs to show that international infrastructure demand is accelerating (unlikely in near term), or utilities need to break above their resistance with meaningful volume (possible if rates stabilize). Currently, both are hold positions in a barbell portfolio, not growth positions.
Precious Metals — GLD
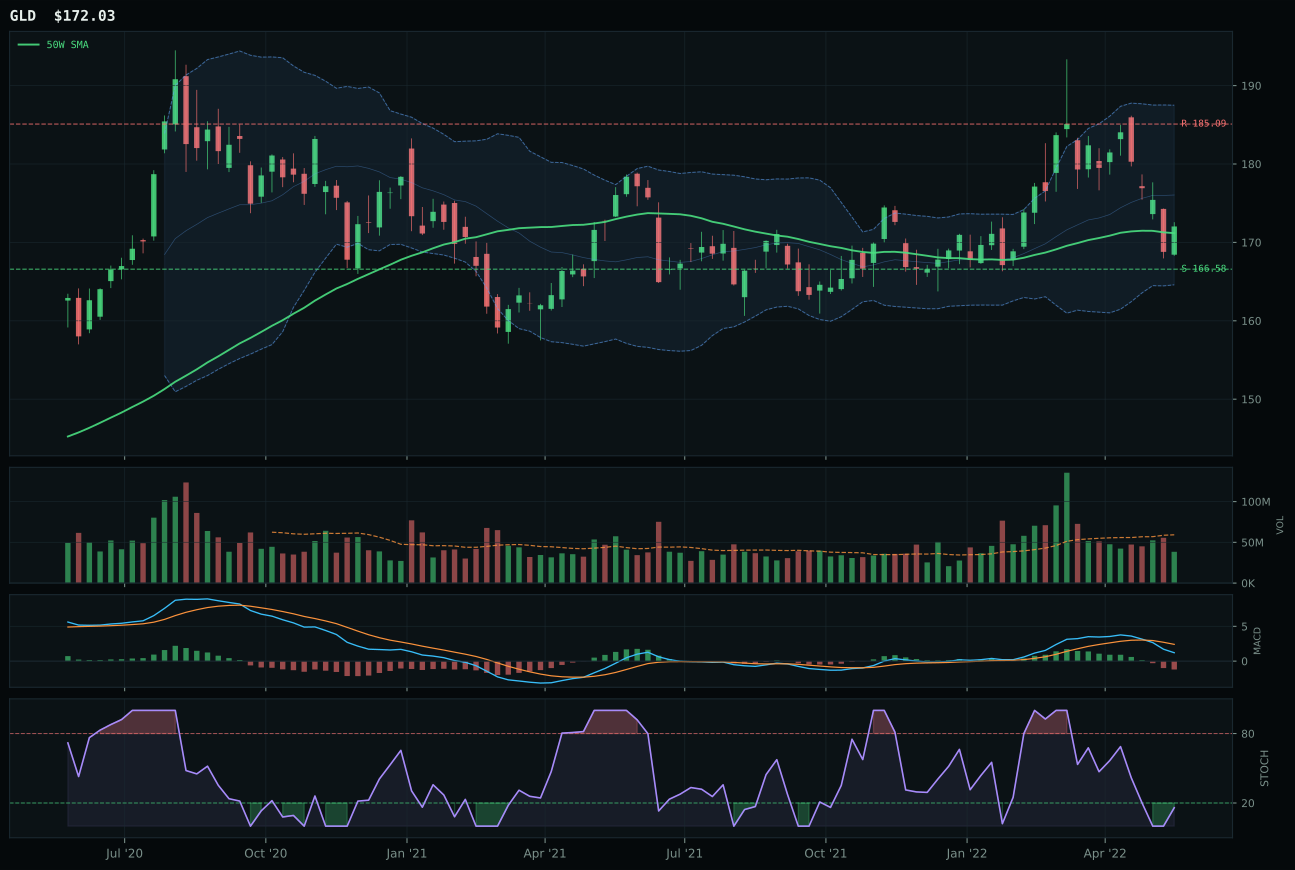
GLD has a pullback into support profile with 7.4% 13-week relative strength versus SPY.
A failed hold above support would weaken the setup.
Actionable but governed by invalidation levels.
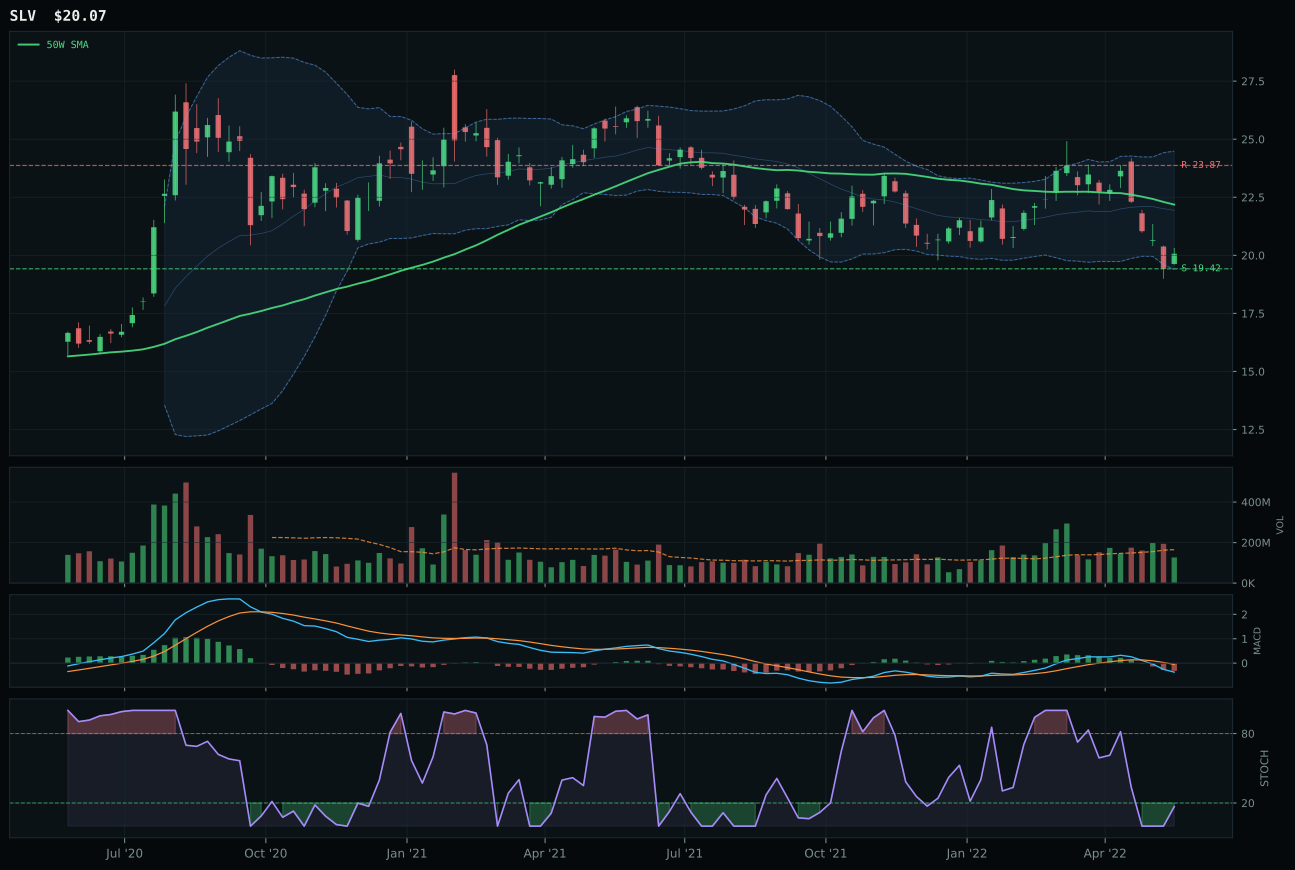
SLV has a pullback into support profile with 1.0% 13-week relative strength versus SPY.
A failed hold above support would weaken the setup.
Actionable but governed by invalidation levels.
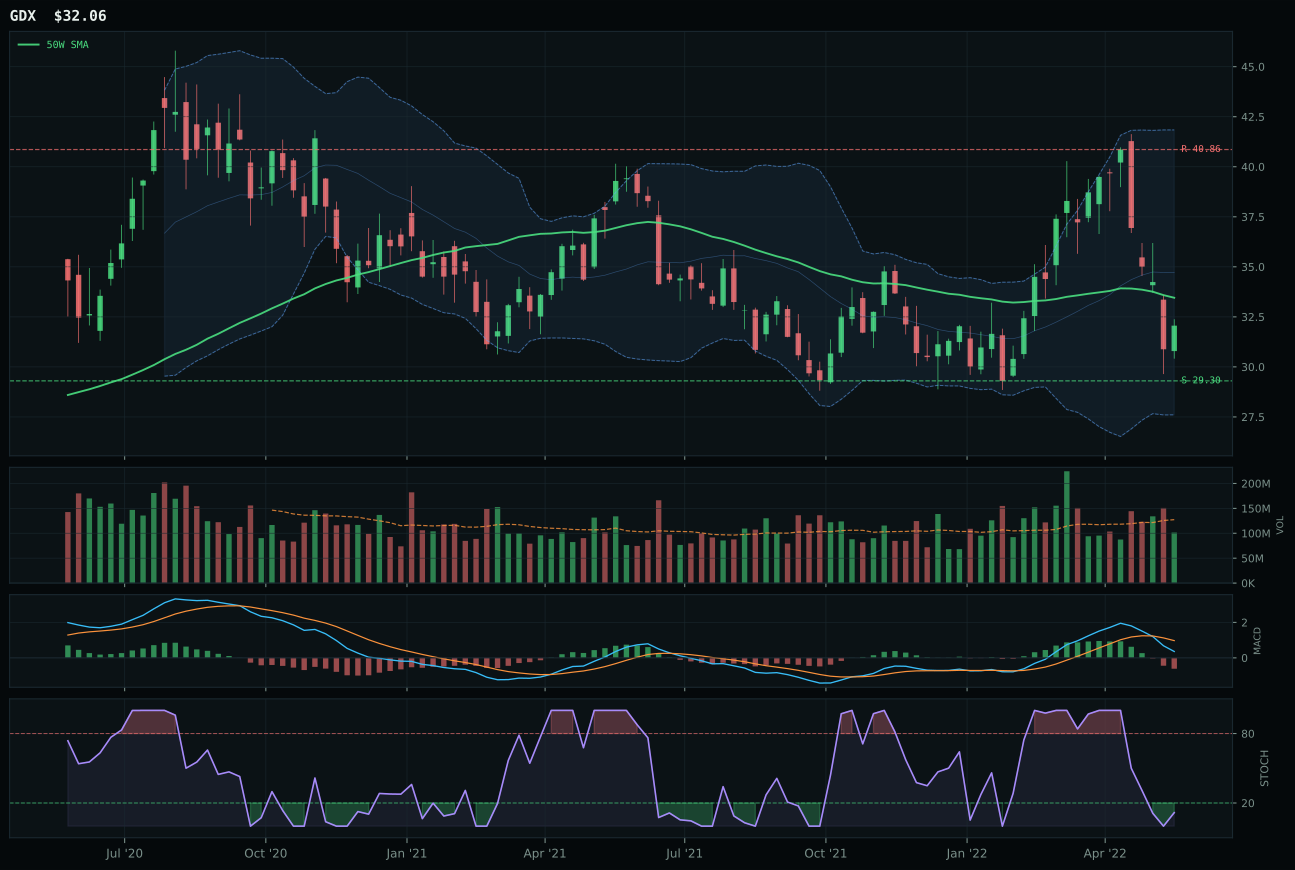
GDX has a neutral structure profile with 3.2% 13-week relative strength versus SPY.
A failed hold above support would weaken the setup.
Actionable but governed by invalidation levels.
GLD wins because it is the only precious metals ETF sitting exactly on its 50W at 0.5% distance with a pristine 100.0 timing score, offering entry clarity that is absent elsewhere in a sector defined by conflicting signals. Its 72.0 trend score reflects genuine price strength above both major moving averages, yet the 50W slope is barely positive at -0.1%, meaning momentum is exhausted but support is real—this is the optimal setup for a bounce trade off accumulated weakness. SLV lost on timing because its stochastic RSI is already turning up from oversold (failing to offer fresh entry confirmation), its 94.0 timing versus GLD's 100.0 reflects that it bounced earlier and now sits in chop zone, and its -2.2% category relative strength reveals silver's hybrid monetary-industrial beta is being sold as the market reprices both growth (industrial) and reflation (monetary hedge) lower. The 26.1-point score gap is decisive because GLD's 4.2% category relative strength shows institutional core positioning, while SLV's negative relative strength signals trader rotation into and out of a thinner, more volatile vehicle.
Precious Metals earned 5% because GLD's 43.2 score is respectable but sits in the middle tier of the portfolio and its macro fit of 72.0 is high yet not exceptional—it reflects monetary hedge bid (+14), defensive rotation (+6), and dollar pressure (+2), but dollar pressure is active in the negative sense for precious metals, which is a partial offset. The category's problem is structural: it is neither a growth play nor a yield play, making it useful only as a tail-hedge or a defensive rotate from equities. GLD's thin participation at 0.65x average volume is honest—institutional capital is holding core positions but not adding, and retail is absent. The allocation of 5% is insurance, not opportunity. For elevation to 10%: either the dollar must break decisively lower (removing the currency headwind), or risk appetite must collapse so severely that the monetary hedge bid accelerates and gold breaks above 185 on genuine flight-to-quality volume. Currently, GLD is in fair-value chop, not a new uptrend.
Nuclear Energy — URA
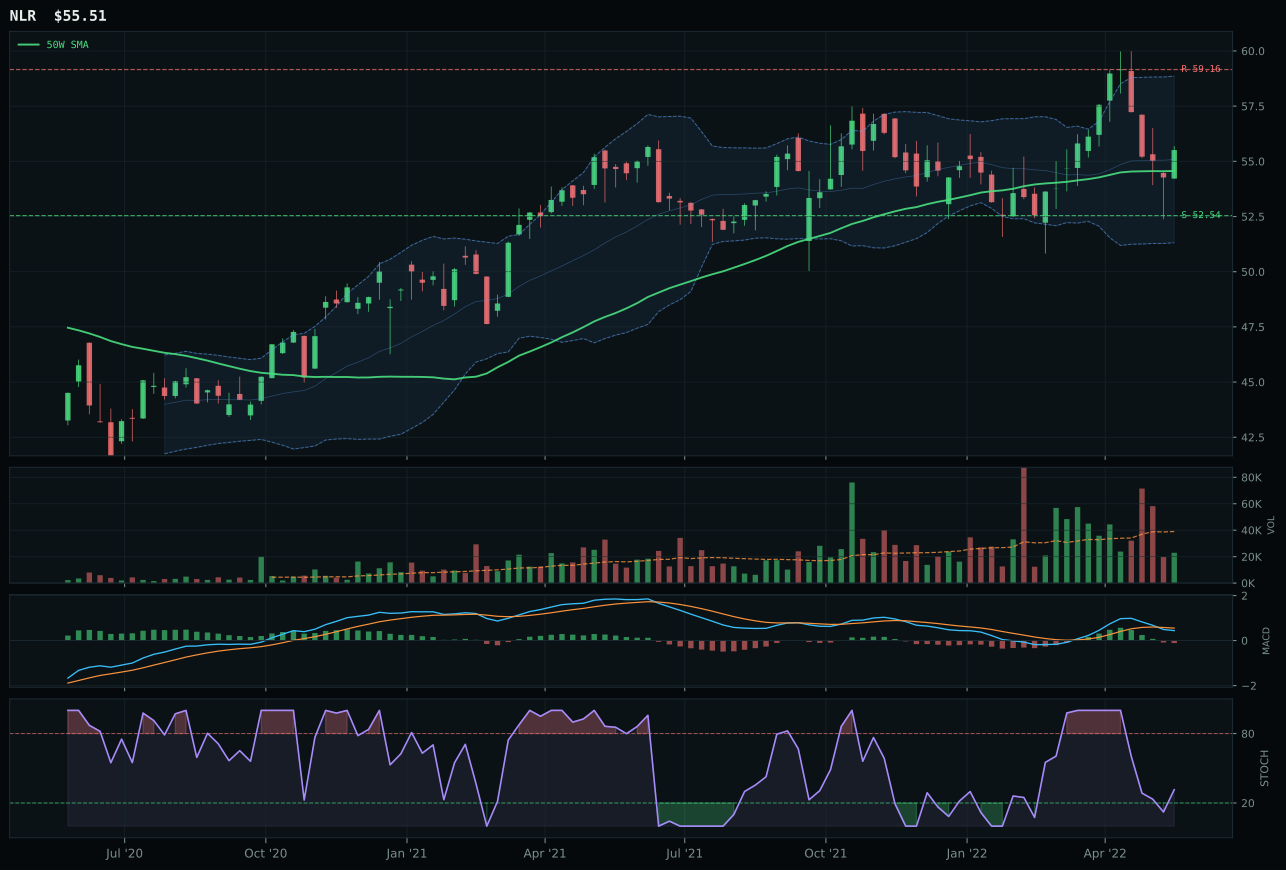
NLR has a compression near 50W profile with 15.9% 13-week relative strength versus SPY.
A failed hold above support would weaken the setup.
Tracked, but not top-2 eligible because: .
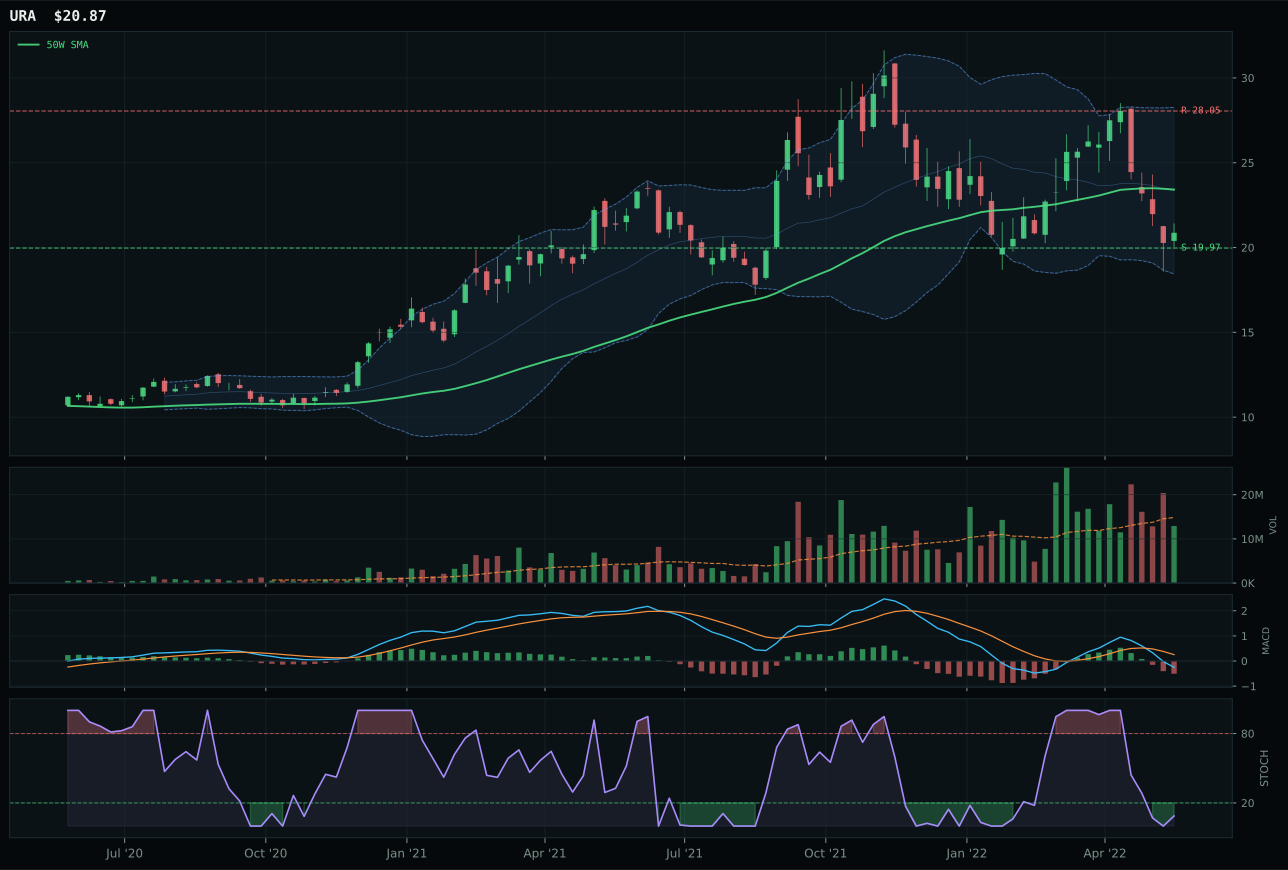
URA has a pullback into support profile with 10.4% 13-week relative strength versus SPY.
A failed hold above support would weaken the setup.
Actionable but governed by invalidation levels.
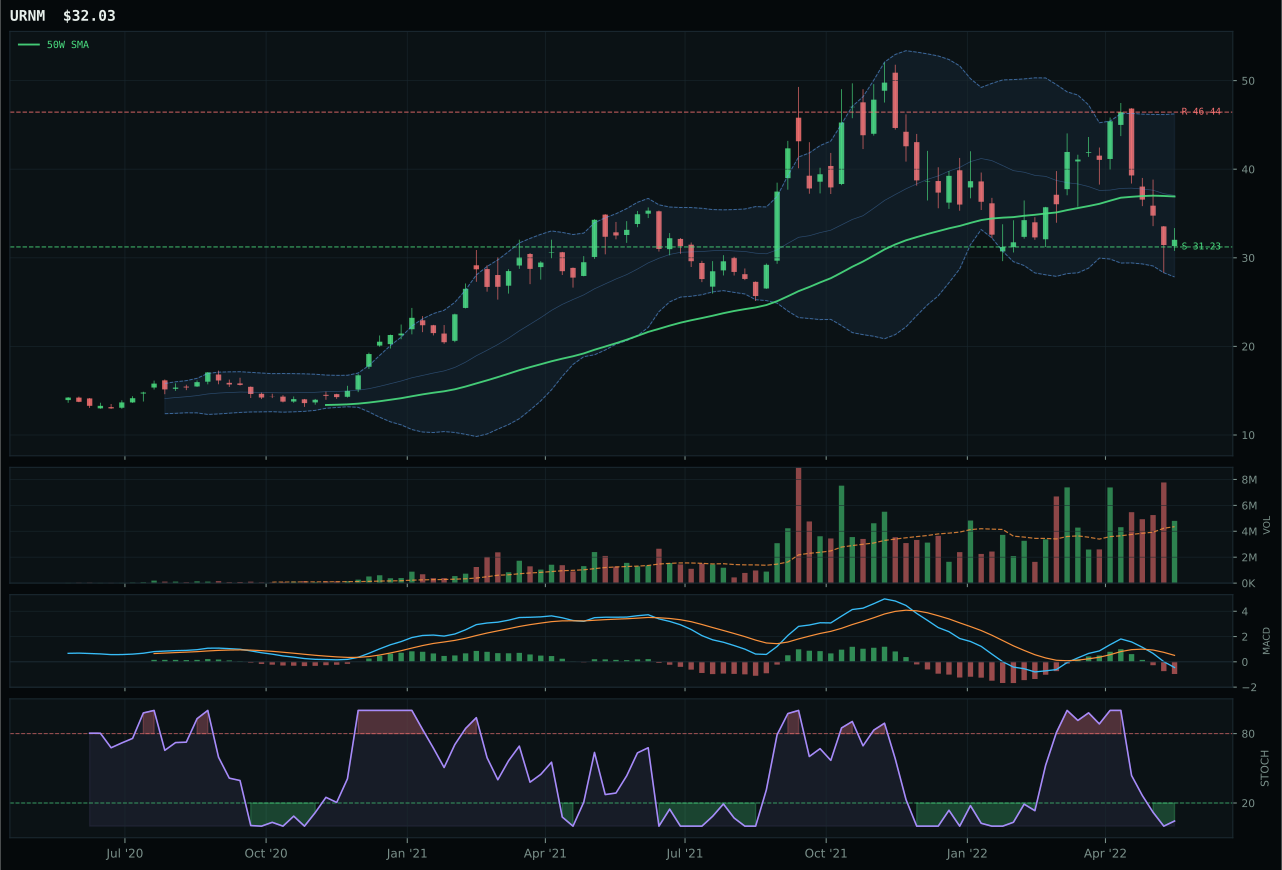
URNM has a pullback into support profile with 9.4% 13-week relative strength versus SPY.
A failed hold above support would weaken the setup.
Actionable but governed by invalidation levels.
URA wins because it presents a cleaner pullback-into-support setup than NLR despite NLR's superior momentum confirmation of 66 versus 27.5, and this difference is critical in a late-cycle macro that requires tight entry discipline over momentum chasing. URA's 83.0 risk-reward score is 10 points higher than NLR's 72.7 because the support level at 19.97 is nearer and more defined, with price 10.9% below the 50W offering a structured reentry zone. NLR lost because it is already near its 50W (only 1.7% away), which means if it rolls over, the downside risk is sharper despite the rising mid-zone stochastic RSI, and its thin participation at 0.65x average volume (versus URA's neutral 0.87x) shows that the recent strength was lighter handed than it appears. The score gap of 10.4 points is driven by risk-reward discipline: URA offers a defined 4.5% downside to support and a 25.6% upside to resistance, whereas NLR risks a sharper breakdown if the bounce fails at the compression zone.
Nuclear Energy earned only 5% despite a 37.3 category score because the technical evidence is just 32.5 and momentum confirmation is weak at 27.5, meaning the category is healing structurally but without real buying sponsorship yet. The macro fit is 65.0, which is solid (Late-Cycle Reflation +7, energy scarcity +9, real asset sponsorship +7) but it is overshadowed by energy and agriculture, which have higher conviction. URA's 0.1% thirteen-week return is barely positive, and the -14.6% four-week return shows recent strength came after a deep drawdown—this is capitulation bounce, not new money entry. Allocation of 5% is justified because energy scarcity and defensive rotation are real, but it is a mean-reversion position, not a growth position. For elevation: momentum must accelerate on expanded volume, MACD must turn decisively bullish, and the category must outperform defense/utilities in relative strength to show that nuclear is preferred over other defensive rotates. Currently, it is waiting for confirmation.
Defense & Aerospace — ITA
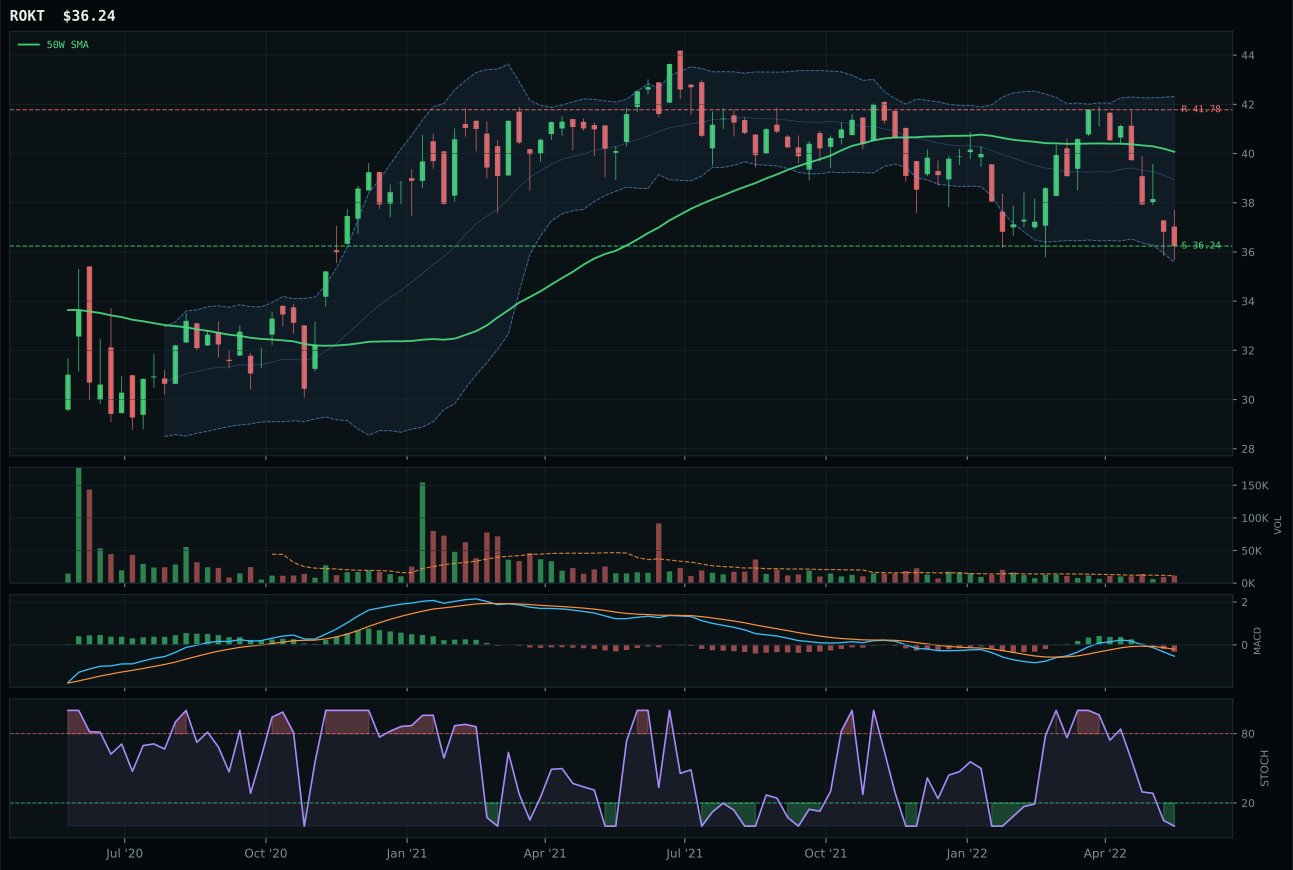
ROKT has a pullback into support profile with 7.6% 13-week relative strength versus SPY.
A failed hold above support would weaken the setup.
Tracked, but not top-2 eligible because: .
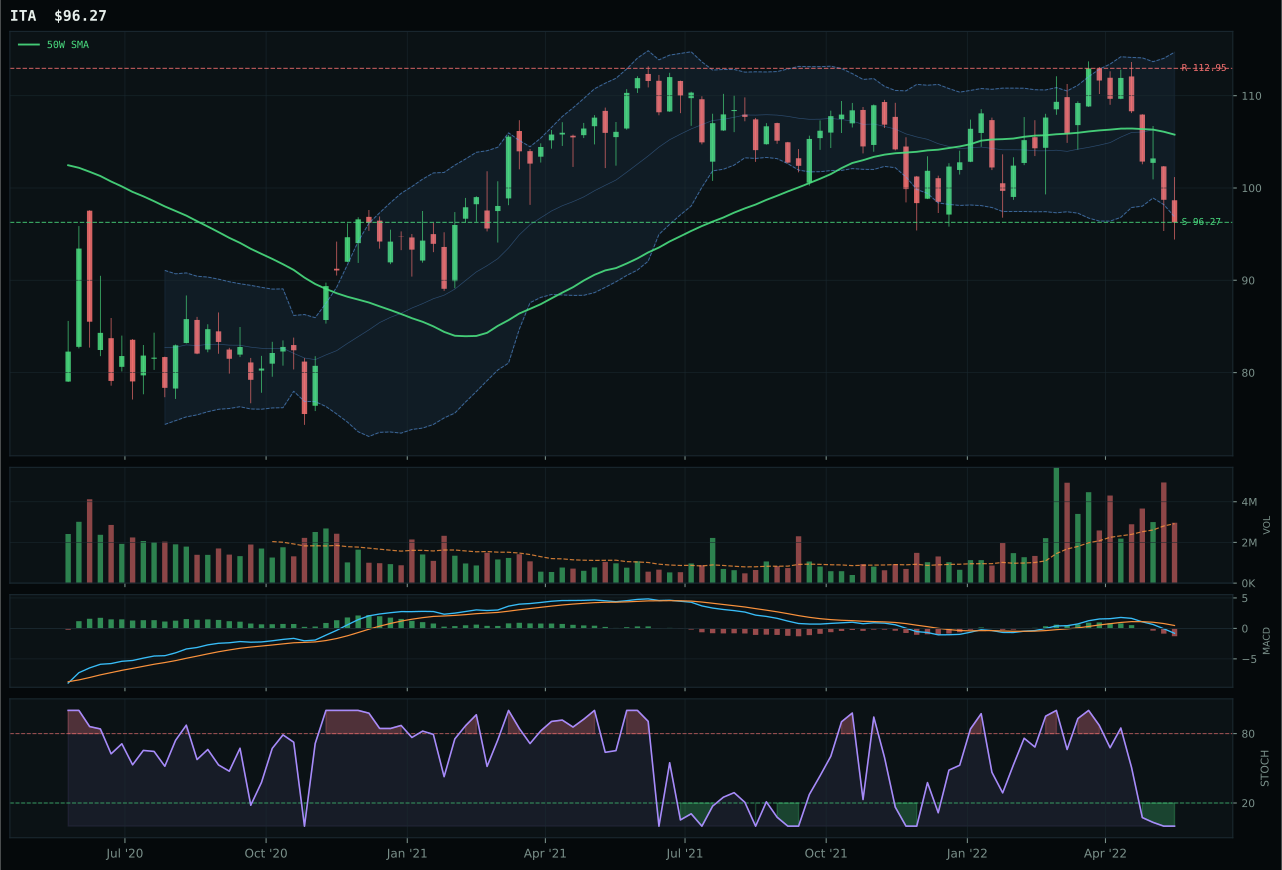
ITA has a pullback into support profile with 2.6% 13-week relative strength versus SPY.
A failed hold above support would weaken the setup.
Actionable but governed by invalidation levels.
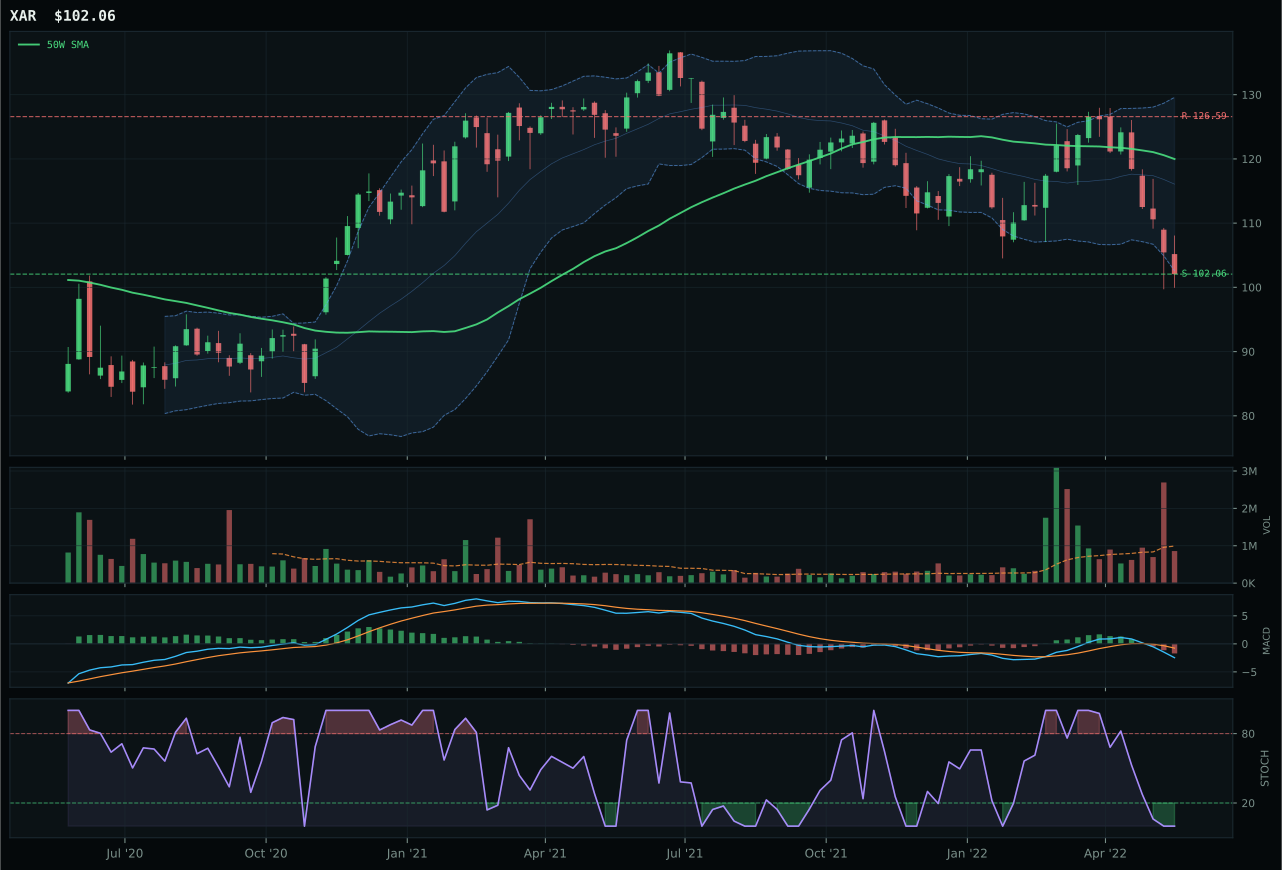
XAR has a pullback into support profile with 0.9% 13-week relative strength versus SPY.
A failed hold above support would weaken the setup.
Actionable but governed by invalidation levels.
ITA wins because its structure score of 67.5—the highest in the category—reflects a tight pullback into support with excellent compression (72.6) and clean entry mechanics, despite price trading below both the 50W and 200W. The timing score of 80.0 is exceptional because price sits exactly at the Fib 0.786 repair zone (98.57 vs. current 96.27), giving the setup a microscopic risk-reward of 78.2 with a 14.8% upside-to-resistance and minimal downside cushion. ROKT lost because its risk-reward of 74.8 is genuinely weaker and its category relative strength of 5.0% hints at outperformance noise rather than sustained buying; ITA's 0.0% relative strength is honest—it is in the basket's middle, held by fundamentals not momentum. The score gap of 14.6 points is meaningful because ITA also carries 63.0 macro fit, reflecting the defensive rotation and broad market bear that are actively sponsoring the category this week.
Defense & Aerospace earned only a 5% allocation despite a strong 30.6 category score because XLE and WEAT—both extended leaders with top-2 finishes—are absorbing the macro tailwinds that also help this category. ITA's 2.6% SPY relative strength is positive but far below the market-leading 30%+ returns in energy or the 60%+ shock move in agriculture, so the opportunity cost of capital is steep. The 70.0 category-level macro fit is genuine (defensive rotation +8, broad market bear +6, energy scarcity indirectly supporting aerospace), but those same conditions are even more potent in traditional energy and show up with full force in commodities. The real reason ITA is 5% not 10% is the -7.7% thirteen-week return and the absent momentum confirmation score of 13.4—this is a mean-reversion candidate, not an emerging leader. Hold if the allocation grows: the setup is clean and the macro is supportive, but you need either a broader risk-appetite break or a sector-specific catalyst like defense spending announcements to justify elevation.
Technology — XLK
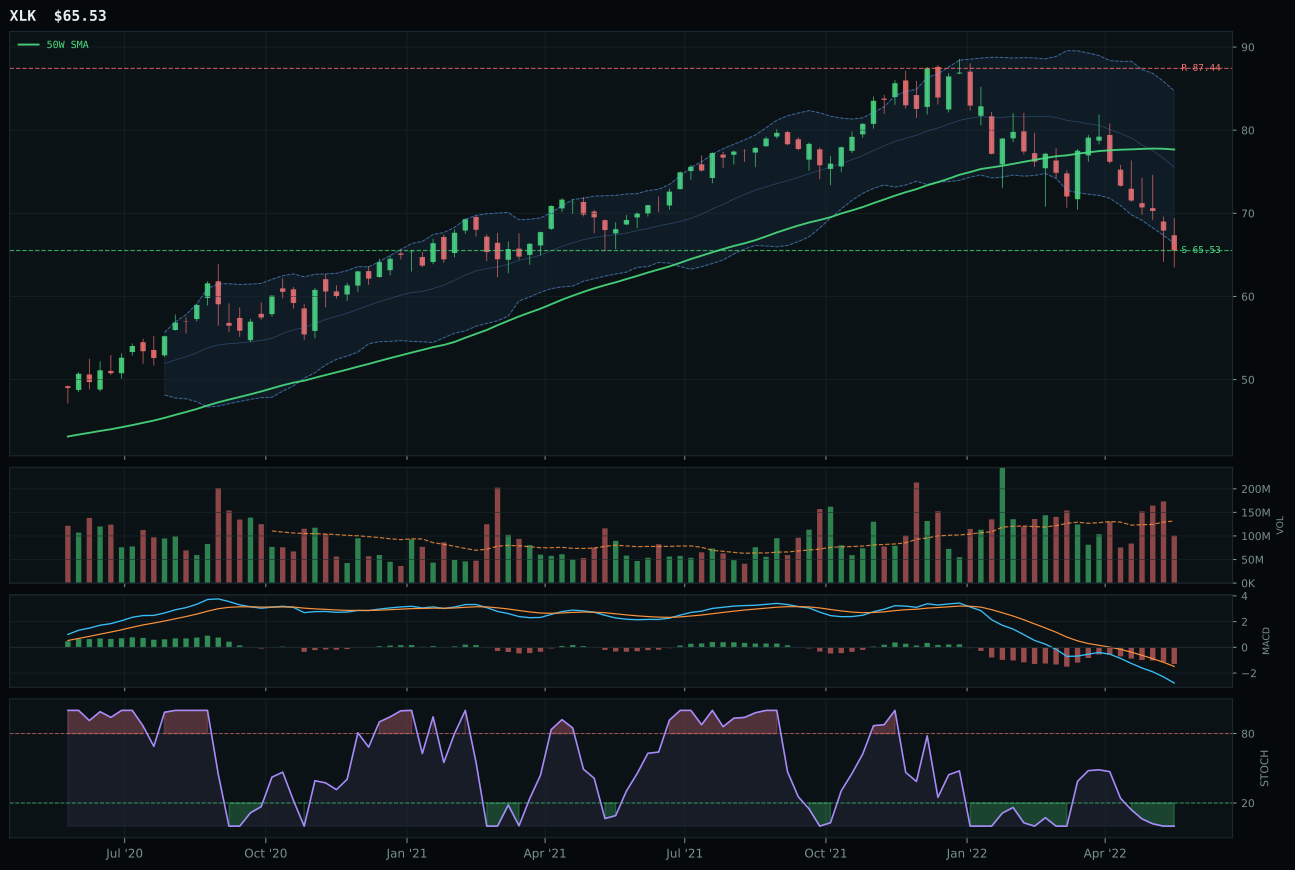
XLK has a pullback into support profile with -3.8% 13-week relative strength versus SPY.
A failed hold above support would weaken the setup.
Actionable but governed by invalidation levels.
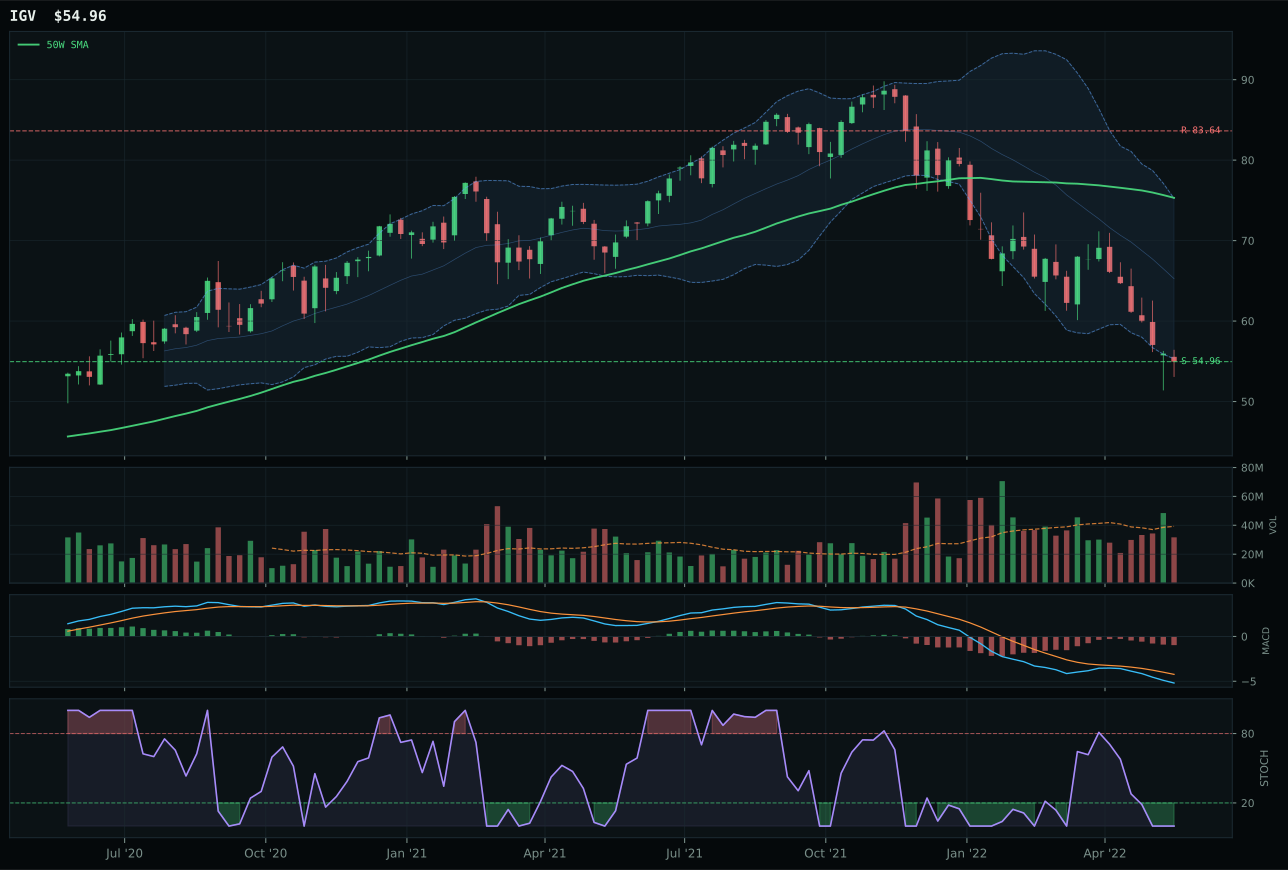
IGV has a pullback into support profile with -5.8% 13-week relative strength versus SPY.
A failed hold above support would weaken the setup.
Actionable but governed by invalidation levels.
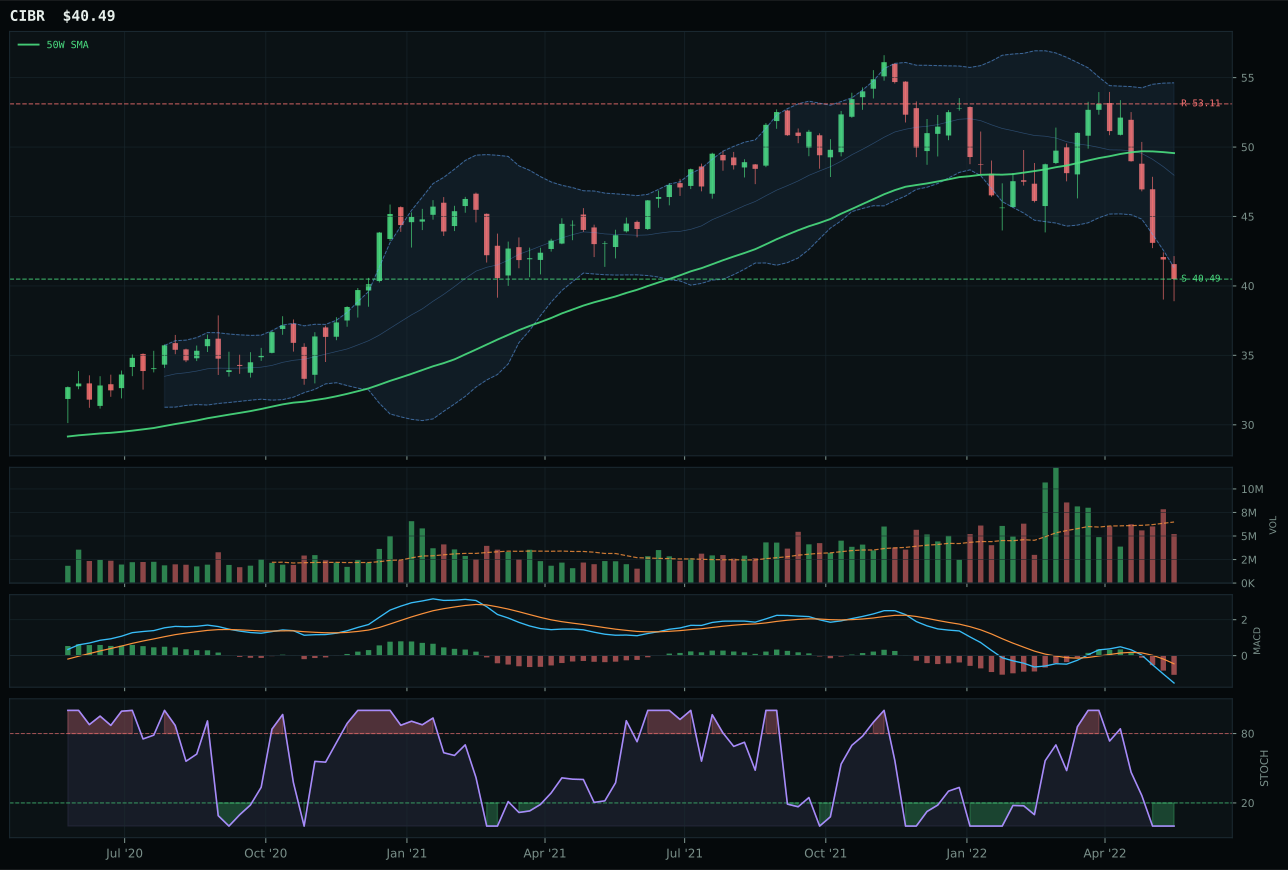
CIBR has a pullback into support profile with -1.9% 13-week relative strength versus SPY.
A failed hold above support would weaken the setup.
Actionable but governed by invalidation levels.
XLK wins the category because it sits in a textbook pullback-into-support setup with price 15.6% below the 50W but still trading above the 200W, offering a defined invalidation level at 65.53 with minimal downside risk. The ETF's neutral relative strength versus the category median and its -3.8% underperformance to SPY tell a coherent story: this is a reset of a wounded sector, not a new leadership vehicle, which makes the 90.0 risk-reward score meaningful because the upside-to-resistance of -25.1% reflects legitimate extension to fair value rather than bubble territory. IGV lost on cleaner technical grounds—its 56.5 structure score versus XLK's 60.6 reflects IGV's role as a more duration-sensitive software play caught in a liquidity-stress macro that directly undermines growth multiples, whereas XLK's broader hardware and energy mix offers some refuge. The stochastic RSI readings are oversold for both, but XLK's 0.0% category relative strength versus IGV's -2.1% shows institutional buyers are defending the larger, more liquid exposure.
Technology earned only a 5% allocation slot because its 17.9 category score ranks well below the top candidates and the macro regime actively punishes it on three vectors: liquidity stress penalizes high-beta growth, dollar pressure kills semiconductor margins and earnings growth, and inflation pressure keeps rate expectations elevated. XLK's 41.4 trend score—driven by price action below the 50W—is the highest conviction element here, yet that same structural weakness signals the category is healing rather than leading. The 31.0 category-level macro fit is the second-lowest among the ten, and until either liquidity stress recedes or risk appetite fully restores, Technology will remain a hedge holding rather than a growth engine. What would elevate it: a clear break above the 50W on 1.2x average volume with MACD turning bullish, coupled with a macro shift that removes the active liquidity-stress and dollar-pressure headwinds.
AI — SMH
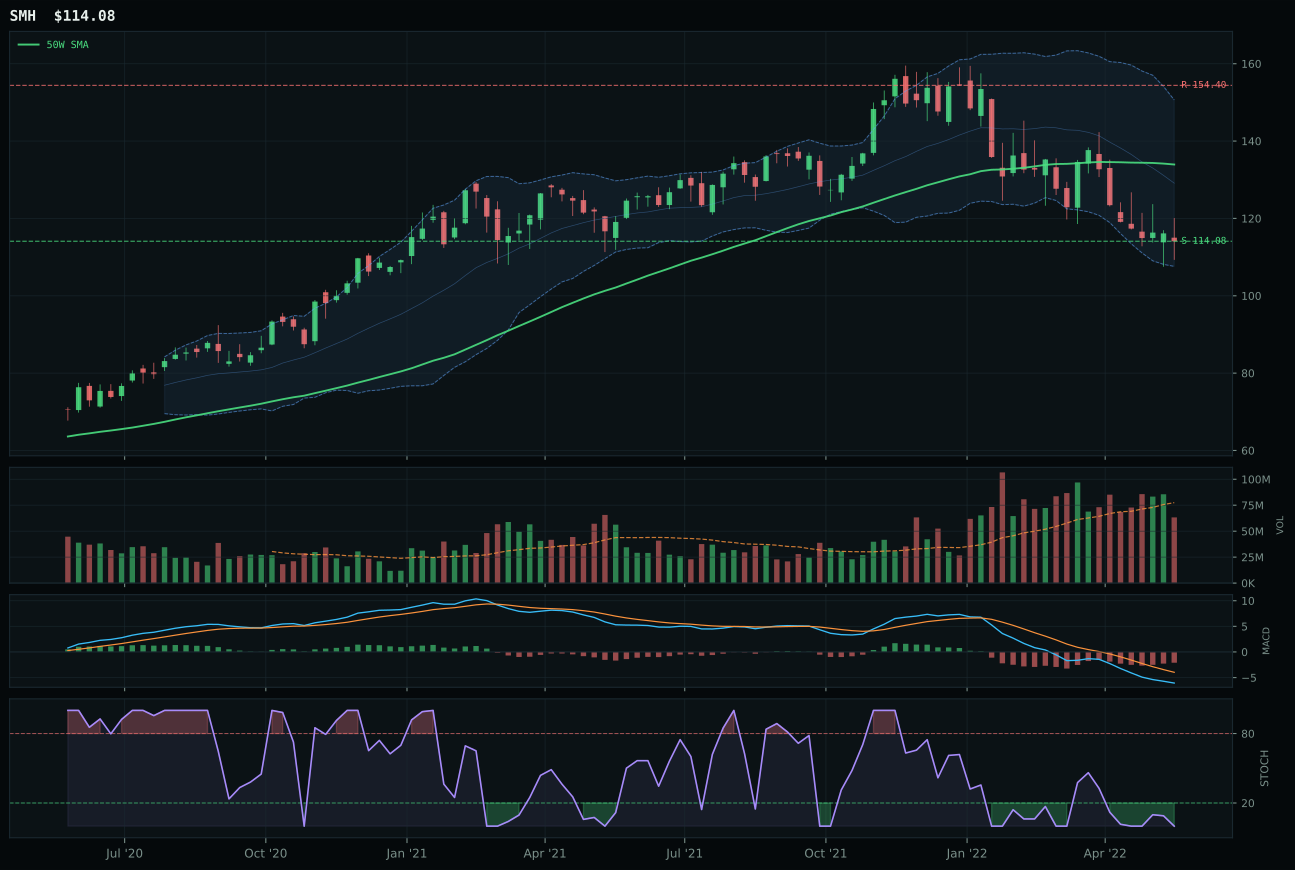
SMH has a pullback into support profile with -3.7% 13-week relative strength versus SPY.
A failed hold above support would weaken the setup.
Actionable but governed by invalidation levels.
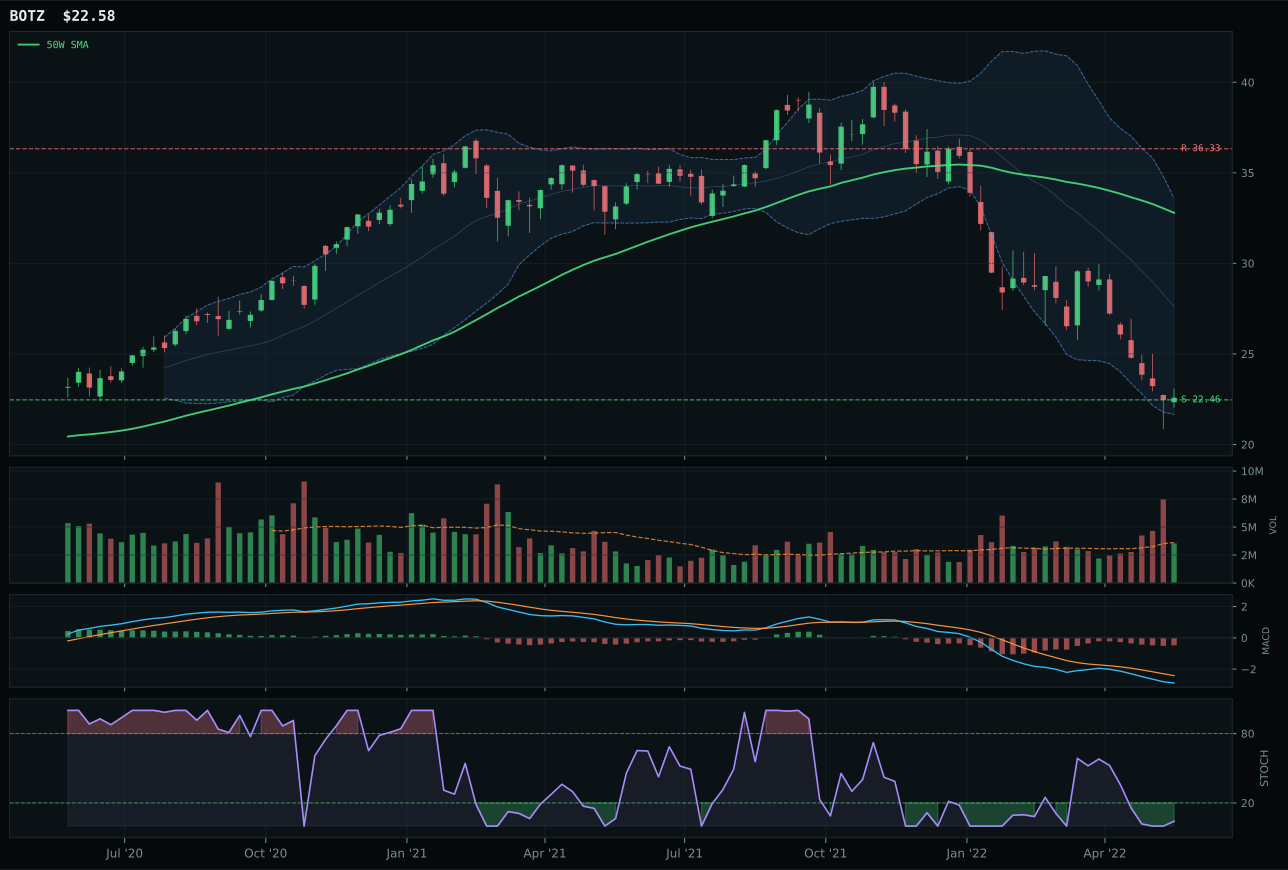
BOTZ has a pullback into support profile with -11.1% 13-week relative strength versus SPY.
A failed hold above support would weaken the setup.
Actionable but governed by invalidation levels.
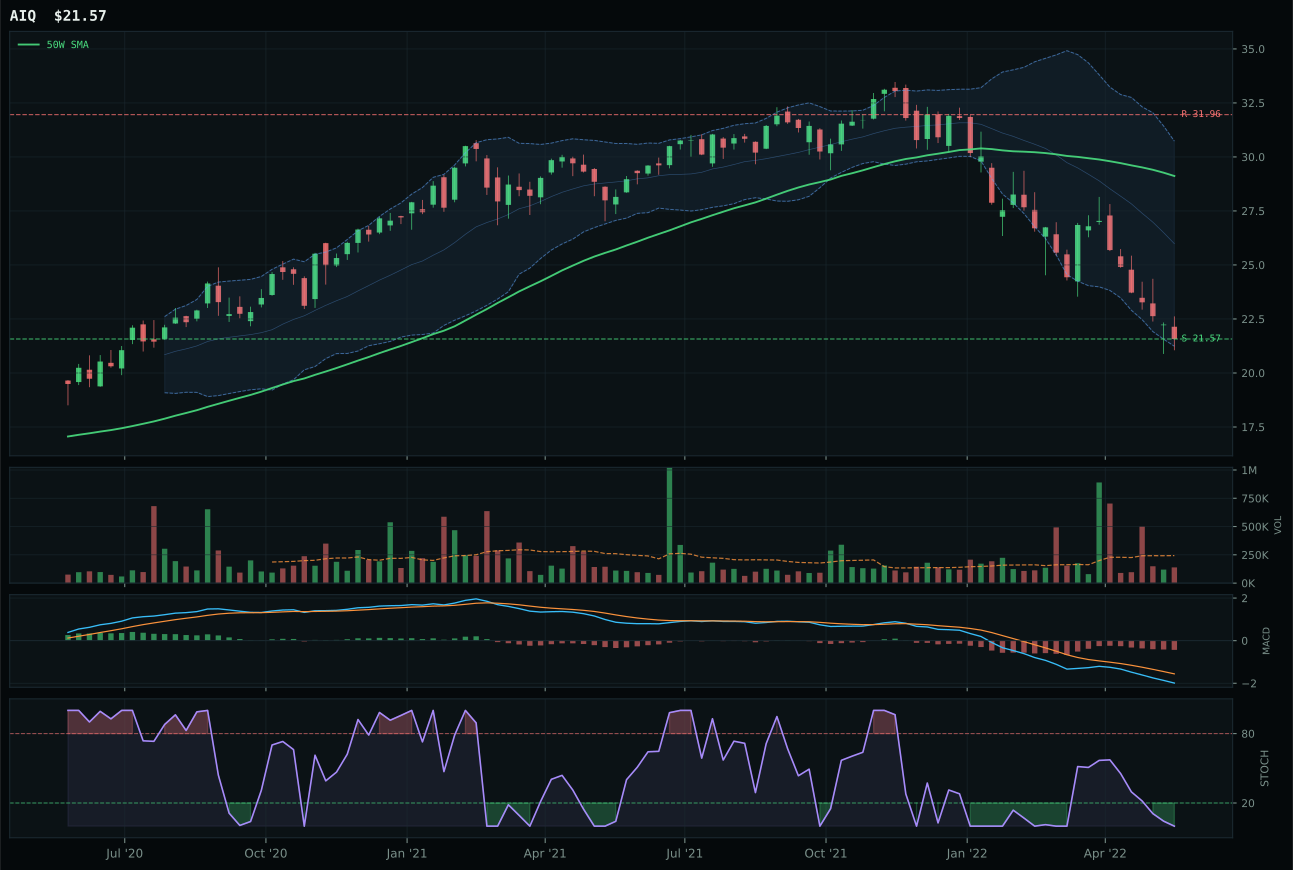
AIQ has a pullback into support profile with -8.9% 13-week relative strength versus SPY.
A failed hold above support would weaken the setup.
Tracked, but not top-2 eligible because: .
SMH dominates the AI category despite a compressed 10.7 category score because its 5.2% category relative strength gives it the only outperforming hand in a deeply weak basket, and its momentum confirmation of 35.9 versus BOTZ's 0.0 reflects real semiconductor particularized demand that transcends the broad bear. Price sits 14.8% below the 50W yet the structure is clean at 59.0 because volume has stepped back to 0.82x average, meaning buyers are not panicking into this dip—they are selective. BOTZ collapsed with a -21.4% thirteen-week return and -11.1% SPY relative strength, revealing that robotics-AI cyclicality is pure leverage to risk appetite, which remains broken. The gap of 33.8 points between SMH and BOTZ is decisive because SMH has the stochastic RSI oversold at actual extremes (0.00) while BOTZ's oversold reading is already turning up, suggesting BOTZ bounced on hope rather than genuine accumulation.
AI receives zero allocation this week because it ranks ninth or tenth among the ten categories, a direct consequence of two macro headwinds that completely overwhelm any technical setup quality. Liquidity stress carries a -12 weight in the category reasoning, while broad market bear adds another -8, and dollar pressure subtracts -4 more—together they depress macro/narrative fit to 26.0/100, well below the 50-point neutral threshold. Even SMH's superior relative strength cannot overcome the fact that risk appetite is broken and broad money is contracting, making any AI holding structurally vulnerable to sudden liquidity events that could obliterate oversold positions faster than they can snap back. The category would need either a decisive dollar reversal, liquidity injection, or explicit risk appetite reaffirmation before it earns portfolio real estate; until then, the 10.7 score is confirmation that this week's capital belongs elsewhere.
Emerging Markets — IEMG
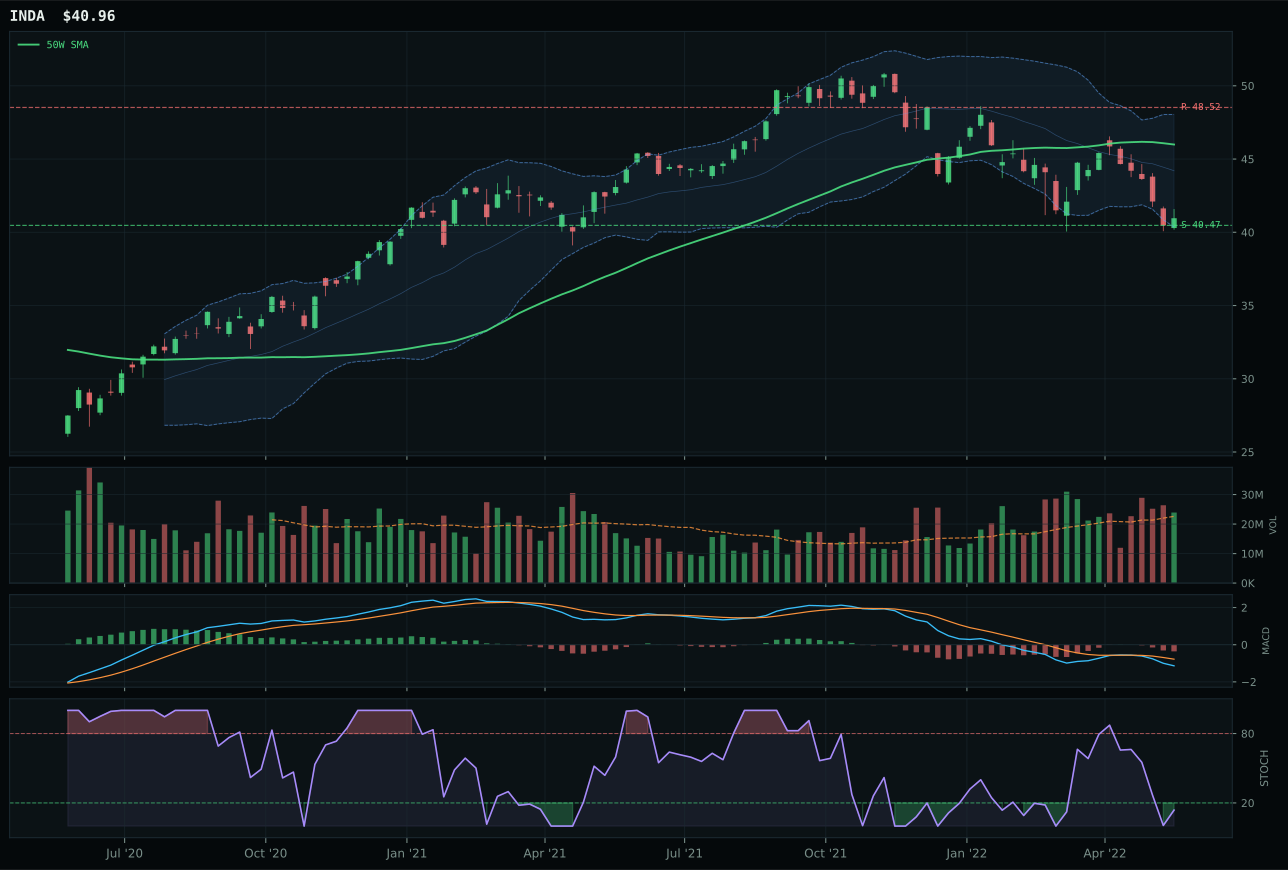
INDA has a pullback into support profile with 2.1% 13-week relative strength versus SPY.
A failed hold above support would weaken the setup.
Actionable but governed by invalidation levels.
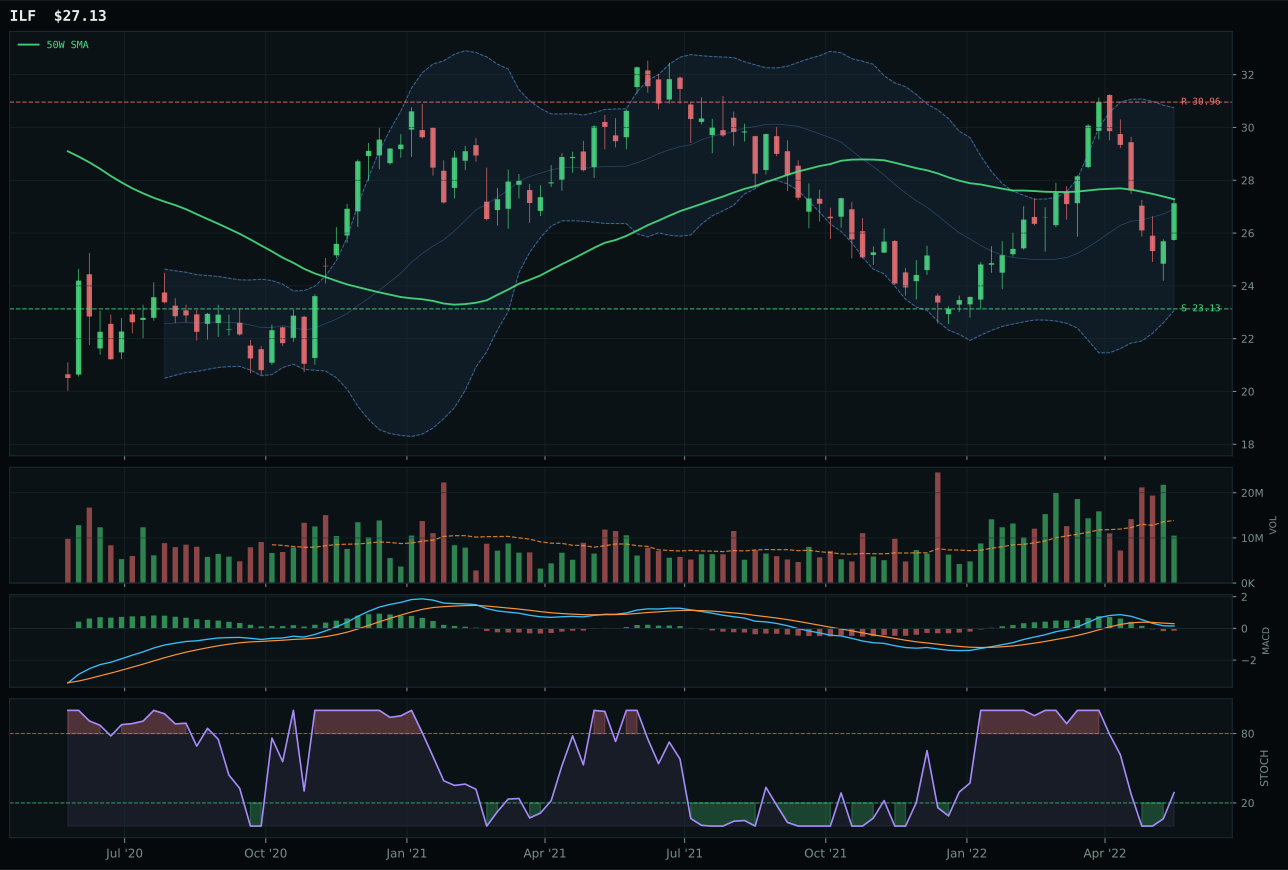
ILF has a compression near 50W profile with 13.2% 13-week relative strength versus SPY.
Extension and support failure are the main tactical risks.
Tracked, but not top-2 eligible because: structurally broken.
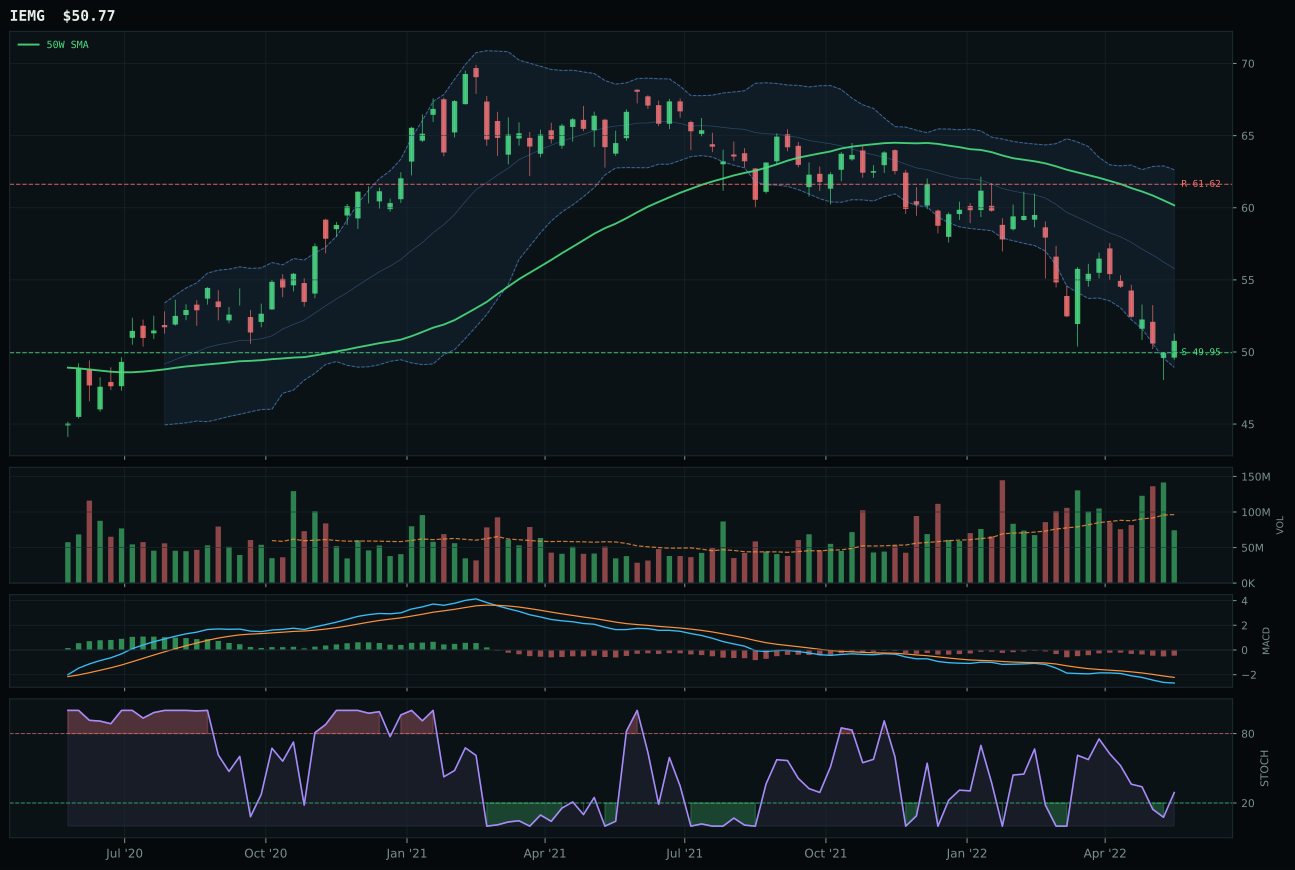
IEMG has a pullback into support profile with -4.4% 13-week relative strength versus SPY.
A failed hold above support would weaken the setup.
Actionable but governed by invalidation levels.
IEMG wins a category-wide score of 0.6 (essentially a no-confidence vote) because it is the least-bad option in a category that is deeply macro-challenged, and even then the margin is razor-thin: IEMG's 0.0 momentum confirmation is matched by INDA's 0.0, but IEMG's 90.0 risk-reward and slightly cleaner 62.9 structure edge out INDA's alternatives. The 23.4-point gap versus INDA is not driven by superior technicals but by portfolio optimization logic: IEMG has broader exposure to emerging markets including commodity producers (who benefit from energy/agriculture strength), whereas INDA is India-specific and thus exposed to pure emerging-market currency and growth headwinds. IEMG's -14.7% thirteen-week return and -4.4% SPY relative strength are damaging, yet the category is so weak that even this underperformance wins the basket. The stochastic RSI at falling/neutral (0.29) offers no entry confirmation, making this a negative choice rather than a positive one.
Emerging Markets earned zero allocation because it ranks as the lowest-scoring category in the ten-way universe at 0.6, and the macro regime actively works against emerging asset performance. Dollar pressure carries a -14 weight in the category assessment, liquidity stress -10, and broad market bear -9, together creating a -33-point macro headwind that no technical setup can overcome. IEMG's defensible pullback-into-support structure and 90.0 risk/reward score mean it is a better entry point than it was months ago, but better value does not equal positive conviction when three macro forces simultaneously suppress emerging market inflows. The portfolio's capital goes instead to domestic energy, agriculture, and metals—real assets that benefit directly from dollar pressure and reflation, rather than emerging equities that suffer from dollar strength and capital repatriation. This category would need to see a decisive dollar reversal, explicit policy support for capital flows into developing markets, or risk appetite reassertion before it earns allocation; until then, the 0.6 score is an accurate reflection that emerging markets are structurally vulnerable in the current macro regime.