
2022-05-13
Informational purposes only. The content in this report, including allocations, analysis, and commentary, is provided solely for informational and educational purposes. It does not constitute financial advice, investment advice, trading advice, or any other type of advice. Past performance does not guarantee future results. Always conduct your own research and consult a qualified financial professional before making investment decisions.
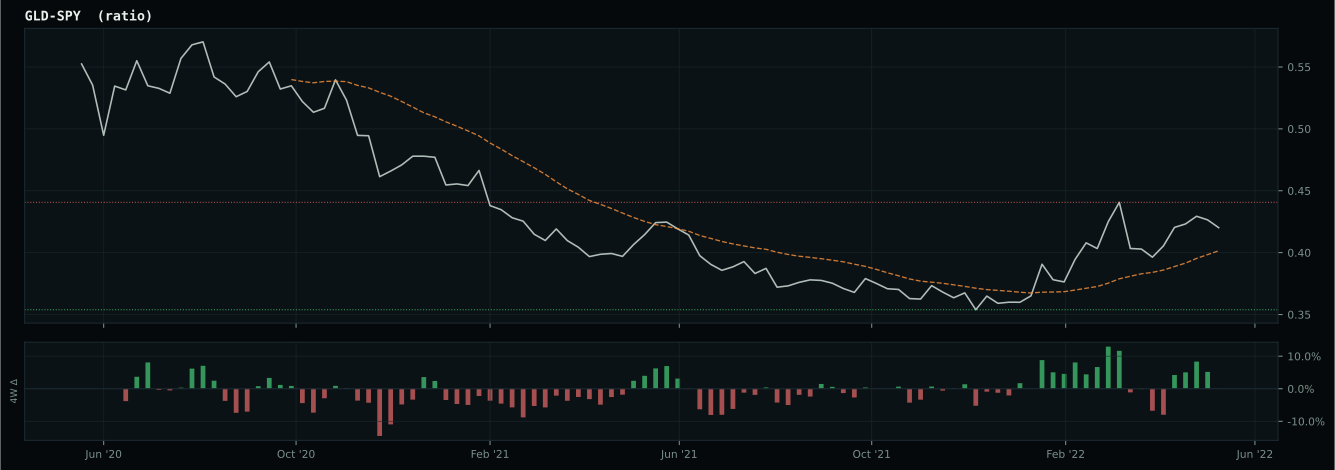
GLD defensive overlay excluded: price is below its 8W SMA. Cause selector will use cash alternative.
Fast-crash circuit breaker triggered: SPY dropped more than 8% from its 4-week high this week. Defensive overlay activated immediately.
Macro risk engine requires the 50% Defensive overlay for this run; payload selected by cause: Liquidity Crisis.
Weekly Allocation
| Ticker | Category | Weight | Role |
|---|---|---|---|
| SGOV | 50% | Overlay | |
| XLE | Traditional Energy | 10% | Top-2 (10%) |
| WEAT | Agriculture & Livestock | 10% | Top-2 (10%) |
| COPX | Industrial Metals | 5% | Tier-2 (5%) |
| XLU | Utilities & Infrastructure | 5% | Tier-2 (5%) |
| SLV | Precious Metals | 5% | Tier-2 (5%) |
| URA | Nuclear Energy | 5% | Tier-2 (5%) |
| IEMG | Emerging Markets | 5% | Tier-2 (5%) |
| ITA | Defense & Aerospace | 5% | Tier-2 (5%) |
Trade Instructions — Monday Open
Sell the tranche from 2022-04-15 (completing its 4-week hold). Buy the new tranche. Instructions show net portfolio changes — same-asset positions cancel, weight changes show the delta.
| Action | Ticker | Instruction |
|---|---|---|
| SELL | XLE | Sell 50% of XLE position (reduce 20.00% → 10.00%) |
| SELL | MOO | Sell entire MOO position (2.50% of portfolio) |
| SELL | XOP | Sell entire XOP position (2.50% of portfolio) |
| SELL | GLD | Sell 8% of GLD position (reduce 15.00% → 13.75%) |
| SELL | URNM | Sell 33% of URNM position (reduce 3.75% → 2.50%) |
| SELL | CIBR | Sell 50% of CIBR position (reduce 2.50% → 1.25%) |
| BUY | SGOV | Buy SGOV — 66.67% of freed cash (adds 12.50% to portfolio) |
| BUY | WEAT | Buy WEAT — 13.33% of freed cash (adds 2.50% to portfolio) |
| BUY | URA | Buy URA — 6.67% of freed cash (adds 1.25% to portfolio) |
| BUY | SLV | Buy SLV — 6.67% of freed cash (adds 1.25% to portfolio) |
| BUY | IEMG | Buy IEMG — 6.67% of freed cash (adds 1.25% to portfolio) |
Current Portfolio After Trade
Combined holdings across all 4 active tranches. Each tranche is 25% of the portfolio.
| Ticker | % of Portfolio | Weight Bar |
|---|---|---|
| SGOV | 35.00% | |
| GLD | 13.75% | |
| XLU | 10.00% | |
| XLE | 10.00% | |
| WEAT | 7.50% | |
| ITA | 5.00% | |
| COPX | 5.00% | |
| URNM | 2.50% | |
| IGF | 2.50% | |
| XLK | 2.50% | |
| URA | 2.50% | |
| CIBR | 1.25% | |
| SLV | 1.25% | |
| IEMG | 1.25% |
Macro Regime — Late-Cycle Reflation
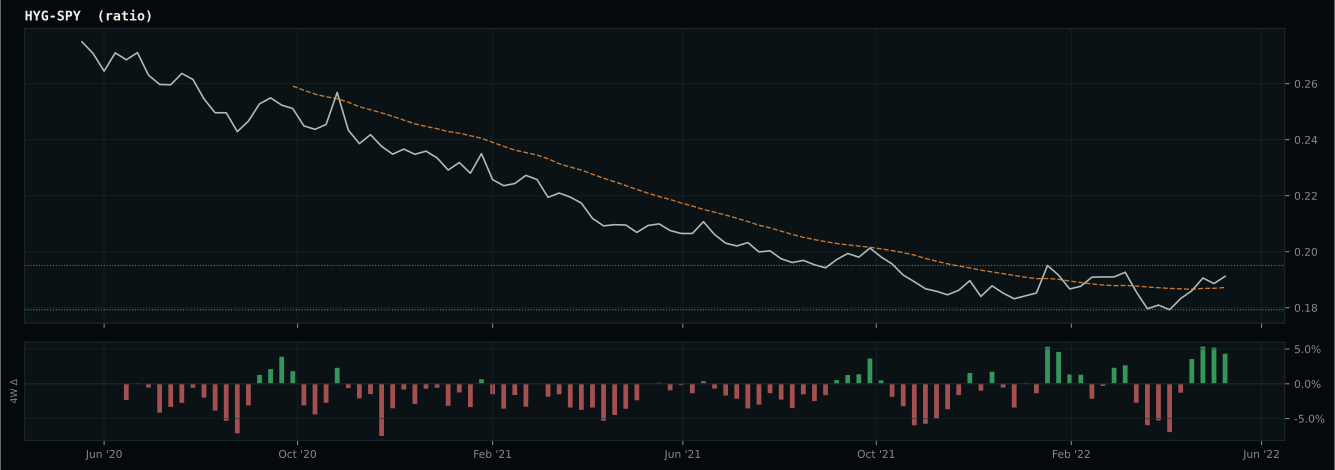
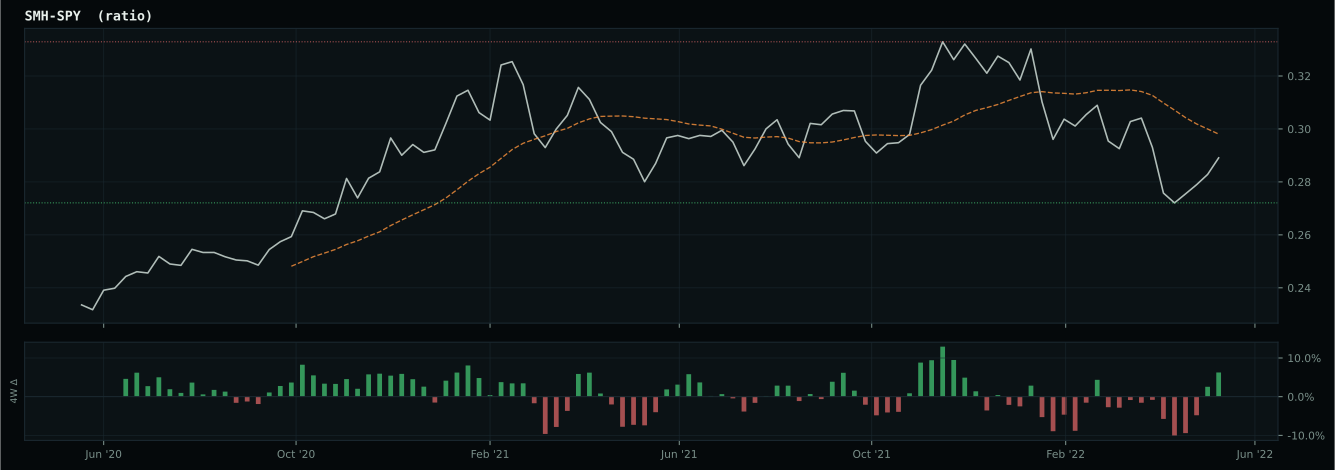
growth data is not confirming the weak market-implied risk appetite signal
Defensive overlay cause is liquidity scarcity: crisis macro risk, severe credit stress, or a dollar/risk-appetite break means cash-like liquidity should lead the defensive sleeve.
Macro Evidence Charts
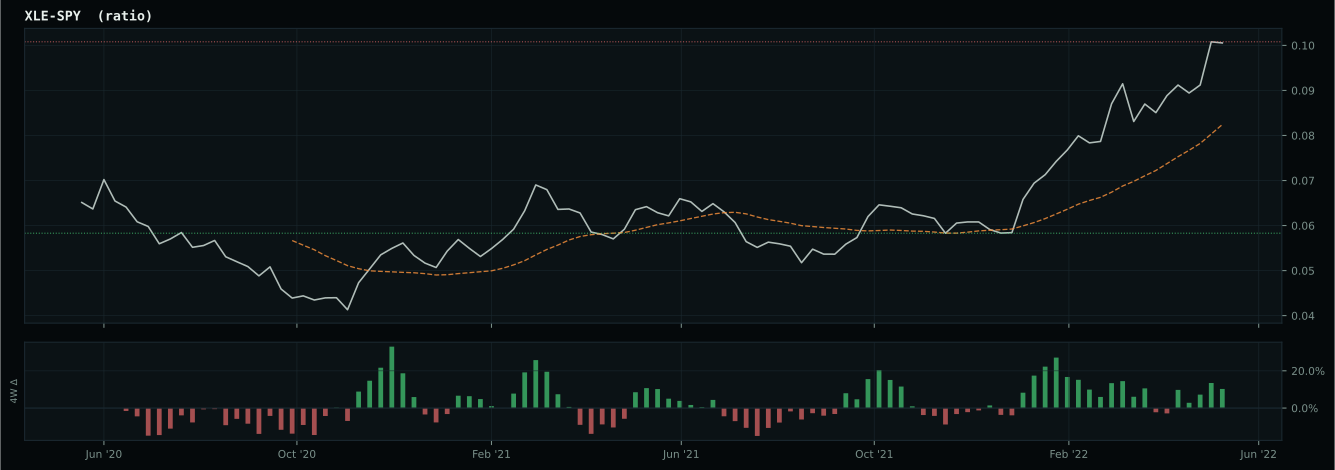
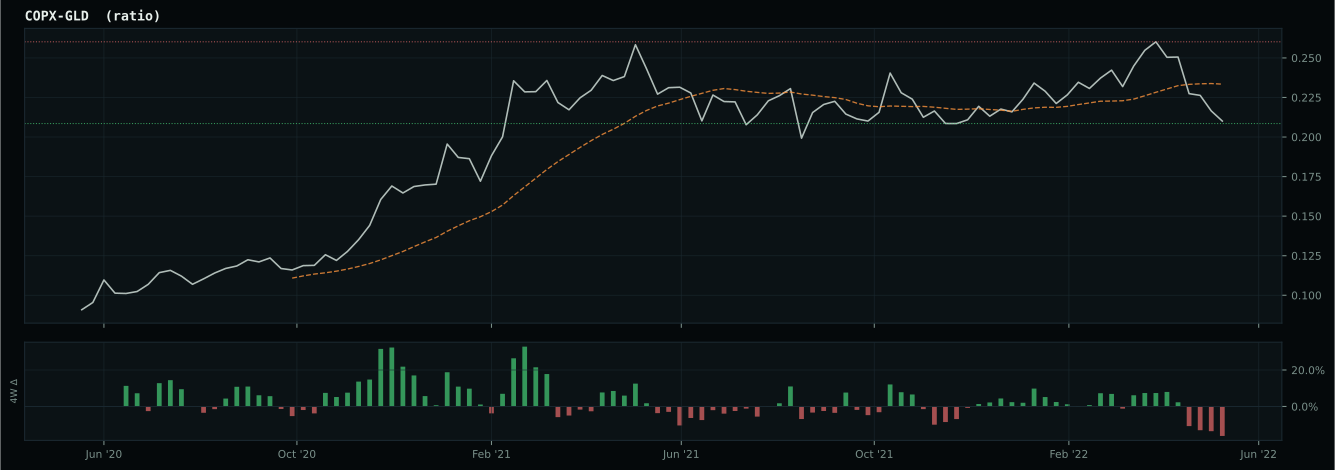
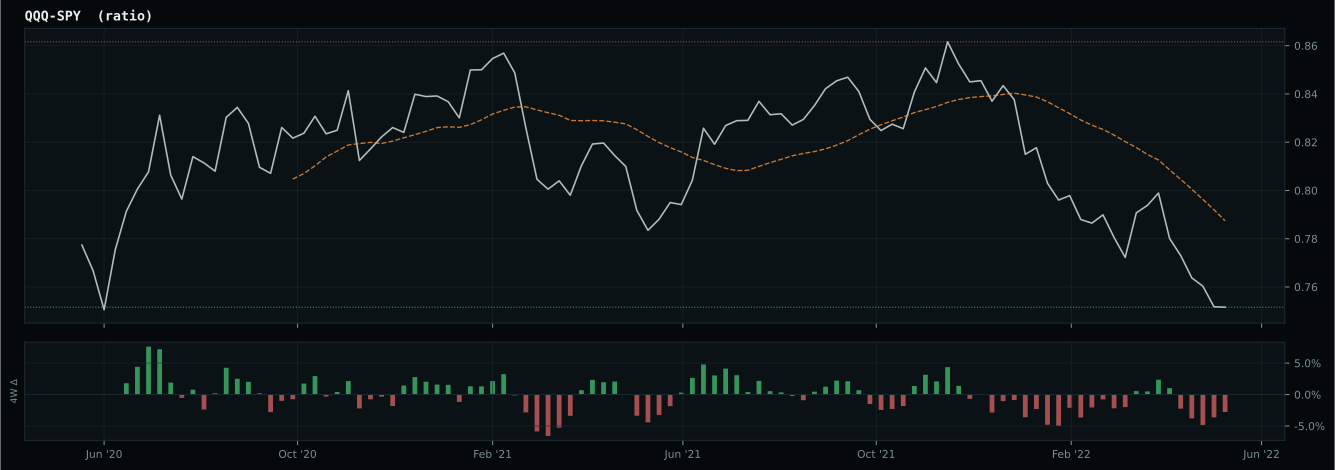
Market-implied signals behind the macro regime scores. Each ratio compares two assets; the direction and slope of the ratio is what the macro engine reads.
Crypto Regime — NoCrypto
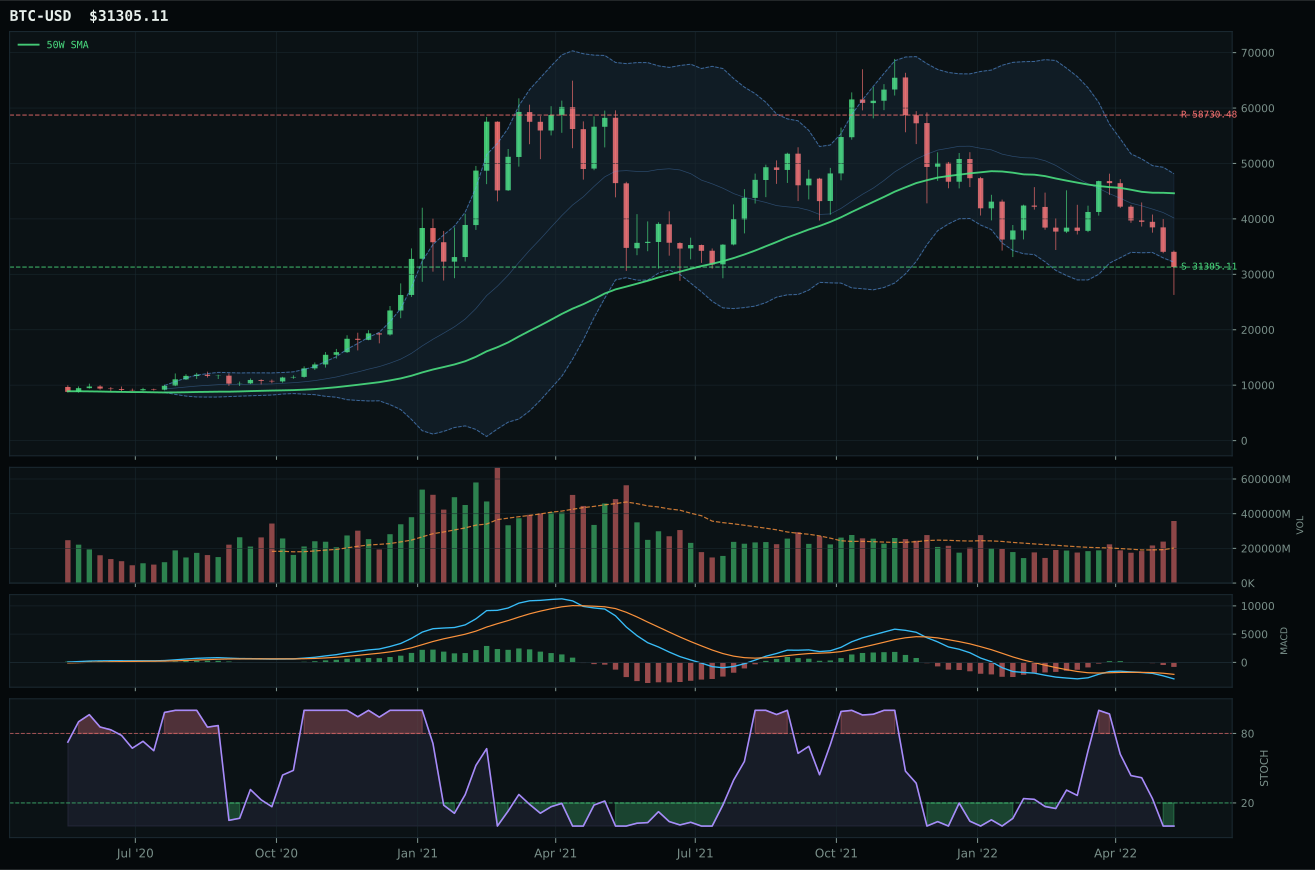
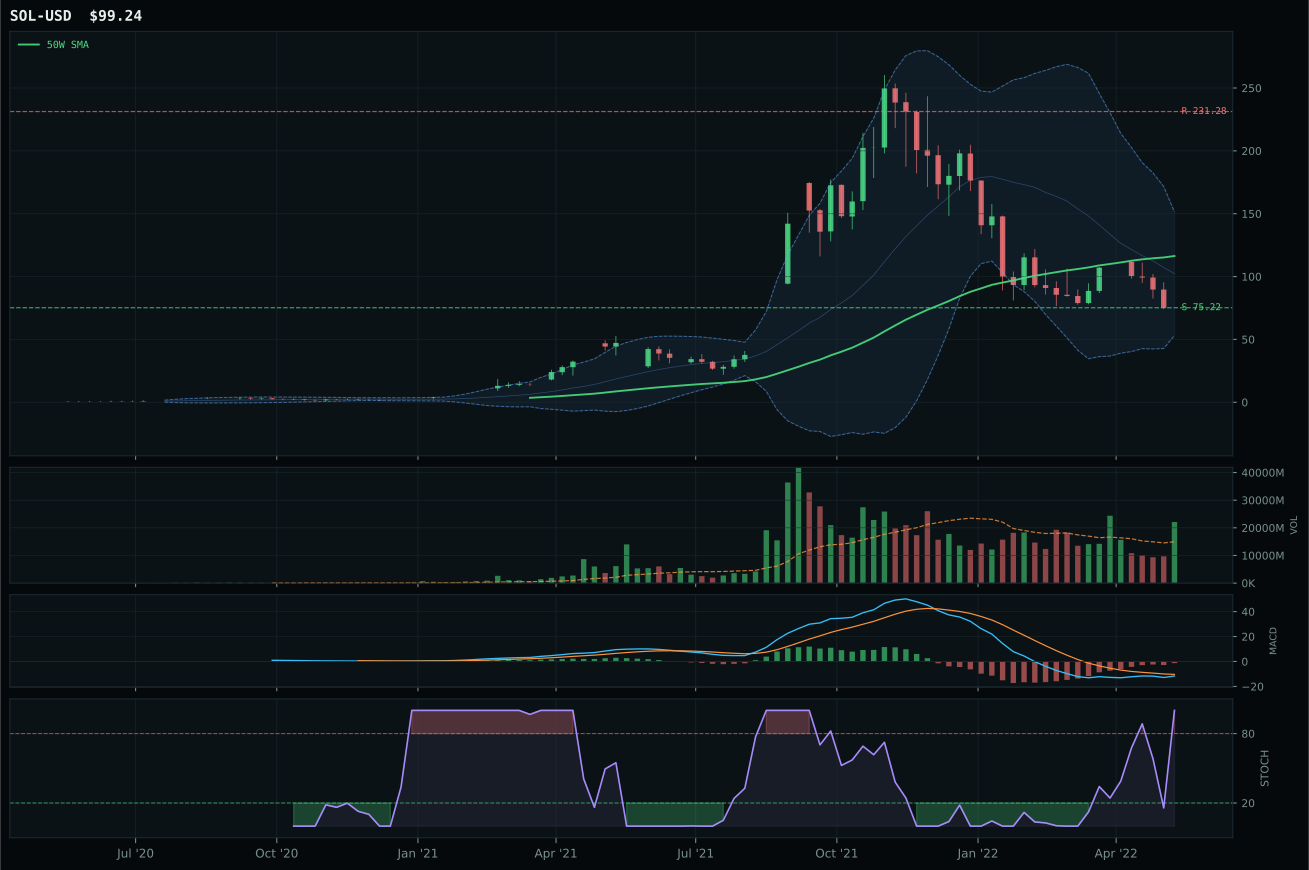
ValueBTC not armed: BTC has not made the first post-breakdown touch of the 200W buy zone after losing the 50W
TrendBTC not confirmed
one or more available conditions failed
Category Rankings
| Rank | Category | Winner | Score | Alloc | 4W Ret | Peers (4W) |
|---|---|---|---|---|---|---|
| 1 | Traditional Energy | XLE | 85.1 | 20% | +6.11% | XOP +16.0% · FCG +15.2% |
| 2 | Agriculture & Livestock | WEAT | 54.7 | 20% | -7.88% | VEGI -7.0% · MOO -5.3% |
| 3 | Industrial Metals | COPX | 44.1 | 10% | +4.49% | PICK -1.9% · REMX +1.4% |
| 4 | Utilities & Infrastructure | XLU | 42.8 | 10% | -1.44% | IGF -2.1% · PAVE -3.6% |
| 5 | Precious Metals | SLV | 40.3 | 10% | +0.31% | GLD +1.6% · GDX +1.6% |
| 6 | Nuclear Energy | URA | 33.0 | 10% | +2.99% | NLR -0.0% · URNM +3.8% |
| 7 | Defense & Aerospace | ITA | 24.1 | 10% | -0.60% | ROKT -3.0% · XAR -3.2% |
| 8 | Technology | XLK | 17.3 | 10% | -5.77% | CIBR -4.1% · IGV -3.9% |
| 9 | AI | SMH | 10.2 | 0% | -6.22% | AIQ -5.0% · BOTZ -4.3% |
| 10 | Emerging Markets | IEMG | — | 0% | -0.87% | INDA -1.7% · ILF -6.9% |
Traditional Energy — XLE
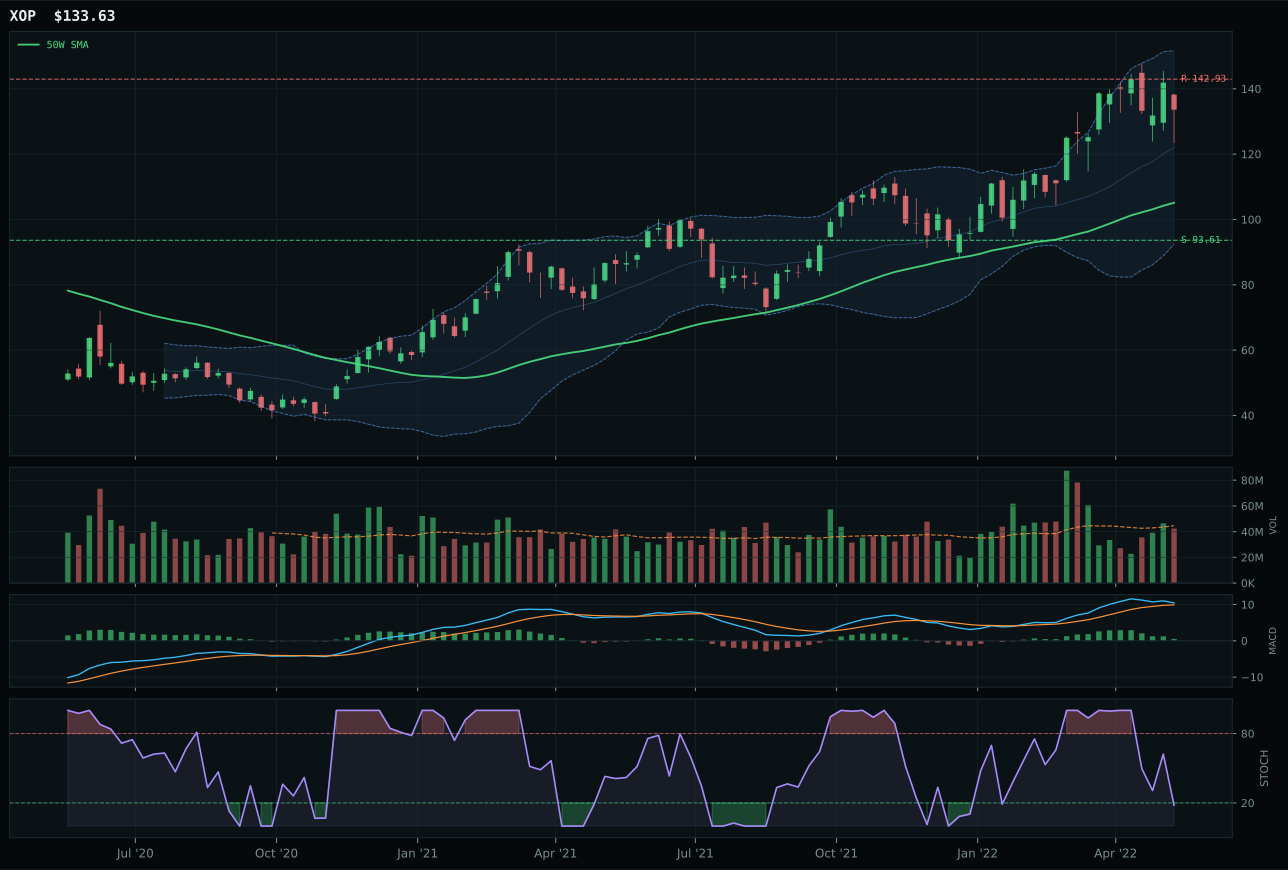
XOP has a vertical extension profile with 26.1% 13-week relative strength versus SPY.
A failed hold above support would weaken the setup.
Actionable but governed by invalidation levels.
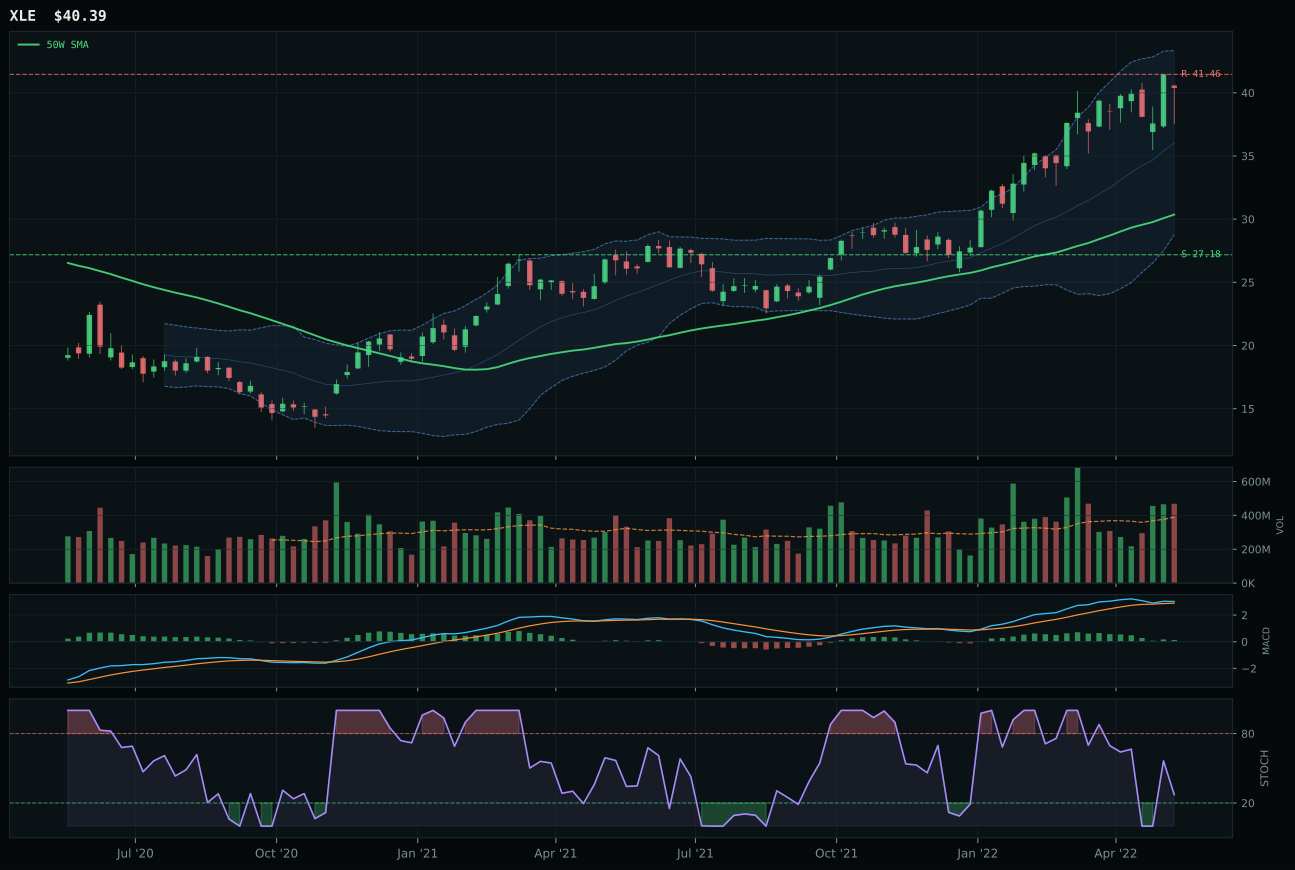
XLE has a vertical extension profile with 23.5% 13-week relative strength versus SPY.
A failed hold above support would weaken the setup.
Actionable but governed by invalidation levels.
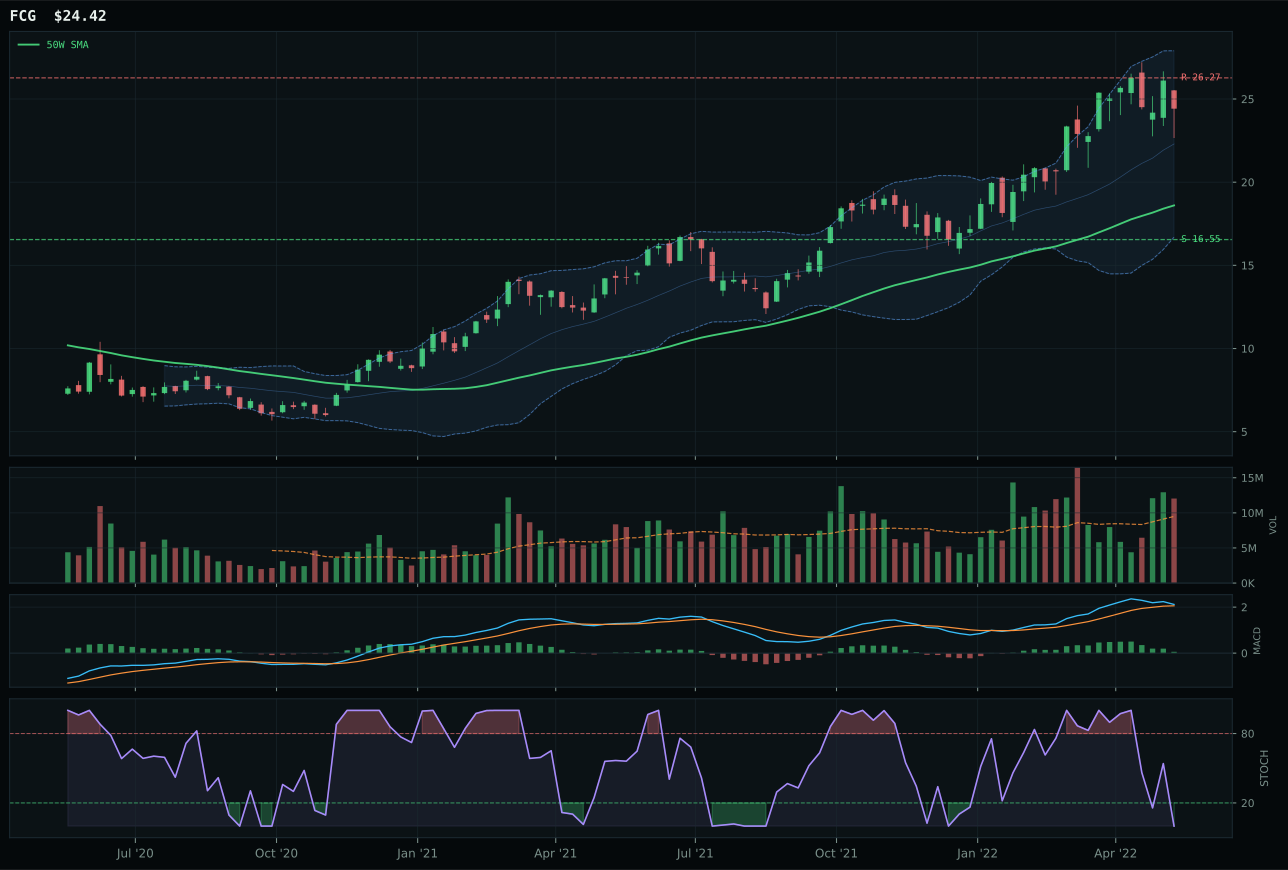
FCG has a vertical extension profile with 26.0% 13-week relative strength versus SPY.
A failed hold above support would weaken the setup.
Actionable but governed by invalidation levels.
XLE wins decisively with a 4.9-point margin over XOP because energy's macro tailwind is so strong that the category can afford entry risk in exchange for defensive breadth. XLE trades at 33.0% extension above the 50W with MACD bullish but flattening and stochastic RSI at 0.27—technically extended but not yet showing exhaustion. XOP is actually more extended at RS SPY 26.1% versus XLE's 23.5%, but XOP's stochastic RSI is oversold at 0.00, meaning XOP is overbought on price but underbought on momentum oscillators, a contradictory signal. More strategically, XLE represents integrated oil majors with cash-flow discipline and balance-sheet defense, while XOP represents exploration upside. In a Late-Cycle Reflation with energy scarcity driving the entire category, the integrated cash-flow story beats the exploration lottery. XLE's volume-price confirmation of 72.5 and persistence of 75.2 reflects organized accumulation, not speculative squeeze.
Traditional Energy ranks among the top-2 categories at a final score of 85.1, earning 10% allocation as a co-leader with Agriculture. The category macro fit of 97.0/100 is extraordinary: energy scarcity is active (+16), Late-Cycle Reflation helps this exposure (+12), inflation pressure is active (+10), supply shortage is active (+9), and real asset sponsorship is active (+7). The geopolitical backdrop—Russia supply disruption, Saudi spare capacity constraints, and declining capex discipline across the industry—creates a genuine scarcity regime, not a cyclical boom. XLE's technical evidence of 69.8/100 combines with this 97.0 macro fit to yield the 85.1 category score, the highest in the portfolio. Energy is the trade that works in both directions: if growth stalls, central banks cannot cut rates enough to offset supply shock inflation; if growth holds, energy demand remains bid. This is as close to a no-lose setup as Late-Cycle Reflation offers. XLE earns a top-2 10% seat because scarcity is the only real macro force left in a liquidity crisis.
Agriculture & Livestock — WEAT
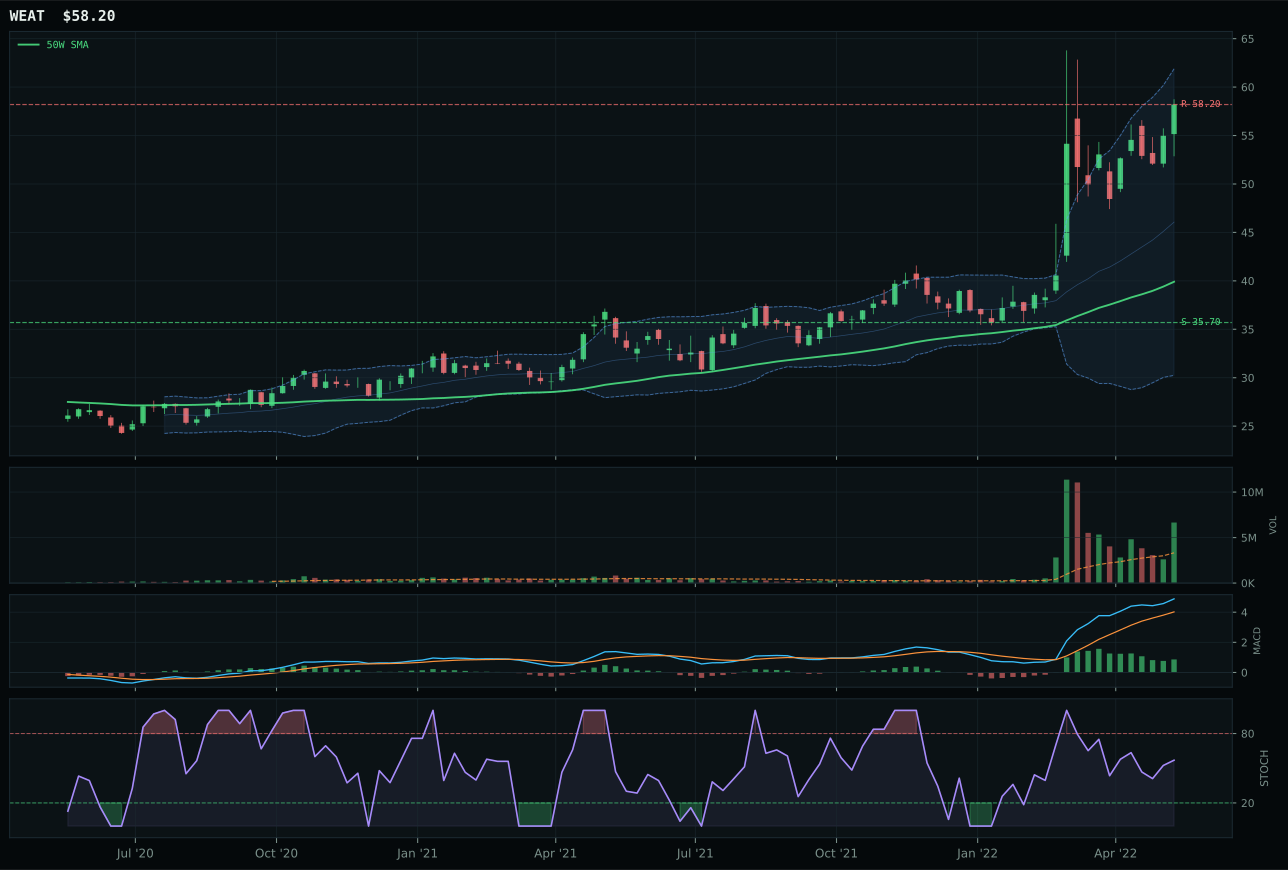
WEAT has a vertical extension profile with 59.8% 13-week relative strength versus SPY.
A failed hold above support would weaken the setup.
Actionable but governed by invalidation levels.
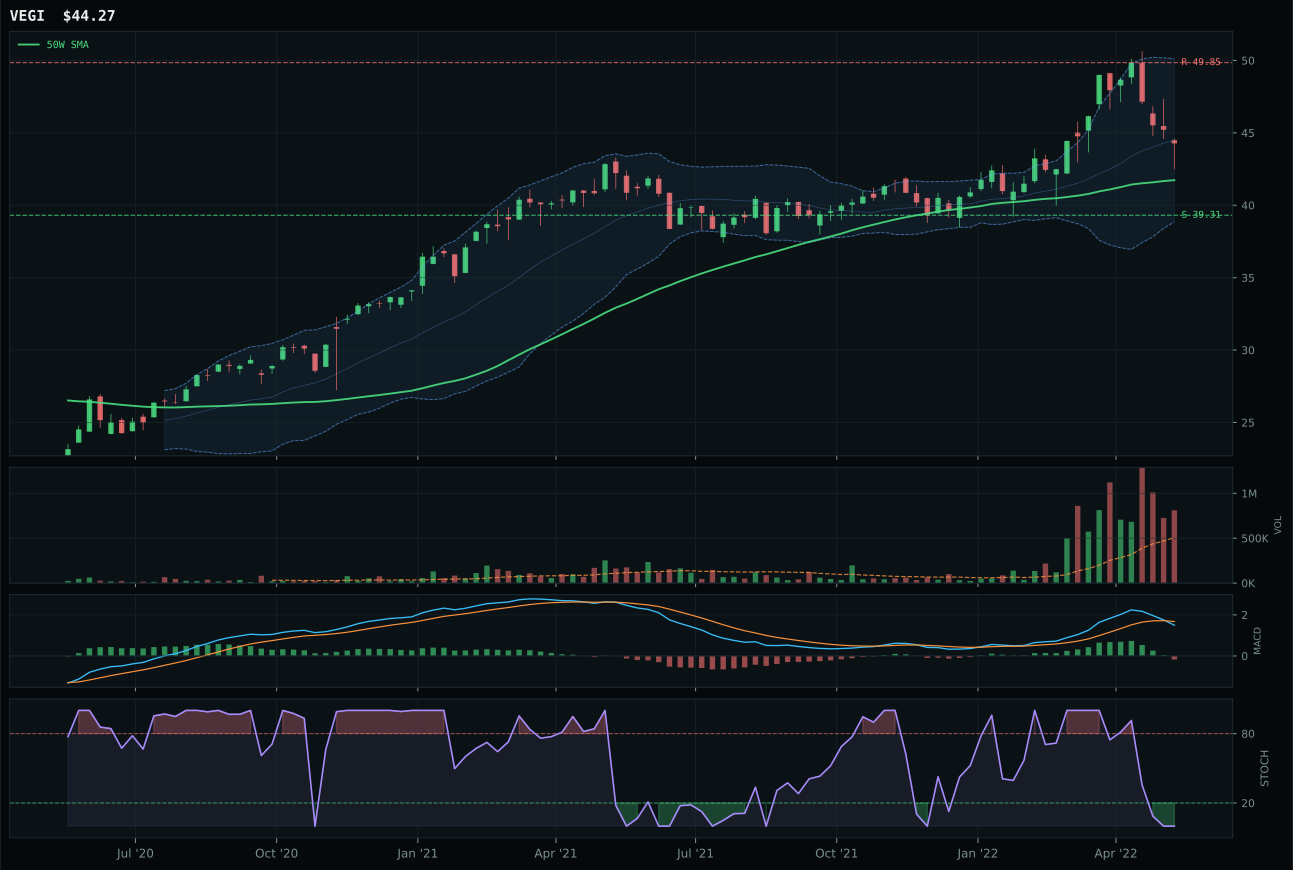
VEGI has a neutral structure profile with 11.2% 13-week relative strength versus SPY.
A failed hold above support would weaken the setup.
Actionable but governed by invalidation levels.
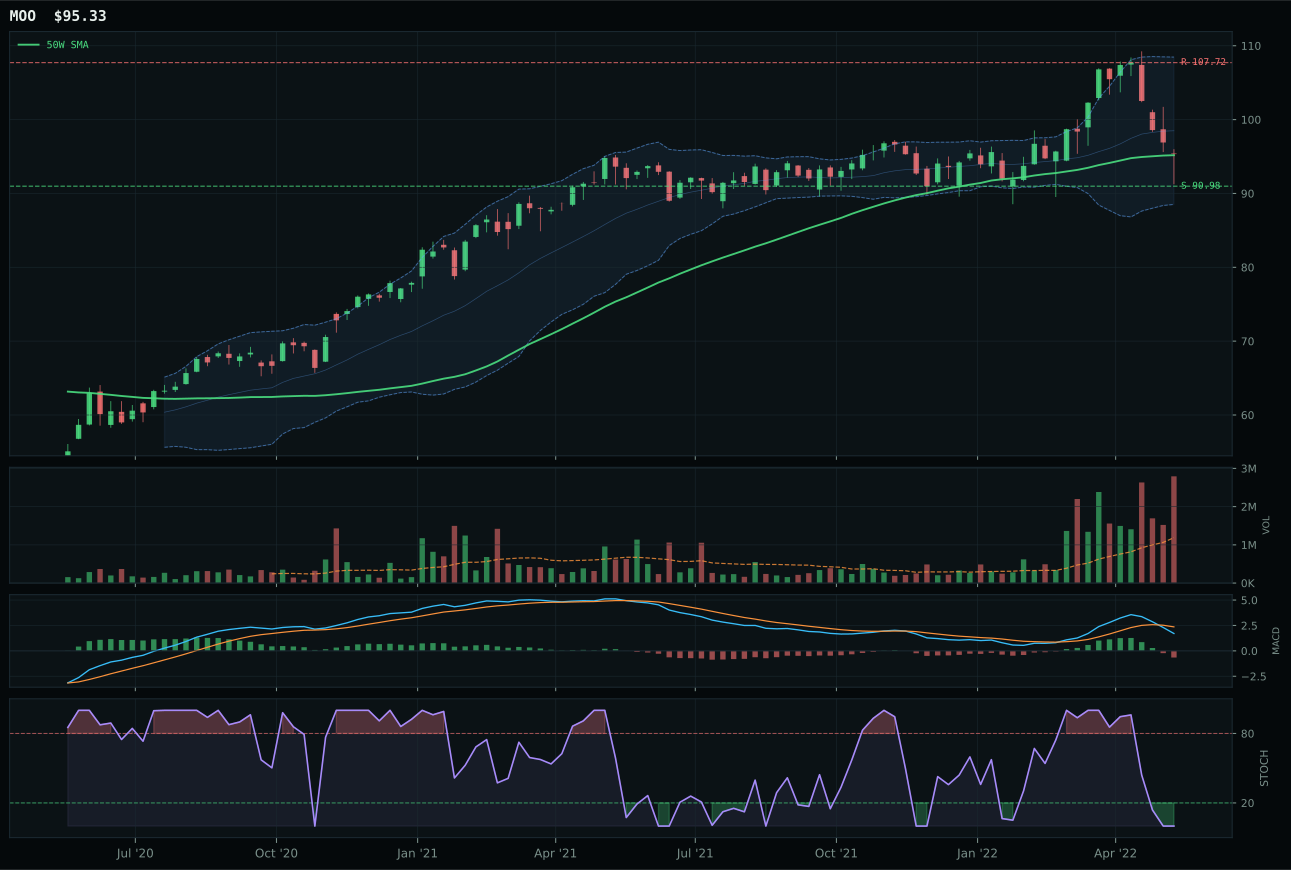
MOO has a pullback into support profile with 7.4% 13-week relative strength versus SPY.
A failed hold above support would weaken the setup.
Actionable but governed by invalidation levels.
WEAT is the week's outlier: price is 45.8% extended above the 50W with MACD bullish but flattening and stochastic RSI rising mid-zone at 0.57—a setup that would ordinarily scream exhaustion and entry risk. Instead, WEAT's 13W return of 51.0%, SPY-relative strength of 59.8%, and category-relative strength of 48.6% prove that buying pressure remains organized and distributed, not panicked retail. Structure scores 72.8/100 despite vertical extension, cleanliness at 58.3 and compression at 45.6 indicate the move is broad-based rather than a narrow spike. Volume confirmation hits 100.0/100 and persistence hits 100.0/100, meaning every technical confirmation tool registers the same message: this is trend, not bounce. VEGI's MACD is bearish/weakening with stochastic RSI oversold and volume distribution pressure, positioning it as a laggard fighting the category current rather than swimming with it.
Agriculture & Livestock ranks among the top-2 categories at a score of 54.7, earning 10% allocation at the overweight tier. The macro case is overpowering: Late-Cycle Reflation helps this exposure (+8), supply shortage is active (+13), inflation pressure is active (+10), real asset sponsorship is active (+8), and commodity breadth positive is active (+5). That 90.0/100 category macro fit combines with WEAT's 100.0/100 technical evidence to drive the final score. Critically, WEAT's setup is not built on hope; it is built on scarcity. The Ukraine supply shock, global grain draw, and bifurcated currency regimes have created a real imbalance, not a sentiment bubble. The 45.8% extension above the 50W is steep enough that new buyers should expect volatility, but the risk/reward of 37.3/100 reflects that upside to resistance is now nearly exhausted—this is a position for holders, not for fresh aggressive entry. WEAT earns its top-2 seat because agricultural scarcity is one of the few remaining real macro forces in a liquidity crisis.
Industrial Metals — COPX
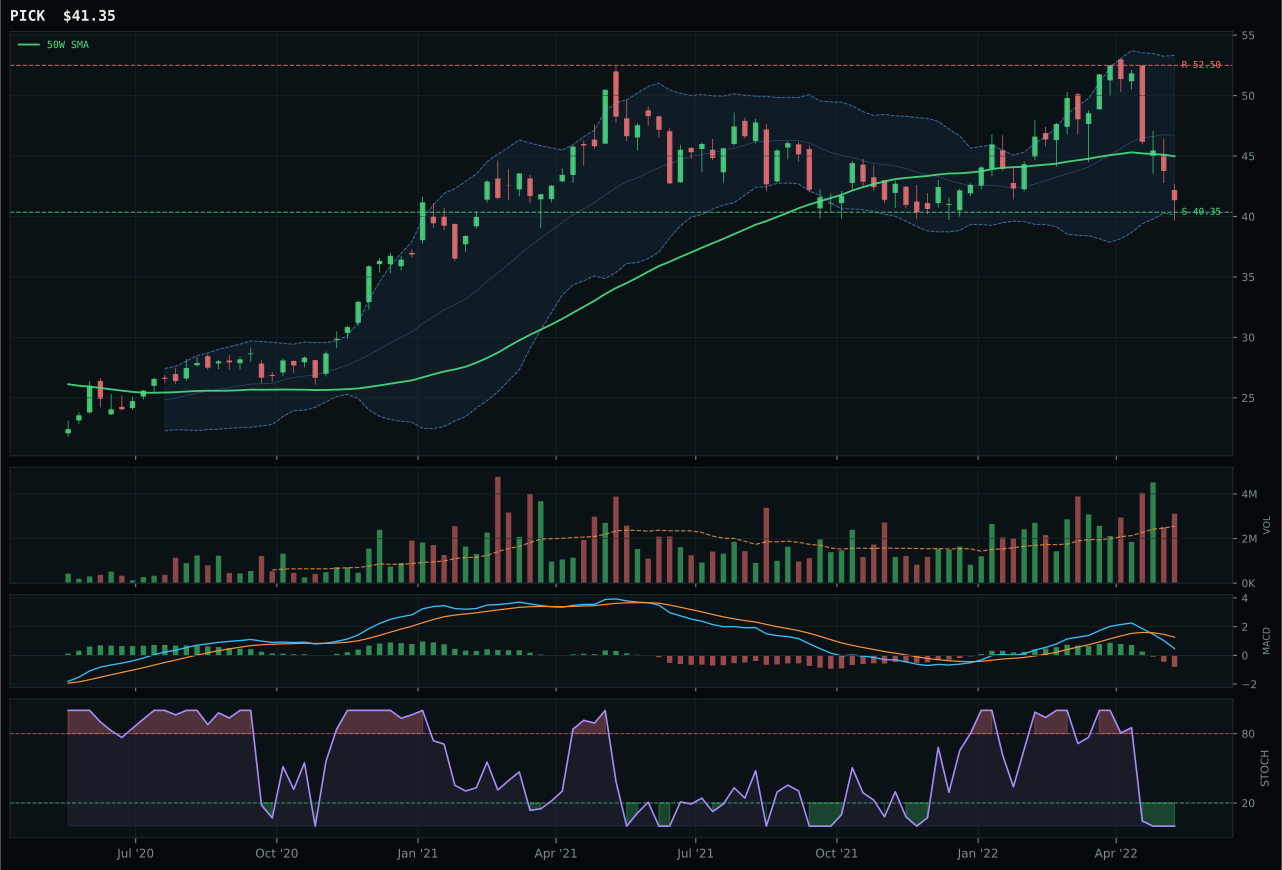
PICK has a pullback into support profile with -2.5% 13-week relative strength versus SPY.
A failed hold above support would weaken the setup.
Actionable but governed by invalidation levels.
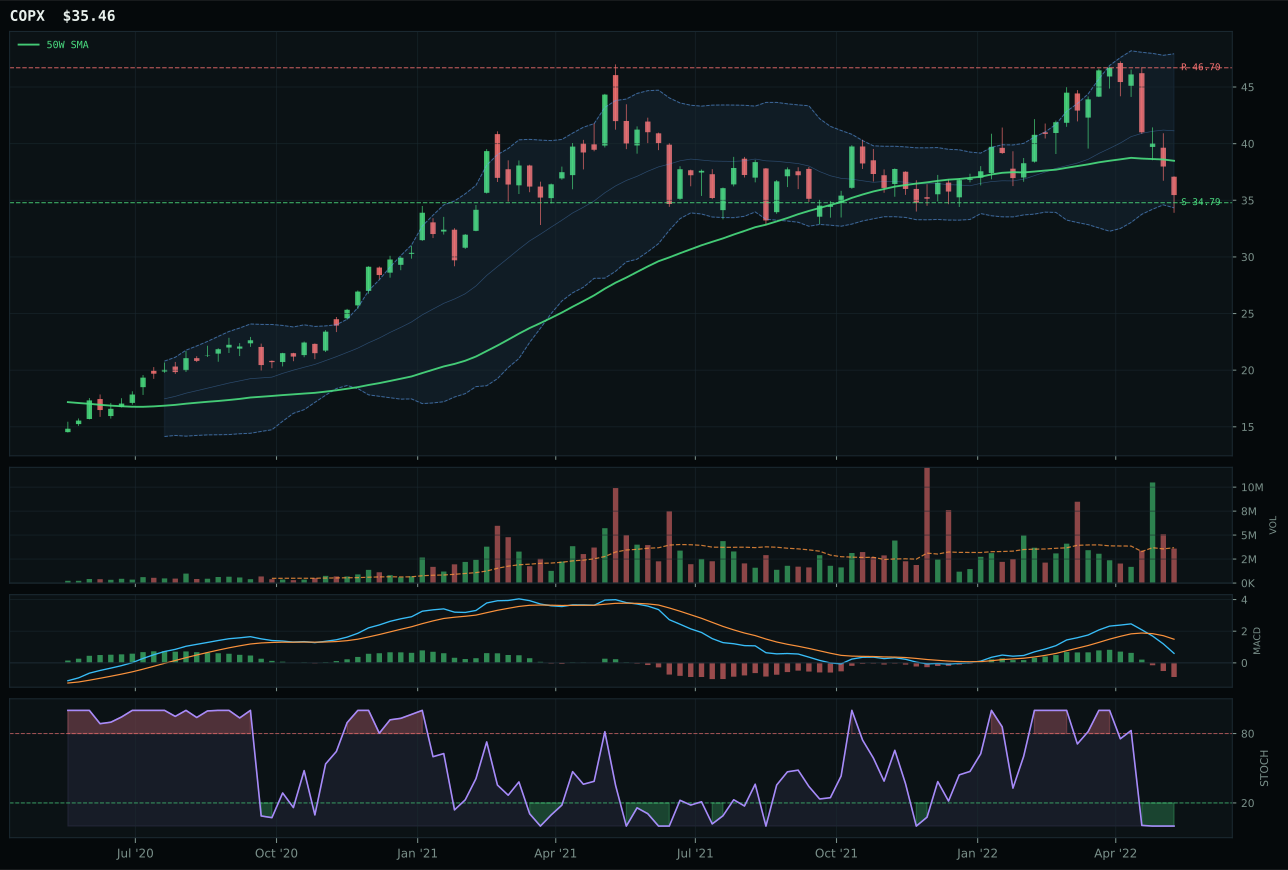
COPX has a pullback into support profile with -4.3% 13-week relative strength versus SPY.
A failed hold above support would weaken the setup.
Actionable but governed by invalidation levels.
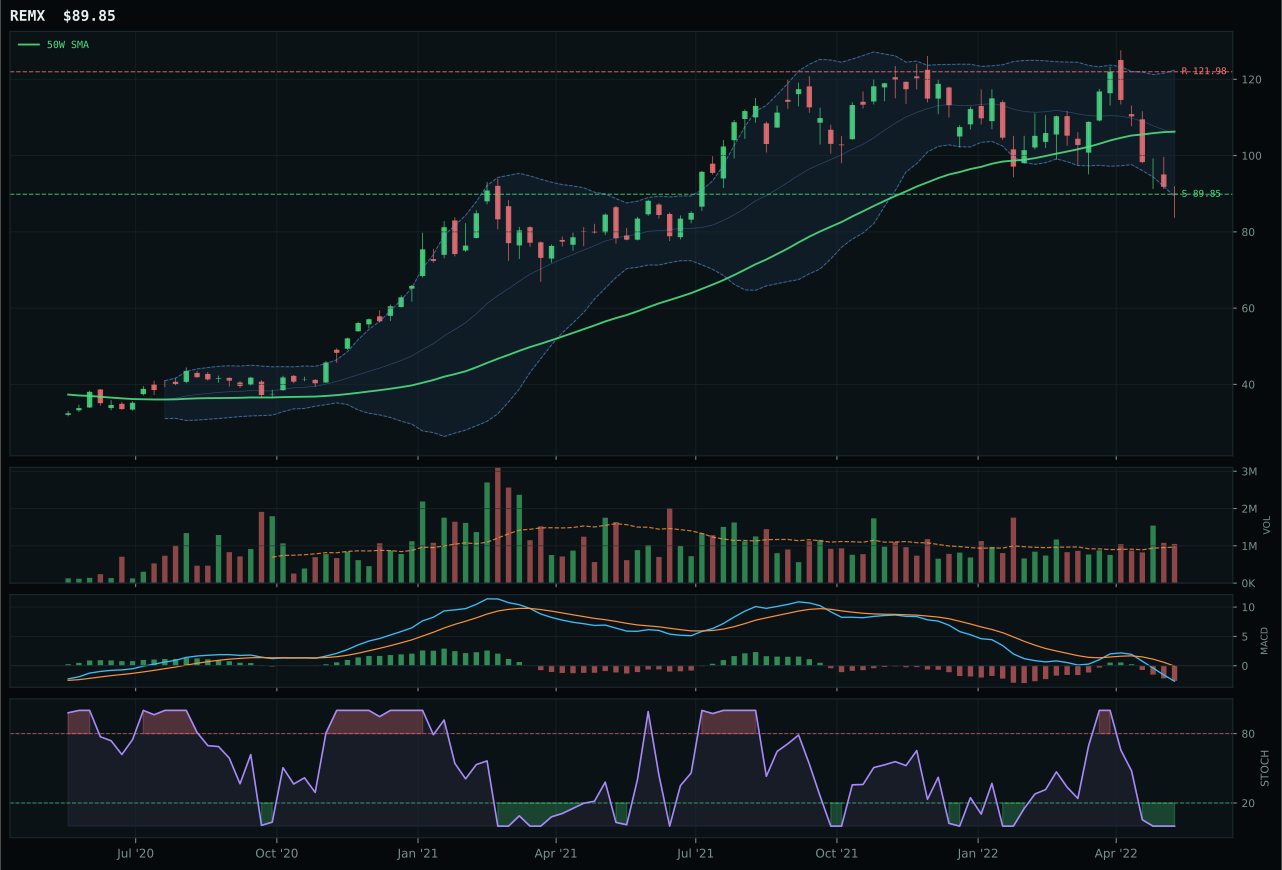
REMX has a pullback into support profile with -5.8% 13-week relative strength versus SPY.
A failed hold above support would weaken the setup.
Actionable but governed by invalidation levels.
COPX wins by the narrowest margin over PICK—just 1.5 points—because its risk/reward of 75.0 exactly matches PICK's, but COPX's timing score of 80.0 is fractionally cleaner on the distance-to-50W metric at -7.9% versus PICK's -7.0%. The real differentiation lies in volume-price confirmation: COPX's neutral volume at 0.98x versus PICK's above-average participation at 1.13x might suggest PICK should win, but neutral volume into an oversold stochastic and bearish MACD is actually more consistent with institutional accumulation than emotional panic selling. COPX's technical evidence score of 29.0 trails PICK's 30.6, a trivial margin in a category where macro drives the entire allocation decision. Both setups are pullbacks into support with oversold technicals; the winner is determined by marginal timing geometry and the slight edge in structure cleanliness, not by fundamental separation.
Industrial Metals receives 5% allocation as a tier-2 category with a final score of 44.1, ranking solidly but not in the top tier. The category macro fit of 75.0/100 is exceptional: metals scarcity is active (+14), commodity breadth positive is active (+10), Late-Cycle Reflation helps this exposure (+10), and real asset sponsorship is active (+6). That macro case is overwhelming and justifies the allocation despite weak technical confirmation; COPX's momentum confirmation is 0.0/100 and persistence is only 25.9/100. This is a pure scarcity play, not a trend trade. The copper market is structurally tight due to the energy transition's copper intensity and Chile's drought-impacted supply—that story is real and does not need MACD confirmation to be true. For Industrial Metals to reach top-2 status at 10%, price would need to confirm the scarcity narrative with actual volume accumulation and MACD reversal, creating a double confirmation. Until then, 5% reflects the macro opportunity without overcommitting to uncertain technical follow-through.
Utilities & Infrastructure — XLU
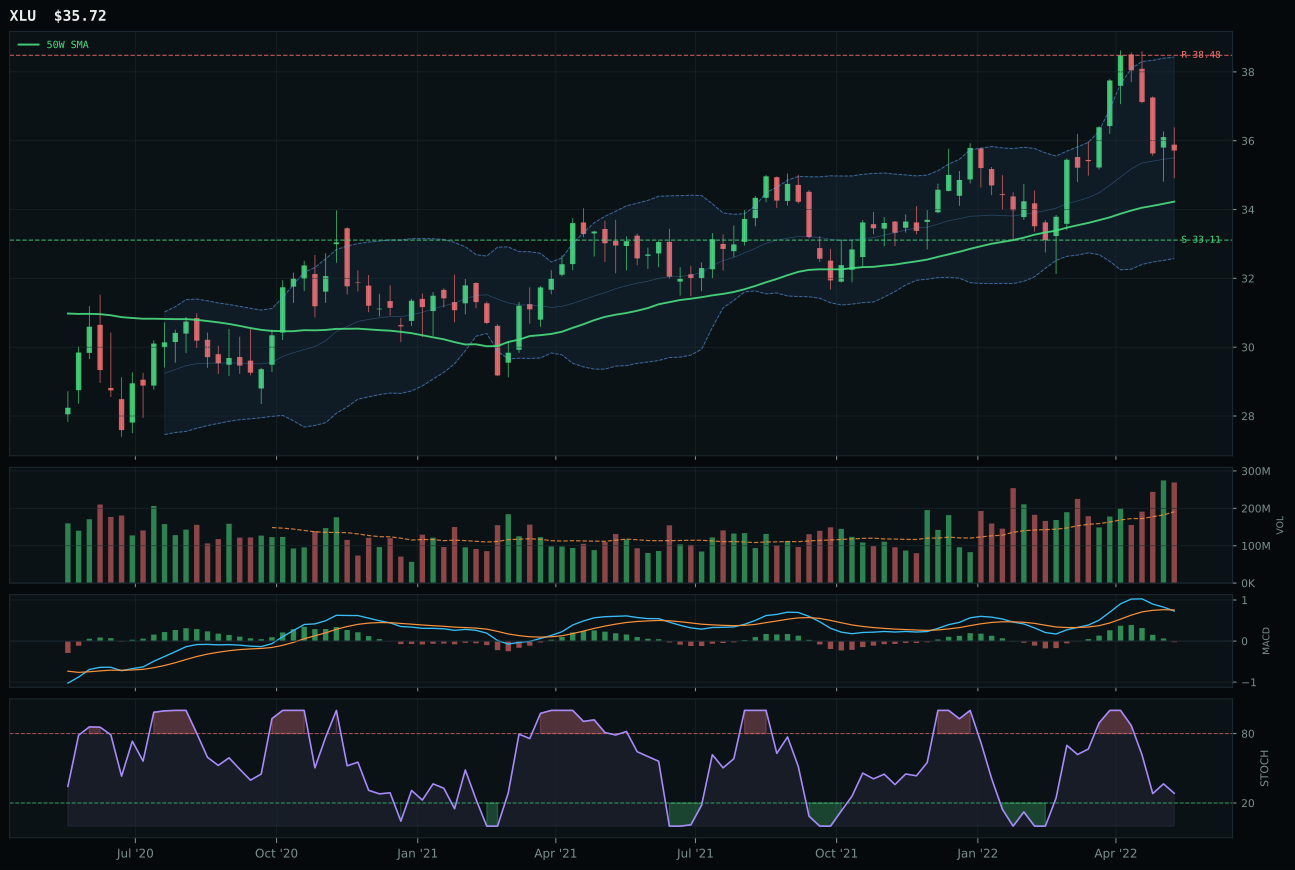
XLU has a neutral structure profile with 15.4% 13-week relative strength versus SPY.
A failed hold above support would weaken the setup.
Actionable but governed by invalidation levels.
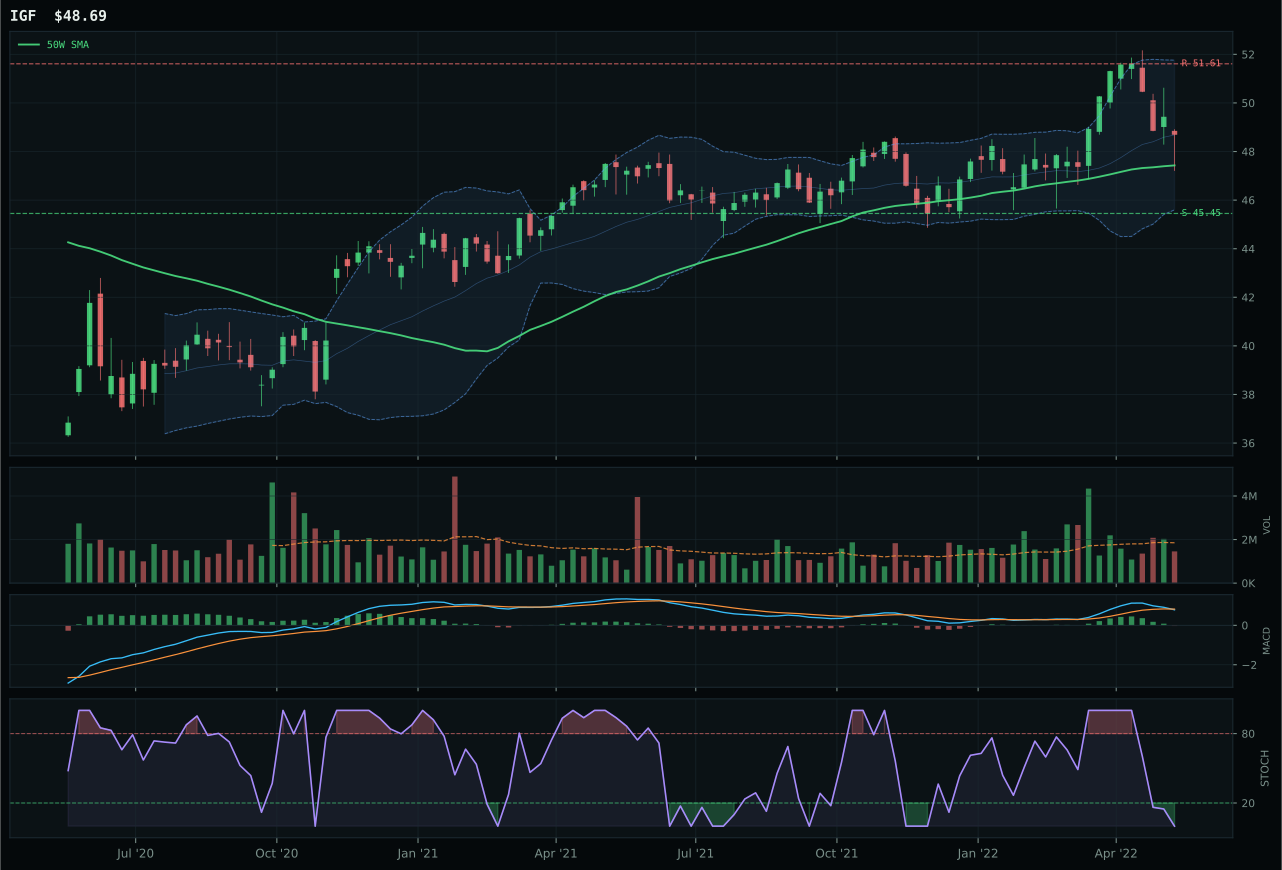
IGF has a compression near 50W profile with 10.9% 13-week relative strength versus SPY.
A failed hold above support would weaken the setup.
Actionable but governed by invalidation levels.
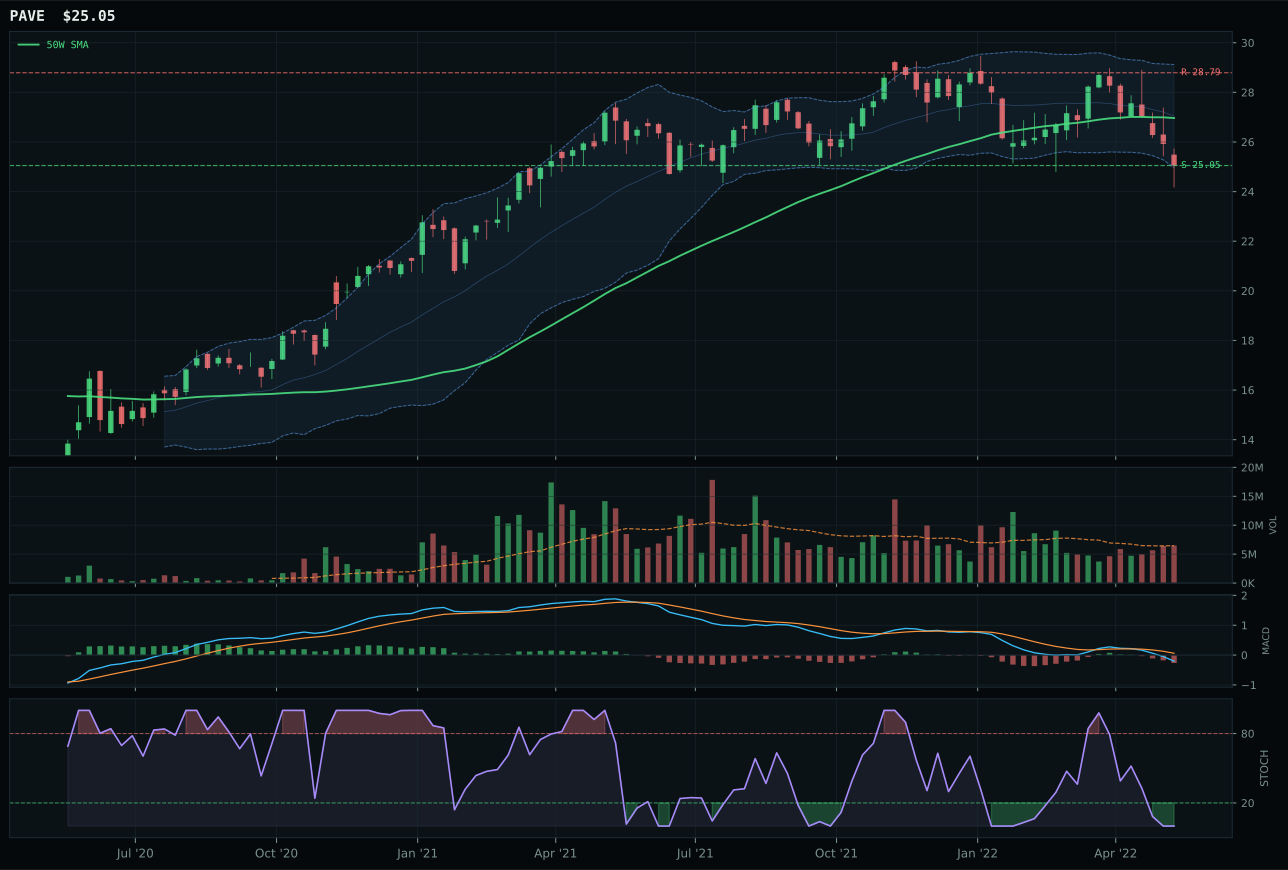
PAVE has a pullback into support profile with 4.5% 13-week relative strength versus SPY.
A failed hold above support would weaken the setup.
Actionable but governed by invalidation levels.
XLU wins because it is still above the 50W with trend score of 92.0/100, offering a defensive positioning without demanding entry into oversold territory. Price sits only 4.3% from the 50W in a neutral structure, and timing score of 92.0 reflects that proximity while stochastic RSI at 0.28 is falling/neutral—not oversold, not extended, just caught in consolidation. XLU's momentum confirmation of 67.7/100 beats IGF's 46, and SPY-relative strength of 15.4% demonstrates that utilities are the defensive leader inside this category. IGF's compression-near-50W setup offers technical crispness but no directional conviction; XLU's neutral structure offers fewer clues but better breadth and relative performance. The 1.6-point gap is narrow, but directional; XLU is holding up better in the broad bear market, which is the definition of defensive quality.
Utilities & Infrastructure receives 5% allocation as a tier-2 category with a final score of 42.8, ranking behind energy and agriculture but ahead of Emerging Markets and AI. The category macro fit of 61.0/100 is supported by defensive rotation active (+12), broad market bear active (+4), and Transition/Mixed helping this exposure (+4), partially offset by inflation pressure active (-6). XLU's trend score of 92.0 combined with this macro support justifies the allocation despite momentum confirmation of only 67.7. This is a defensive positioning trade, not an offensive opportunity. XLU is holding better than equities, and that relative defense has value in a liquidity crisis even if MACD is bearish. For Utilities to reach a higher tier, either the broad market bear would need to deepen further, pushing more capital into true defensives, or MACD inside the category would need to turn bullish. Currently, 5% reflects the defensive rotation case at its current intensity—meaningful but not dominant.
Precious Metals — SLV
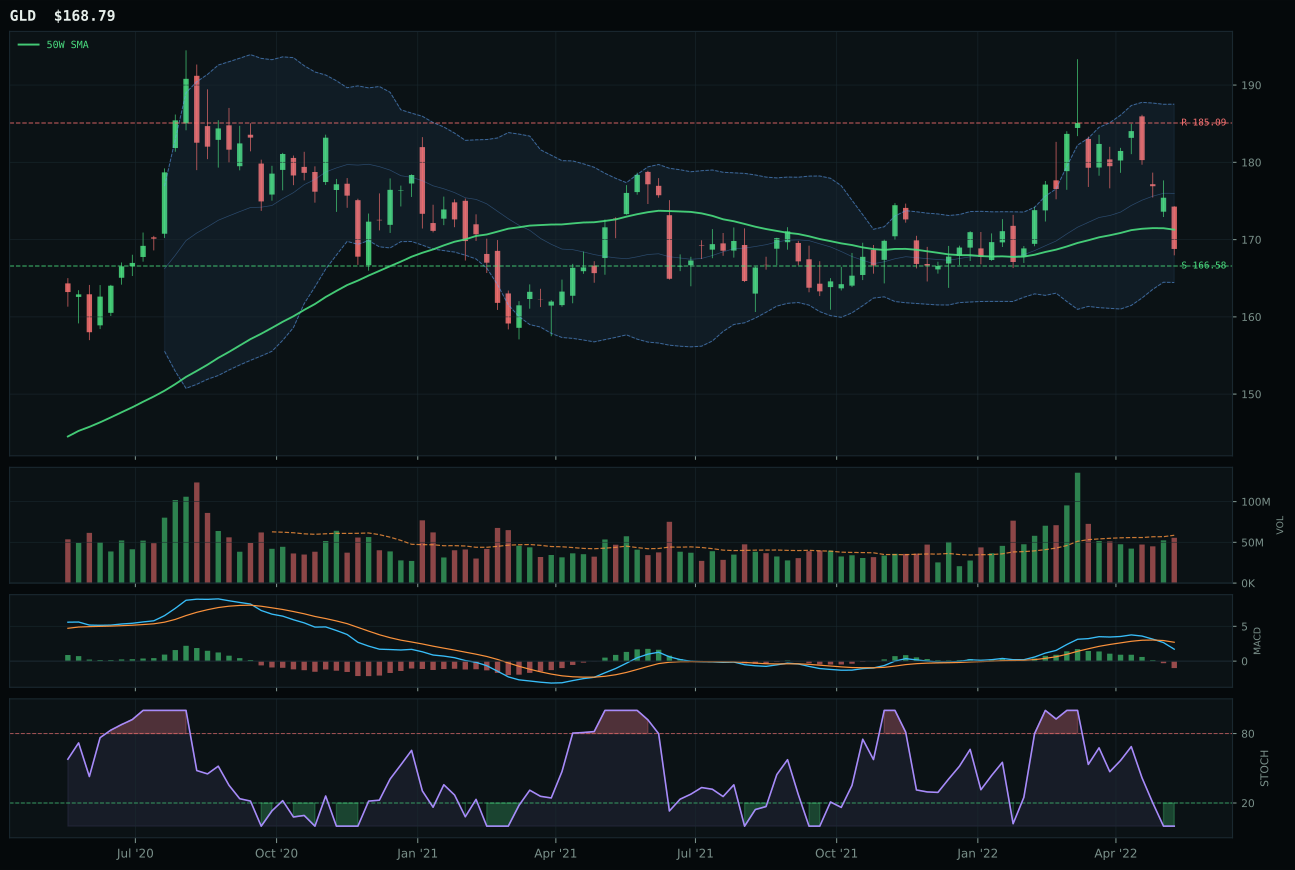
GLD has a pullback into support profile with 5.9% 13-week relative strength versus SPY.
A failed hold above support would weaken the setup.
Actionable but governed by invalidation levels.
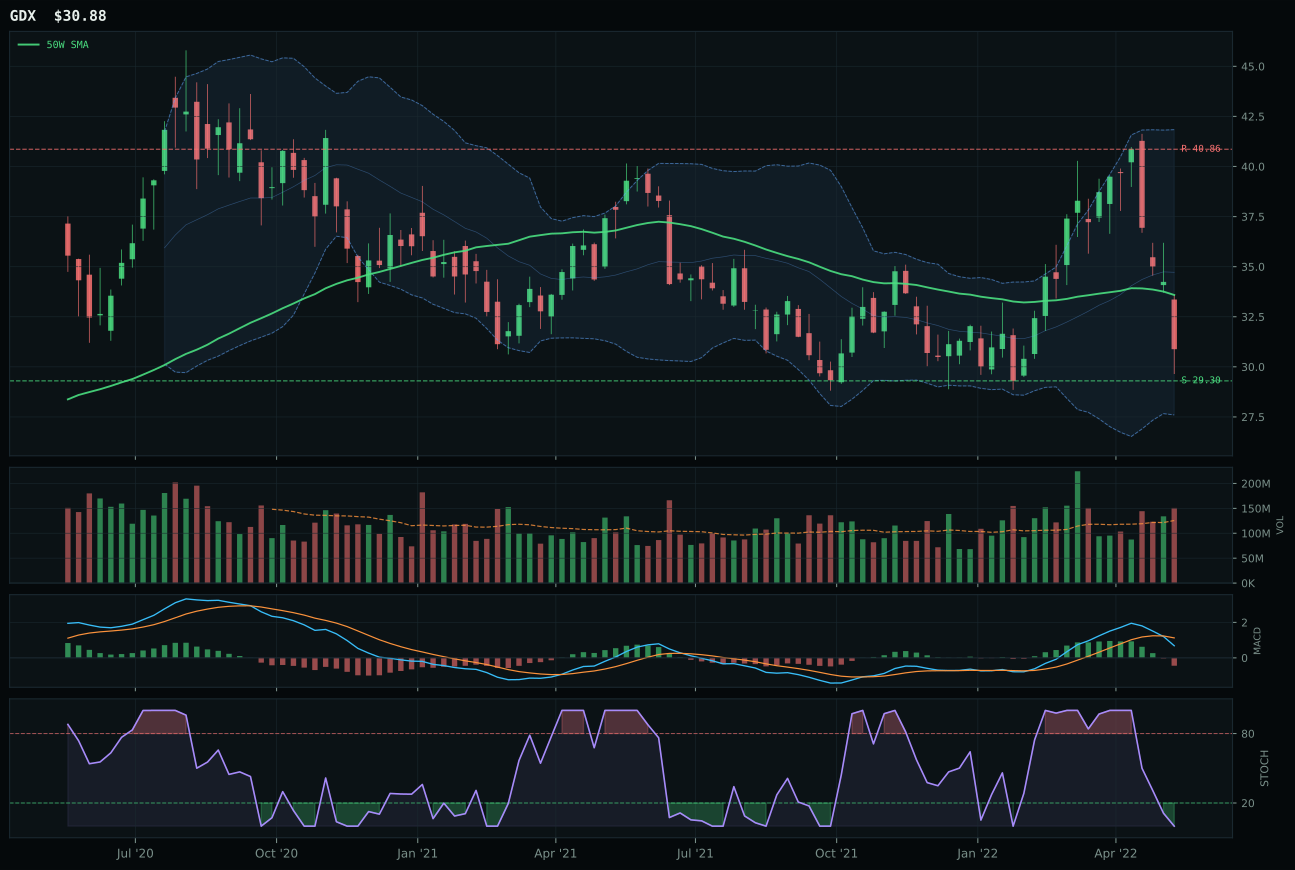
GDX has a neutral structure profile with 4.0% 13-week relative strength versus SPY.
A failed hold above support would weaken the setup.
Actionable but governed by invalidation levels.
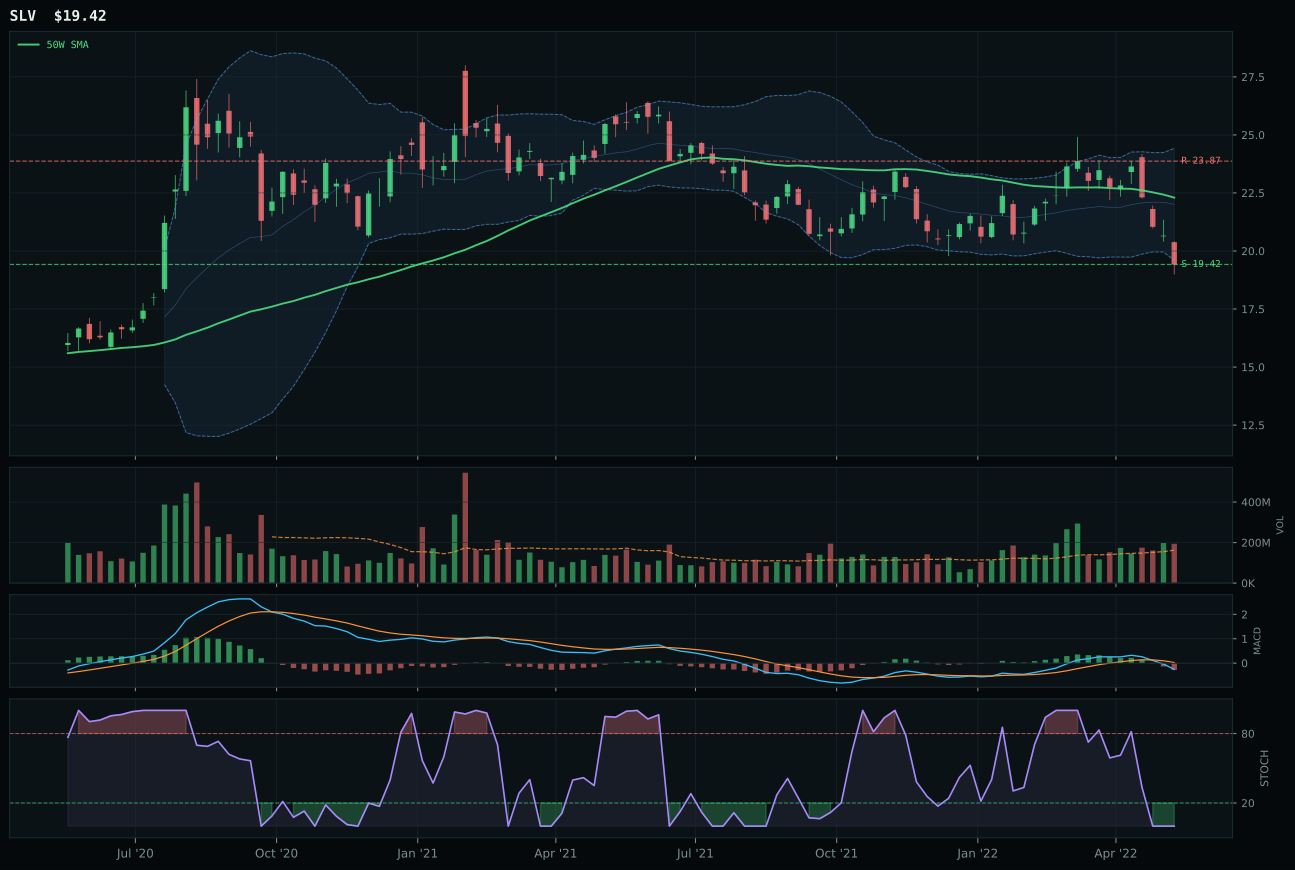
SLV has a pullback into support profile with -2.2% 13-week relative strength versus SPY.
A failed hold above support would weaken the setup.
Actionable but governed by invalidation levels.
SLV wins the category despite trailing in momentum because its setup structure is cleaner and its volume sponsorship is more believable. At 12.9% below the 50W, SLV is pulling into support near 19.42 with stochastic RSI oversold at 0.00—a pure mean-reversion geometry. GLD sits only 1.5% below the 50W with deep retracement territory near Fib 0.786; that proximity to the 50W means GLD has more room to fall before hitting true support, making it technically messier. SLV's structure score of 71.6 beats GLD's 69.6, and critically, SLV carries above-average volume participation at 1.19x versus GLD's neutral volume. In precious metals, volume into oversold stochastic is the proof of intelligent buying; GLD's neutral volume into an oversold print reads like passive index liquidation, not accumulation. The 26.2-point gap in technical evidence (0.1 vs 43.2) appears to favor GLD, but that reflects GLD's better macro narrative, not better technical positioning—SLV wins the setup, loses the story.
Precious Metals receives 5% allocation as a tier-2 category, with a final score of 40.3 that reflects strong macro sponsorship but weak technical confirmation. The category macro fit of 74.0/100 is driven by active monetary hedge bid (+14), defensive rotation (+7), and dollar pressure (+3)—a narrative that makes sense in a Late-Cycle Reflation with liquidity stress active. However, SLV's momentum confirmation is only 0.0/100; both silver and gold are falling in price, and the volume-price data shows accumulation geometry rather than strong conviction buying. The 5% tier-2 position reflects a macro conviction play rather than a technical momentum trade. For Precious Metals to earn a top-2 seat at 10%, either MACD would need to turn bullish or volume confirmation would need to shift from neutral to strong accumulation—currently, the setup is saying prepare for a bounce, not ride an emerging trend. The monetary hedge narrative remains sound, but metal prices have not yet confirmed that narrative with bullish technicals.
Nuclear Energy — URA
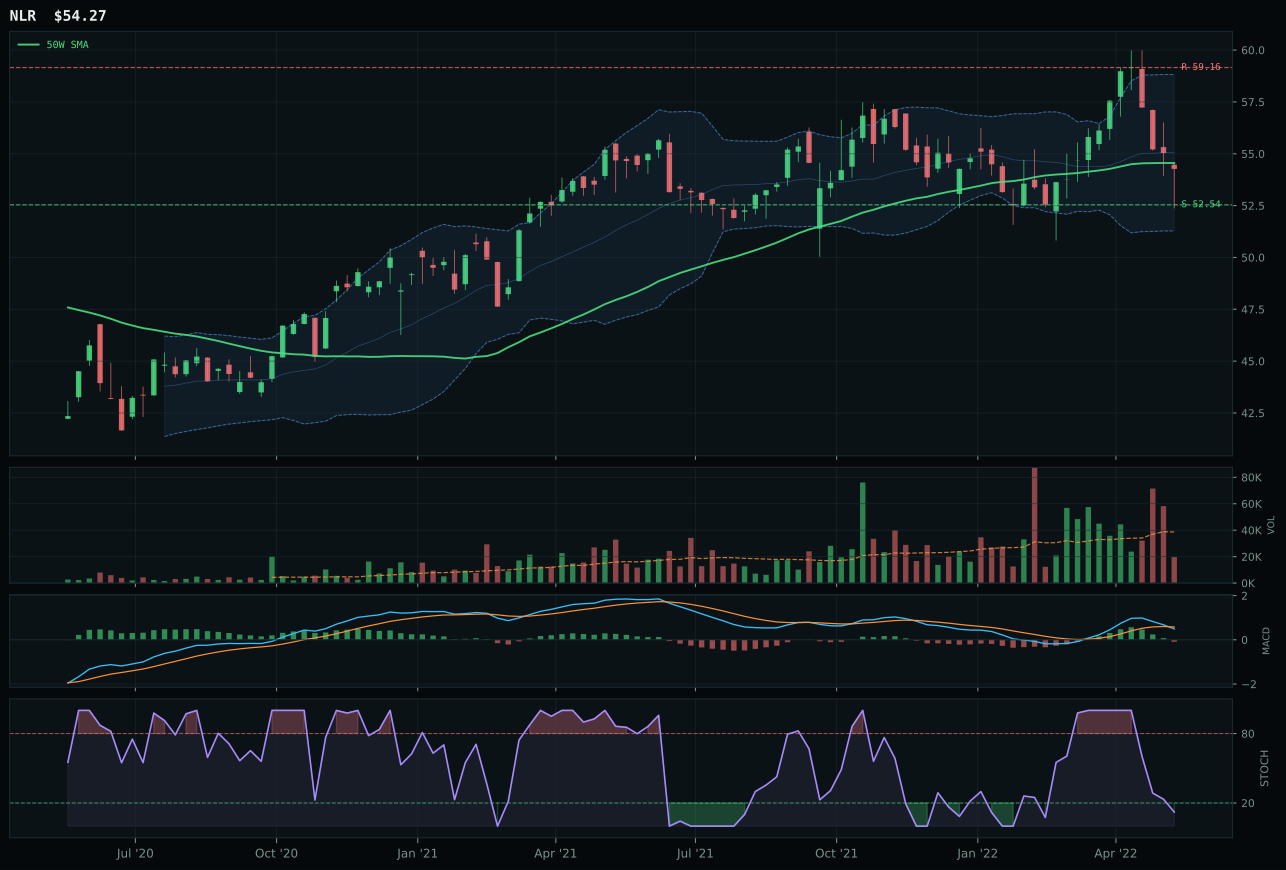
NLR has a pullback into support profile with 10.5% 13-week relative strength versus SPY.
A failed hold above support would weaken the setup.
Tracked, but not top-2 eligible because: .
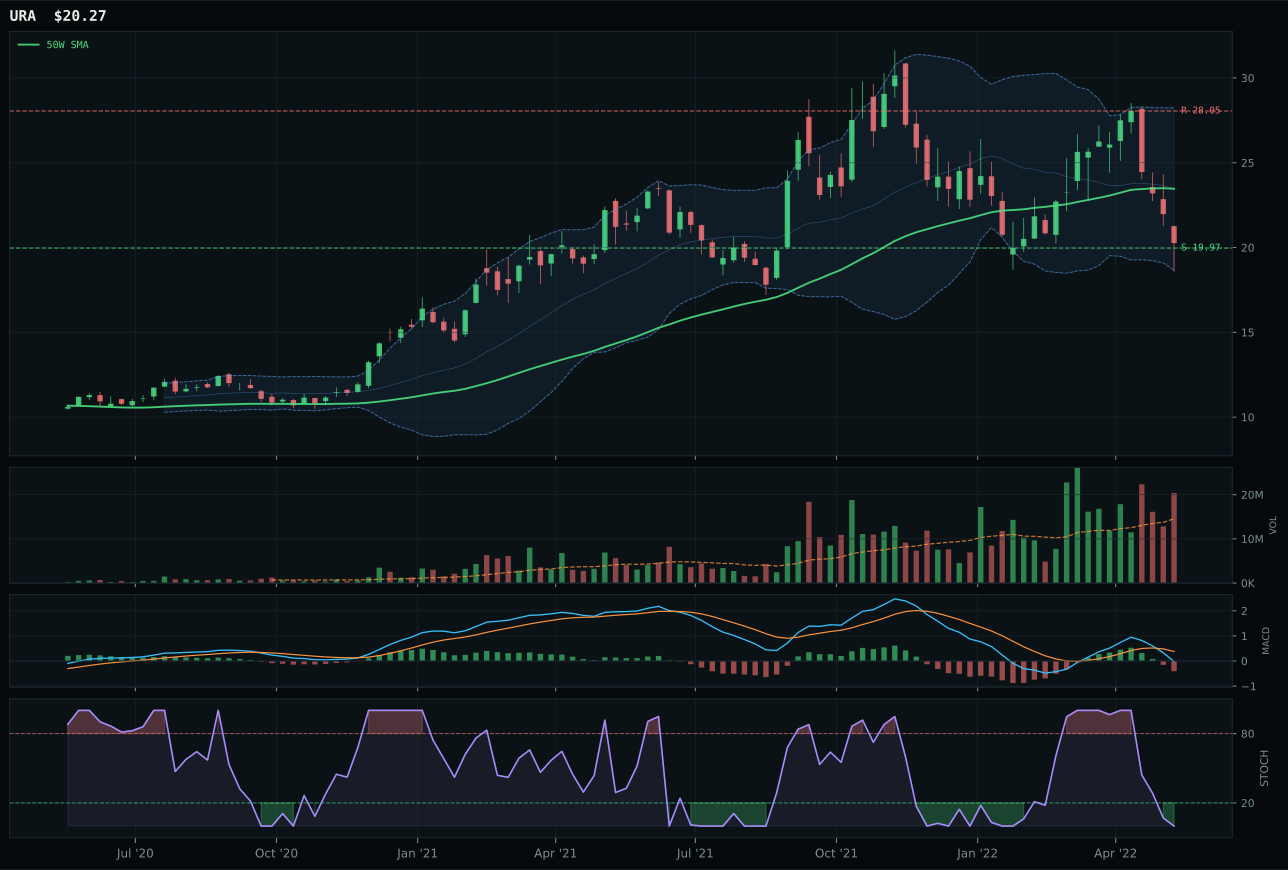
URA has a pullback into support profile with 1.6% 13-week relative strength versus SPY.
A failed hold above support would weaken the setup.
Actionable but governed by invalidation levels.
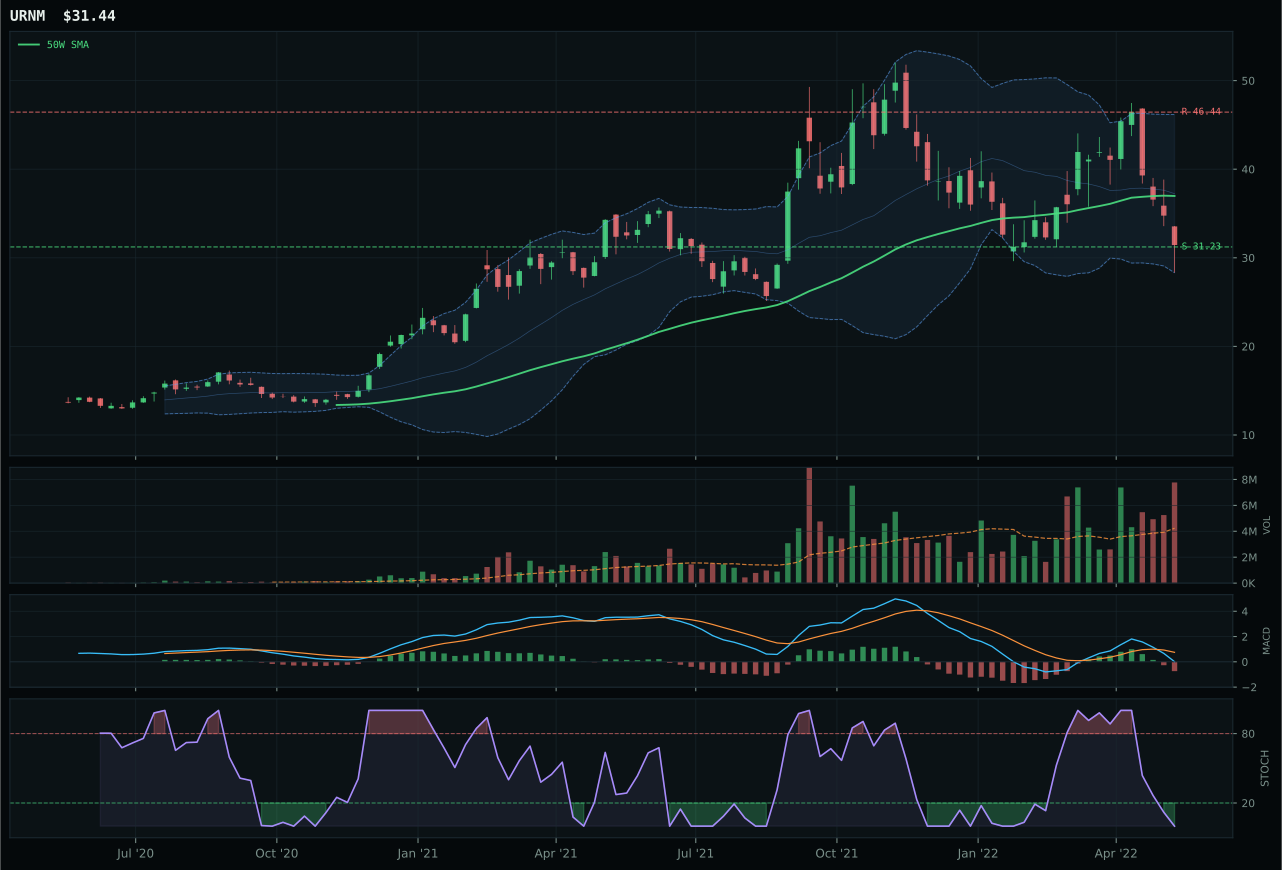
URNM has a pullback into support profile with 0.6% 13-week relative strength versus SPY.
A failed hold above support would weaken the setup.
Actionable but governed by invalidation levels.
URA wins because its volume participation of 1.40x average is above-average accumulation versus NLR's thin participation, and into an oversold stochastic at 0.00 with bearish MACD, above-average volume suggests institutional buying rather than retail panic. NLR actually scores higher on technical evidence at 45.0 versus URA's 21.6, but that reflects NLR's positive 13W return of 1.7% and SPY-relative strength of 10.5%—strengths that become liabilities in a category where the macro case is about energy scarcity, not defensiveness. URA's -7.2% 13W return and 1.6% SPY RS position it as a pure scarcity play battered by broad selloff; NLR's positive returns mean it is priced as a defensive utility, not an energy solution. The 6.1-point gap in category score reflects NLR's better current technicals but URA's better category positioning relative to the macro narrative driving energy allocation.
Nuclear Energy receives 5% allocation as a tier-2 category with a final score of 33.0, ranking lower than Precious Metals and Industrial Metals but still inside the portfolio. The category macro fit of 65.0/100 is solid: energy scarcity is active (+9), Late-Cycle Reflation helps this exposure (+7), real asset sponsorship is active (+7), and inflation pressure is active (+3). However, liquidity stress is also active (-7), creating a friction that keeps this category from earning a higher tier. URA's technical evidence of only 21.6/100 tells the story: this is a collapsed chart being bid by scarcity, not a setup with positive momentum confirmation. The 5% allocation reflects the real macro case—nuclear is the only carbon-free baseline power source and energy scarcity is genuine—without overcommitting to uncertain technical follow-through. For Nuclear to reach 10% tier-2 status, either MACD would need to confirm an actual uptrend or broader energy tailwinds would need to strengthen further. Currently, nuclear is a tactical scarcity play, not a trend position.
Defense & Aerospace — ITA
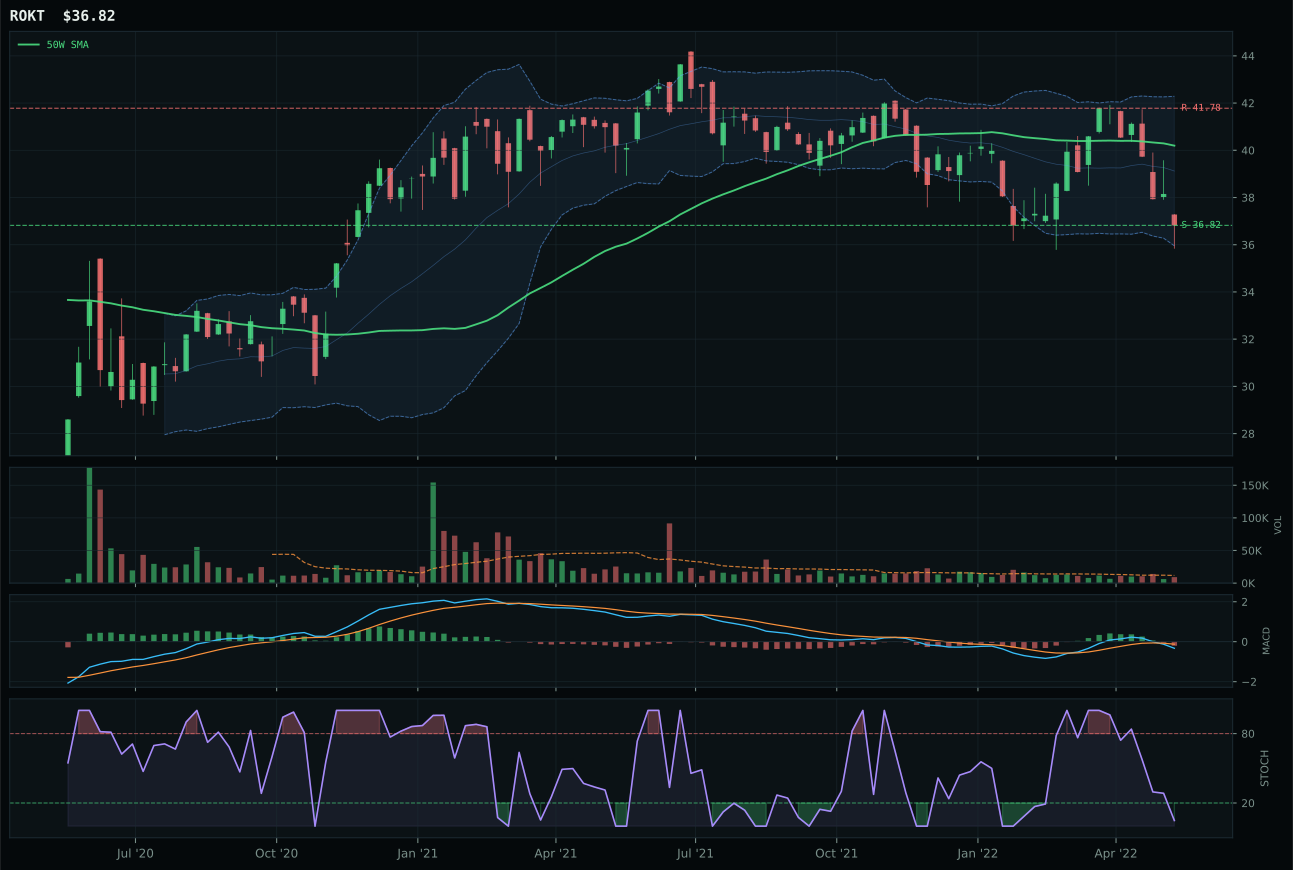
ROKT has a pullback into support profile with 7.5% 13-week relative strength versus SPY.
A failed hold above support would weaken the setup.
Tracked, but not top-2 eligible because: .
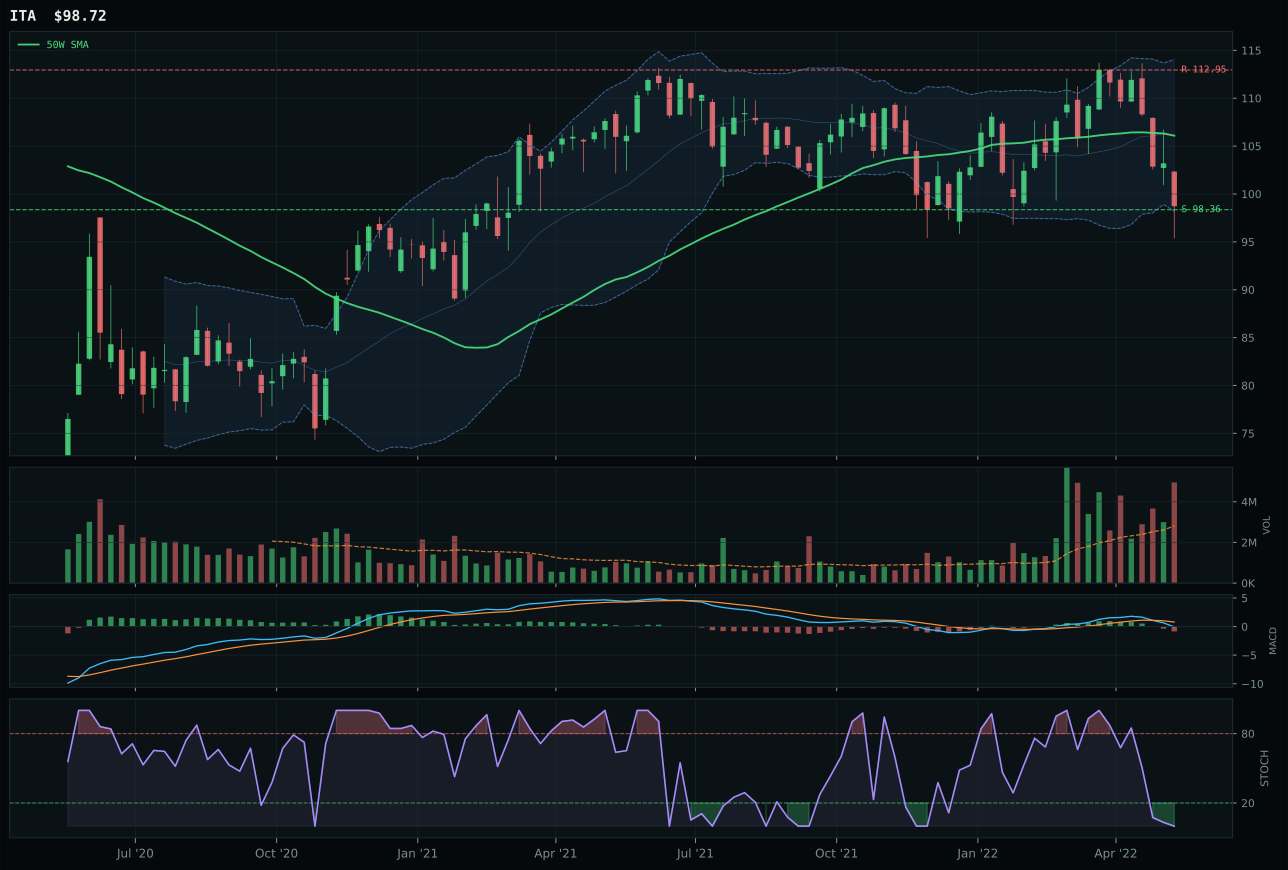
ITA has a pullback into support profile with 2.7% 13-week relative strength versus SPY.
A failed hold above support would weaken the setup.
Actionable but governed by invalidation levels.
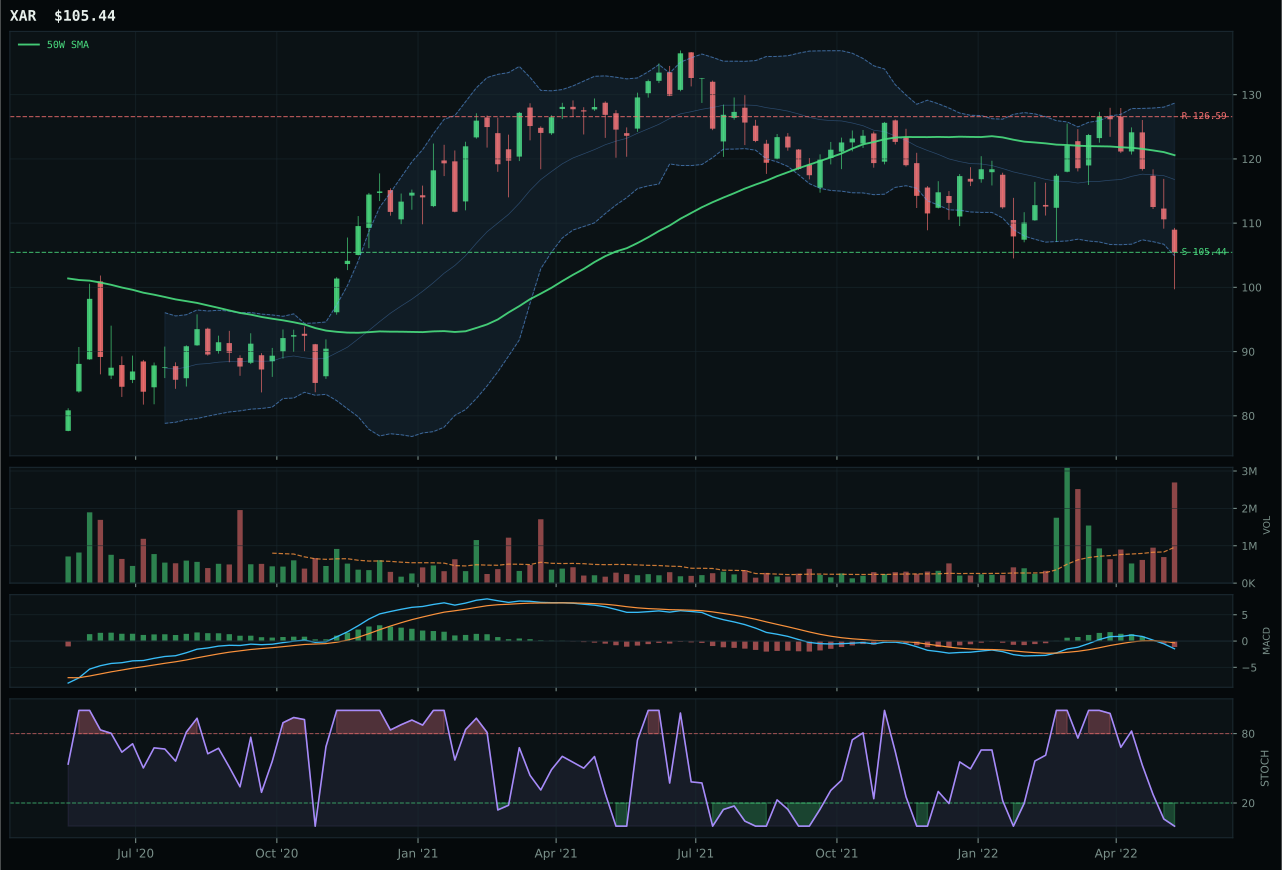
XAR has a pullback into support profile with 2.3% 13-week relative strength versus SPY.
A failed hold above support would weaken the setup.
Actionable but governed by invalidation levels.
ITA wins because it converts macro strength into actual risk management geometry: a pullback into support at 98.36 with a defined invalidation level and 80.0/100 timing score that reflects distance to the 50W at exactly -6.9%—tight enough to mean something, loose enough to avoid the flinch zone. Price has fallen below the 200W, confirming this is structural damage not cyclical pullback, and MACD is bearish/weakening; that combination would terrify a growth manager but rewards a defensive buyer looking for a support test. ROKT's setup is technically sound but fails on risk/reward: its 71.7 versus ITA's 82.0 means the upside-to-resistance math is tighter, leaving less margin of safety. More strategically, ITA's 0.0% category-relative strength matches ROKT's 4.8%, but ITA's 2.7% SPY RS beats ROKT's 7.5%—meaning ITA is holding up better relative to the broad market, the actual test of defensive quality.
Defense & Aerospace earns 5% allocation as a tier-2 category, ranking behind the two overweight leaders but ahead of several weaker themes. The category macro fit of 70.0/100 is formidable: defensive rotation is active (+8), broad market bear is active (+6), dollar pressure is active (+3), and Late-Cycle Reflation actually helps this exposure (+6). ITA's representative win on technical grounds combined with this macro tailwind yields a final category score of 24.1, enough to justify a modest 5% commitment in a risk-off week. The tension here is real: ITA sits below the 200W with momentum confirmation at only 1.8/100, meaning this is a macro-driven position, not a price confirmation trade. For Defense to advance to top-2 status at 10%, either MACD would need to turn bullish inside the category or macro descriptors would need to shift toward greater risk appetite—currently neither is present, so 5% reflects the macro case without overextending into uncertain technical confirmation.
Emerging Markets — IEMG
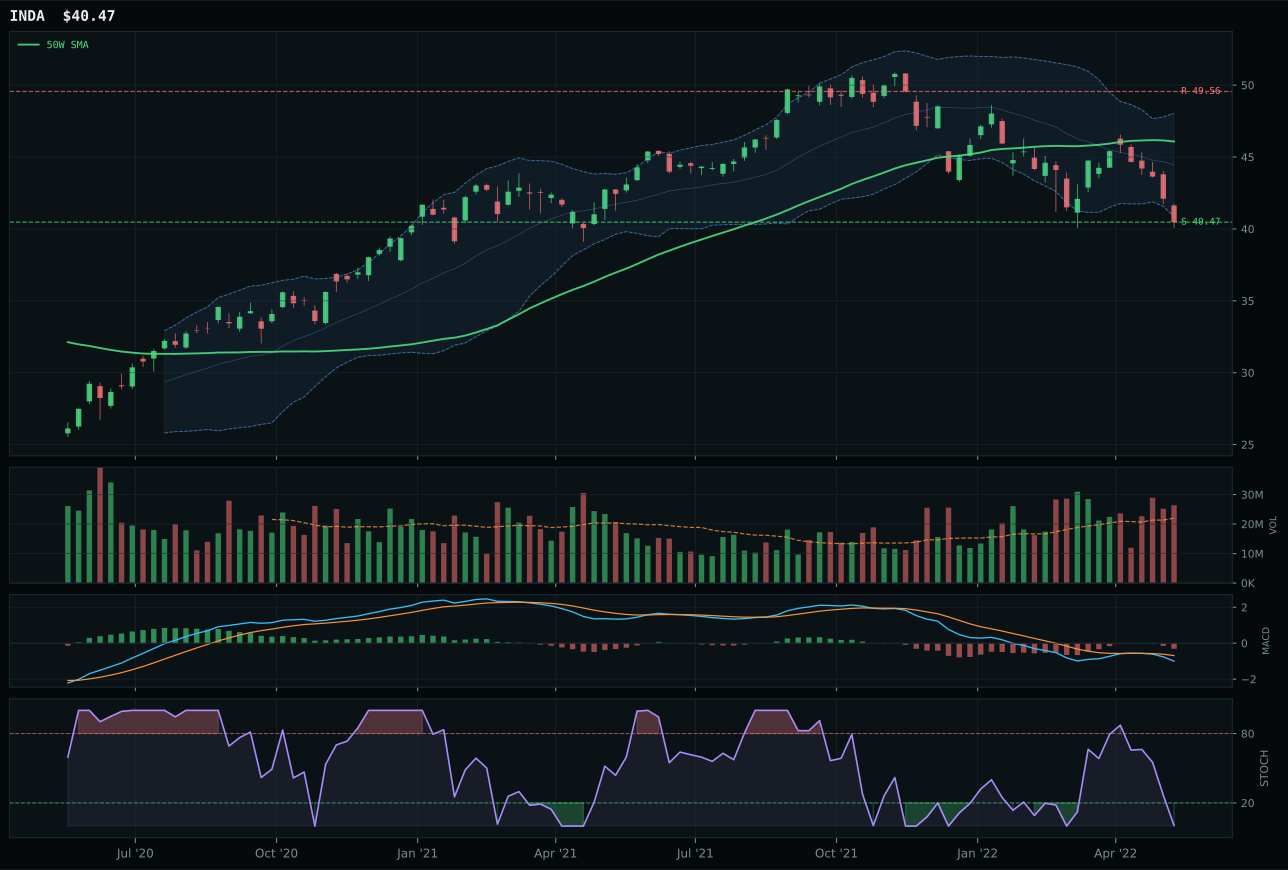
INDA has a pullback into support profile with 0.4% 13-week relative strength versus SPY.
A failed hold above support would weaken the setup.
Actionable but governed by invalidation levels.
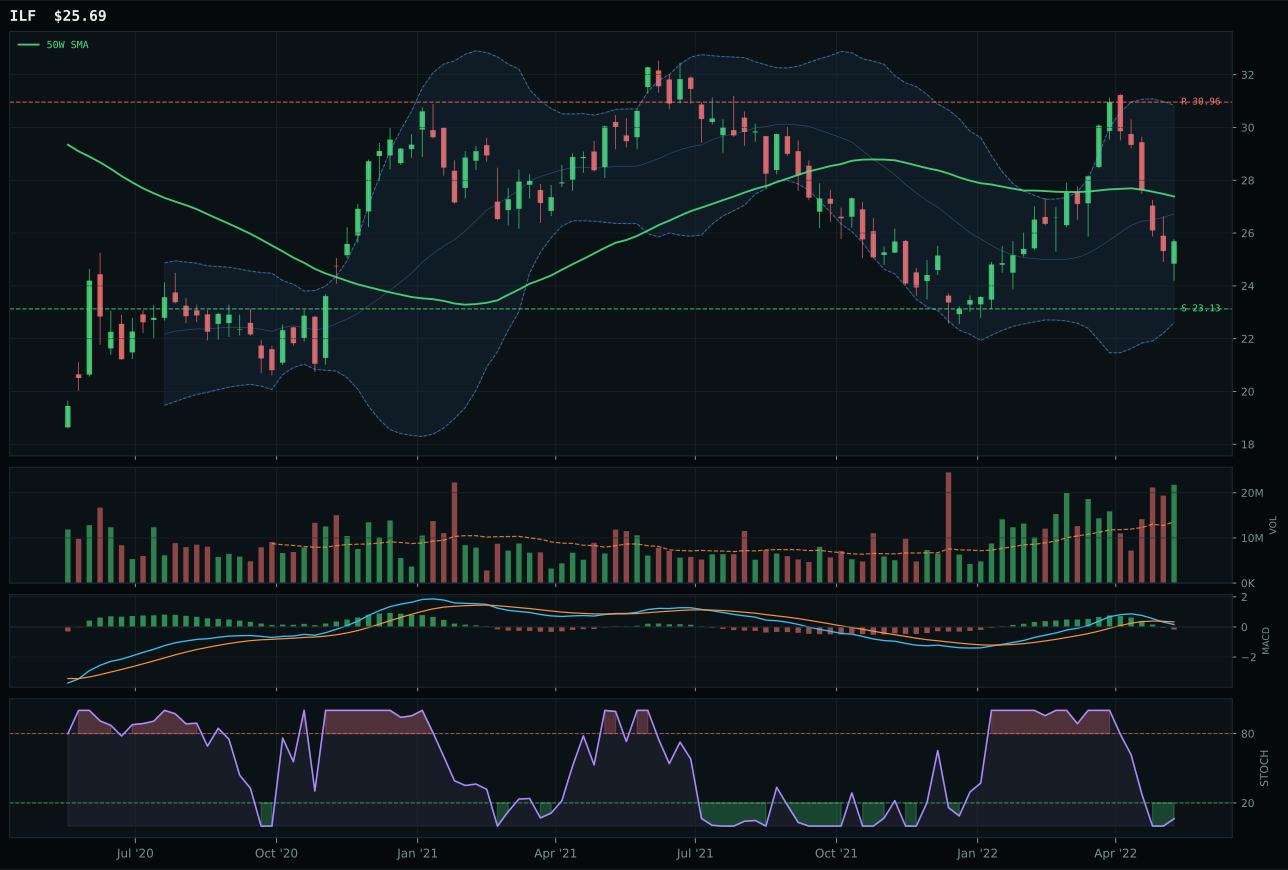
ILF has a neutral structure profile with 5.7% 13-week relative strength versus SPY.
Extension and support failure are the main tactical risks.
Tracked, but not top-2 eligible because: structurally broken.
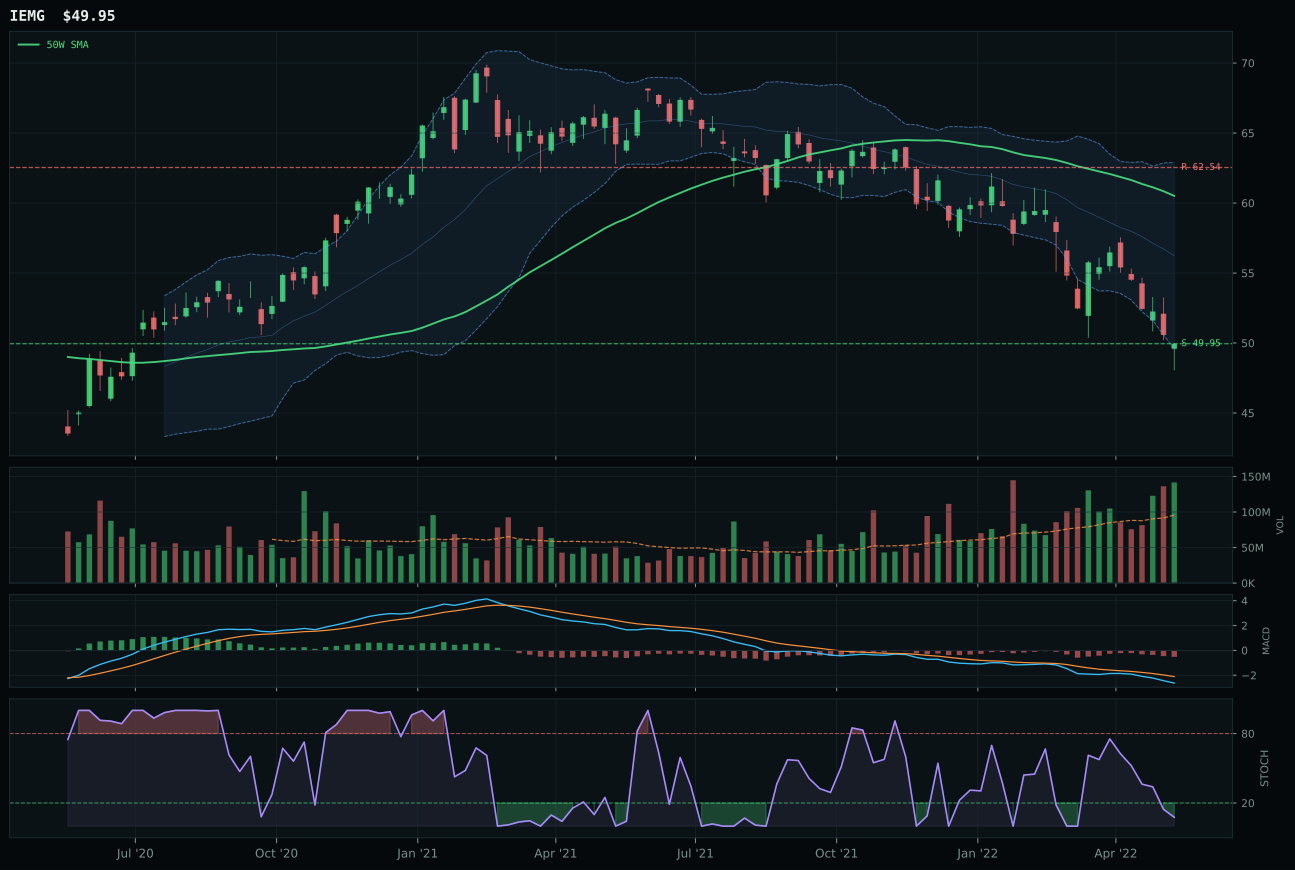
IEMG has a pullback into support profile with -7.2% 13-week relative strength versus SPY.
A failed hold above support would weaken the setup.
Actionable but governed by invalidation levels.
IEMG wins by default in a category where every option is broken, and broken things require choosing the least damaged path. IEMG trades 17.5% below the 50W with oversold stochastic at 0.08 and bearish MACD, a setup where risk/reward hits 90.0/100—maximum downside protection. INDA is tighter to the 50W at only -12.2%, giving it more room to fall before hitting true support, and its risk/reward is only 86.3. The 22.9-point gap between IEMG (0.0 technical evidence) and INDA (30.9) reflects the fundamental reality that emerging markets are getting liquidated by dollar strength and risk-off flows; there is no winner here, only a question of which name offers the best exit point or bounce opportunity. IEMG's category-relative strength of -7.6% means it is underperforming even the worst emerging market peers, making it the technical laggard but the best value for mean-reversion traders.
Emerging Markets receives 5% allocation as a tier-2 category, but the final score of 0.0 should be read as a warning flag, not a green light. The category macro fit of 17.0/100 is among the worst in the portfolio: dollar pressure is active (-14), liquidity stress is active (-10), and broad market bear is active (-9). IEMG's technical evidence of 0.0/100 provides no offset to that macro headwind. The 5% allocation is not conviction; it is a default position—EM deserves a seat because diversification matters and oversold technicals eventually bounce, but the category is ranked 8th or lower, indicating it wins the allocation only because 10 categories need to be filled. IEMG's 0.0 score comes from volume-price confirmation and persistence both registering zero, meaning there is no evidence of accumulation, only forced selling into oversold levels. For Emerging Markets to earn a higher tier, dollar pressure would need to ease, liquidity stress would need to reverse, and MACD would need to turn bullish—none of those conditions are in place. This is a parking position for alpha only.
Technology — XLK
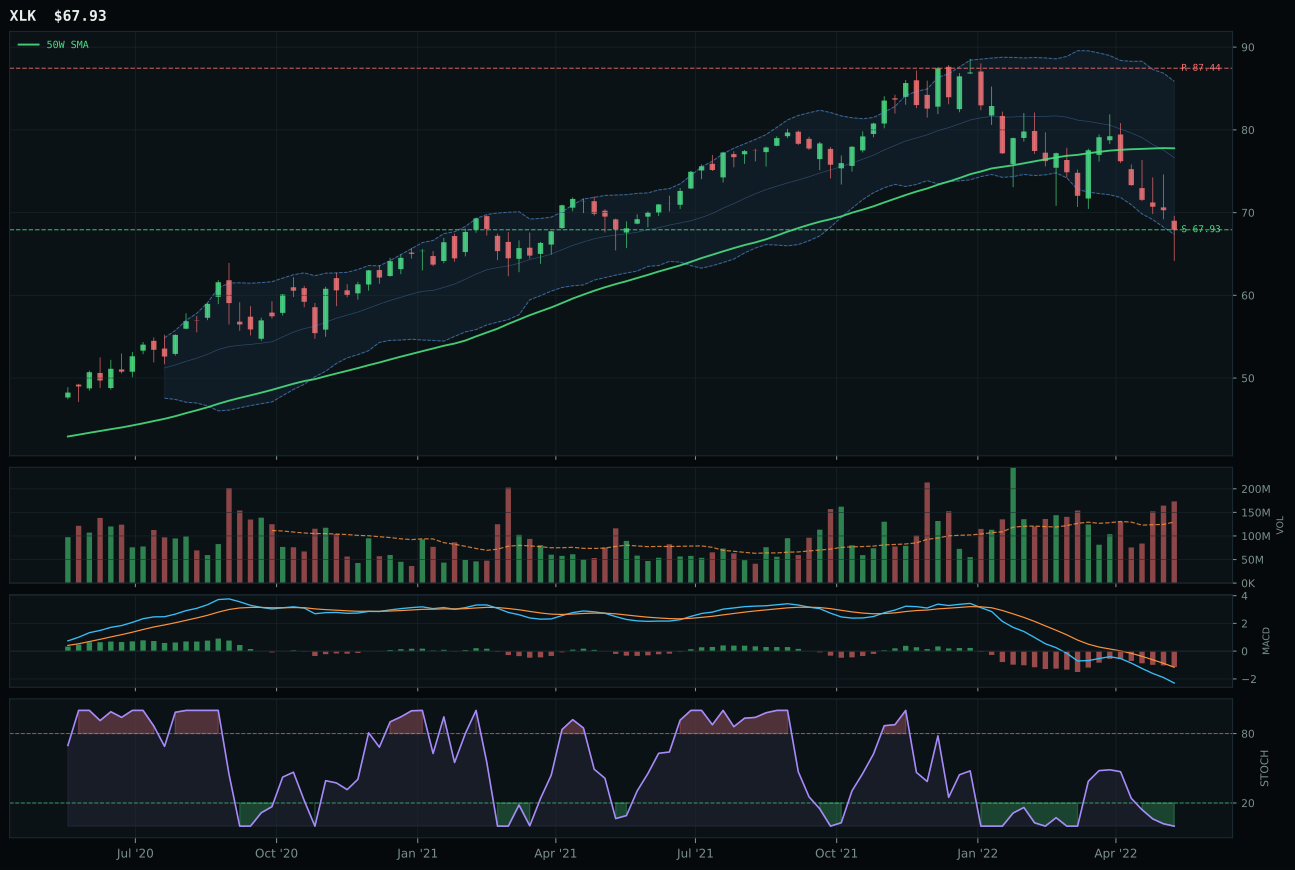
XLK has a pullback into support profile with -3.5% 13-week relative strength versus SPY.
A failed hold above support would weaken the setup.
Actionable but governed by invalidation levels.
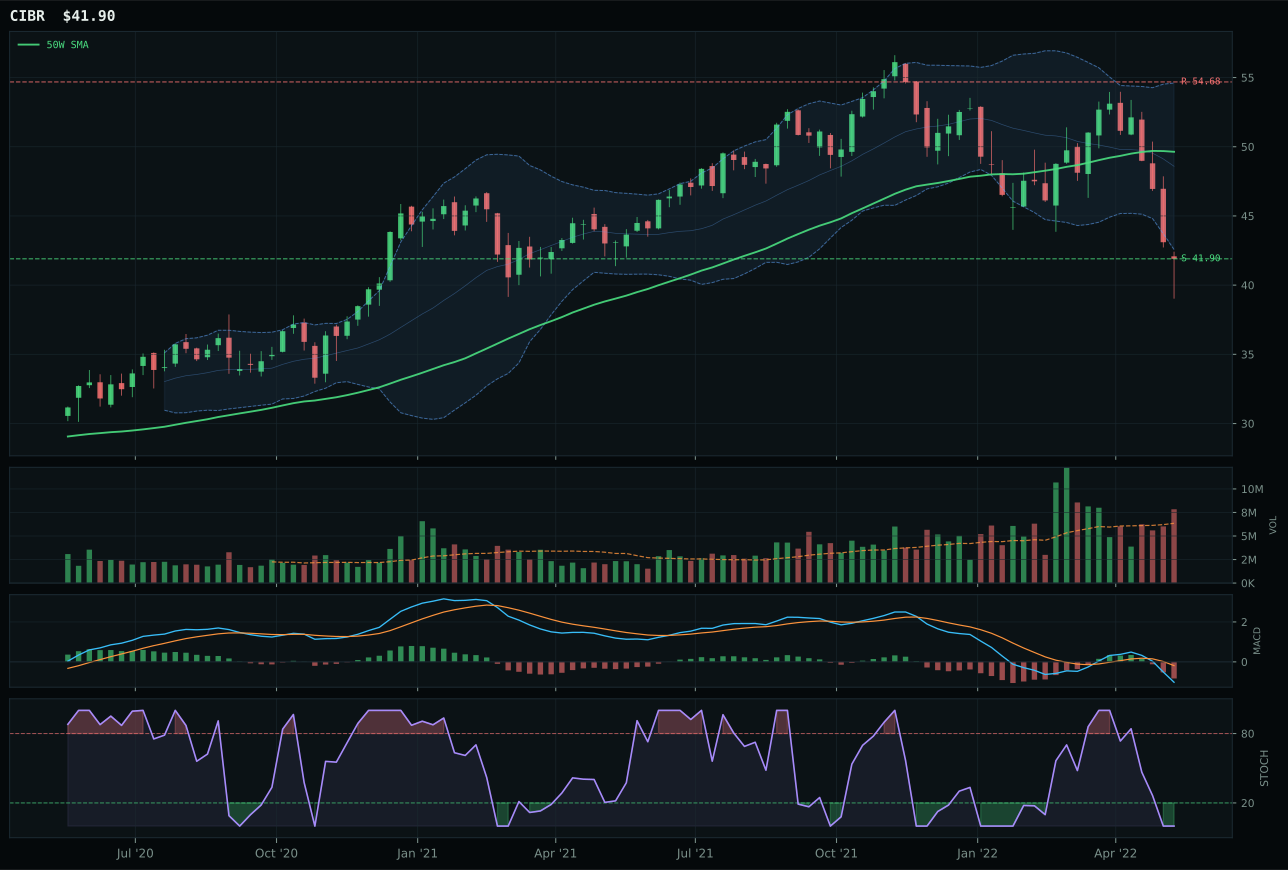
CIBR has a pullback into support profile with -3.0% 13-week relative strength versus SPY.
A failed hold above support would weaken the setup.
Actionable but governed by invalidation levels.
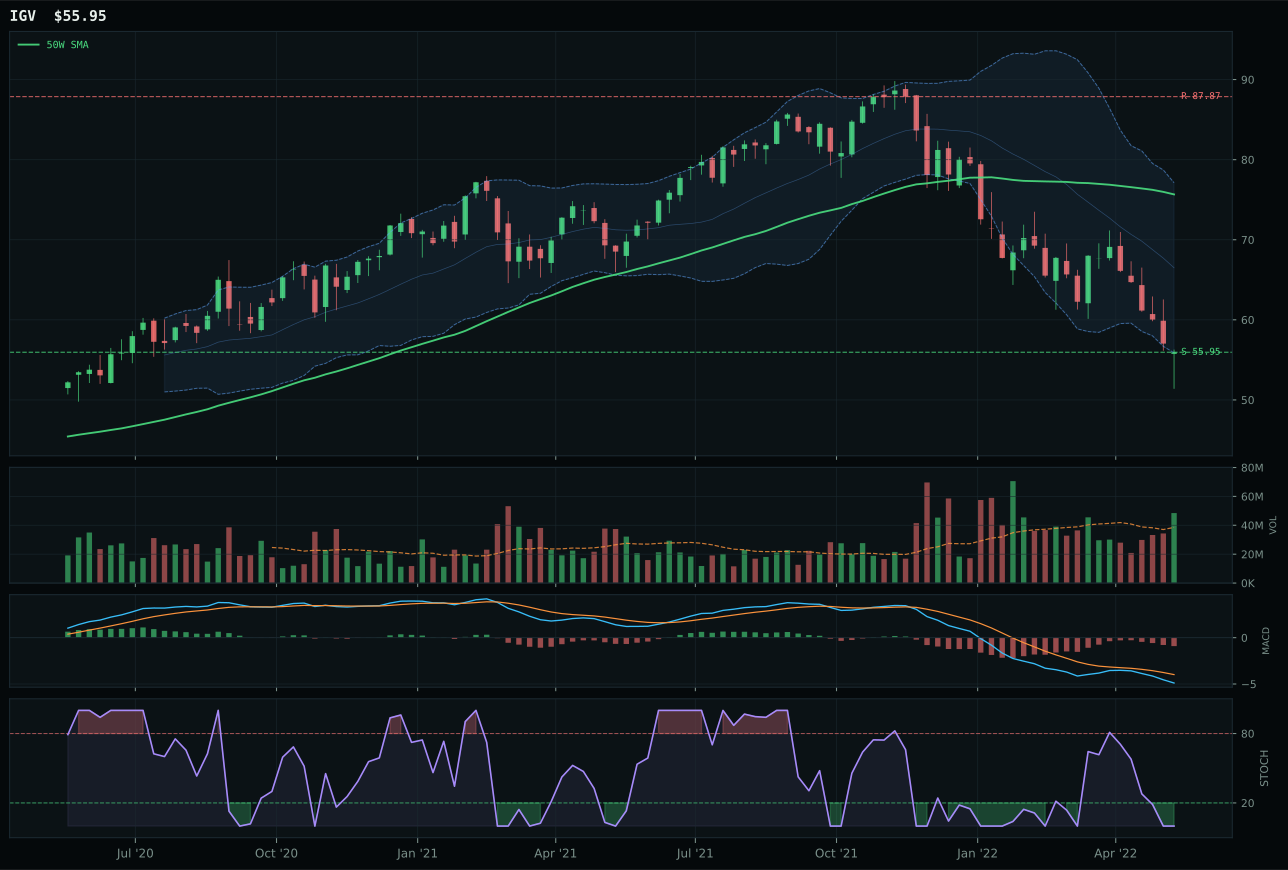
IGV has a pullback into support profile with -10.4% 13-week relative strength versus SPY.
A failed hold above support would weaken the setup.
Actionable but governed by invalidation levels.
XLK wins the category because its pullback into support near 67.93 offers a defined, testable setup with real invalidation risk—the mark of a tradable position rather than a bounce guess. Trading 12.7% below the 50W with MACD bearish but stochastic RSI oversold at 0.00, XLK has found a floor where volume is arriving at 1.34x average participation, suggesting accumulation into weakness rather than capitulation selling. CIBR lost on the margin despite a nearly identical technical foundation; its category-relative strength is flat at 0.5% versus XLK's 0.0%, and more critically, its volume-price confirmation trails at 20.0 versus 22.0. In a broad liquidation, the fight between two damaged technology names comes down to which one shows even marginal proof that smart money is building, not just bouncing. XLK's above-average volume into an oversold stochastic provides that proof.
Technology receives 0% allocation this week and ranks outside the portfolio entirely—specifically 9th or 10th among the ten category slots. The category's macro fit of 31.0/100 collapses under the weight of active liquidity stress (-10), dollar pressure (-5), and inflation pressure (-4), a trifecta that penalizes growth narratives and duration risk in Late-Cycle Reflation. Even XLK's best-in-basket timing score of 60.0 cannot overcome a trend reading of only 41.8/100; price remains below the 50W, earnings multiples face compression, and the setup reads as defensive damage control rather than accumulation. For Technology to earn a tier-2 slot of 5%, the category would need either MACD to turn bullish and confirm an actual trend reversal, or macro descriptors to shift away from liquidity stress—neither has occurred. The real assets, energy, and agricultural themes are simply outbidding duration and growth in this environment.
AI — SMH
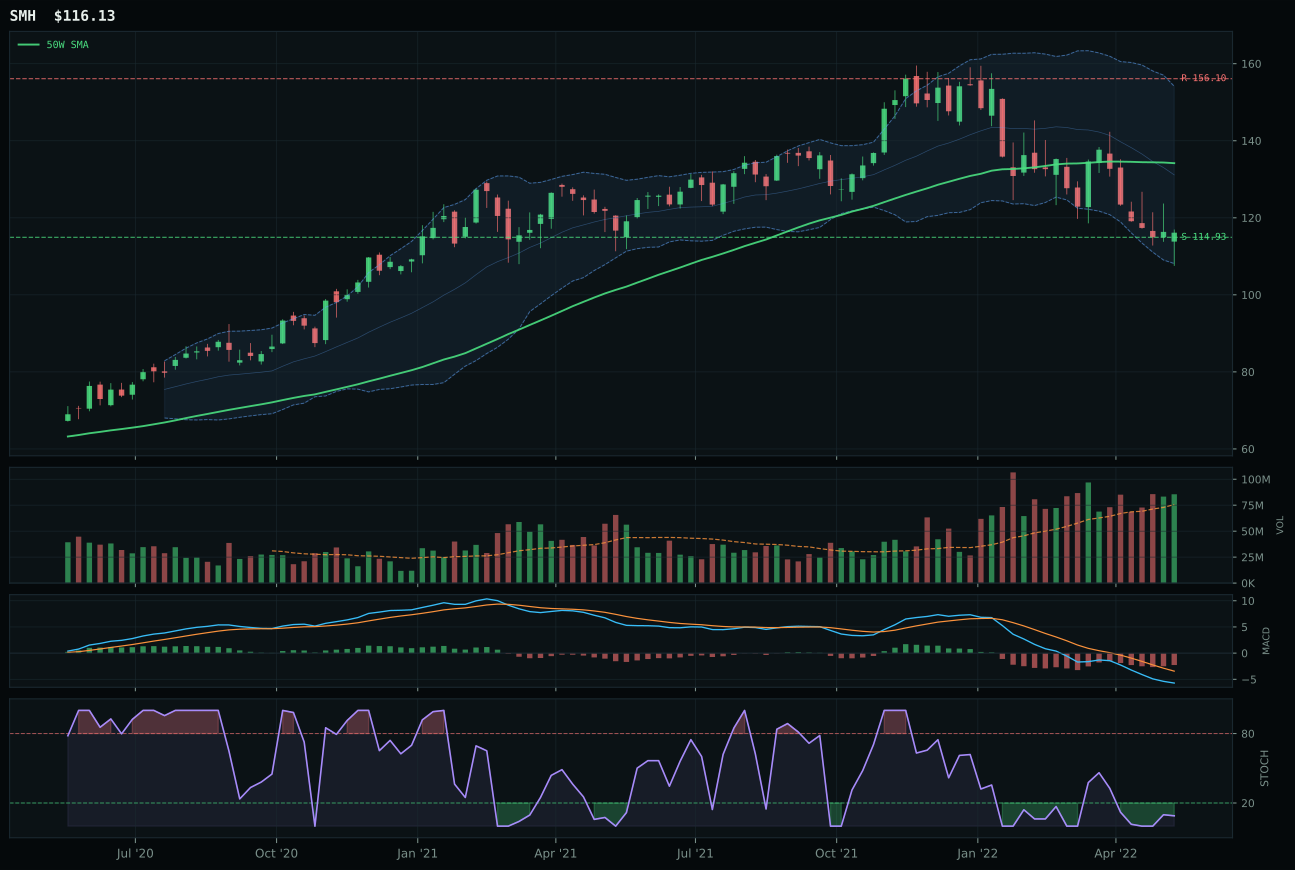
SMH has a pullback into support profile with -3.6% 13-week relative strength versus SPY.
A failed hold above support would weaken the setup.
Actionable but governed by invalidation levels.
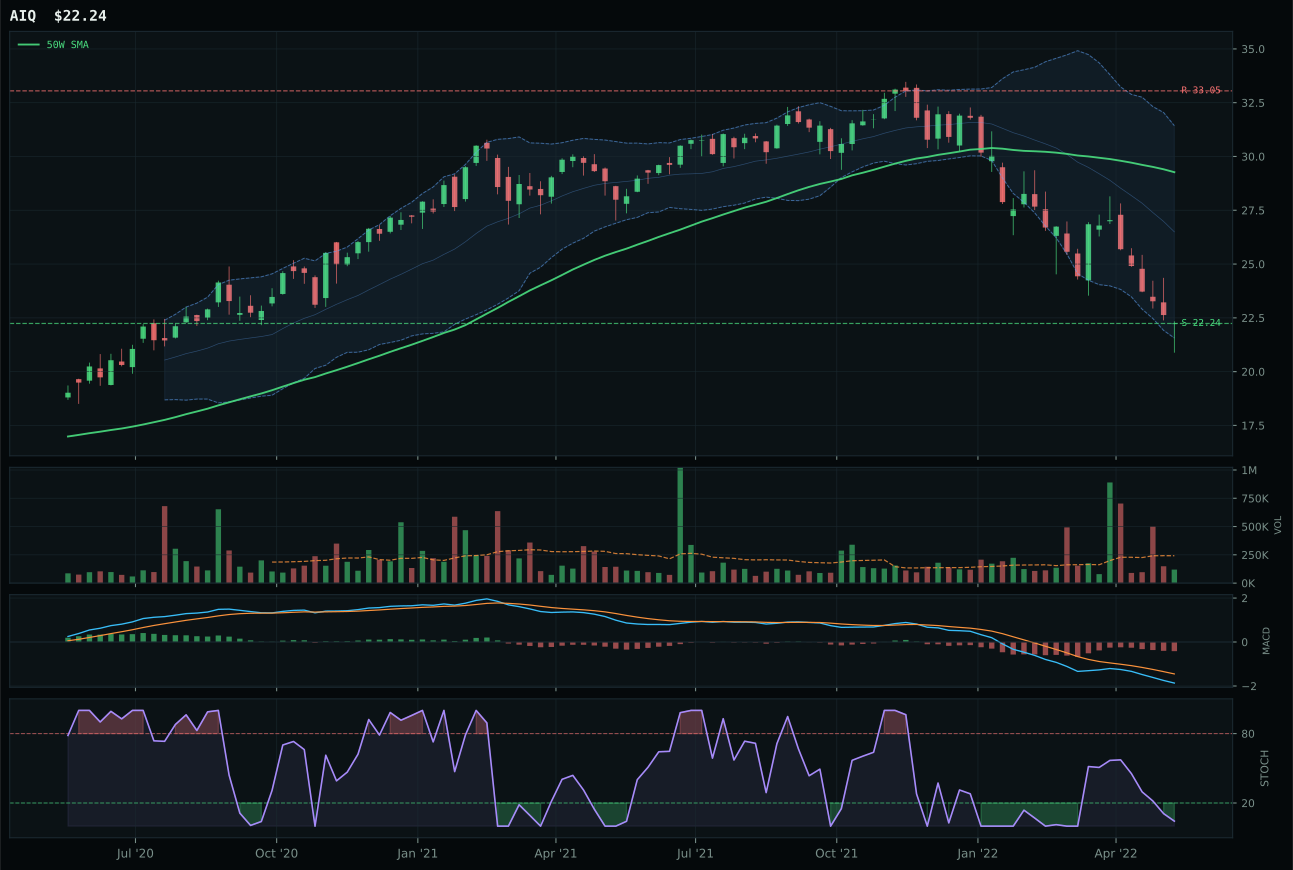
AIQ has a pullback into support profile with -10.8% 13-week relative strength versus SPY.
A failed hold above support would weaken the setup.
Tracked, but not top-2 eligible because: .
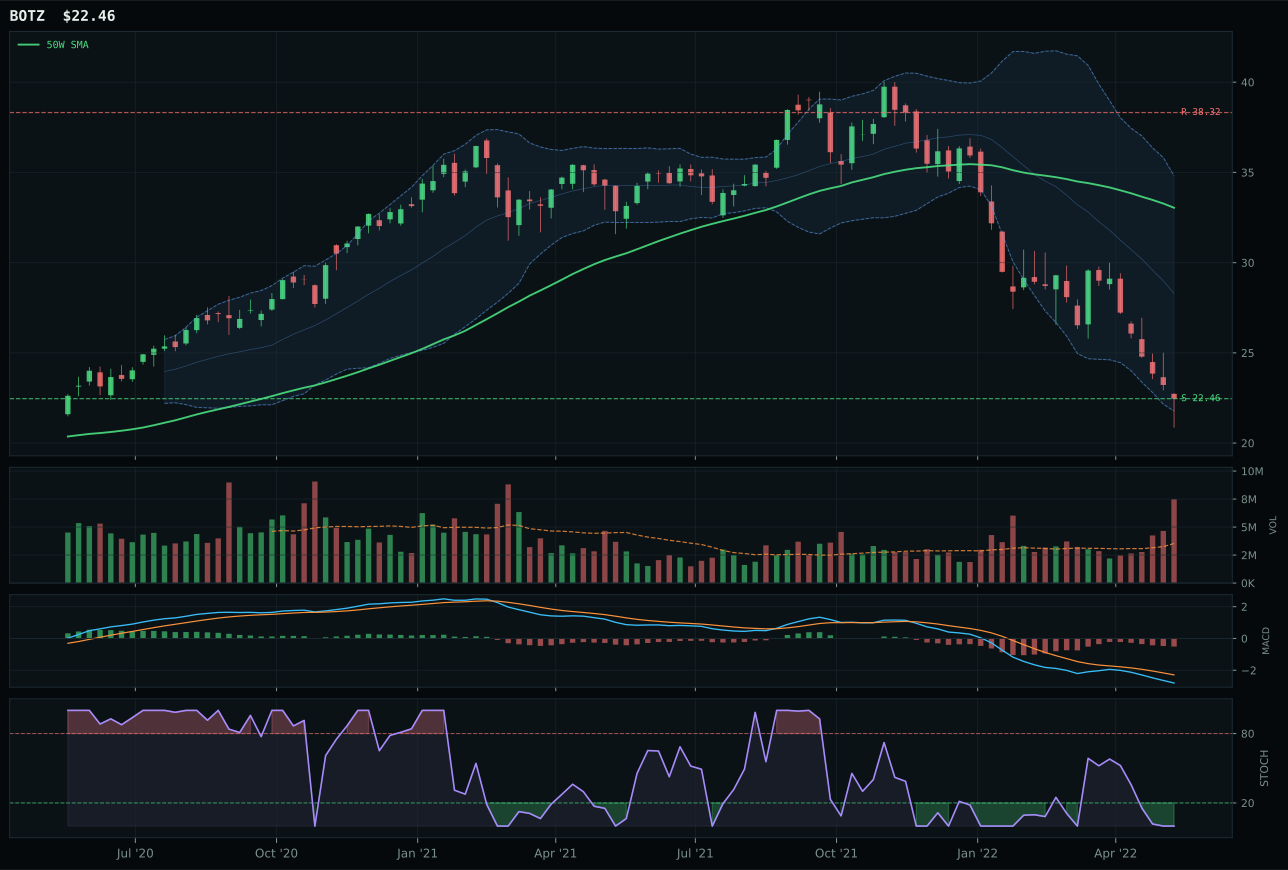
BOTZ has a pullback into support profile with -13.6% 13-week relative strength versus SPY.
A failed hold above support would weaken the setup.
Actionable but governed by invalidation levels.
SMH wins cleanly over AIQ because timing quality is not negotiable in a bear market, and SMH's stochastic RSI is turning up from oversold at 0.09 while AIQ's remains flat at 0.00. Structure is crisper at 64.1 versus 58.2, but the decisive edge is momentum confirmation: SMH posts a 49.9/100 momentum score with category-relative strength of 7.2%, meaning semiconductors are the relative outperformer inside AI; AIQ manages only 0.0% category RS on a 20.5 technical evidence score. Volume participation at SMH is above-average at 1.13x, versus thin participation at AIQ—a crucial tell in a broad deleveraging. The 52.7-point gap versus AIQ reflects not a close call but a clean separation; SMH's setup is pulling into support with active accumulation signal, while AIQ sits in pure liquidation mode with no offsetting macro narrative.
AI receives 0% allocation and ranks 9th or 10th, excluded entirely from this week's portfolio. The category macro fit of 26.0/100 is devastated by active liquidity stress (-12), broad market bear (-8), and dollar pressure (-4)—a harsh combination for a category priced on perpetual growth and zero-rate optionality. SMH's technical evidence of 56.0/100 is respectable and pulls the category's weighted basket score to 33.6, but after testing against persistence, volume sponsorship, and macro descriptors, the final score compresses to 10.2. AI simply cannot compete against commodities bid by scarcity, energy driven by geopolitics, and agriculture backed by real shortage. For AI to earn a 5% slot, macro descriptors would need to reverse—specifically liquidity stress would need to ease and risk appetite to stabilize—or the category's leaders would need to show MACD confirmation of a new uptrend, neither of which has materialized.