
2022-05-06
Informational purposes only. The content in this report, including allocations, analysis, and commentary, is provided solely for informational and educational purposes. It does not constitute financial advice, investment advice, trading advice, or any other type of advice. Past performance does not guarantee future results. Always conduct your own research and consult a qualified financial professional before making investment decisions.
GLD defensive overlay excluded: price is below its 8W SMA. Cause selector will use cash alternative.
Fast-crash circuit breaker triggered: SPY dropped more than 8% from its 4-week high this week. Defensive overlay activated immediately.
Macro risk engine requires the 50% Defensive overlay for this run; payload selected by cause: Liquidity Crisis.
Weekly Allocation
| Ticker | Category | Weight | Role |
|---|---|---|---|
| SGOV | 50% | Overlay | |
| XLE | Traditional Energy | 10% | Top-2 (10%) |
| WEAT | Agriculture & Livestock | 10% | Top-2 (10%) |
| IGF | Utilities & Infrastructure | 5% | Tier-2 (5%) |
| GLD | Precious Metals | 5% | Tier-2 (5%) |
| COPX | Industrial Metals | 5% | Tier-2 (5%) |
| ITA | Defense & Aerospace | 5% | Tier-2 (5%) |
| URA | Nuclear Energy | 5% | Tier-2 (5%) |
| XLK | Technology | 5% | Tier-2 (5%) |
Trade Instructions — Monday Open
Sell the tranche from 2022-04-08 (completing its 4-week hold). Buy the new tranche. Instructions show net portfolio changes — same-asset positions cancel, weight changes show the delta.
| Action | Ticker | Instruction |
|---|---|---|
| SELL | XLE | Sell 33% of XLE position (reduce 30.00% → 20.00%) |
| SELL | VEGI | Sell entire VEGI position (2.50% of portfolio) |
| SELL | XOP | Sell 50% of XOP position (reduce 5.00% → 2.50%) |
| SELL | REMX | Sell entire REMX position (1.25% of portfolio) |
| SELL | SLV | Sell entire SLV position (1.25% of portfolio) |
| SELL | XLU | Sell 11% of XLU position (reduce 11.25% → 10.00%) |
| SELL | URNM | Sell 25% of URNM position (reduce 5.00% → 3.75%) |
| SELL | CIBR | Sell 33% of CIBR position (reduce 3.75% → 2.50%) |
| BUY | GLD | Buy GLD — 5.88% of freed cash (adds 1.25% to portfolio) |
| BUY | COPX | Buy COPX — 5.88% of freed cash (adds 1.25% to portfolio) |
| BUY | SGOV | Buy SGOV — 58.82% of freed cash (adds 12.50% to portfolio) |
| BUY | WEAT | Buy WEAT — 11.76% of freed cash (adds 2.50% to portfolio) |
| BUY | IGF | Buy IGF — 5.88% of freed cash (adds 1.25% to portfolio) |
| BUY | XLK | Buy XLK — 5.88% of freed cash (adds 1.25% to portfolio) |
| BUY | URA | Buy URA — 5.88% of freed cash (adds 1.25% to portfolio) |
Current Portfolio After Trade
Combined holdings across all 4 active tranches. Each tranche is 25% of the portfolio.
| Ticker | % of Portfolio | Weight Bar |
|---|---|---|
| SGOV | 22.50% | |
| XLE | 20.00% | |
| GLD | 15.00% | |
| XLU | 10.00% | |
| ITA | 5.00% | |
| COPX | 5.00% | |
| WEAT | 5.00% | |
| URNM | 3.75% | |
| CIBR | 2.50% | |
| XOP | 2.50% | |
| MOO | 2.50% | |
| IGF | 2.50% | |
| XLK | 2.50% | |
| URA | 1.25% |
Macro Regime — Transition / Mixed
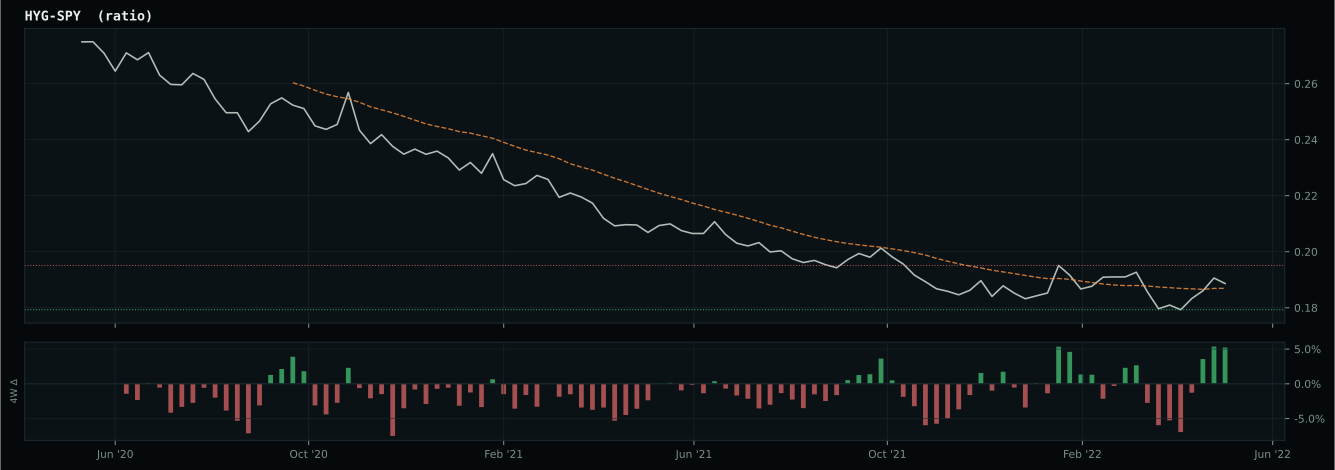
growth data is not confirming the weak market-implied risk appetite signal
Defensive overlay cause is liquidity scarcity: crisis macro risk, severe credit stress, or a dollar/risk-appetite break means cash-like liquidity should lead the defensive sleeve.
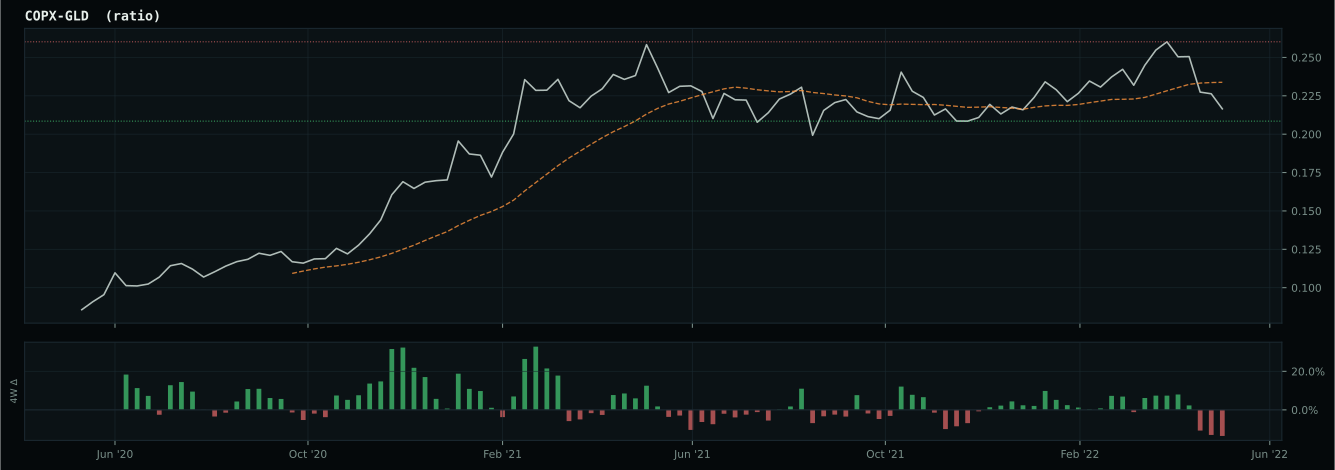
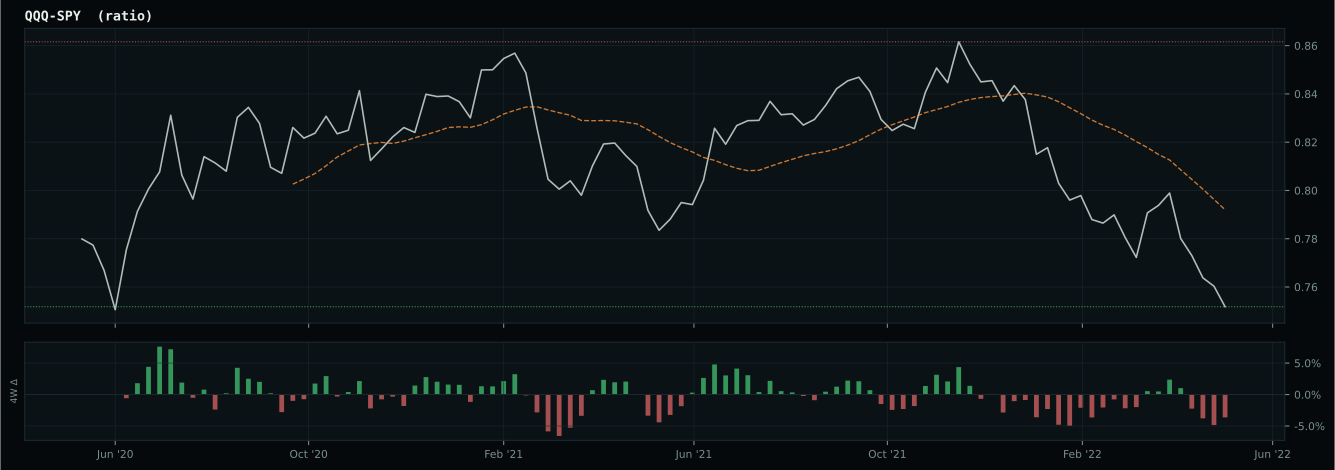
Macro Evidence Charts
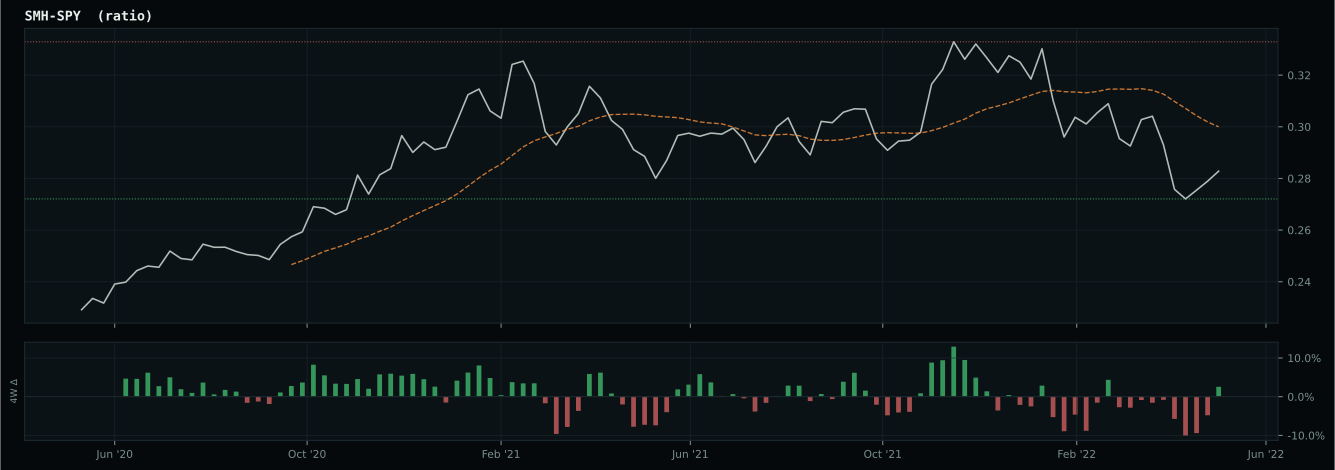
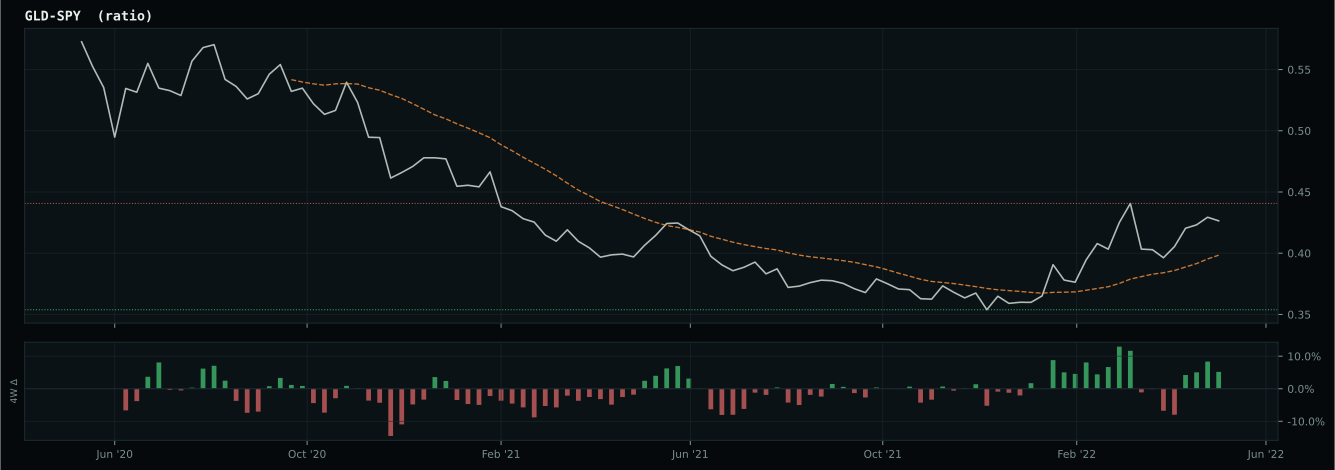
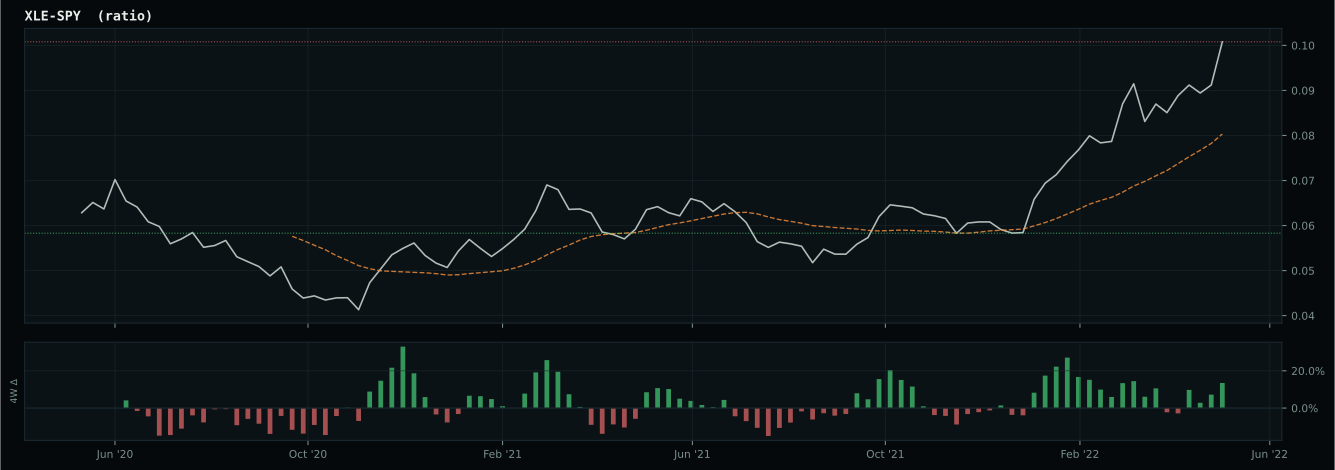
Market-implied signals behind the macro regime scores. Each ratio compares two assets; the direction and slope of the ratio is what the macro engine reads.
Crypto Regime — NoCrypto
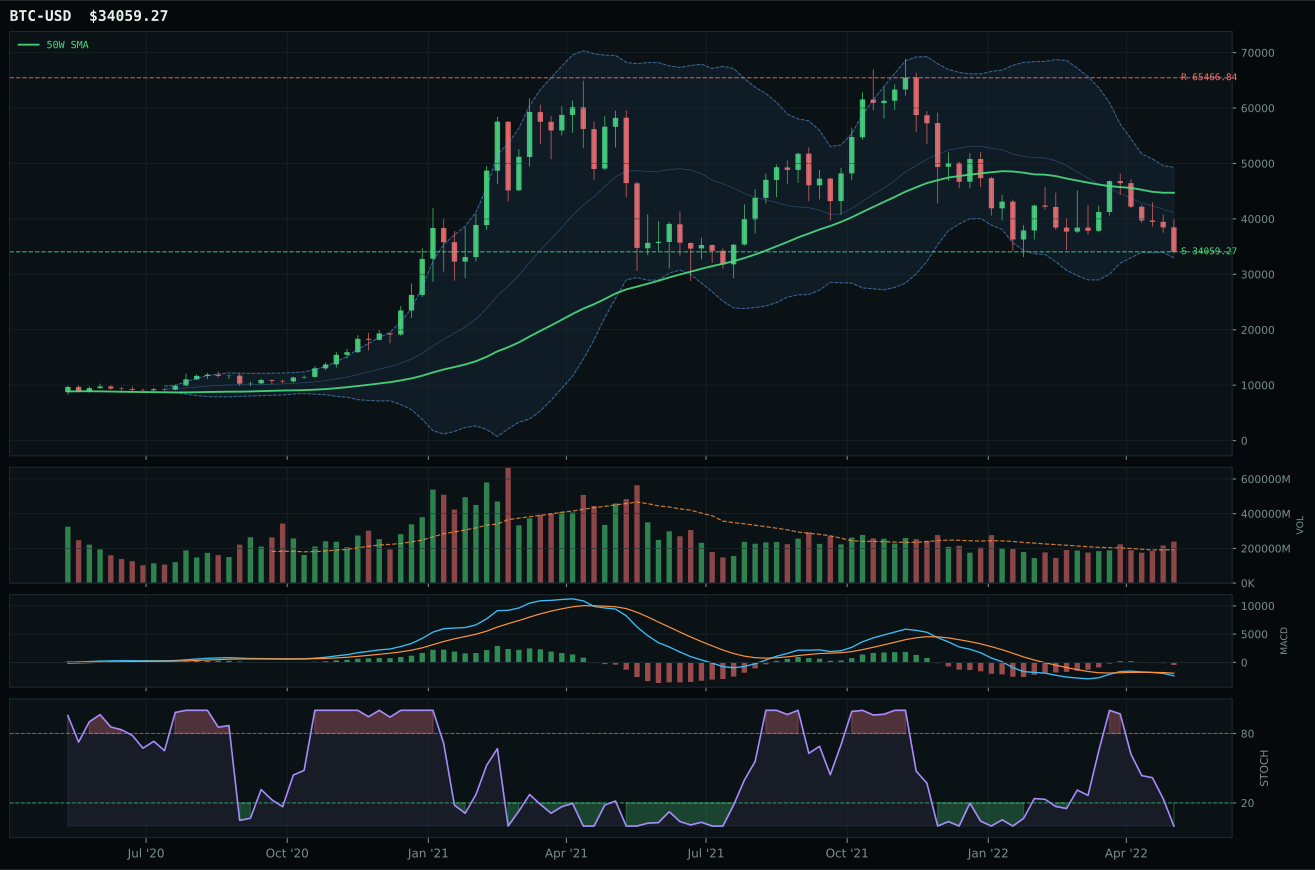
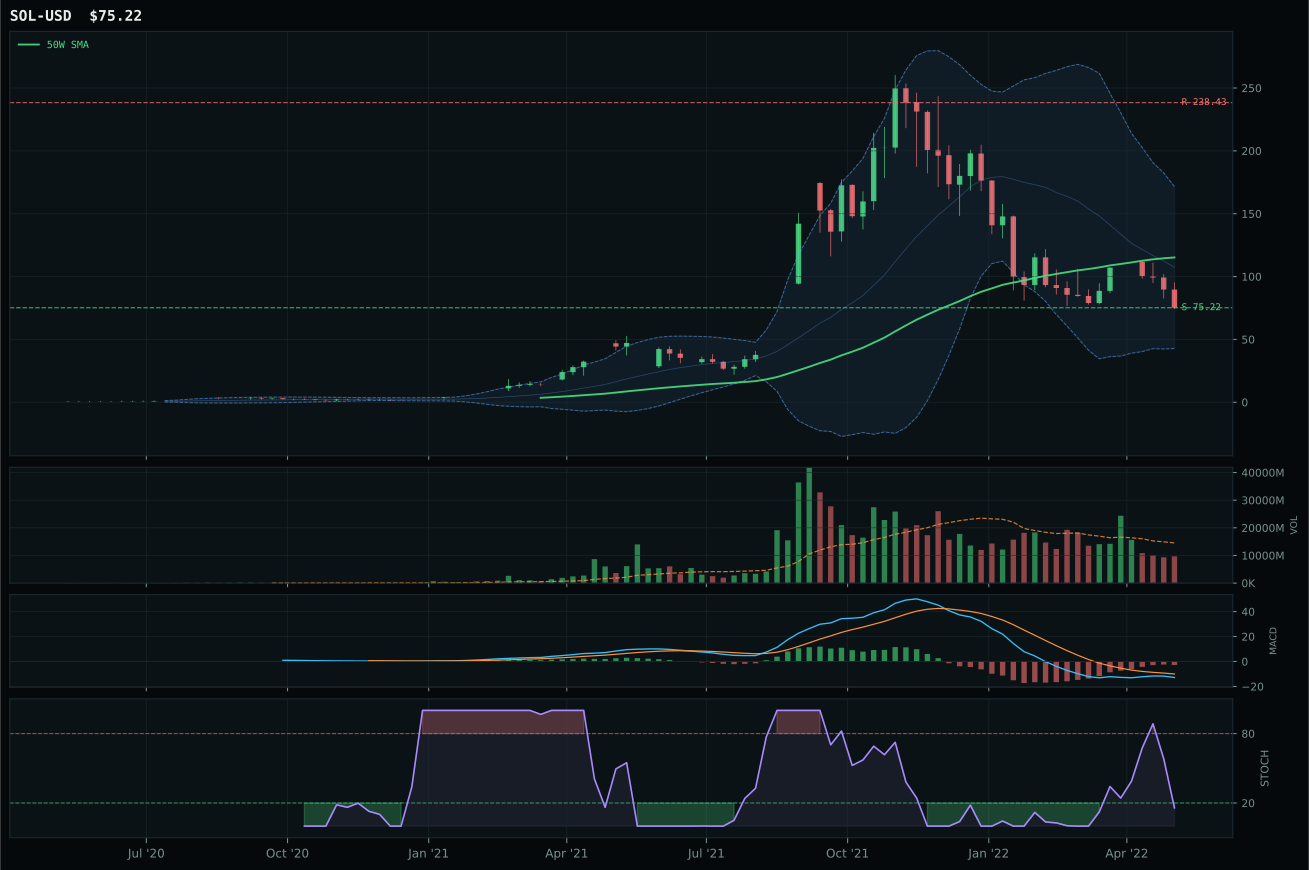
ValueBTC not armed: BTC has not made the first post-breakdown touch of the 200W buy zone after losing the 50W
TrendBTC not confirmed
one or more available conditions failed
Category Rankings
| Rank | Category | Winner | Score | Alloc | 4W Ret | Peers (4W) |
|---|---|---|---|---|---|---|
| 1 | Traditional Energy | XLE | 84.5 | 20% | +10.85% | FCG +17.2% · XOP +18.0% |
| 2 | Agriculture & Livestock | WEAT | 64.0 | 20% | -0.54% | VEGI +3.4% · MOO +3.9% |
| 3 | Utilities & Infrastructure | IGF | 62.9 | 10% | +5.67% | XLU +4.5% · PAVE +3.4% |
| 4 | Precious Metals | GLD | 55.8 | 10% | -0.84% | GDX -1.6% · SLV +1.1% |
| 5 | Industrial Metals | COPX | 48.7 | 10% | +10.73% | PICK +12.2% · REMX +13.0% |
| 6 | Defense & Aerospace | ITA | 46.6 | 10% | +2.36% | ROKT +3.9% · XAR +2.0% |
| 7 | Nuclear Energy | URA | 42.3 | 10% | +5.83% | NLR +4.9% · URNM +3.6% |
| 8 | Technology | XLK | 38.0 | 10% | +2.70% | CIBR +3.6% · IGV +6.8% |
| 9 | AI | SMH | 30.2 | 0% | +7.95% | AIQ +4.6% · BOTZ +6.3% |
| 10 | Emerging Markets | IEMG | 7.2 | 0% | +7.06% | INDA +0.1% · ILF +15.1% |
Traditional Energy — XLE
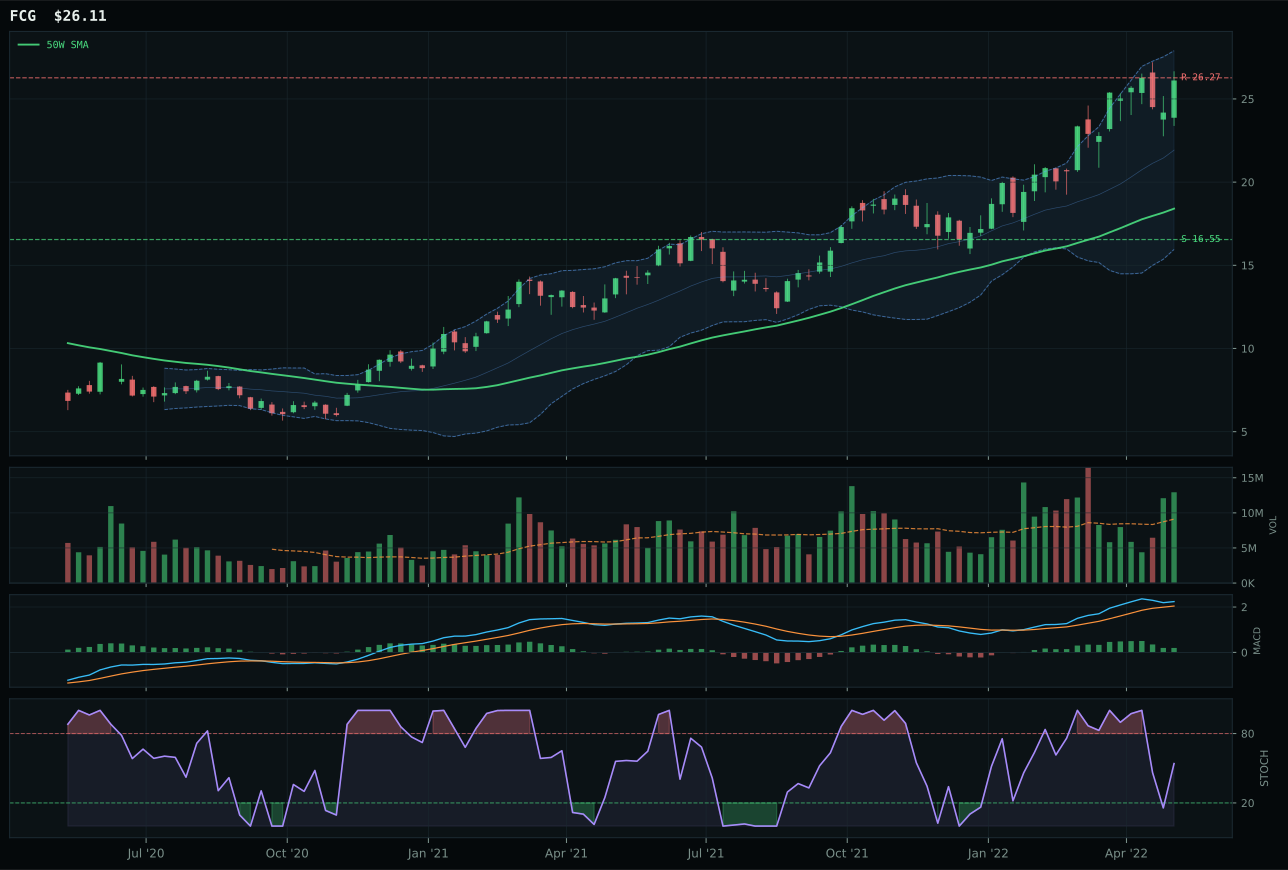
FCG has a vertical extension profile with 36.0% 13-week relative strength versus SPY.
A failed hold above support would weaken the setup.
Actionable but governed by invalidation levels.
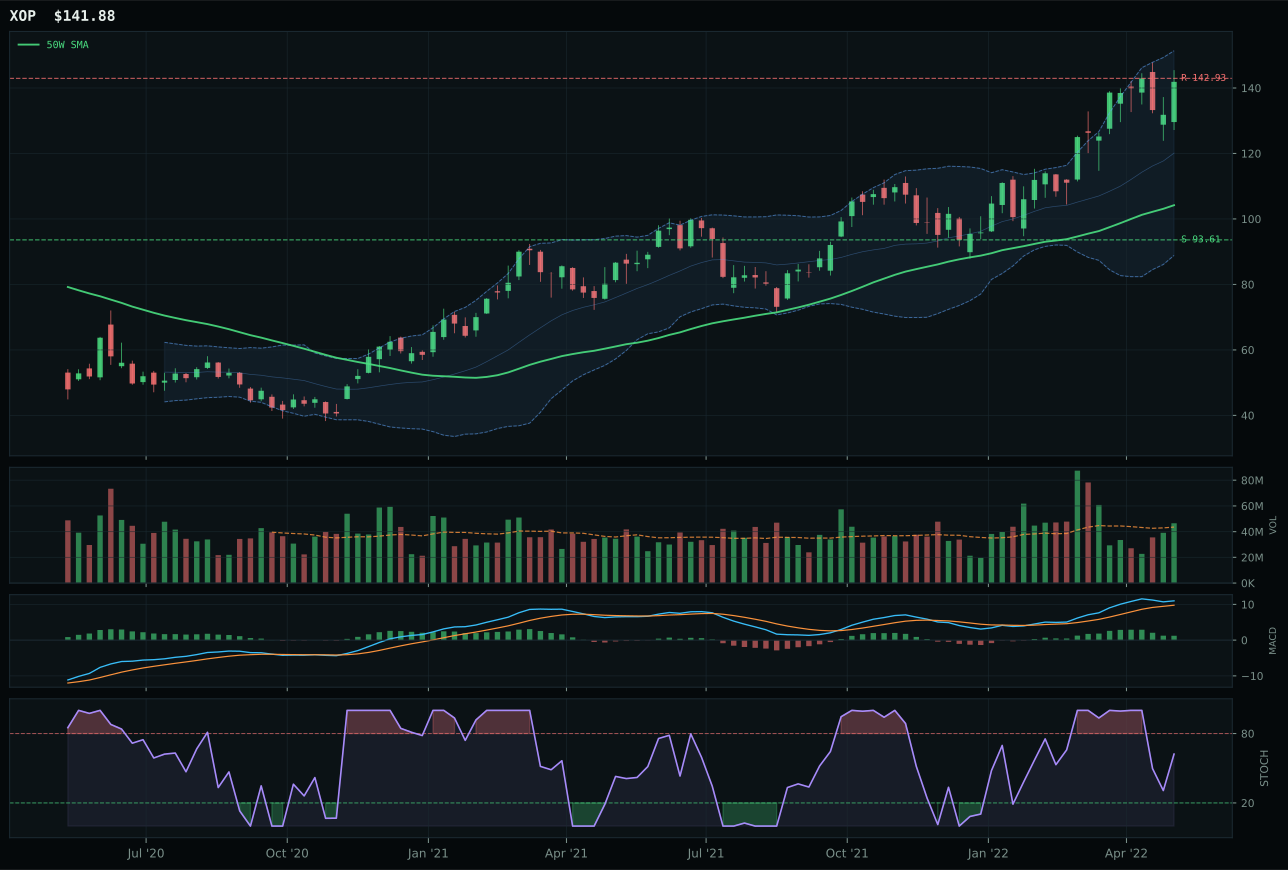
XOP has a vertical extension profile with 35.1% 13-week relative strength versus SPY.
A failed hold above support would weaken the setup.
Actionable but governed by invalidation levels.
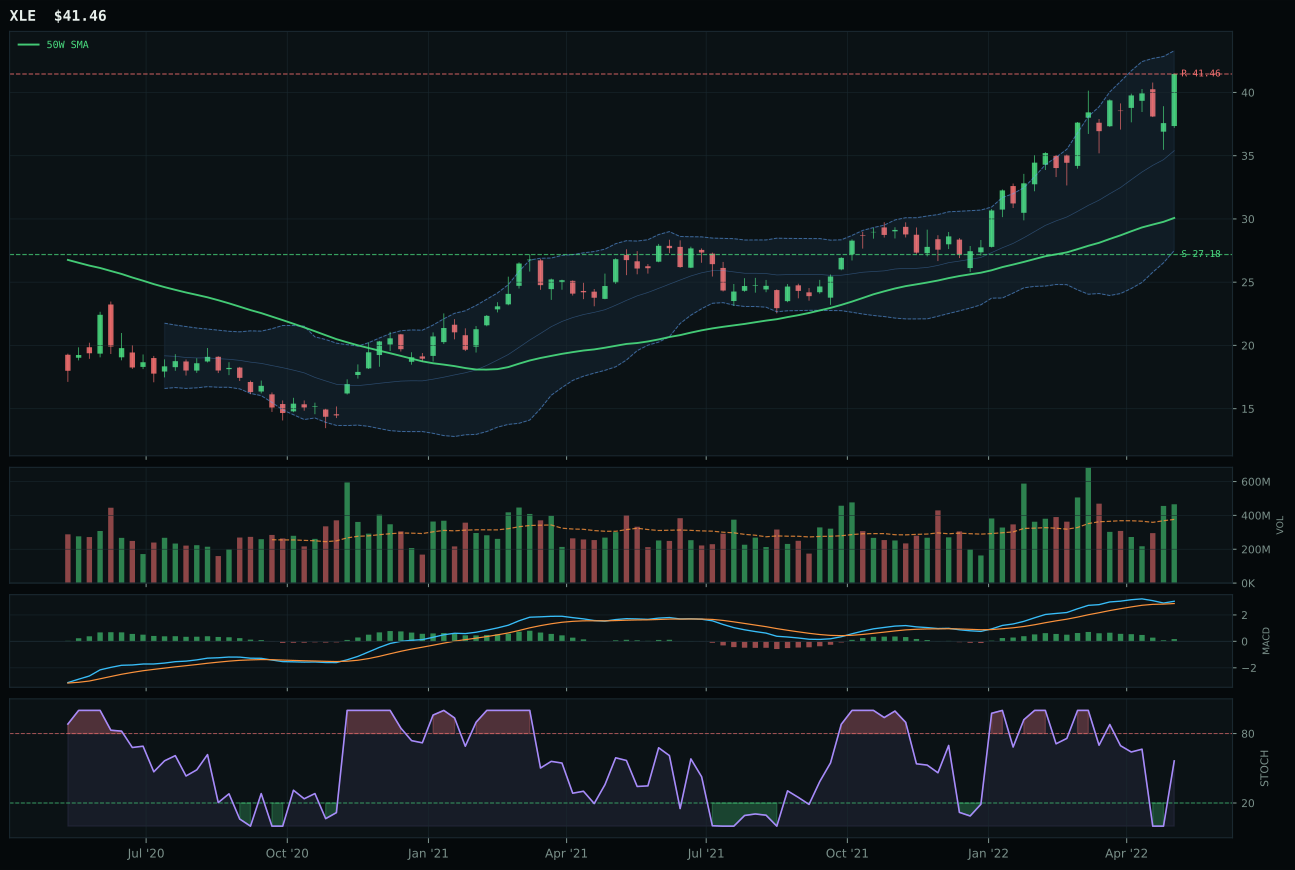
XLE has a vertical extension profile with 28.7% 13-week relative strength versus SPY.
A failed hold above support would weaken the setup.
Actionable but governed by invalidation levels.
XLE claims the top-2 slot with a 84.5 category score and perfect 100.0 trend score, driven by price 37.8% above the 50-week moving average with 20.3% 13-week return and dominant 28.7% relative strength versus SPY. The structure score of 74.1 reflects vertical extension with above-average participation at 1.24x, and MACD bullish-but-flattening with stochastic RSI falling/neutral at 0.56 signals the move is mature but not yet topping. FCG's 3.4-point gap reflects weaker risk/reward (22.2 vs 39.7) and looser structure (69.7 vs 74.1); while FCG's 36.0% relative strength is superior, it offers less defensive value if energy prices mean-revert. XLE's integrated cash-generation model and diversified exposure (not just crude) makes it the more durable holding in a late-cycle inflationary regime. Volume-price confirmation at 71.5% and persistence at 77.0% tell a story of sustained institutional accumulation, not a final-day momentum spike.
Traditional Energy ranks first at 84.5 category score and commands 10% allocation as a top-2 category because macro fit is 92.0—the highest in the portfolio—with energy scarcity (+16), inflation pressure (+10), supply shortage (+9), and real asset sponsorship (+7) creating a nearly perfect storm of structural support. The 40.0 timing score is the only weakness; XLE's extended entry at +37.8% from the 50-week is textbook late-cycle buying, and mean-reversion risk is real. However, in a regime where liquidity is contracting and inflation is accelerating, the premium for scarcity overwhelms entry-timing risk. Geopolitical supply disruptions (Russia, Iran sanctions, OPEC production cuts) remain structural, not cyclical. This allocation reflects a conviction thesis: energy will outperform in a stagflationary environment regardless of near-term pullbacks. Add to this position on any break below support at 27.18; do not reduce until energy earnings begin rolling over relative to the broad market.
Agriculture & Livestock — WEAT
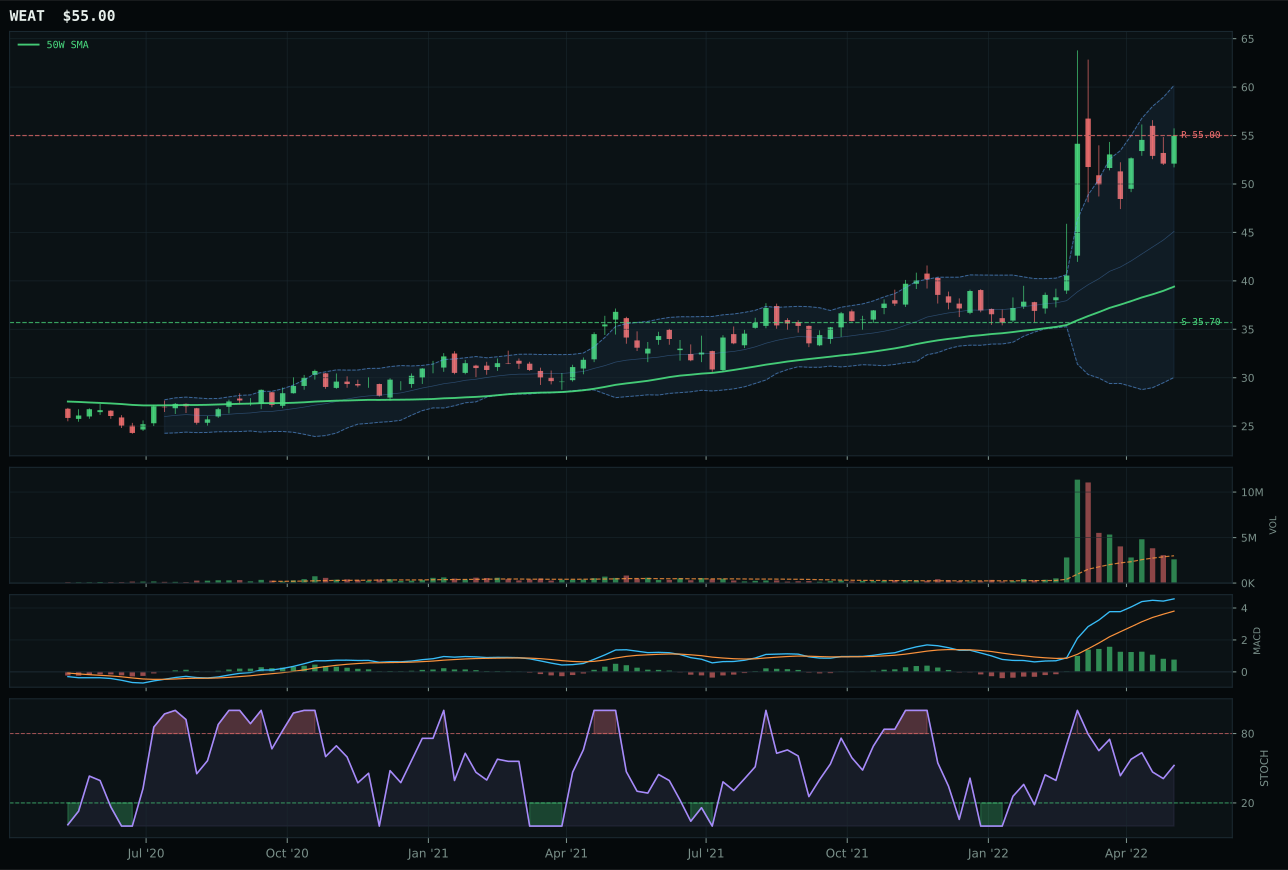
WEAT has a vertical extension profile with 57.4% 13-week relative strength versus SPY.
A failed hold above support would weaken the setup.
Actionable but governed by invalidation levels.
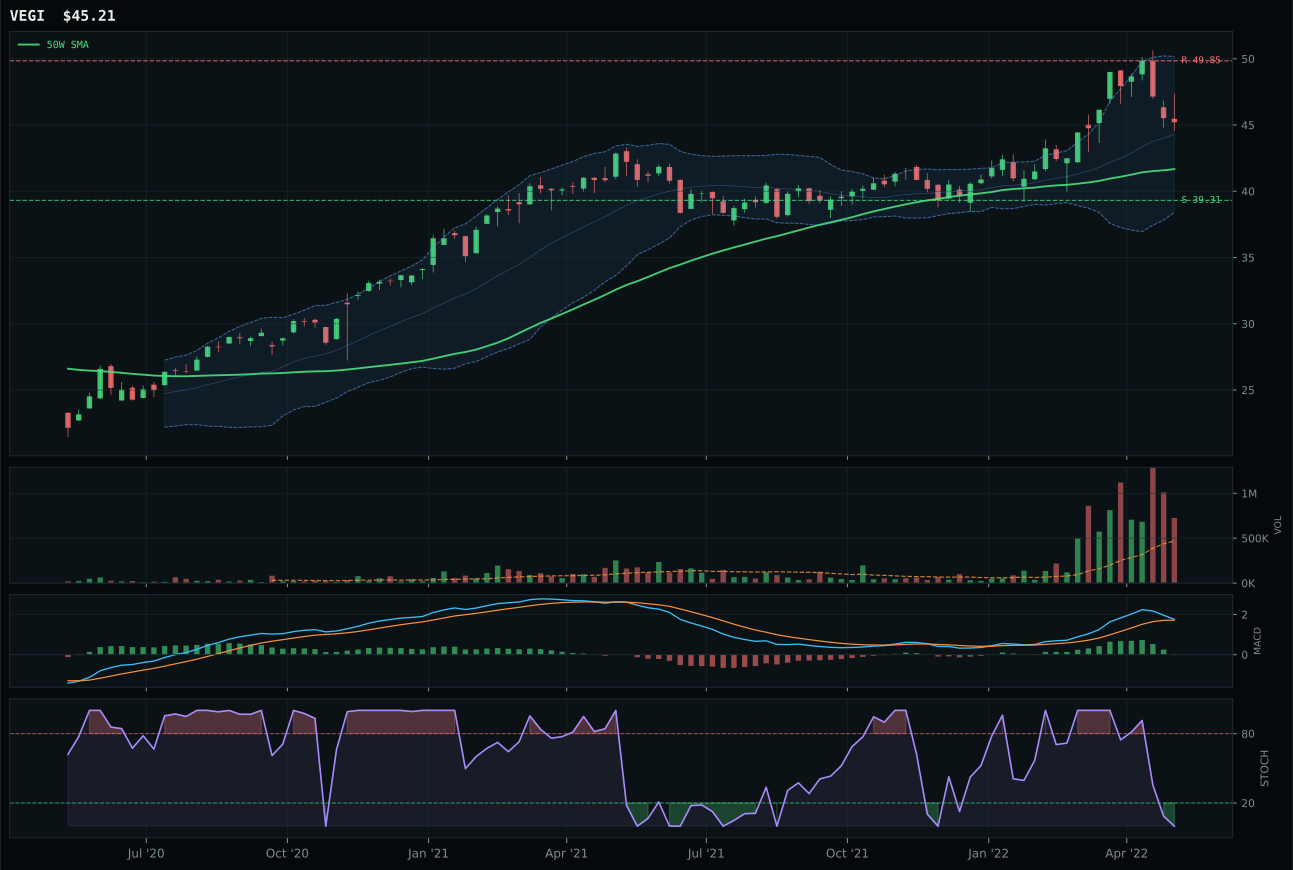
VEGI has a neutral structure profile with 17.3% 13-week relative strength versus SPY.
A failed hold above support would weaken the setup.
Actionable but governed by invalidation levels.
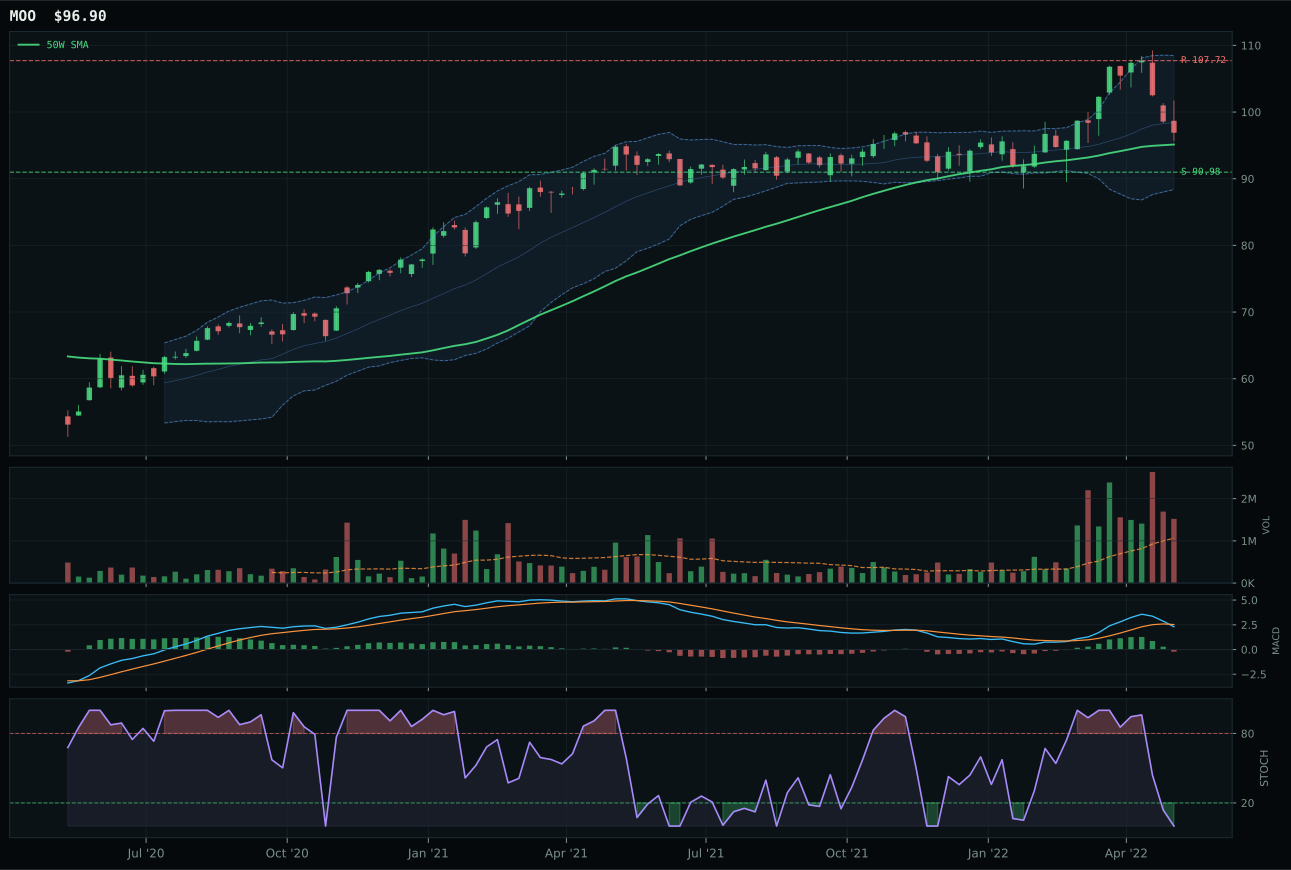
MOO has a compression near 50W profile with 11.7% 13-week relative strength versus SPY.
A failed hold above support would weaken the setup.
Actionable but governed by invalidation levels.
WEAT earns top-2 status with a perfect 100.0 trend score and 100.0 momentum confirmation, reflecting price 39.6% above the 50-week moving average with a 49.1% 13-week return and 57.4% relative strength versus SPY. The vertical extension setup is extended but not yet invalidated; MACD is bullish but flattening and stochastic RSI is falling/neutral at 0.52, both red flags for momentum exhaustion. Volume is neutral (0.87x), which actually protects this setup from distribution risk—there has been no panic selling into the rise, only steady accumulation at higher prices. VEGI lost despite superior macro fit (69.0 versus 50.0) because distribution pressure and 0.0% category-relative strength tell a story of lagging leadership. WEAT's 40.1% category-relative strength dominates the decision; it is the only name with positive money flow into continued strength.
Agriculture & Livestock ranks second at 64.0 category score and joins XLE as a top-2 allocation at 20%. Macro fit is 86.0—the highest in the portfolio—driven by supply shortage (+13), inflation pressure (+10), real asset sponsorship (+8), and commodity breadth positive (+5). The geopolitical supply shocks to wheat and grains remain structural; Russia and Ukraine disruptions are not solved by lower prices alone. WEAT's extended entry at +39.6% from the 50-week is the only weakness here, but the risk/reward of 32.7 (54.1% downside to support) actually makes sense given macro tailwinds. This is a top-2 category precisely because it works in a stagflationary environment where growth names crater but real asset scarcity remains bid. Reduce to 10% only if corn and wheat prices break key supply levels or if global demand indicators roll over decisively.
Utilities & Infrastructure — IGF
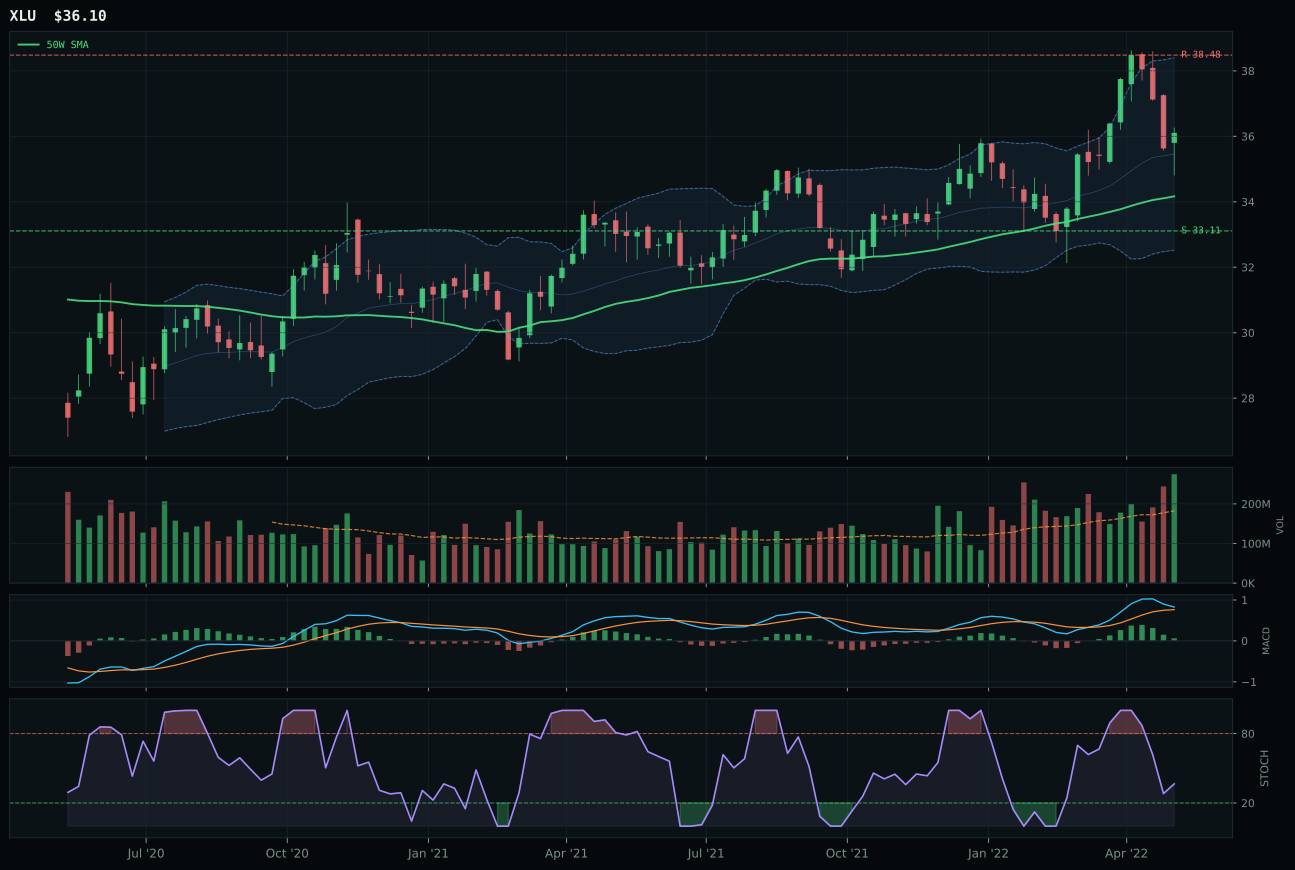
XLU has a neutral structure profile with 13.8% 13-week relative strength versus SPY.
A failed hold above support would weaken the setup.
Actionable but governed by invalidation levels.
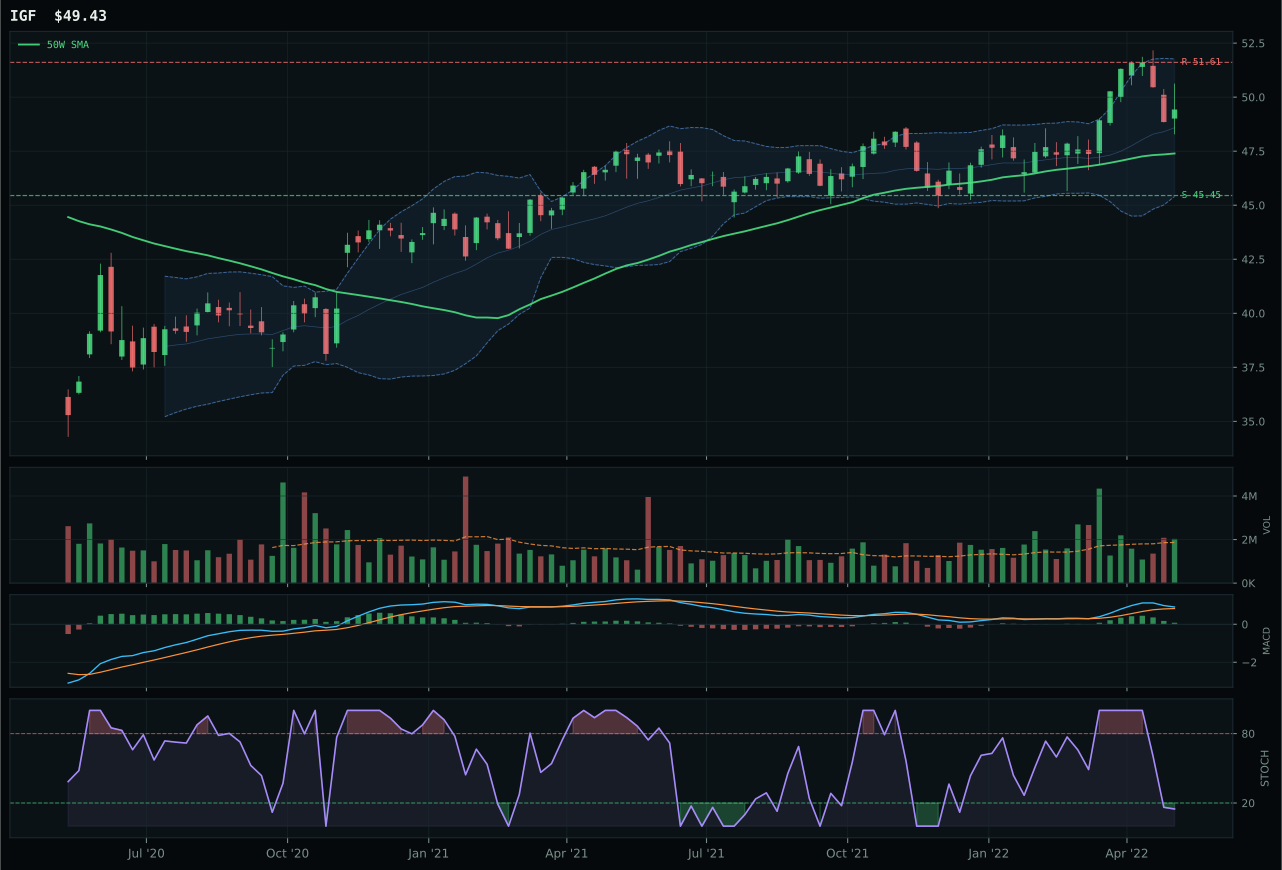
IGF has a neutral structure profile with 12.5% 13-week relative strength versus SPY.
A failed hold above support would weaken the setup.
Actionable but governed by invalidation levels.
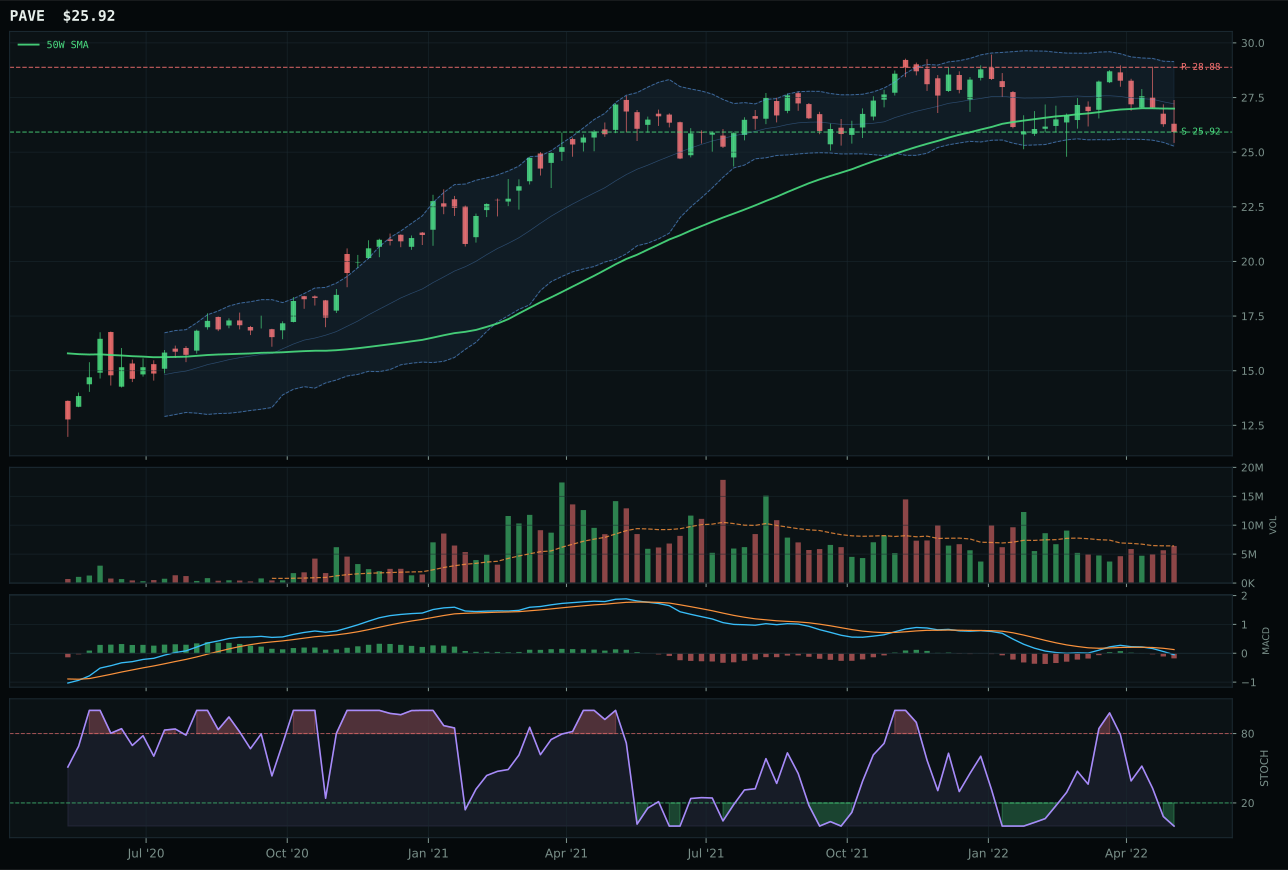
PAVE has a pullback into support profile with 7.8% 13-week relative strength versus SPY.
A failed hold above support would weaken the setup.
Actionable but governed by invalidation levels.
IGF wins a close call over XLU (separated by just 1.5 points) with a 62.9 category score by posting a superior 85.0 timing score versus XLU's 70.0, earned by sitting 4.3% above the 50-week in the Fibonacci 0.382 upper-retracement momentum zone. IGF's stochastic RSI oversold at 0.15 suggests reversal potential, while XLU's falling/neutral at the same price levels is neutral to slightly bearish. XLU dominates on technical evidence (83.7 vs 73.4) and volume confirmation (accumulation/confirmation vs neutral), but IGF's global infrastructure positioning (versus XLU's domestic regulated utilities) offers better macro diversification in a stagflationary environment. The 12.5% relative strength for IGF and 13.8% for XLU are nearly identical; trend scores both at 100.0 reflect upside positioning. This is a wire-thin decision driven by timing mechanics and macro setup.
Utilities & Infrastructure earned 5% with a 62.9 category score, placing it fourth overall but unable to compete with the two top-2 categories (XLE and WEAT) and higher-conviction defensive names (Defense, Precious Metals). Macro fit is 64.0 with defensive rotation strongly bid (+12) and transition regime support (+4), but offset by inflation pressure (-6) that erodes utility cash flows. IGF's 4.1% 13-week return is solid but not extraordinary; it is working as a steady diversifier rather than a momentum driver. The allocation reflects conviction that falling growth expectations support dividend and utility demand, but this thesis is second-order relative to energy scarcity and agricultural commodity shortage narratives. XLU's superior technical evidence (83.7) and volume-price confirmation suggest it may be the better tactical position if forced to choose, but global infrastructure income exposure via IGF provides currency and jurisdiction diversification. Hold at 5%; rotate to XLU if inflation data rolls over and domestic rate-sensitive stocks stabilize.
Precious Metals — GLD
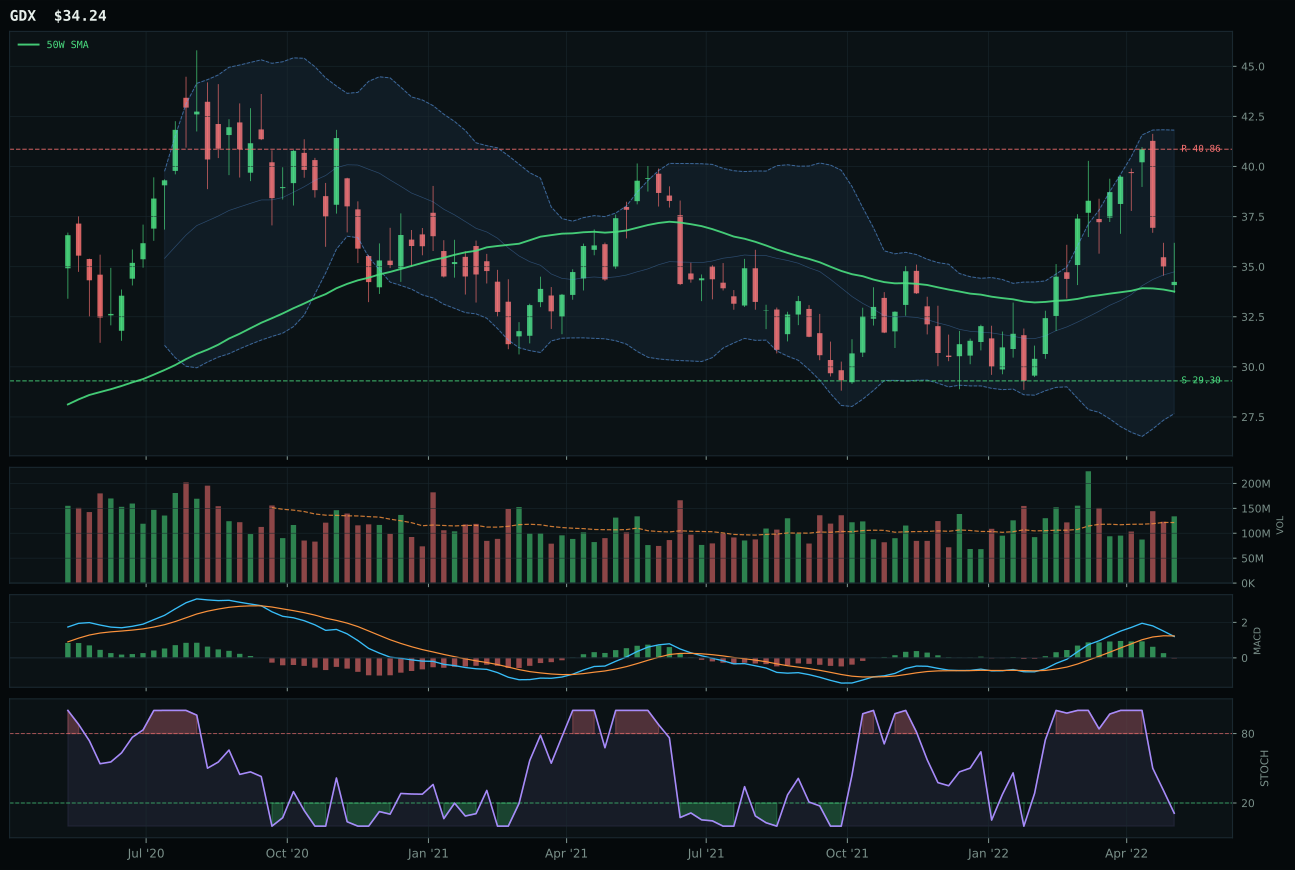
GDX has a compression near 50W profile with 21.0% 13-week relative strength versus SPY.
A failed hold above support would weaken the setup.
Actionable but governed by invalidation levels.
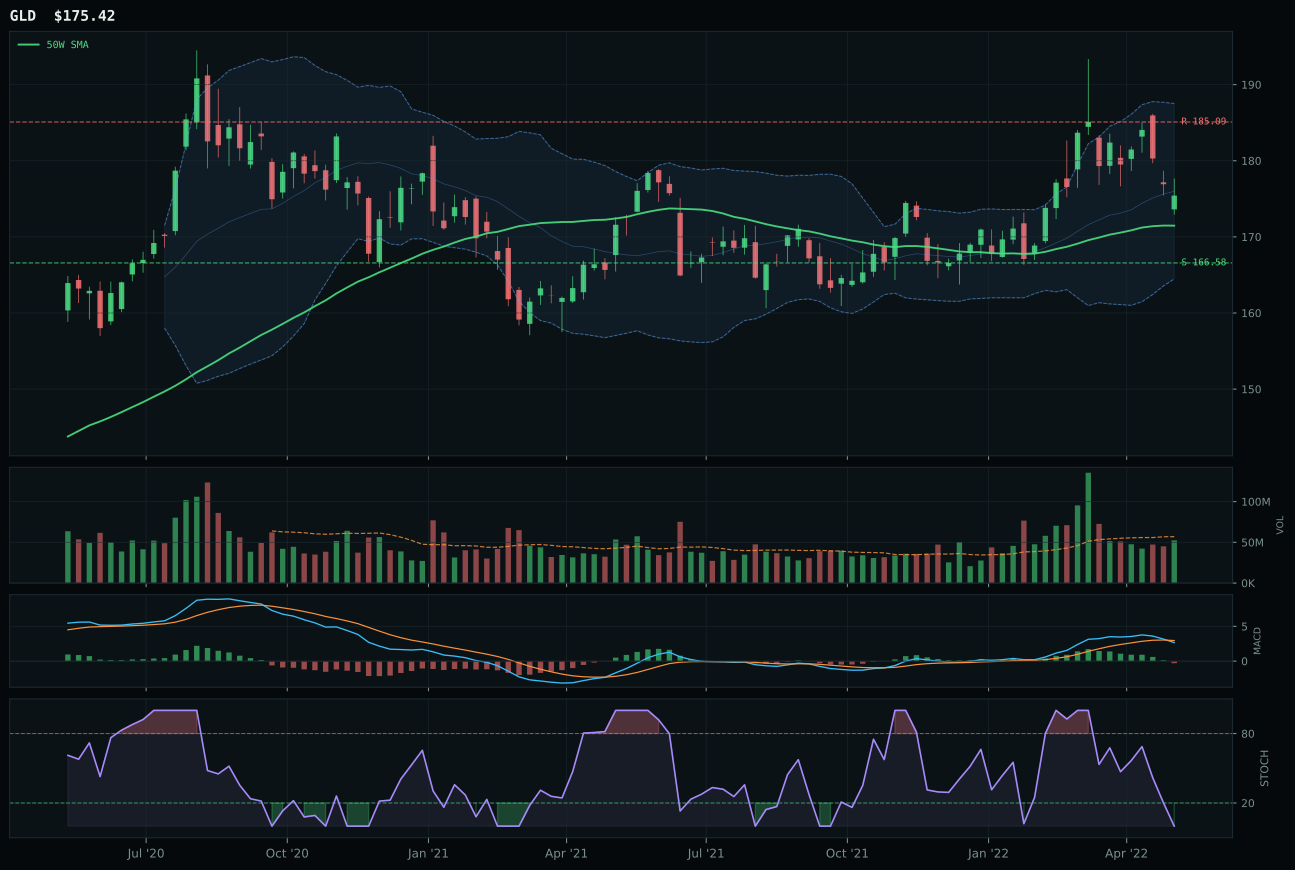
GLD has a compression near 50W profile with 12.2% 13-week relative strength versus SPY.
A failed hold above support would weaken the setup.
Actionable but governed by invalidation levels.
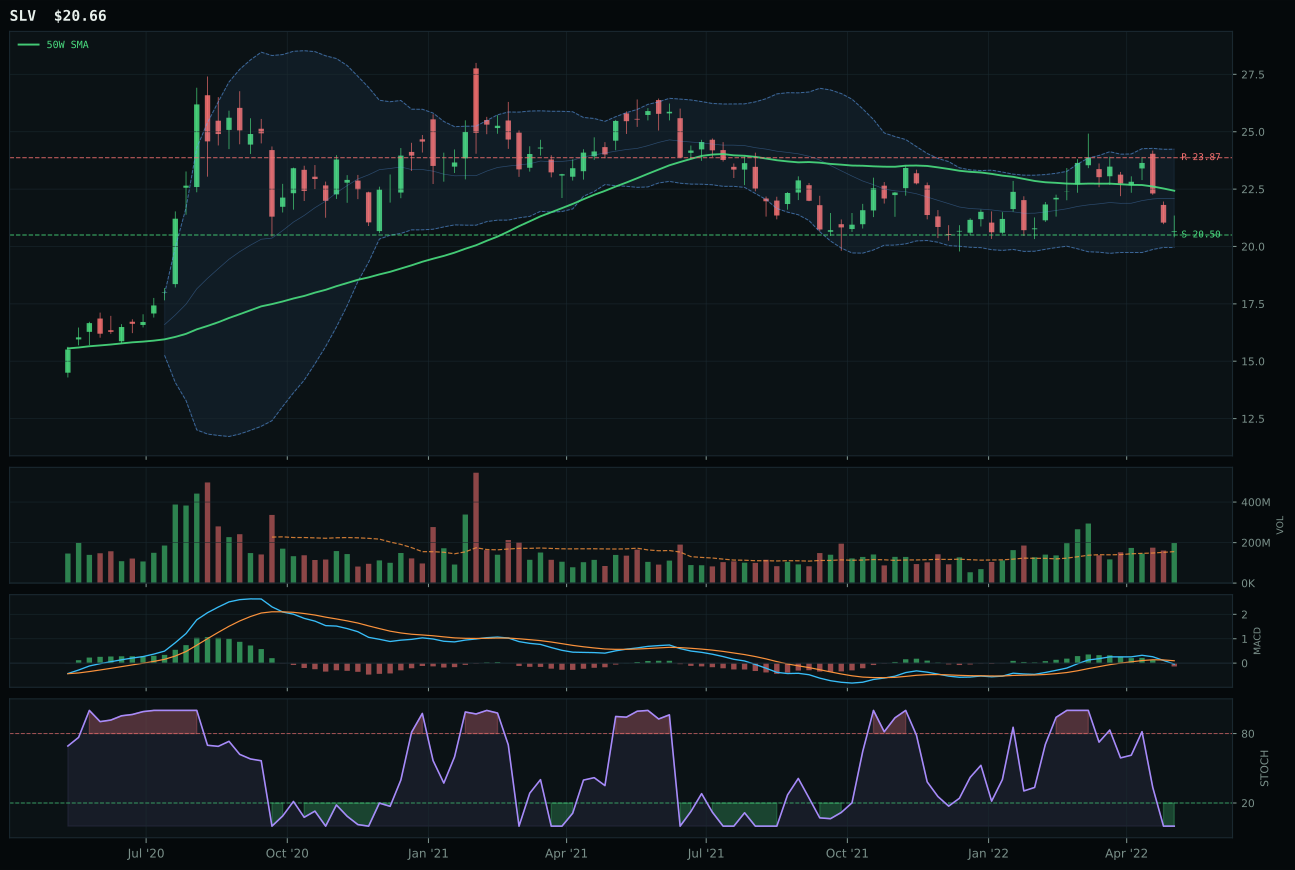
SLV has a pullback into support profile with 7.7% 13-week relative strength versus SPY.
A failed hold above support would weaken the setup.
Actionable but governed by invalidation levels.
GLD wins a tight race over GDX by claiming the superior risk/reward score of 70.7 versus 55.3, reflecting better defined entry mechanics at just 2.3% from the 50-week in the Fibonacci 0.500 middle-retracement zone. The 100.0 timing score matches GDX's, but GLD's neutral volume (0.92x) and MACD bearish/weakening avoid the false confidence that GDX's above-average participation might signal. Structure scores are virtually tied (GLD 72.5 vs GDX 72.3), making the risk/reward delta the decision factor: GDX trades with 21.0% relative strength but offers only 55.3% downside-to-support ratio, while GLD's 12.2% relative strength pairs with 5.3% support cushion below—more durable for position holding. The 2.4-point margin is tight because both setups are legitimate; GLD simply offers cleaner defensive positioning.
Precious Metals earned 5% because its 55.8 category score ranks sixth, below top-2 categories and below Defense & Aerospace (46.6), despite stronger macro fit of 72.0 versus 68.0 for Defense. Monetary hedge bid is the strongest descriptor active (+14 at category level), and defensive rotation (+7) reinforces precious metals as fear insurance. However, dollar pressure (+3) and the fact that GLD has only 3.9% 13-week return—versus 20.3% for XLE and 49.1% for WEAT—means this category is working more as a diversifier than a return generator. Gold's typical negative correlation to equities is breaking down in this regime; it is not crashing, but it is not leading either. The allocation reflects insurance value and macro hedge positioning rather than momentum. Increase to 10% if the dollar index breaks below 100 or if real yields turn decisively negative.
Industrial Metals — COPX
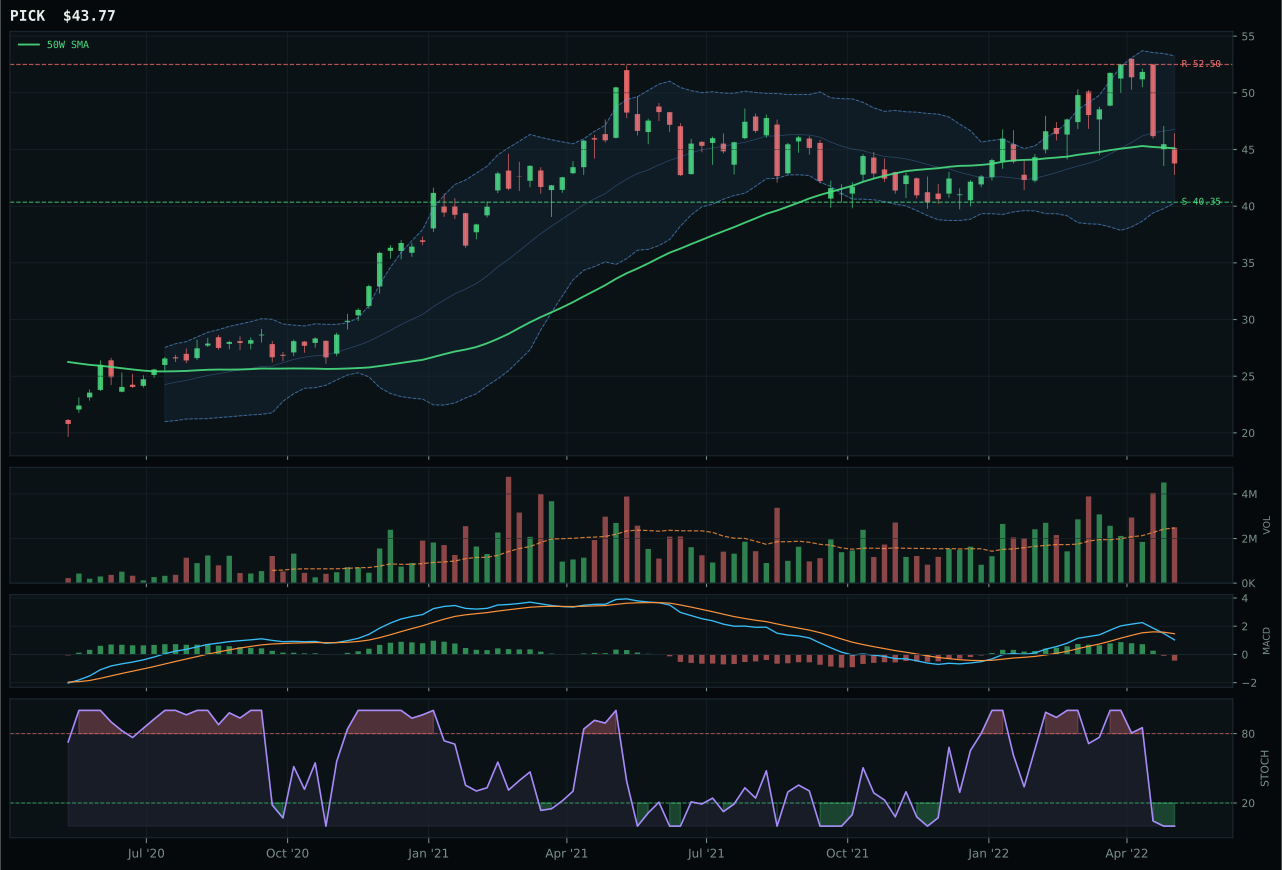
PICK has a compression near 50W profile with 7.1% 13-week relative strength versus SPY.
A failed hold above support would weaken the setup.
Actionable but governed by invalidation levels.
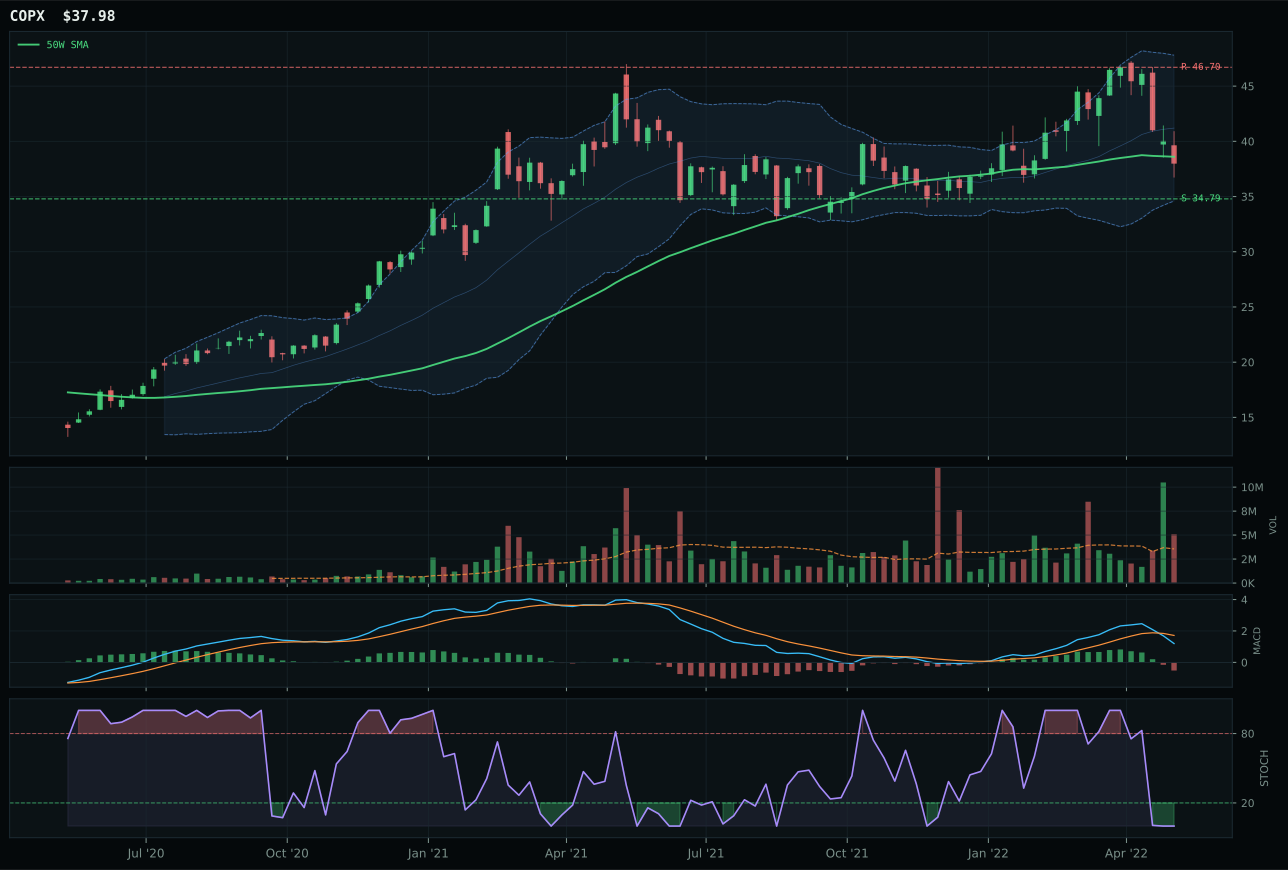
COPX has a compression near 50W profile with 7.6% 13-week relative strength versus SPY.
A failed hold above support would weaken the setup.
Actionable but governed by invalidation levels.
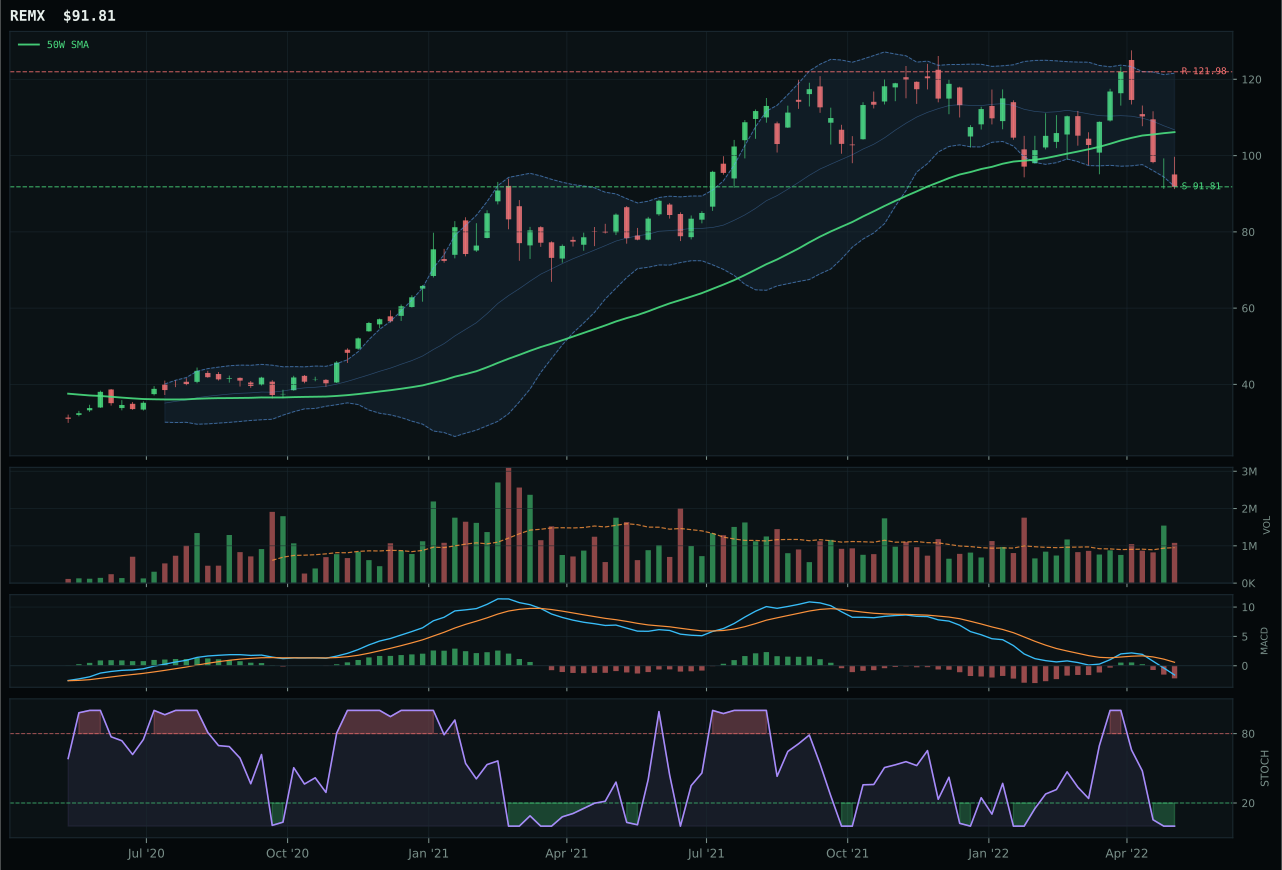
REMX has a pullback into support profile with -1.1% 13-week relative strength versus SPY.
A failed hold above support would weaken the setup.
Actionable but governed by invalidation levels.
COPX wins by the narrowest margin of the week—just 0.8 points over PICK—because it alone combines compression-near-50W setup with above-average volume participation at 1.43x. The timing score of 100.0 is earned by sitting 1.6% below the 50-week in the deep-retracement Fibonacci 0.618 value zone, exactly where accumulation before breakout typically begins. PICK's neutral volume at the same tight price levels tells a different story: less institutional commitment, more retail capitulation. Relative strength differentiates them marginally (COPX 0.5% vs PICK 0.0% category-relative), but volume confirmation is the tiebreaker. Both offer identical upside penalties to 46.70/52.50 resistance, but COPX's above-average buyer participation suggests institutions are using weakness to build, not distribute. Risk/reward mirrors (COPX 74.7 vs PICK 88.0), but structure wins the day.
Industrial Metals earned 5% with a 48.7 category score despite category-level macro fit of 73.0—a surprisingly strong 86.0-point score—because technical evidence is weak at 47.1 for the winner and macro support alone cannot carry capital allocation in a transition regime. Metals scarcity (+14) and commodity breadth positive (+10) are real structural forces, but both COPX and PICK show only flat-to-negative 13-week momentum, signaling the market is pricing scarcity into near-term weakness already. Real asset sponsorship (+6) helps, but -7 from dollar pressure is material drag. This is core holding allocation, not expansion capital. The thesis is that copper demand from energy transition and infrastructure spending will eventually overcome near-term demand destruction, but entry timing remains off. Hold at 5% and commit new capital only on a break above resistance at 46.70 with volume confirmation.
Defense & Aerospace — ITA
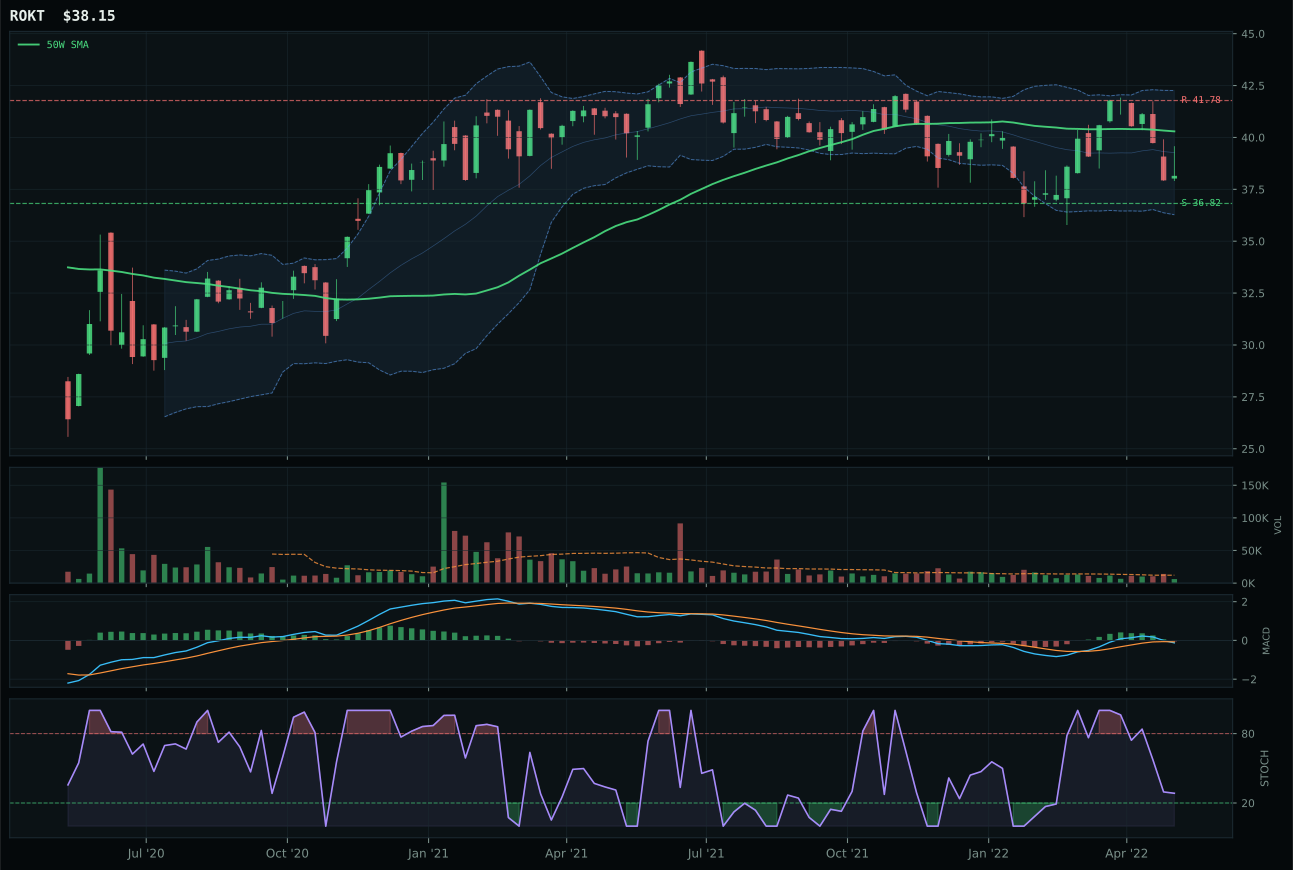
ROKT has a pullback into support profile with 11.1% 13-week relative strength versus SPY.
A failed hold above support would weaken the setup.
Tracked, but not top-2 eligible because: .
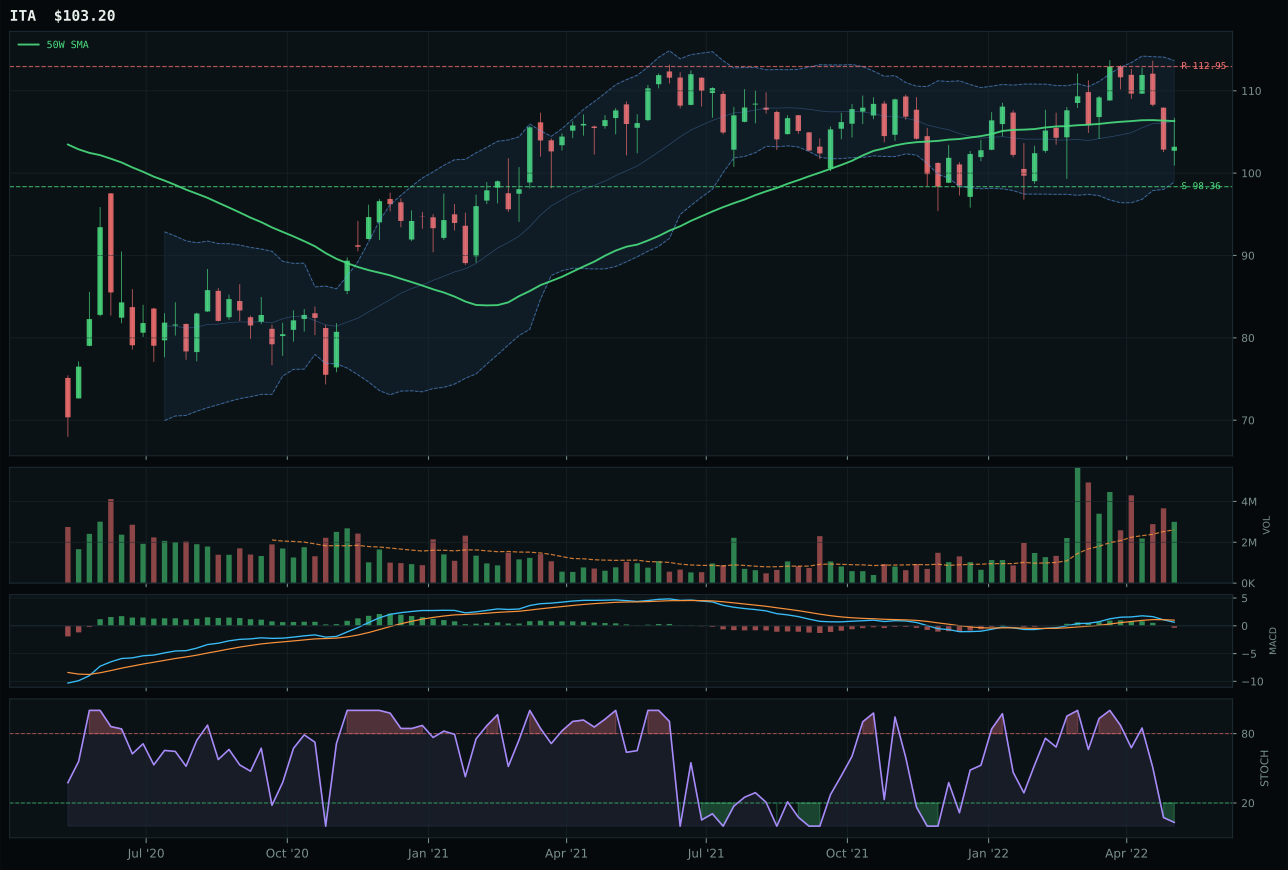
ITA has a pullback into support profile with 9.1% 13-week relative strength versus SPY.
A failed hold above support would weaken the setup.
Actionable but governed by invalidation levels.
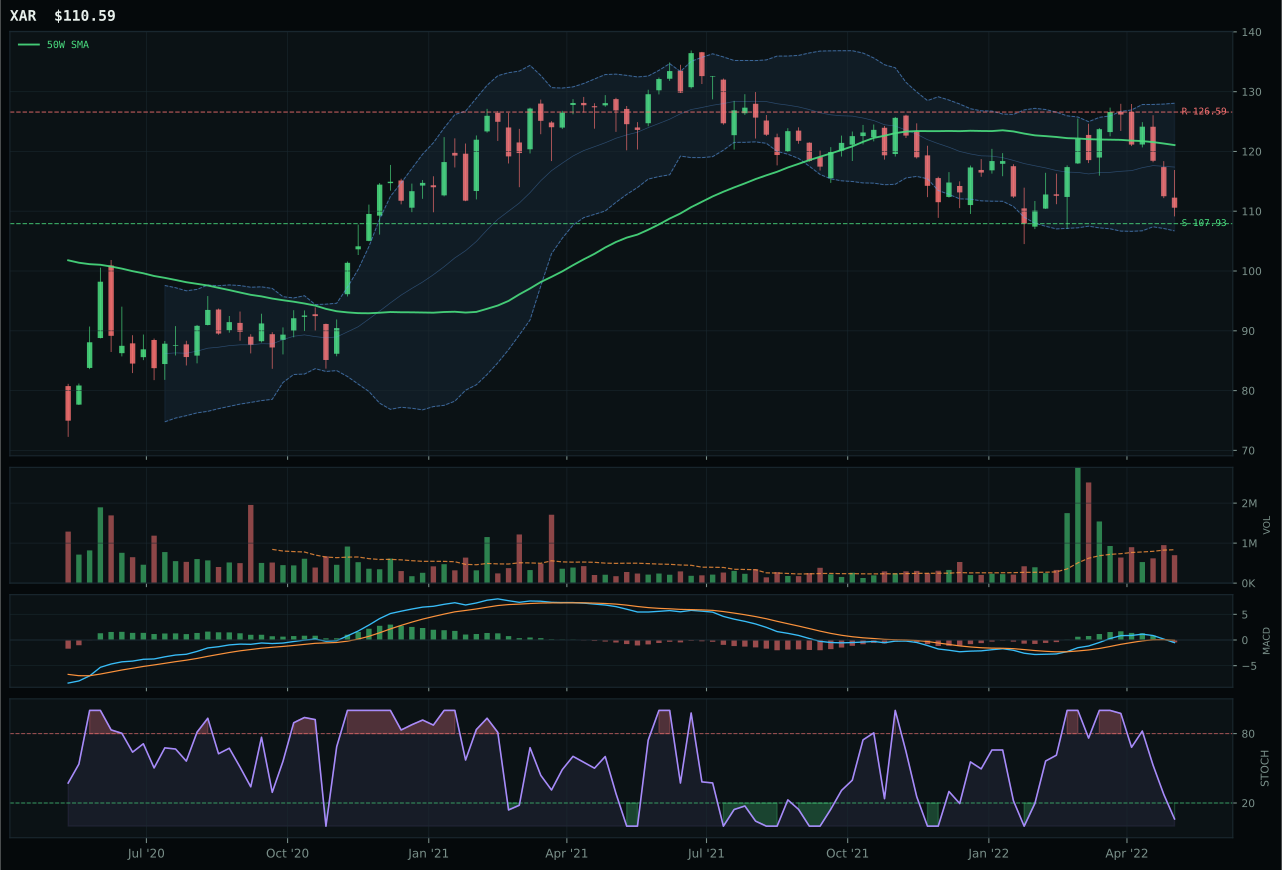
XAR has a pullback into support profile with 8.8% 13-week relative strength versus SPY.
A failed hold above support would weaken the setup.
Actionable but governed by invalidation levels.
ITA wins cleanly on the perfect timing score of 100.0, earned by sitting just 2.9% below the 50-week moving average in the Fibonacci 0.618 middle-retracement zone—a textbook decision point. Relative strength versus SPY at 9.1% demonstrates category leadership, and the above-average volume participation (1.15x) confirms accumulation rather than capitulation bouncing. ROKT lost because its timing score languished at 80.0 despite slightly higher 13-week momentum at 2.8%; the runner-up's thin volume participation and looser Fibonacci placement in the deep-retracement value zone signaled distribution risk. ITA's structure score of 73.4 exceeded ROKT's 69.7, reflecting cleaner price compression and more defined support at 98.36. The 38.9-point gap is decisive and reflects ITA's superior risk management.
Defense & Aerospace earned 5% despite a 46.6 category score and strong macro fit (68.0) because two higher-ranked categories demanded the top-2 allocation slots. Defensive rotation is actively bid (+8), broad market bear is +6, and dollar strength helps this defensive positioning (+3). The macro environment is genuinely supportive: institutional flows are rotating from growth into quality, durability, and crisis hedges. ITA's positive 13-week return of 0.8% while SPY cratered stands out in a field of red, marking genuine relative strength. However, the category's technical evidence remains only 46.7, limiting ceiling for capital commitment. Utilities & Infrastructure (62.9) and Precious Metals (55.8) outranked it for the remaining non-top-2 allocation. Hold this as a barbell anchor against tech exposure; increase to 10% if broad market fear continues to accelerate.
Nuclear Energy — URA
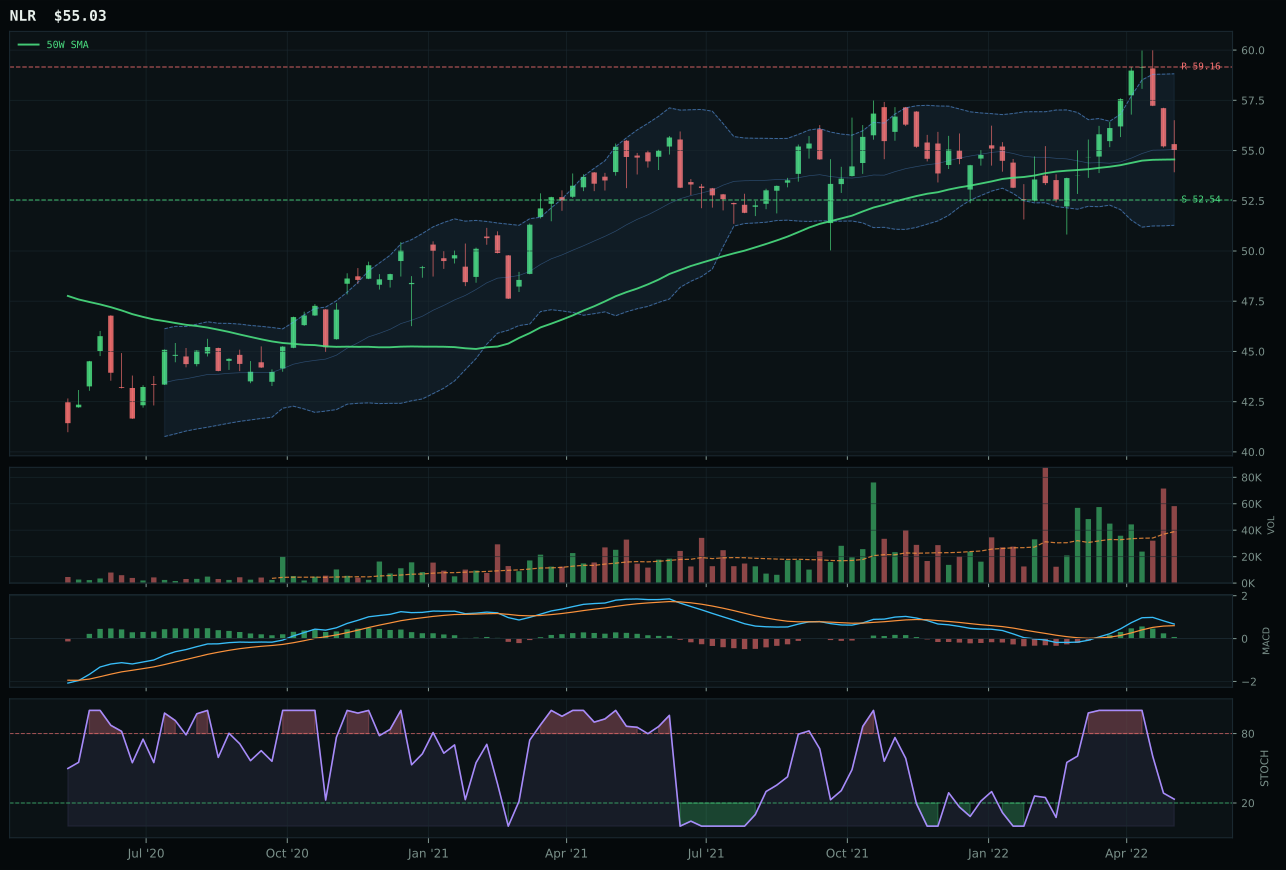
NLR has a pullback into support profile with 11.1% 13-week relative strength versus SPY.
A failed hold above support would weaken the setup.
Tracked, but not top-2 eligible because: .
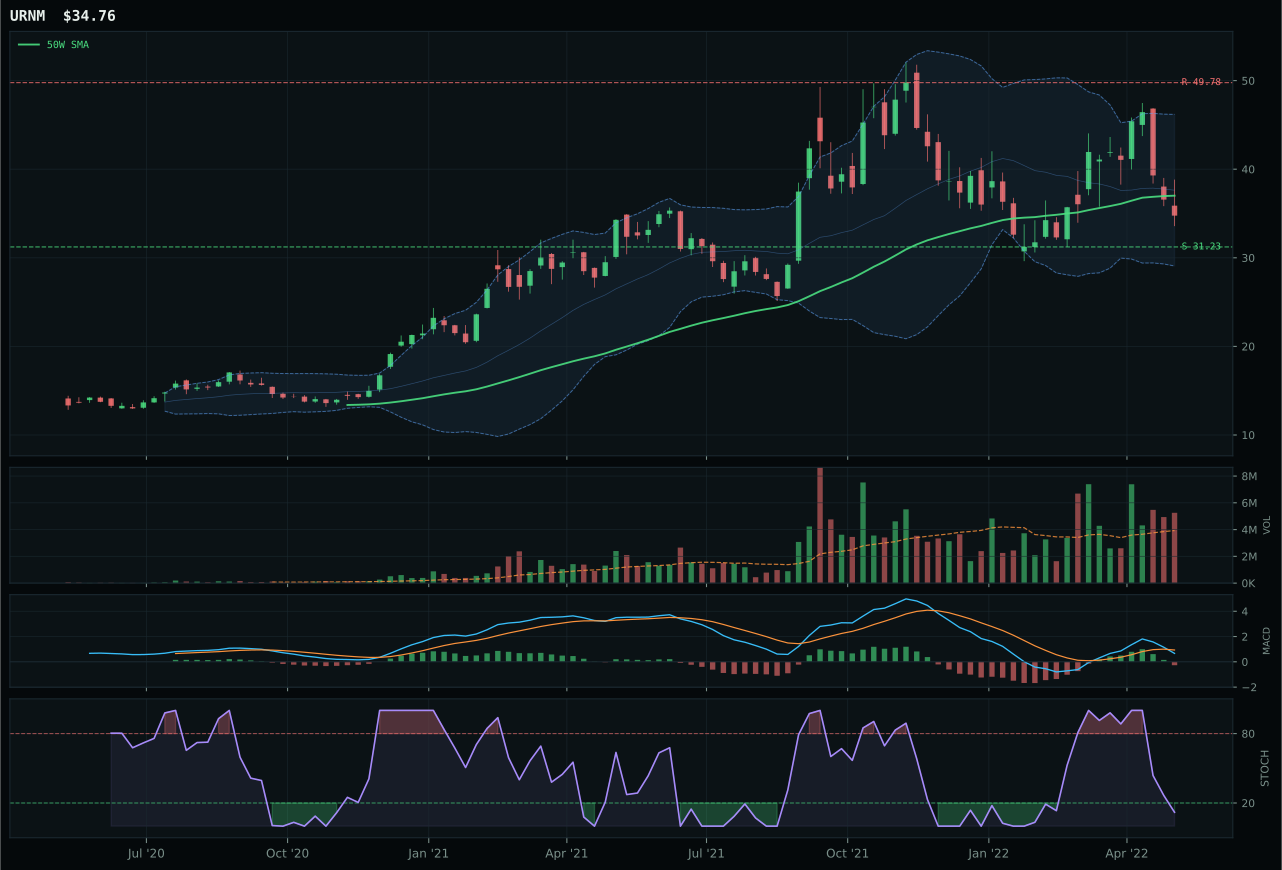
URNM has a neutral structure profile with 17.8% 13-week relative strength versus SPY.
A failed hold above support would weaken the setup.
Actionable but governed by invalidation levels.
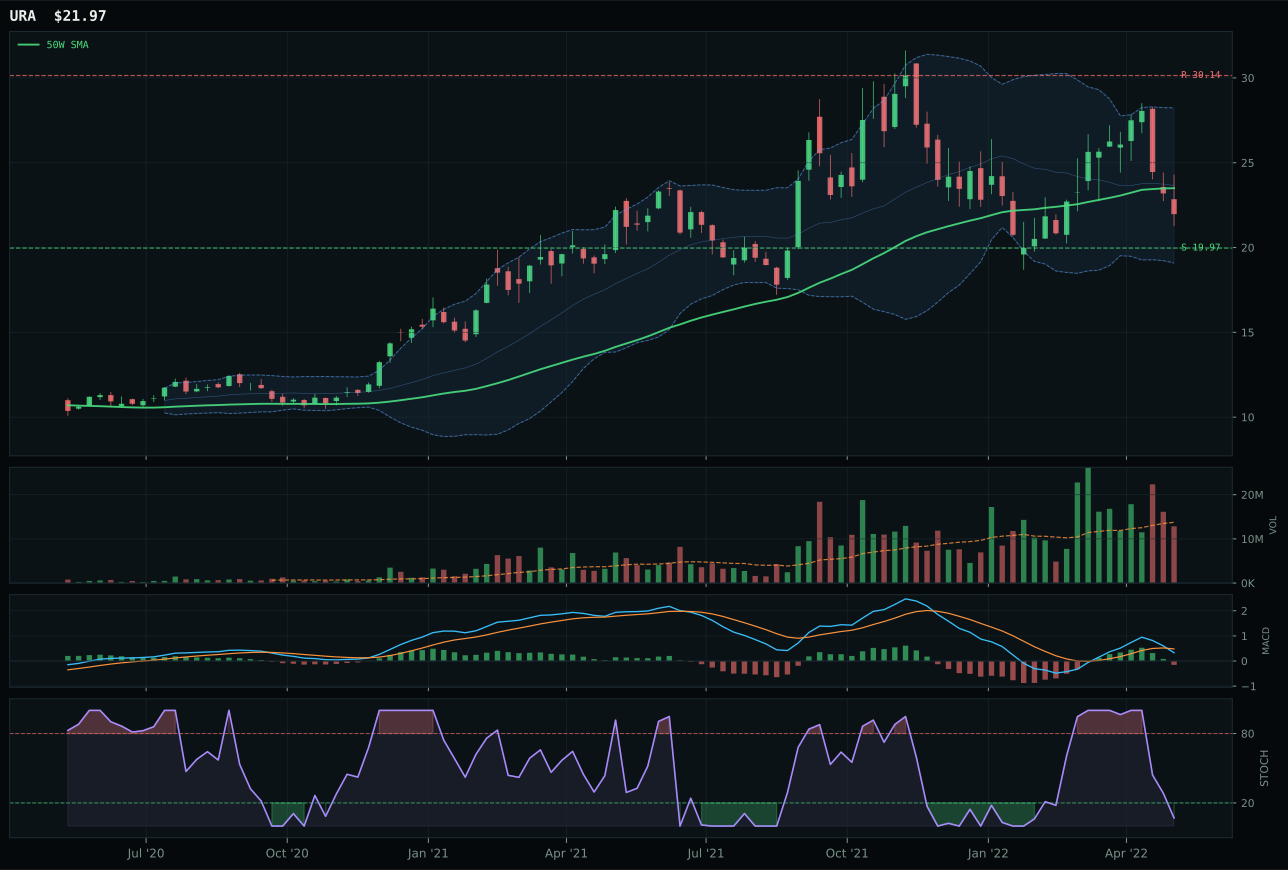
URA has a neutral structure profile with 15.4% 13-week relative strength versus SPY.
A failed hold above support would weaken the setup.
Actionable but governed by invalidation levels.
URA edges out a tight three-way race with a 42.3 category score by combining a 77.0 timing score with 77.0 trend score in a neutral structure setup, reflecting solid positioning 6.5% below the 50-week in the Fibonacci 0.618 deep-retracement value zone. NLR's superior 45.0 technical evidence and bullish-but-flattening MACD lost because its pullback-into-support setup is less defined and stochastic RSI is falling/neutral rather than oversold, reducing the reversal probability weighting. Category-relative strength at 0.0% for URA versus -4.4% for NLR tilts toward URA despite the runner-up's above-average volume participation. The reasoning layer places URA only third in the three-ETF basket (43.7 score) behind NLR (45.0), but the representative reasoning layer selects it as the ETF to hold because macro fit is neutral and technical setup wins ties.
Nuclear Energy earned 5% with a 42.3 category score, placing it sixth overall and making it a core diversifier rather than a return driver. Macro fit is 65.0 with energy scarcity support (+9) and real asset sponsorship (+7), but these are offset by risk-appetite collapse mechanics that normally penalize leverage plays. URA's 7.1% 13-week return is not impressive, and the -20.1% 4-week return shows recent weakness; this is not an inflection point setup. Technical evidence is only 37.5 for URA, well below the portfolio average. However, the allocation reflects a nuanced thesis: if energy prices remain structurally elevated and inflation persistence forces central banks to pause rate hikes despite recession fears, nuclear becomes a play on energy security with lower cyclicality than coal or traditional hydrocarbons. This is barbell positioning—defensive allocation to a non-consensus energy source. Increase to 10% only if uranium prices stabilize above $45/pound and utilities begin reactor restart announcements.
Technology — XLK
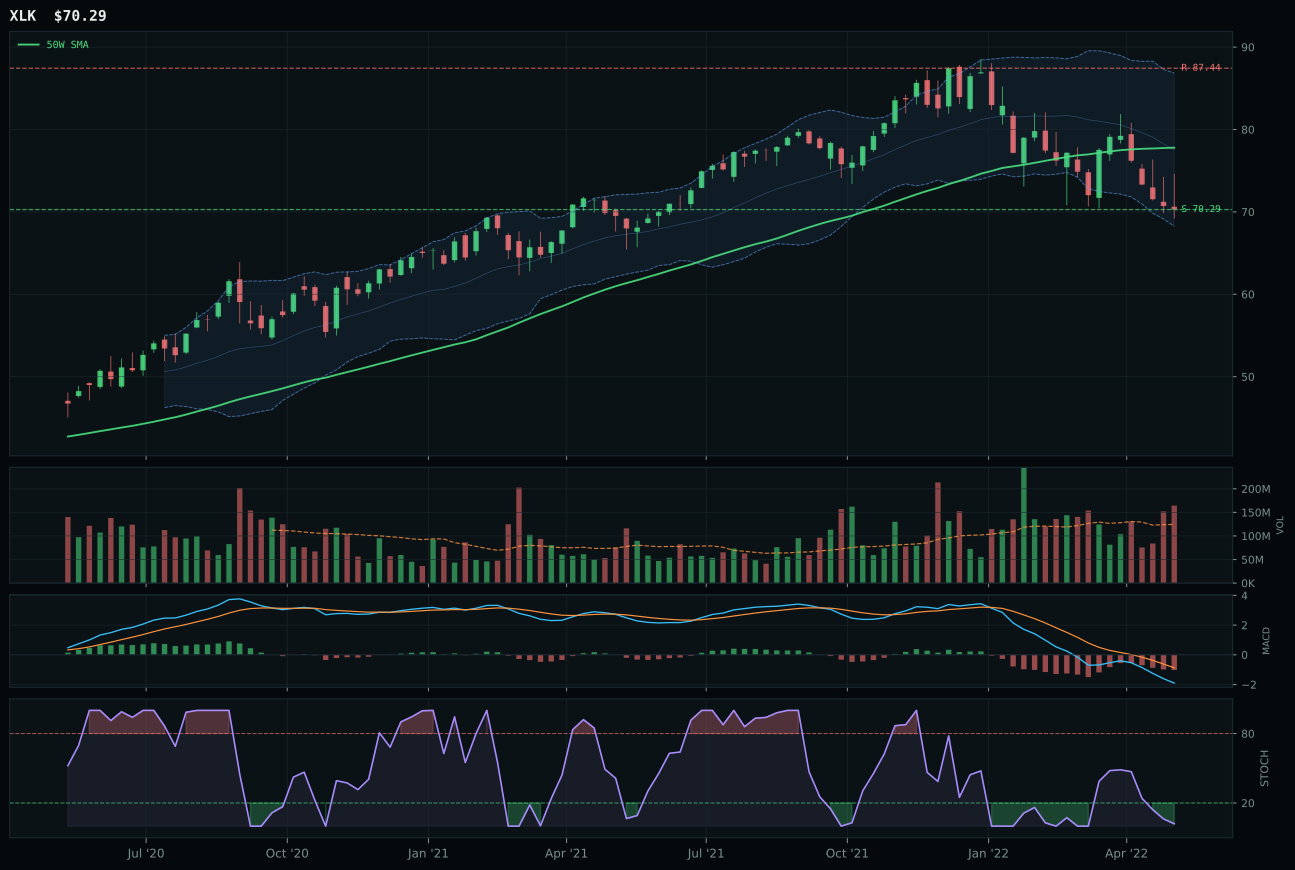
XLK has a pullback into support profile with -3.6% 13-week relative strength versus SPY.
A failed hold above support would weaken the setup.
Actionable but governed by invalidation levels.
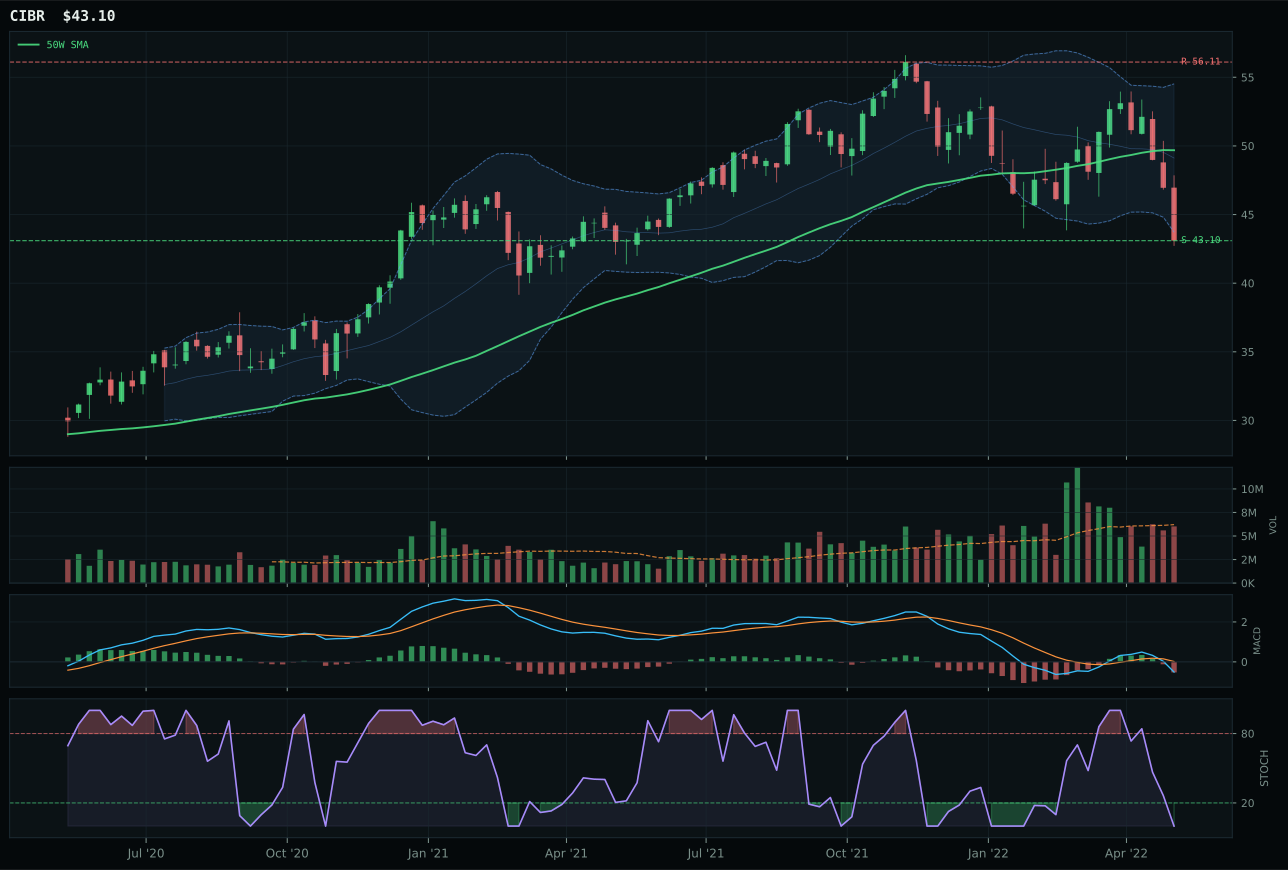
CIBR has a pullback into support profile with -1.0% 13-week relative strength versus SPY.
A failed hold above support would weaken the setup.
Actionable but governed by invalidation levels.
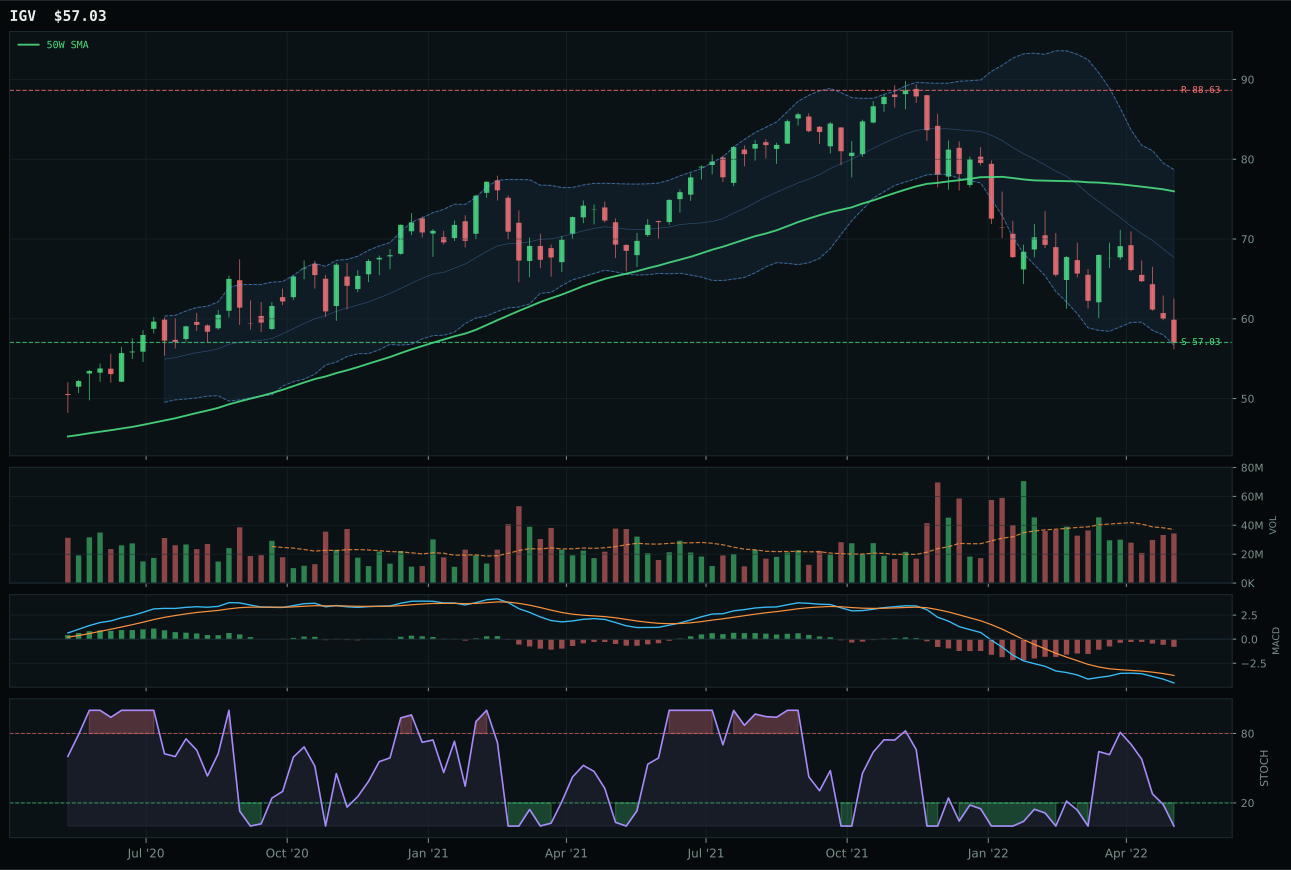
IGV has a pullback into support profile with -10.4% 13-week relative strength versus SPY.
A failed hold above support would weaken the setup.
Actionable but governed by invalidation levels.
XLK wins the category on the strength of a pullback-into-support setup with defined risk and above-average participation at 1.32x the 20-week average. The 80.0 timing score reflects optimal positioning—down 9.7% from the 50-week moving average, MACD bearish/weakening, and stochastic RSI deeply oversold at 0.02—all hallmarks of a coiled trade rather than capitulation. CIBR's 60.0 timing score and neutral volume participation concede the edge despite similar structure; XLK's category-relative strength of 0.0% still outmatches CIBR's technical evidence, which scored 29.6 versus XLK's 33.4. This is a clean reset trade in a sector that has been indiscriminately beaten down, not a recovery narrative.
Technology earned just 5% because macro conditions remain hostile to duration and growth: liquidity expansion provides only modest tailwind (+9), while inflation pressure and dollar strength drag (-4 combined). At 38.0 category score, Technology ranks seventh among ten categories—above only Emerging Markets—because the current regime punishes stretched valuations and compressed margins. The setup quality matters less when the directional environment is uncertain; even with XLK pulling into a textbook support zone, the reward asymmetry stays compressed at 19.6% to resistance versus unlimited downside if broad market weakness persists. Hold this position only as a hedged tactical nibble, not as conviction. If inflation data rolls over and liquidity conditions visibly improve, this category could re-rate higher.
AI — SMH
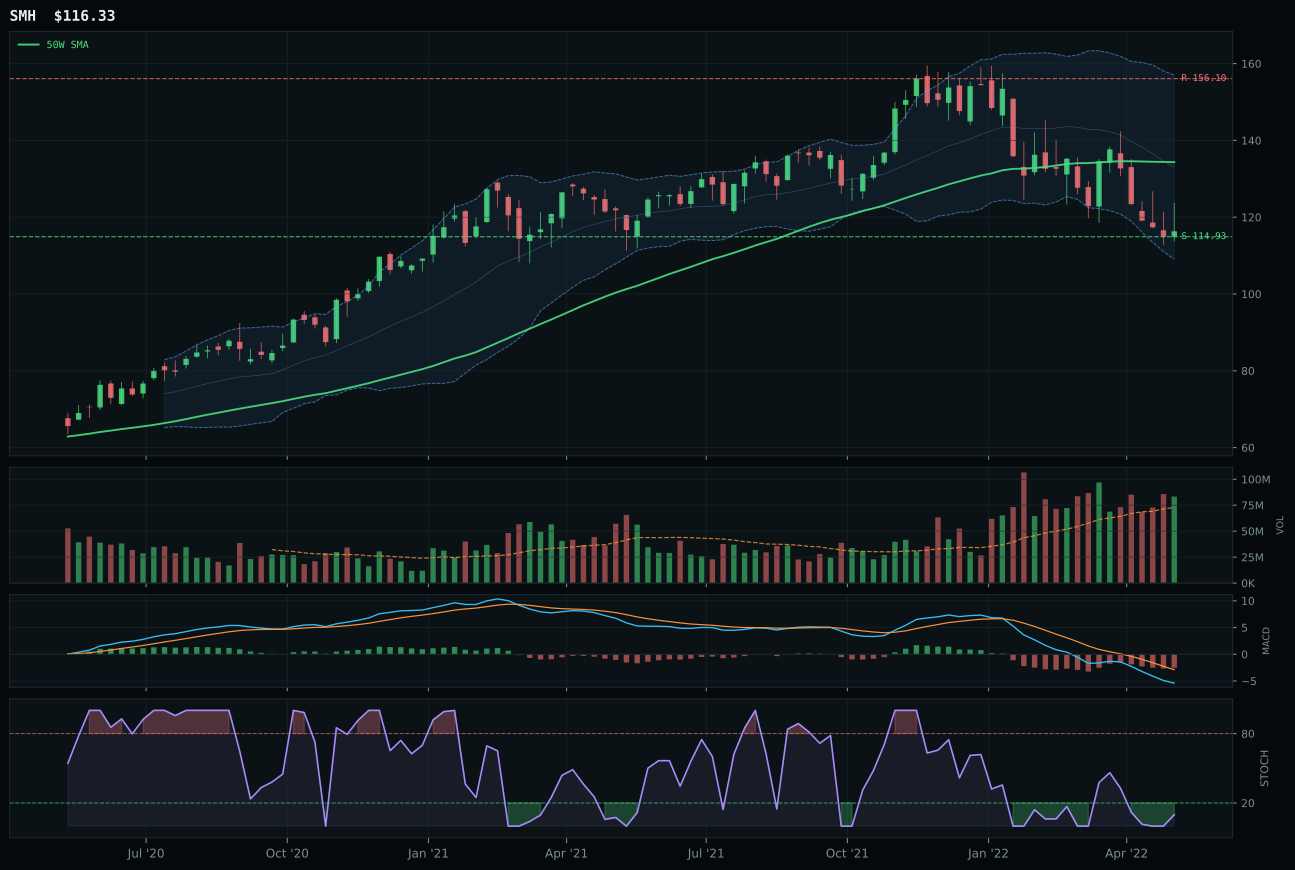
SMH has a pullback into support profile with -6.3% 13-week relative strength versus SPY.
A failed hold above support would weaken the setup.
Actionable but governed by invalidation levels.
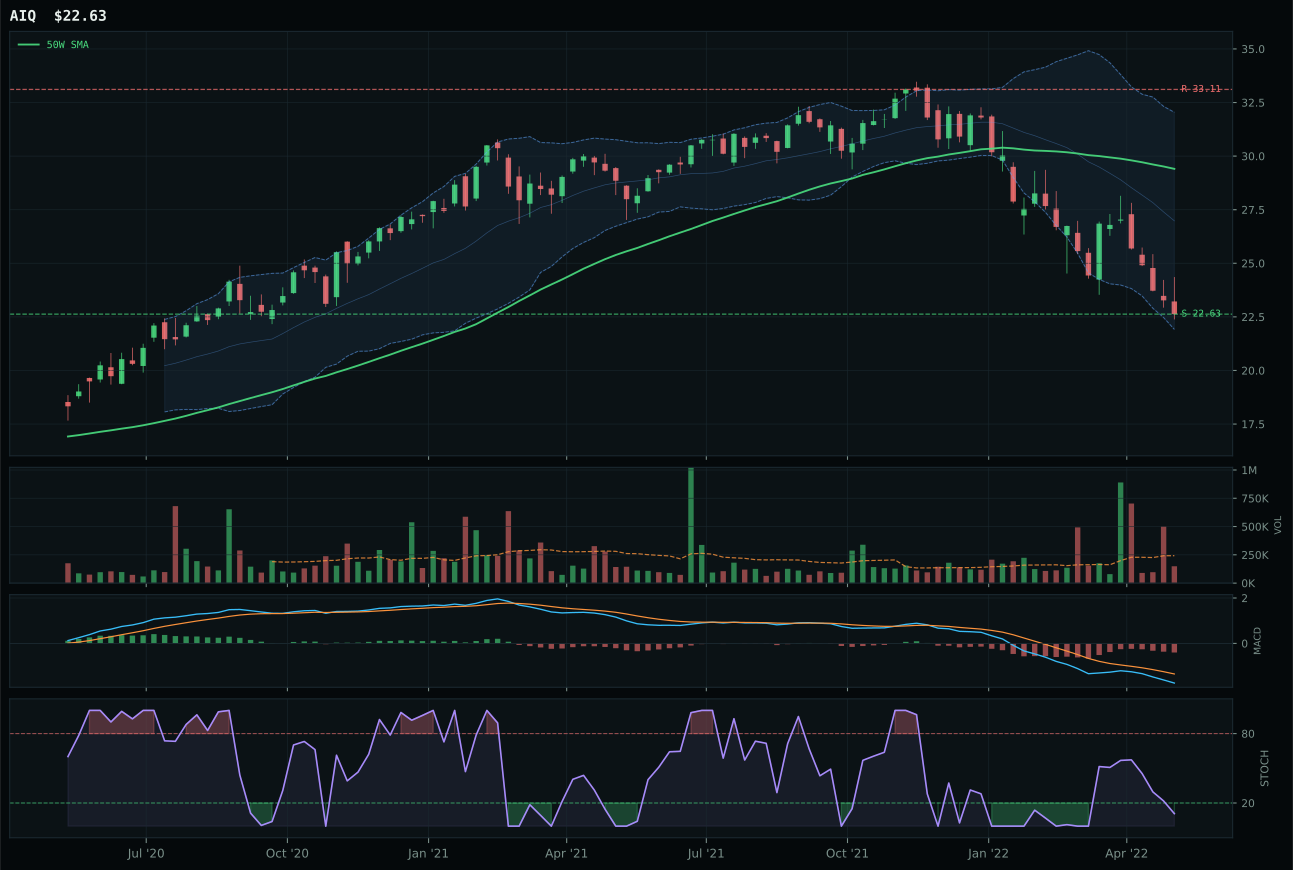
AIQ has a pullback into support profile with -11.6% 13-week relative strength versus SPY.
A failed hold above support would weaken the setup.
Tracked, but not top-2 eligible because: .
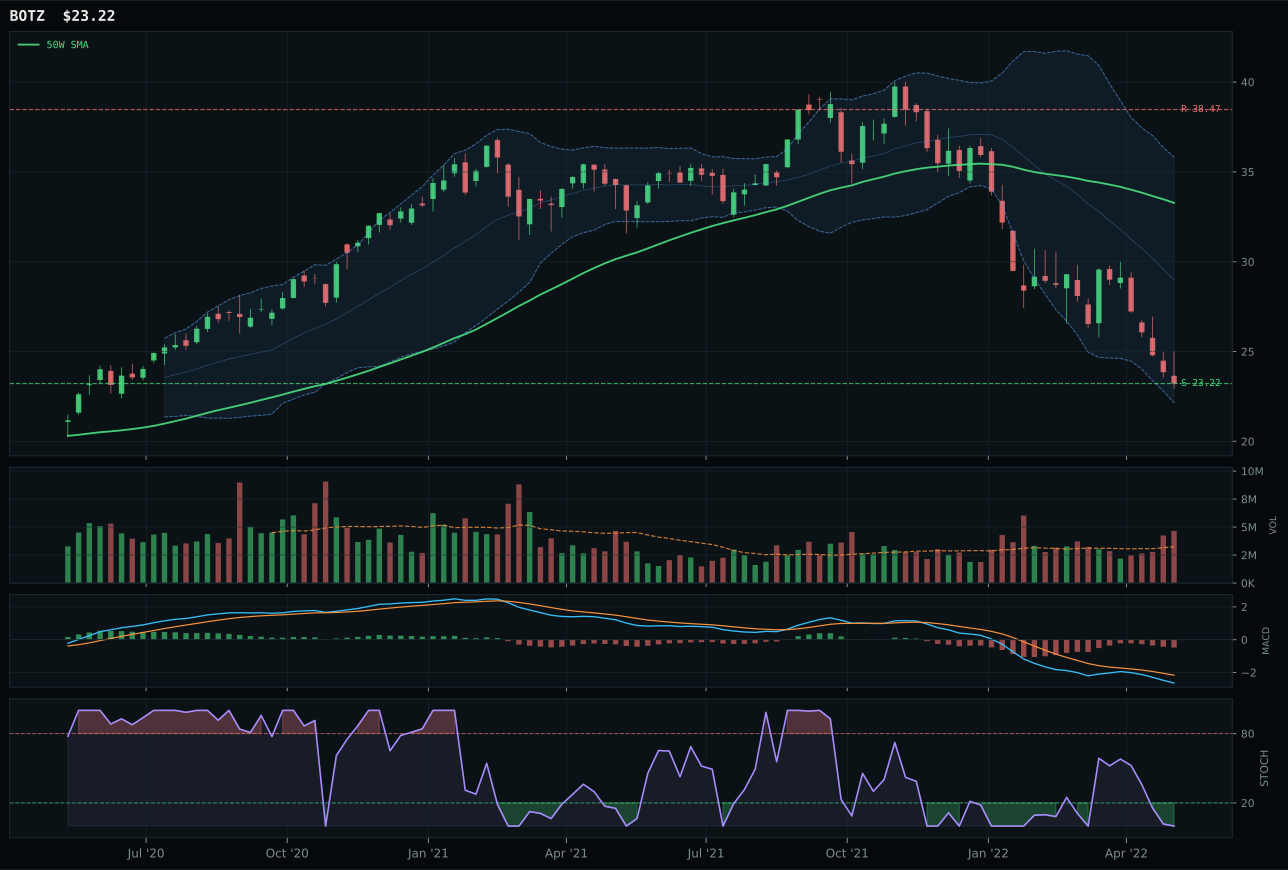
BOTZ has a pullback into support profile with -12.0% 13-week relative strength versus SPY.
A failed hold above support would weaken the setup.
Actionable but governed by invalidation levels.
SMH captures the AI category by combining category-relative strength of 5.3% with a stochastic RSI that is oversold and turning up at 0.10, signaling potential reversal mechanics. The 74.0 timing score benefits from the 13.4% pullback to the 50-week, Fibonacci location at the 0.786 repair zone near 121.68, and above-average volume (1.14x) that distinguishes it from AIQ's thin participation. Technical evidence came in at 29.6, a low bar, but SMH edged AIQ (20.4) by demonstrating the first sign of momentum inflection; AIQ's 19.9% 13-week loss with -11.6% relative strength told a story of momentum collapse, not bottoming. The gap of 32.9 points versus AIQ masks a category in deep distress: no ETF in this basket scored above 35.2 on the reasoned proof order.
AI receives 0% allocation and ranks ninth or tenth among the ten categories with a 30.2 score, excluded entirely this week. The category's 48.0 macro fit is weak—liquidity expansion barely offsets broad market bear and dollar pressure headwinds—and SMH's technical score of 29.6 signals that even the category winner lacks conviction. A -6.3% 13-week return against SPY alongside price at -13.4% from the 50W means the category is fighting both macro and micro currents simultaneously. The stochastic oversold turn-up in SMH is the sole green flag, but it is insufficient to override the 30.2 category score sitting below half the field. For AI to earn 5%, either the broad market bear descriptor would need to flip or SMH would need to demonstrate volume confirmation above the 50W near 132.50 with MACD bullish turn.
Emerging Markets — IEMG
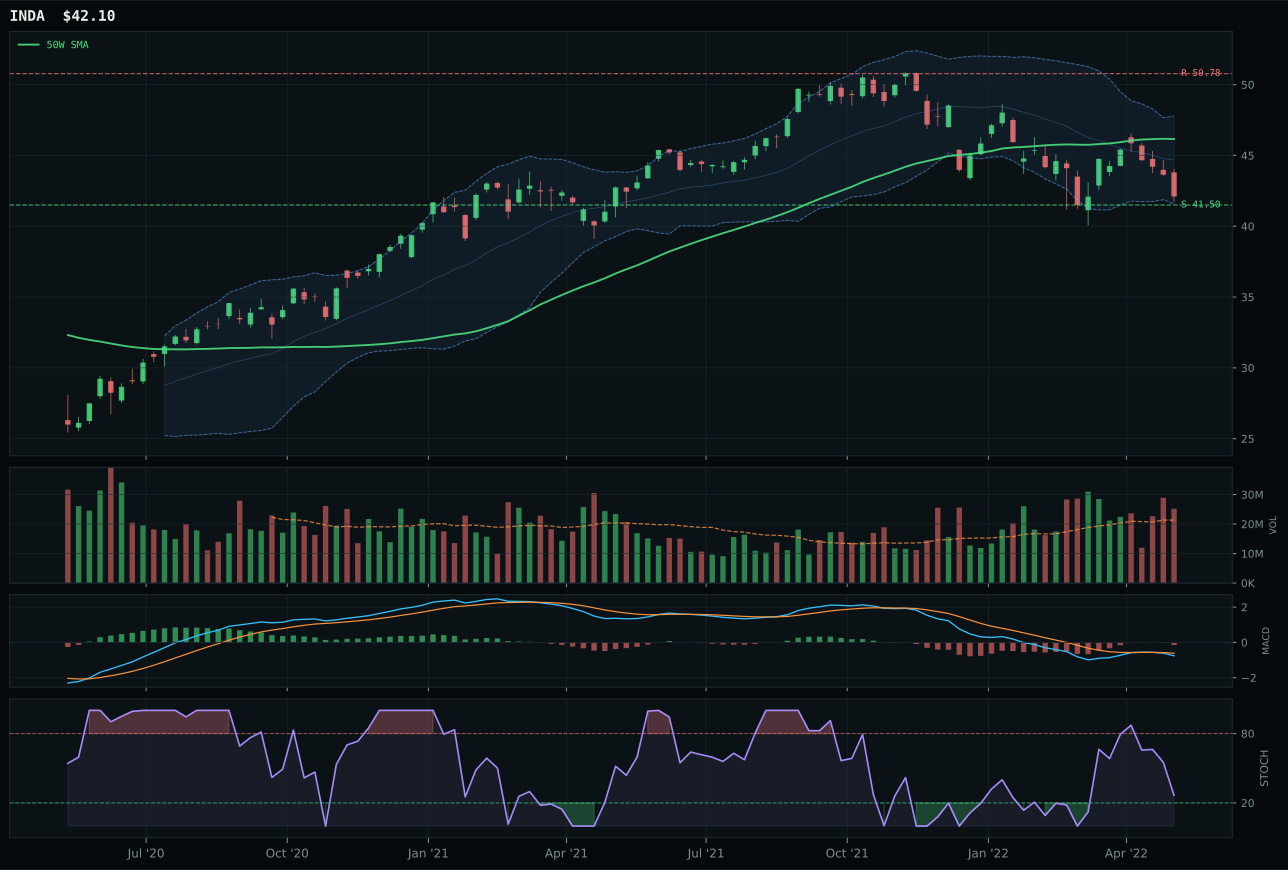
INDA has a pullback into support profile with 1.1% 13-week relative strength versus SPY.
A failed hold above support would weaken the setup.
Actionable but governed by invalidation levels.
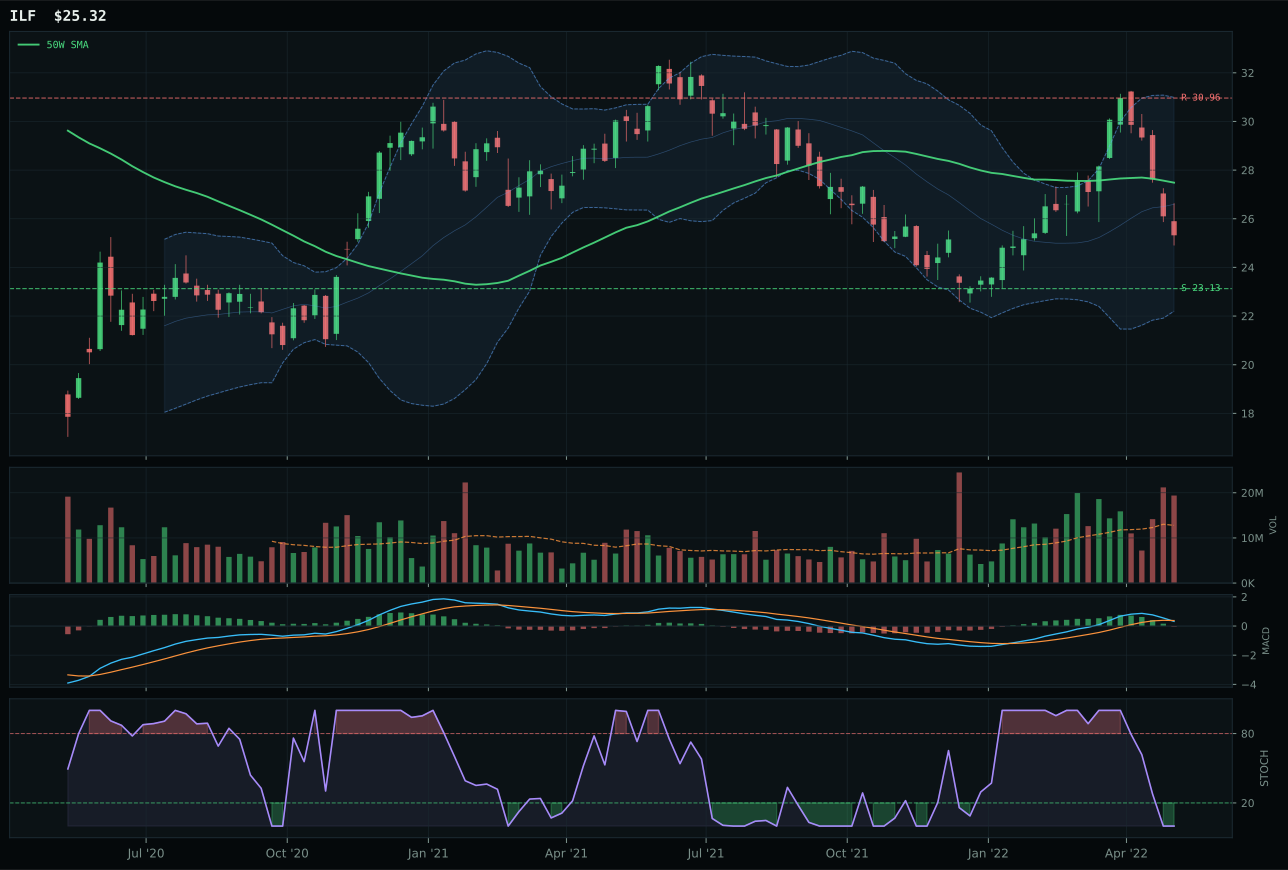
ILF has a neutral structure profile with 8.0% 13-week relative strength versus SPY.
Extension and support failure are the main tactical risks.
Tracked, but not top-2 eligible because: structurally broken.
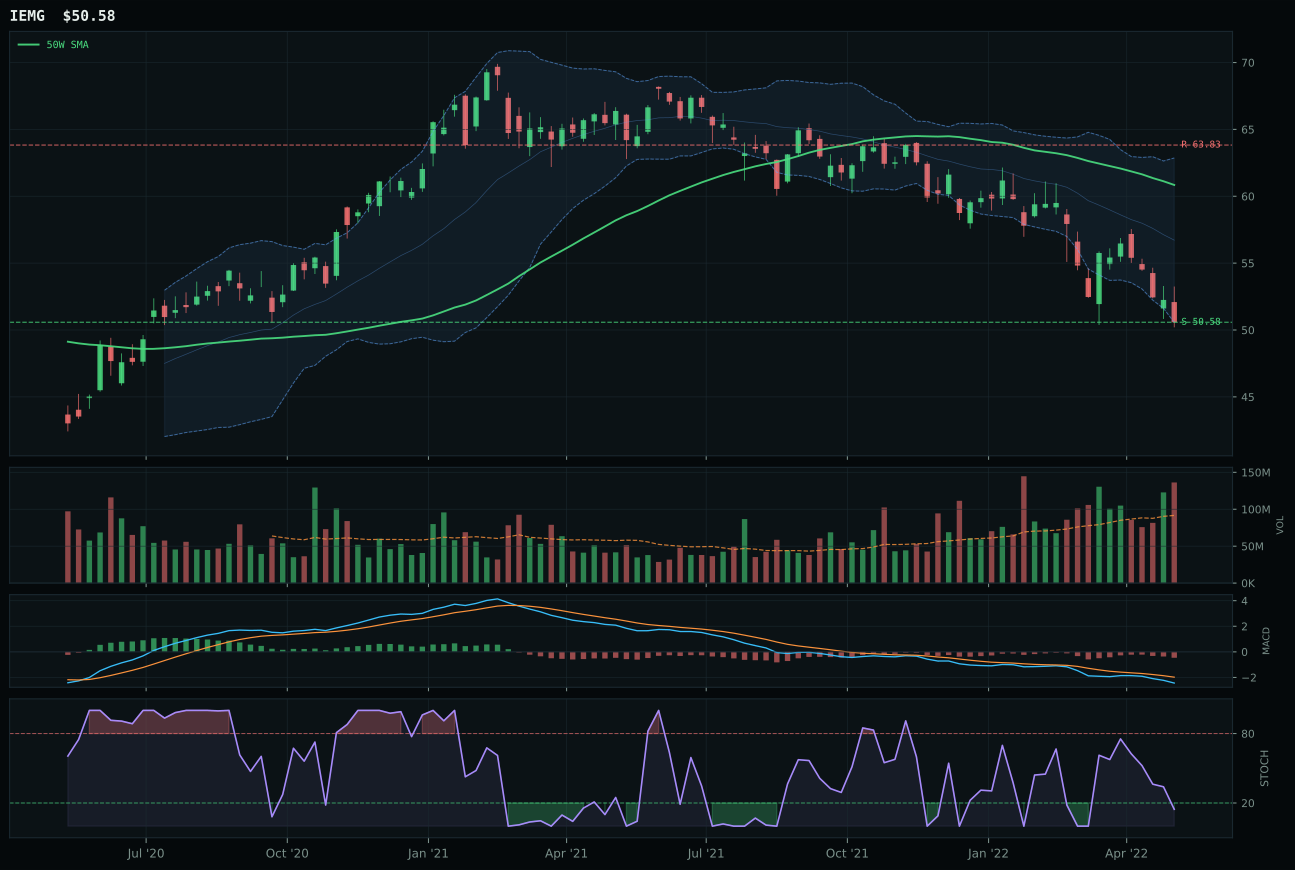
IEMG has a pullback into support profile with -6.5% 13-week relative strength versus SPY.
A failed hold above support would weaken the setup.
Actionable but governed by invalidation levels.
IEMG wins a category in absolute freefall with a 7.2 final score and 0.0 technical evidence—among the lowest in the portfolio—by virtue of above-average volume participation at 1.49x the 20-week average and a pullback-into-support setup at 50.58 support. This is not a win by strength but by comparative weakness: INDA's 36.5 technical evidence and -8.8% distance to the 50-week made it the runner-up choice despite superior structure. The volume-price confirmation and persistence scores are both 0.0 for IEMG, reflecting the market's complete rejection of momentum; 13-week return is -14.8% with -7.6% category-relative strength. Stochastic RSI oversold at 0.15 and MACD bearish/weakening confirm capitulation has occurred. This is a category where buying the extreme weakness makes sense only if macro shifts dramatically toward dollar weakness and risk appetite recovery.
Emerging Markets receives 0% allocation and ranks tenth (last) with a 7.2 category score and anemic 35.0 macro fit, dominated by -14 dollar pressure headwind and -9 broad market bear. IEMG's 0.0 technical evidence score reflects zero momentum confirmation and zero volume-price confirmation—this is a purely structural break with no accumulation signal. The -6.5% relative weakness versus SPY combined with price action below the 200W confirms that emerging market investors are rotating out, not accumulating at support. Neither timing (60.0) nor risk/reward (90.0) can overcome the fundamental rejection: liquidity expansion (+7) cannot offset the macro composite of dollar strength and global risk-off. For this category to earn 5%, the dollar pressure descriptor would need to flip positive—a requirement that seems impossible given current Fed policy expectations. IEMG at support near 50.58 might attract retail value hunters, but the system correctly recognizes this as a falling knife with no institutional sponsorship and macro headwinds that are likely to persist through the transition regime.