
2022-04-29
Informational purposes only. The content in this report, including allocations, analysis, and commentary, is provided solely for informational and educational purposes. It does not constitute financial advice, investment advice, trading advice, or any other type of advice. Past performance does not guarantee future results. Always conduct your own research and consult a qualified financial professional before making investment decisions.
XLE defensive overlay excluded: price is below its 8W SMA. Cause selector will use GLD or cash alternative.
GLD defensive overlay excluded: price is below its 8W SMA. Cause selector will use cash alternative.
Fast-crash circuit breaker triggered: SPY dropped more than 8% from its 4-week high this week. Defensive overlay activated immediately.
Macro risk engine requires the 50% Defensive overlay for this run; payload selected by cause: Transition Defense.
Weekly Allocation
| Ticker | Category | Weight | Role |
|---|---|---|---|
| SGOV | 20% | Overlay | |
| GLD | Precious Metals | 25% | Overlay |
| XLU | 15% | Overlay | |
| XLE | Traditional Energy | 10% | Top-2 (10%) |
| WEAT | Agriculture & Livestock | 5% | Tier-2 (5%) |
| IGF | Utilities & Infrastructure | 5% | Tier-2 (5%) |
| URNM | Nuclear Energy | 5% | Tier-2 (5%) |
| ITA | Defense & Aerospace | 5% | Tier-2 (5%) |
| COPX | Industrial Metals | 5% | Tier-2 (5%) |
| XLK | Technology | 5% | Tier-2 (5%) |
Trade Instructions — Monday Open
Sell the tranche from 2022-04-01 (completing its 4-week hold). Buy the new tranche. Instructions show net portfolio changes — same-asset positions cancel, weight changes show the delta.
| Action | Ticker | Instruction |
|---|---|---|
| SELL | XLE | Sell 25% of XLE position (reduce 40.00% → 30.00%) |
| SELL | XOP | Sell 33% of XOP position (reduce 7.50% → 5.00%) |
| SELL | REMX | Sell 50% of REMX position (reduce 2.50% → 1.25%) |
| SELL | XAR | Sell entire XAR position (1.25% of portfolio) |
| SELL | MOO | Sell 33% of MOO position (reduce 3.75% → 2.50%) |
| SELL | ILF | Sell entire ILF position (1.25% of portfolio) |
| BUY | GLD | Buy GLD — 21.43% of freed cash (adds 3.75% to portfolio) |
| BUY | XLU | Buy XLU — 21.43% of freed cash (adds 3.75% to portfolio) |
| BUY | ITA | Buy ITA — 7.14% of freed cash (adds 1.25% to portfolio) |
| BUY | COPX | Buy COPX — 7.14% of freed cash (adds 1.25% to portfolio) |
| BUY | SGOV | Buy SGOV — 28.57% of freed cash (adds 5.00% to portfolio) |
| BUY | WEAT | Buy WEAT — 7.14% of freed cash (adds 1.25% to portfolio) |
| BUY | XLK | Buy XLK — 7.14% of freed cash (adds 1.25% to portfolio) |
Current Portfolio After Trade
Combined holdings across all 4 active tranches. Each tranche is 25% of the portfolio.
| Ticker | % of Portfolio | Weight Bar |
|---|---|---|
| XLE | 30.00% | |
| GLD | 13.75% | |
| XLU | 11.25% | |
| SGOV | 10.00% | |
| XOP | 5.00% | |
| URNM | 5.00% | |
| ITA | 5.00% | |
| CIBR | 3.75% | |
| COPX | 3.75% | |
| MOO | 2.50% | |
| VEGI | 2.50% | |
| WEAT | 2.50% | |
| REMX | 1.25% | |
| SLV | 1.25% | |
| IGF | 1.25% | |
| XLK | 1.25% |
Macro Regime — Transition / Mixed
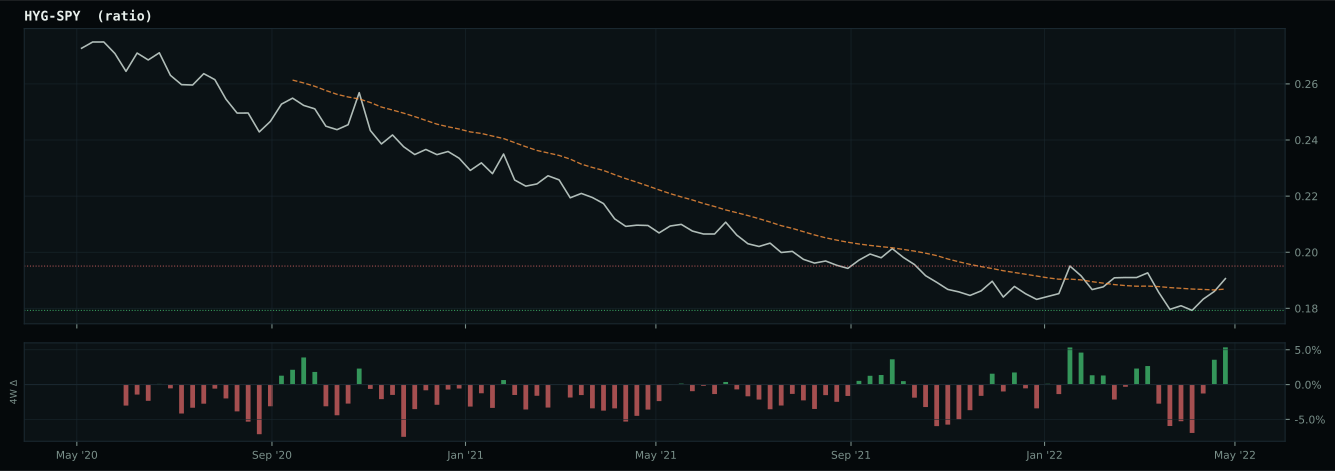
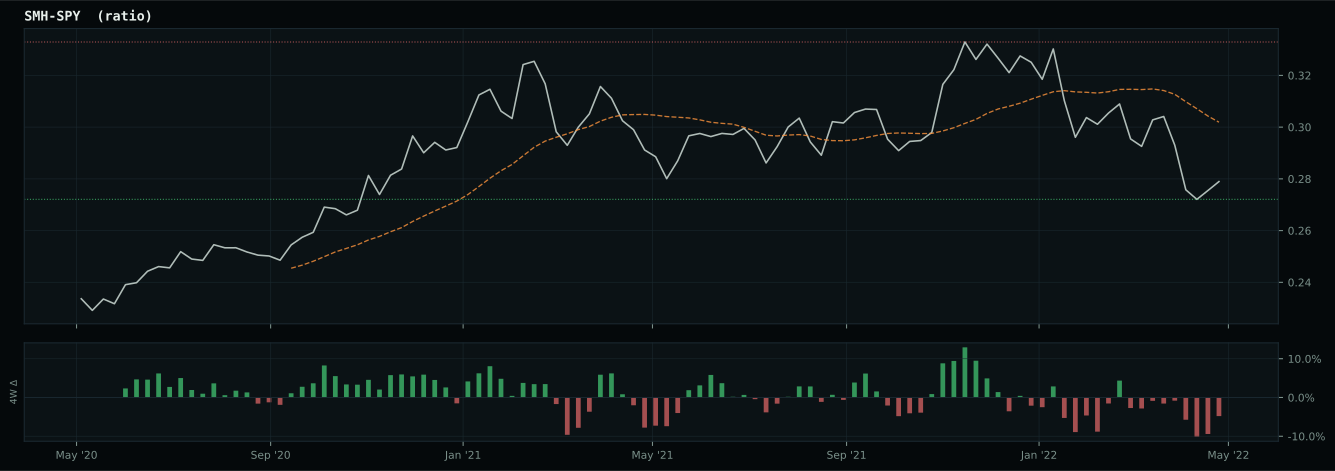
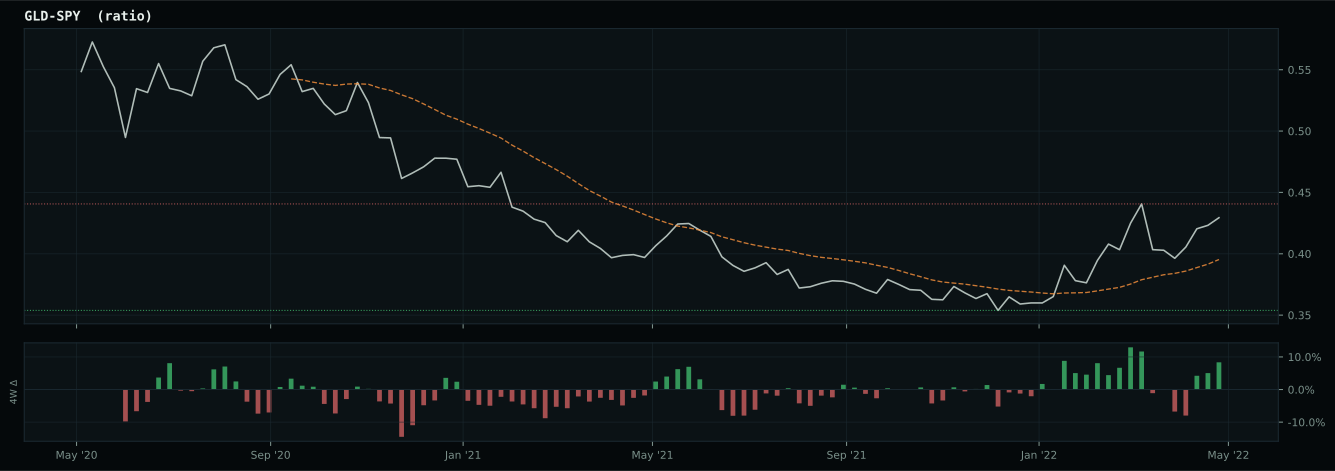
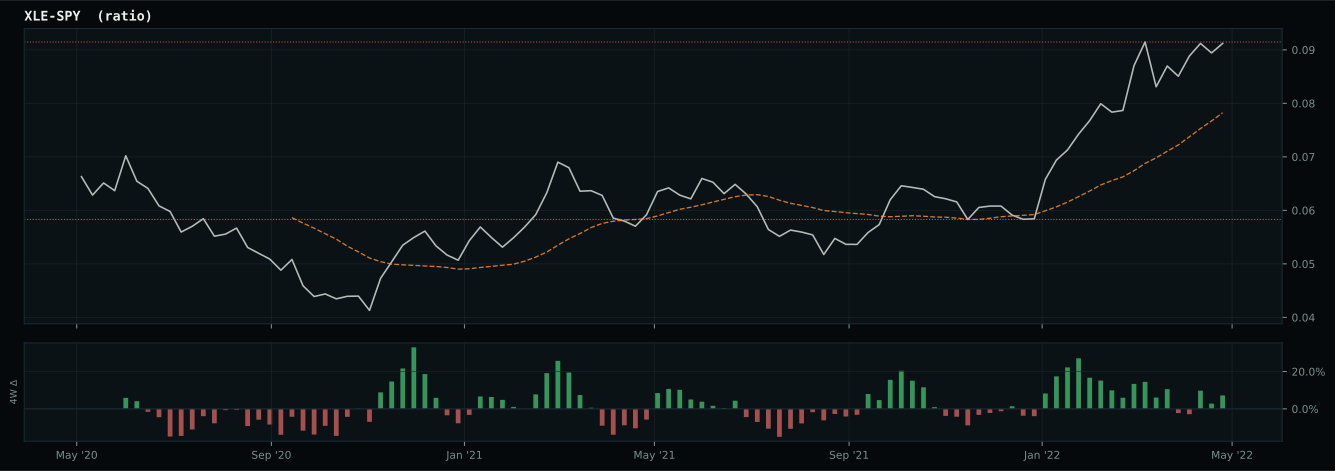
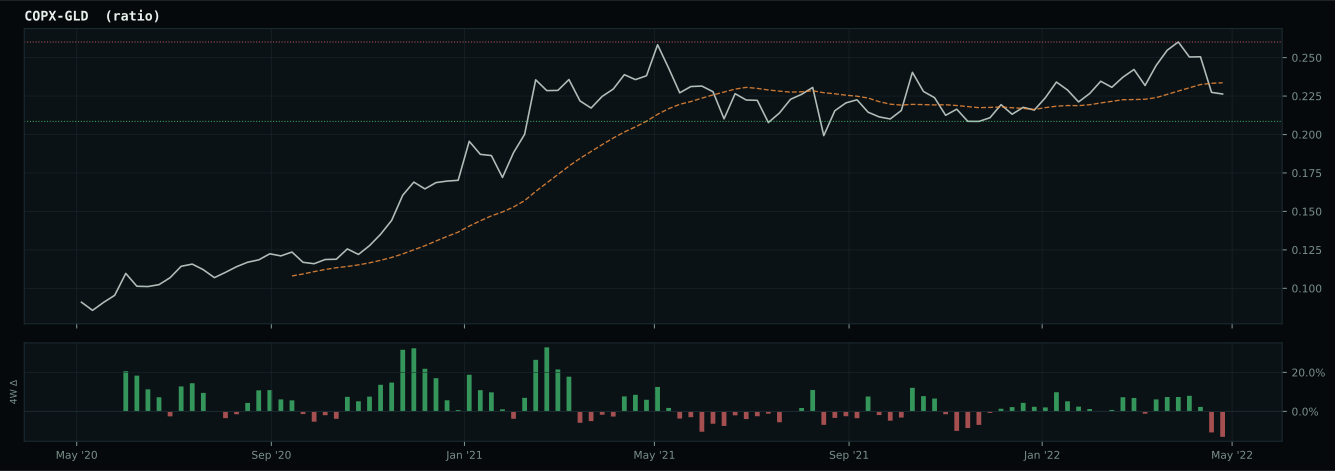
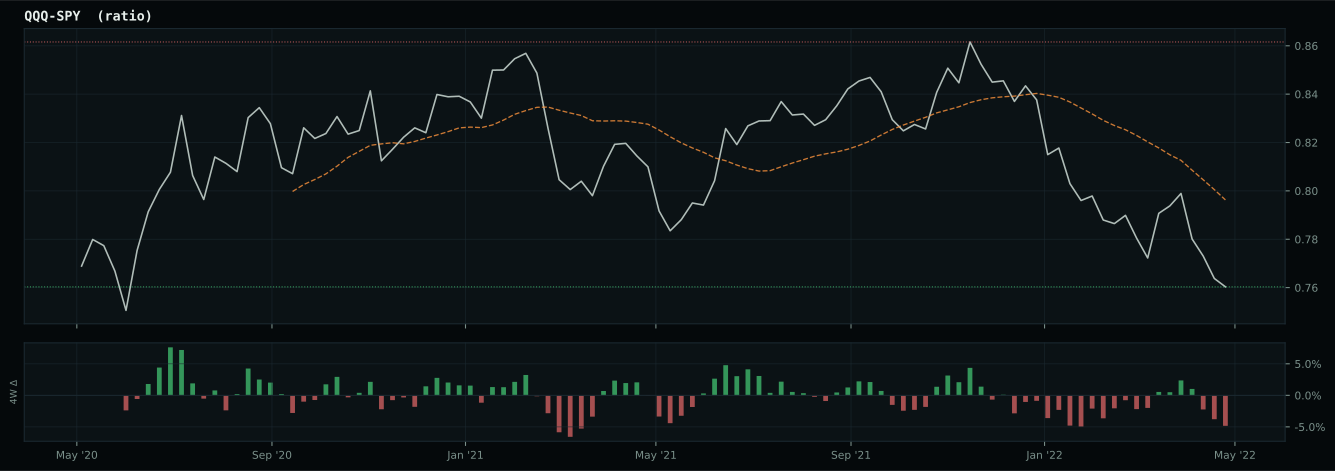
growth data is not confirming the weak market-implied risk appetite signal
Defensive overlay cause is not singular enough to concentrate: the sleeve diversifies across liquidity, monetary defense, and defensive equity exposure while the market resolves the next regime.
Macro Evidence Charts
Market-implied signals behind the macro regime scores. Each ratio compares two assets; the direction and slope of the ratio is what the macro engine reads.
Crypto Regime — NoCrypto
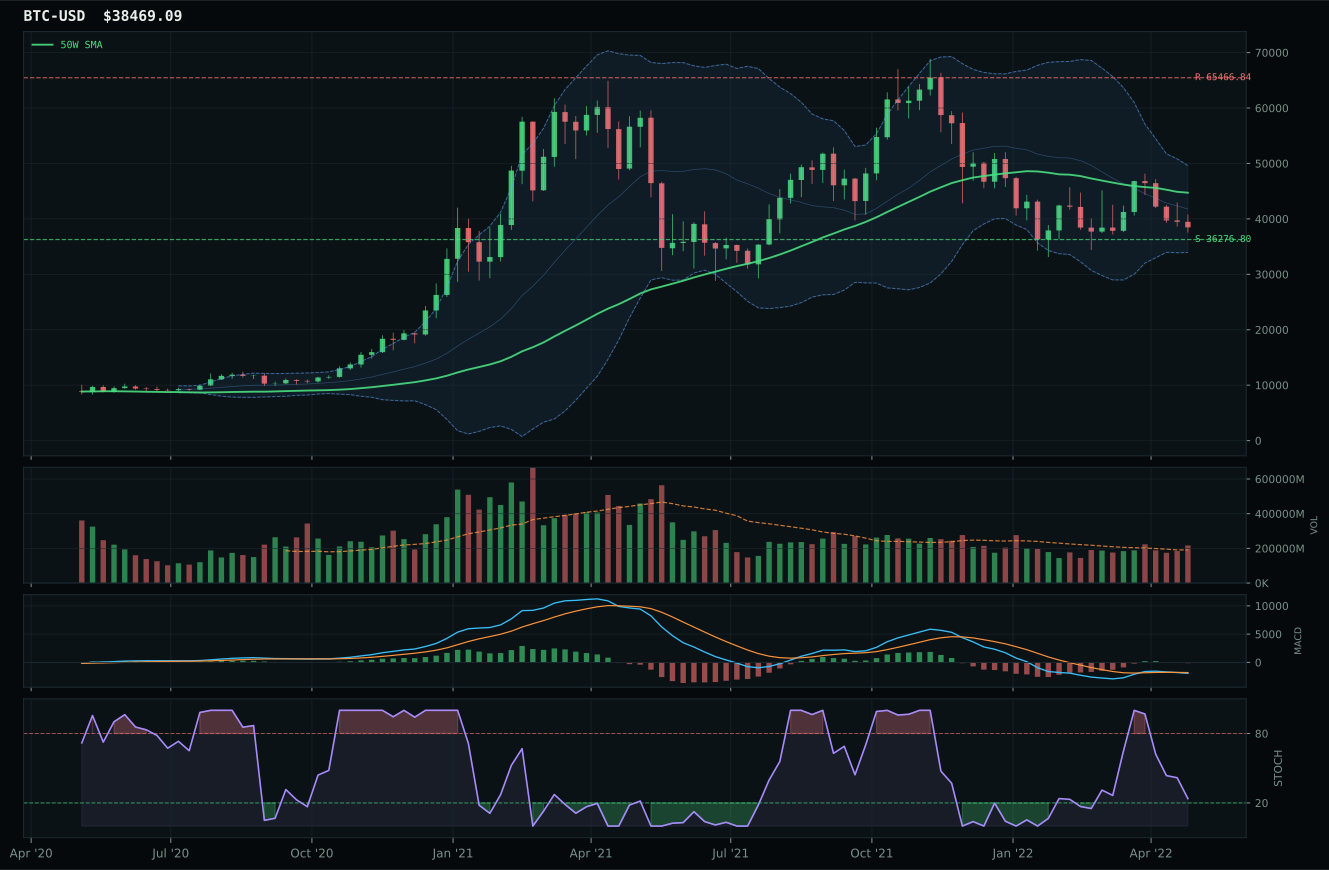
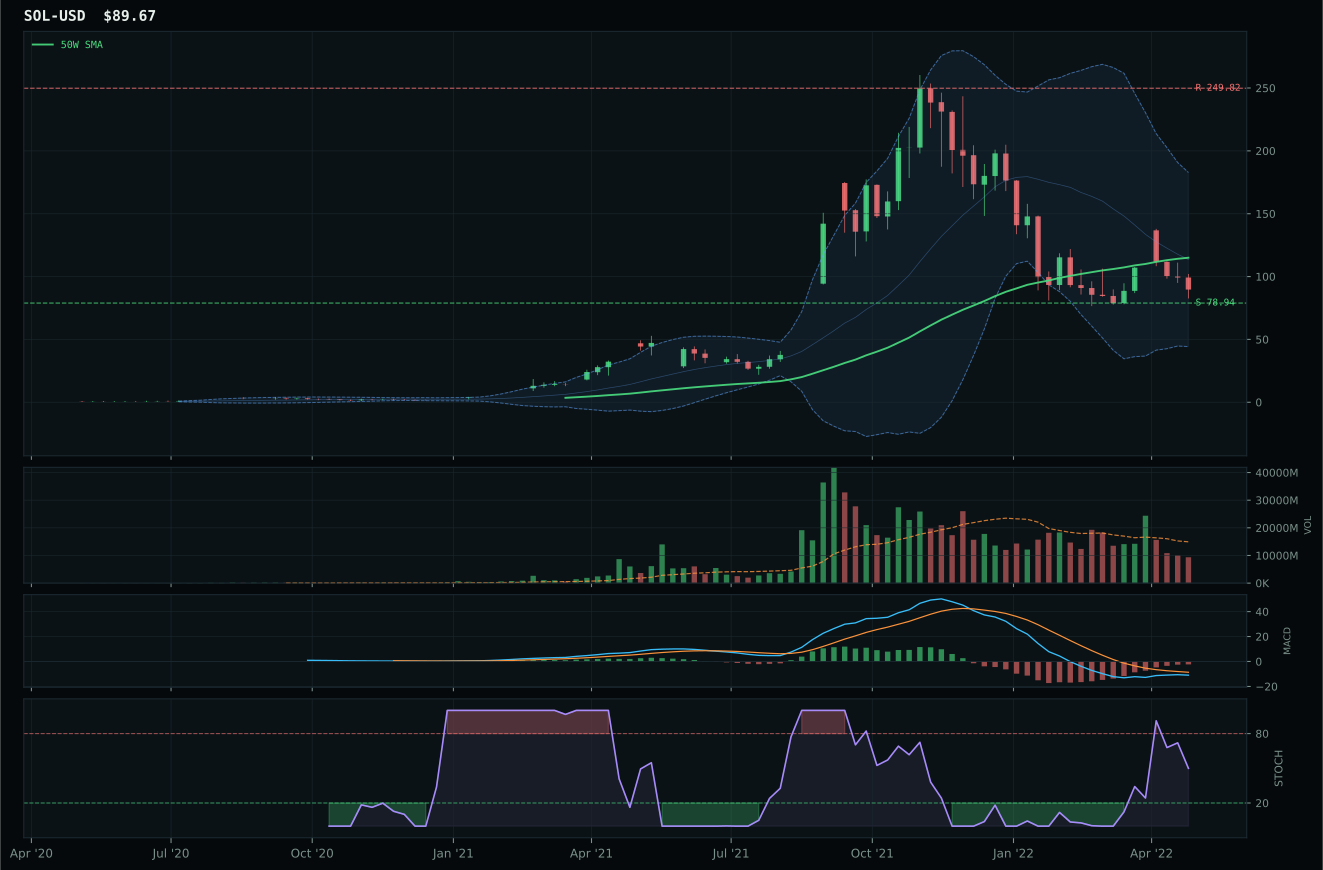
ValueBTC not armed: BTC has not made the first post-breakdown touch of the 200W buy zone after losing the 50W
TrendBTC not confirmed
one or more available conditions failed
Category Rankings
| Rank | Category | Winner | Score | Alloc | 4W Ret | Peers (4W) |
|---|---|---|---|---|---|---|
| 1 | Traditional Energy | XLE | 79.0 | 20% | +20.48% | XOP +23.6% · FCG +24.3% |
| 2 | Precious Metals | GLD | 69.5 | 20% | -0.52% | GDX -5.0% · SLV -2.3% |
| 3 | Agriculture & Livestock | WEAT | 64.0 | 10% | +8.35% | VEGI +0.5% · MOO +0.4% |
| 4 | Utilities & Infrastructure | IGF | 63.3 | 10% | +5.02% | XLU +4.3% · PAVE -1.1% |
| 5 | Nuclear Energy | URNM | 60.4 | 10% | -4.42% | URA -1.5% · NLR +3.5% |
| 6 | Defense & Aerospace | ITA | 51.1 | 10% | +0.09% | XAR -2.9% · ROKT +0.4% |
| 7 | Industrial Metals | COPX | 44.9 | 10% | +1.16% | PICK +3.3% · REMX +9.7% |
| 8 | Technology | XLK | 42.2 | 10% | -0.25% | CIBR -7.6% · IGV -3.1% |
| 9 | AI | SMH | 27.1 | 0% | +6.62% | AIQ -1.5% · BOTZ +1.7% |
| 10 | Emerging Markets | INDA | 13.1 | 0% | -4.43% | IEMG +2.0% · ILF +11.8% |
Traditional Energy — XLE
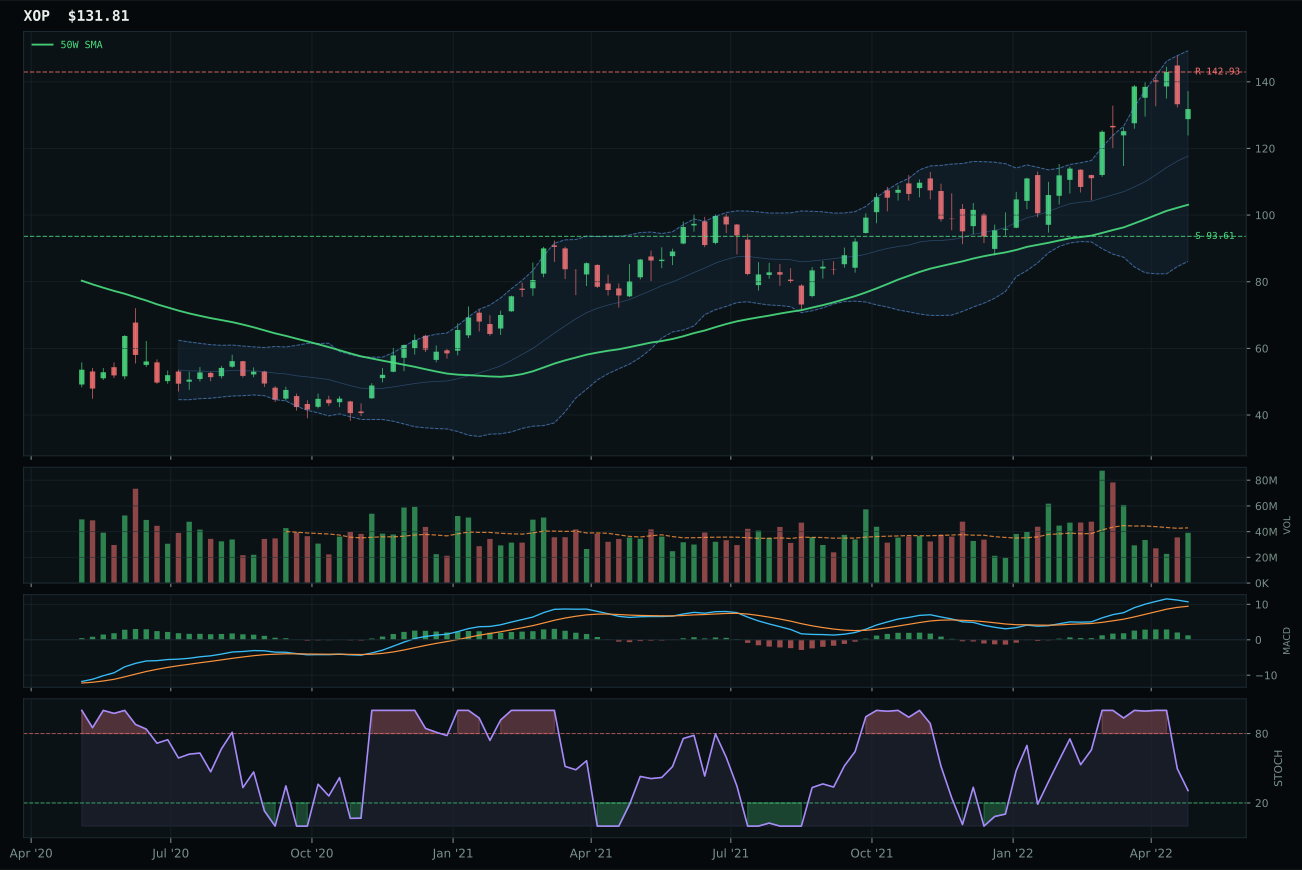
XOP has a vertical extension profile with 31.1% 13-week relative strength versus SPY.
A failed hold above support would weaken the setup.
Actionable but governed by invalidation levels.
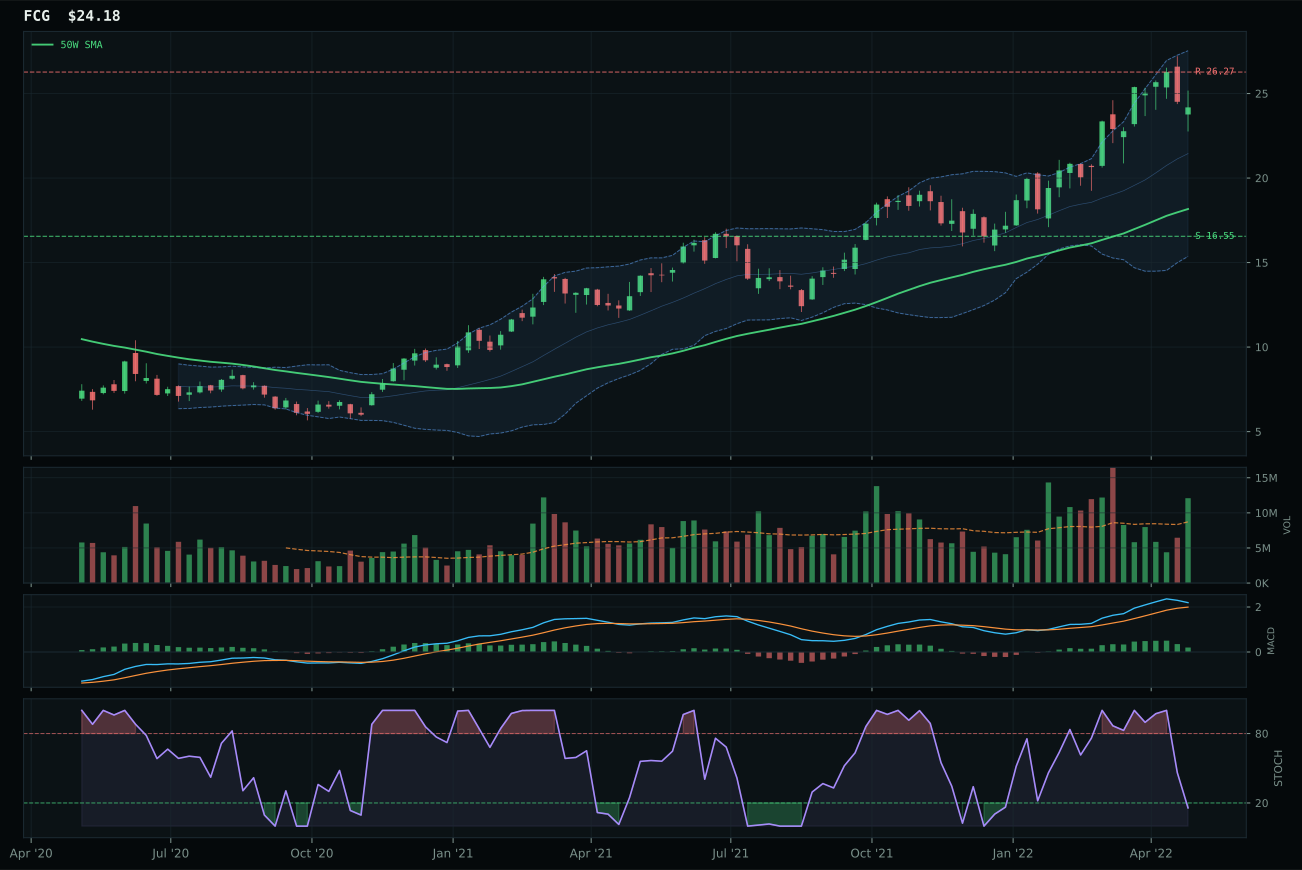
FCG has a vertical extension profile with 31.4% 13-week relative strength versus SPY.
A failed hold above support would weaken the setup.
Actionable but governed by invalidation levels.
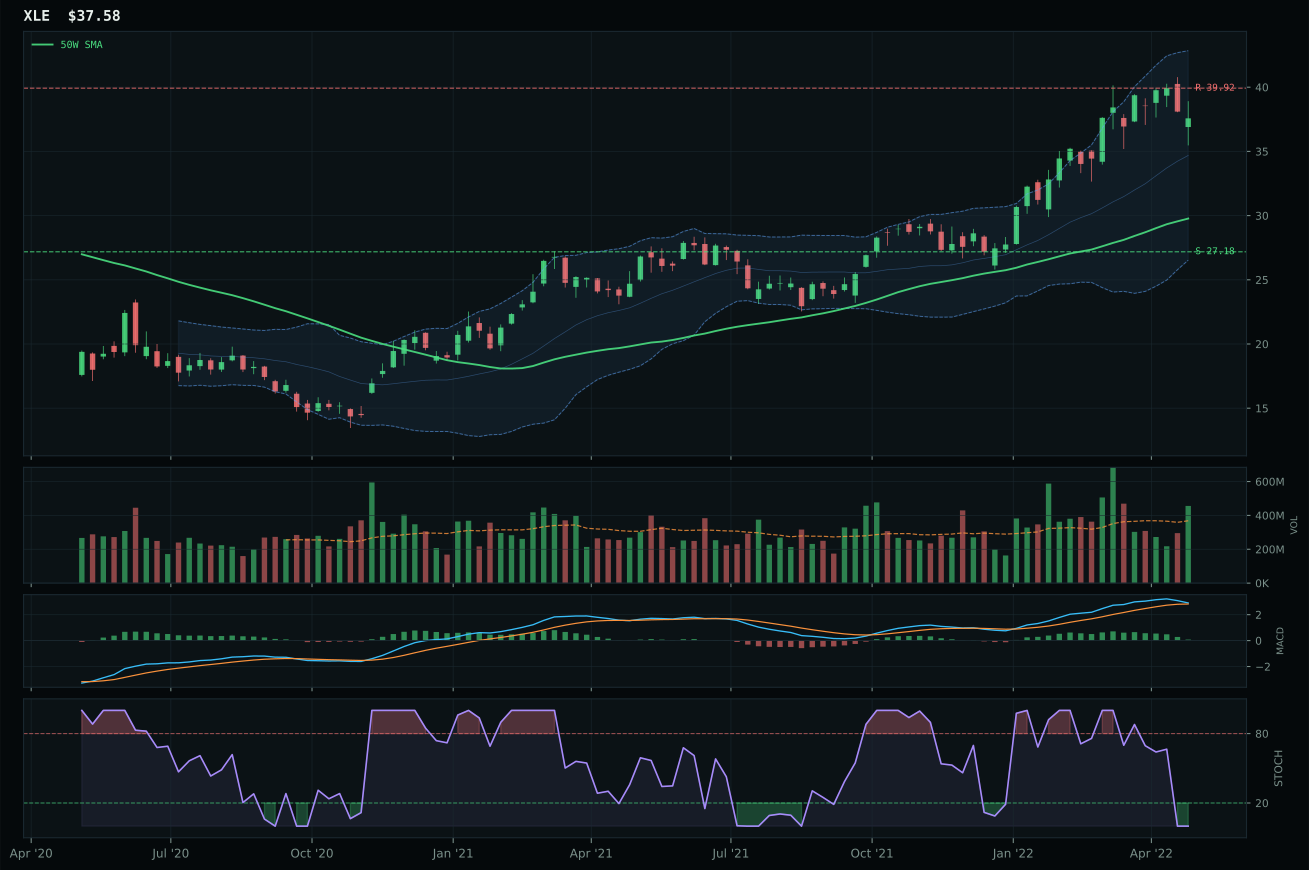
XLE has a vertical extension profile with 21.3% 13-week relative strength versus SPY.
A failed hold above support would weaken the setup.
Actionable but governed by invalidation levels.
XLE wins the top-2 allocation with a commanding final score of 79.0, built on exceptional trend strength of 96.0 with price 26.2% extended above the 50-week moving average and RS versus SPY reaching 21.3%. The structure is vertical extension with above-average volume participation at 1.24x the 20-week average, confirming that the energy rally is not a quiet accumulation but an open stampede of buyer interest. Stochastic RSI is fully oversold at 0.00 despite the extended price action, indicating that mechanical momentum indicators are screaming overbought while volume and breadth indicators are screaming underbought—the classic setup for continuation. Runner-up XOP shows higher RS versus SPY at 31.1% and perfect momentum confirmation score of 100.0 versus XLE's 91.0, but XOP's risk-reward deteriorates to 33.4 versus XLE's 47.8, and volume confirmation is only neutral versus XLE's above-average participation, explaining why XLE retains the edge despite appearing more conservative.
Traditional Energy claims the first top-2 allocation slot at 10% with macro fit of 92.0—the highest macro conviction score in the entire portfolio. Energy scarcity adds 16 points, inflation pressure adds 10 points, supply shortage adds 9 points, and real asset sponsorship adds 7 points, creating a confluence of fundamental forces that override all other portfolio considerations. XLE's technical evidence of 58.2 is moderate, held back by timing score of 48.0 (the extension penalty) and risk-reward of 47.8 (limited upside remaining), but the macro case is so strong that technical weakness at entry levels becomes irrelevant—the conviction is that energy supply constraints will dominate through year-end regardless of near-term pullbacks. The allocation decision places energy alongside precious metals as co-equal portfolio anchors against inflation and monetary debasement, with energy providing income via integrated majors' cash flow while gold provides pure purchasing-power preservation. XOP remains tactically available if exploration beta is warranted, but XLE's stability and cash-return profile make it the core vehicle. For energy to lose its top-2 status, the macro narrative would require either a hard recession reducing demand below structural supply constraints or a geopolitical resolution of Middle East tensions—neither scenario currently warrants reduction from 10%.
Precious Metals — GLD
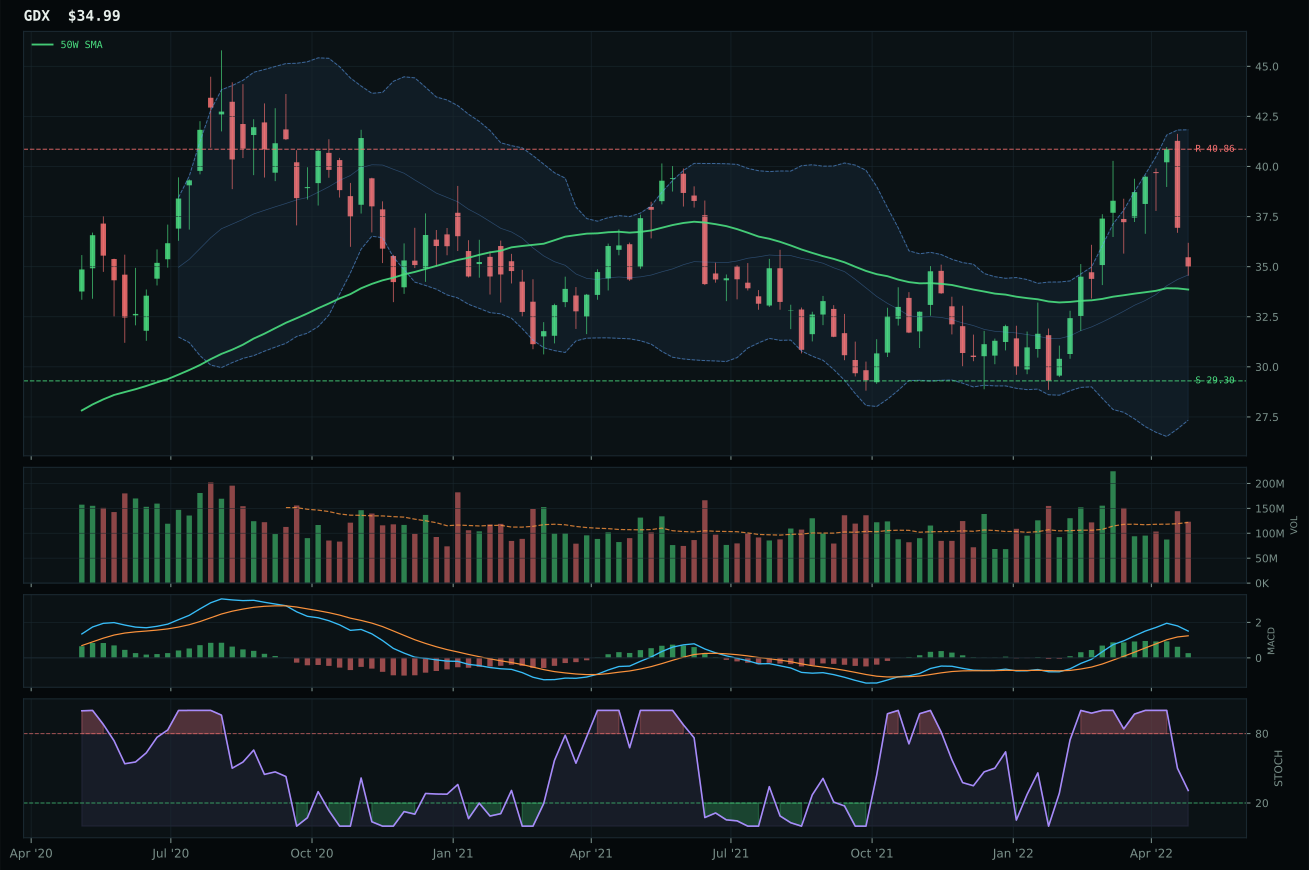
GDX has a neutral structure profile with 26.2% 13-week relative strength versus SPY.
A failed hold above support would weaken the setup.
Actionable but governed by invalidation levels.
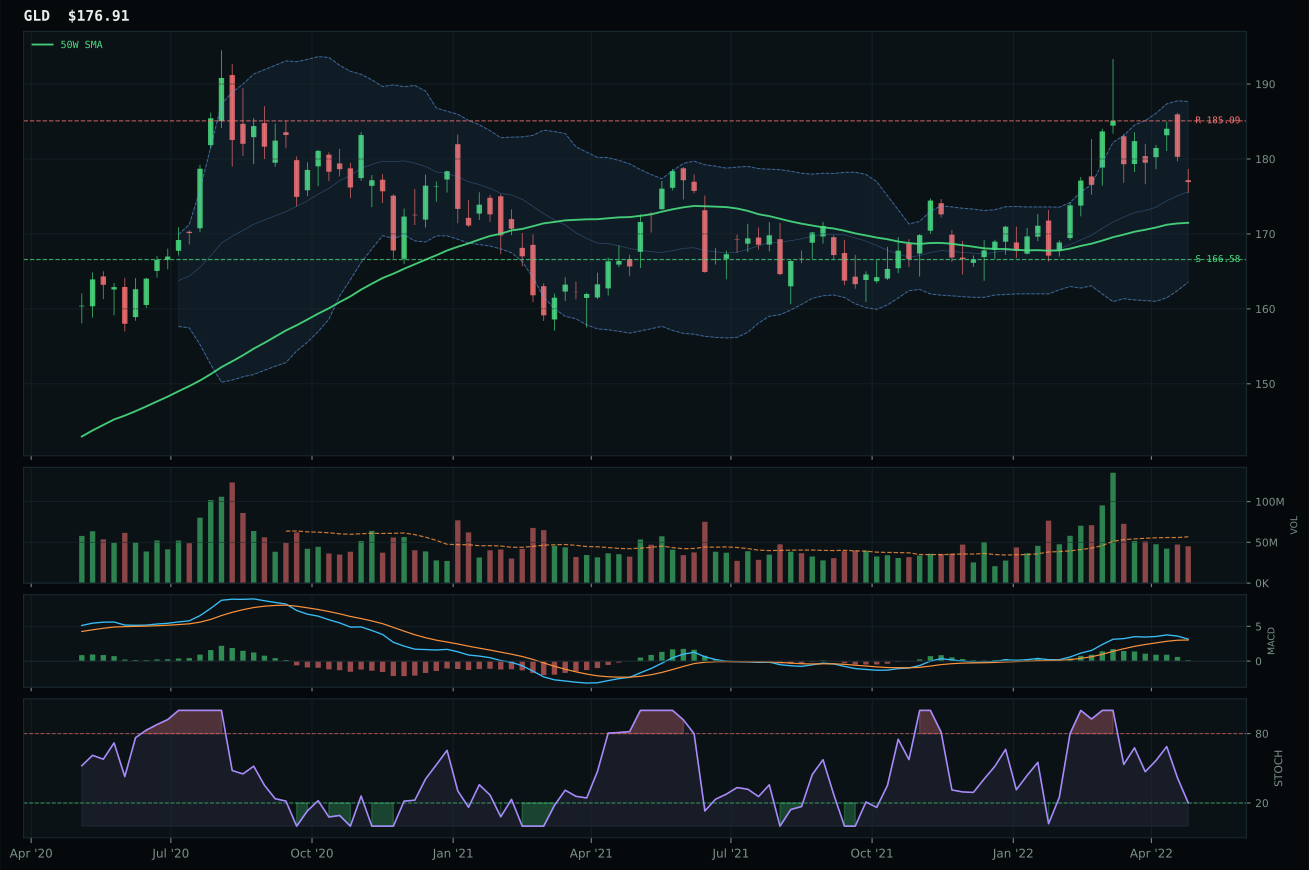
GLD has a neutral structure profile with 12.6% 13-week relative strength versus SPY.
A failed hold above support would weaken the setup.
Actionable but governed by invalidation levels.
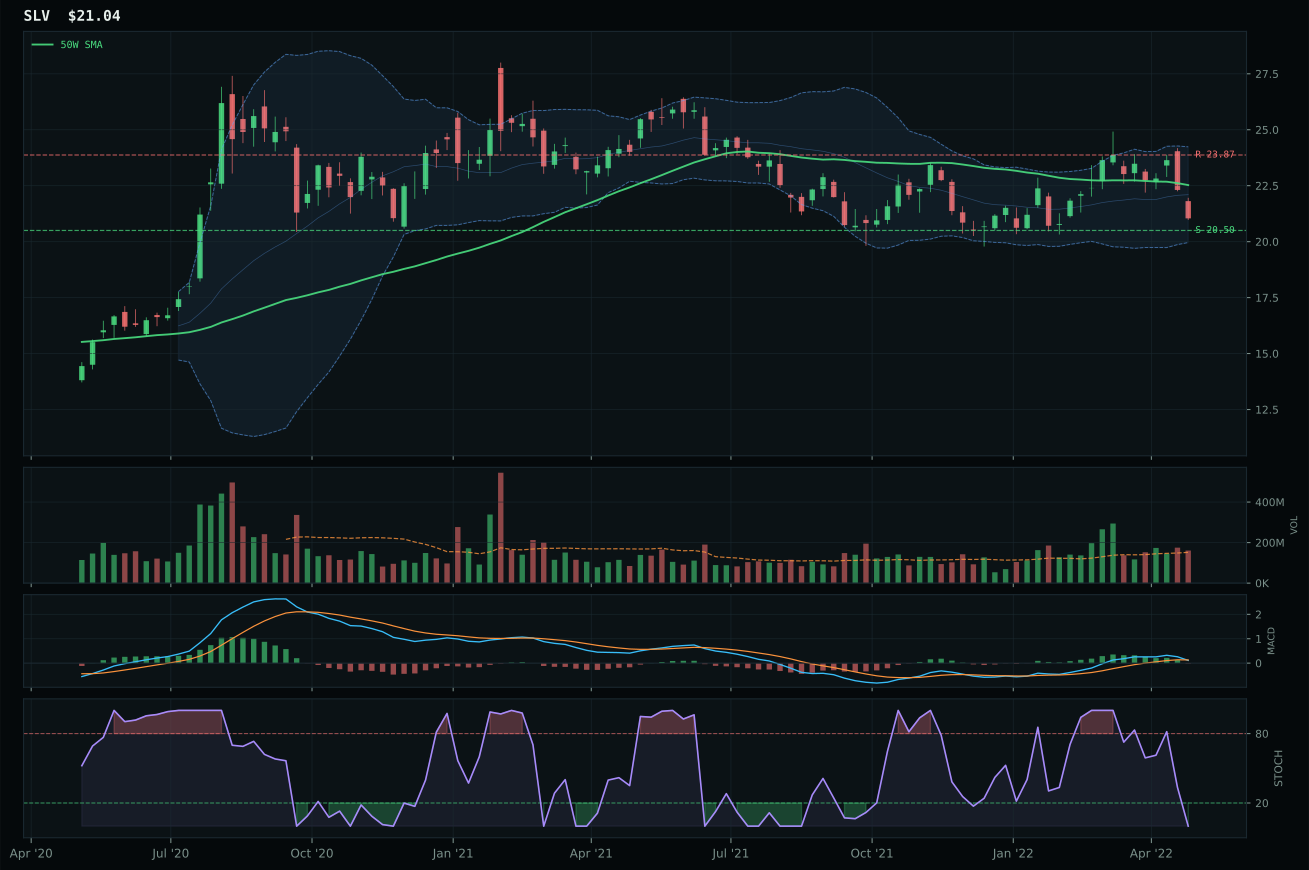
SLV has a pullback into support profile with 8.4% 13-week relative strength versus SPY.
A failed hold above support would weaken the setup.
Actionable but governed by invalidation levels.
GLD wins the category and earns top-2 status with a decisive technical and macro case: price sits only 3.2% above the 50-week moving average with a perfectly flat 50W slope of 0.0%, establishing a neutral structure that avoids both the extension penalty of WEAT and the repair-zone weakness of deep pullbacks. Relative strength versus SPY reaches 12.6% while category-relative strength remains at 0.0%, indicating GLD is the tier-1 gold expression rather than a leveraged or exotic variant. Volume-price confirmation reaches 72.0 and persistence 69.4, confirming that the uptrend is being accumulated rather than abandoned on every dip. Runner-up GDX shows higher technical evidence at 85.3 and explosive 13-week return of 19.4% versus GLD's 5.9%, but that momentum comes at the cost of structure cleaniness at 72.2 versus GLD's 74.9 and risk-reward deterioration to 51.3 versus 65.8—the miner leverage is now priced in and the margin of safety has compressed.
Precious Metals claims the second top-2 overweight allocation at 10%, equal to energy, based on a final score of 69.5 and category-level macro fit of 72.0 anchored by monetary hedge bid at +14 points. This is the defining macro narrative of the week: defensive rotation adds 7 points, dollar pressure adds 3 points, but the 14-point boost from monetary hedge bid reflects the portfolio's core conviction that real rates remain negative, currency debasement continues, and gold serves as essential ballast. GLD's technical evidence of 77.4 is substantial, built on perfect trend (100.0), excellent timing (92.0), and solid momentum confirmation (81.2), establishing this as a high-conviction play rather than a speculative commodity bet. The allocation splits precious metals between GLD as the core monetary hedge and smaller positions in agricultural and energy real assets, creating a portfolio structure that defends purchasing power through multiple mechanisms. GDX remains available as a tactical trade if gold momentum accelerates, but GLD's cleaner structure and lower volatility make it the preferred allocation vehicle for a regime where real yield compression is the primary driver.
Agriculture & Livestock — WEAT
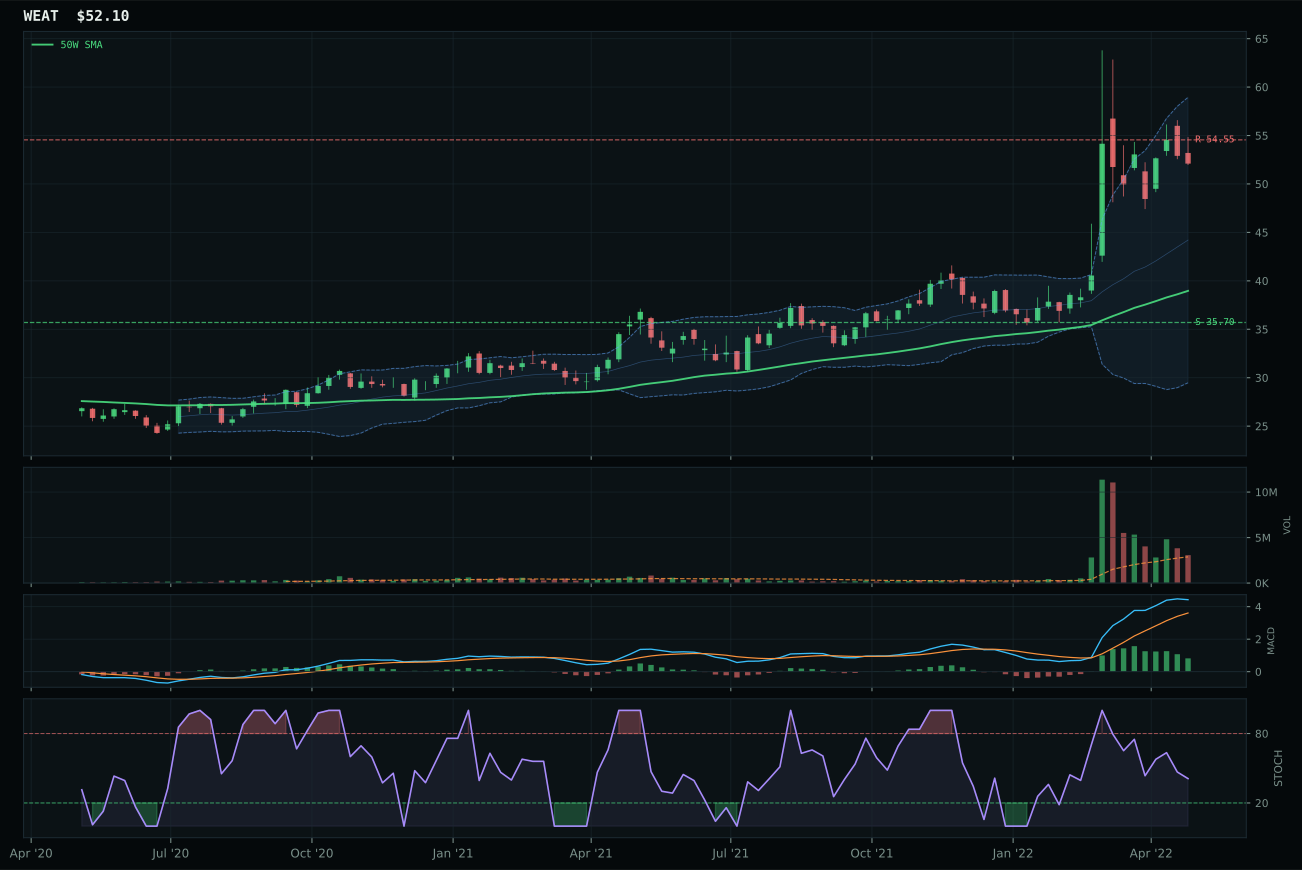
WEAT has a vertical extension profile with 44.4% 13-week relative strength versus SPY.
A failed hold above support would weaken the setup.
Actionable but governed by invalidation levels.
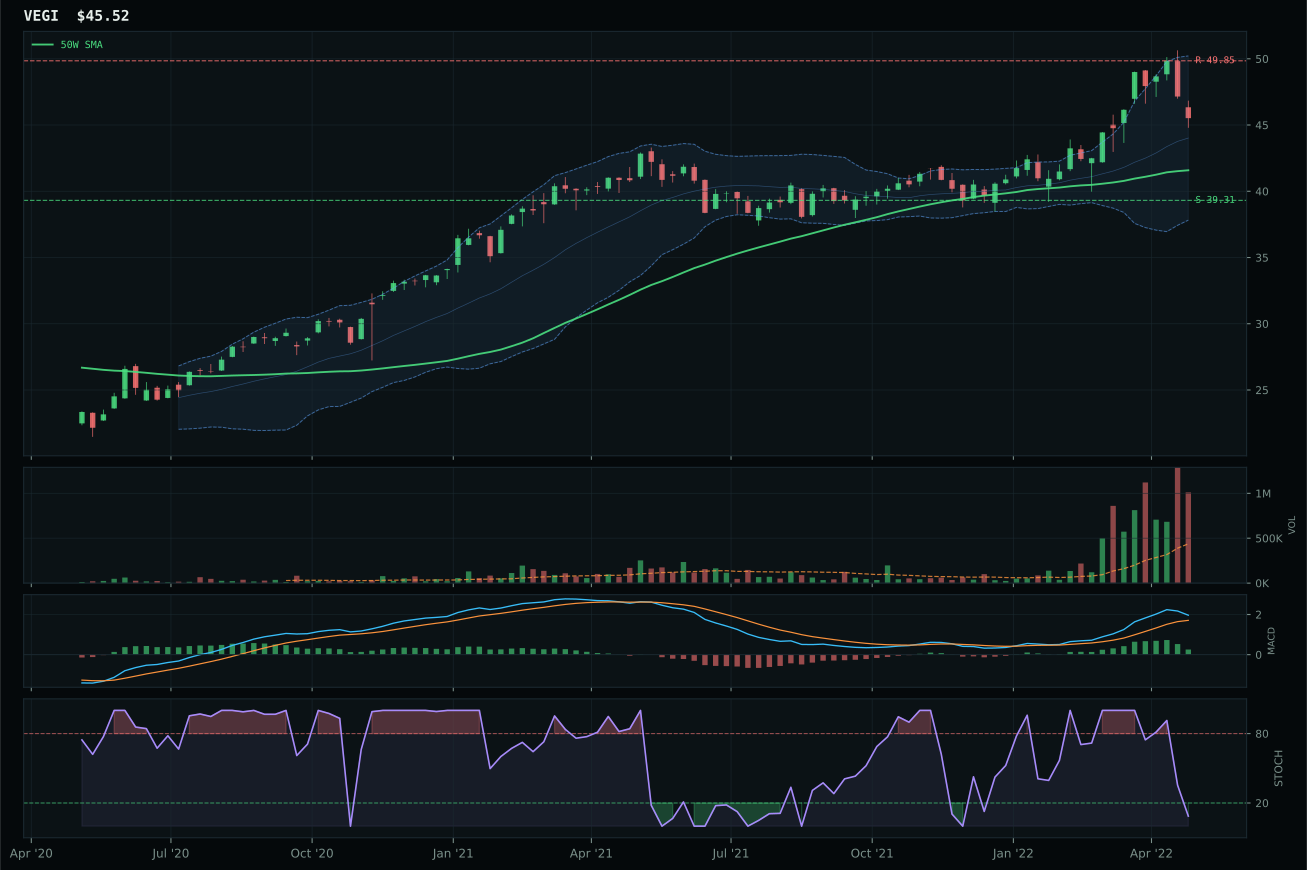
VEGI has a neutral structure profile with 18.0% 13-week relative strength versus SPY.
A failed hold above support would weaken the setup.
Actionable but governed by invalidation levels.
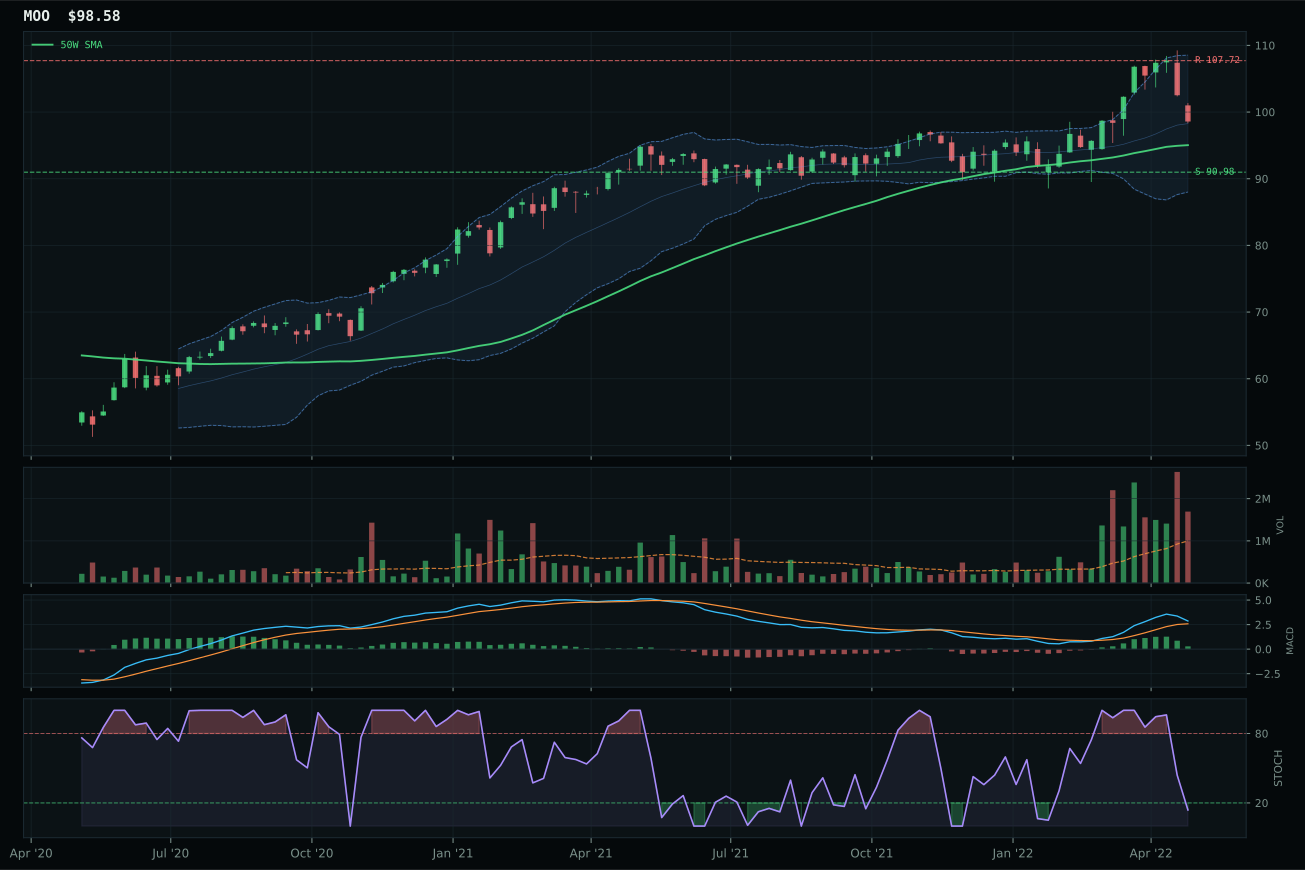
MOO has a neutral structure profile with 14.1% 13-week relative strength versus SPY.
A failed hold above support would weaken the setup.
Actionable but governed by invalidation levels.
WEAT wins decisively because it is the only ETF in the category offering genuine uptrend structure: price sits 33.7% above the 50-week moving average with a positive 50W slope of 0.9%, and the 13-week return of 37.6% paired with 44.4% relative strength versus SPY represents overwhelmingly the strongest momentum in the category. Volume-price confirmation scores 86.6 and persistence scores a perfect 100.0, indicating that the extended move is not a whipsaw but a sustained shift higher being confirmed on every pullback. The runner-up VEGI shows higher technical composite score (74 vs. 61) but that advantage is illusory: VEGI's volume drops to distribution pressure while WEAT holds neutral at 1.07x, and VEGI's category-relative strength of 0.0% versus WEAT's 26.5% reveals which name is actually receiving fresh capital. Risk-reward is clearly unfavorable for new longs at 31.8, with upside to 54.55 resistance only 4.5% away against 45.9% downside, but that penalty reflects the strength of the move, not weakness in the setup.
Agriculture & Livestock receives 5% allocation despite holding a tier-2 rank, justified by the strongest category-level macro fit in the entire portfolio at 86.0. Supply shortage adds 13 points, inflation pressure adds 10 points, real asset sponsorship adds 8 points, and commodity breadth positive adds 5 points—a convergence of macro tailwinds that explains why WEAT has extended so far. The final score of 64.0 ranks this category above technology, AI, and emerging markets, but below precious metals and energy, reflecting the truth that agricultural supply stress is real but secondary to energy and monetary hedges in the current regime. WEAT's technical evidence of 70.2 is solid, built on perfect trend score of 100.0 and momentum confirmation of 100.0, but timing and risk-reward penalties keep the category out of the absolute top allocation tier. The portfolio architecture places WEAT as a tactical real-asset play complementing the broader commodity and inflation hedge already established through energy and metals; to earn 5% allocation, agriculture would need to demonstrate tighter risk-reward through consolidation while maintaining relative strength, allowing new capital entry at less extended levels.
Utilities & Infrastructure — IGF
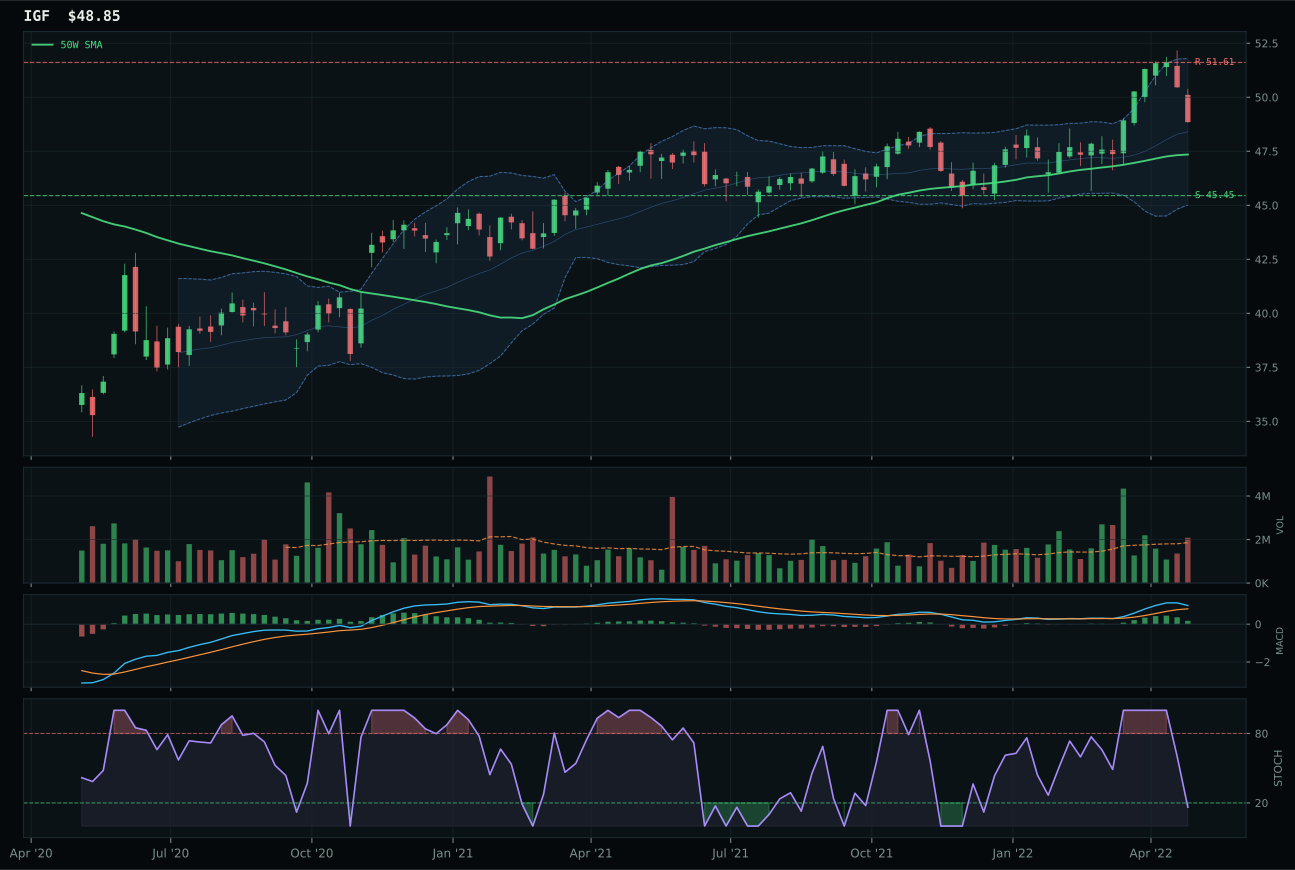
IGF has a neutral structure profile with 11.8% 13-week relative strength versus SPY.
A failed hold above support would weaken the setup.
Actionable but governed by invalidation levels.
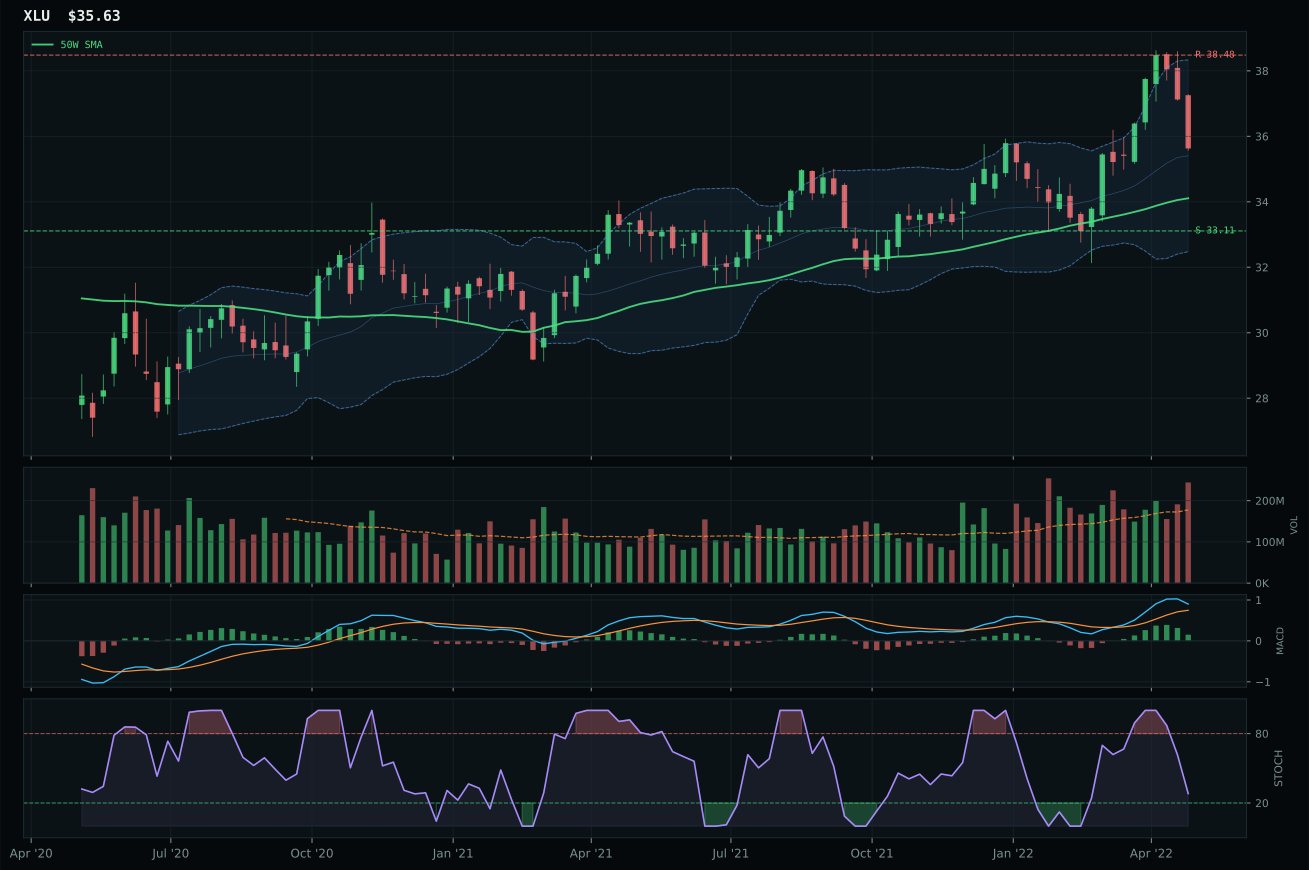
XLU has a neutral structure profile with 11.6% 13-week relative strength versus SPY.
A failed hold above support would weaken the setup.
Actionable but governed by invalidation levels.
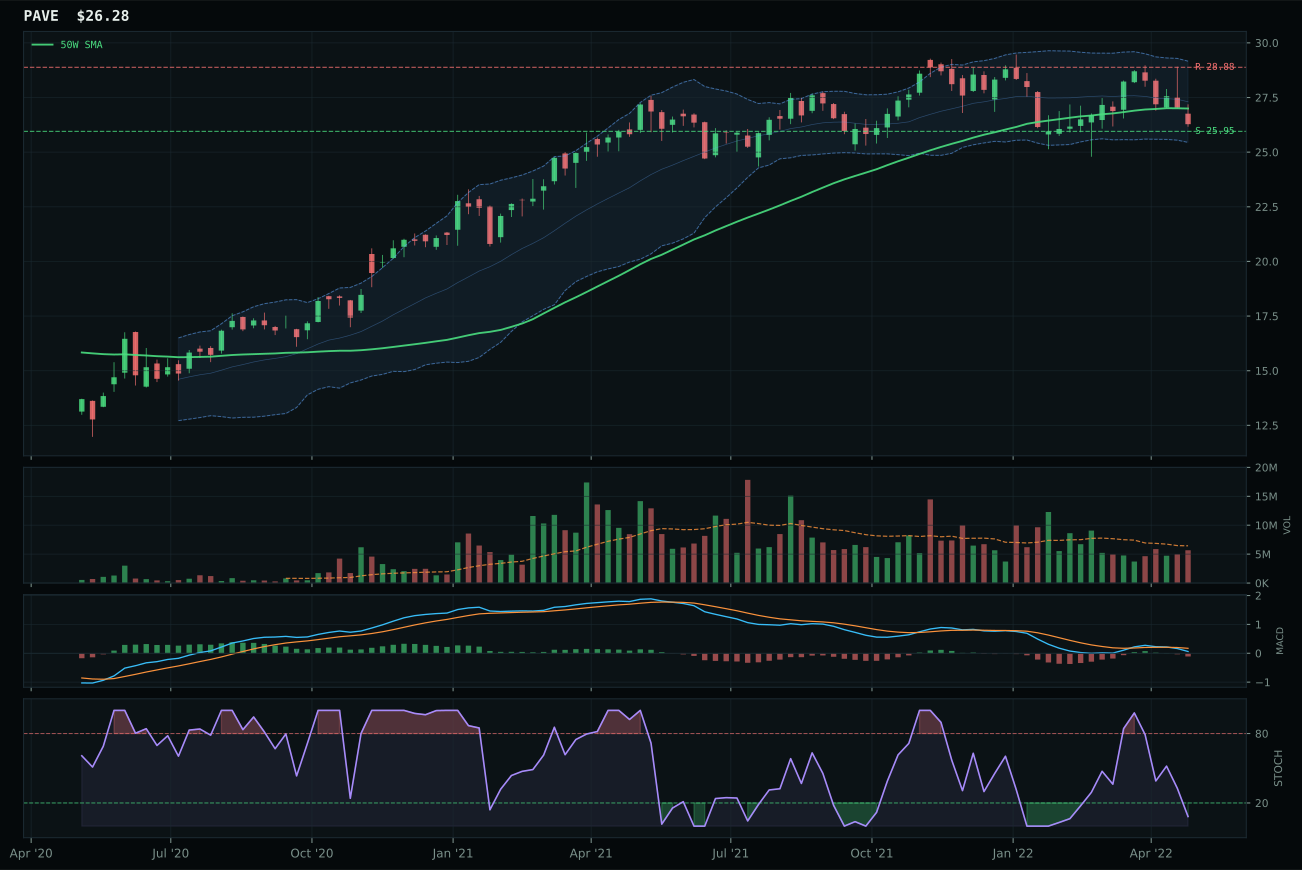
PAVE has a pullback into support profile with 8.0% 13-week relative strength versus SPY.
A failed hold above support would weaken the setup.
Actionable but governed by invalidation levels.
IGF wins narrowly over XLU with perfect trend score of 100.0, price 3.2% above the 50W and rising, paired with 11.8% relative strength versus SPY that confirms defensive rotation is flowing into the infrastructure name. The timing score of 92.0 reflects price sitting in the exact middle retracement zone at Fibonacci 0.382 near 49.21, offering both room to run and a defined invalidation level if the setup breaks. Volume-price confirmation reaches 65.7 and persistence 63.5, confirming that the 5.0% thirteen-week return is supported rather than rejected by volume participants. The margin over XLU is razor-thin at 0.2 points (63.3 vs. 63.2 final scores), with XLU showing marginally better risk-reward at 71 versus IGF's 66 and identical trend scores of 100—the decision hinges on IGF's 0.1% category-relative strength edge versus XLU's 0.0%, a statistical separation that reflects the randomness of category-relative expression.
Utilities & Infrastructure earns 5% allocation as a tier-2 position with final score of 63.3 and category-level macro fit of 64.0, driven by defensive rotation at +12 points and broader market bear at +4 points. IGF's technical evidence of 75.0 is solid across the board—trend 100.0, timing 92.0, momentum 77.0—but the macro fit of 47.0 reveals that infrastructure is not a macro-driven allocation decision. The placement at 5% reflects portfolio architecture: utilities and infrastructure serve as pure defensive rotation plays when growth is questioned, but they lack the conviction drivers (energy scarcity, real asset sponsorship, monetary hedge bid) that elevate categories to 10% overweights. This category is correctly sized as a tertiary defensive sleeve that complements gold (monetary hedge), energy (commodity scarcity), and agricultural (supply shock) as part of a multi-vector portfolio defense. The very tight technical setup—both IGF and XLU showing perfect trend scores and sitting equidistant from their moving averages—suggests this category is in equilibrium and not yet decisively committing to larger capital flows. IGF would remain a 5% position through consolidation above the 51.61 resistance level; a breakdown below the 45.45 support level would trigger evaluation of whether the defensive thesis is breaking down.
Nuclear Energy — URNM
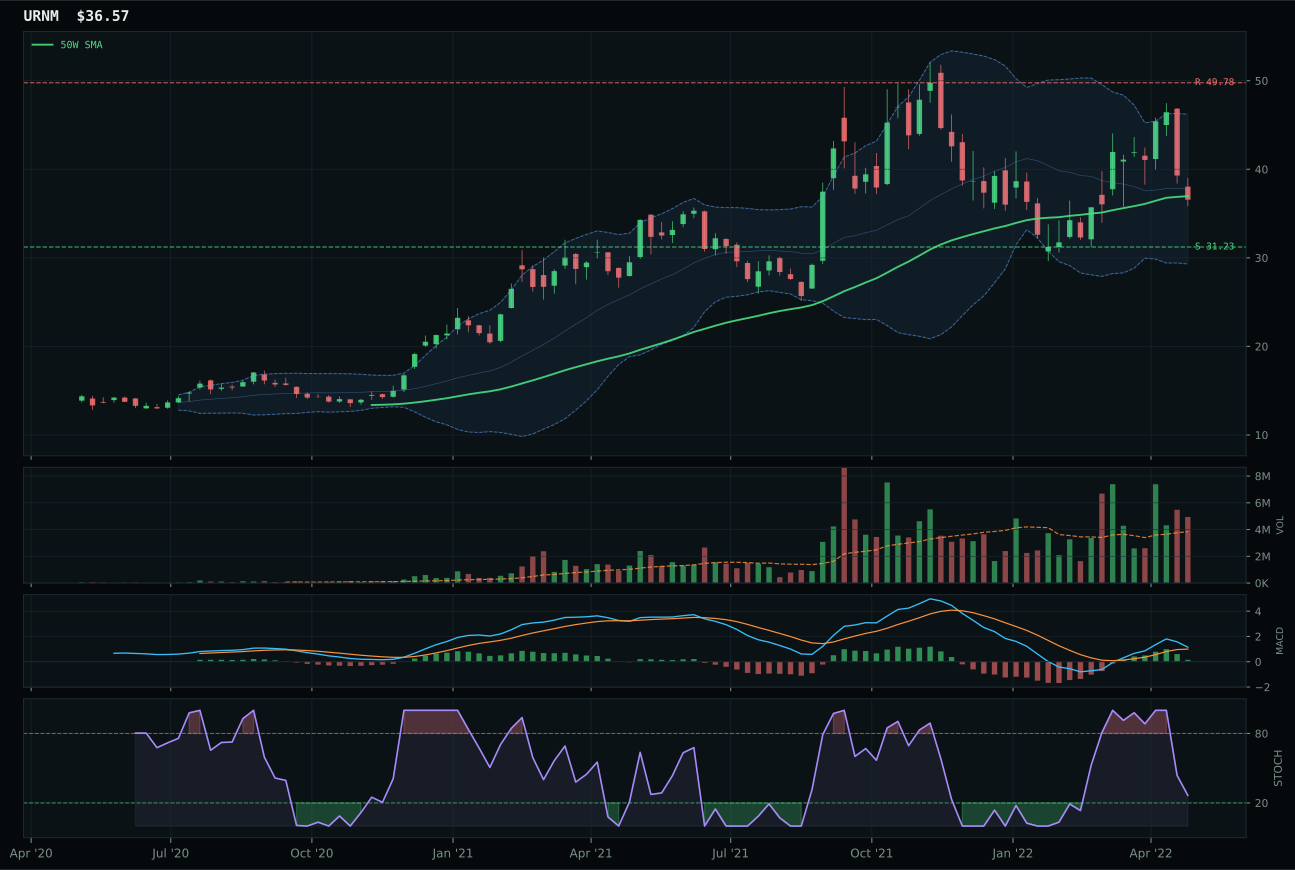
URNM has a compression near 50W profile with 23.9% 13-week relative strength versus SPY.
A failed hold above support would weaken the setup.
Actionable but governed by invalidation levels.
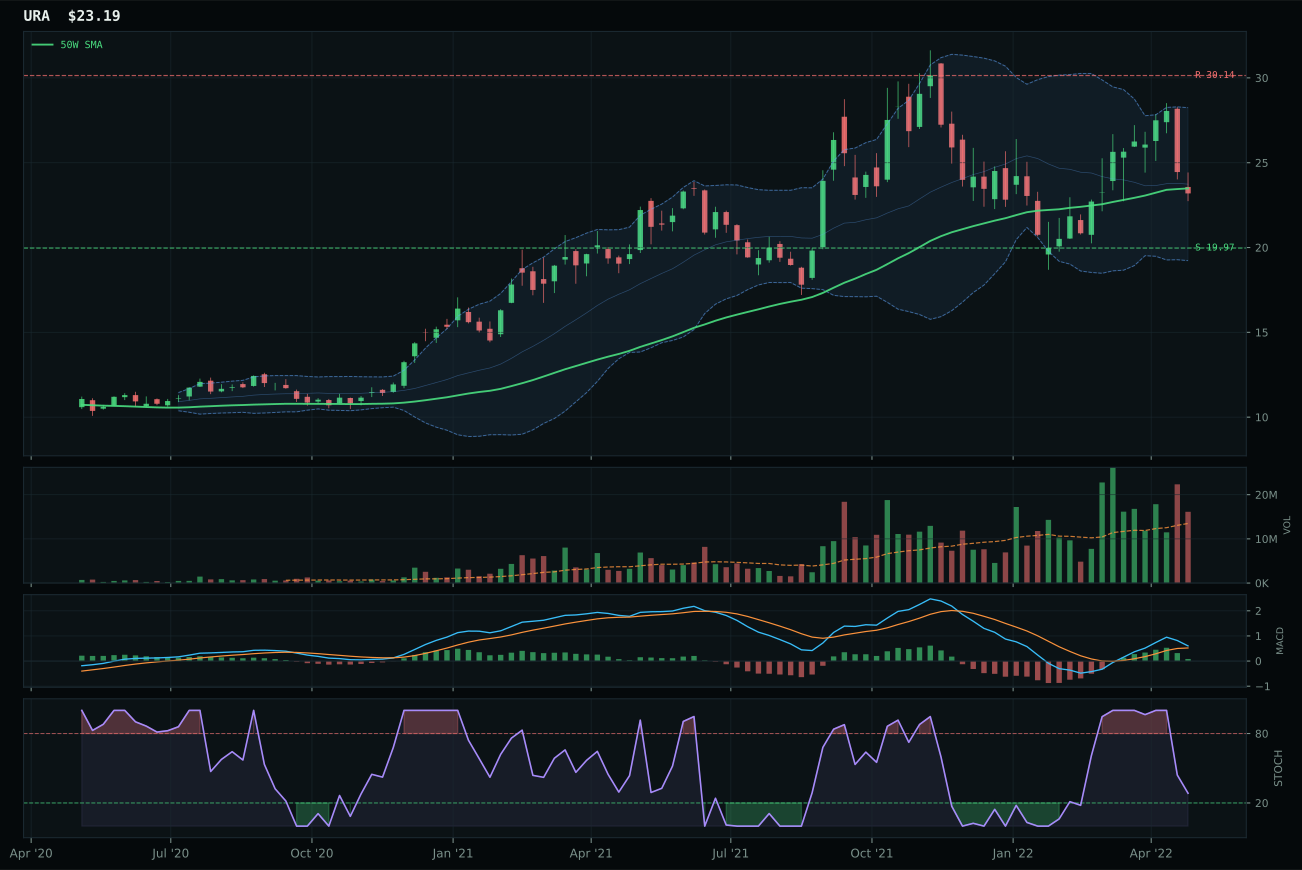
URA has a compression near 50W profile with 22.9% 13-week relative strength versus SPY.
A failed hold above support would weaken the setup.
Actionable but governed by invalidation levels.
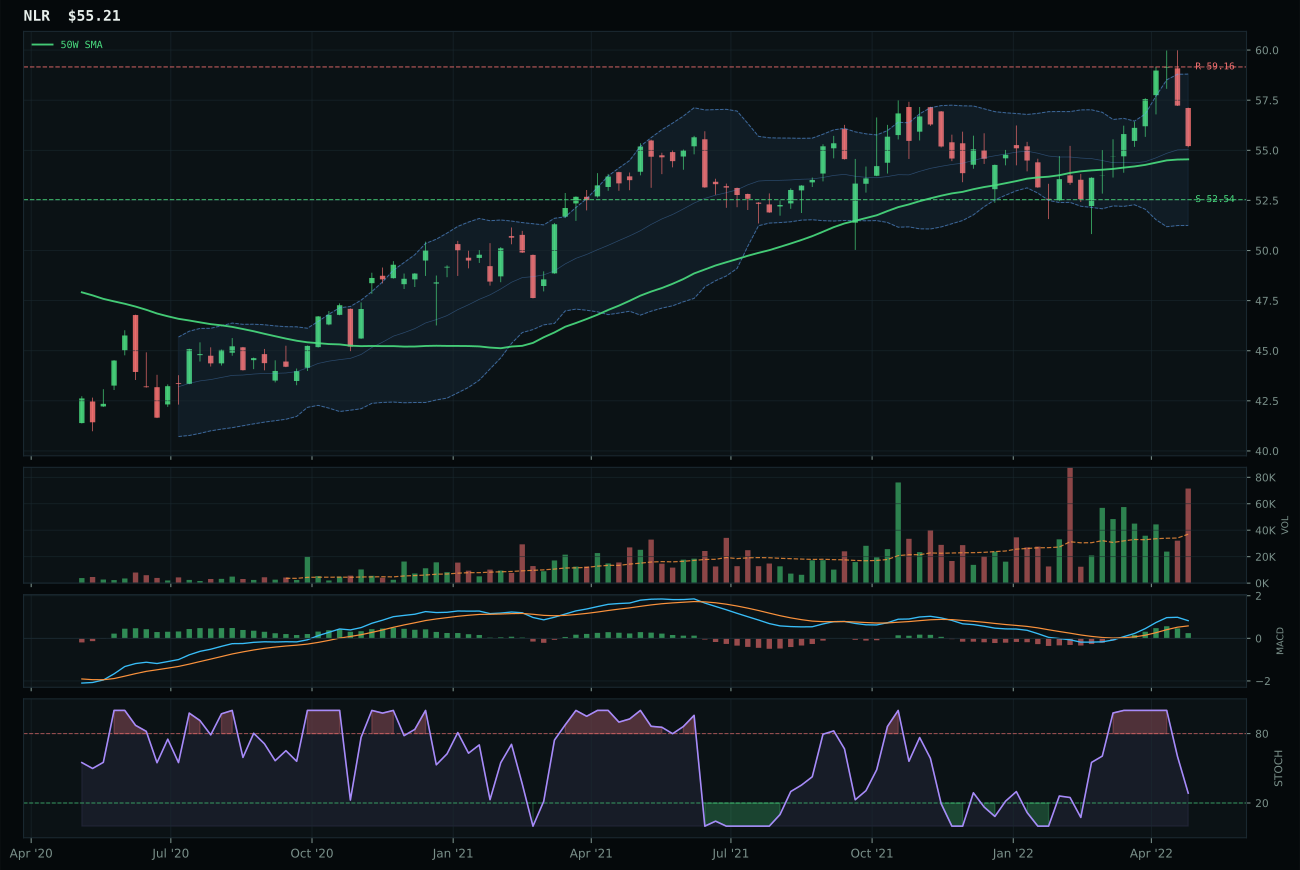
NLR has a compression near 50W profile with 11.9% 13-week relative strength versus SPY.
A failed hold above support would weaken the setup.
Tracked, but not top-2 eligible because: .
URNM wins despite price sitting -1.1% below the 50-week moving average, claiming category leadership through a compression-near-50W setup that can expand aggressively if buyers defend the level. The timing score reaches 95.0 and momentum confirmation scores 98.8, with 13-week return of 17.1% and RS versus SPY of 23.9% revealing that uranium miners are the fastest-moving exposure in the portfolio right now. Runner-up URA shows even higher technical composite score of 88 versus URNM's 79, with superior trend score of 91 versus 71 and matching momentum confirmation of 95, but the deciding factor is URNM's 1.0% category-relative strength versus URA's 0.0%—a marginal but consistent advantage in leading the peer set. Volume-price confirmation at 66.4 is solid for both, confirming that the 17% move over 13 weeks is not ephemeral but sustained. MACD is bullish but flattening for both, indicating the move is maturing but not yet rolling over.
Nuclear Energy earns 5% allocation as a tier-2 position with final score of 60.4 and category-level macro fit of 65.0 anchored by energy scarcity at +9 points and real asset sponsorship at +7 points. URNM's technical evidence score of 71.2 is the strongest among all tier-2 representatives, built on excellent trend, timing, and momentum scores, creating a rare instance where tier-2 allocation is driven by technical strength rather than macro compensation. The placement at 5% rather than 10% reflects portfolio discipline: while uranium exposure is warranted by energy scarcity and the multi-decade structural undersupply of nuclear fuel, URNM's 17% thirteen-week move has already captured much of the near-term impetus. The allocation serves as a leveraged complement to traditional energy, providing exposure to a structural undersupply story without overweighting to uranium mining volatility. The risk-reward at 57.9 remains reasonable despite the extended move, with 26.5% upside to resistance against 17.1% downside to support, but the tighter margin of safety compared to mid-May entry levels justifies sizing at 5% rather than matching the 10% allocated to XLE. URNM would remain a 5% position through a breakout above 49.78 resistance; a failure to maintain support at 31.23 would trigger a review of the category's macro thesis.
Defense & Aerospace — ITA
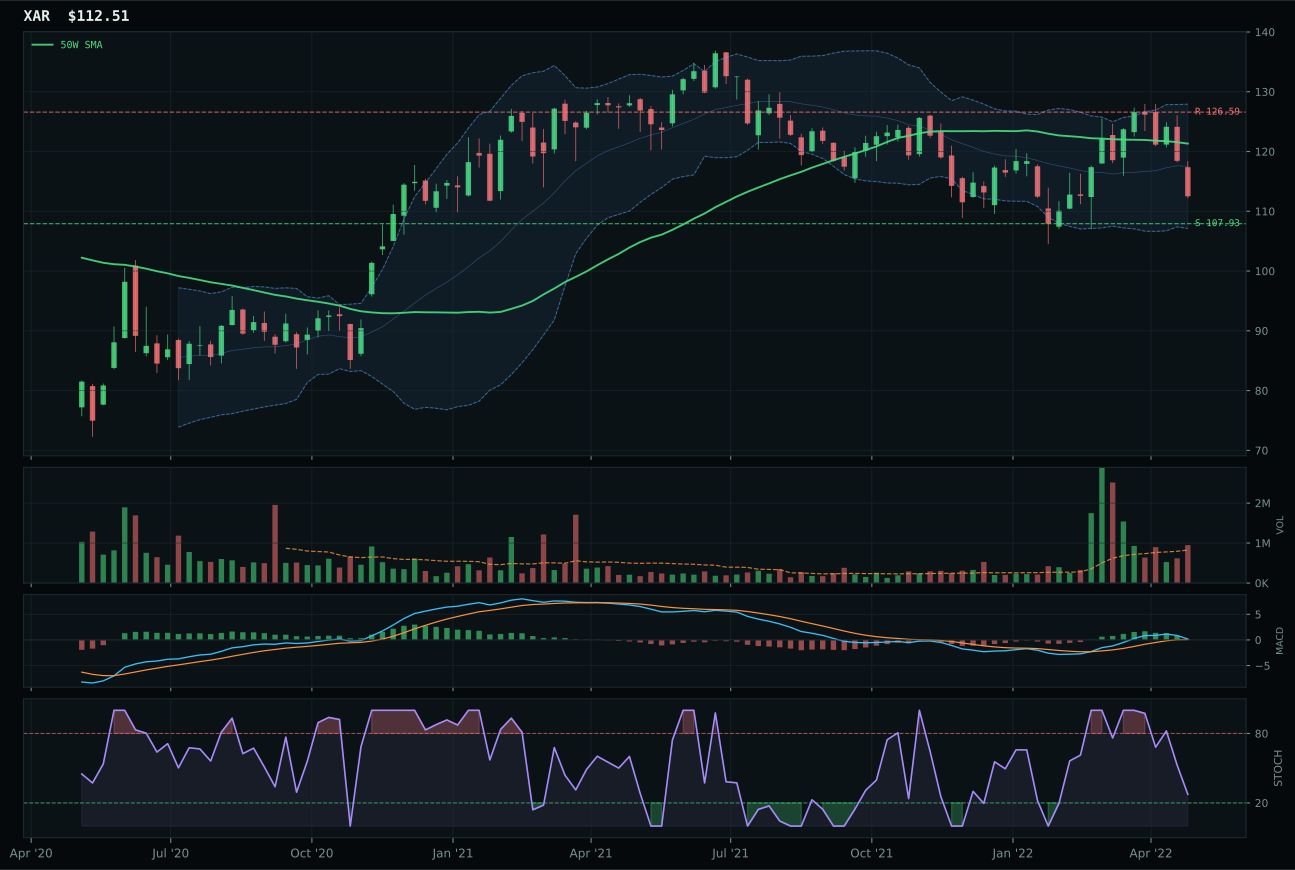
XAR has a pullback into support profile with 11.0% 13-week relative strength versus SPY.
A failed hold above support would weaken the setup.
Actionable but governed by invalidation levels.
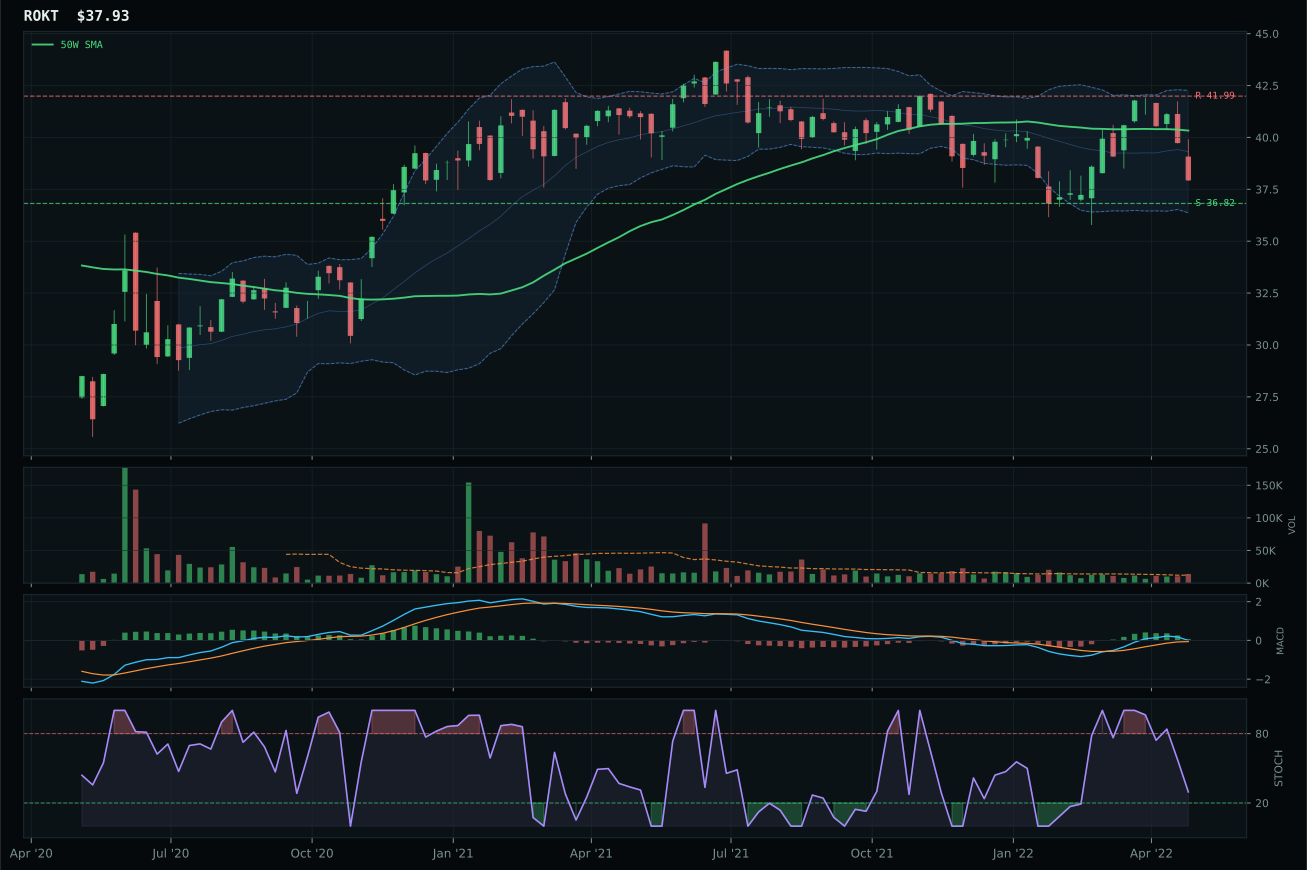
ROKT has a pullback into support profile with 9.8% 13-week relative strength versus SPY.
A failed hold above support would weaken the setup.
Tracked, but not top-2 eligible because: .
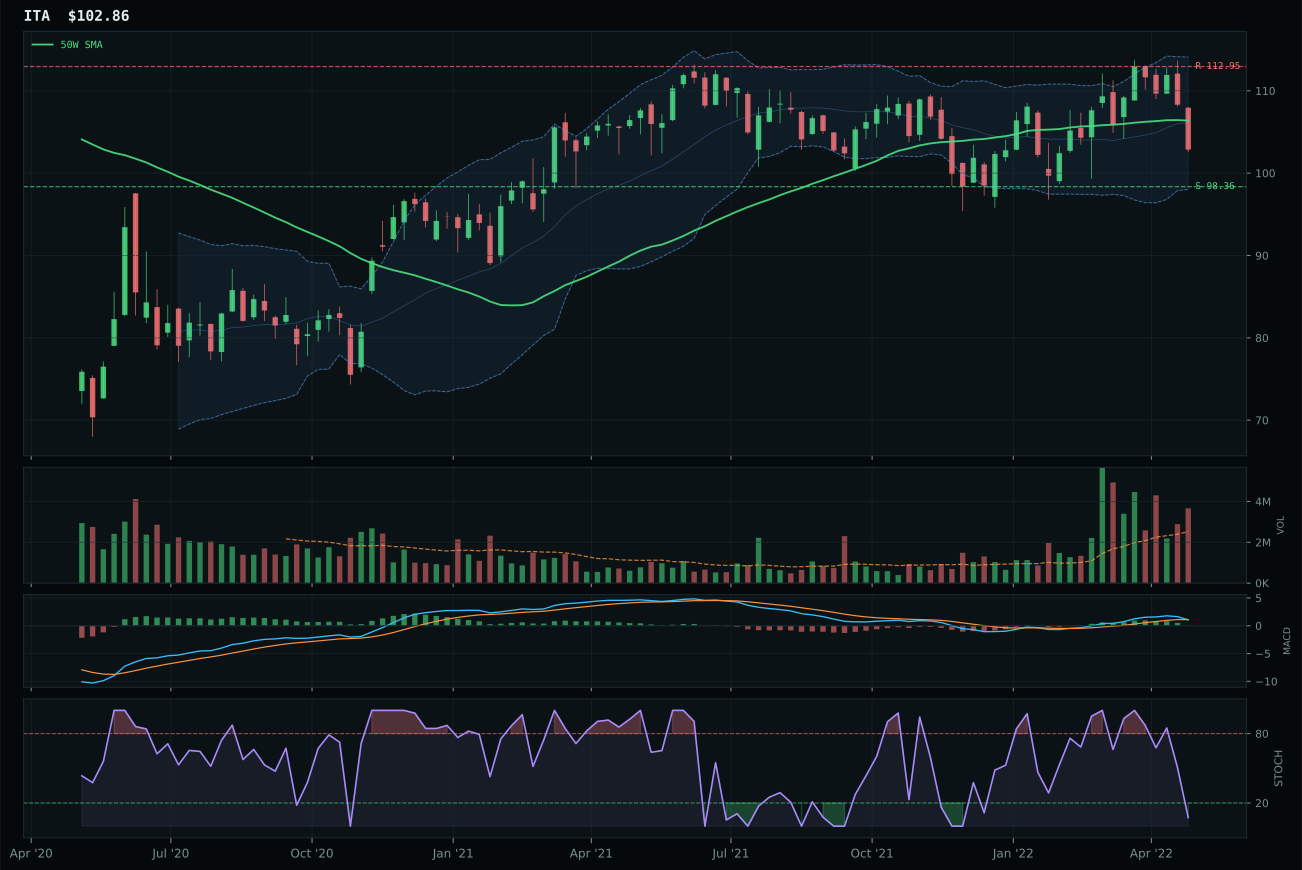
ITA has a pullback into support profile with 10.0% 13-week relative strength versus SPY.
A failed hold above support would weaken the setup.
Actionable but governed by invalidation levels.
ITA wins the category with a perfect timing score of 100.0, stemming from price sitting -3.3% below the 50-week moving average in the exact middle retracement zone at Fibonacci 0.618 near 102.40. This is the tightest setup in the category: the invalidation level is both clear and close, requiring discipline but offering rapid feedback. Relative strength versus SPY of 10.0% and category-relative strength of 0.0% are both respectable, and above-average volume participation at 1.45x the 20-week average confirms buyers are defending the pullback rather than allowing it to roll over. The 13-week return of 3.2% reveals positive price action over the intermediate term despite the recent pullback, and MACD remains bearish but the oversold stochastic RSI creates upside potential if the macro regime stabilizes. Runner-up XAR actually posts higher trend (71 vs. 67) and better technical evidence overall (68.0 vs. 47.5), but its timing score of 87.0 loses to ITA's 100.0 because XAR sits further from the 50-week at a deeper Fibonacci zone, making the setup less symmetric.
Defense & Aerospace earns 5% allocation as a tier-2 position, with a final category score of 51.1 supported primarily by macro tailwinds rather than technical lead. Defensive rotation adds 8 points, broad market bear adds 6 points, and dollar pressure adds 3 points, yielding a category-level macro fit of 68.0—the strongest macro reading among all tier-2 categories this week. ITA's technical evidence score of 47.5 is merely adequate, held back by momentum confirmation at 45.6 and volume-price confirmation at 40.0, indicating that while the setup is sound, the sector is not flooding with institutional demand. The allocation reflects a belt-and-suspenders approach to portfolio defense: precious metals (gold specifically) offer the pure hedge, while defense aerospace adds a rotation play that tends to perform during periods when growth is questioned and geopolitical risk remains elevated. To graduate to top-2, this category would need to break above the 112.95 resistance level on strong volume, signaling that the pullback was a healthy consolidation rather than the start of a deeper correction.
Industrial Metals — COPX
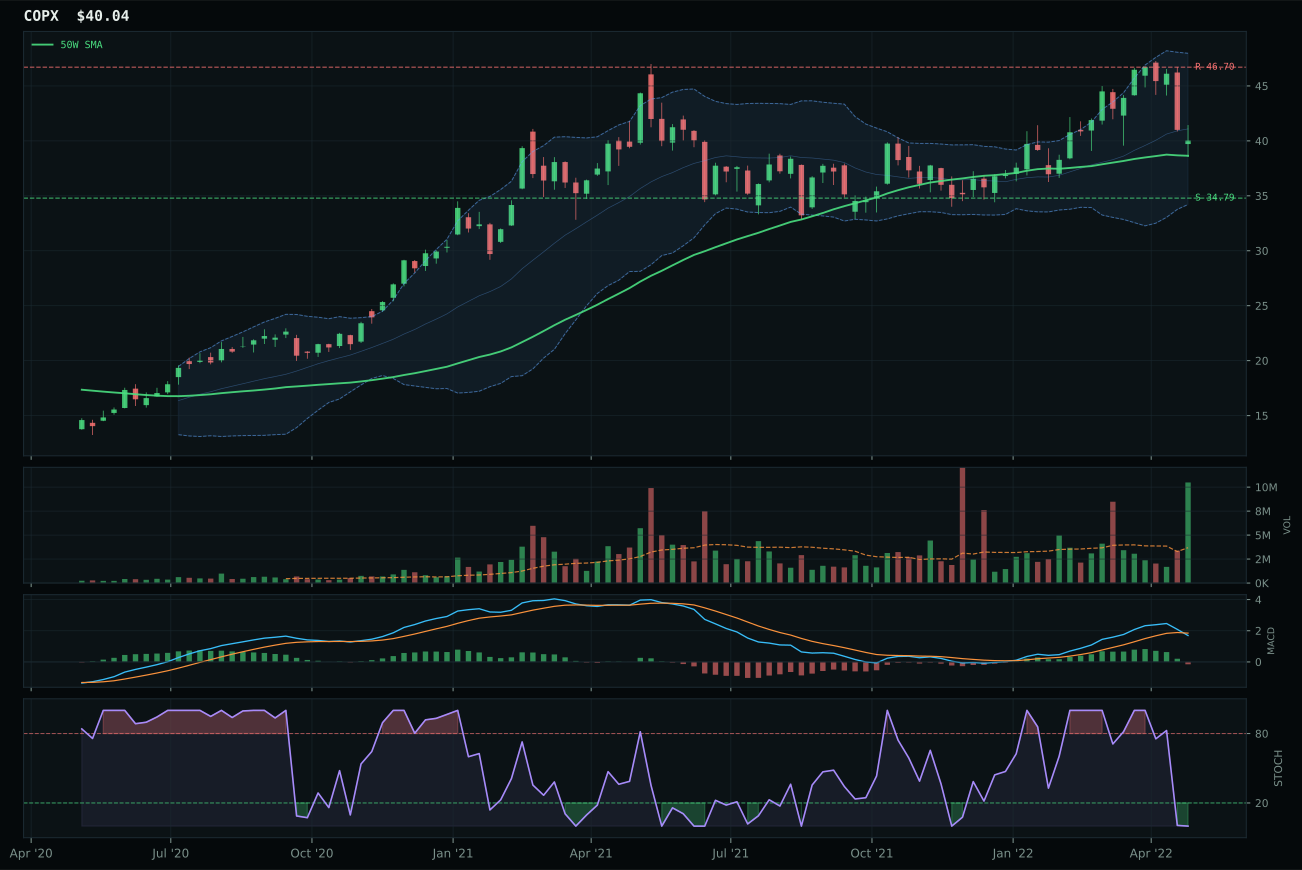
COPX has a neutral structure profile with 15.1% 13-week relative strength versus SPY.
A failed hold above support would weaken the setup.
Actionable but governed by invalidation levels.
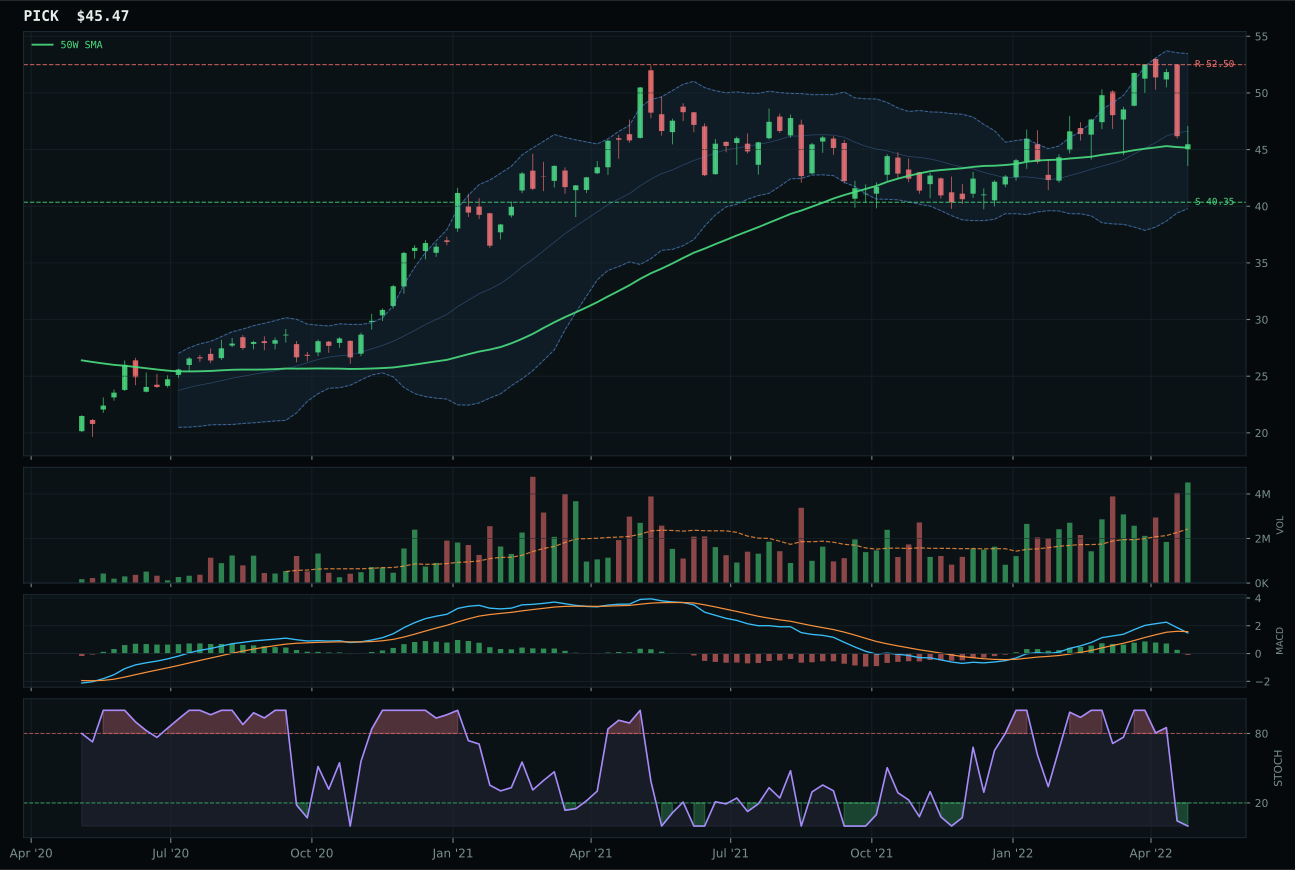
PICK has a compression near 50W profile with 14.2% 13-week relative strength versus SPY.
A failed hold above support would weaken the setup.
Actionable but governed by invalidation levels.
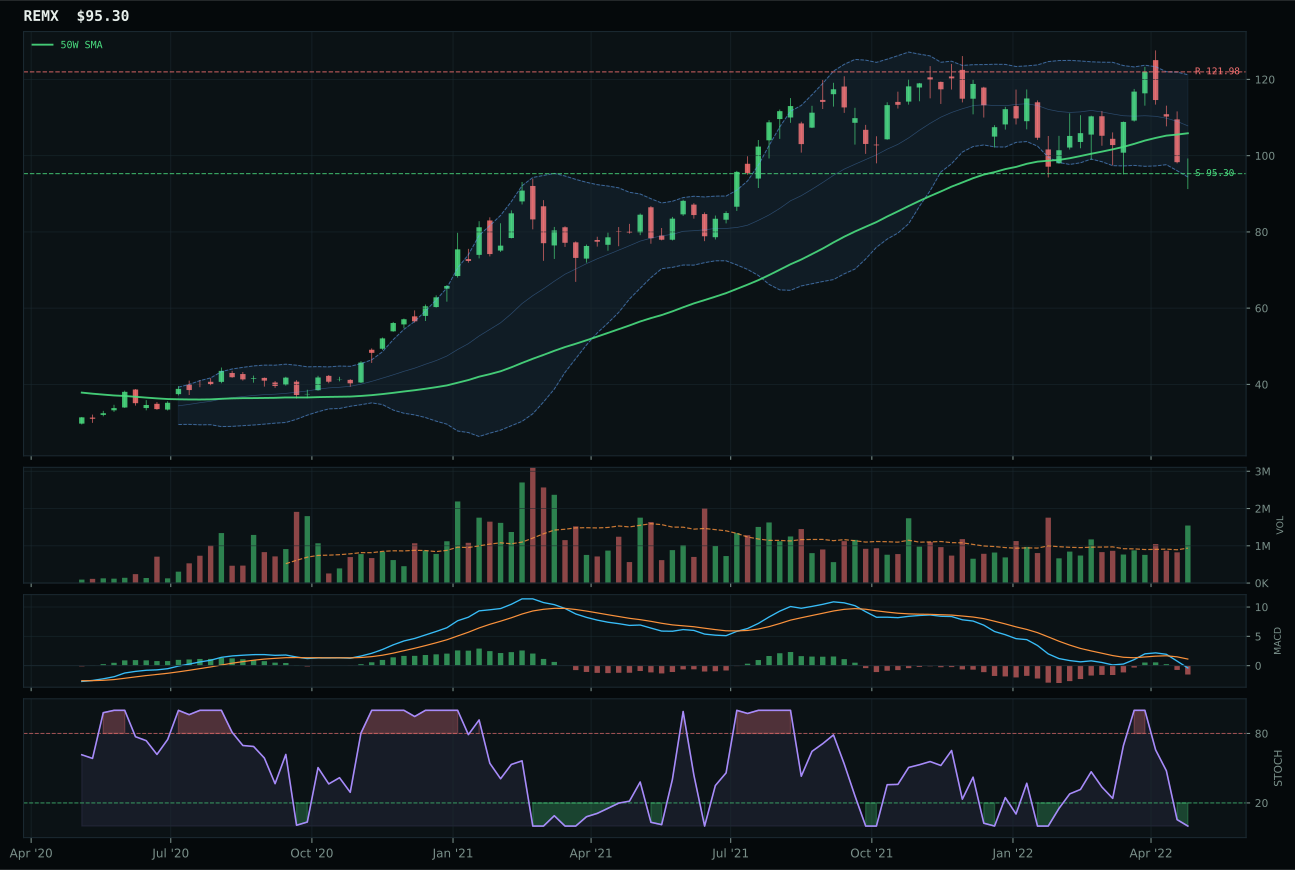
REMX has a pullback into support profile with 4.9% 13-week relative strength versus SPY.
A failed hold above support would weaken the setup.
Actionable but governed by invalidation levels.
COPX wins because it demonstrates the tightest proximity to the 50-week moving average at only -3.6% with stochastic RSI fully oversold at 0.00, creating a timing score of 92.0 and offering the cleanest mean-reversion setup in the category. While trend score of 82.0 reflects price above both the 50-week and 200-week with solid 15.1% relative strength versus SPY, the momentum confirmation languishes at 32.9 and volume-price confirmation at 30.9, revealing that the copper strength story is not yet receiving institutional sponsorship. Runner-up PICK shows identical trend score of 82.0 and actually reaches a perfect timing score of 100.0, but PICK's structure cleanliness of 68.1 trails COPX's 70.0, and more critically PICK's category-relative strength of 0.0% loses to COPX's 0.9%—a marginal but clear edge in proving that COPX is leading the category move. Distribution pressure in volume at 2.84x the 20-week average for COPX is elevated but acceptable given the setup's proximity to support and the macro case for copper scarcity.
Industrial Metals earns a tier-2 5% allocation despite weak technical evidence of 21.2 for the representative, justified entirely by category-level macro fit of 73.0 driven by metals scarcity at +14 points and commodity breadth positive at +10 points. The final score of 44.9 ranks this category in the middle of the portfolio, below agricultural, energy, and precious metals but above technology, AI, and emerging markets, reflecting a portfolio decision to maintain exposure to physical commodity scarcity without overcommitting to metals that lack the central-bank bid of gold. COPX's relative weakness on technical evidence (21.2 versus 75.0 for GLD) reveals the key tension: industrial metals are driven by supply-demand macro stories rather than clean technical setups, and this category allocation is truly a macro-driven conviction play. The placement at 5% rather than 10% reflects appropriate sizing discipline—the copper and mining thesis is real, but the technical evidence does not yet match the confidence level warranted to double the position. COPX would need to break above the 46.70 resistance level on strong volume while maintaining distribution pressure to prove that industrial users and refiners are accumulating, not merely hoping; such a confirmation would support raising allocation to match the macro conviction.
Technology — XLK
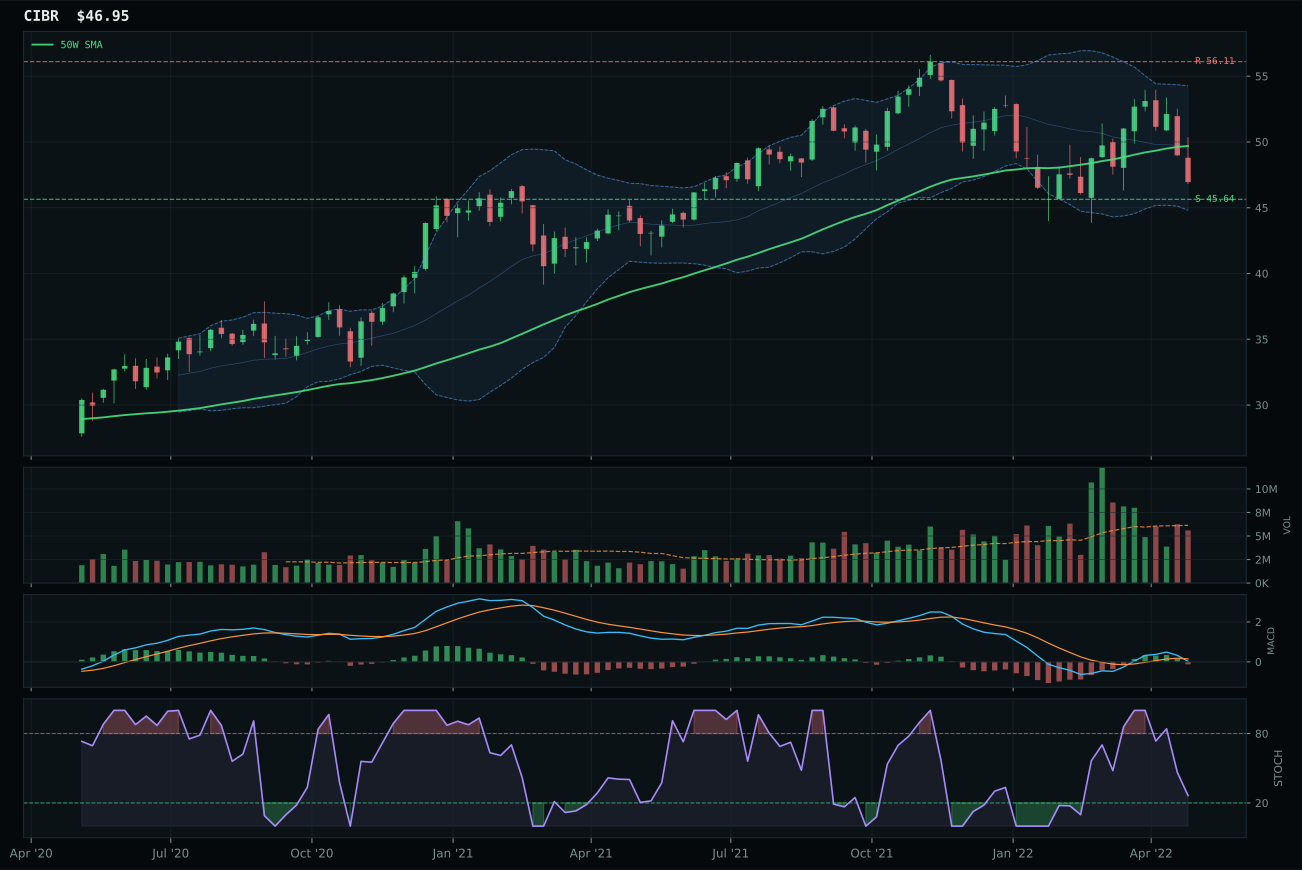
CIBR has a pullback into support profile with 9.6% 13-week relative strength versus SPY.
A failed hold above support would weaken the setup.
Actionable but governed by invalidation levels.
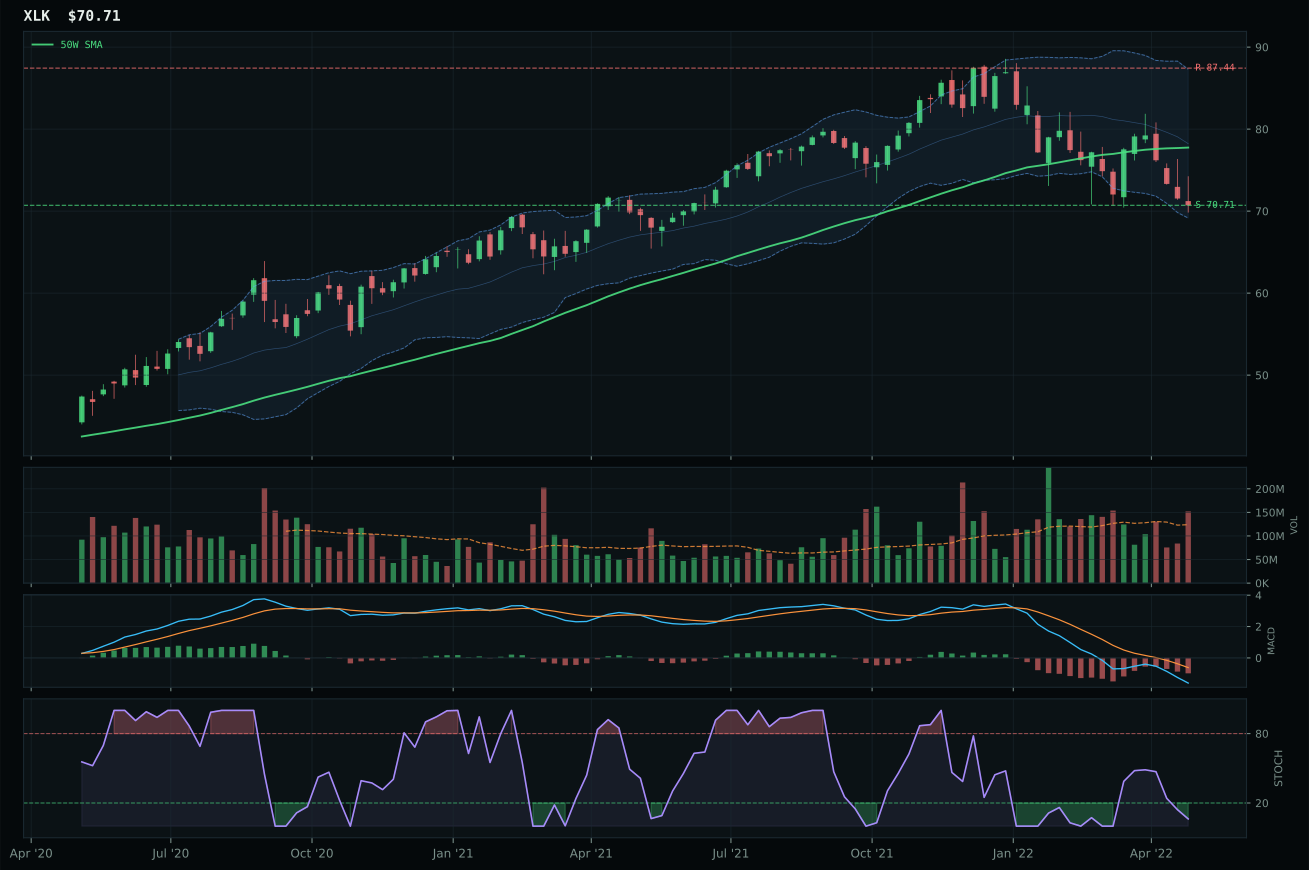
XLK has a pullback into support profile with -3.7% 13-week relative strength versus SPY.
A failed hold above support would weaken the setup.
Actionable but governed by invalidation levels.
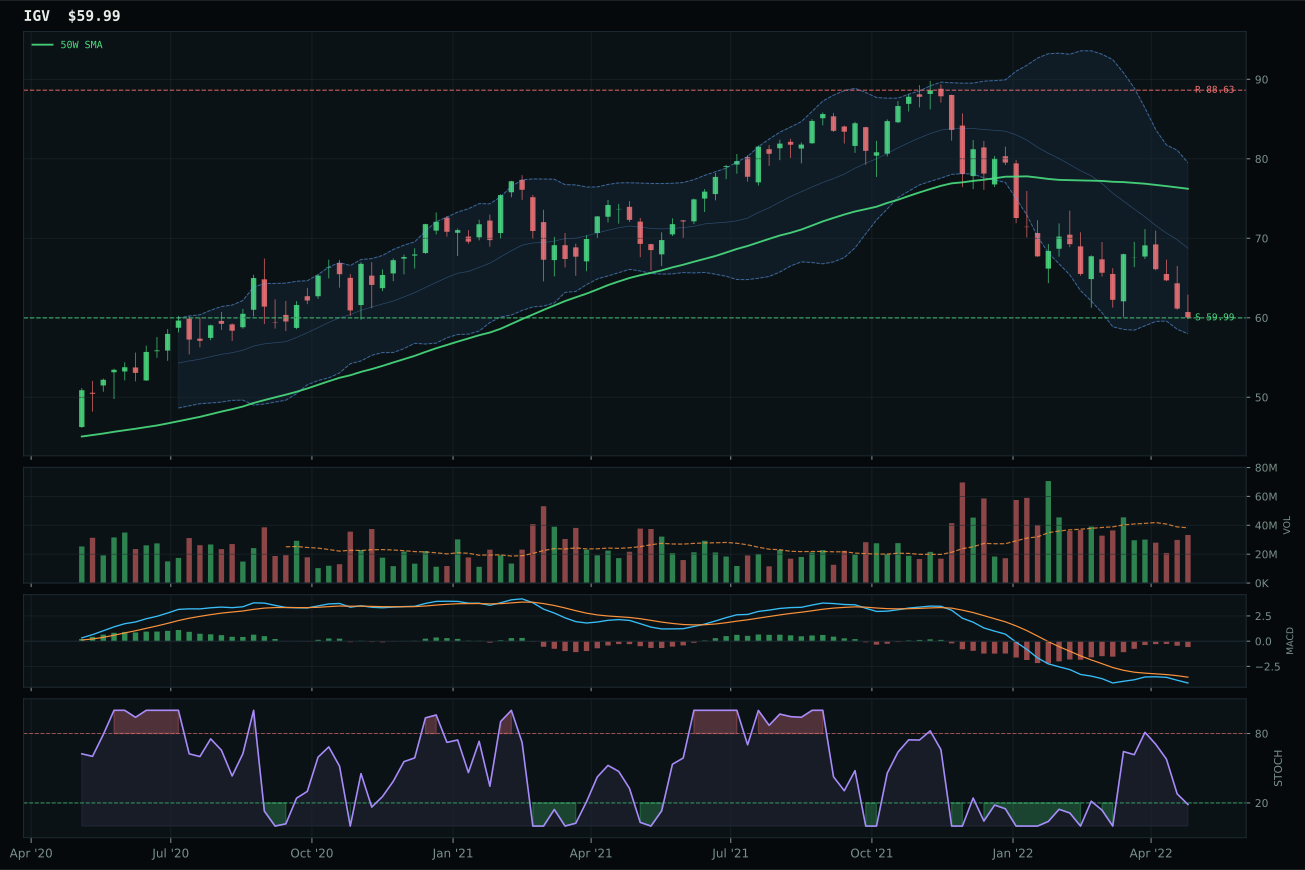
IGV has a pullback into support profile with -5.5% 13-week relative strength versus SPY.
A failed hold above support would weaken the setup.
Actionable but governed by invalidation levels.
XLK wins the category because it holds a defined pullback setup into support at 70.71 with above-average volume participation at 1.23x the 20-week average—a signal that accumulation, not mere bounce, is sponsoring the move. The 13-week return sits at -10.5%, placing it only marginally behind CIBR's 2.9%, but the critical difference is volume confirmation: CIBR shows neutral participation while XLK demonstrates active buyer interest at the lows. Relative strength versus SPY stands at -3.7%, identical category-relative strength to CIBR at 0.0%, but XLK's stochastic RSI is fully oversold at 0.06 versus CIBR's falling-neutral state, creating a cleaner technical invalidation level if support breaks. The timing score of 80.0 reflects a distance to the 50-week moving average of -9.1% and price sitting in the Fibonacci 0.786 repair zone near 52-week lows, positioning the setup as a mean-reversion candidate rather than a chase into overhead resistance.
Technology receives a tier-2 allocation of 5% this week, ranked below two higher-scoring categories but still eligible for a capital slot in a mixed macro regime. The category-level macro fit of 50.0 reflects conflicting forces: liquidity expansion adds 9 points but risk appetite broken and inflation pressure each subtract 4 to 5 points, creating net neutrality in the macro narrative. XLK's technical evidence score of 32.8 is dragged down by momentum confirmation at only 4.9 and volume-price confirmation at 25.2, meaning the setup is clean but lacks the institutional sponsorship that would justify overweighting. The broader portfolio context matters here: with energy, precious metals, and defense aerospace all offering stronger setups and more favorable macro tailwinds, technology holds its allocation as a position of managed exposure rather than conviction. To earn a top-2 slot, this category would need to demonstrate either sustained volume participation through a breakout of the 87.44 resistance level or a meaningful improvement in relative strength versus SPY that signals rotation back into growth after the recent decline.
AI — SMH
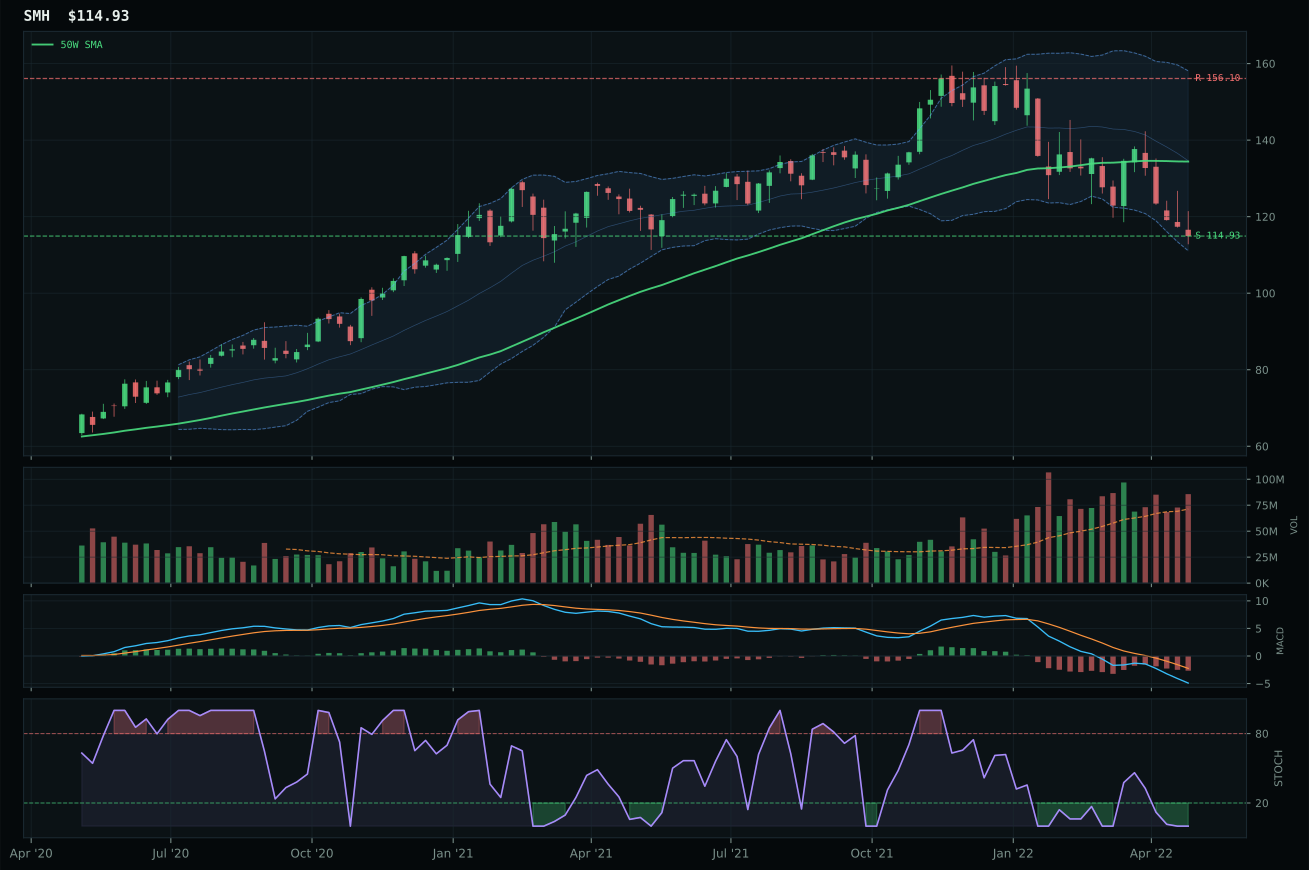
SMH has a pullback into support profile with -5.4% 13-week relative strength versus SPY.
A failed hold above support would weaken the setup.
Actionable but governed by invalidation levels.
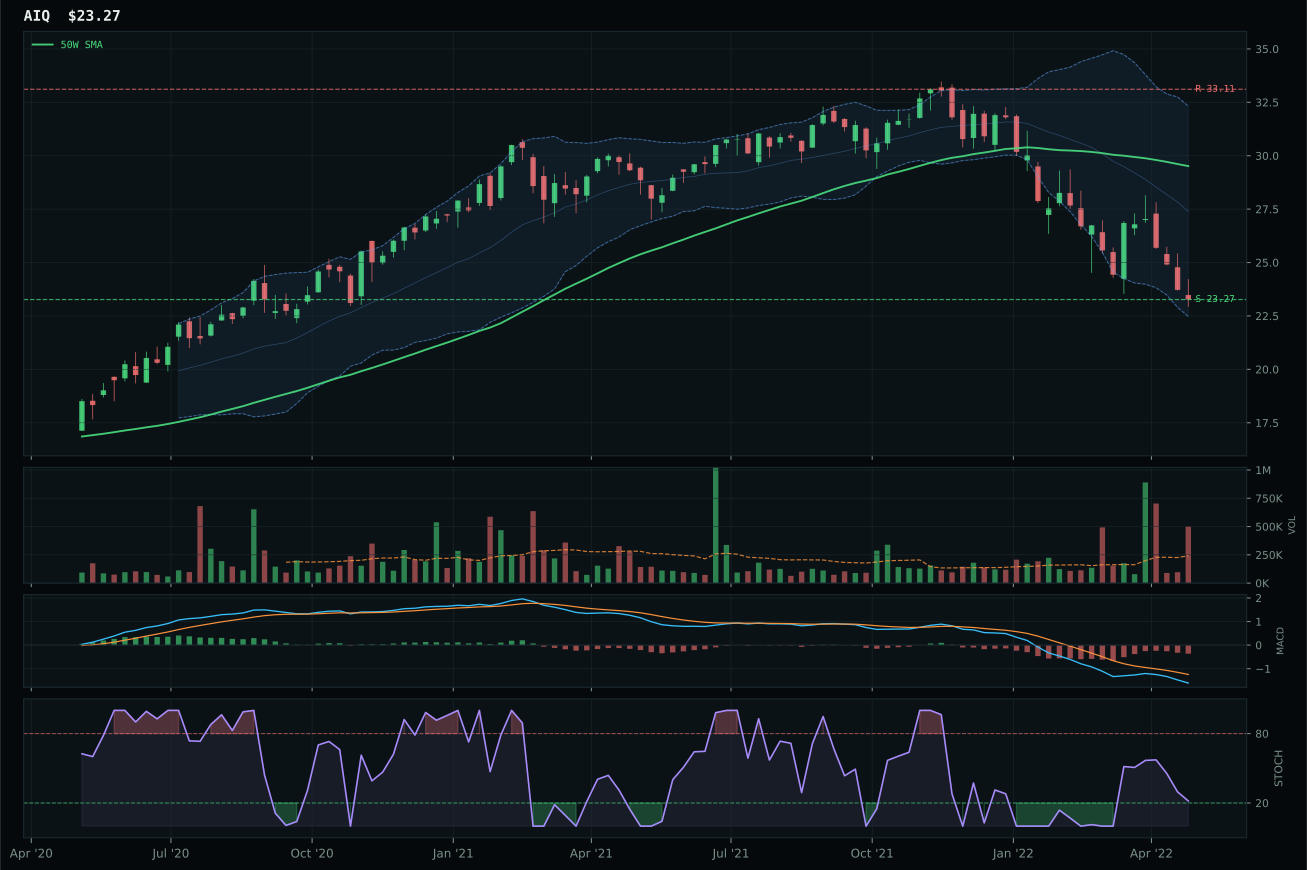
AIQ has a pullback into support profile with -8.7% 13-week relative strength versus SPY.
A failed hold above support would weaken the setup.
Tracked, but not top-2 eligible because: .
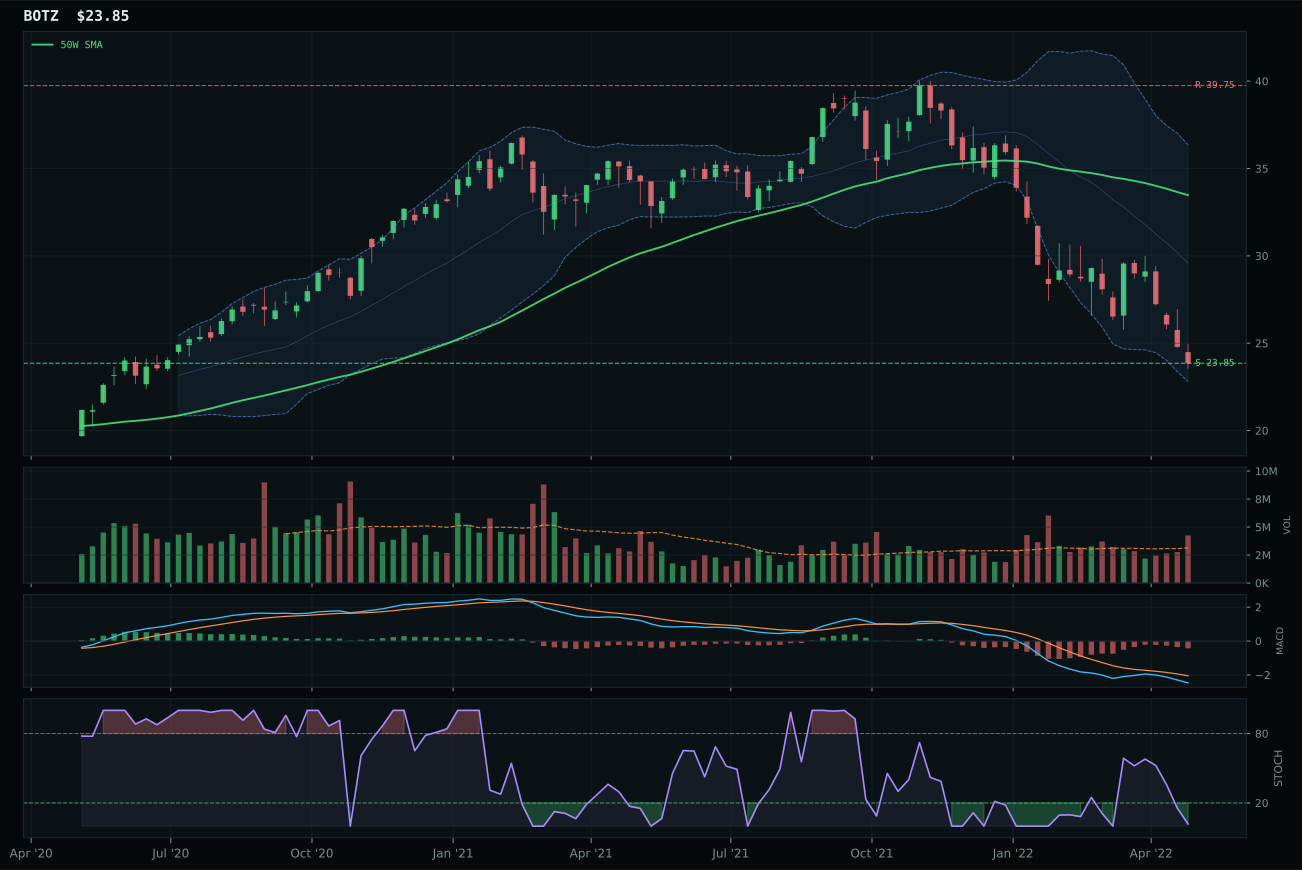
BOTZ has a pullback into support profile with -9.2% 13-week relative strength versus SPY.
A failed hold above support would weaken the setup.
Actionable but governed by invalidation levels.
SMH wins despite a weak overall category score because it shows the cleanest technical structure among three deteriorating choices: price sits below the 50-week but above the 200-week, establishing a pullback setup with defined support at 114.93 and above-average volume participation at 1.20x the 20-week average. The 13-week return of -12.2% and category-relative strength of 3.3% are both superior to AIQ's -15.5% and 0.0%, respectively, translating directly into higher momentum confirmation at 0.8 versus AIQ's 0.0. Stochastic RSI is fully oversold at 0.00, offering a clear invalidation level if buyers abandon defense of support. The risk-reward remains unfavorable at 75.0, with upside to resistance constrained to just 26.4% against 38.2% downside to support, but that asymmetry is the only risk metric available in a category where all three ETFs are breaking down.
AI is excluded entirely this week with 0% allocation, ranked 9th or 10th among the ten categories due to a final score of just 27.1 and category-level macro fit of only 48.0. The regime transition environment actively penalizes technology consumption plays: risk appetite broken subtracts 8 points while broad market bear subtracts another 8 points, overwhelming the 10 points of support from liquidity expansion. SMH's technical evidence score of 25.2 reflects how weak the technical case has become—trend 38.9, momentum 0.8, and volume-price confirmation at 20.4 all point to an unraveling sector. The setup is defensible on a mean-reversion basis if support at 114.93 holds, but the portfolio allocation system correctly identifies that capital deployed here competes directly with far superior opportunities in energy, gold, and defense where both technicals and macro winds are aligned. For AI to earn even a 5% tier-2 position next week, the category would need to demonstrate volume absorption at these lower levels combined with a meaningful reversal in relative strength versus SPY—currently the entire category is in distribution.
Emerging Markets — INDA
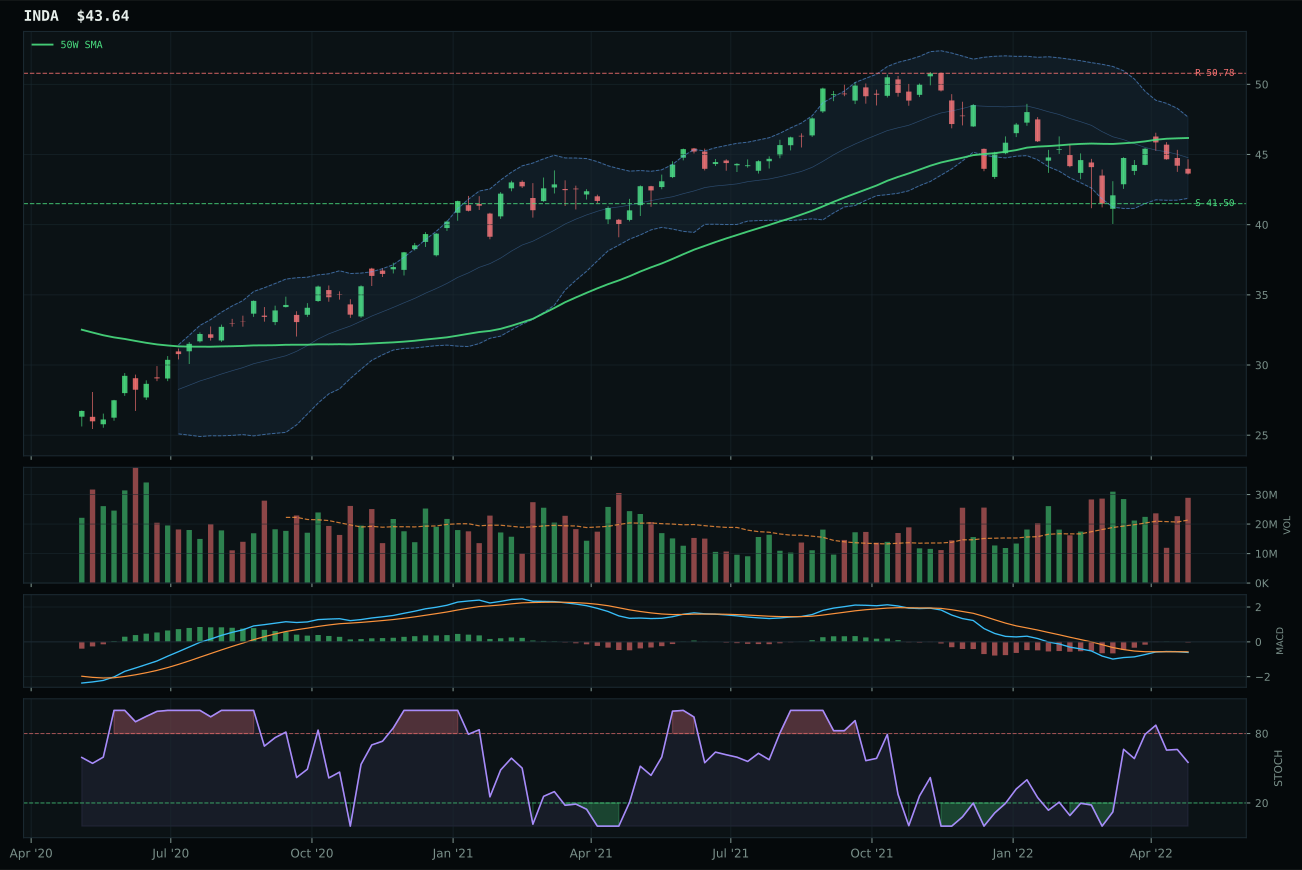
INDA has a neutral structure profile with 4.2% 13-week relative strength versus SPY.
A failed hold above support would weaken the setup.
Actionable but governed by invalidation levels.
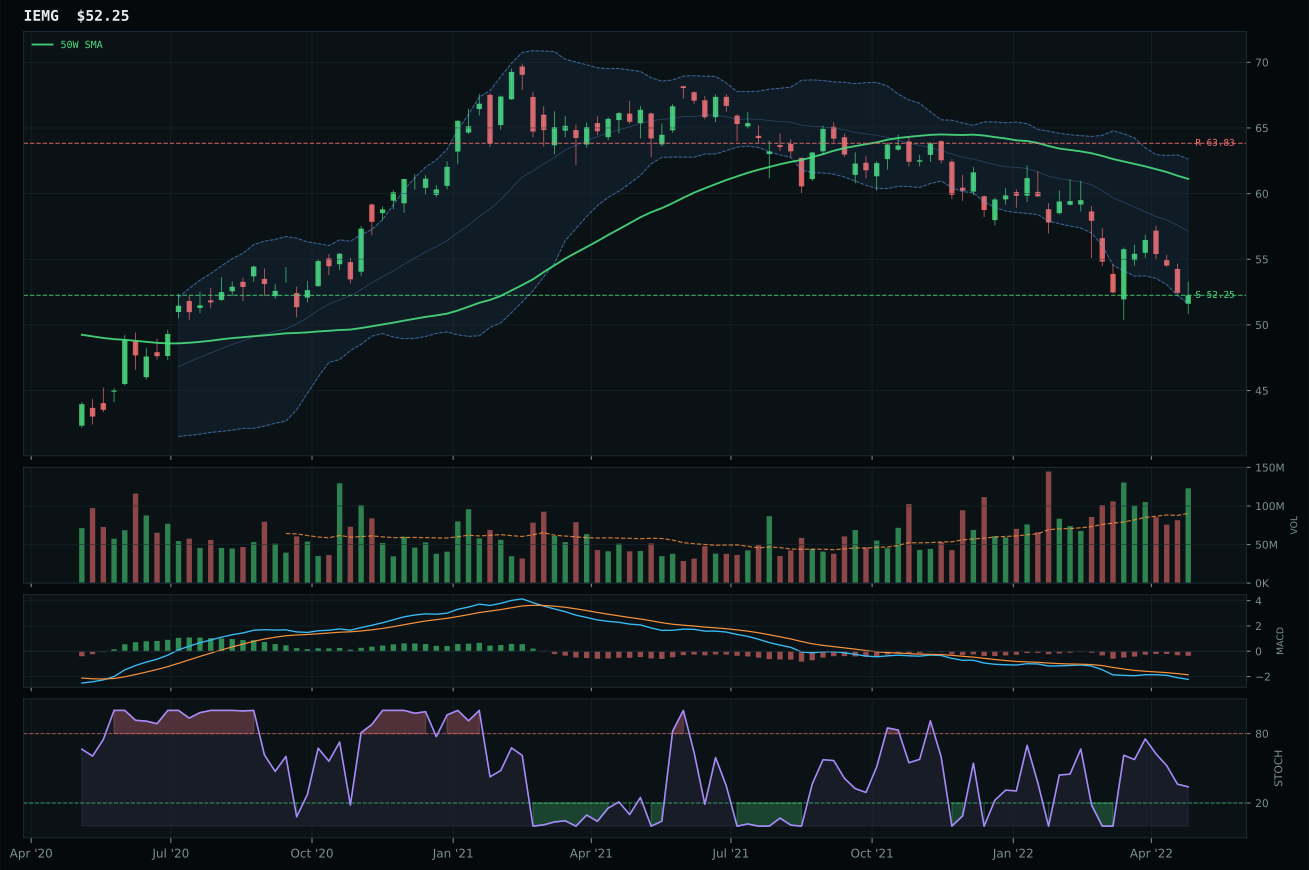
IEMG has a pullback into support profile with -2.8% 13-week relative strength versus SPY.
A failed hold above support would weaken the setup.
Actionable but governed by invalidation levels.
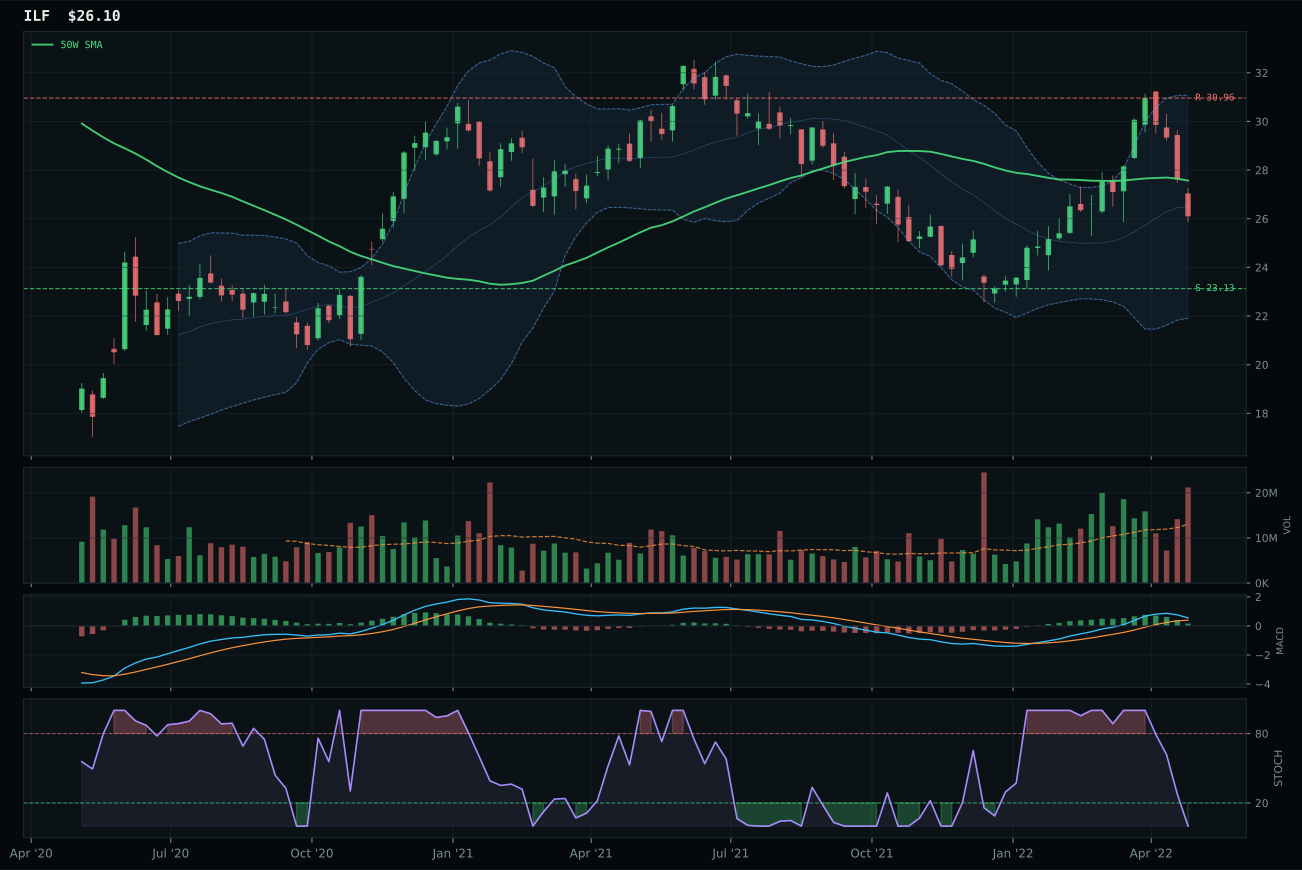
ILF has a neutral structure profile with 10.5% 13-week relative strength versus SPY.
Extension and support failure are the main tactical risks.
Tracked, but not top-2 eligible because: structurally broken.
INDA wins within a collapsing category because it displays the cleanest technical setup despite weak absolute scores: price sits -5.5% below the 50W in the deep retracement value zone at Fibonacci 0.618, with neutral structure providing 71.5 structure score and 82.0 timing score. The 13-week return of -2.6% versus IEMG's -9.6% and the -7.0% category-relative weakness in IEMG create a clear proof of INDA's relative leadership. Risk-reward reaches 98.0 for INDA, the highest in the category, with 5.2% downside to support versus 14.1% upside to resistance—a 2.7-to-1 asymmetry favoring bulls if the mean reversion story holds. Runner-up ILF shows higher RS versus SPY at 10.5% versus INDA's 4.2%, but ILF's setup is neutral structure with distribution pressure in volume, whereas INDA holds above-average participation confirming that the -2.6% return is being accumulated.
Emerging Markets is entirely excluded at 0% allocation, ranked 9th or 10th with a final score of just 13.1 and category-level macro fit of only 35.0. Dollar pressure subtracts 14 points, broad market bear subtracts 9 points, and liquidity expansion adds only 8 points—a 15-point net macro headwind that eliminates any case for capital commitment. INDA's technical evidence of 64.9 would ordinarily qualify for a 5% tier-2 position in isolation, but the portfolio correctly identifies that emerging markets are the lowest-conviction category given the current regime: US dollar strength, accelerating Fed tightening, and flight to quality all create structural headwinds that no 5% upside bounce from oversold levels can overcome. The category tier-2 candidates (INDA and ILF) are adequate as tactical trades if dollar weakness reverses abruptly, but the allocation system appropriately assigns zero capital until either the macro descriptor checklist removes the dollar pressure headwind or emerging-market relative strength rebounds above 0% versus SPY. For EM to earn even 5% allocation, the portfolio would require either a substantial dollar reversal, a Fed pause, or a 3-5 week consolidation in INDA that builds a higher-conviction accumulation pattern—none of which are currently visible.