
2022-04-22
Informational purposes only. The content in this report, including allocations, analysis, and commentary, is provided solely for informational and educational purposes. It does not constitute financial advice, investment advice, trading advice, or any other type of advice. Past performance does not guarantee future results. Always conduct your own research and consult a qualified financial professional before making investment decisions.
XLE defensive overlay excluded: price is below its 8W SMA. Cause selector will use GLD or cash alternative.
GLD defensive overlay excluded: price is below its 8W SMA. Cause selector will use cash alternative.
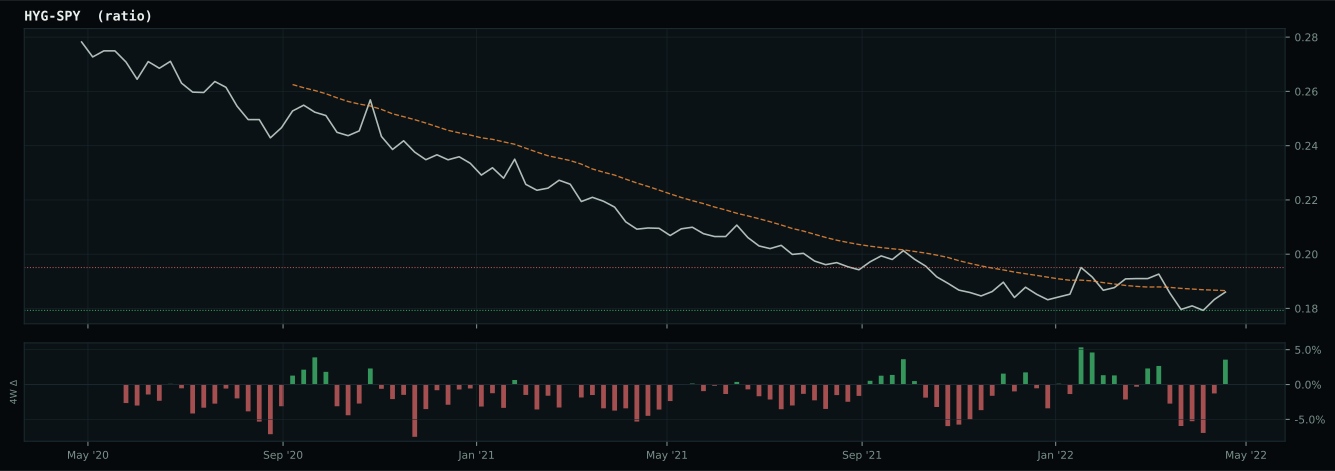
Macro risk engine requires the 50% Defensive overlay for this run; payload selected by cause: Transition Defense.
Weekly Allocation
| Ticker | Category | Weight | Role |
|---|---|---|---|
| SGOV | 20% | Overlay | |
| GLD | Precious Metals | 25% | Overlay |
| XLU | Utilities & Infrastructure | 20% | Overlay |
| XLE | Traditional Energy | 10% | Top-2 (10%) |
| WEAT | Agriculture & Livestock | 5% | Tier-2 (5%) |
| ITA | Defense & Aerospace | 5% | Tier-2 (5%) |
| URNM | Nuclear Energy | 5% | Tier-2 (5%) |
| COPX | Industrial Metals | 5% | Tier-2 (5%) |
| CIBR | Technology | 5% | Tier-2 (5%) |
Trade Instructions — Monday Open
Sell the tranche from 2022-03-25 (completing its 4-week hold). Buy the new tranche. Instructions show net portfolio changes — same-asset positions cancel, weight changes show the delta.
| Action | Ticker | Instruction |
|---|---|---|
| SELL | XLE | Sell 20% of XLE position (reduce 50.00% → 40.00%) |
| SELL | WEAT | Sell 50% of WEAT position (reduce 2.50% → 1.25%) |
| SELL | XOP | Sell 25% of XOP position (reduce 10.00% → 7.50%) |
| SELL | XAR | Sell 50% of XAR position (reduce 2.50% → 1.25%) |
| BUY | GLD | Buy GLD — 33.33% of freed cash (adds 5.00% to portfolio) |
| BUY | XLU | Buy XLU — 25.00% of freed cash (adds 3.75% to portfolio) |
| BUY | ITA | Buy ITA — 8.33% of freed cash (adds 1.25% to portfolio) |
| BUY | SGOV | Buy SGOV — 33.33% of freed cash (adds 5.00% to portfolio) |
Current Portfolio After Trade
Combined holdings across all 4 active tranches. Each tranche is 25% of the portfolio.
| Ticker | % of Portfolio | Weight Bar |
|---|---|---|
| XLE | 40.00% | |
| GLD | 10.00% | |
| XOP | 7.50% | |
| XLU | 7.50% | |
| URNM | 5.00% | |
| SGOV | 5.00% | |
| CIBR | 3.75% | |
| MOO | 3.75% | |
| ITA | 3.75% | |
| COPX | 2.50% | |
| REMX | 2.50% | |
| VEGI | 2.50% | |
| XAR | 1.25% | |
| IGF | 1.25% | |
| ILF | 1.25% | |
| SLV | 1.25% | |
| WEAT | 1.25% |
Macro Regime — Late-Cycle Reflation
growth data is not confirming the weak market-implied risk appetite signal
Defensive overlay cause is not singular enough to concentrate: the sleeve diversifies across liquidity, monetary defense, and defensive equity exposure while the market resolves the next regime.
Macro Evidence Charts
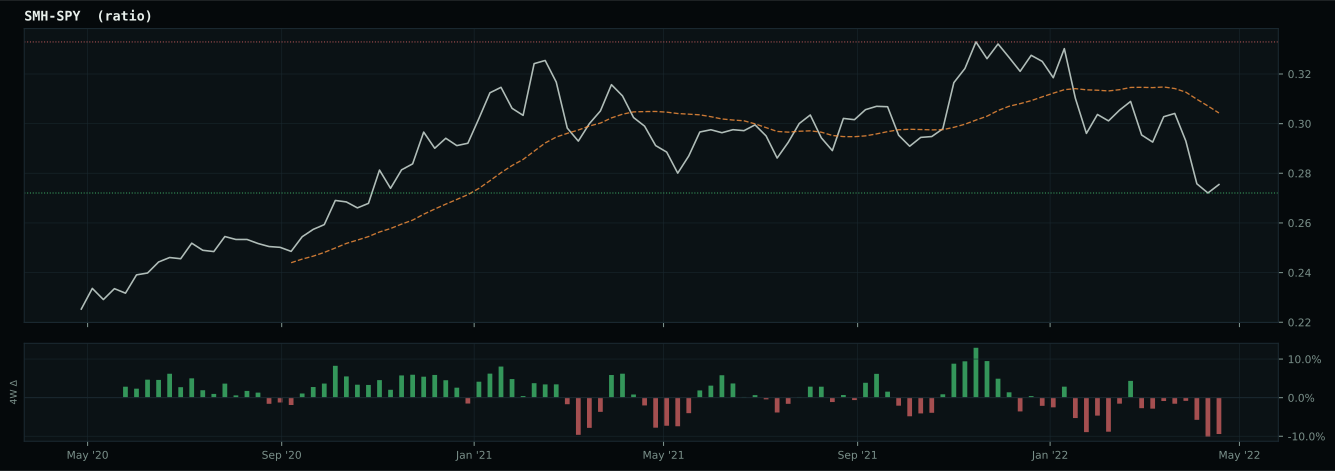
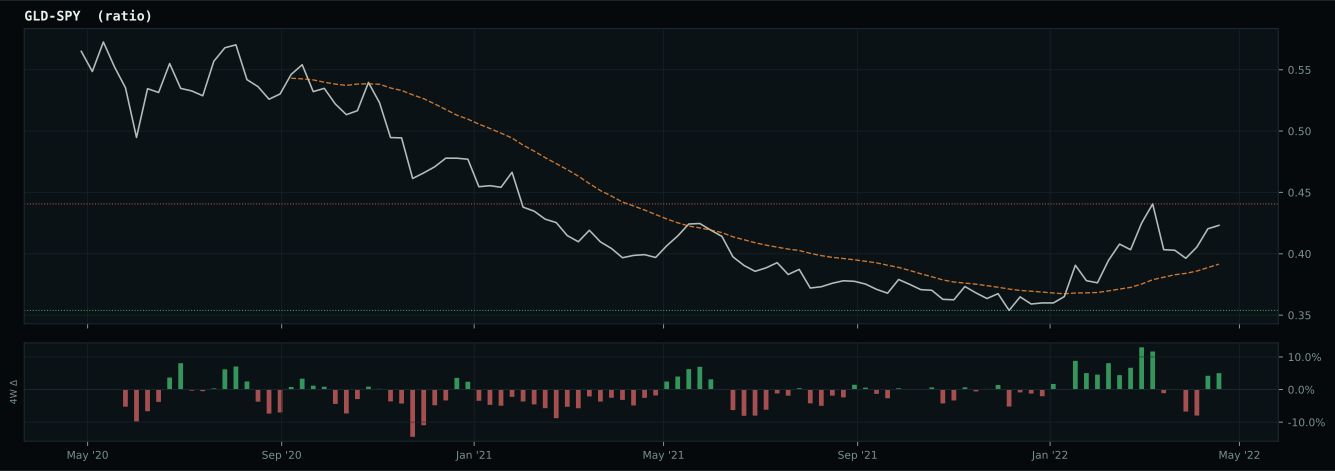
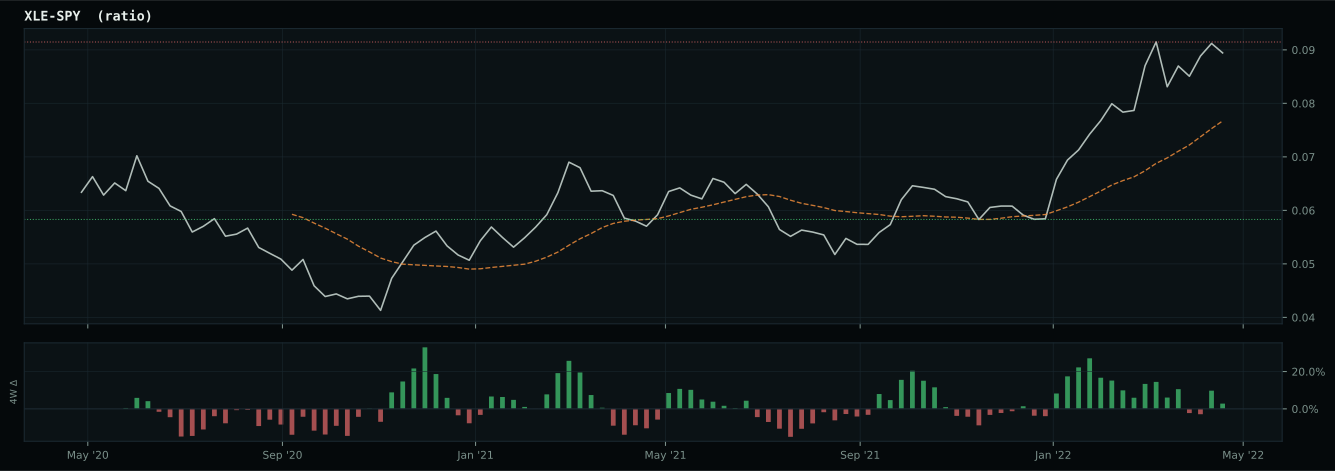
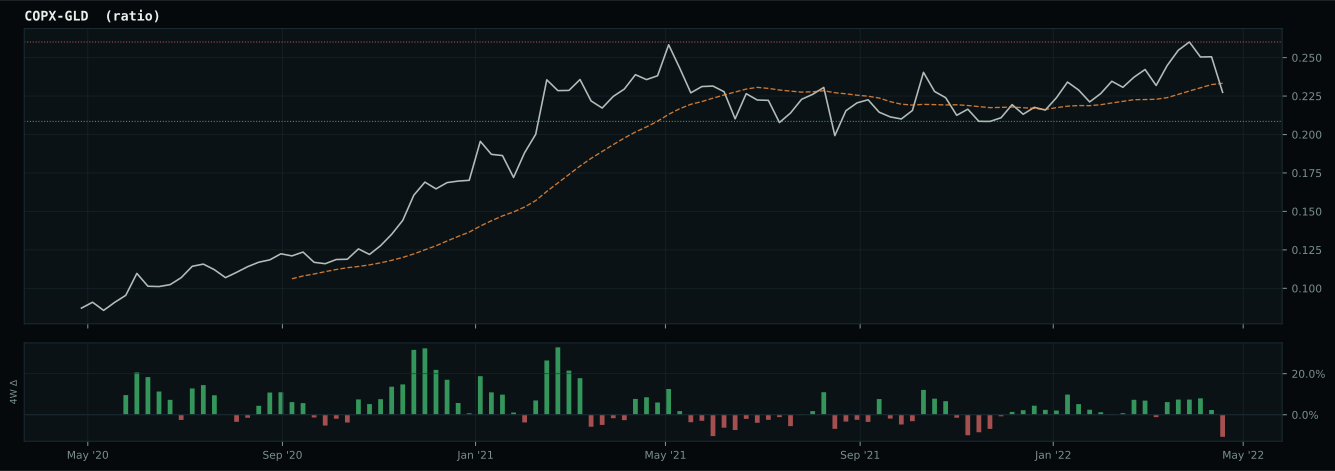
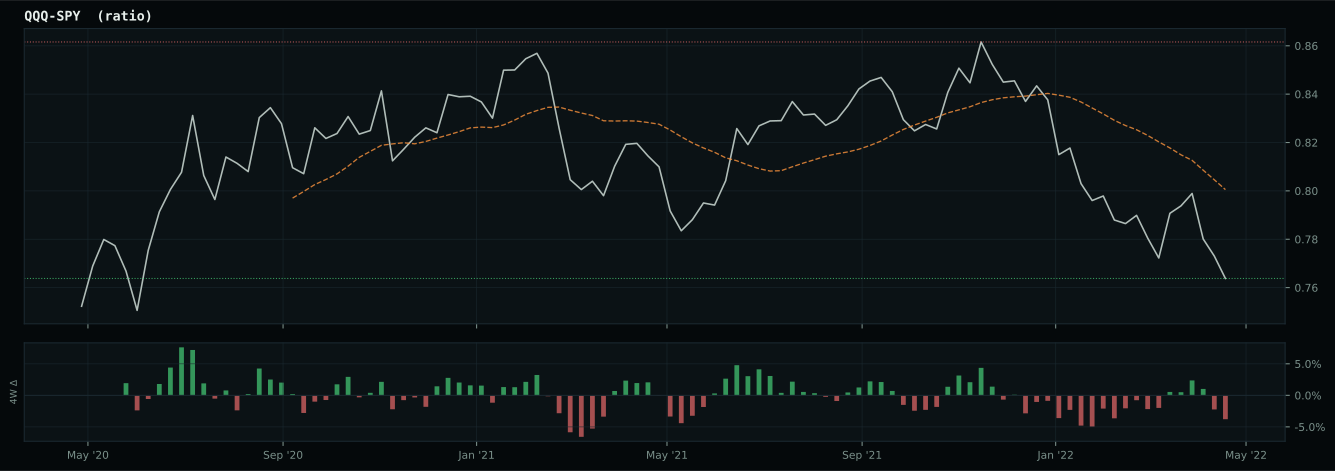
Market-implied signals behind the macro regime scores. Each ratio compares two assets; the direction and slope of the ratio is what the macro engine reads.
Crypto Regime — NoCrypto
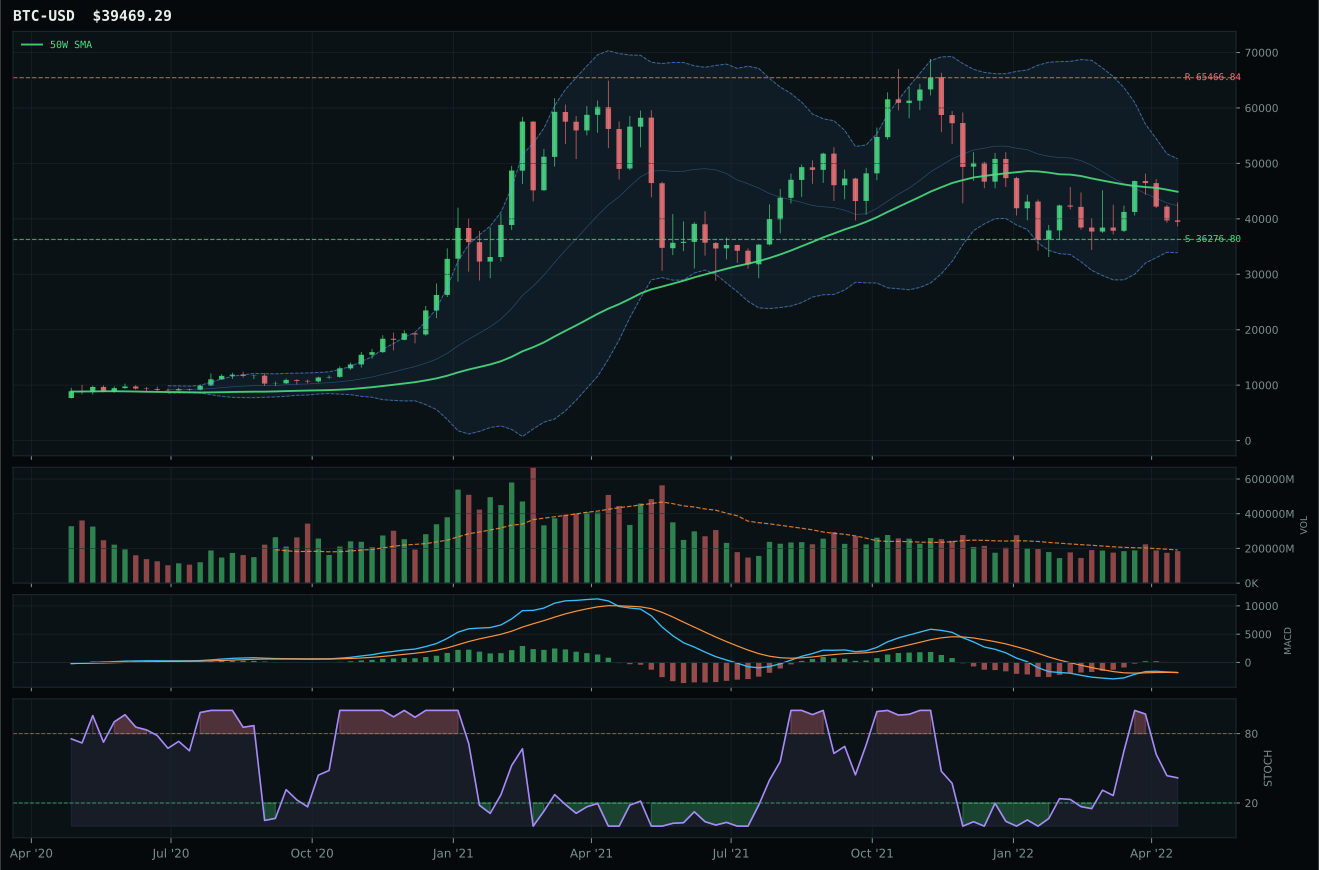
ValueBTC not armed: BTC has not made the first post-breakdown touch of the 200W buy zone after losing the 50W
TrendBTC not confirmed
one or more available conditions failed
Category Rankings
| Rank | Category | Winner | Score | Alloc | 4W Ret | Peers (4W) |
|---|---|---|---|---|---|---|
| 1 | Traditional Energy | XLE | 78.5 | 20% | +12.11% | FCG +6.4% · XOP +7.4% |
| 2 | Precious Metals | GLD | 69.2 | 20% | -2.28% | GDX -8.0% · SLV -7.3% |
| 3 | Utilities & Infrastructure | XLU | 68.3 | 10% | -2.62% | IGF +0.2% · PAVE -7.8% |
| 4 | Agriculture & Livestock | WEAT | 64.0 | 10% | +10.43% | VEGI -6.0% · MOO -5.8% |
| 5 | Defense & Aerospace | ITA | 62.1 | 10% | -9.86% | XAR -12.3% · ROKT -7.3% |
| 6 | Nuclear Energy | URNM | 50.6 | 10% | -14.46% | URA -10.9% · NLR -2.7% |
| 7 | Industrial Metals | COPX | 49.4 | 10% | -1.94% | PICK -2.2% · REMX +3.4% |
| 8 | Technology | CIBR | 17.0 | 10% | -16.41% | IGV -8.6% · XLK -7.7% |
| 9 | Emerging Markets | IEMG | 4.8 | 0% | -1.09% | INDA -6.5% · ILF +2.0% |
| 10 | AI | SMH | 4.0 | 0% | -2.51% | AIQ -7.7% · BOTZ -6.9% |
Traditional Energy — XLE
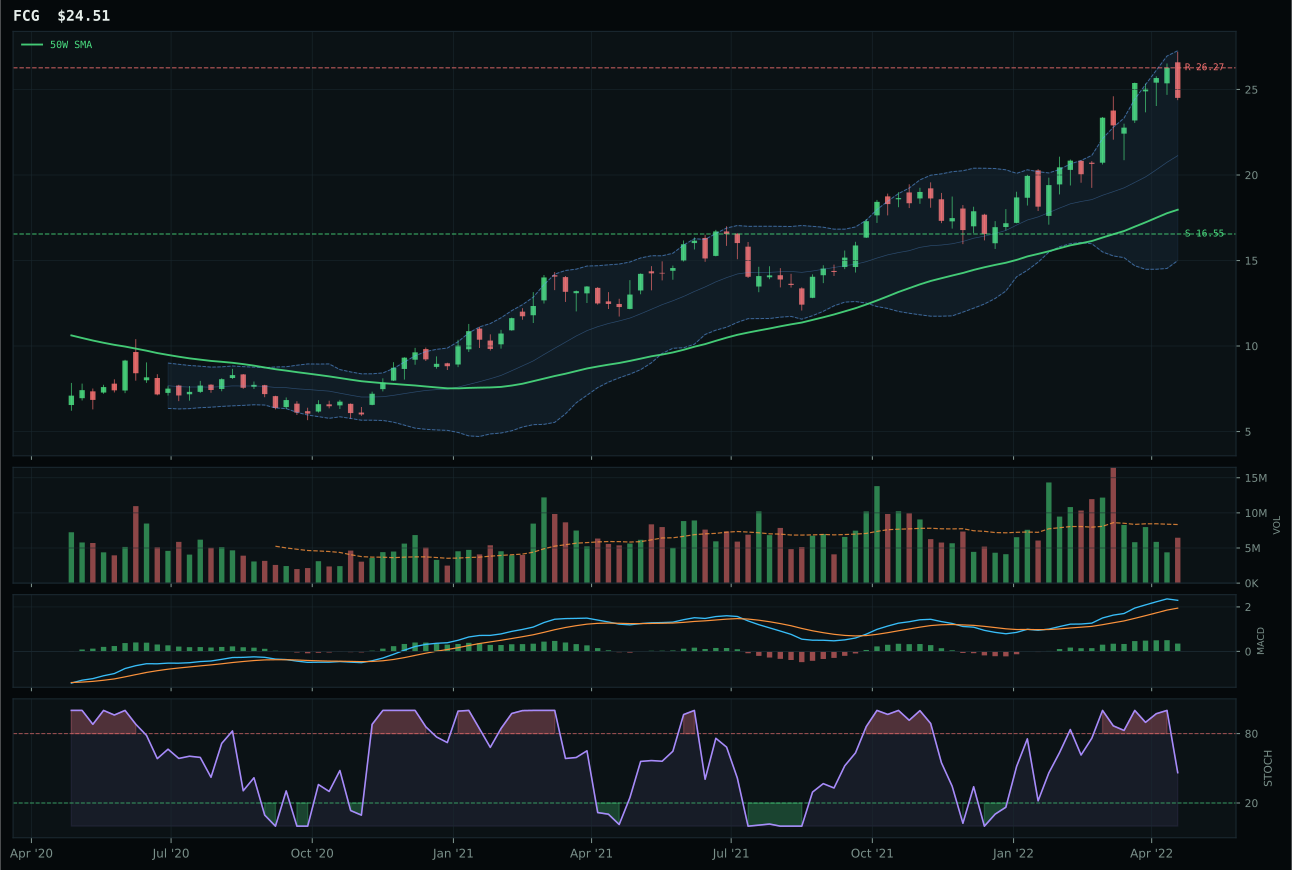
FCG has a vertical extension profile with 37.8% 13-week relative strength versus SPY.
A failed hold above support would weaken the setup.
Actionable but governed by invalidation levels.
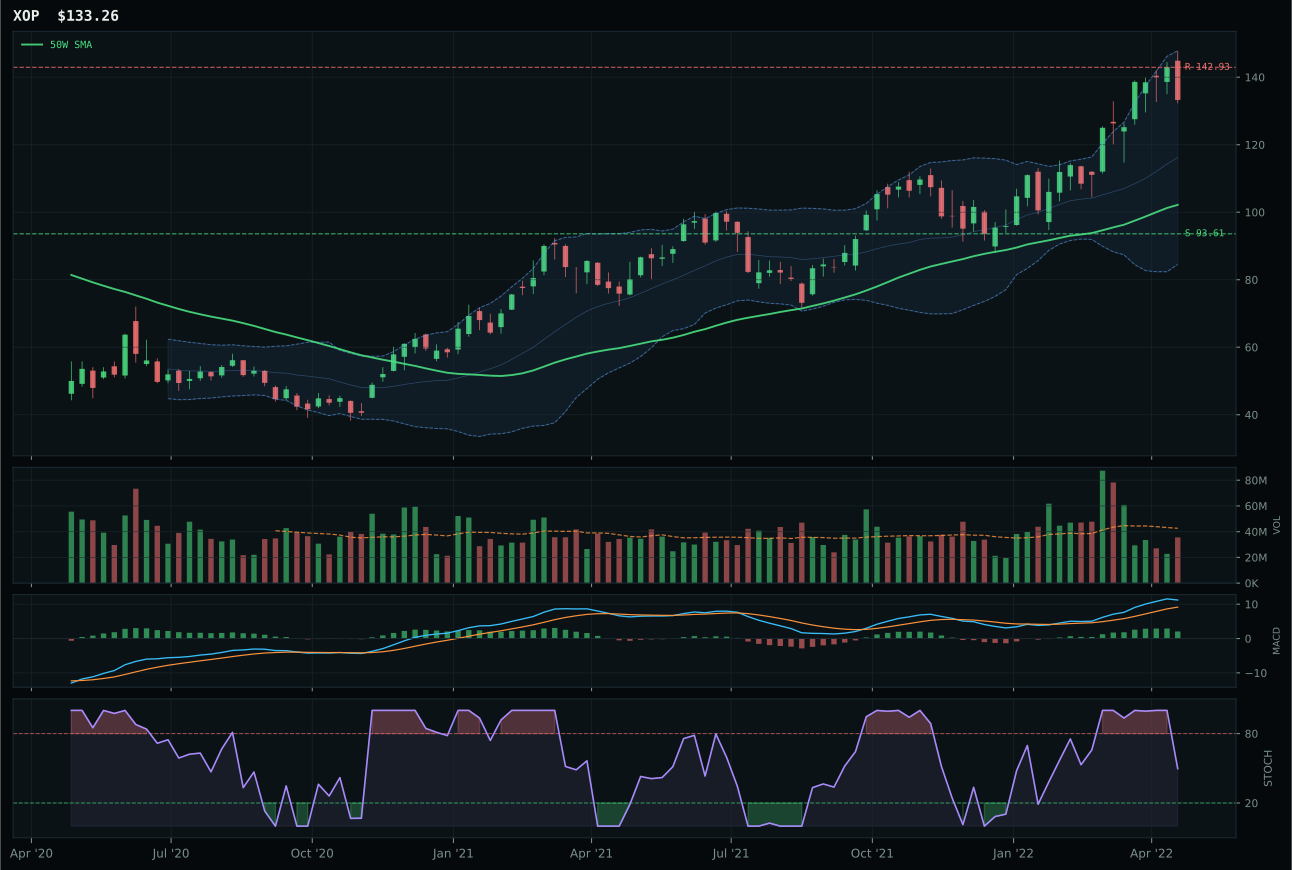
XOP has a vertical extension profile with 35.3% 13-week relative strength versus SPY.
A failed hold above support would weaken the setup.
Actionable but governed by invalidation levels.
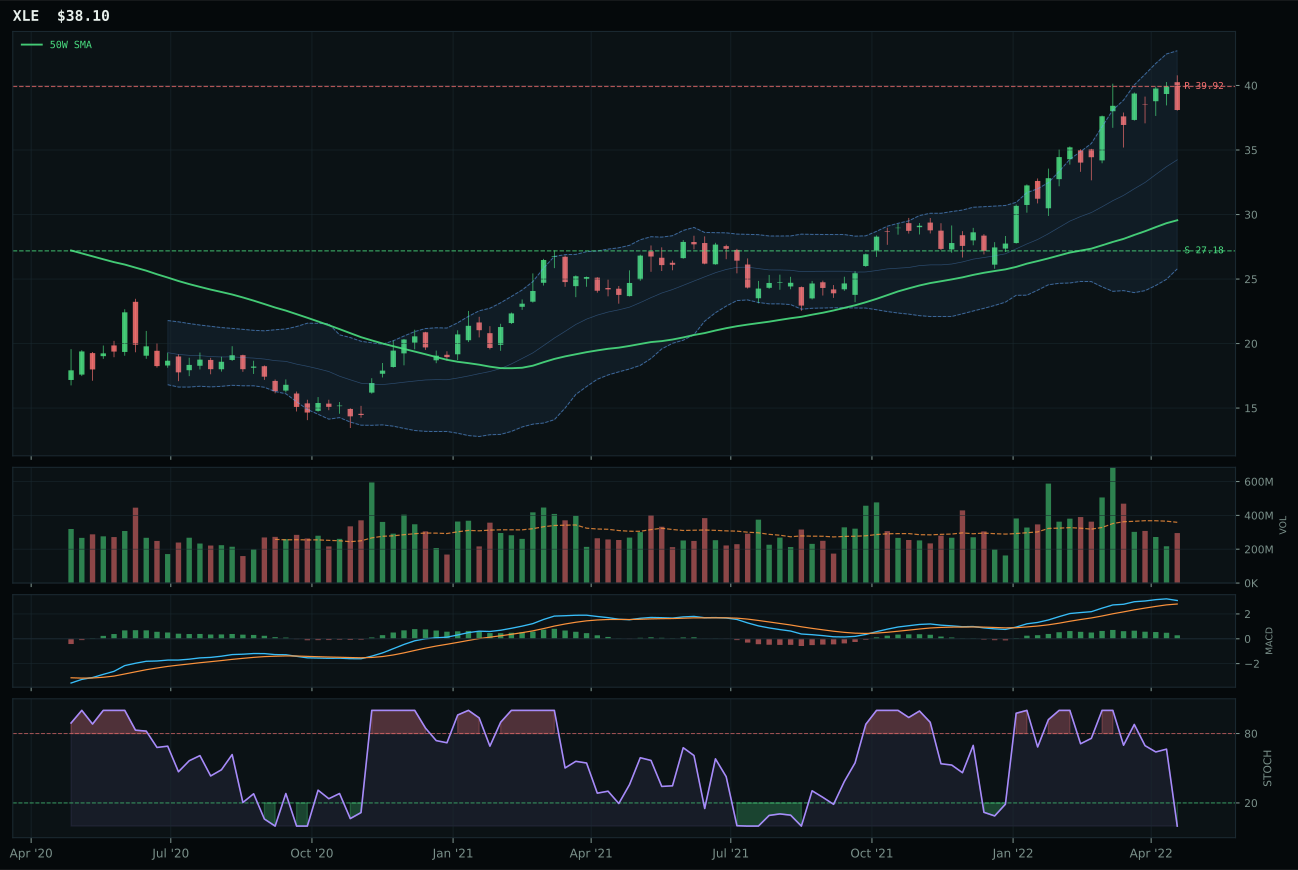
XLE has a vertical extension profile with 24.7% 13-week relative strength versus SPY.
A failed hold above support would weaken the setup.
Actionable but governed by invalidation levels.
XLE wins Traditional Energy and earns top-2 allocation despite extension risk because it combines flawless trend conviction (100.0/100) with the most defensible structural approach among extended plays. Price sits 28.9% above the 50-week with 24.7% RS versus SPY and 22.0% 13-week return—undeniably extended, but XLE avoids the even-greater extension of FCG (36.4% distance from 50W, 37.8% RS versus SPY) and controls risk/reward better (47.0 versus 32.5). FCG's stochastic RSI sits in falling/neutral territory versus XLE's oversold condition, which in an extended setup is technically preferable because it suggests near-term volatility compression rather than ongoing distribution. XLE's momentum confirmation of 97.3/100 is driven by persistent 13-week strength despite four-week weakness, a pattern that signals structural demand rather than momentum fade.
Traditional Energy receives 10% allocation as the highest-ranked category at 78.5, driven by a macro fit of 90.0/100 that includes energy scarcity (+16), inflation pressure (+10), supply shortage (+9), late-cycle reflation (+12), and real-asset sponsorship (+7). This is the portfolio's strongest macro tailwind, and it justifies overweighting despite extension risk. XLE's technical evidence of 57.3/100 is notably lower than some tier-2 peers because the 48.0/100 timing score reflects the 28.9% distance from 50W and oversold stochastic RSI—both suggesting limited upside without pullback reset. However, the category's macro conviction is sufficient to override extension concerns: energy supply constraints are structural, not cyclical, and the late-cycle reflation regime benefits inflation-hedge positioning. This allocation is defensive-real-asset-driven rather than growth-momentum-driven, and it remains appropriate as long as energy-scarcity narratives persist.
Precious Metals — GLD
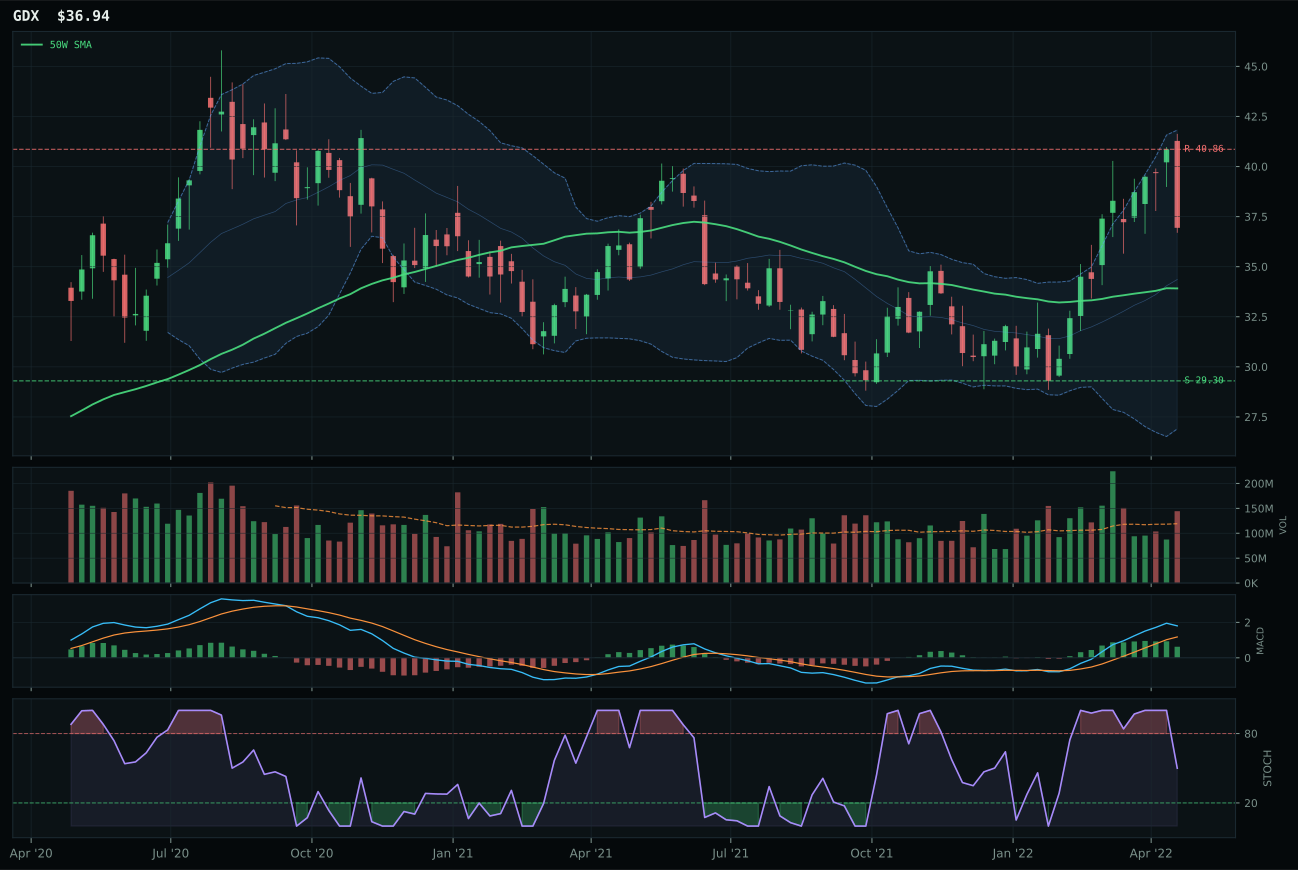
GDX has a neutral structure profile with 19.4% 13-week relative strength versus SPY.
A failed hold above support would weaken the setup.
Actionable but governed by invalidation levels.
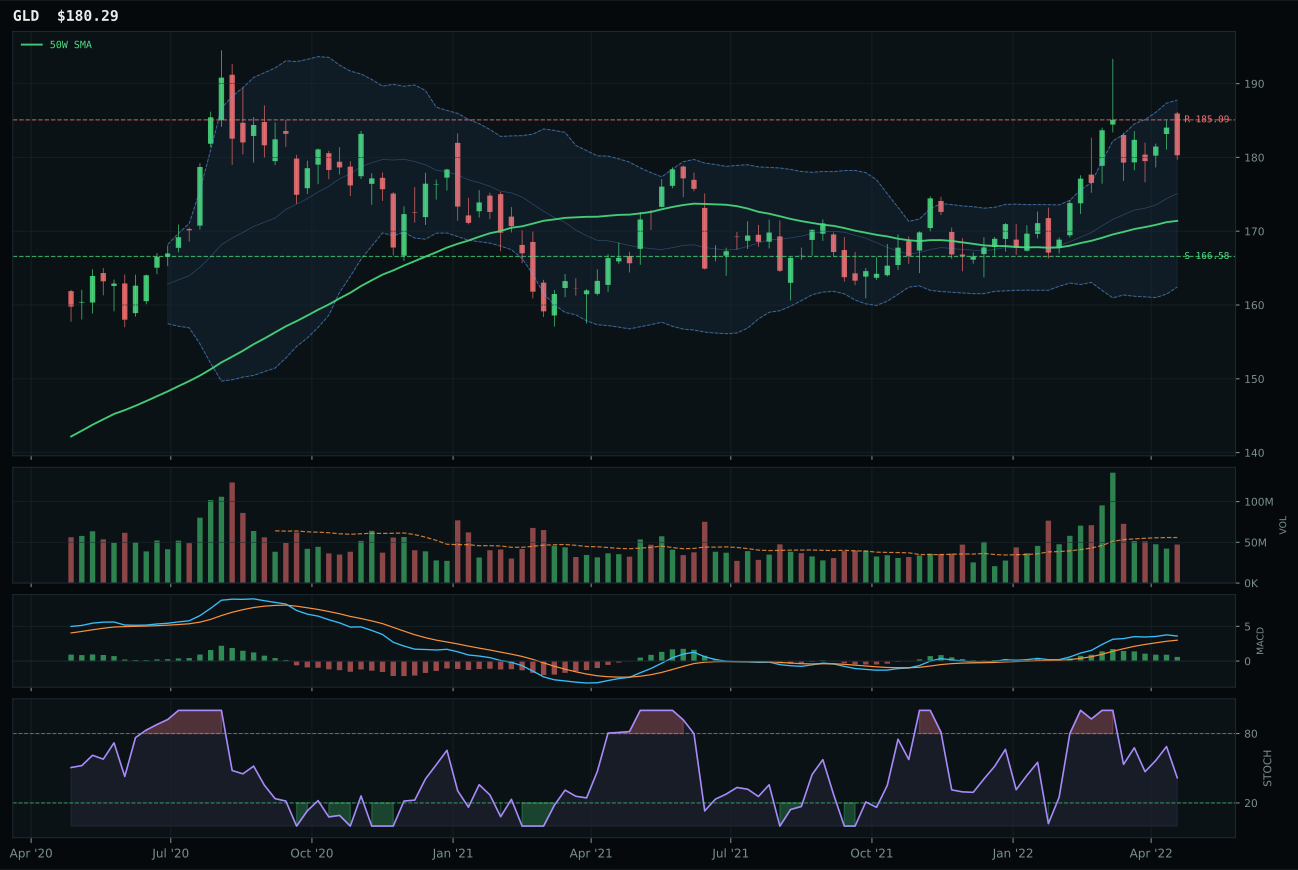
GLD has a neutral structure profile with 8.1% 13-week relative strength versus SPY.
A failed hold above support would weaken the setup.
Actionable but governed by invalidation levels.
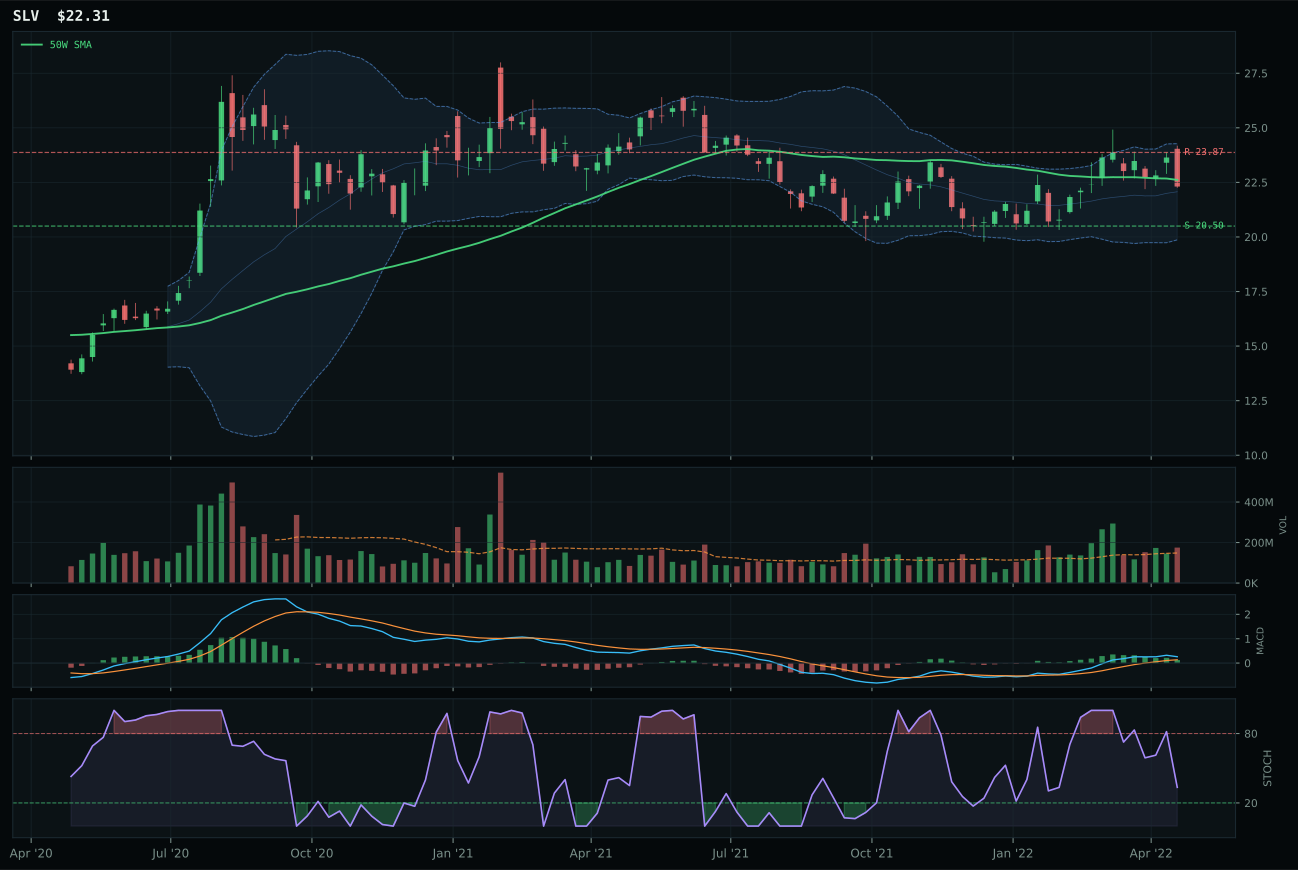
SLV has a compression near 50W profile with 2.4% 13-week relative strength versus SPY.
A failed hold above support would weaken the setup.
Actionable but governed by invalidation levels.
GLD wins Precious Metals and earns top-2 allocation because it delivers trend conviction (100.0/100) with structure quality that justifies the category rank. Price sits above 50-week and 200-week with a 50W slope of 0.1% and 5.2% distance from the 50-week, placing GLD in a neutral-structure setup where the score must be driven by breadth, liquidity, and relative strength. The 8.1% RS versus SPY and 5.4% 13-week return confirm the monetary-hedge bid is active without overstretching. GDX, the runner-up, shows higher momentum (16.7% 13W, 19.4% RS versus SPY) and higher technical evidence (82.9/100), but its timing score of 70.0 lags GLD's 77.0 because stochastic RSI sits in falling/neutral territory, and more critically, its macro/narrative fit plummets to 37.0/100 due to active headwinds—liquidity stress (-9), credit stress (-7), risk appetite broken (-5)—that offset its technical strength.
Precious Metals receives 10% allocation as the second-highest-ranked category at 69.2, tied to a macro regime where monetary-hedge bid is explicitly active (+14) and defensive rotation is in place (+7). The category's 74.0/100 macro fit combines with 73.6/100 technical evidence to create a 62%/38% weighting that produces conviction. GLD's specific appeal is its role as the clean monetary hedge—dollar pressure (+2) and inflation pressure are present in late-cycle reflation, but GLD's neutral-to-positive volume profile (0.85x, still supporting the move) and falling-but-still-bullish MACD make it the lower-volatility choice versus GDX's leveraged-miner profile. This allocation reflects defensive positioning in a regime where risk appetite has broken and real assets are the portfolio's primary growth sleeve.
Utilities & Infrastructure — XLU
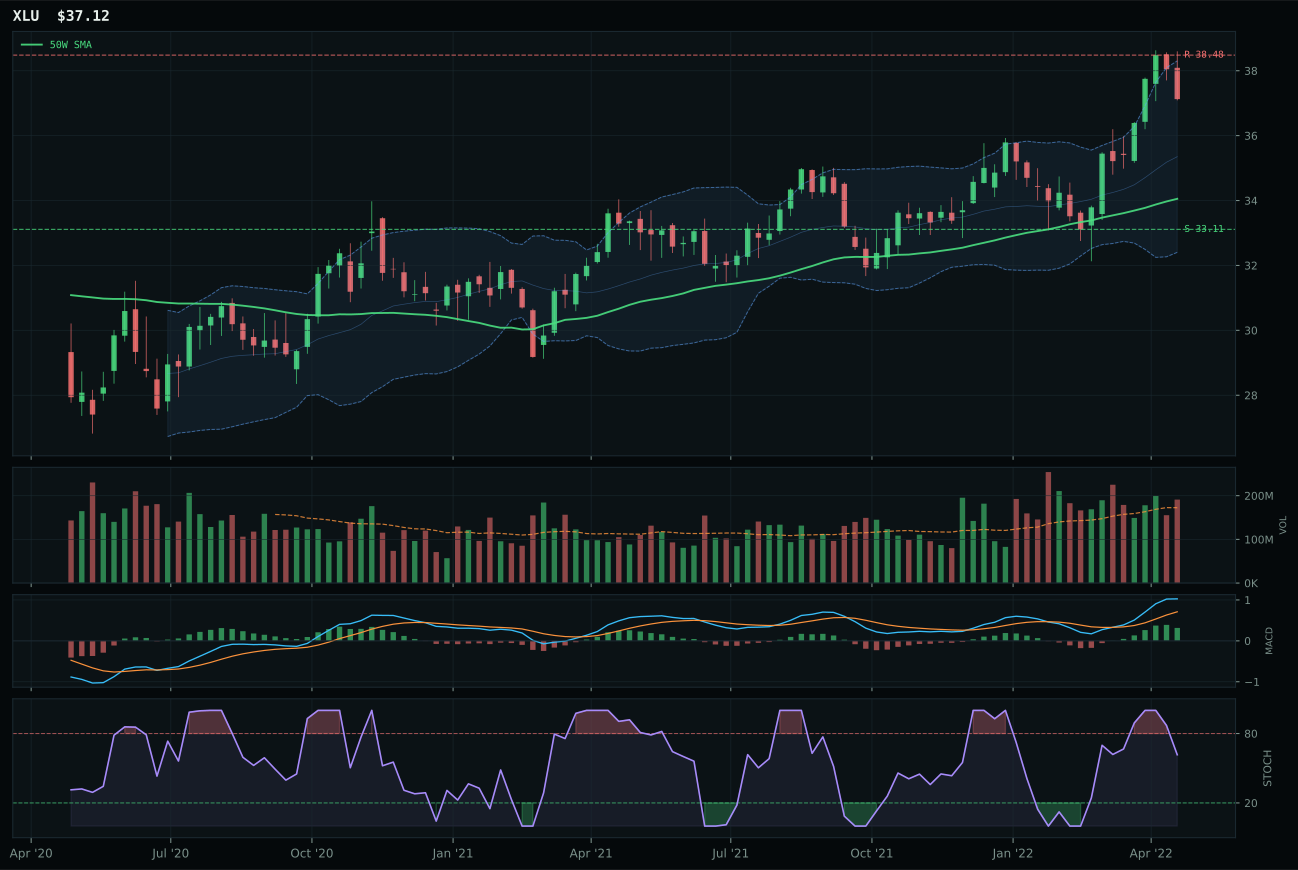
XLU has a neutral structure profile with 10.6% 13-week relative strength versus SPY.
A failed hold above support would weaken the setup.
Actionable but governed by invalidation levels.
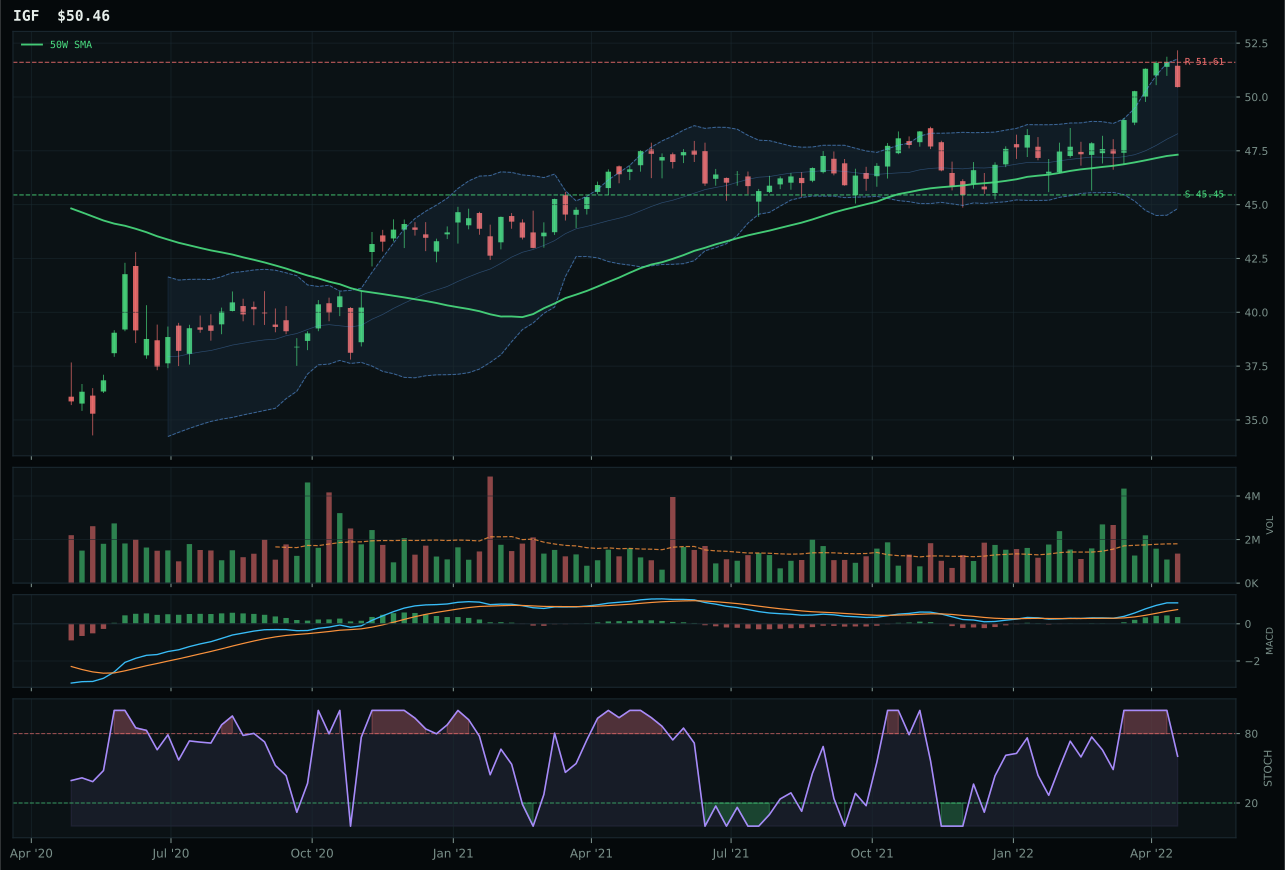
IGF has a neutral structure profile with 9.7% 13-week relative strength versus SPY.
A failed hold above support would weaken the setup.
Actionable but governed by invalidation levels.
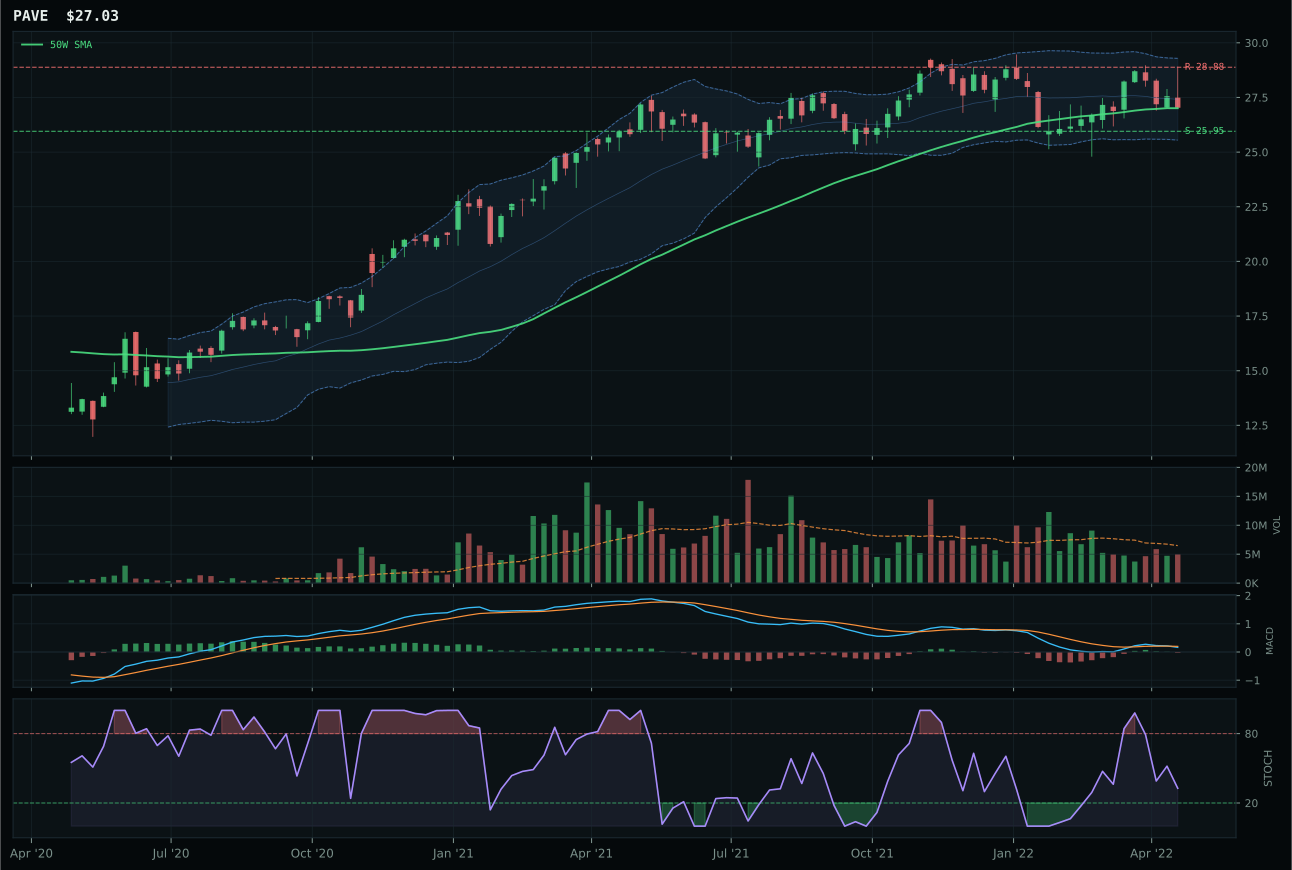
PAVE has a pullback into support profile with 6.1% 13-week relative strength versus SPY.
A failed hold above support would weaken the setup.
Actionable but governed by invalidation levels.
XLU wins Utilities & Infrastructure with a 68.3 category score, ranking tier-2, because it delivers flawless trend conviction (100.0/100) paired with above-average volume participation (1.11x the 20-week average) that confirms defensive accumulation. Price sits 9.0% above the 50-week in neutral structure, so the category win is driven by breadth and liquidity—XLU's 10.6% RS versus SPY, 7.9% 13-week return, and above-average volume show institutional rotation into defensive sectors. IGF trails on risk/reward (48.6 versus 50.2), volume (neutral versus above-average participation), and category-relative strength (0.0% versus 0.9%), despite matching the trend (100.0) and MACD-improving profile. The 1.7-point gap between them is tight, but XLU's participation advantage and upside-to-resistance constraint (only 3.5% to 38.48) make it the lower-volatility, higher-conviction position for this defensive regime.
Utilities & Infrastructure receives 5% allocation in tier-2 with a category score of 68.3, supported by macro fit of 61.0/100 driven by defensive rotation (+12), broad market bear (+4), and late-cycle reflation plus transition themes (+4), partially offset by inflation pressure (-6). XLU's technical evidence of 89.8/100 is among the portfolio's highest, reflecting trend, volume, and momentum confirmation scores above 80.0—this is evidence-grade buying, not hope. However, the tier-2 position reflects capital hierarchy: Precious Metals (69.2) and Traditional Energy (78.5) score higher on both technical merit and macro conviction, so Utilities must share tier-2 allocation with Agriculture, Defense, Technology, Industrial Metals, and Nuclear. The category would move to top-2 if either defensive-rotation intensity deepened further or if risk-appetite deterioration accelerated, but currently, allocation is appropriate as a steady defensive anchor without crisis intensity.
Agriculture & Livestock — WEAT
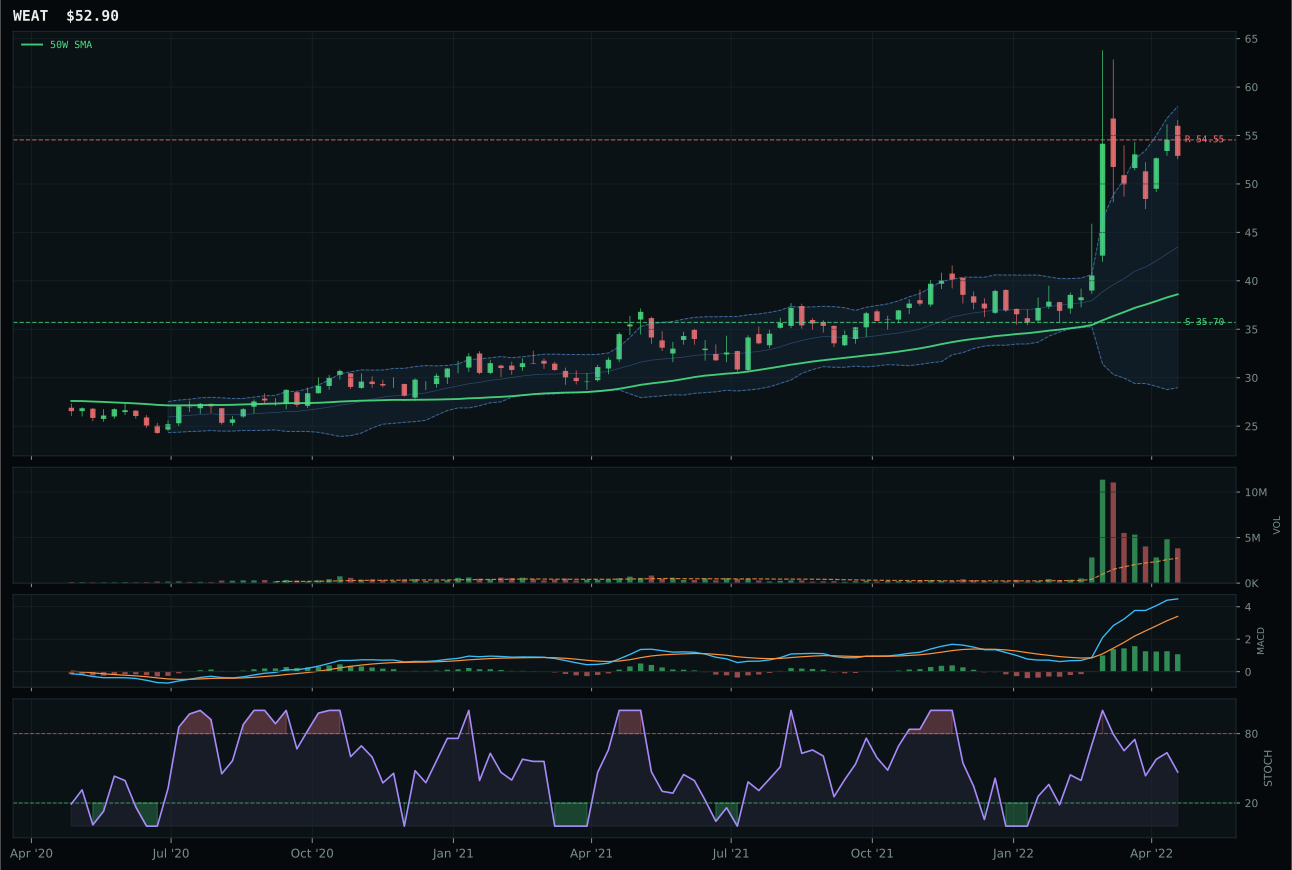
WEAT has a vertical extension profile with 44.9% 13-week relative strength versus SPY.
A failed hold above support would weaken the setup.
Actionable but governed by invalidation levels.
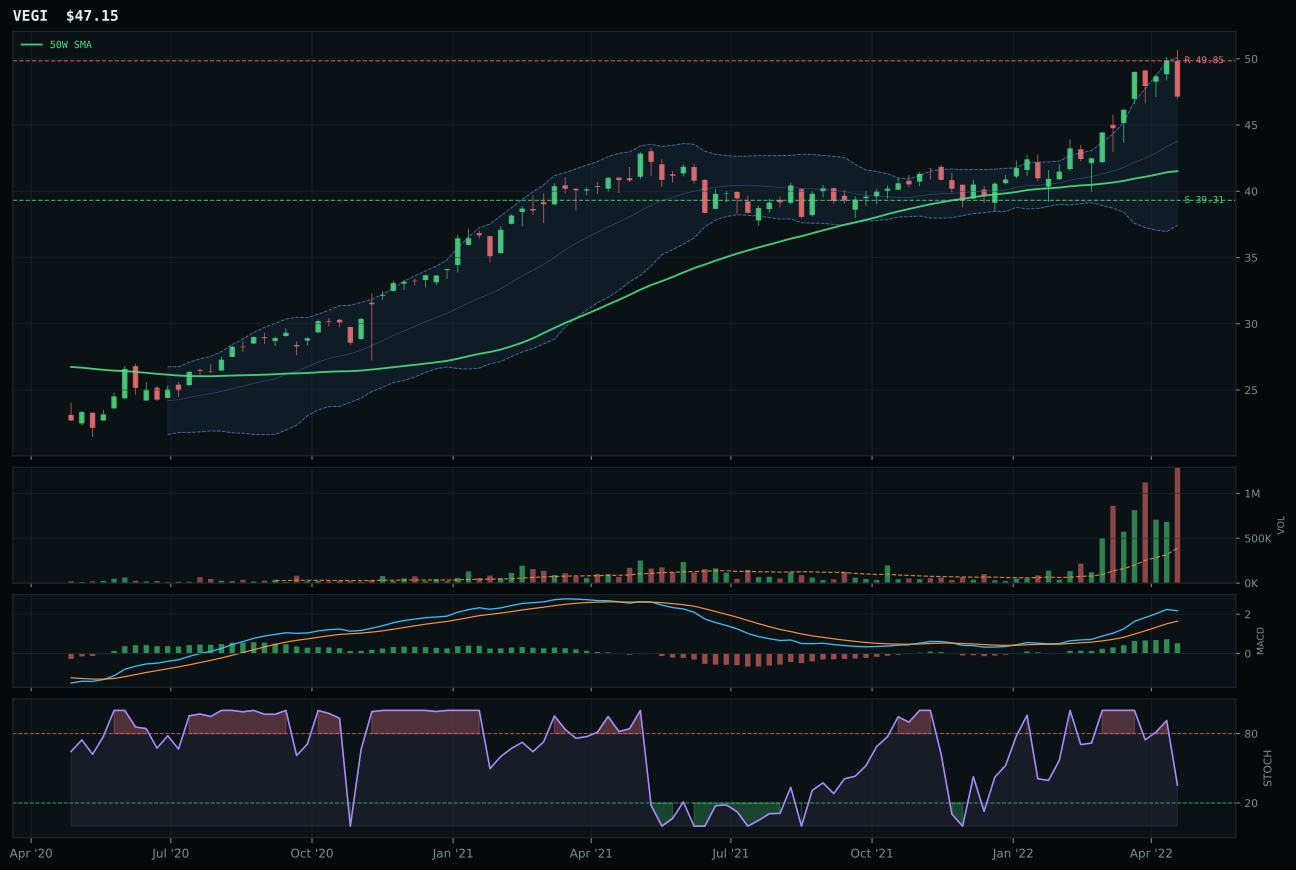
VEGI has a neutral structure profile with 17.8% 13-week relative strength versus SPY.
A failed hold above support would weaken the setup.
Actionable but governed by invalidation levels.
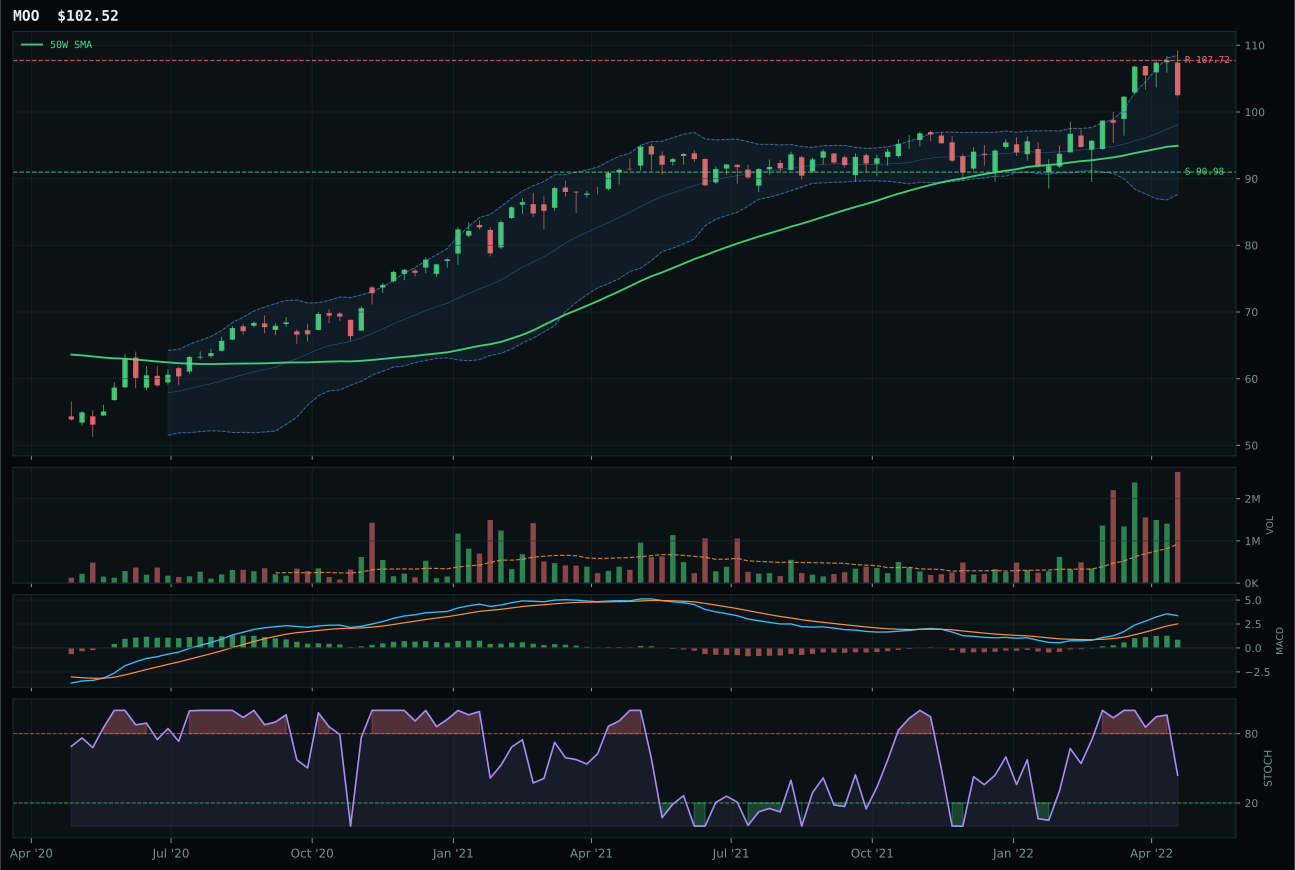
MOO has a neutral structure profile with 14.2% 13-week relative strength versus SPY.
A failed hold above support would weaken the setup.
Actionable but governed by invalidation levels.
WEAT wins because it combines a trend score of 100.0 with momentum confirmation of 100.0—a rare pairing that reflects a sustained move of 42.2% over thirteen weeks. Price sits 37.0% above the 50-week, creating extension risk that is explicitly penalized in the timing score (56.0), but this penalty reflects entry risk, not setup breakage. VEGI scores higher on trend (100.0) and structure (70.0 versus WEAT's 66.4), but it loses the category to stochastic RSI timing (falling/neutral versus rising mid-zone) and volume confirmation that shows distribution pressure rather than accumulation. The category-relative strength gap is decisive: WEAT's 27.1% versus VEGI's 0.0% means WEAT is being accumulated while VEGI is being distributed, a crucial technical distinction when evaluating real-asset breadth.
Agriculture & Livestock receives 5% allocation in tier-2 despite a category score of 64.0 and one of the portfolio's strongest macro fits at 90.0/100. Supply shortages (+13), inflation pressure (+10), real-asset sponsorship (+8), and commodity breadth positive (+5) create a powerful fundamental backdrop that supports WEAT's extended position. The tier-2 allocation reflects capital constraint—not weakness in the category's case—because Precious Metals and Traditional Energy ranked higher on category scores (69.2 and 78.5 respectively) in a 50% overlay regime that allocates only 10% to top-2 and 5% to tiers 3-8. If this allocation overlay were to shift, Agriculture would be the first tier-2 candidate to promote given its macro support and clean technical momentum, but current constraints place it in a holding pattern.
Defense & Aerospace — ITA
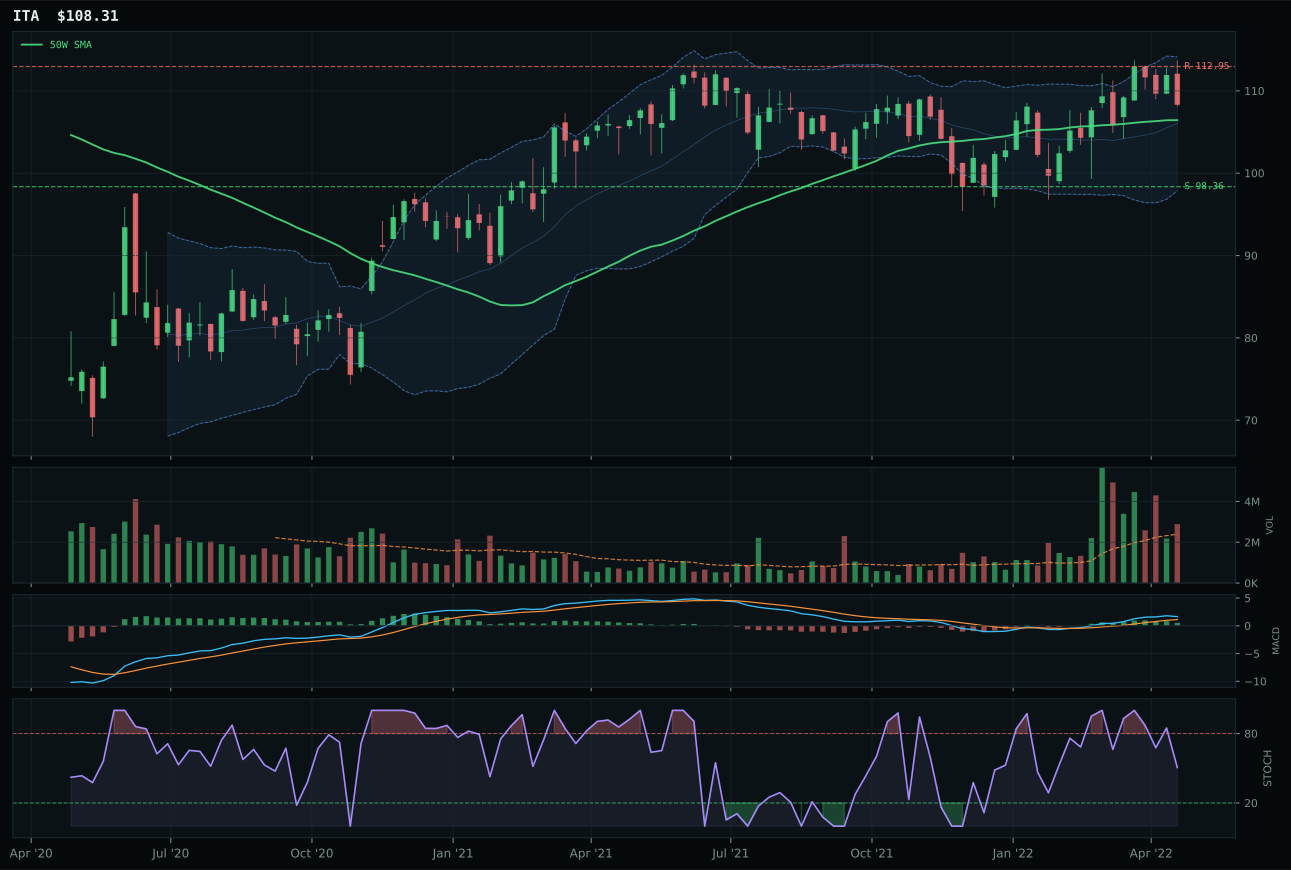
ITA has a compression near 50W profile with 8.7% 13-week relative strength versus SPY.
A failed hold above support would weaken the setup.
Actionable but governed by invalidation levels.
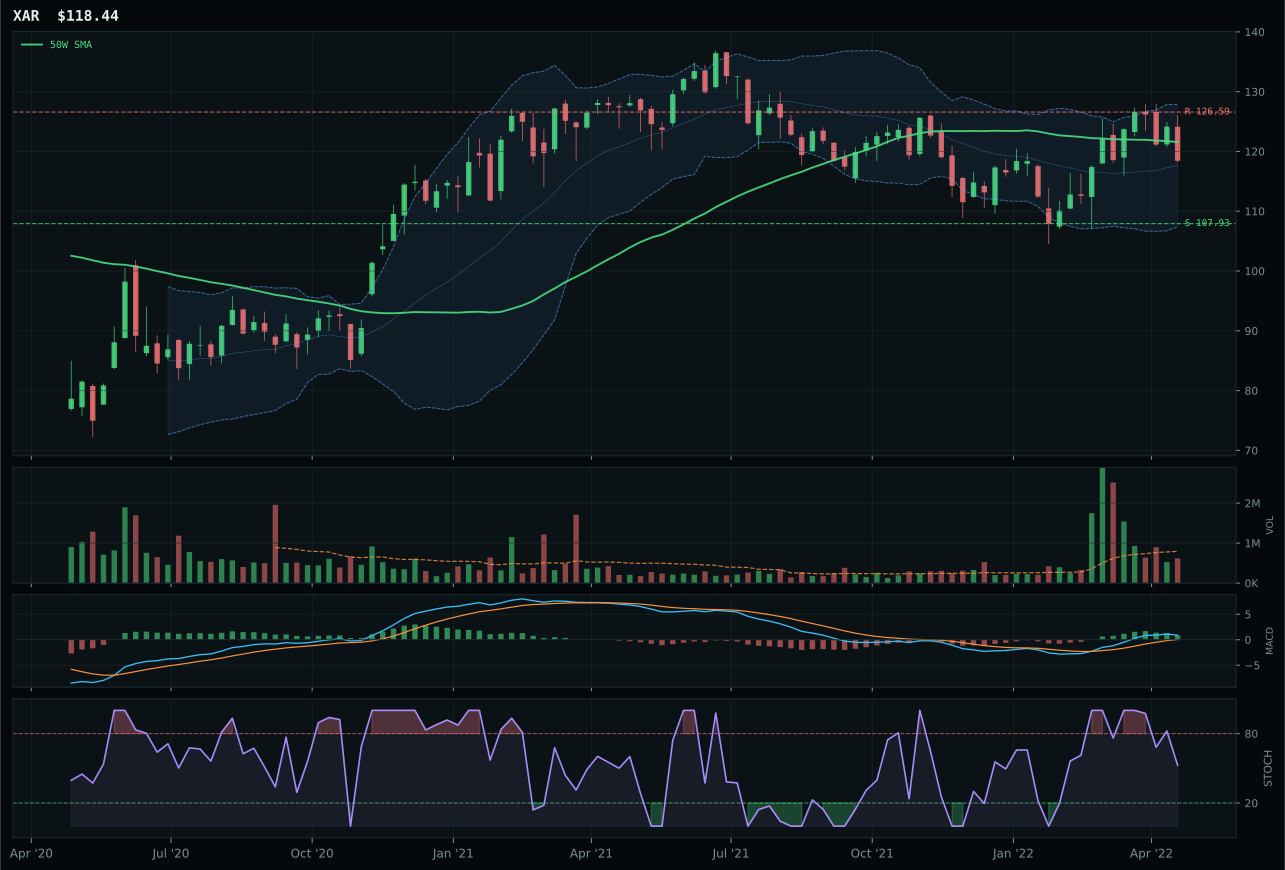
XAR has a compression near 50W profile with 8.0% 13-week relative strength versus SPY.
A failed hold above support would weaken the setup.
Actionable but governed by invalidation levels.
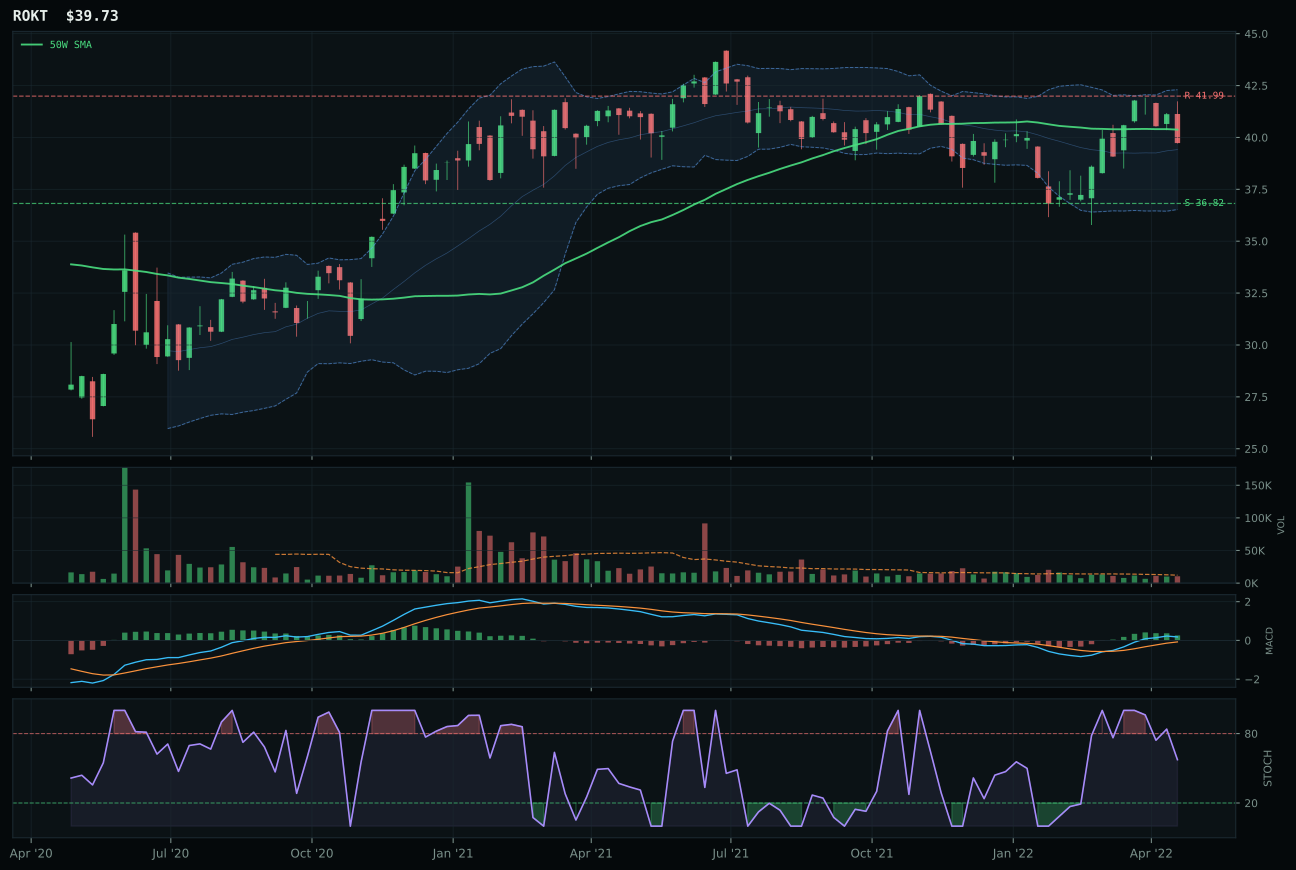
ROKT has a compression near 50W profile with 7.1% 13-week relative strength versus SPY.
A failed hold above support would weaken the setup.
Tracked, but not top-2 eligible because: .
ITA wins Defense & Aerospace because it trades above both 50-week and 200-week moving averages with a clean compression structure just 1.8% from the 50-week—a tight setup that rewards buyers who defend the level. The 13-week return of 6.0% pairs with 8.7% RS versus SPY and above-average volume participation at 1.21x the 20-week average, signaling institutional accumulation rather than retail bounce. XAR trails on structure (72.4 versus 76.1), volume (neutral versus above-average participation), and category-relative strength (0.0% versus 0.6%), despite matching compression setup and bullish-but-flattening MACD. ITA's trend score of 100.0 reflects price position and momentum slope; XAR cannot match this because its 50W slope is neutral, leaving no technical reason to favor it over a cleaner player with confirmed volume backing.
Defense & Aerospace receives 5% as tier-2, ranking below Precious Metals and Traditional Energy but well-supported by macro regime. The category score of 62.1 reflects strong technical evidence (78.2/100) weighted against solid macro fit (63.0/100) that includes defensive rotation (+7), broad market bear (+6), and real-asset sponsorship via late-cycle reflation themes. This is a classic defensive trade: ITA has clean technicals with above-average participation, and the macro environment actively favors rotation into defensive equities as growth risk increases. The category would move to top-2 tier if momentum confirmation strengthened or if risk-appetite deterioration deepened, but for now it occupies the tier-2 slot as a steady, macro-supported holding that provides equity exposure without growth assumptions.
Nuclear Energy — URNM
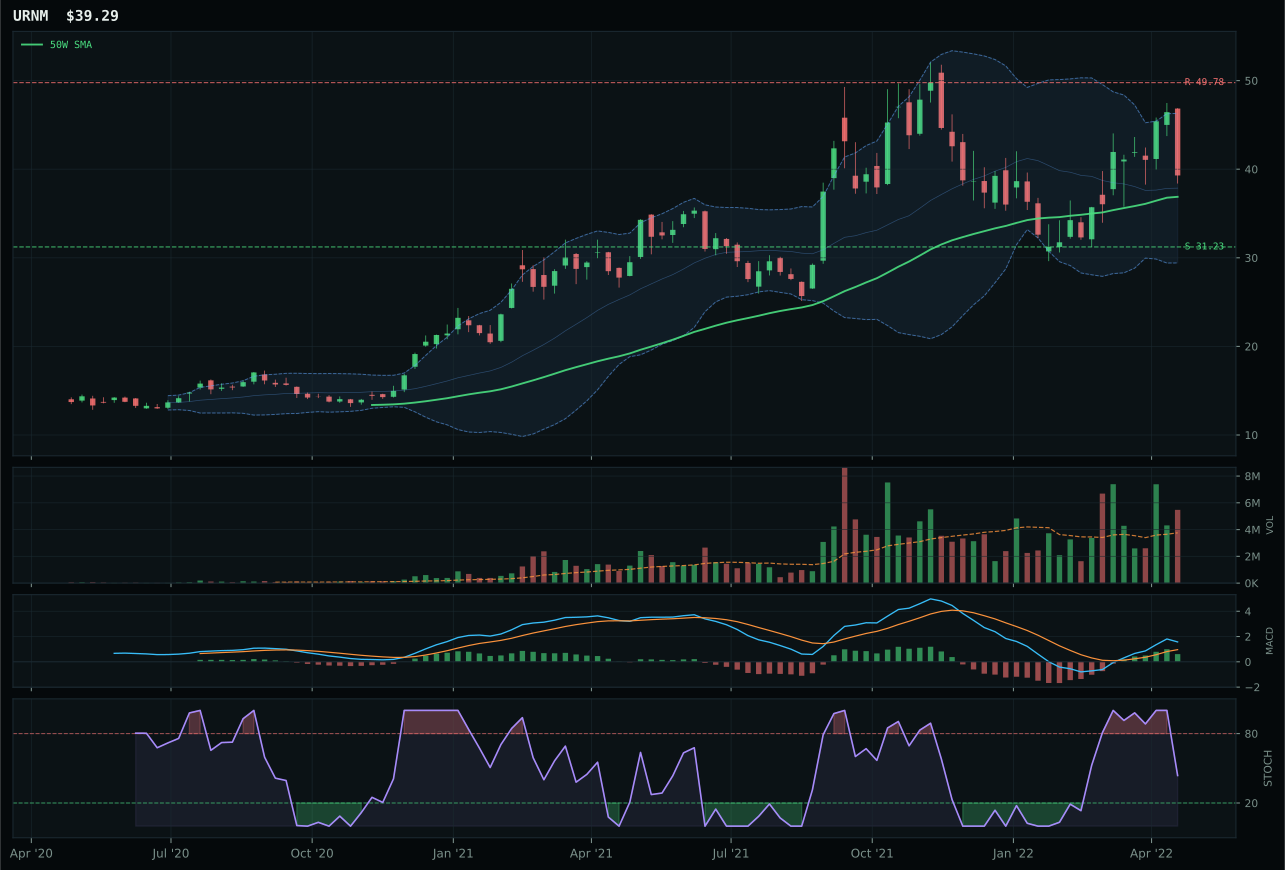
URNM has a neutral structure profile with 23.2% 13-week relative strength versus SPY.
A failed hold above support would weaken the setup.
Actionable but governed by invalidation levels.
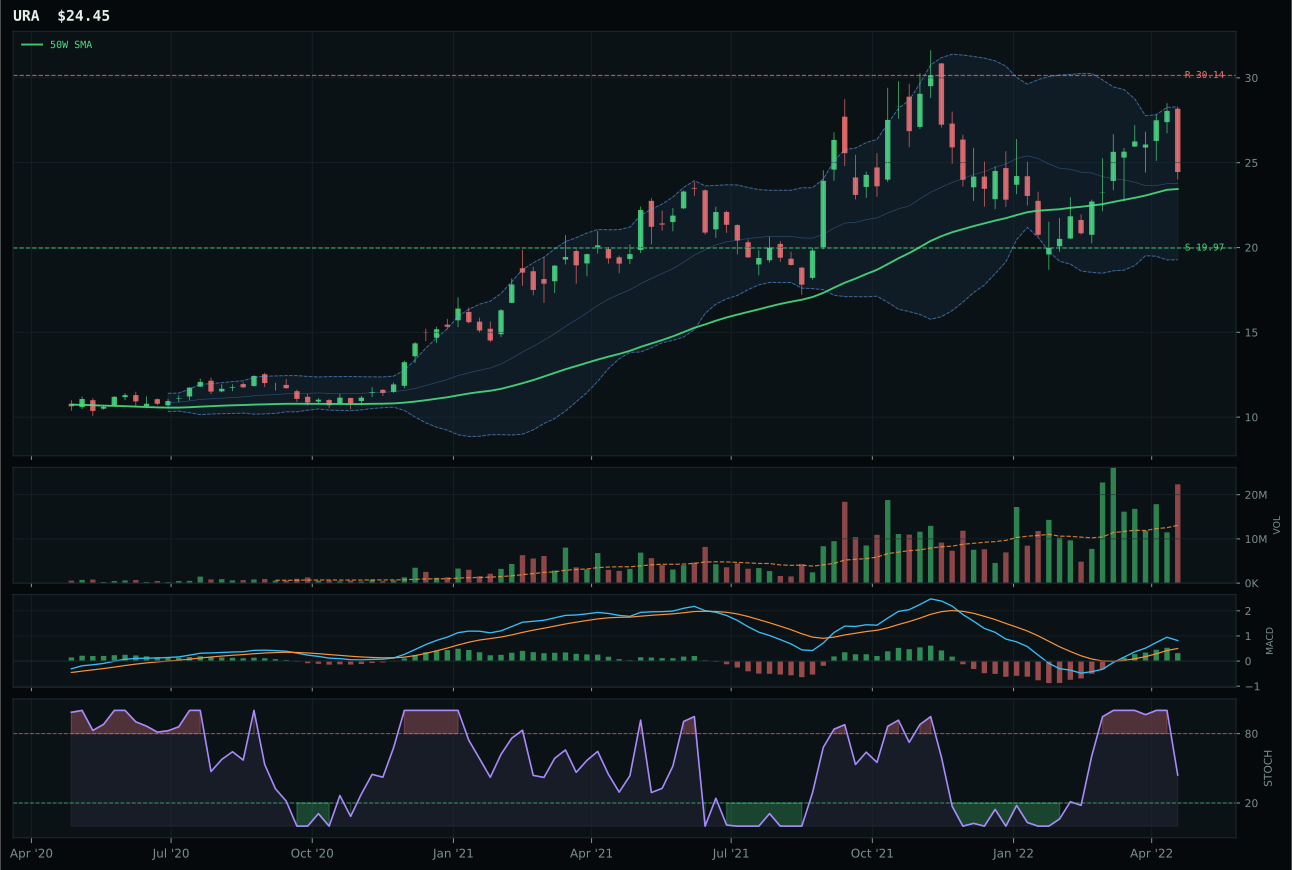
URA has a neutral structure profile with 20.6% 13-week relative strength versus SPY.
A failed hold above support would weaken the setup.
Actionable but governed by invalidation levels.
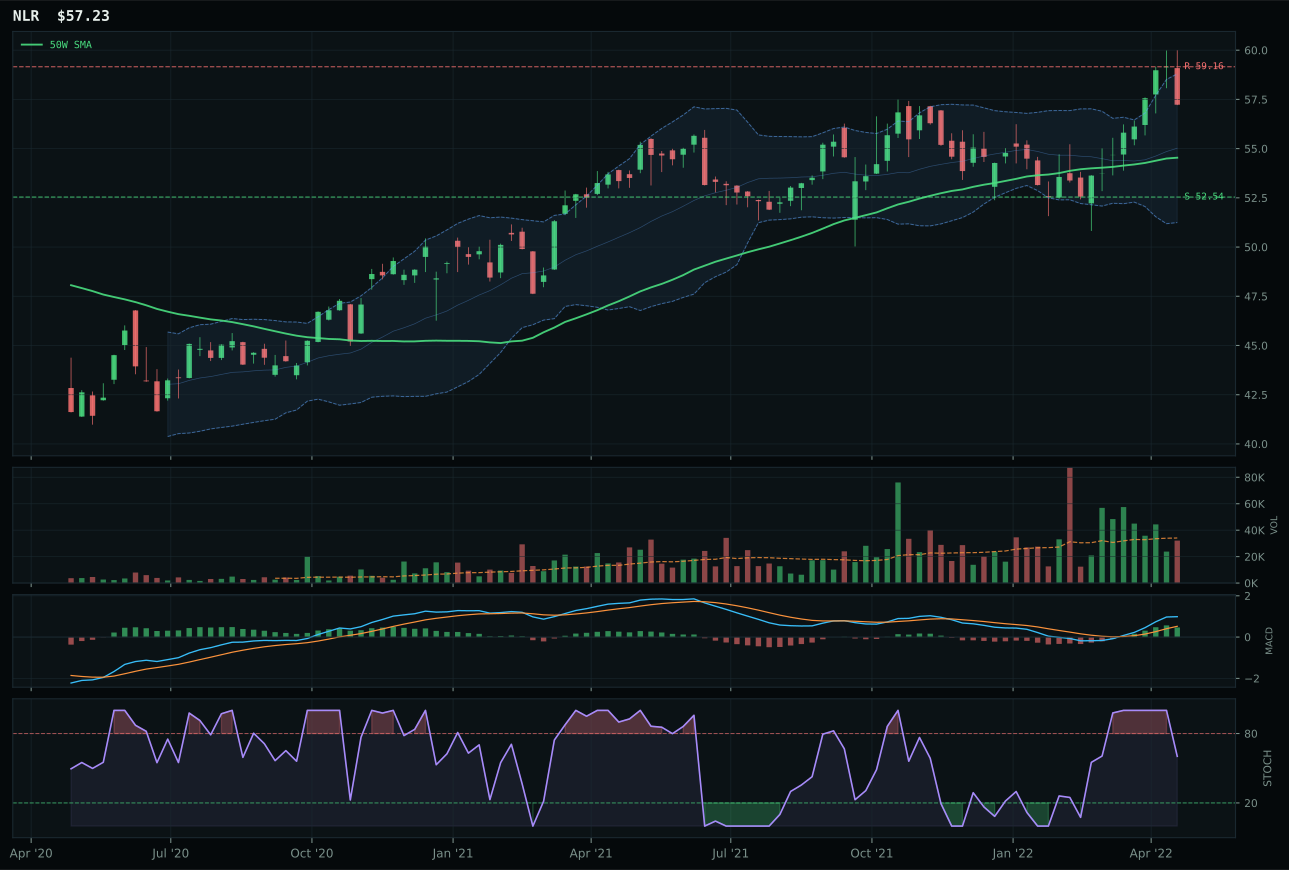
NLR has a neutral structure profile with 10.4% 13-week relative strength versus SPY.
A failed hold above support would weaken the setup.
Tracked, but not top-2 eligible because: .
URNM wins Nuclear Energy with a 50.6 score, placing it in tier-2, because it shows momentum confirmation of 100.0/100 paired with above-average volume participation at 1.46x the 20-week average. Price sits 6.5% above the 50-week but only 0.3% below the 200-week, creating a reset-in-progress setup where volume is the critical proof point—and URNM's above-average participation confirms accumulation is occurring. The 20.5% 13-week return and 23.2% RS versus SPY document sustained demand across the recovery from recent weakness. URA, the runner-up, loses on risk/reward (45.1 versus 52.7), structure (69.4 versus 70.1), and volume confirmation (distribution pressure versus accumulation), despite matching the MACD-improving and stochastic-RSI-neutral timing pattern. The 0.3-point gap between URNM and URA is extremely tight, but URA's distribution-pressure volume profile and weaker risk/reward make URNM's broader participation the differentiator.
Nuclear Energy receives 5% allocation in tier-2 with a category score of 50.6, supported by macro fit of 60.0/100 driven by energy scarcity (+9), real-asset sponsorship (+7), and inflation pressure (+3), partially offset by liquidity stress (-7). URNM's technical evidence of 76.8/100 reflects strong momentum and volume confirmation, but the category's overall score remains tier-2 because risk/reward is constrained (52.7/100) by the 21.1% upside requirement to reach resistance versus 25.8% downside to support—an unfavorable asymmetry that reflects the rally from low support levels. The tier-2 position is appropriate: energy scarcity themes support nuclear demand, but the category lacks the momentum extension of Traditional Energy or the macro-tailwind intensity of Precious Metals. For URNM to move to top-2, either upside extension would need to break resistance with confirmed volume, or uranium-specific supply narratives would need to intensify further.
Industrial Metals — COPX
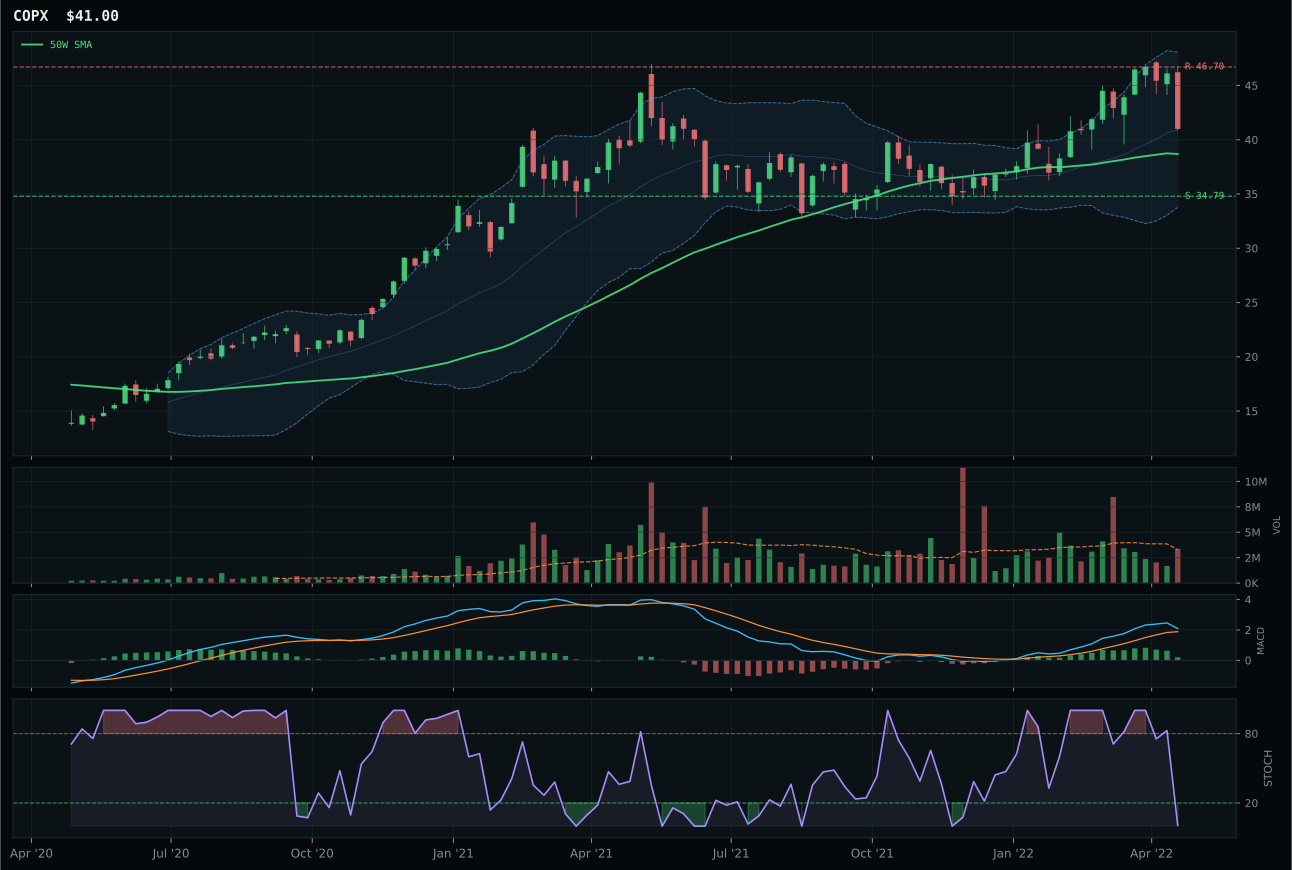
COPX has a neutral structure profile with 7.4% 13-week relative strength versus SPY.
A failed hold above support would weaken the setup.
Actionable but governed by invalidation levels.
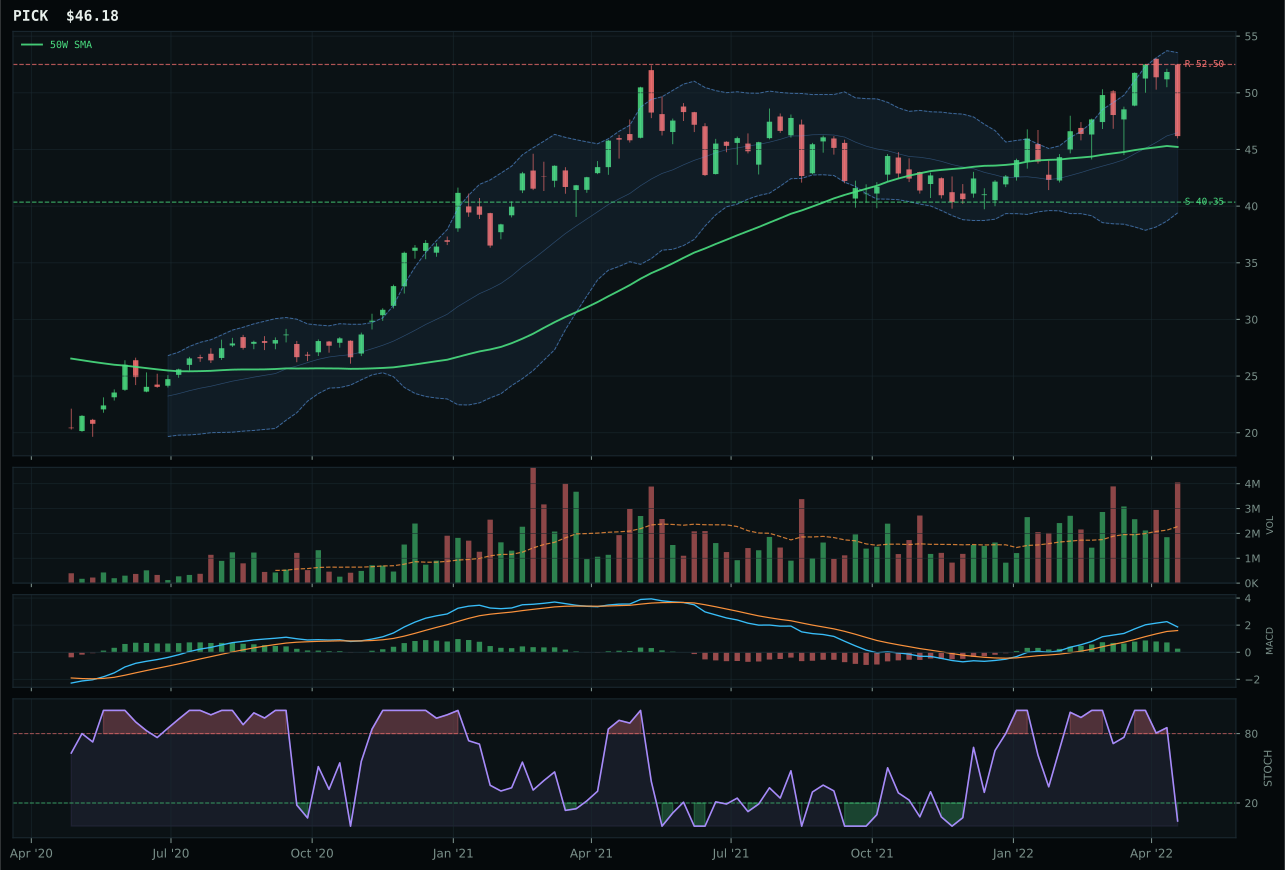
PICK has a compression near 50W profile with 7.8% 13-week relative strength versus SPY.
A failed hold above support would weaken the setup.
Actionable but governed by invalidation levels.
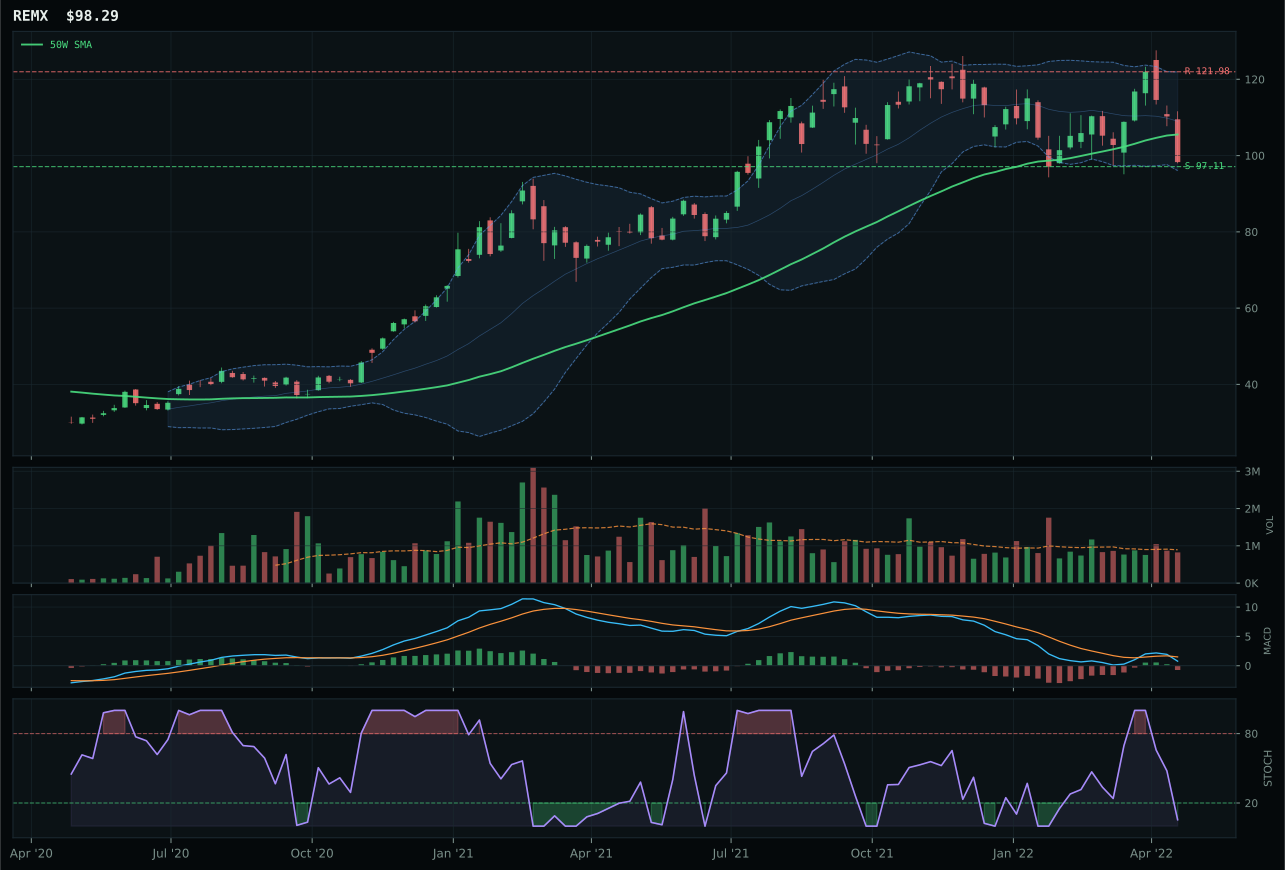
REMX has a pullback into support profile with -3.4% 13-week relative strength versus SPY.
A failed hold above support would weaken the setup.
Actionable but governed by invalidation levels.
COPX wins Industrial Metals with a score of 49.4, ranking tier-2, because it delivers trend conviction (96.0/100) with structure quality (75.5/100) that reflects clean price action. COPX sits 6.0% above the 50-week with above-average moving-average alignment and a neutral-structure setup where accumulation can be measured by breadth and relative strength. The 7.4% RS versus SPY confirms the metals-scarcity narrative is supported, and the 4.7% 13-week return is modest but positive in an environment where negative returns dominate. PICK trails on risk/reward (60.0 versus 65.3), structure cleanliness (70.8 versus 75.5), and volume confirmation (distribution pressure versus neutral), making it a less-viable entry despite compression near the 50-week. The 2.2-point gap between COPX and PICK is clear: COPX's neutral volume environment and superior structure create the fewer-argument setup for accumulation.
Industrial Metals receives 5% allocation as tier-2, supported by a category score of 49.4 and strong macro fit of 68.0/100 driven by metals scarcity (+14), commodity breadth positive (+10), late-cycle reflation (+10), and real-asset sponsorship (+6). These tailwinds offset liquidity-stress headwinds (-8) and position the category as a second-tier real-asset play. COPX's technical evidence of 68.0/100 combined with macro fit of 56.0/100 creates an allocation case that is sound but not urgent. The category ranks below Precious Metals and Agriculture on score, and it lacks the extended momentum of Traditional Energy, so tier-2 placement reflects appropriate capital hierarchy. For COPX to move to top-2, either momentum confirmation would need to accelerate beyond the current 52.6/100 or metals-scarcity narratives would need to deepen further—currently, allocation is justified as a real-asset anchor without being a primary driver.
Technology — CIBR
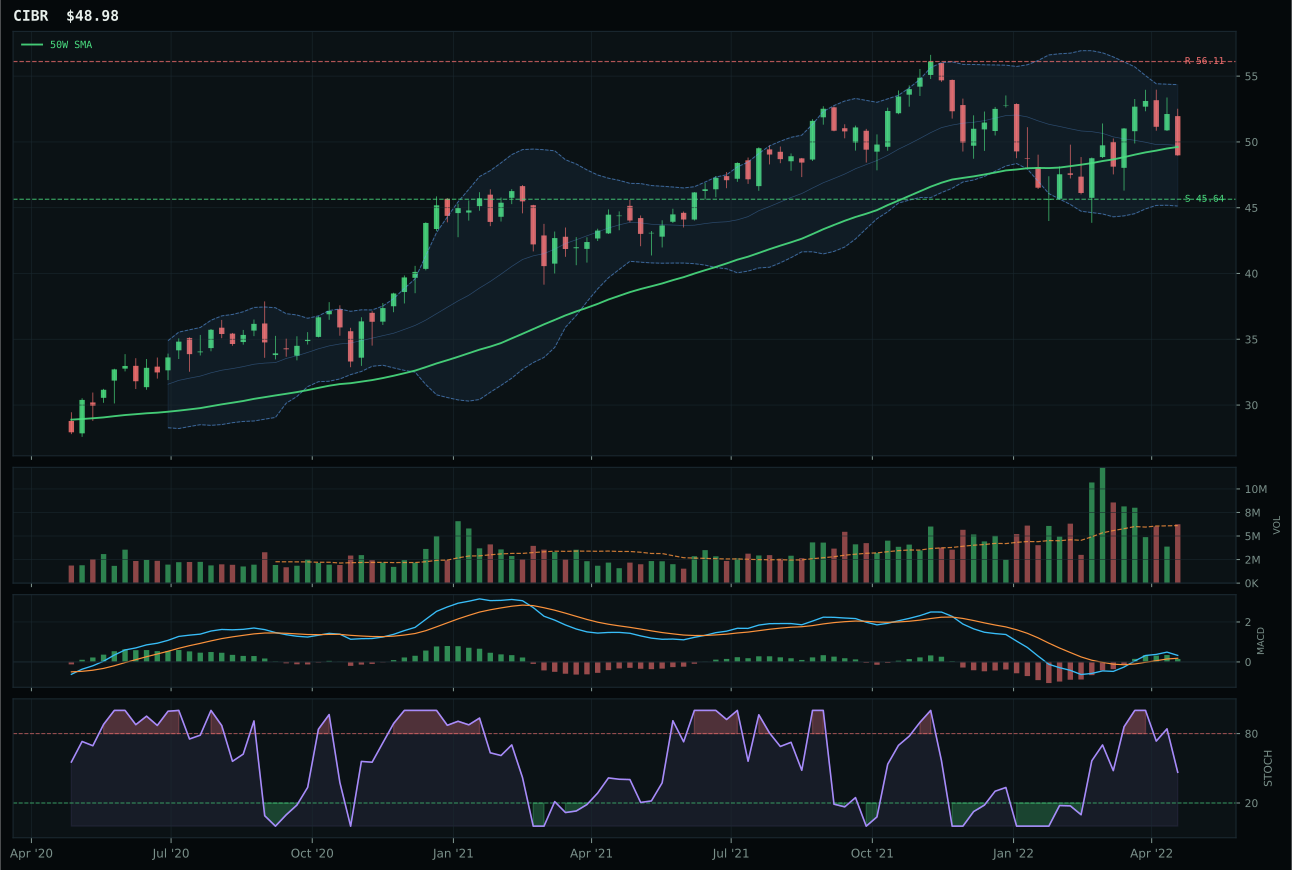
CIBR has a compression near 50W profile with 8.0% 13-week relative strength versus SPY.
A failed hold above support would weaken the setup.
Actionable but governed by invalidation levels.
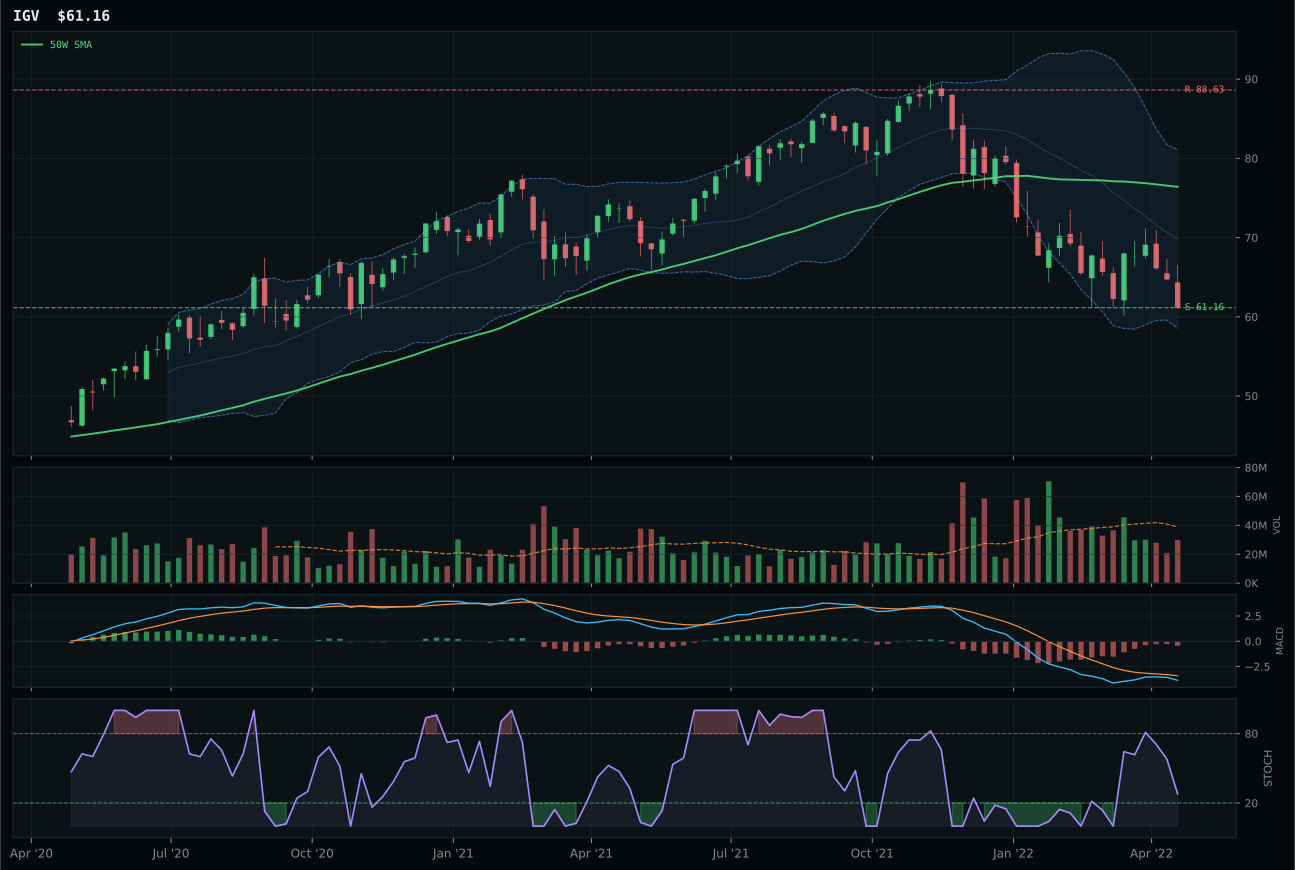
IGV has a pullback into support profile with -7.0% 13-week relative strength versus SPY.
A failed hold above support would weaken the setup.
Actionable but governed by invalidation levels.
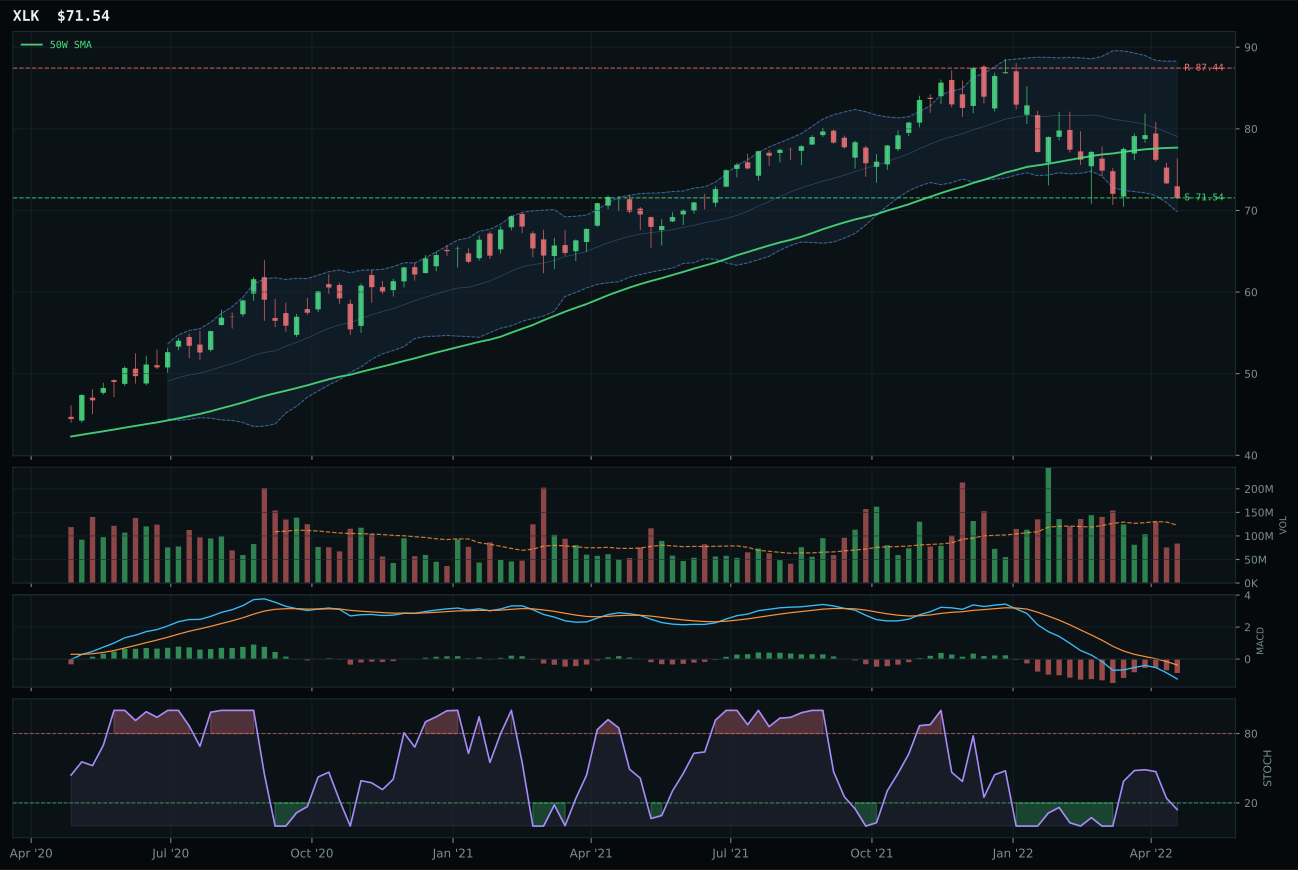
XLK has a pullback into support profile with -4.6% 13-week relative strength versus SPY.
A failed hold above support would weaken the setup.
Actionable but governed by invalidation levels.
CIBR wins because it sits in a compression setup just 1.3% below the 50-week moving average with the price still above the 200-week, creating a reset opportunity rather than a momentum chase. The 13-week return of 5.3% paired with 8.0% relative strength versus SPY and 12.6% category-relative strength shows selective accumulation in a defensive rotation environment, where cybersecurity sits as a steadier tech subtheme. IGV, the runner-up, failed on timing—its 65.0 score versus CIBR's 100.0—because MACD turned bearish while stochastic RSI fell neutral, and it lags category peers by 2.4%, making it a structural underperformance versus a technically sound reset. The 40.9-point gap between these two is decisive: CIBR's compression near the 50W combined with neutral volume and bullish-but-flattening MACD creates the kind of coil that can deliver upside expansion on directional confirmation.
Technology earned 5% allocation as a tier-2 holding in a late-cycle reflation regime where liquidity stress, credit stress, and broken risk appetite are all active headwinds. The category's 17.0 score reflects macro headwinds that compress the upside opportunity set—liquidity stress alone drags the category fit to 24.0/100—but CIBR's technical evidence of 85.4/100 keeps it eligible for capital. This is a hold-not-chase position: the chart work is clean and the setup is defensible, but macro regime deterioration means the category would need either credit-stress relief or a shift in the equity risk-appetite descriptor to move into top-2 tier. For now, technicals justify allocation against a weak macro backdrop, not because the category is a primary driver.
Emerging Markets — IEMG
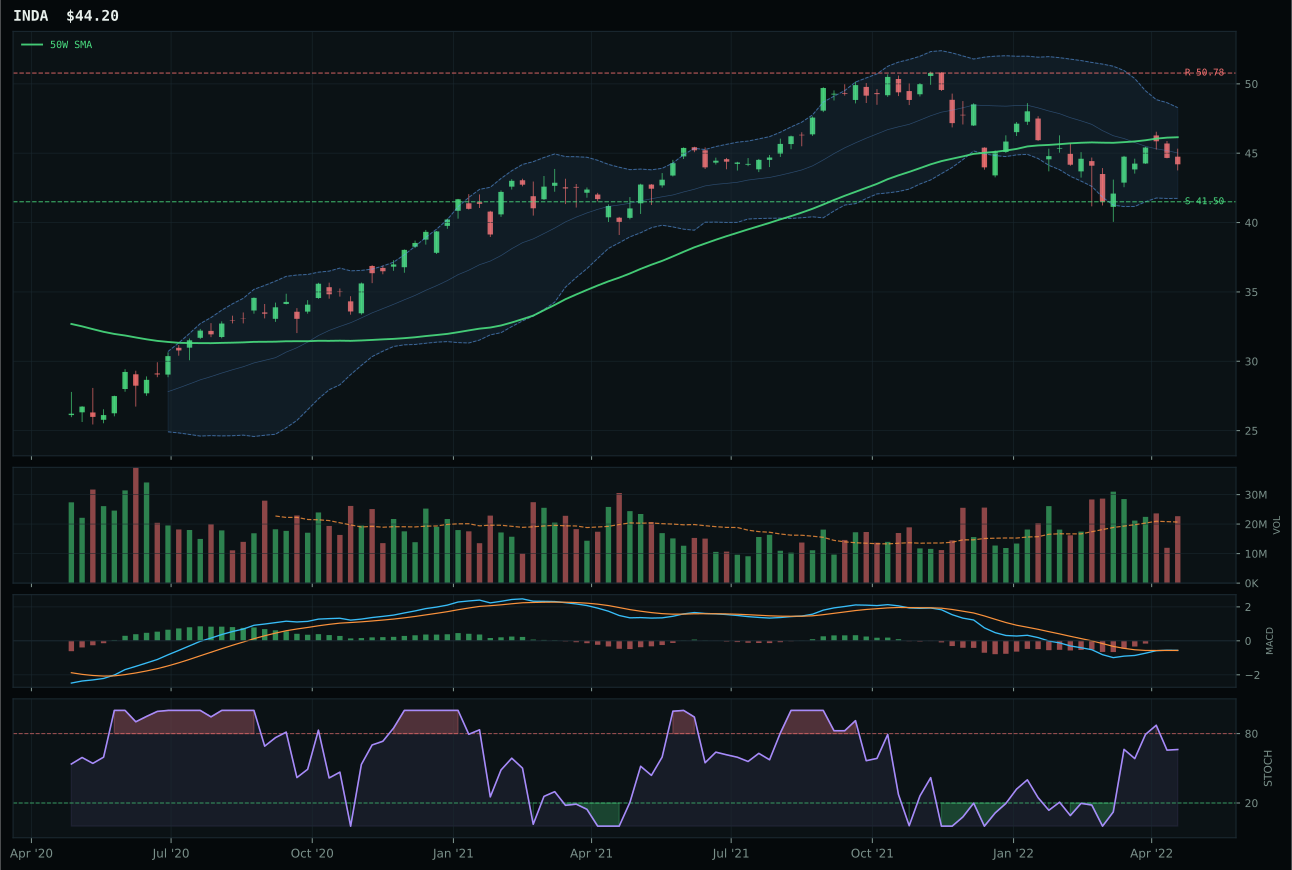
INDA has a neutral structure profile with -1.1% 13-week relative strength versus SPY.
A failed hold above support would weaken the setup.
Actionable but governed by invalidation levels.
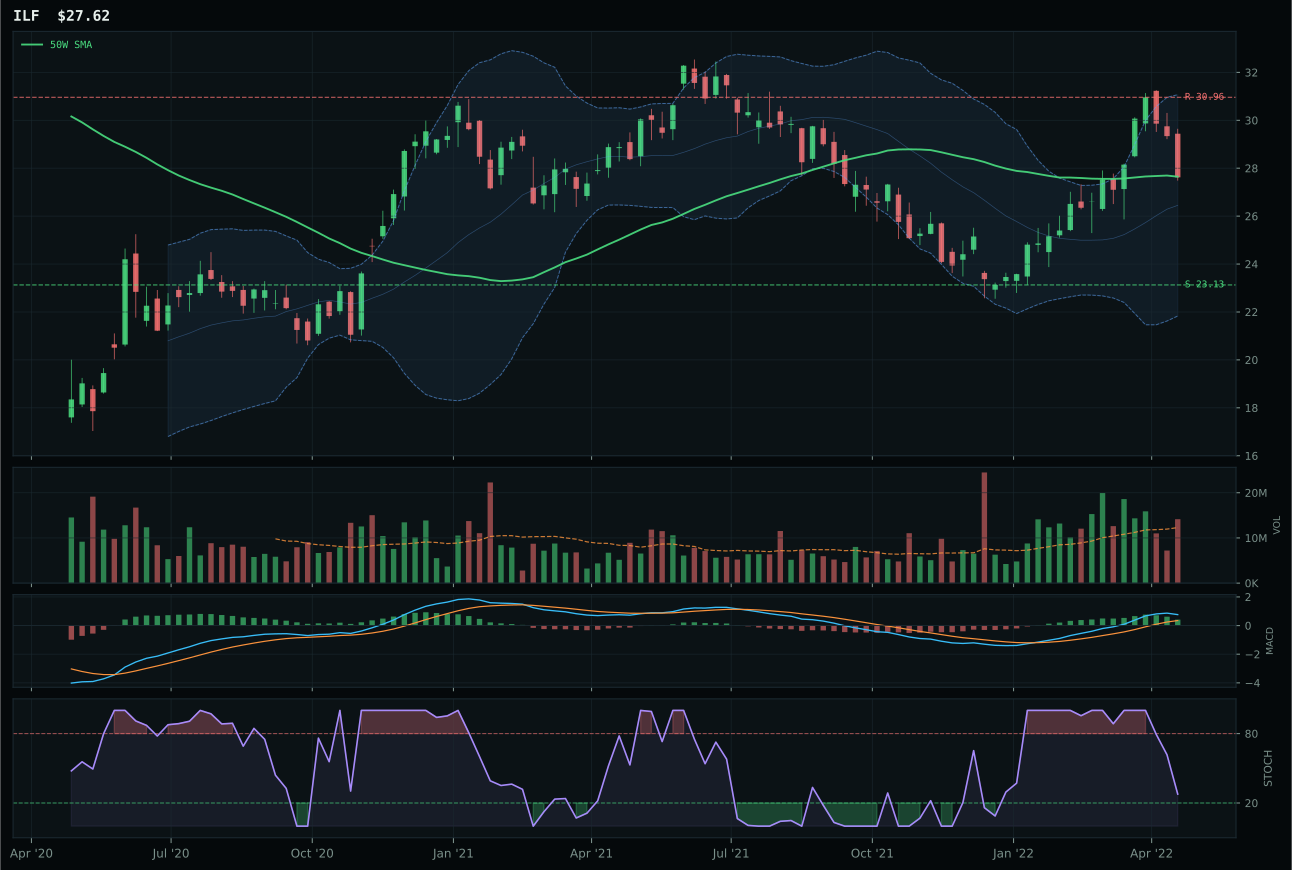
ILF has a compression near 50W profile with 13.8% 13-week relative strength versus SPY.
Extension and support failure are the main tactical risks.
Tracked, but not top-2 eligible because: structurally broken.
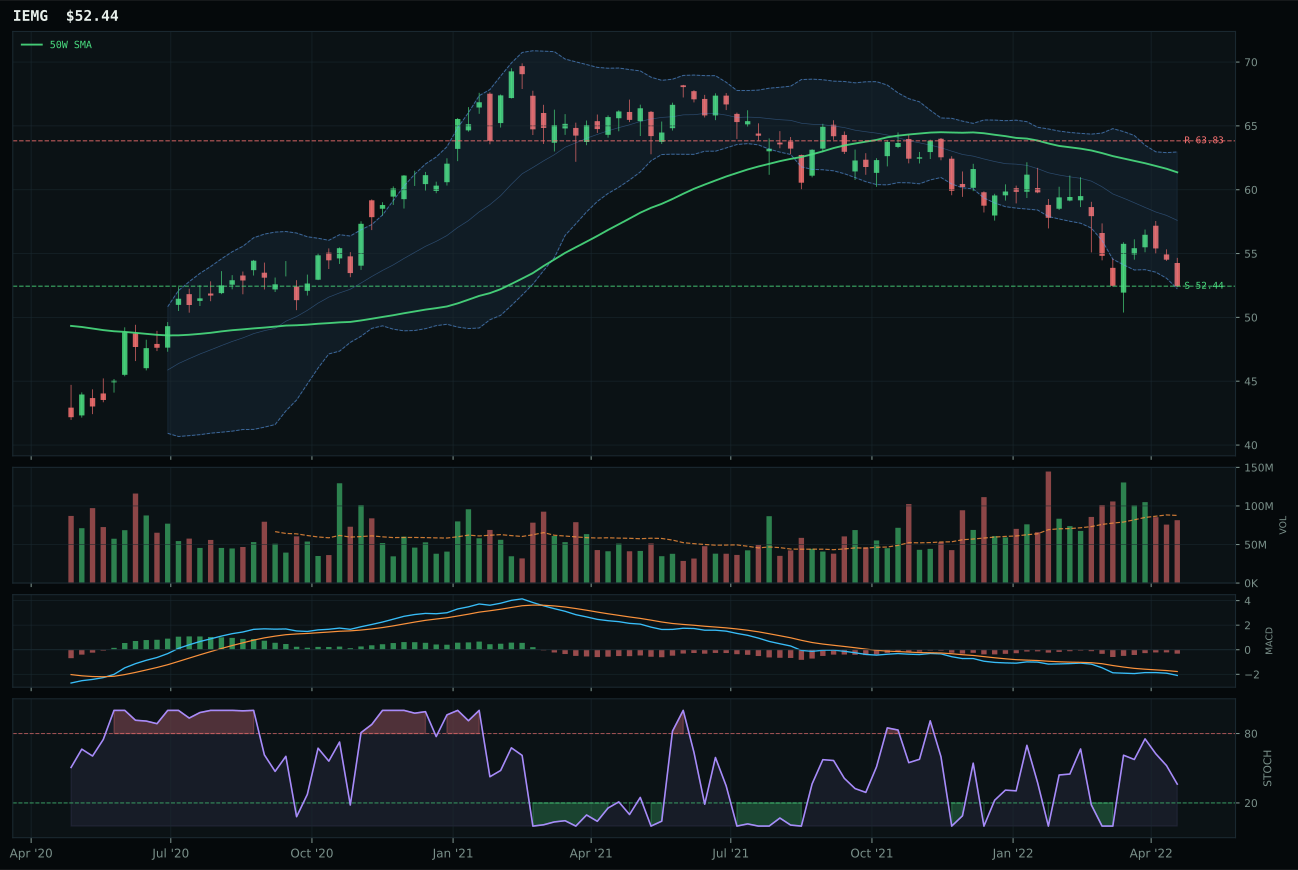
IEMG has a pullback into support profile with -9.6% 13-week relative strength versus SPY.
A failed hold above support would weaken the setup.
Actionable but governed by invalidation levels.
IEMG wins Emerging Markets by default in a category that scores only 4.8, ranking 9th or 10th and receiving 0% allocation, because it is the least-negative setup among three broken trends. Price sits 14.5% below the 50-week and below the 200-week, placing it in a near-52W-low repair zone where support at 52.44 must hold to prevent cascade weakness. The trend score of 23.6/100 and momentum confirmation of 2.2/100 are disqualifying, but IEMG avoids INDA's problem of running near resistance (just 4.2% away) and beats ILF on being closer to actual support levels. However, this is a hollow victory: MACD is bearish-but-improving, stochastic RSI is falling/neutral, and volume is neutral throughout—none of this creates a compelling reversal case, merely the least-offensive positioning in a category where all signals point to renewed weakness.
Emerging Markets receives 0% allocation, ranking outside the portfolio entirely, because the category score of 4.8 reflects macro regime hostility that cannot be overcome by technical repair. Dollar pressure (-14), credit stress (-10), liquidity stress (-10), and broad market bear (-9) combine to create a category-level macro fit of only 7.0/100—the lowest on the portfolio. Even INDA, the technical winner with 73.9/100 evidence, cannot overcome macro headwinds because its 35.0/100 narrative fit drags the blended score below investment threshold. The tier breakdown is clear: Precious Metals and Traditional Energy occupy top-2 at 10% each; Agriculture, Defense, Technology, Industrial Metals, Nuclear, and Utilities occupy tier-2 at 5% each; Emerging Markets and AI earn 0% due to macro hostility that technical setups cannot repair. For Emerging Markets to earn even tier-2 allocation, either dollar pressure would need to reverse or credit stress would need obvious relief—currently, the regime is actively punishing currency and credit exposure.
AI — SMH
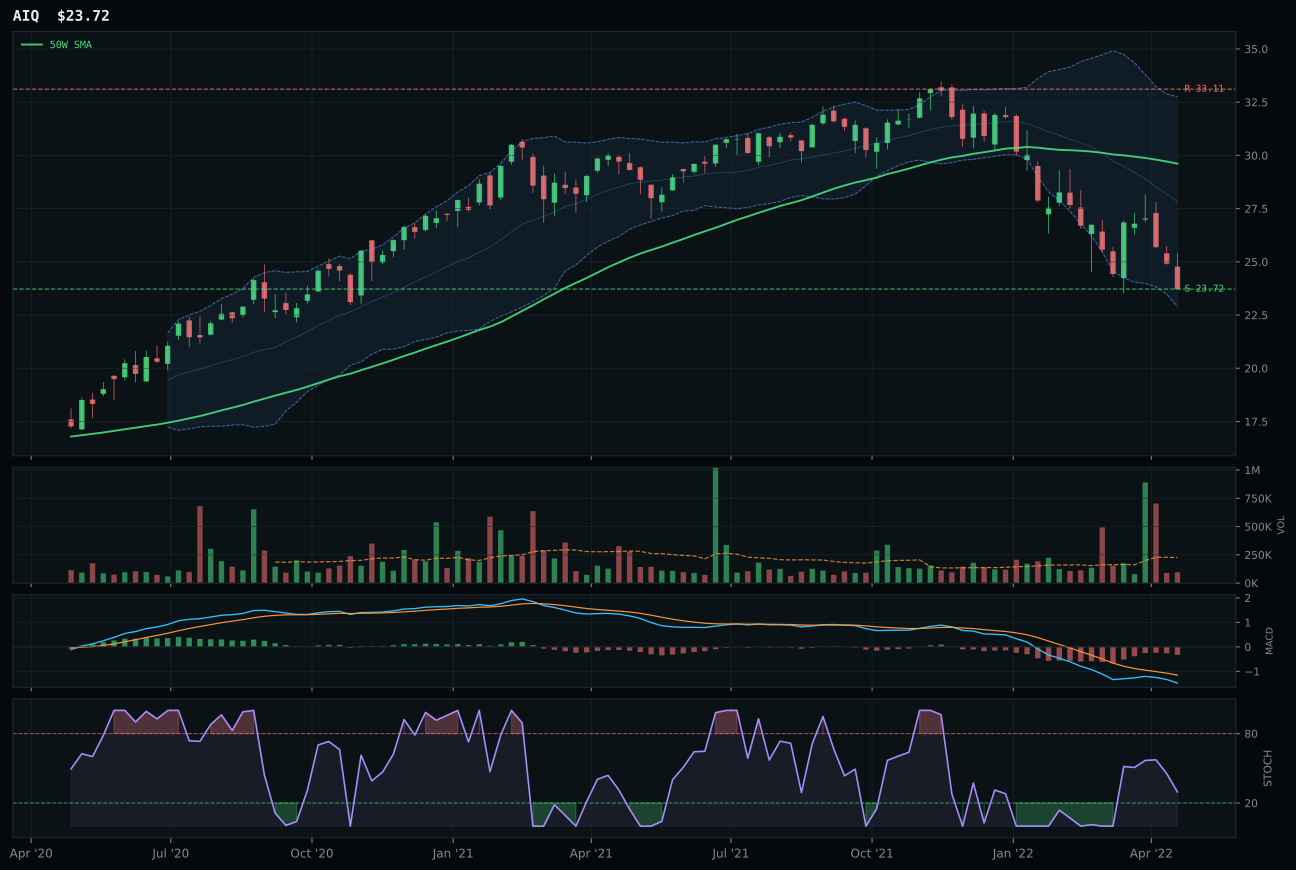
AIQ has a pullback into support profile with -12.2% 13-week relative strength versus SPY.
A failed hold above support would weaken the setup.
Tracked, but not top-2 eligible because: .
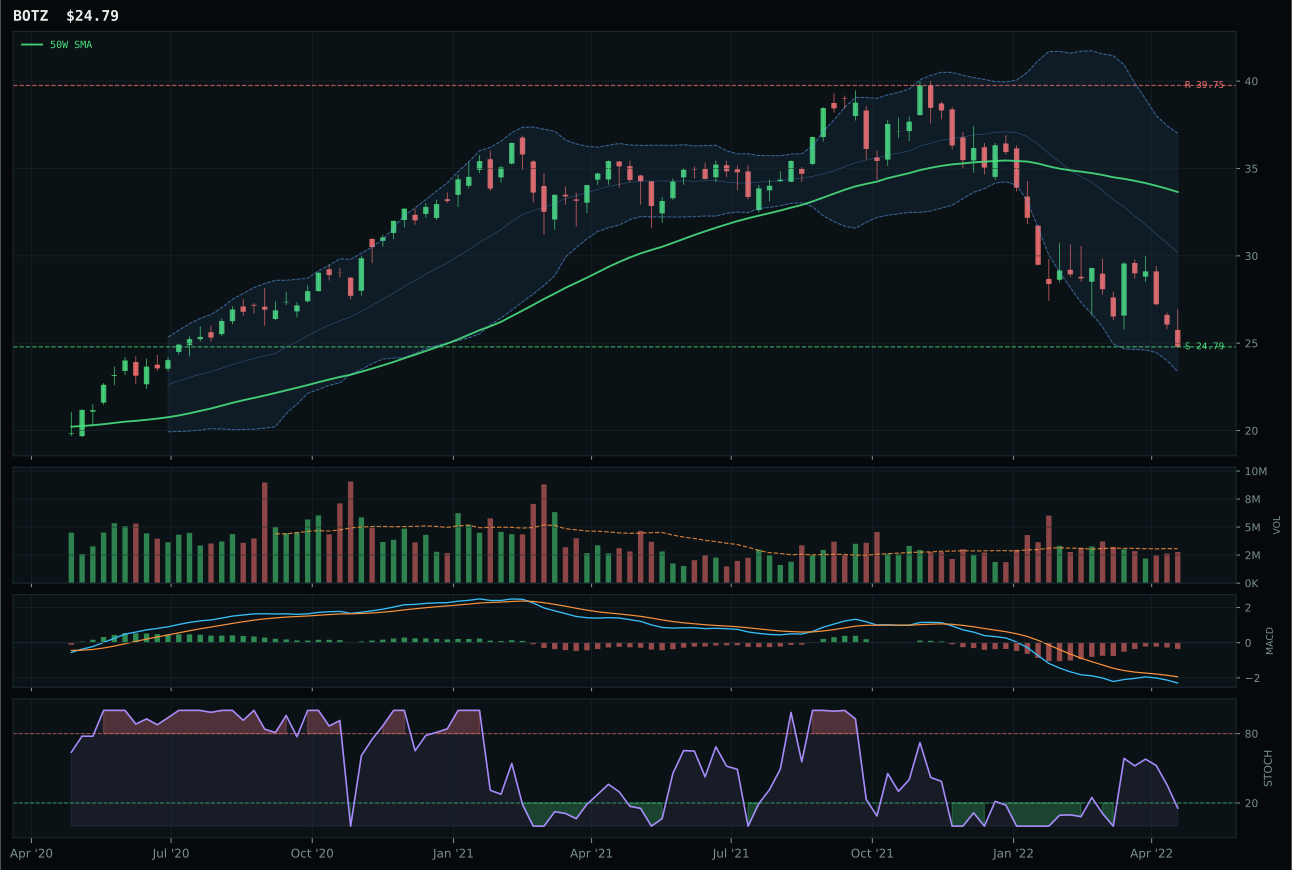
BOTZ has a pullback into support profile with -13.2% 13-week relative strength versus SPY.
A failed hold above support would weaken the setup.
Actionable but governed by invalidation levels.
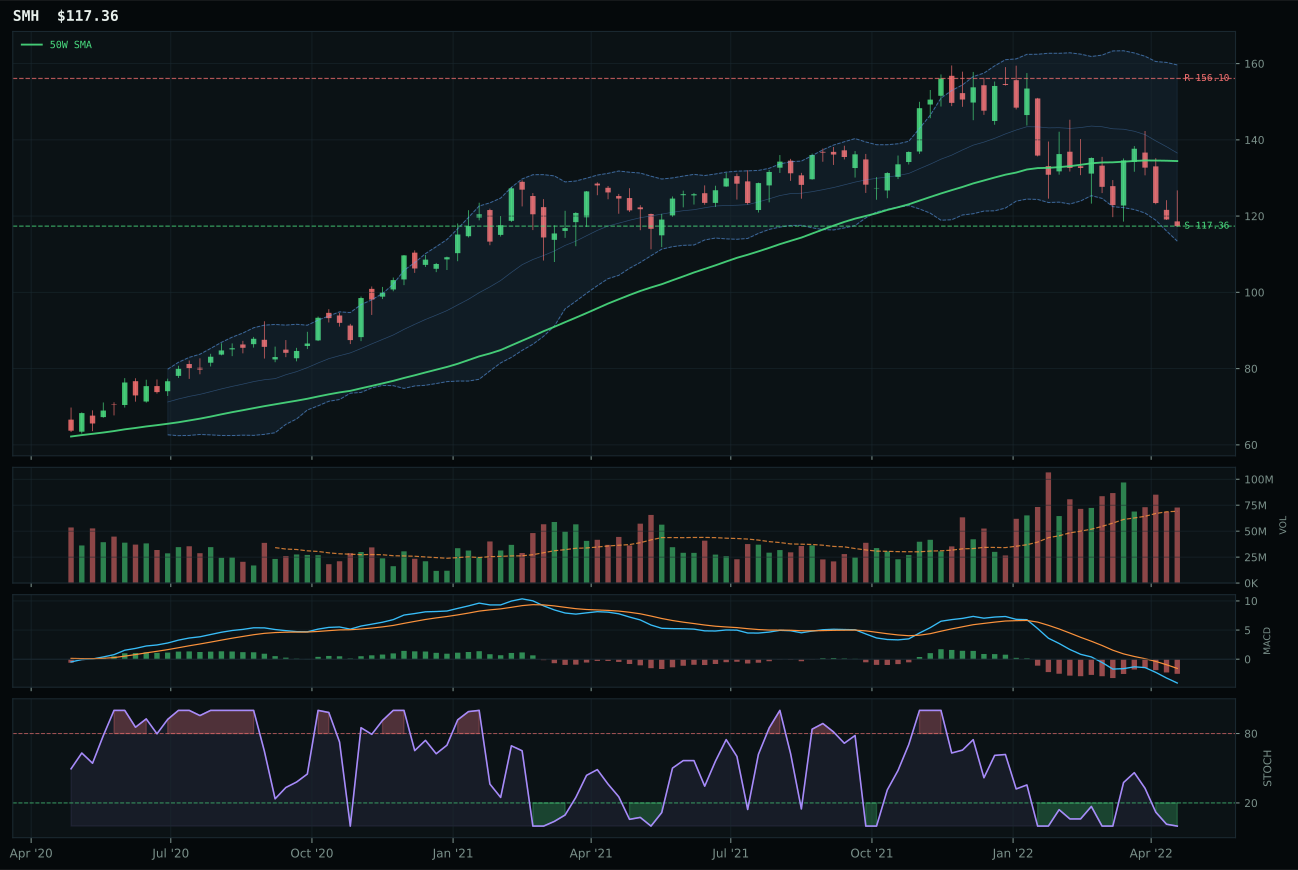
SMH has a pullback into support profile with -10.9% 13-week relative strength versus SPY.
A failed hold above support would weaken the setup.
Actionable but governed by invalidation levels.
SMH wins the AI category despite weakness because it holds the least-bad technical setup among three broken trends. Price sits 12.7% below the 50-week but above the 200-week, landing in a repair zone near the 52-week low where support can be tested at 117.36. The 1.3% category-relative strength barely distinguishes it from AIQ (0.0%), but SMH avoids the thin-participation volume trap that affected AIQ, and its structure scores 63.0 versus AIQ's 61.0 on cleanliness and support definition. Neither setup is attractive—momentum scores are zero across the board, MACD is bearish-weakening, stochastic RSI is oversold—but SMH's neutral volume and lesser distance from support make it marginally more defensible than peers that show deteriorating MACD or volume participation that rejects the move.
AI receives 0% allocation this week, ranking 9th or 10th in the portfolio. The category score of 4.0 reflects a macro regime that is actively hostile: liquidity stress (-12), credit stress (-8), broad market bear (-8), and dollar pressure (-4) compound to create category-level macro fit of only 18.0/100. Even the technical winner, SMH, posts just 22.0/100 technical evidence due to -10.9% RS versus SPY and zero momentum confirmation over four and thirteen weeks. This is not a setup that improves with patient waiting—the damage is structural, not tactical. For AI to earn a position, either equity risk appetite would need to shift from broken to stable, or credit conditions would need visible relief. Until one of those conditions changes, capital is better deployed into categories like Precious Metals or Traditional Energy where macro tailwinds exist.