
2022-04-15
Informational purposes only. The content in this report, including allocations, analysis, and commentary, is provided solely for informational and educational purposes. It does not constitute financial advice, investment advice, trading advice, or any other type of advice. Past performance does not guarantee future results. Always conduct your own research and consult a qualified financial professional before making investment decisions.
Macro risk engine requires the 50% Defensive overlay for this run; payload selected by cause: Inflation Scarcity.
Weekly Allocation
| Ticker | Category | Weight | Role |
|---|---|---|---|
| XLE | 50% | Overlay | |
| MOO | Agriculture & Livestock | 10% | Top-2 (10%) |
| XOP | Traditional Energy | 10% | Top-2 (10%) |
| GLD | Precious Metals | 5% | Tier-2 (5%) |
| XLU | Utilities & Infrastructure | 5% | Tier-2 (5%) |
| URNM | Nuclear Energy | 5% | Tier-2 (5%) |
| ITA | Defense & Aerospace | 5% | Tier-2 (5%) |
| COPX | Industrial Metals | 5% | Tier-2 (5%) |
| CIBR | Technology | 5% | Tier-2 (5%) |
Trade Instructions — Monday Open
Sell the tranche from 2022-03-18 (completing its 4-week hold). Buy the new tranche. Instructions show net portfolio changes — same-asset positions cancel, weight changes show the delta.
| Action | Ticker | Instruction |
|---|---|---|
| SELL | GLD | Sell 20% of GLD position (reduce 6.25% → 5.00%) |
| SELL | XAR | Sell 33% of XAR position (reduce 3.75% → 2.50%) |
| SELL | WEAT | Sell 33% of WEAT position (reduce 3.75% → 2.50%) |
| SELL | ILF | Sell 50% of ILF position (reduce 2.50% → 1.25%) |
| BUY | CIBR | Buy CIBR — 25.00% of freed cash (adds 1.25% to portfolio) |
| BUY | MOO | Buy MOO — 50.00% of freed cash (adds 2.50% to portfolio) |
| BUY | ITA | Buy ITA — 25.00% of freed cash (adds 1.25% to portfolio) |
Current Portfolio After Trade
Combined holdings across all 4 active tranches. Each tranche is 25% of the portfolio.
| Ticker | % of Portfolio | Weight Bar |
|---|---|---|
| XLE | 50.00% | |
| XOP | 10.00% | |
| GLD | 5.00% | |
| URNM | 5.00% | |
| XLU | 3.75% | |
| CIBR | 3.75% | |
| MOO | 3.75% | |
| XAR | 2.50% | |
| WEAT | 2.50% | |
| COPX | 2.50% | |
| REMX | 2.50% | |
| VEGI | 2.50% | |
| ITA | 2.50% | |
| ILF | 1.25% | |
| IGF | 1.25% | |
| SLV | 1.25% |
Macro Regime — Transition / Mixed
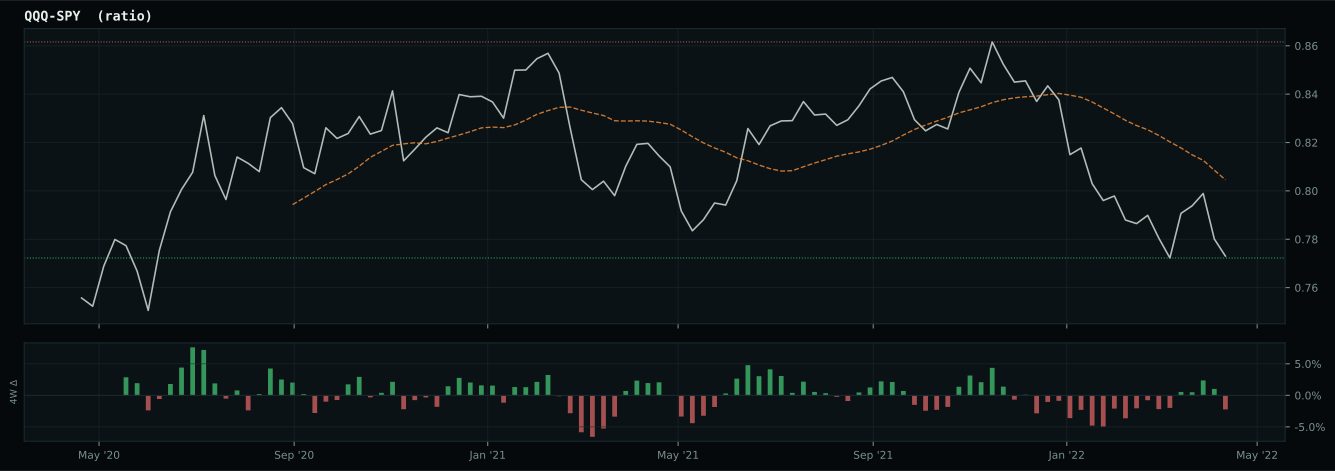
growth data is not confirming the weak market-implied risk appetite signal
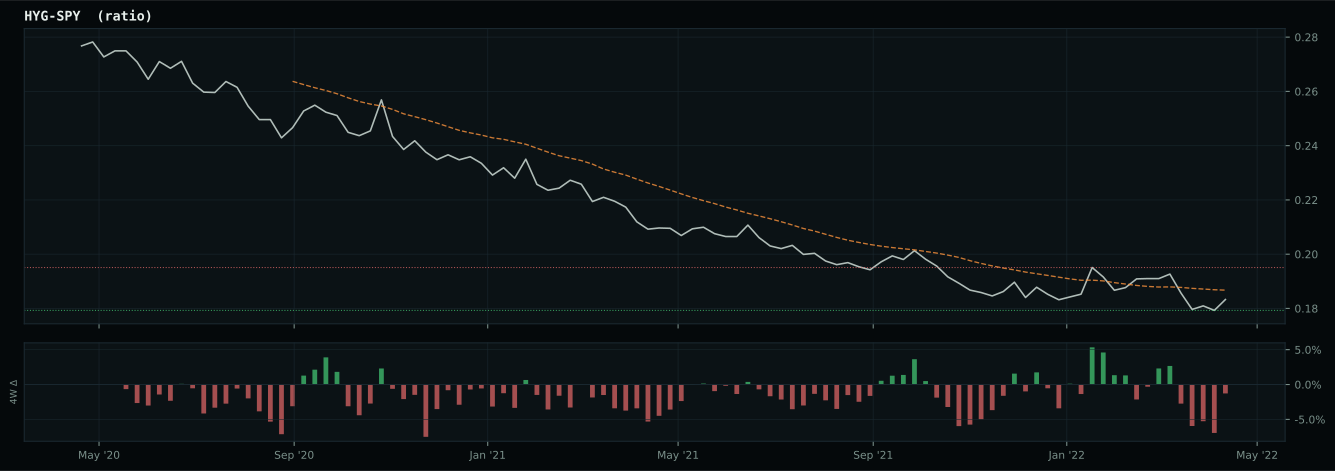
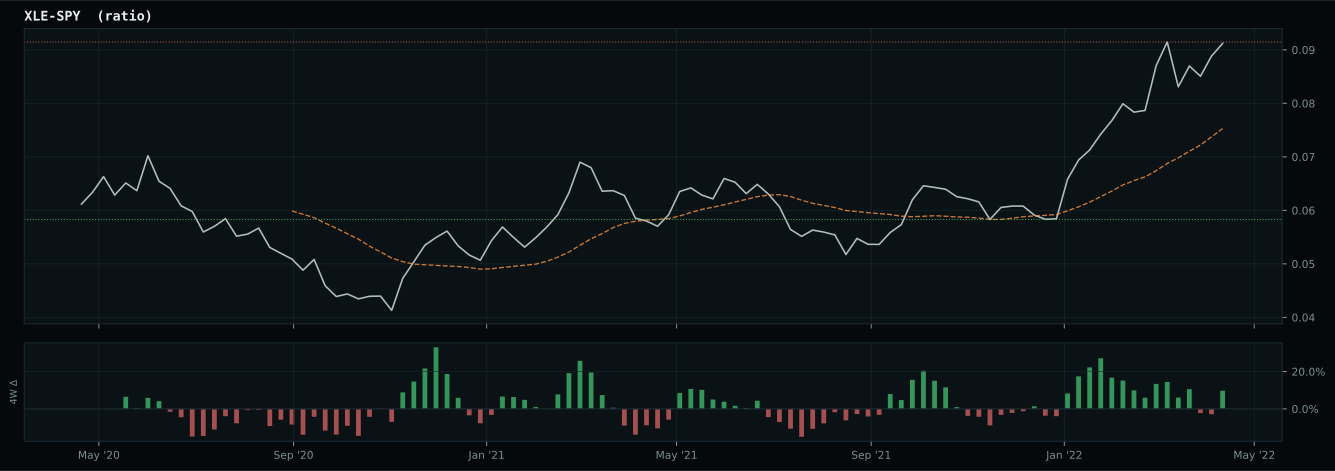
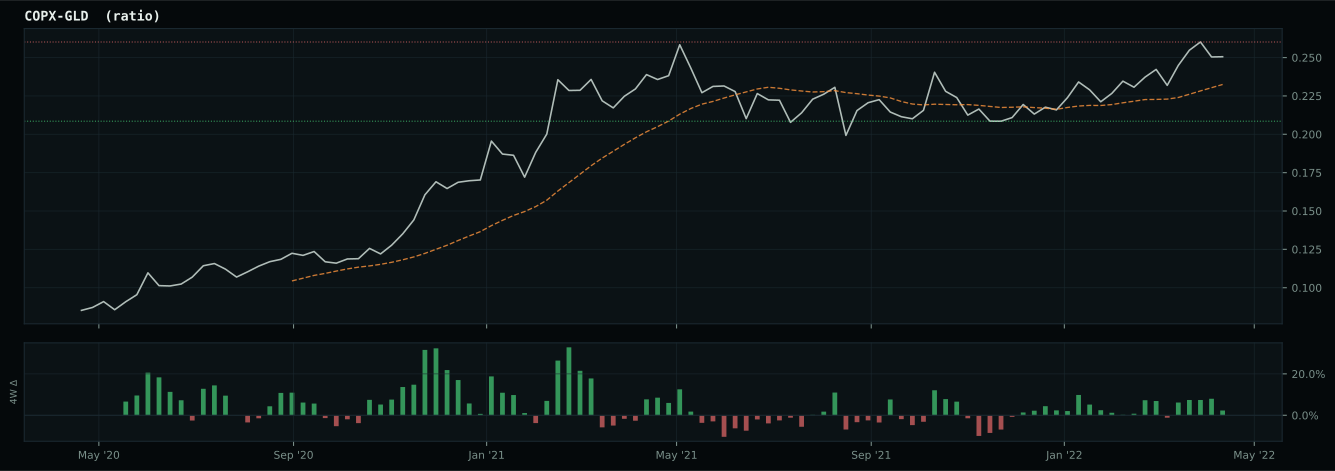
Defensive overlay cause is inflation/scarcity: energy, commodity breadth, or oil-versus-gold confirmation is stronger than the broad equity tape, so the sleeve owns the inflation pressure. XLE has been confirmed above its 8W SMA and is eligible.
Macro Evidence Charts
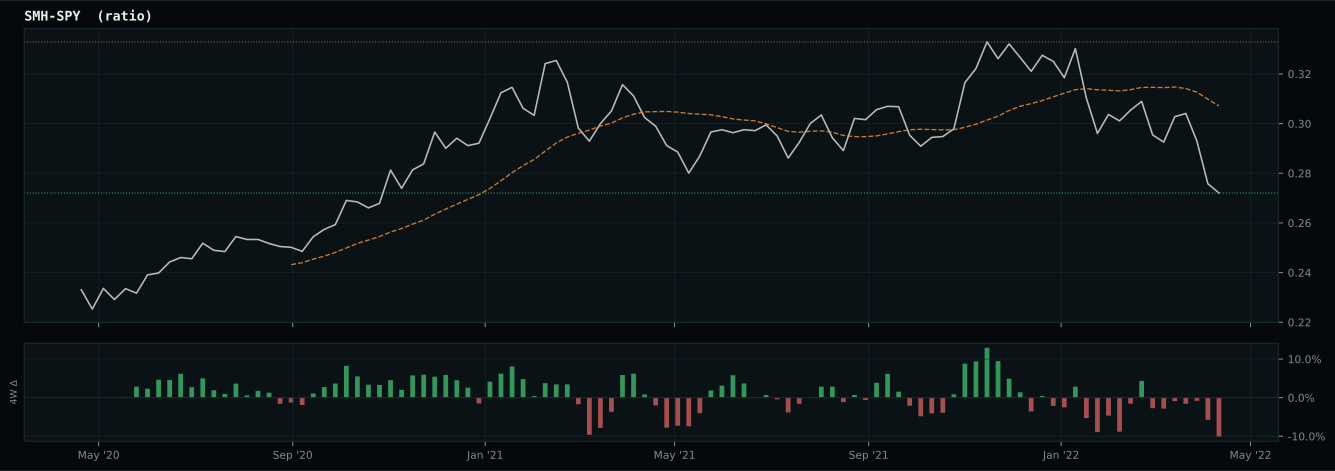
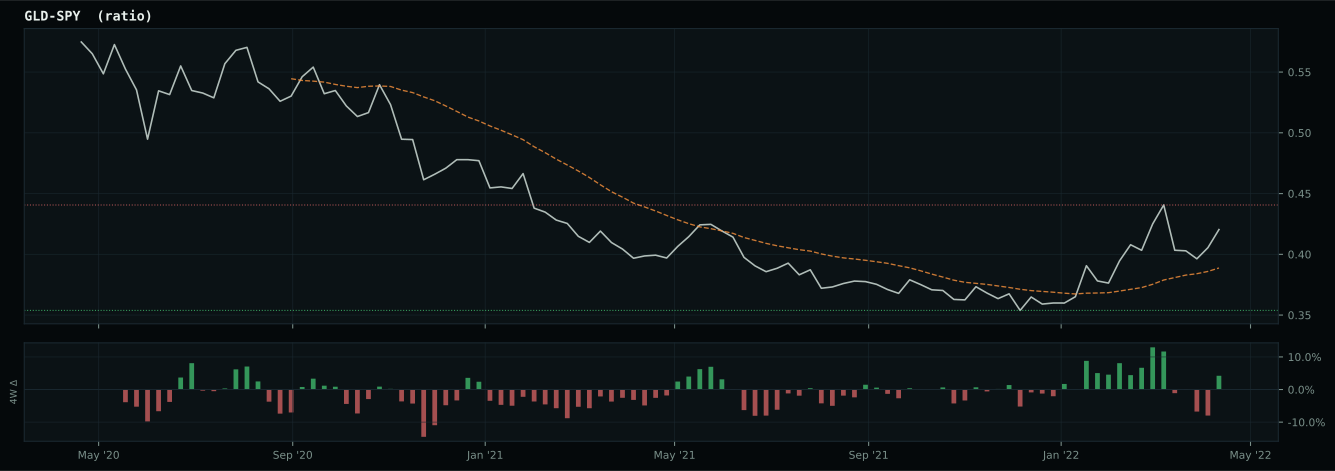
Market-implied signals behind the macro regime scores. Each ratio compares two assets; the direction and slope of the ratio is what the macro engine reads.
Crypto Regime — NoCrypto
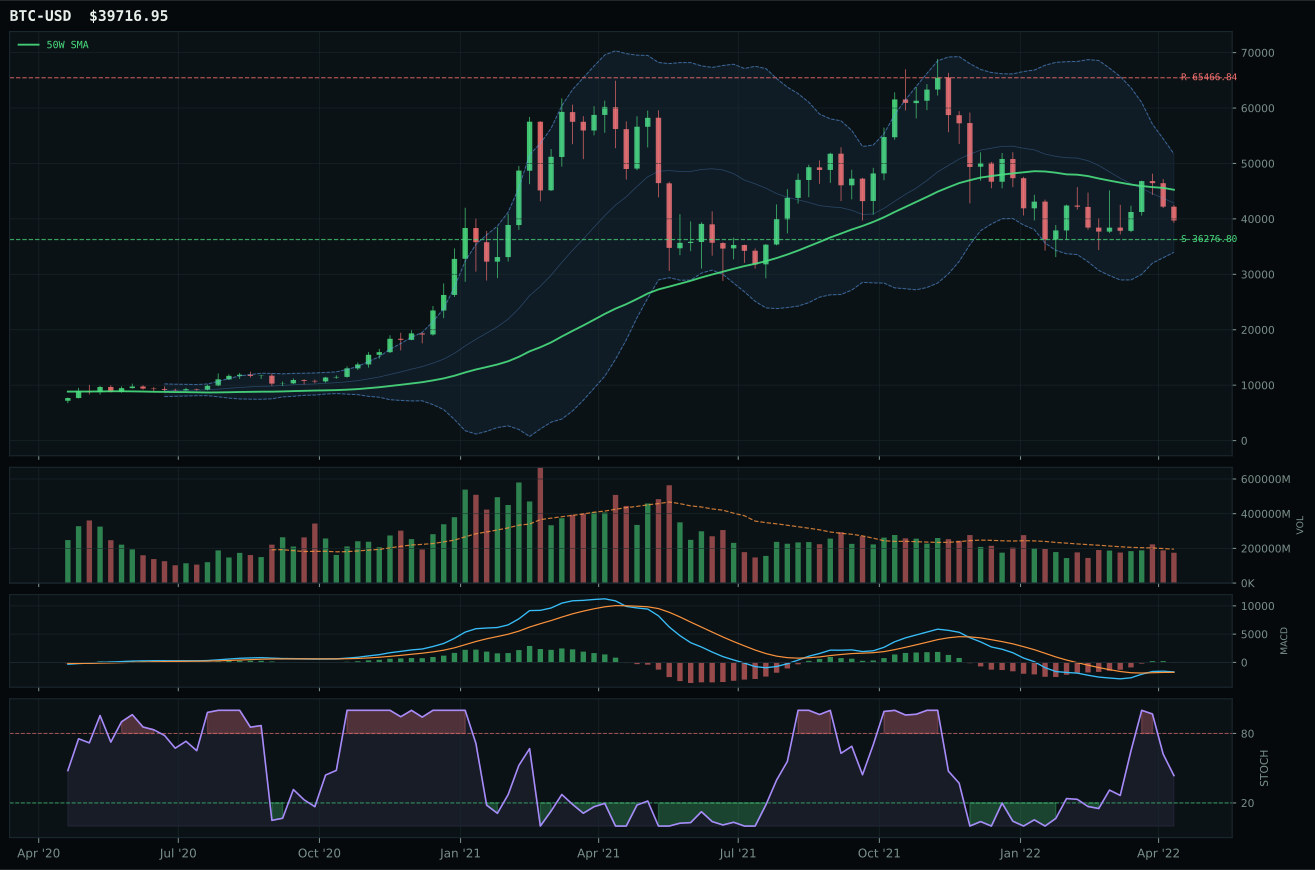
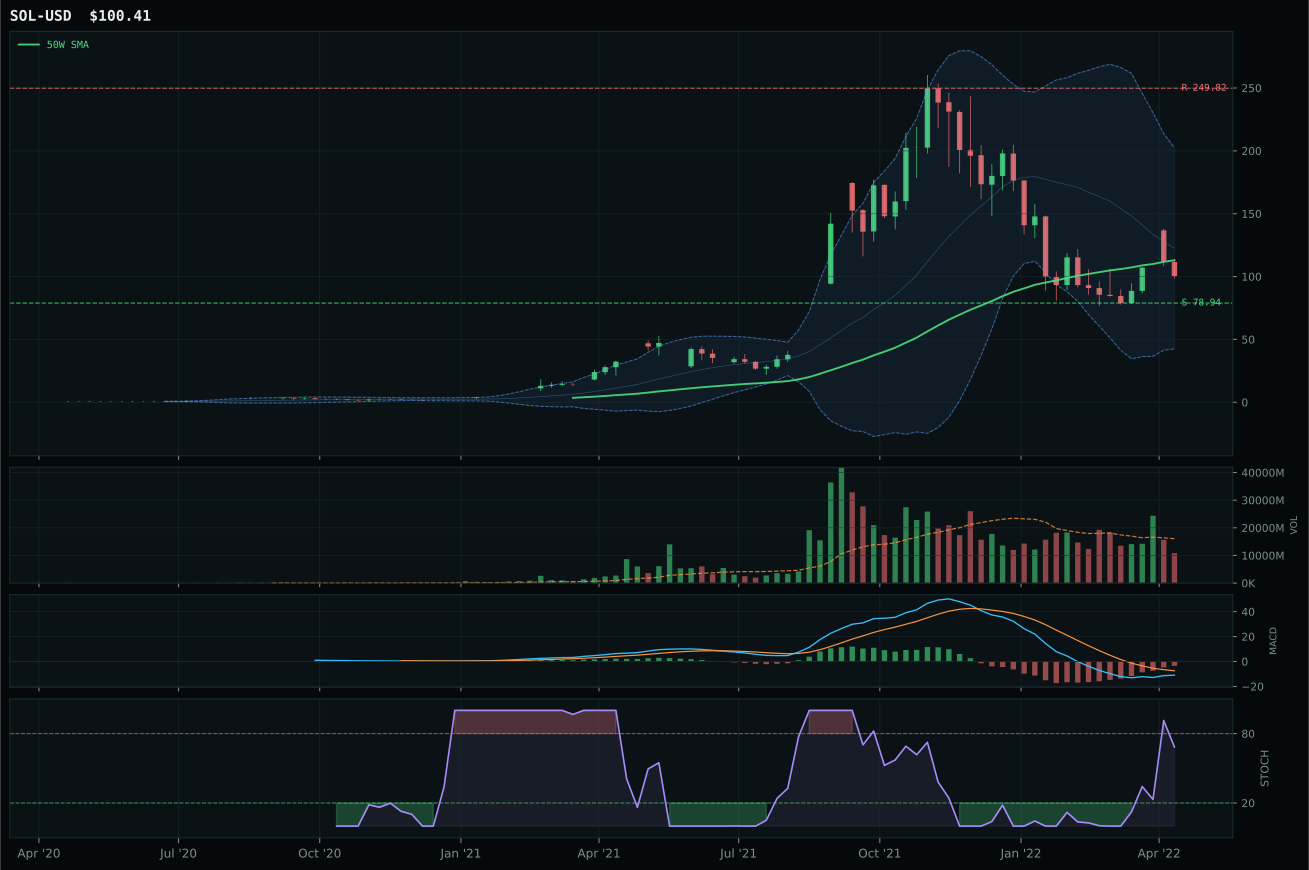
ValueBTC not armed: BTC has not made the first post-breakdown touch of the 200W buy zone after losing the 50W
TrendBTC not confirmed
one or more available conditions failed
Category Rankings
| Rank | Category | Winner | Score | Alloc | 4W Ret | Peers (4W) |
|---|---|---|---|---|---|---|
| 1 | Agriculture & Livestock | MOO | 89.4 | 20% | -11.30% | WEAT +7.6% · VEGI -10.7% |
| 2 | Traditional Energy | XOP | 75.8 | 20% | -7.16% | FCG -7.7% · XLE +0.7% |
| 3 | Precious Metals | GLD | 74.3 | 10% | -9.42% | GDX -25.4% · SLV -18.3% |
| 4 | Utilities & Infrastructure | XLU | 67.9 | 10% | -6.20% | IGF -5.2% · PAVE -9.2% |
| 5 | Nuclear Energy | URNM | 64.5 | 10% | -33.13% | URA -27.6% · NLR -8.2% |
| 6 | Defense & Aerospace | ITA | 61.7 | 10% | -11.96% | XAR -15.3% · ROKT -10.0% |
| 7 | Industrial Metals | COPX | 59.4 | 10% | -22.98% | PICK -21.4% · REMX -17.3% |
| 8 | Technology | CIBR | 45.3 | 10% | -20.00% | IGV -13.7% · XLK -7.7% |
| 9 | Emerging Markets | ILF | 26.0 | 0% | -12.57% | INDA -10.0% · IEMG -8.6% |
| 10 | AI | SMH | 16.7 | 0% | -3.03% | AIQ -10.7% · BOTZ -13.3% |
Agriculture & Livestock — MOO
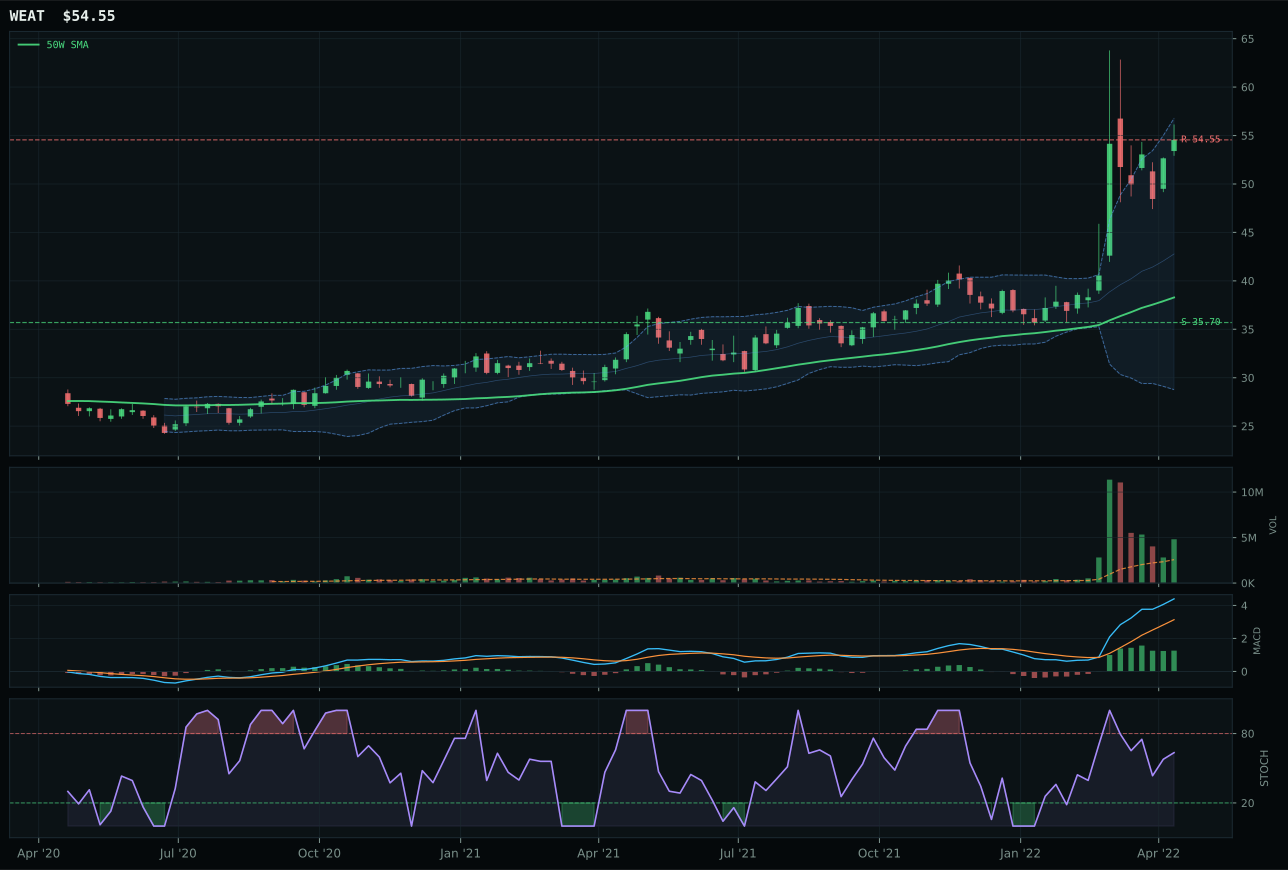
WEAT has a vertical extension profile with 58.6% 13-week relative strength versus SPY.
A failed hold above support would weaken the setup.
Actionable but governed by invalidation levels.
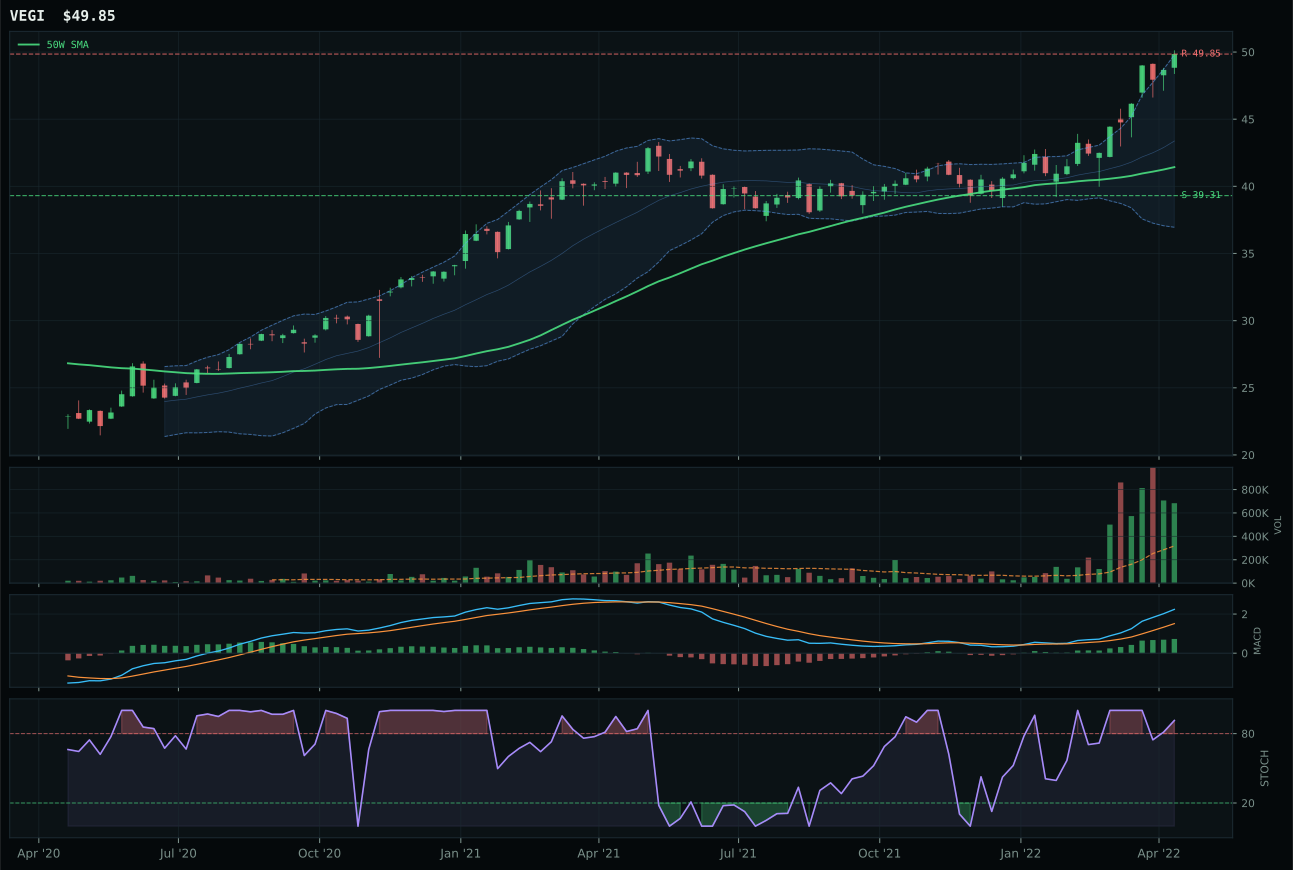
VEGI has a vertical extension profile with 23.3% 13-week relative strength versus SPY.
A failed hold above support would weaken the setup.
Actionable but governed by invalidation levels.
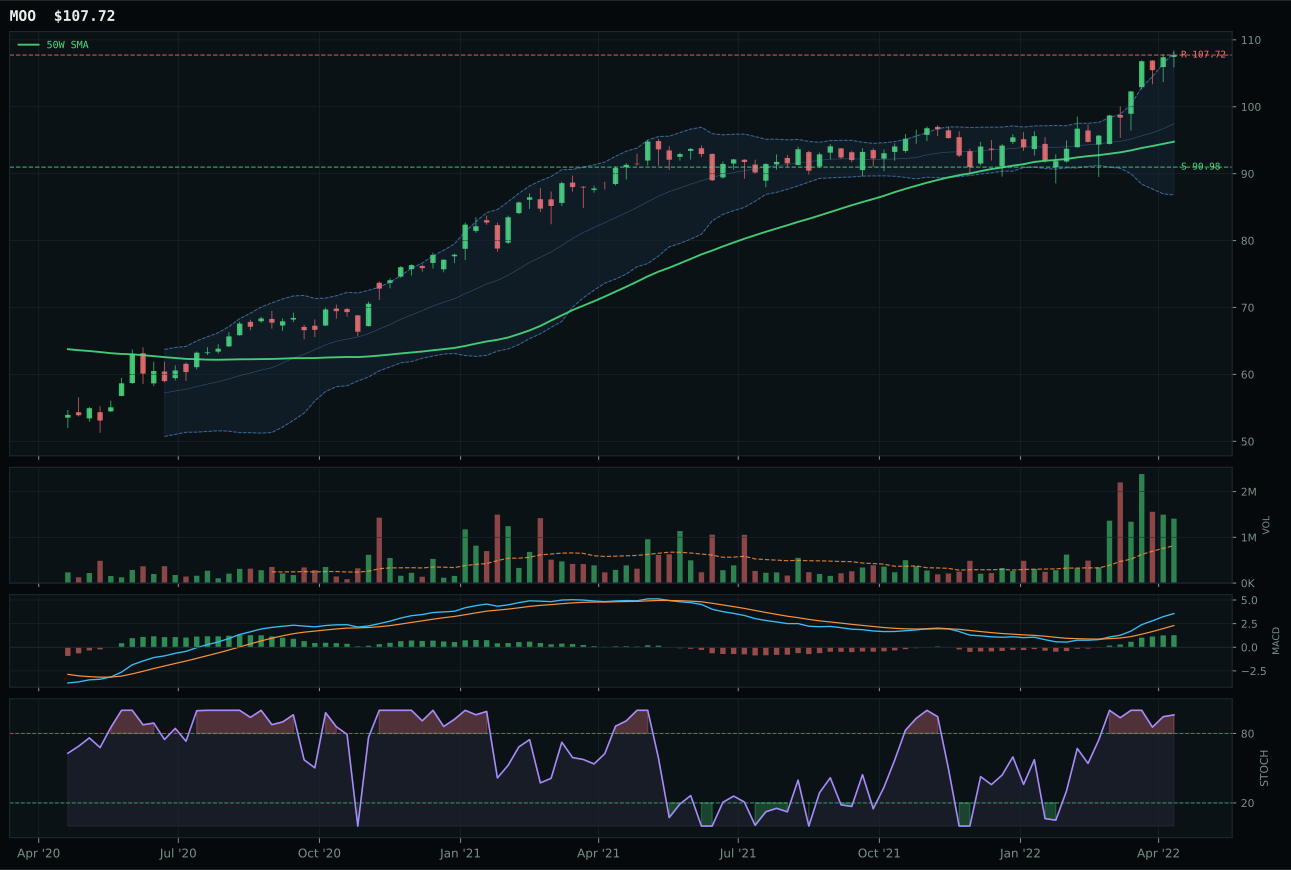
MOO has a neutral structure profile with 18.5% 13-week relative strength versus SPY.
A failed hold above support would weaken the setup.
Actionable but governed by invalidation levels.
MOO captured top-2 selection with an 89.4 category score and 83.7 reasoned technical evidence that reflects a rare combination of early-trend positioning and confirmation sponsorship. At 13.7% above the 50W with 1.72x volume accumulation, this is extension with purpose—new money is flooding in rather than profit-taking into thin liquidity. WEAT's 52.8% thirteen-week return and 58.6% SPY relative strength are more dramatic, yet its bullish-but-flattening MACD and 42.5% distance from the 50W signal momentum is maturing; stochastic RSI falling to neutral tells the story of overbought buyers exhausting themselves. MOO's cleaner structure at 83.1 versus WEAT's 73.2, combined with neutral-structure positioning rather than vertical extension, creates an asymmetry where MOO offers higher conviction at lower risk. The 18.5% SPY relative strength and accumulation-confirmation volume are the markers of a genuinely sponsored move.
Agriculture landed in the top-2 tier at 89.4 because macro conditions have turned aggressively bullish for commodities: supply shortage adds +13, inflation pressure adds +10, real asset sponsorship adds +8, and commodity-breadth-positive adds +5. This is 36 points of macro tailwind in an environment where defensive rotation and broad-market-bear are also active, creating a dual bid from both yield-seeking and hedging flows. The 70.0 ETF-level macro fit for MOO reflects the alignment of technical strength with actual descriptors—this is not a setup winning on technicals alone, but a category where fundamentals have shifted. MOO's 100 momentum confirmation and 84.5 persistence indicate this is not a one-week squeeze but an established trend with multi-week holding power; the allocation sits at 20% because agricultural outperformance is sustainable as long as supply concerns remain unresolved.
Traditional Energy — XOP
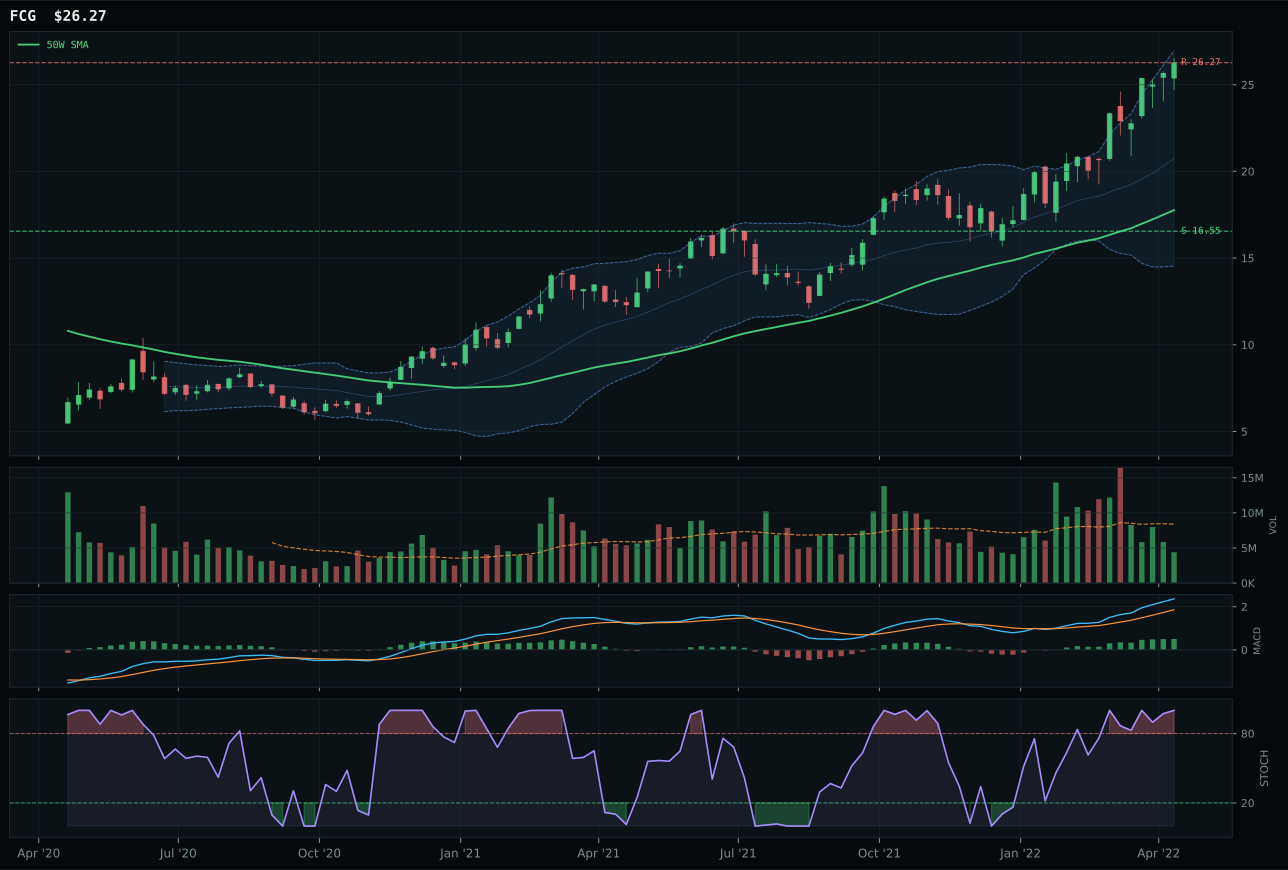
FCG has a vertical extension profile with 37.5% 13-week relative strength versus SPY.
A failed hold above support would weaken the setup.
Actionable but governed by invalidation levels.
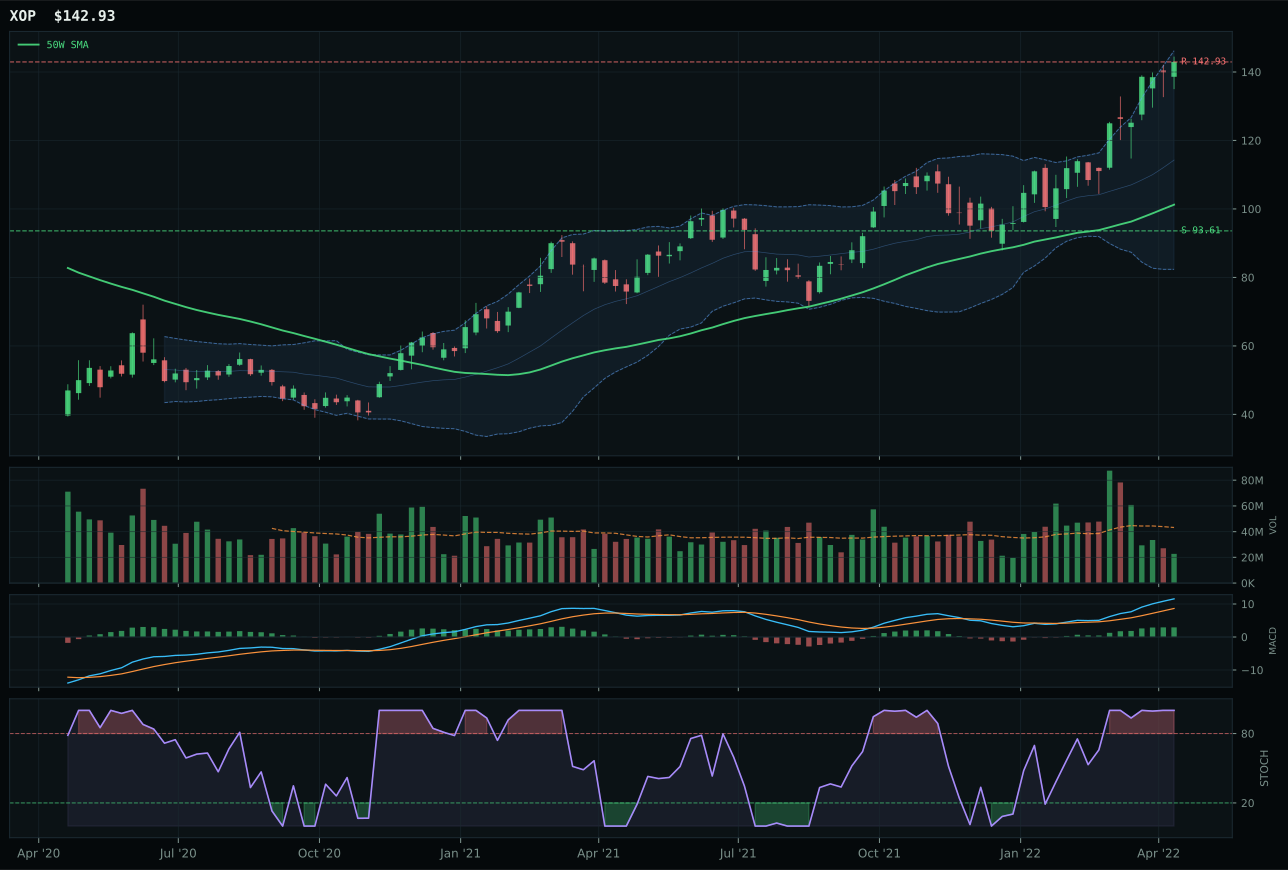
XOP has a vertical extension profile with 34.6% 13-week relative strength versus SPY.
A failed hold above support would weaken the setup.
Actionable but governed by invalidation levels.
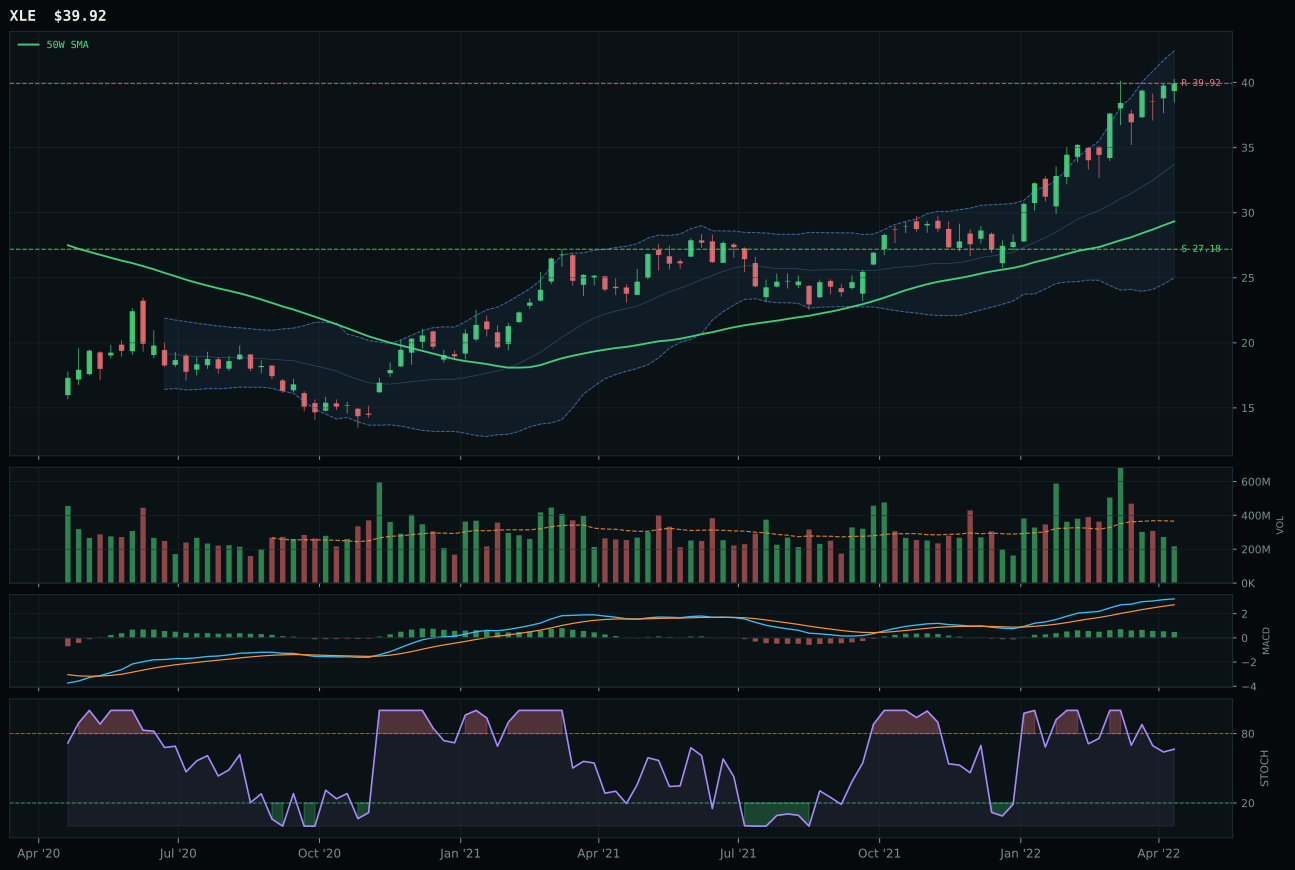
XLE has a vertical extension profile with 29.6% 13-week relative strength versus SPY.
A failed hold above support would weaken the setup.
Actionable but governed by invalidation levels.
XOP captured the top-2 position at 75.8 by winning a tight three-way race where all three contenders posted 100 momentum scores, but risk/reward and structure differentiated the leader. At 39.7 risk/reward versus FCG's 39.5, the gap is marginal, yet XOP's 73.3 structure cleanliness versus FCG's 70.7 and its marginally less stretched position at 41.2% versus 47.9% from the 50W reflect superior entry geometry. Both sit at overbought stochastic RSI momentum of 1.00 with bullish-improving MACD, but FCG's 37.5% SPY relative strength is more aggressive than XOP's 34.6%, signaling that one is being chased harder than the other. Volume confirmation of 64.5 for XOP versus thin participation for both reveals that XOP is attracting more steady buying, while FCG's strength is more speculative. This is exploration beta in a sponsored energy environment, and XOP's broader index participation gives it higher portfolio integration odds.
Traditional energy earned top-2 selection and 10% allocation because energy-scarcity adds +16, inflation-pressure adds +10, supply-shortage adds +9, and real-asset-sponsorship adds +7—a remarkable 42-point macro tailwind at the category level. The 85.0 category macro fit is the highest in the portfolio, reflecting that this is the regime's primary beneficiary, and XOP's 59.0 ETF-level macro fit shows the exploration beta proxy is properly aligned with the macro opportunity. XOP's 28.8% thirteen-week return and 100 persistence score indicate this is not a flash momentum trade but an established trend with multi-month support; the 41.2% extension is steep, yet in a supply-shortage regime, steep extensions tend to persist until fundamental disruption occurs. This allocation is sized for structural outperformance in an inflationary environment where energy access constrains growth, not for tactical commodity rotation. The category deserves 20% because energy scarcity is a multi-year structural tailwind with no near-term resolution.
Precious Metals — GLD
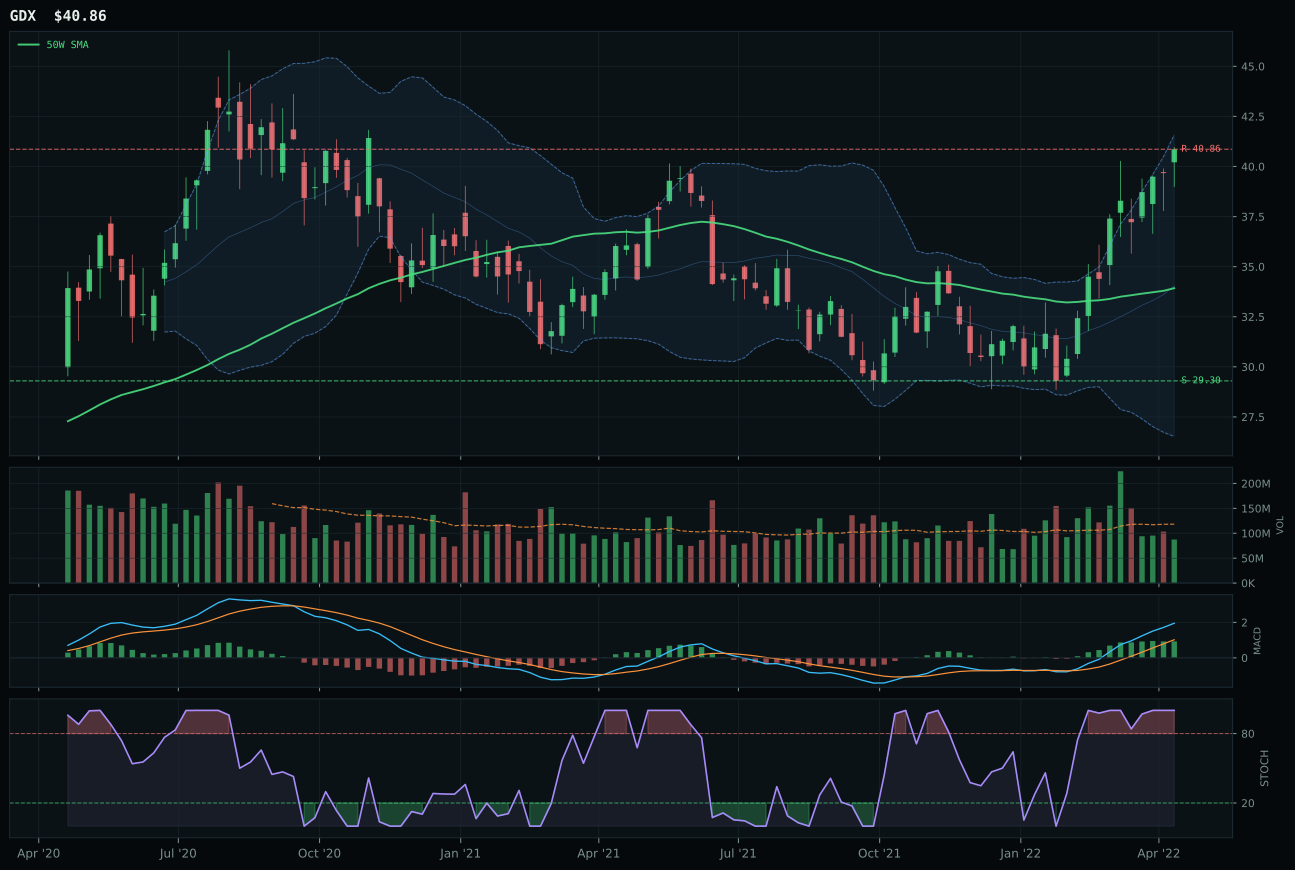
GDX has a vertical extension profile with 37.7% 13-week relative strength versus SPY.
A failed hold above support would weaken the setup.
Actionable but governed by invalidation levels.
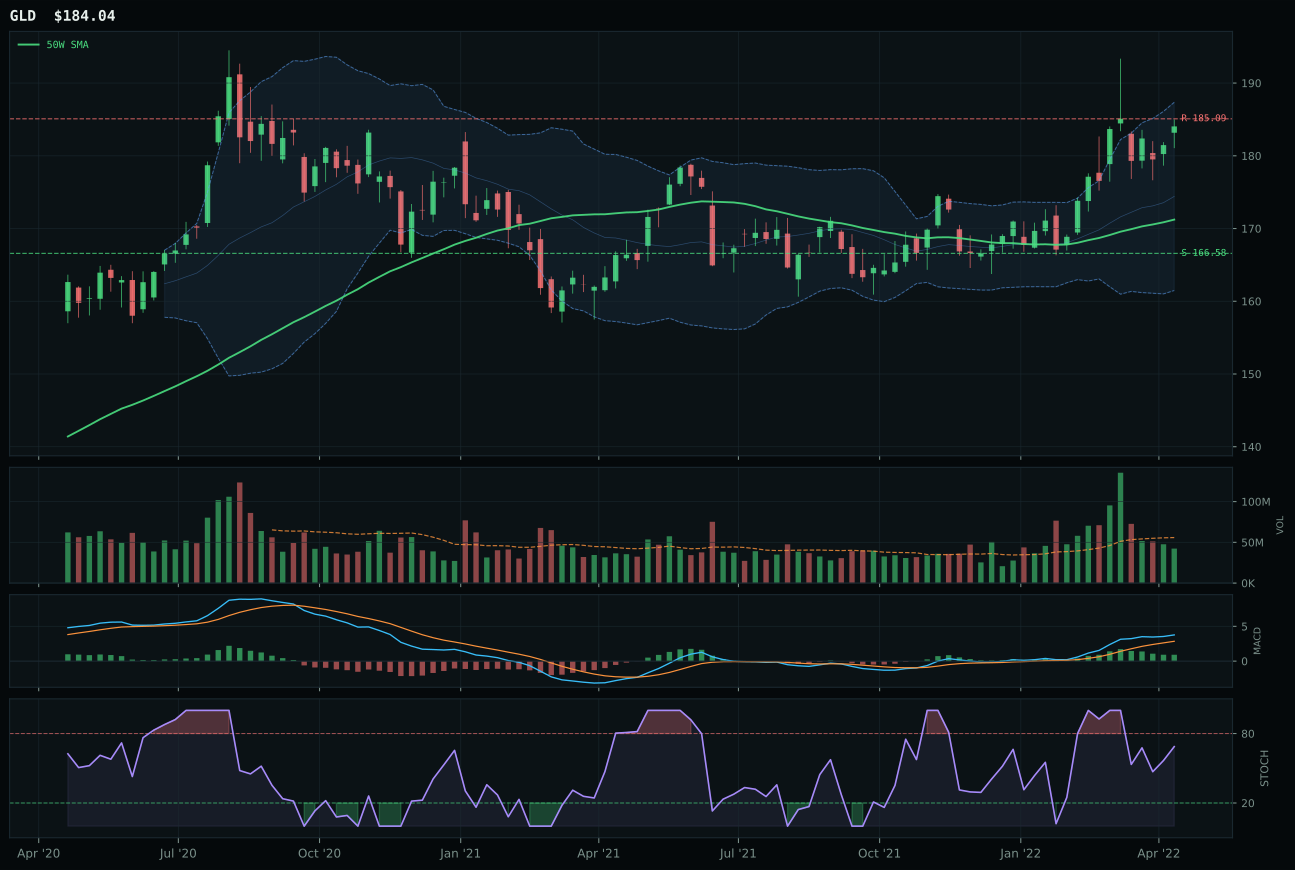
GLD has a neutral structure profile with 14.3% 13-week relative strength versus SPY.
A failed hold above support would weaken the setup.
Actionable but governed by invalidation levels.
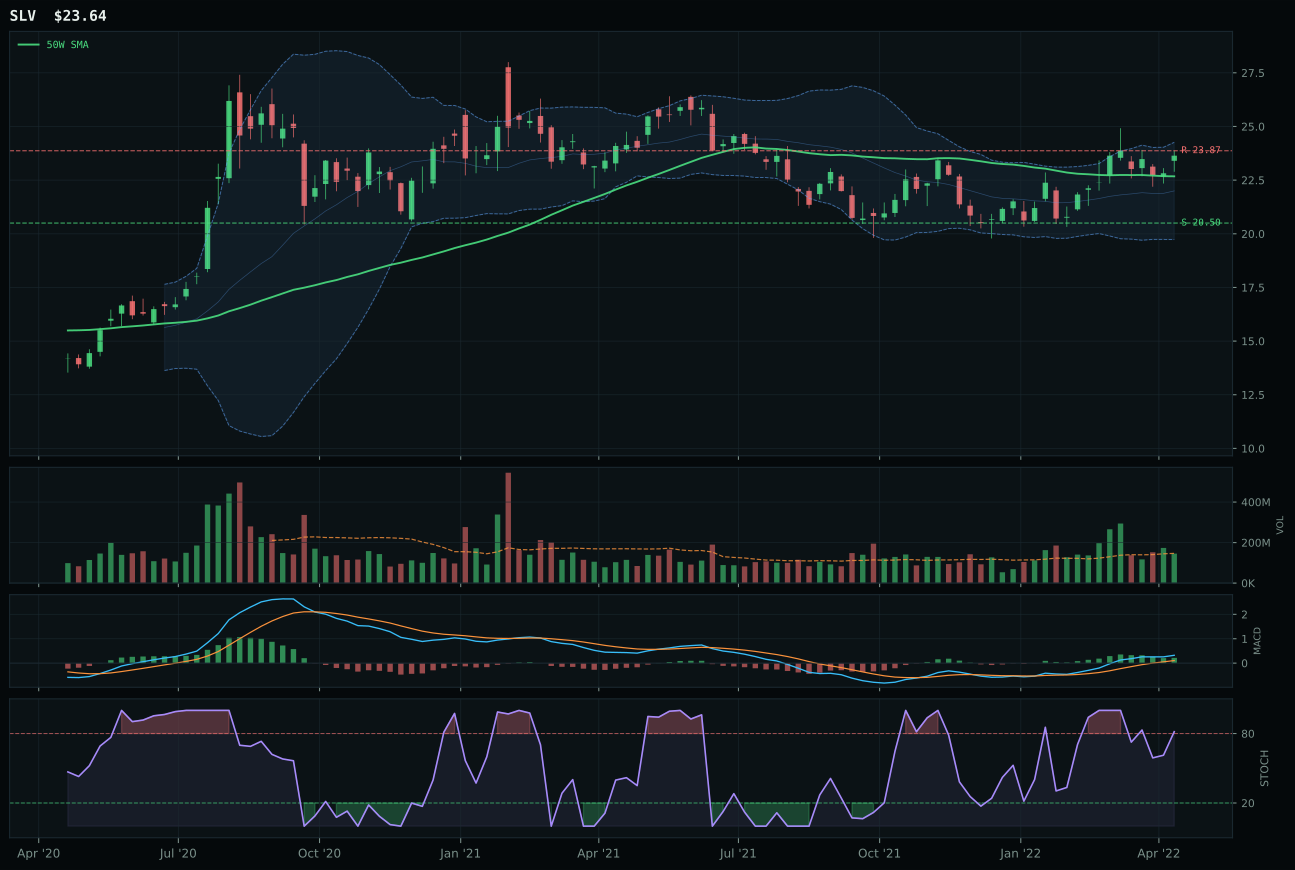
SLV has a neutral structure profile with 17.3% 13-week relative strength versus SPY.
A failed hold above support would weaken the setup.
Actionable but governed by invalidation levels.
GLD edges GDX with a cleaner 78.0 timing score versus 37.0, the result of sitting 7.5% above the 50W while GDX stretches 20.4% above—in an overbought environment, proximity to the moving average is a feature, not a bug. The monetary-hedge bid is active in both, but GLD's bullish-but-flattening MACD combined with stochastic RSI rising mid-zone creates a profile of gradual accumulation, whereas GDX's overbought momentum at stochastic 0.95+ signals toppy exhaustion. Structure cleanliness of 77.7 versus 74.6 and volume confirmation of 73.2 versus thin participation reveal that gold is being bought steadily while gold miners are being chased; MACD improving versus bullish-improving is a subtle but material difference in a risk-management context. GLD's 8.5% thirteen-week return underwhelms GDX's 31.9%, yet persistence of 70.0 versus the miners' trend exhaustion indicates which will hold gains.
Precious metals earned 5% allocation at a 74.3 score despite sitting outside top-2 because the monetary-hedge bid of +14 and defensive-rotation of +7 provide powerful macro support in a transition regime. The 72.0 category-level macro fit ranks it fifth among ten categories, positioning it as a secondary hedge complementary to defense and utilities rather than a primary directional bet. Credit stress is active at -7 and risk-appetite-broken at -5, but these are precisely the conditions that drive gold demand; the category's job is to diversify away from equity and commodity strength. GLD's near-full extension leaves limited upside but substantial downside cushion at 10.5% below support, creating an asymmetry favored for hedge positioning. To justify elevation above 5%, precious metals would need either a macro regime shift toward explicit financial stress or continued deterioration in equity technicals; at current levels, this is a barbell hedge sized appropriately to the portfolio's inflation and volatility exposure.
Utilities & Infrastructure — XLU
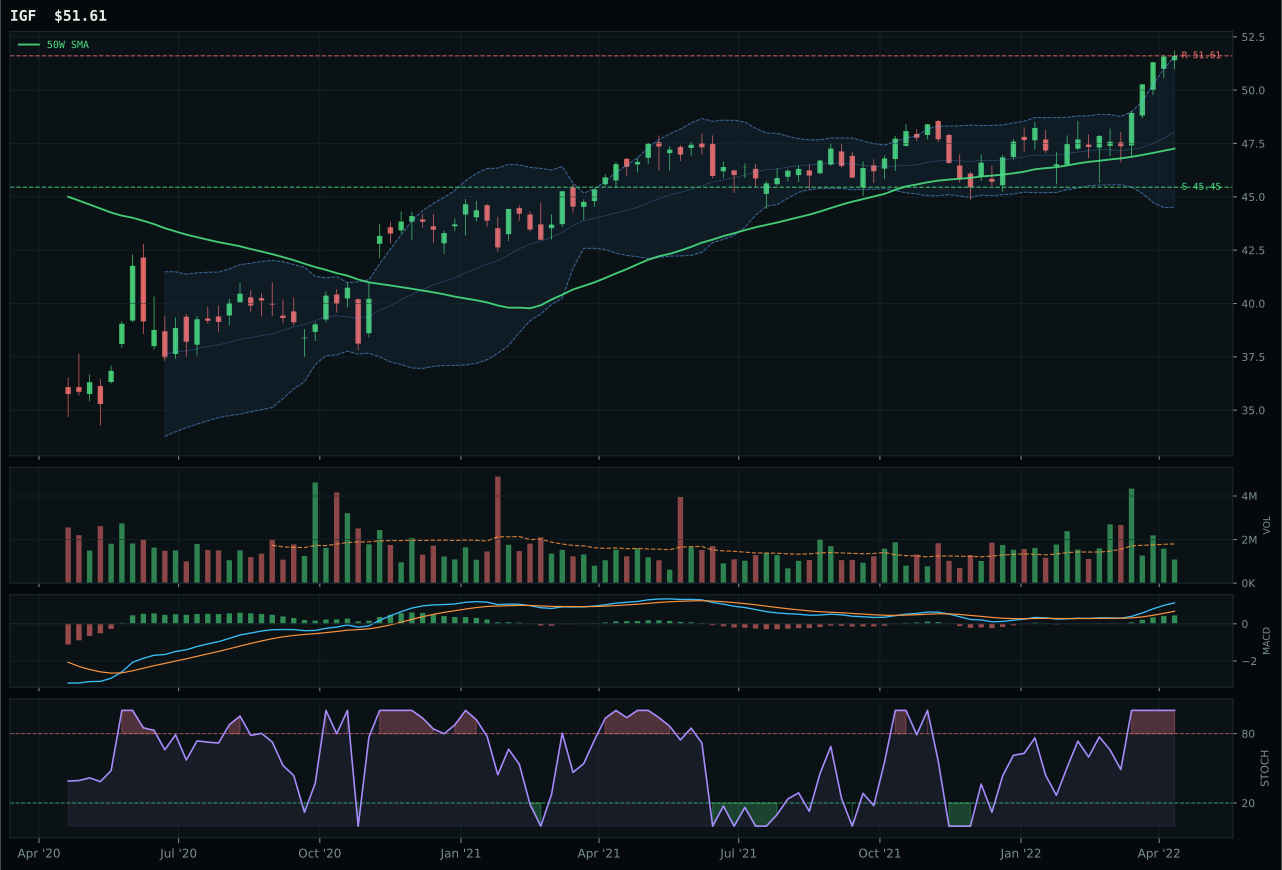
IGF has a neutral structure profile with 12.8% 13-week relative strength versus SPY.
A failed hold above support would weaken the setup.
Actionable but governed by invalidation levels.
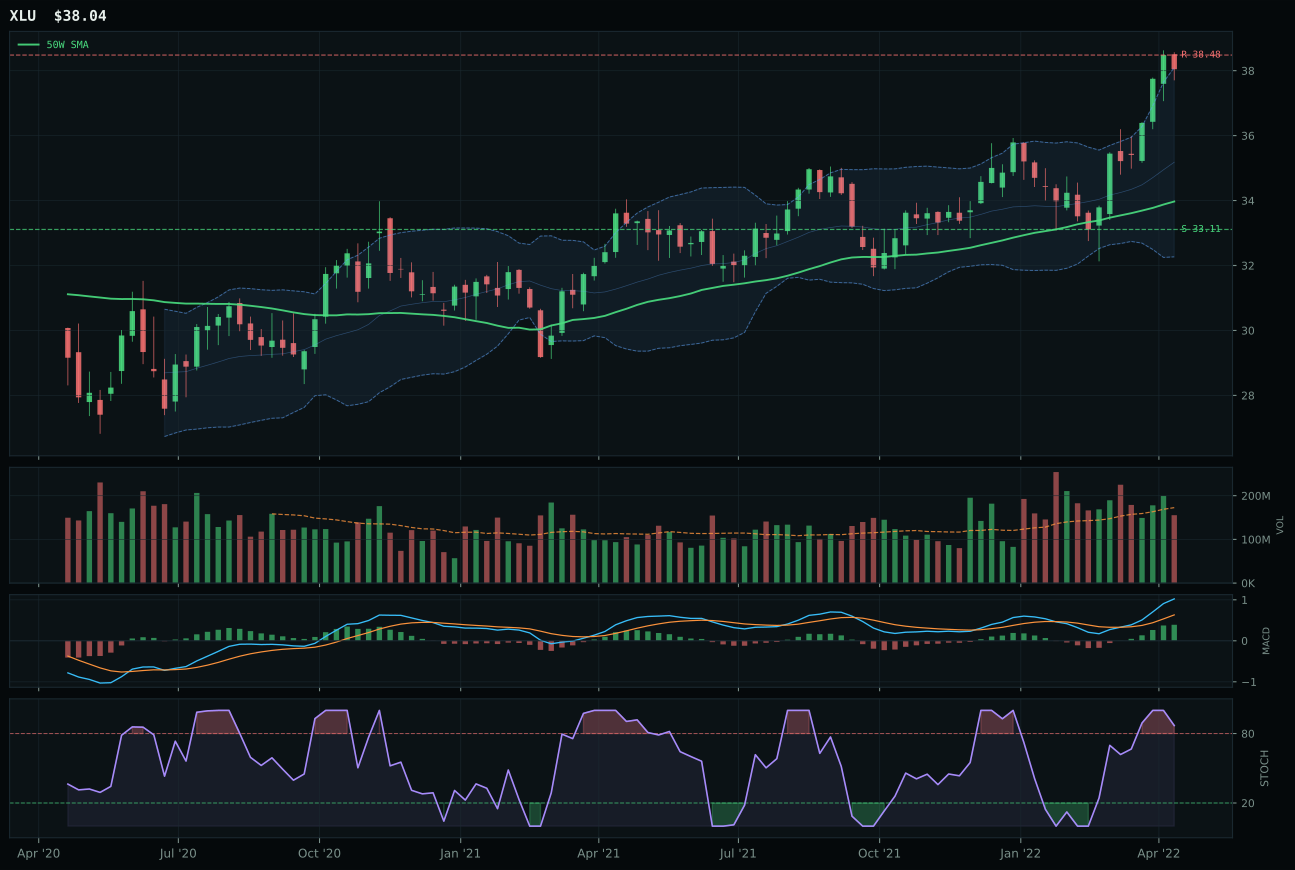
XLU has a neutral structure profile with 15.4% 13-week relative strength versus SPY.
A failed hold above support would weaken the setup.
Actionable but governed by invalidation levels.
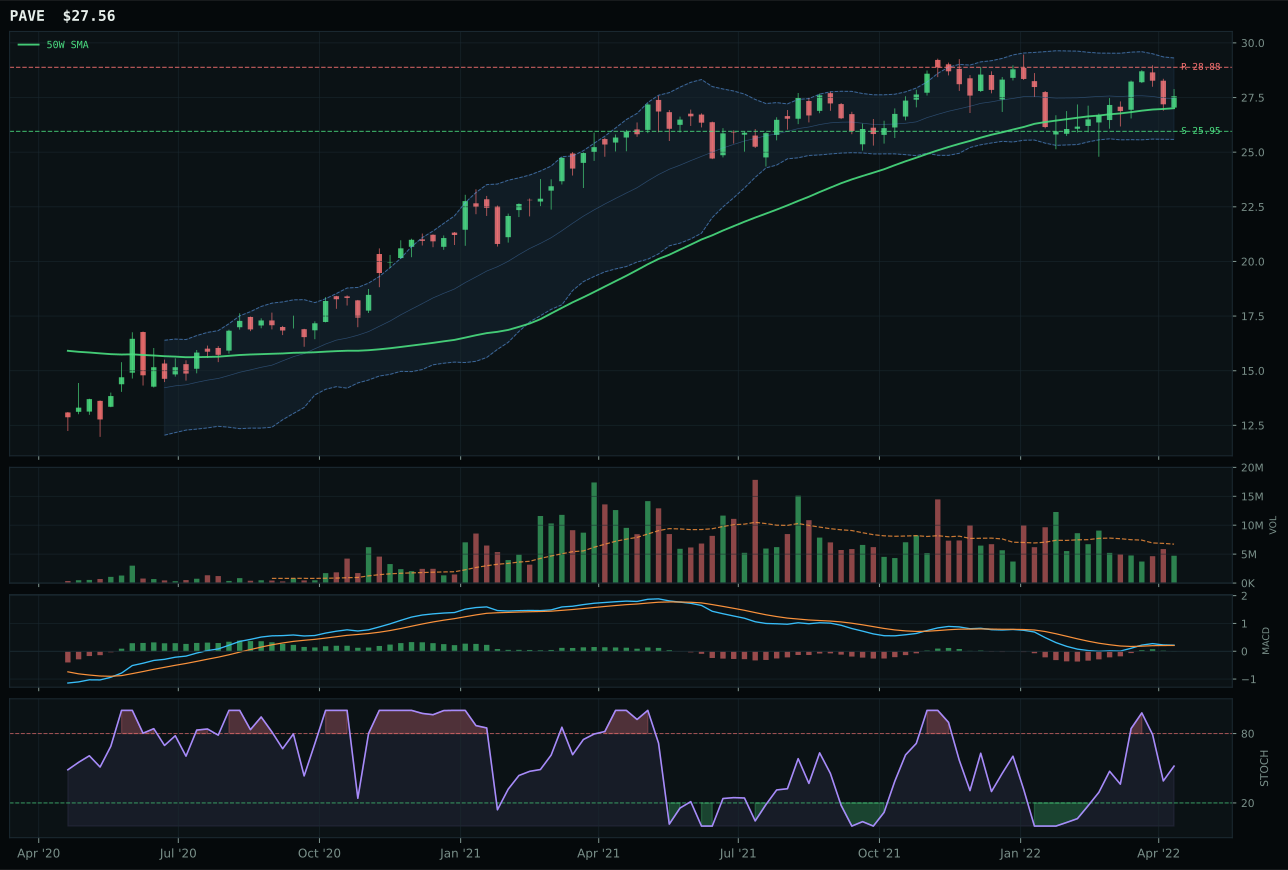
PAVE has a compression near 50W profile with 4.3% 13-week relative strength versus SPY.
A failed hold above support would weaken the setup.
Actionable but governed by invalidation levels.
XLU earned the representative slot with 100 trend confirmation and 100 momentum scores that reflect regulated-utility defense in a broken-risk-appetite environment, while IGF's superior technical evidence of 75.9 could not overcome thinner volume participation. At 12.0% above the 50W with neutral 0.90x volume, XLU sits in the sweet spot of extended-but-not-stretched, where demand is steady rather than desperate; IGF's thin participation and overbought momentum at stochastic 1.00+ reveal a more crowded, exhausted setup. Timing scores of 49 versus 75 reflect risk-reward asymmetry: XLU's -1.1% upside to resistance with 14.9% downside cushion provides defensive appeal, while IGF's -1.9% upside with 13.5% downside is similarly constrained but with thinner accumulation underneath. The 2.6% category-relative strength advantage for XLU indicates this is the household-name defensive proxy winning capital rotation, not the thematic infrastructure play.
Utilities ranked seventh at 67.9 and earned 5% allocation as a secondary defensive anchor complementary to Defense & Aerospace, driven by defensive-rotation (+12) and broad-market-bear (+4) providing macro support in a transition regime. The 60.0 category macro fit reflects balanced support from defensive rotation but headwinds from inflation pressure (-6), creating a profile where utilities is a protective holding rather than a growth engine. XLU's 15.4% SPY relative strength and 9.6% thirteen-week return show utilities are outperforming in a broad downdraft, yet the near-zero upside and modest momentum confirm this is a crowded trade. This allocation is appropriately sized for portfolio stability; utilities benefit from rate-sensitive yield demand and risk-aversion flows but face operating-cost pressures from inflation that cap upside. To justify elevation above 5%, utilities would require either a continued risk-appetite deterioration or a shift in inflation expectations downward—neither is currently priced in, making this a complementary-hedge position rather than a primary directional bet.
Nuclear Energy — URNM
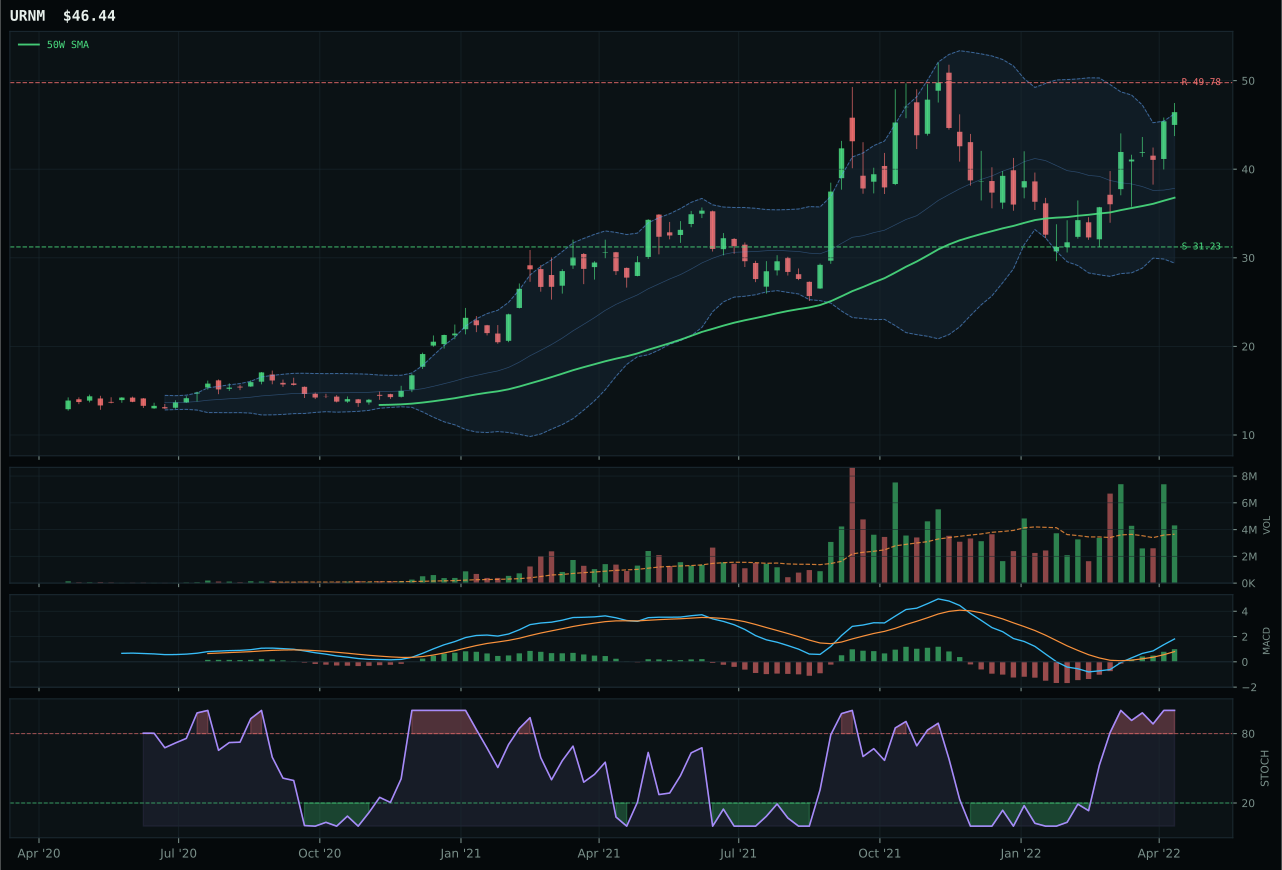
URNM has a vertical extension profile with 33.6% 13-week relative strength versus SPY.
A failed hold above support would weaken the setup.
Actionable but governed by invalidation levels.
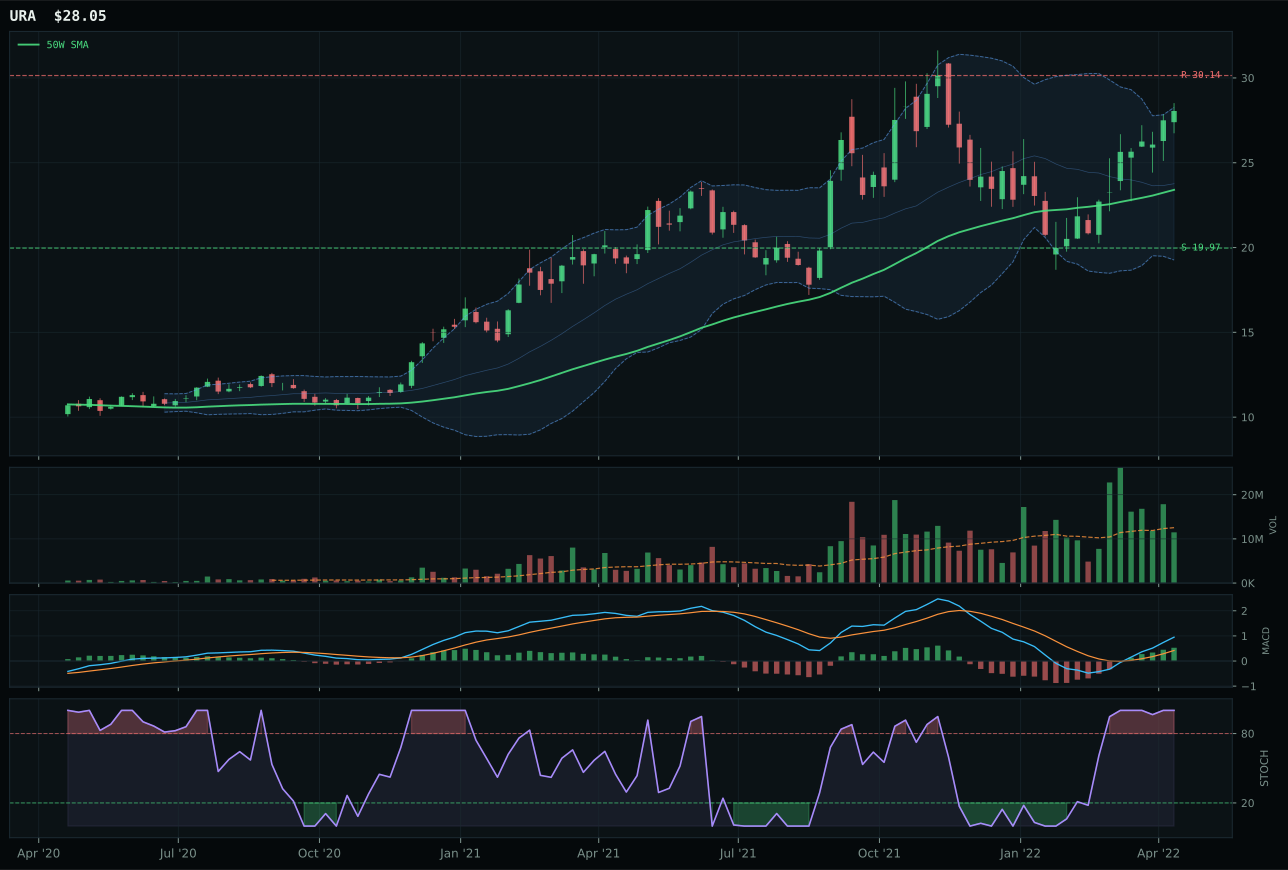
URA has a vertical extension profile with 27.5% 13-week relative strength versus SPY.
A failed hold above support would weaken the setup.
Actionable but governed by invalidation levels.
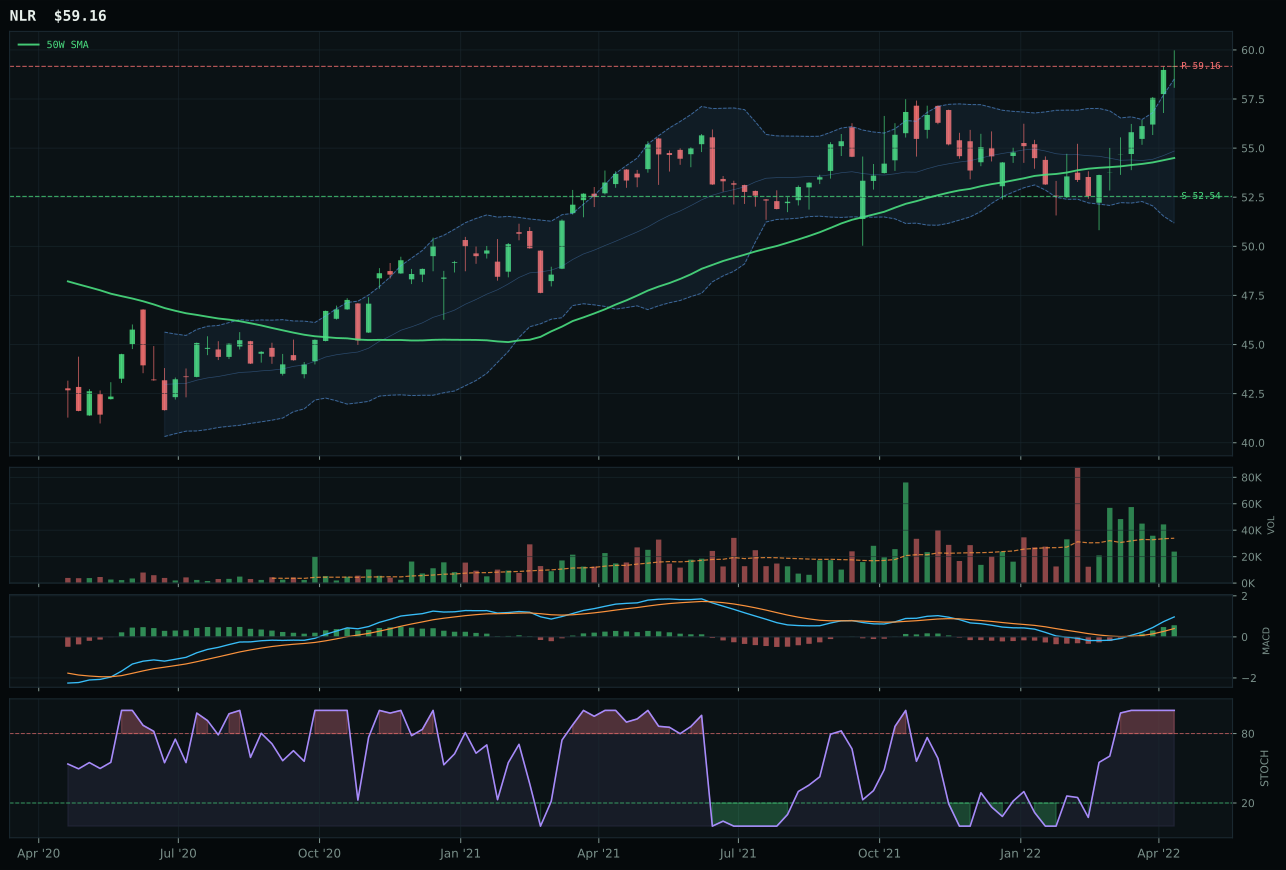
NLR has a neutral structure profile with 14.4% 13-week relative strength versus SPY.
A failed hold above support would weaken the setup.
Tracked, but not top-2 eligible because: .
URNM prevailed over URA despite lower technical evidence of 79.7 versus 76.4 because volume confirmation of 75.0 with above-average participation at 1.18x surpassed URA's neutral volume contribution; category-relative strength of 6.1% versus 0.0% sealed the decision. Both sit 26-27% above their 50-week moving averages in overbought-momentum territory with bullish-improving MACD and identical timing scores of 45, but URNM's above-average participation suggests money is actively rotating into uranium miners rather than simply covering shorts. The 27.8% thirteen-week return is explosive, yet the 80.2 persistence and 75.0 volume-price confirmation indicate accumulation rather than exhaustion; structure at 72.9 with vertical extension is clean, and support at 31.23 provides a meaningful cushion if sentiment reverses. This is momentum with confirmation, the holy grail of technical selection in a category riding energy-scarcity and real-asset-sponsorship tailwinds.
Nuclear energy earned 5% allocation at 64.5 because energy-scarcity (+9), real-asset-sponsorship (+7), and inflation-pressure (+3) deliver 19 points of macro support, but credit-stress (-5) and risk-appetite-broken (-4) dampen the category-level macro fit to 60.0. URNM's 64.0 ETF-level macro fit and 33.6% SPY relative strength position it as a high-conviction bet on energy transition rather than cyclical commodity trading. The positioning at 5% reflects belief that nuclear demand will sustain while acknowledging that 26.2% extension and overbought RSI create tactical vulnerability; this is a position sized for a two-to-three month hold rather than a permanent portfolio sleeve. To justify elevation above 5%, nuclear would require either credit stress relief or continued deterioration in traditional energy supply, both of which are plausible but not yet confirmed. The allocation should be viewed as a concentrated bet on the energy-transition narrative within a diversified commodity and real-asset bucket.
Defense & Aerospace — ITA
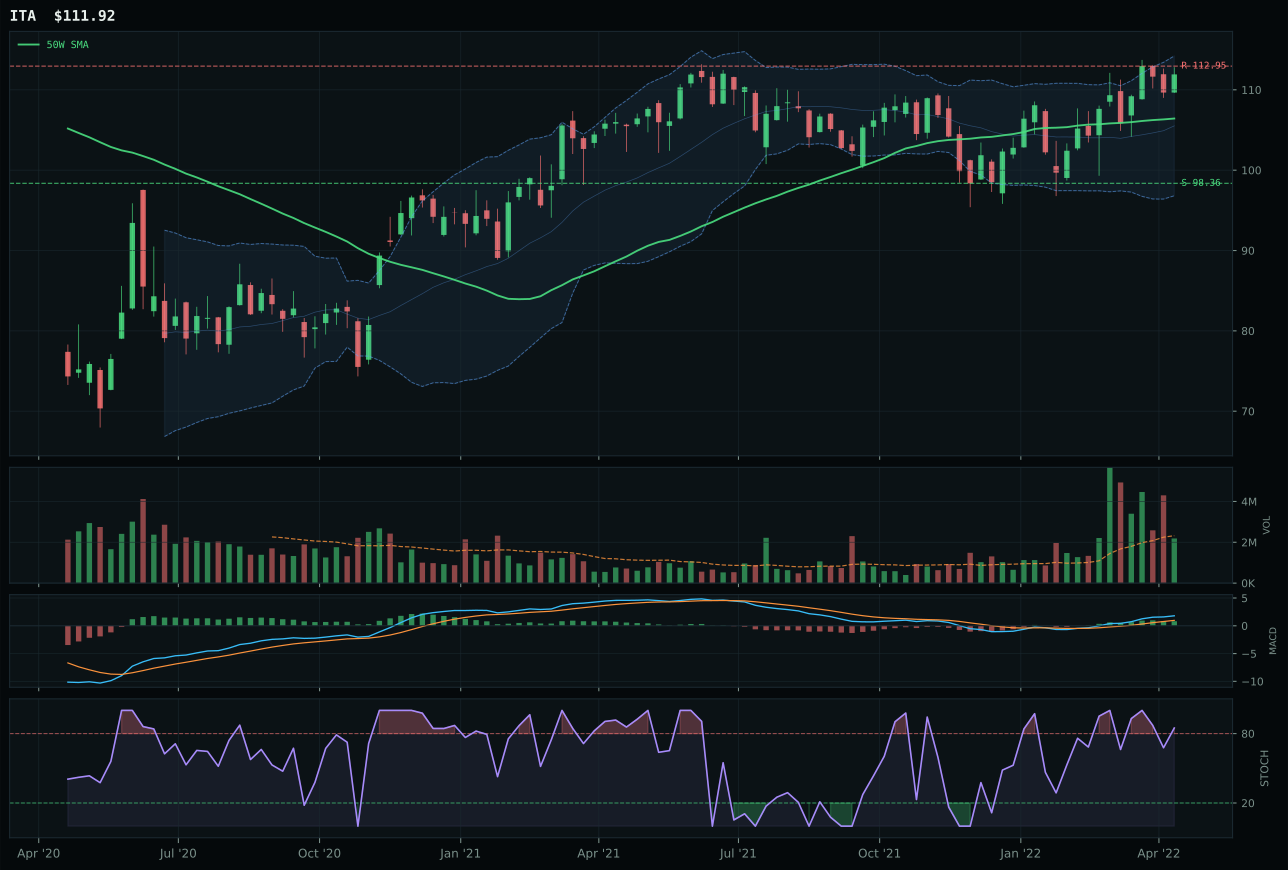
ITA has a neutral structure profile with 9.3% 13-week relative strength versus SPY.
A failed hold above support would weaken the setup.
Actionable but governed by invalidation levels.
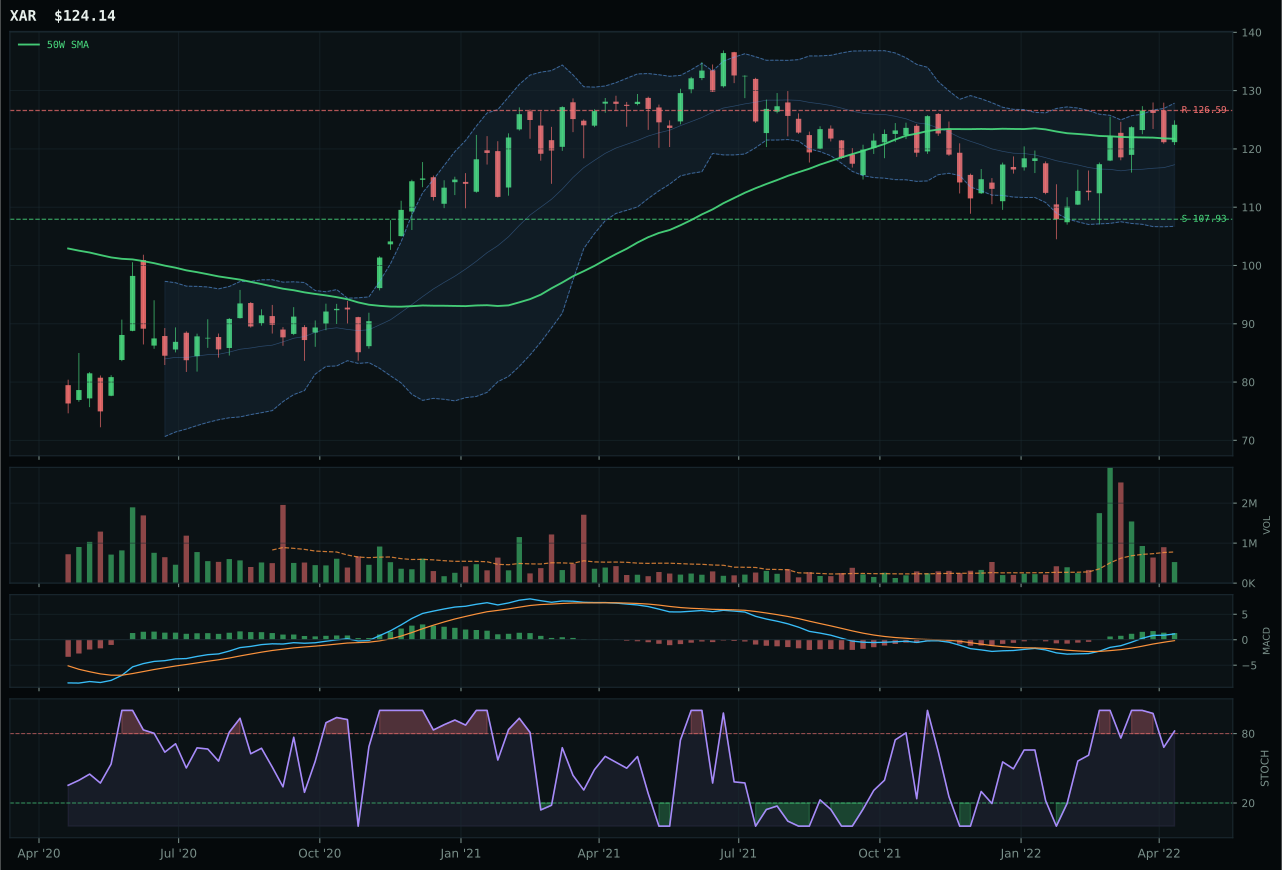
XAR has a compression near 50W profile with 10.7% 13-week relative strength versus SPY.
A failed hold above support would weaken the setup.
Actionable but governed by invalidation levels.
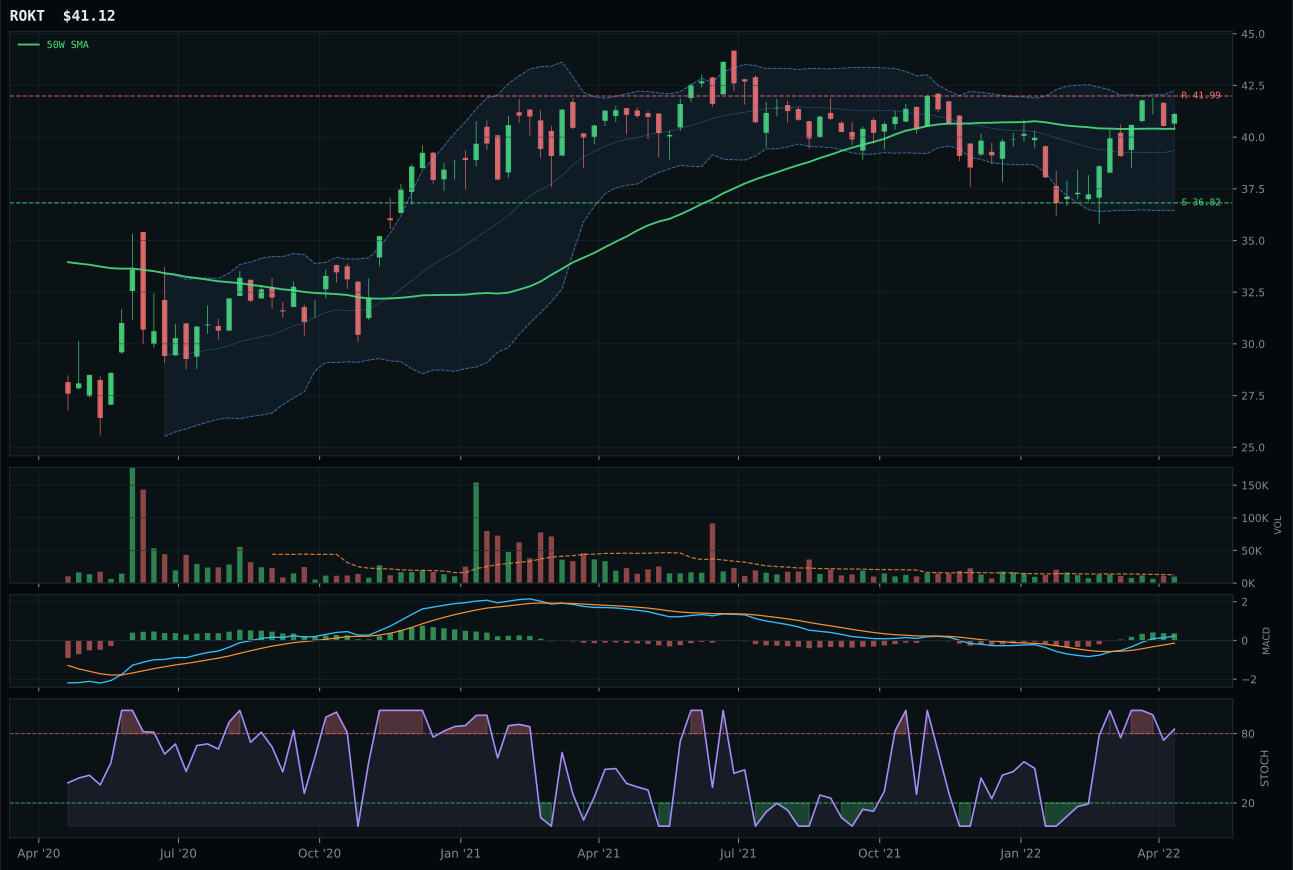
ROKT has a compression near 50W profile with 8.6% 13-week relative strength versus SPY.
A failed hold above support would weaken the setup.
Tracked, but not top-2 eligible because: .
ITA earned the representative slot with a 100 trend score and bullish-improving MACD that XAR, despite higher technical evidence of 74.4, could not overcome—the difference lies in neutral structure at 73.6 versus compression near the 50W at 71.1, and neutral volume versus thin participation. Both ETFs sit near 52-week highs with overbought stochastic RSI rolling over, but ITA's 5.2% distance from the 50W provides cleaner entry geometry than XAR's compression setup, which lacks the clean breakout momentum required in this regime. The 77.6 momentum confirmation reflects 3.6% thirteen-week returns and 0.0% category-relative strength—not a leader within its peer set, but a respectable performer in a category where defensive rotation adds +7 to macro scoring and broad-market-bear adds +6.
Defense & Aerospace ranks third at 61.7 and earned 5% allocation because it sits between the two top-tier categories and the field of lower-ranked exposures, serving as a secondary defensive anchor alongside utilities and precious metals. The 70.0 category-level macro fit stems from defensive rotation and broad-market-bear being active, giving this sector structural support independent of the current equity bounce. However, the -0.9% upside-to-resistance and 38.2 risk/reward score reveal that ITA is nearly fully extended—there is limited margin of safety for new buyers. This allocation should be viewed as a hedge holding that benefits from continued market stress rather than a core growth engine; if risk appetite recovers and credit stress reverses, this position would rightfully shrink in favor of higher-beta categories currently dormant.
Industrial Metals — COPX
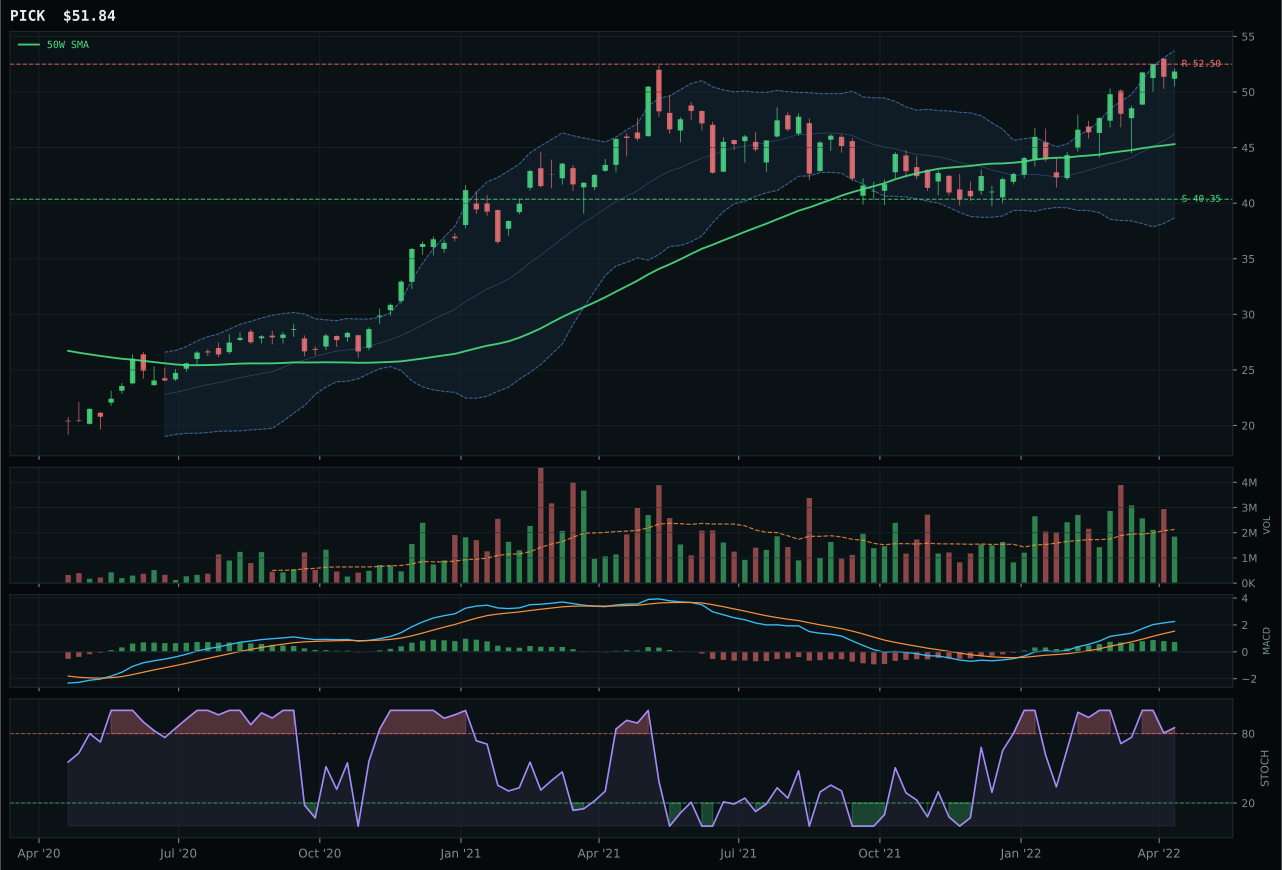
PICK has a neutral structure profile with 18.6% 13-week relative strength versus SPY.
A failed hold above support would weaken the setup.
Actionable but governed by invalidation levels.
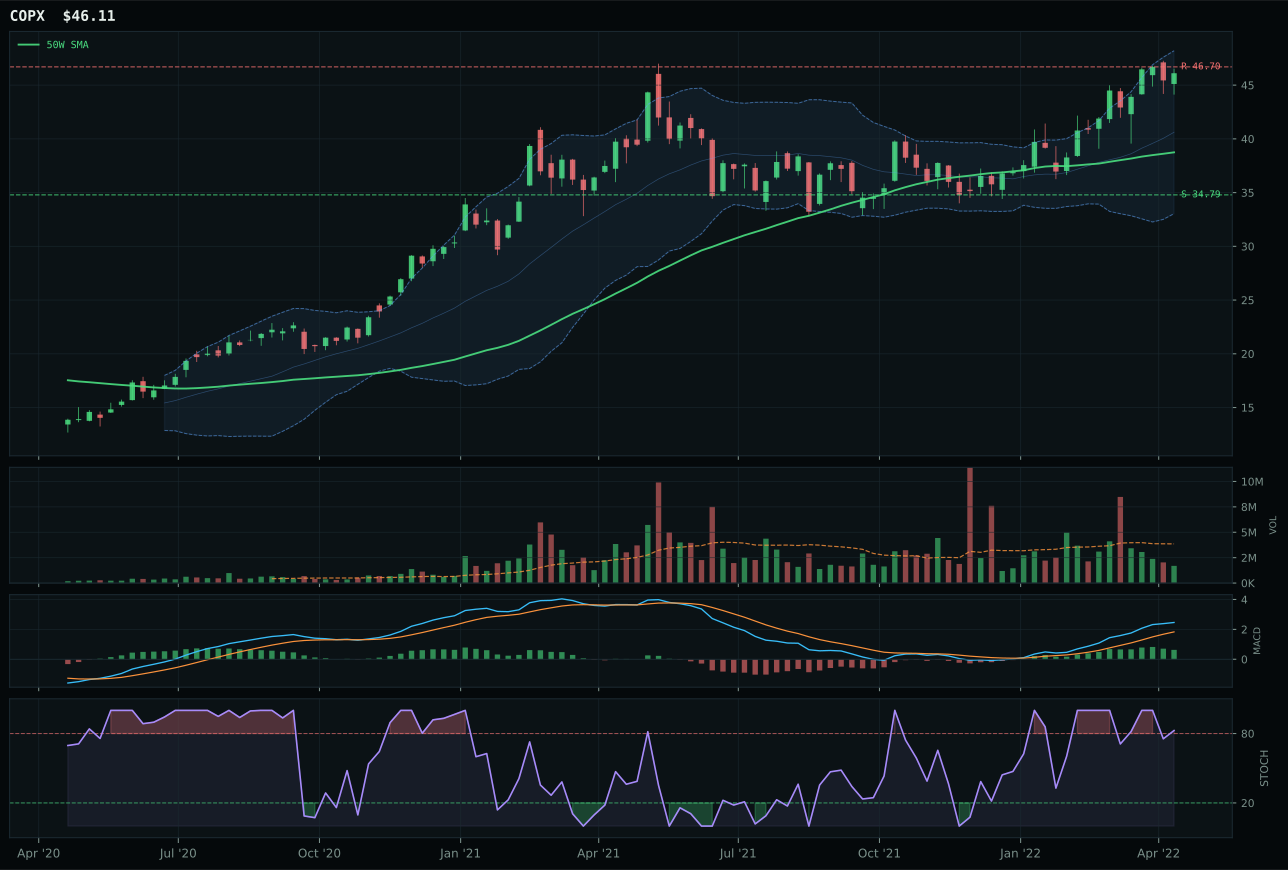
COPX has a vertical extension profile with 21.9% 13-week relative strength versus SPY.
A failed hold above support would weaken the setup.
Actionable but governed by invalidation levels.
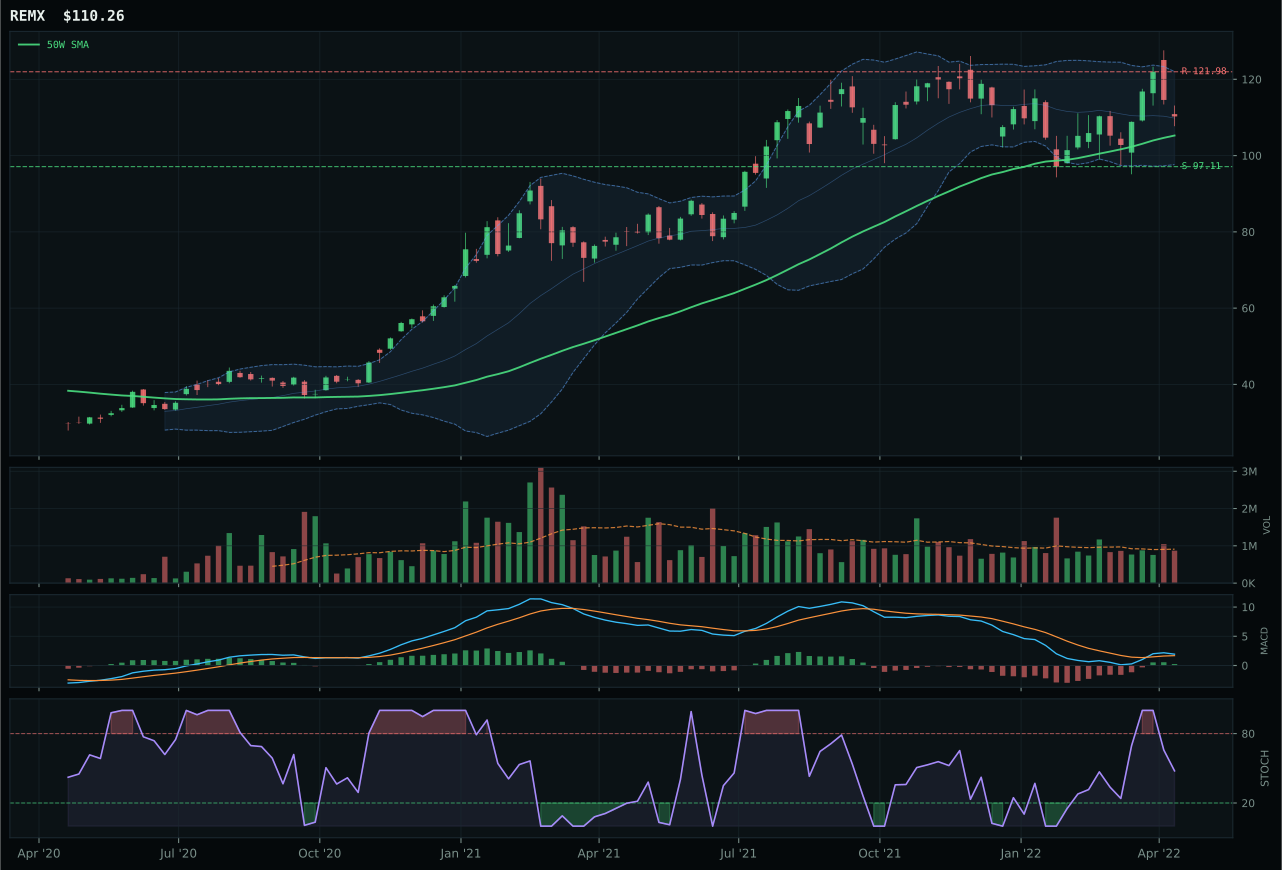
REMX has a neutral structure profile with 1.7% 13-week relative strength versus SPY.
A failed hold above support would weaken the setup.
Actionable but governed by invalidation levels.
COPX won on category-relative strength of 3.3% versus PICK's 0.0%, a narrow margin that reflects the difficulty of selecting winners in a category where metals-scarcity is driving all three ETFs higher simultaneously. The 100 momentum confirmation score is warranted by 16.1% thirteen-week returns and bullish-but-flattening MACD, yet timing scores a punitive 22.0 because 19.0% extension above the 50W puts every new buyer into late entry. PICK's superior technical evidence of 72.9 versus COPX's 48.1 signals that the broader mining basket is setting the pace, but its 0.0% category-relative strength means it is keeping pace rather than leading; volume confirmation is the tiebreaker, with COPX's thin participation at 0.44x acceptable as proof of specialist accumulation rather than broad-based chasing. This is a category where technical leadership and macro sponsorship are pulling in different directions.
Industrial metals ranks sixth at 59.4 and holds 5% allocation because metals-scarcity (+14), commodity-breadth-positive (+10), and real-asset-sponsorship (+6) deliver 30 points of category-level macro support despite credit stress (-7) and dollar pressure (-7). The 66.0 category macro fit is respectable but not elite; this is a secondary commodity play behind agriculture and energy rather than a primary inflation hedge. COPX's vertical extension and thin volume indicate that while the trend is intact, participation is narrowing—a yellow flag for continuation. The allocation should be viewed as tactical exposure to cyclical industrial demand within an inflation-hedging sleeve rather than a core position; if dollar strength accelerates or credit stress intensifies, this category would see rapid repricing. Current sizing at 5% reflects conviction in commodity breadth while managing the timing risk of late-entry positioning; the category has room to expand if pull-backs create cleaner entry points.
Technology — CIBR
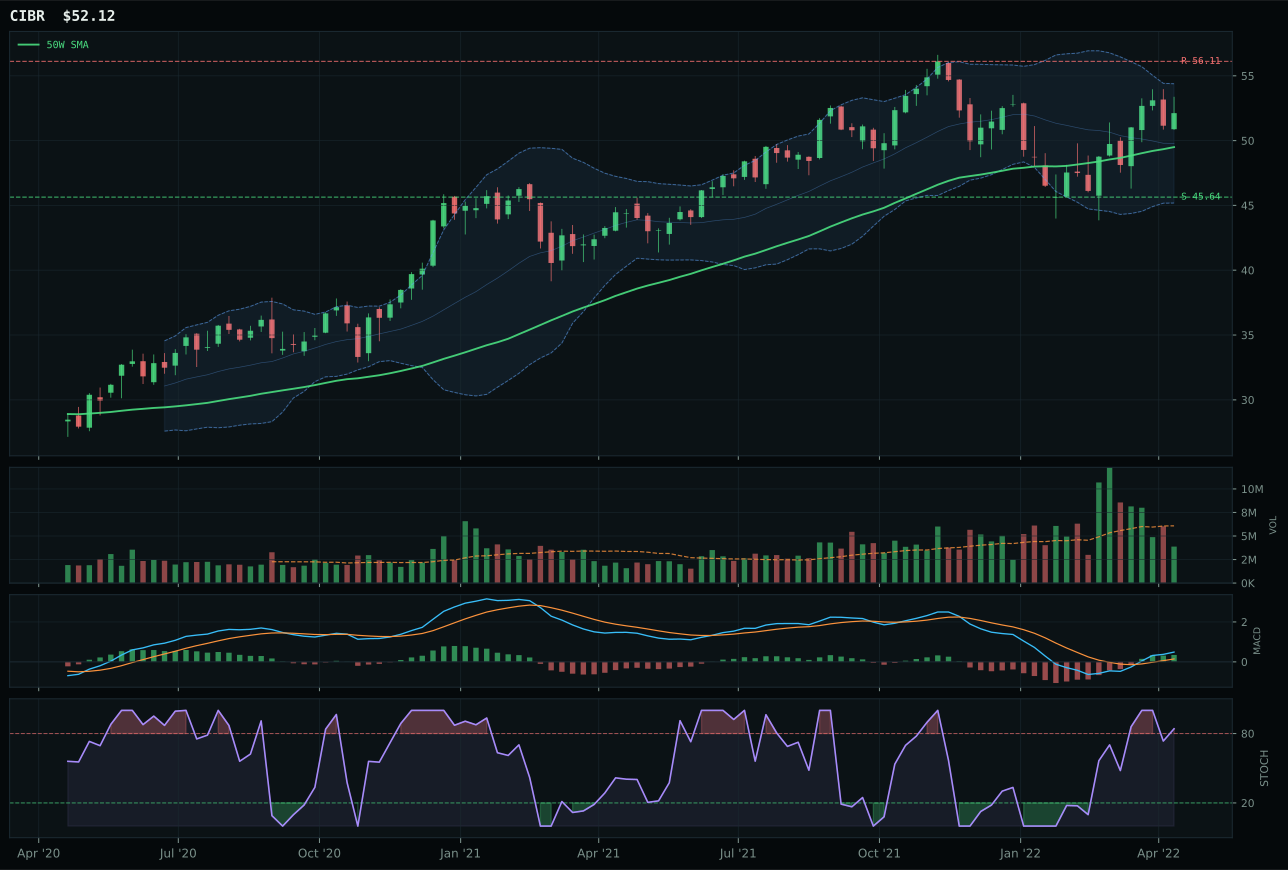
CIBR has a neutral structure profile with 12.8% 13-week relative strength versus SPY.
A failed hold above support would weaken the setup.
Actionable but governed by invalidation levels.
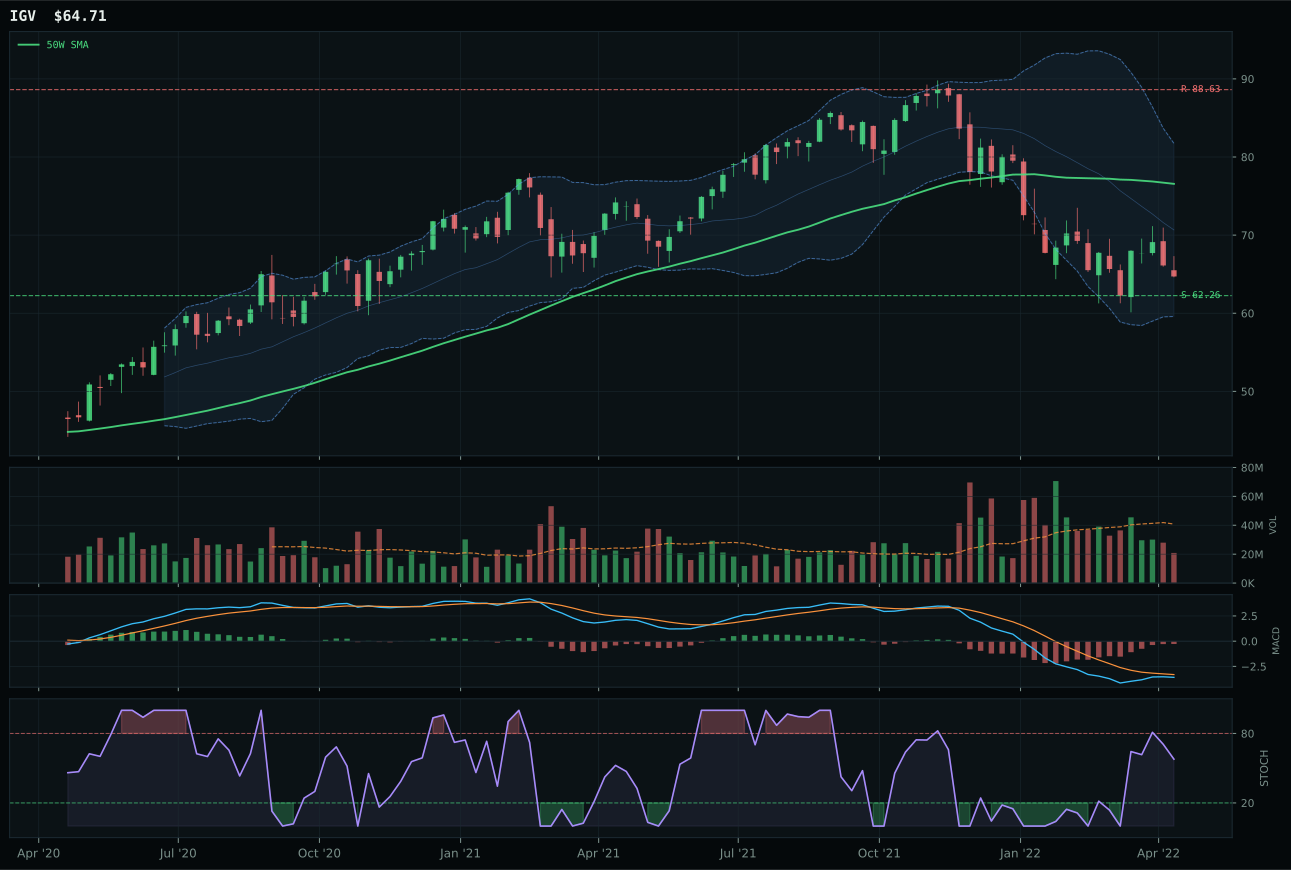
IGV has a pullback into support profile with -3.6% 13-week relative strength versus SPY.
A failed hold above support would weaken the setup.
Actionable but governed by invalidation levels.
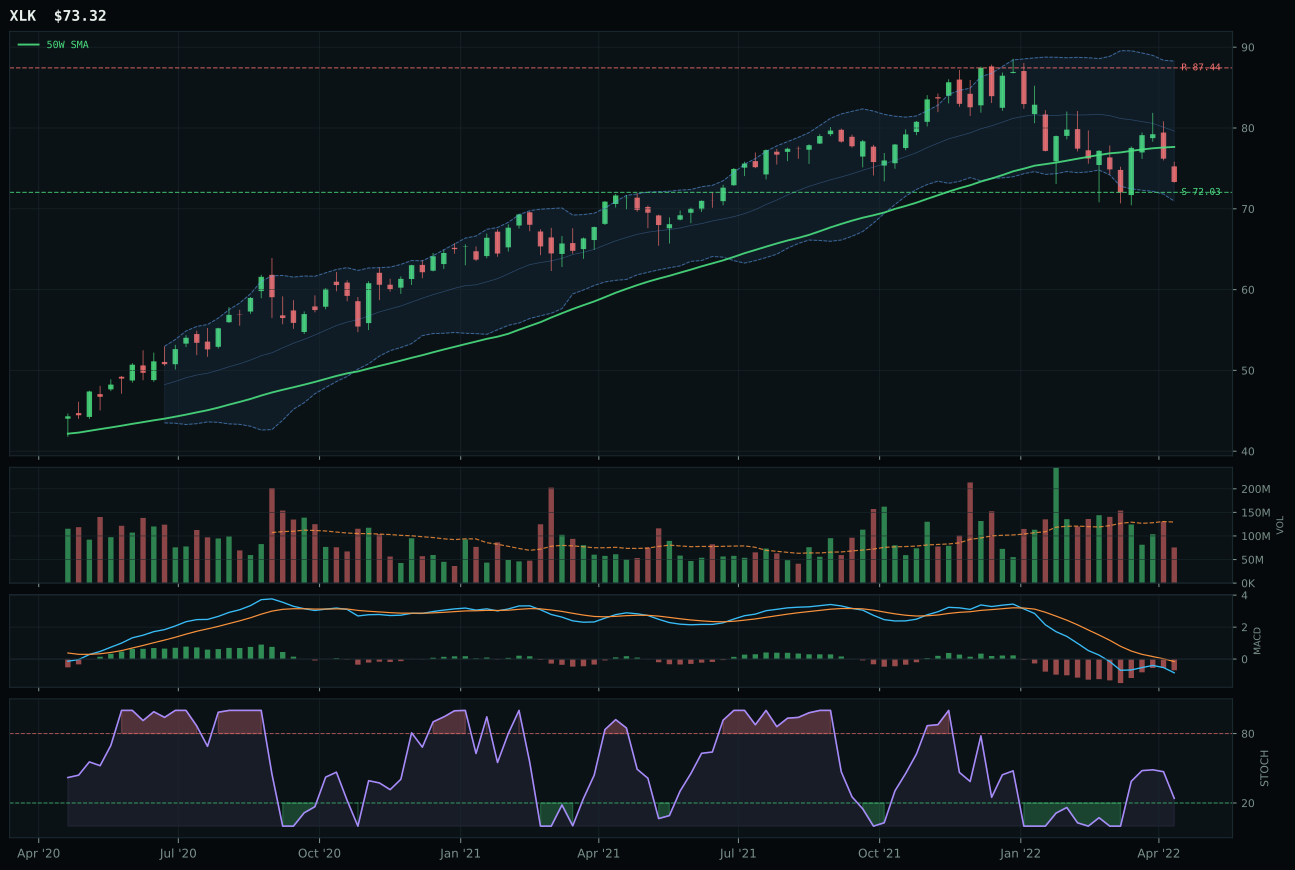
XLK has a pullback into support profile with -5.7% 13-week relative strength versus SPY.
A failed hold above support would weaken the setup.
Actionable but governed by invalidation levels.
CIBR captured the category on the back of a 16.4% relative strength advantage over its peers, driven by cybersecurity's positioning as a steadier technology subtheme in a defensive rotation environment. The trend score of 100 reflects price sitting cleanly above both the 50-week and 200-week moving averages, with a 12.8% outperformance versus SPY providing clear technical sponsorship. IGV's 0.0% category-relative strength and weaker MACD confirmation (bearish vs. bullish) sealed its runner-up status despite a superior risk/reward setup; the enterprise software exposure is simply not being accumulated relative to its peer set. CIBR's neutral structure with 70.4 cleanliness and bullish-improving MACD created a setup where every percentage point of distance from the 50W represents accumulation rather than distribution, though thin volume at 0.64x average tempers conviction.
Technology ranks fifth among the ten categories at 45.3 and earned a 5% slot rather than top-2 consideration because macro headwinds outweigh its technical merit. Credit stress and broad-market-bear conditions are active descriptors that suppress the entire category's macro fit to 43.0, creating a 19-point gap versus the two selected leaders. CIBR's 7.0% thirteen-week return is respectable but insufficient to overcome the structural challenge: with risk appetite broken and liquidity expansion the only positive macro tailwind, this is a defensive core holding suitable for portfolio ballast, not capital deployment. The category remains eligible and the setup is valid, but in a transition regime where energy scarcity and inflation pressure are winning narratives, technology requires a 3-5 point push in macro fit to justify elevation above current weight.
Emerging Markets — ILF
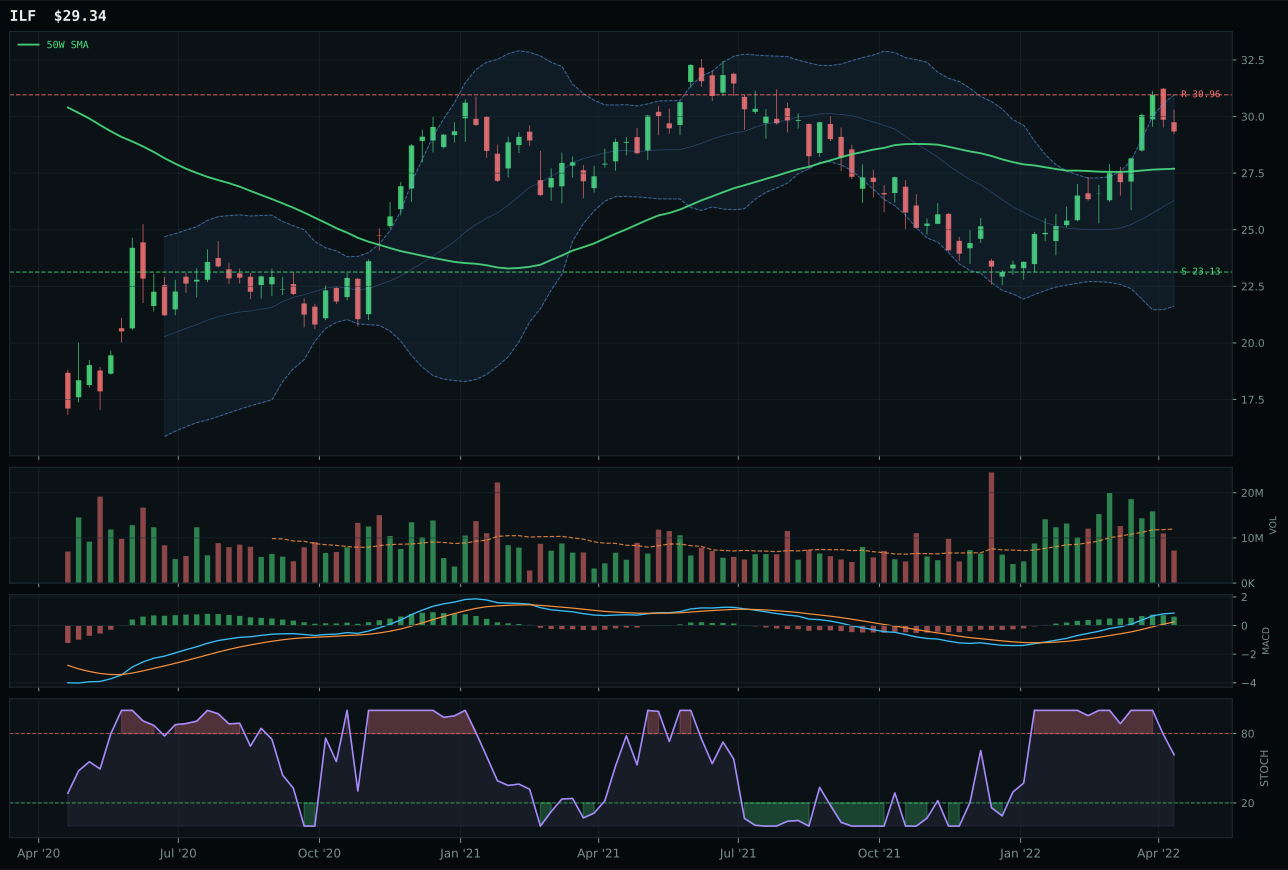
ILF has a neutral structure profile with 24.1% 13-week relative strength versus SPY.
A failed hold above support would weaken the setup.
Actionable but governed by invalidation levels.
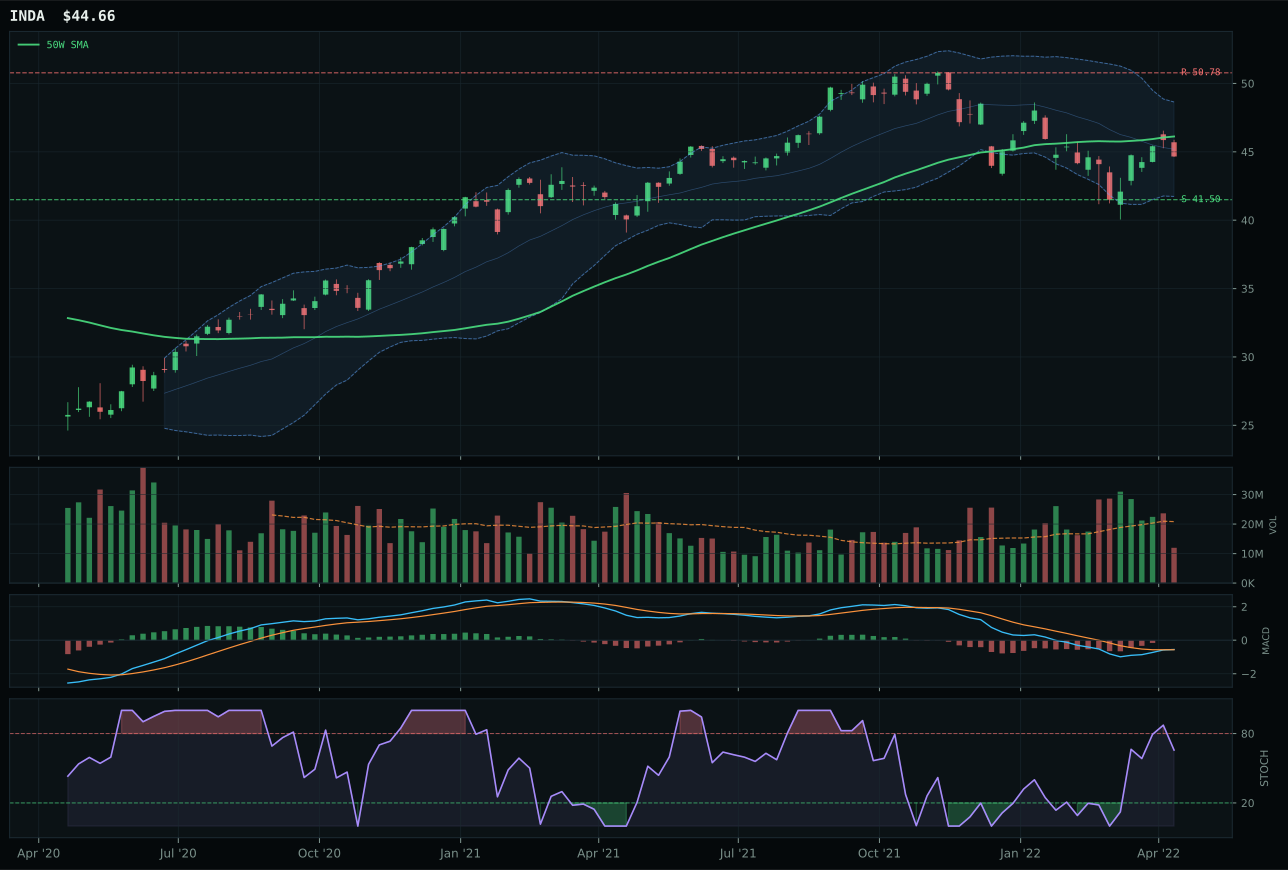
INDA has a neutral structure profile with -1.2% 13-week relative strength versus SPY.
A failed hold above support would weaken the setup.
Actionable but governed by invalidation levels.
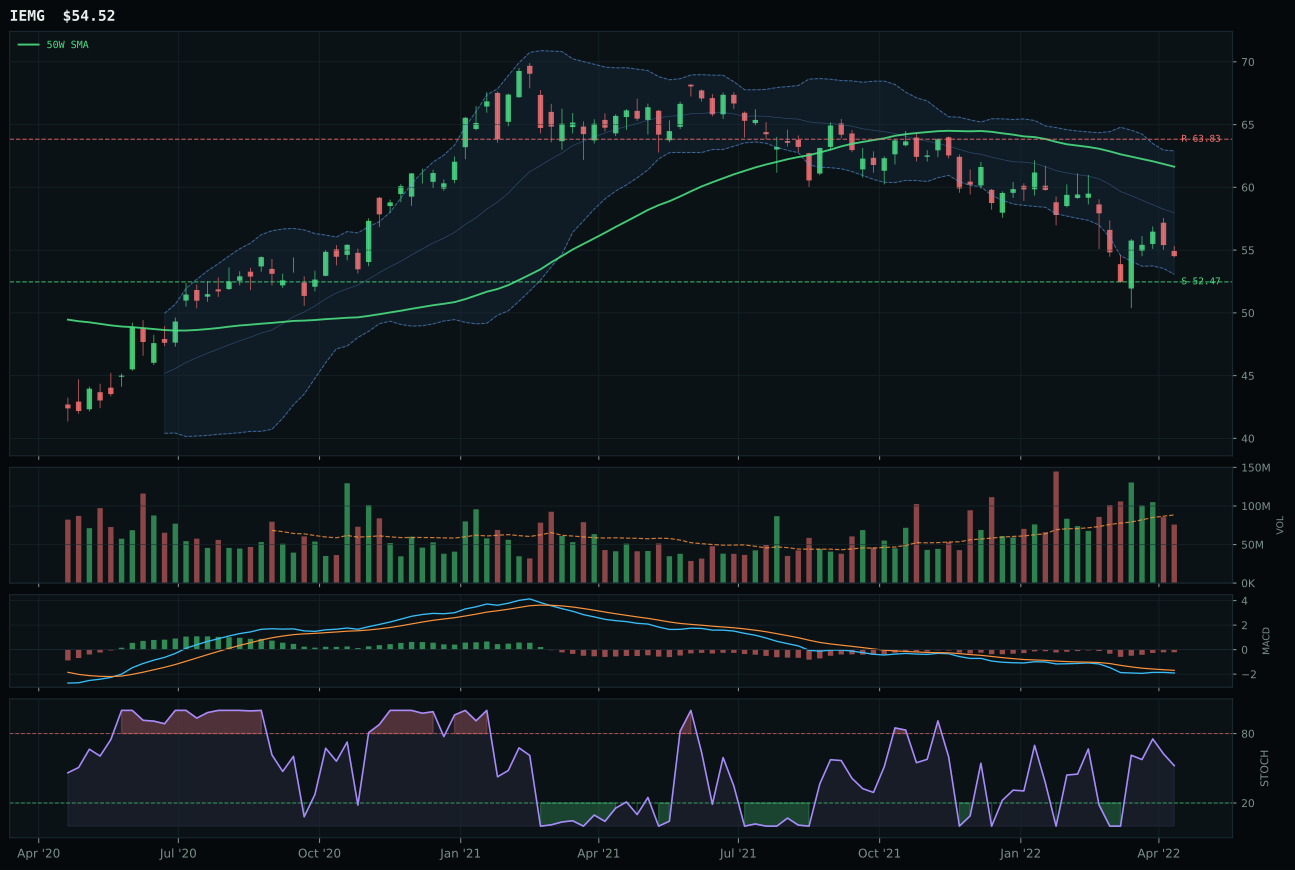
IEMG has a pullback into support profile with -5.1% 13-week relative strength versus SPY.
A failed hold above support would weaken the setup.
Actionable but governed by invalidation levels.
ILF captures the category despite modest 26.0 overall score because its 91.1 technical evidence and 25.3% category-relative strength over INDA's 0.0% reflect Latin America's outperformance as a commodity-and-value play in an inflation regime. The trend is immaculate at 100 with price 5.9% above the 50W in a neutral structure, and persistence of 93.4 combined with volume-price confirmation of 87.7 indicate this is not a statistical quirk but a sustained shift in capital flows toward commodity-linked equities. INDA's -7.0% thirteen-week return and -1.2% SPY relative strength versus ILF's 18.3% and 24.1% paint a clear picture: India's quality-growth exposure is dead in a rising-rate, inflation-driven environment, while Latin America's commodity beta is experiencing multi-week accumulation. The -5.2% upside to resistance tempers conviction, yet buying near resistance in uptrends is the signature of institutional accumulation in regime-confirmation moves.
Emerging Markets is excluded entirely (0% allocation, ranked 9th or 10th) because its 26.0 final score reflects a category buried under dollar pressure (-14 macro points), credit stress (-10), and broad-market bear conditions (-9). ILF's 91.1% technical evidence is genuinely impressive—this is a clean trend—but the category-level macro fit of only 25.0/100 means the entire segment is fighting a macro headwind that overwhelms local strength. Dollar pressure is the primary culprit: EM assets denominated in foreign currency lose value in a rising-dollar regime, and the regime remains biased toward greenback strength in a risk-off, credit-stressed environment. For Emerging Markets to earn even 5%, either the dollar would need to weaken materially (a weekly reversal unlikely), or risk appetite would need to stabilize decisively above current levels. ILF's strength is real but isolated within a broken category.
AI — SMH
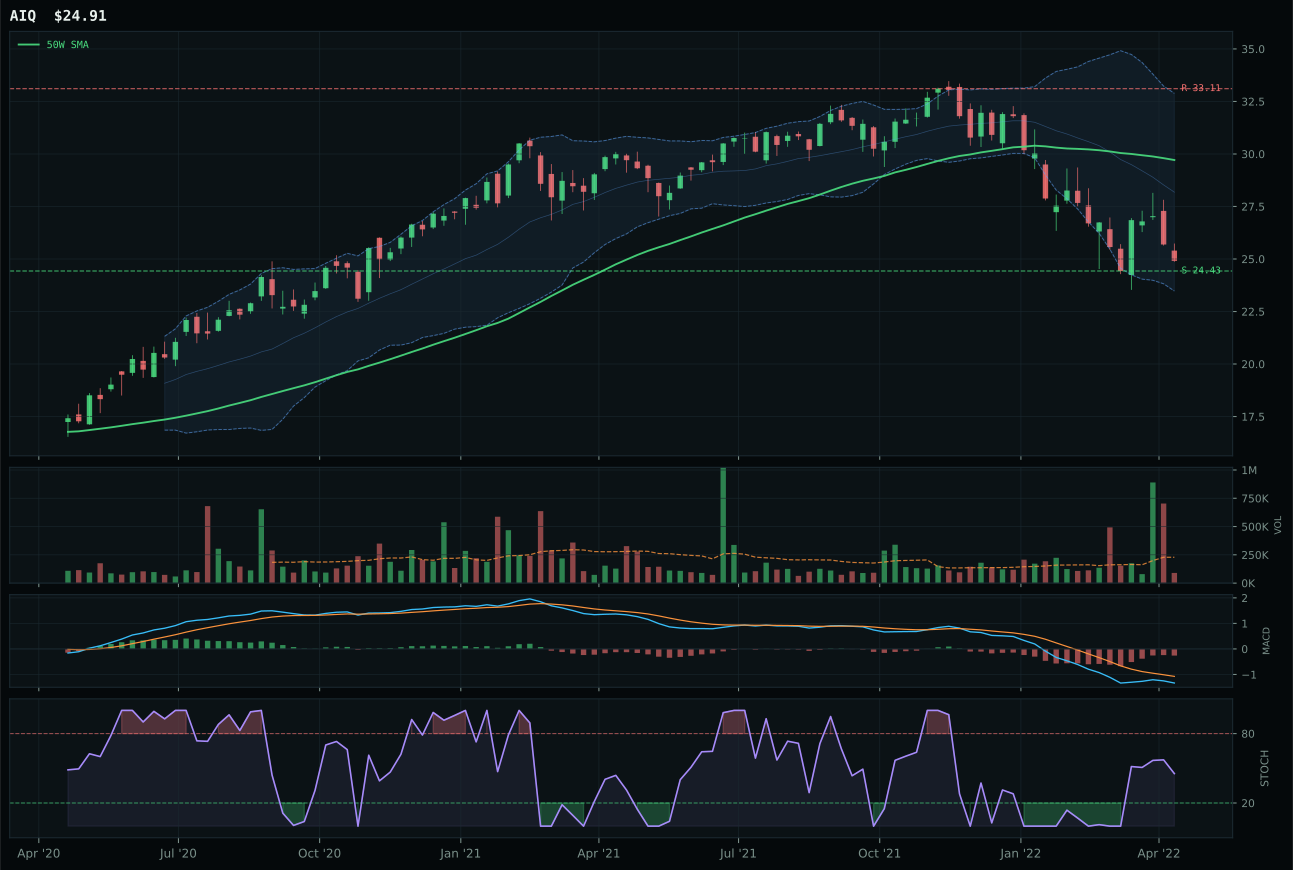
AIQ has a pullback into support profile with -11.3% 13-week relative strength versus SPY.
A failed hold above support would weaken the setup.
Tracked, but not top-2 eligible because: .
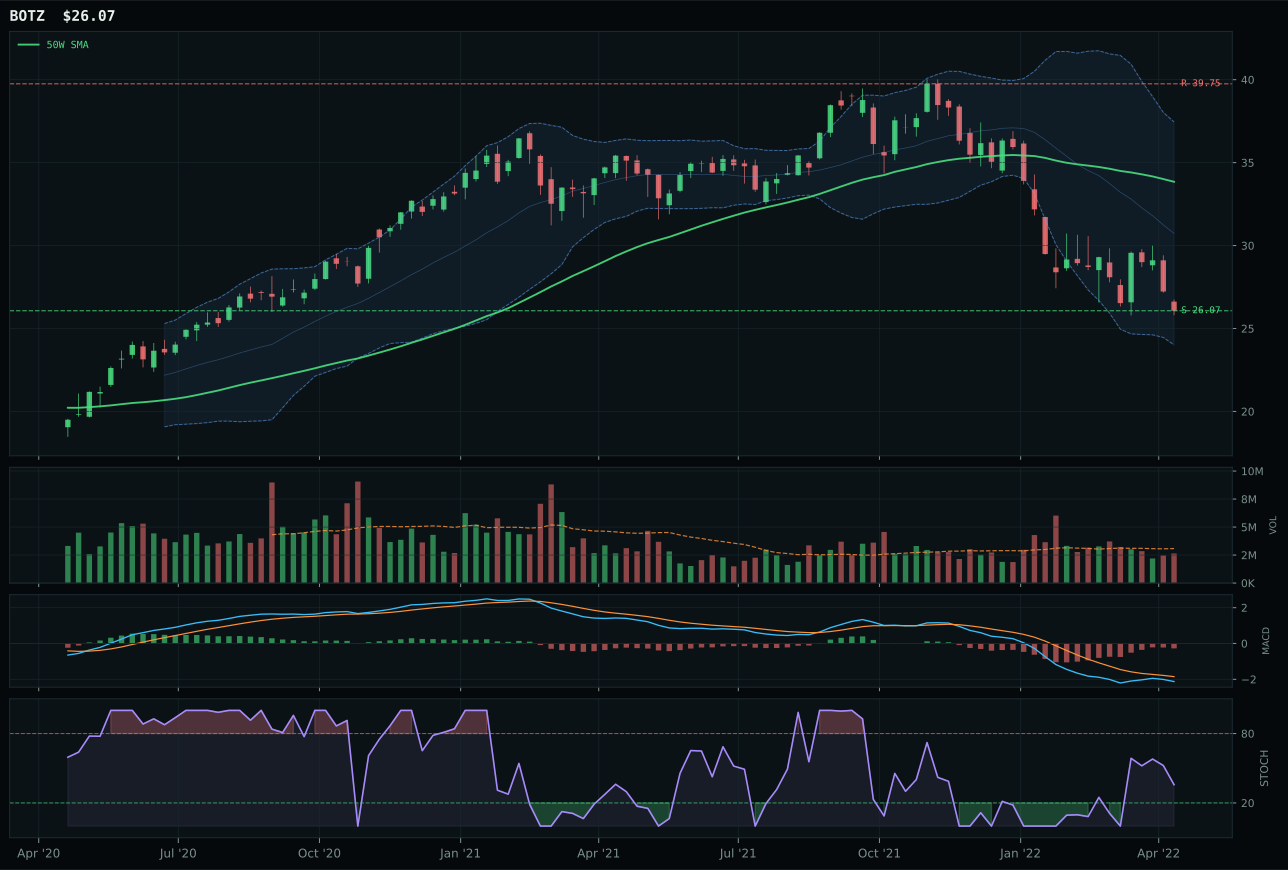
BOTZ has a pullback into support profile with -13.2% 13-week relative strength versus SPY.
A failed hold above support would weaken the setup.
Actionable but governed by invalidation levels.
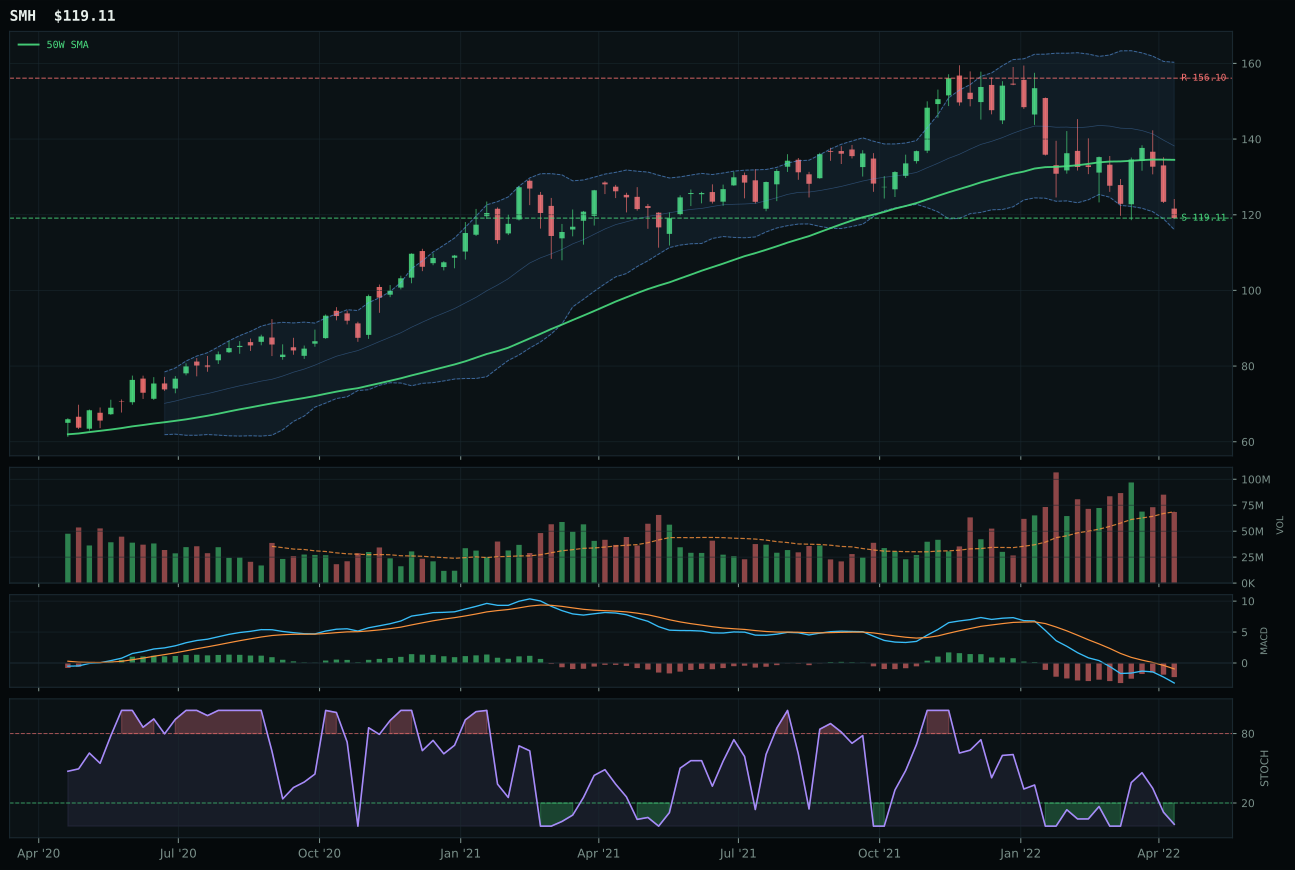
SMH has a pullback into support profile with -16.6% 13-week relative strength versus SPY.
A failed hold above support would weaken the setup.
Actionable but governed by invalidation levels.
SMH prevails because its pullback-into-support setup at 119.11 provides a defined risk structure that AIQ's thin participation cannot match—at neutral volume SMH offers accumulation potential while AIQ's thin-volume pullback signals exhausted buying pressure. The 62.8 structure score and oversold stochastic RSI reading of 0.02 differentiate a genuine washout from a distribution phase; MACD is bearish-but-improving across all three contenders, but only SMH combines that with an RSI that has room to expand. A -22.4% thirteen-week return and -16.6% SPY relative strength are brutal numbers, yet the negative momentum confirmation of 0.0 is appropriate punishment for an oversold bounce without volume confirmation—this is a lesser-of-evils selection in a category hammered by broken risk appetite and credit stress.
AI is excluded entirely (0% allocation, ranked 9th or 10th) because its 16.7 final score and 18.2 representative technical evidence reflect a category suffocating under risk-appetite stress and credit concerns. Liquidity expansion nets only +10 points while broad-market bear conditions drain -8 and credit stress subtracts another -8. The category's three names (SMH, AIQ, BOTZ) average momentum confirmation of 0.3/100—a signal of complete technical capitulation—and none can establish volume sponsorship above 31/100. For AI to earn even 10% allocation, either risk appetite would need to reverse decisively or semiconductors would need to hold support and build a fresh consolidation with fresh volume; currently, the chart is still asking questions rather than answering them.