
2022-04-08
Informational purposes only. The content in this report, including allocations, analysis, and commentary, is provided solely for informational and educational purposes. It does not constitute financial advice, investment advice, trading advice, or any other type of advice. Past performance does not guarantee future results. Always conduct your own research and consult a qualified financial professional before making investment decisions.
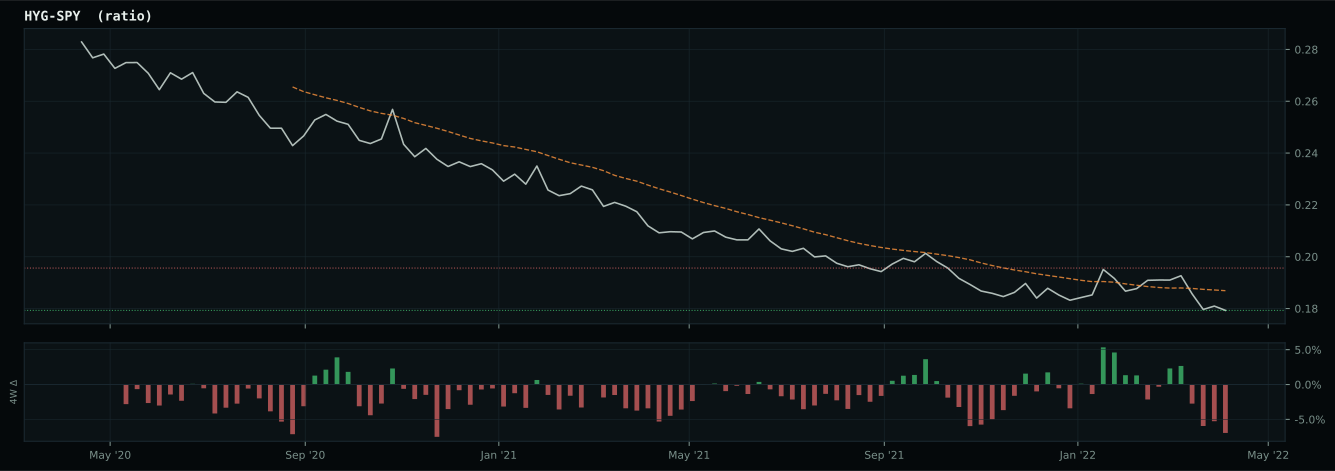
Macro risk engine requires the 50% Defensive overlay for this run; payload selected by cause: Inflation Scarcity.
Weekly Allocation
| Ticker | Category | Weight | Role |
|---|---|---|---|
| XLE | 50% | Overlay | |
| VEGI | Agriculture & Livestock | 10% | Top-2 (10%) |
| XOP | Traditional Energy | 10% | Top-2 (10%) |
| REMX | Industrial Metals | 5% | Tier-2 (5%) |
| SLV | Precious Metals | 5% | Tier-2 (5%) |
| XLU | Utilities & Infrastructure | 5% | Tier-2 (5%) |
| URNM | Nuclear Energy | 5% | Tier-2 (5%) |
| ITA | Defense & Aerospace | 5% | Tier-2 (5%) |
| CIBR | Technology | 5% | Tier-2 (5%) |
Trade Instructions — Monday Open
Sell the tranche from 2022-03-11 (completing its 4-week hold). Buy the new tranche. Instructions show net portfolio changes — same-asset positions cancel, weight changes show the delta.
| Action | Ticker | Instruction |
|---|---|---|
| SELL | XLE | Sell 5% of XLE position (reduce 52.50% → 50.00%) |
| SELL | GLD | Sell 29% of GLD position (reduce 8.75% → 6.25%) |
| SELL | COPX | Sell 33% of COPX position (reduce 3.75% → 2.50%) |
| SELL | WEAT | Sell 25% of WEAT position (reduce 5.00% → 3.75%) |
| SELL | XAR | Sell 25% of XAR position (reduce 5.00% → 3.75%) |
| BUY | XOP | Buy XOP — 28.57% of freed cash (adds 2.50% to portfolio) |
| BUY | REMX | Buy REMX — 14.29% of freed cash (adds 1.25% to portfolio) |
| BUY | VEGI | Buy VEGI — 28.57% of freed cash (adds 2.50% to portfolio) |
| BUY | SLV | Buy SLV — 14.29% of freed cash (adds 1.25% to portfolio) |
| BUY | ITA | Buy ITA — 14.29% of freed cash (adds 1.25% to portfolio) |
Current Portfolio After Trade
Combined holdings across all 4 active tranches. Each tranche is 25% of the portfolio.
| Ticker | % of Portfolio | Weight Bar |
|---|---|---|
| XLE | 50.00% | |
| XOP | 10.00% | |
| GLD | 6.25% | |
| URNM | 5.00% | |
| WEAT | 3.75% | |
| XLU | 3.75% | |
| XAR | 3.75% | |
| COPX | 2.50% | |
| CIBR | 2.50% | |
| ILF | 2.50% | |
| REMX | 2.50% | |
| VEGI | 2.50% | |
| IGF | 1.25% | |
| MOO | 1.25% | |
| SLV | 1.25% | |
| ITA | 1.25% |
Macro Regime — Transition / Mixed
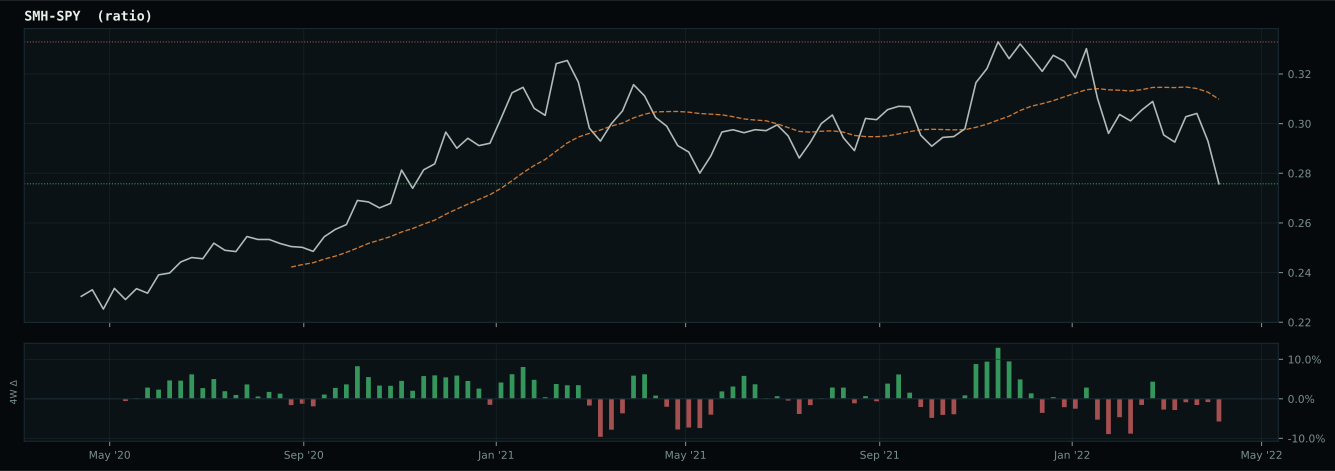
growth data is not confirming the weak market-implied risk appetite signal
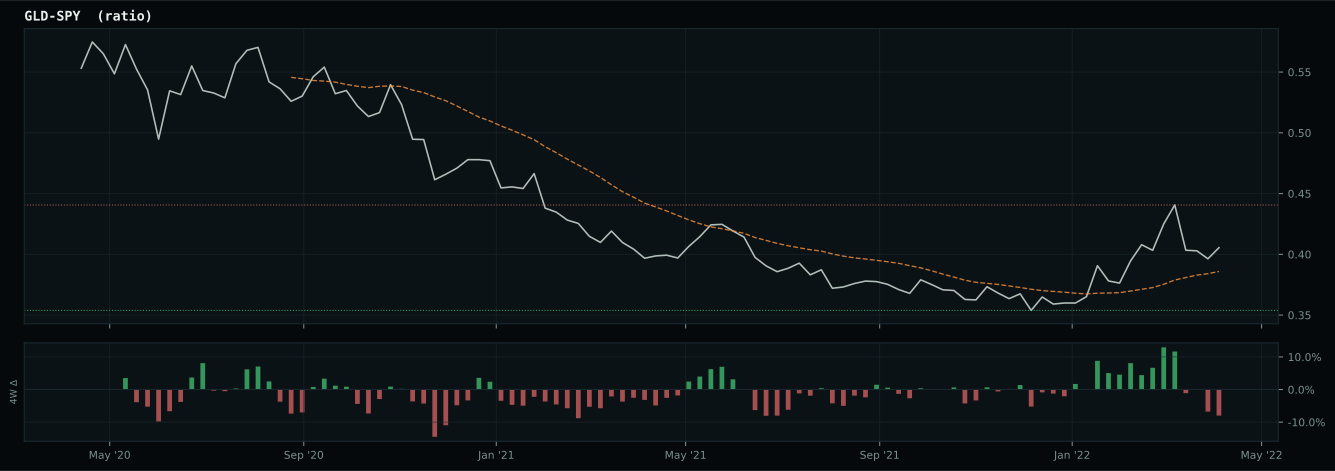
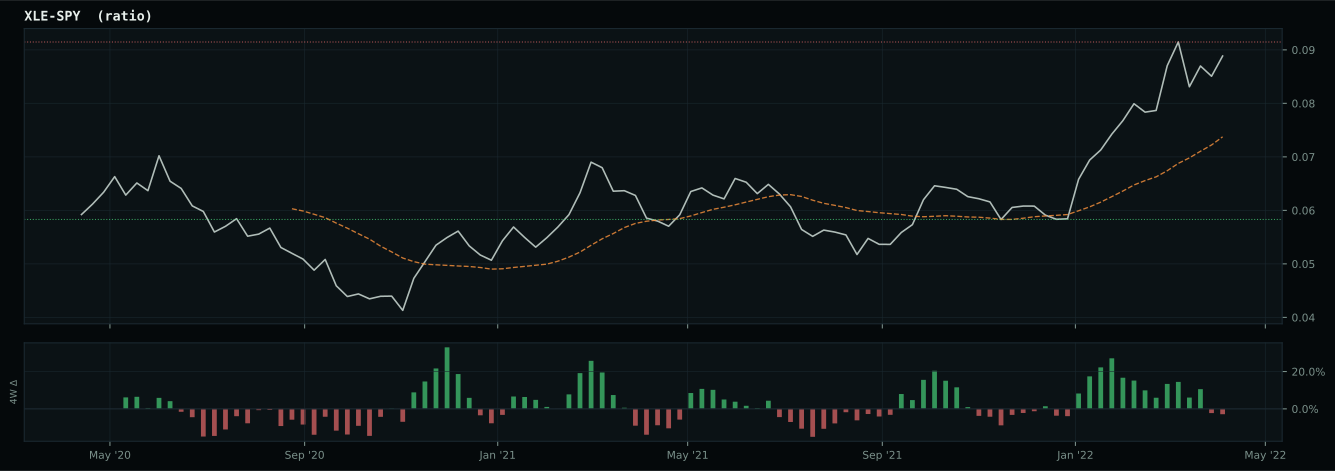
Defensive overlay cause is inflation/scarcity: energy, commodity breadth, or oil-versus-gold confirmation is stronger than the broad equity tape, so the sleeve owns the inflation pressure. XLE has been confirmed above its 8W SMA and is eligible.
Macro Evidence Charts
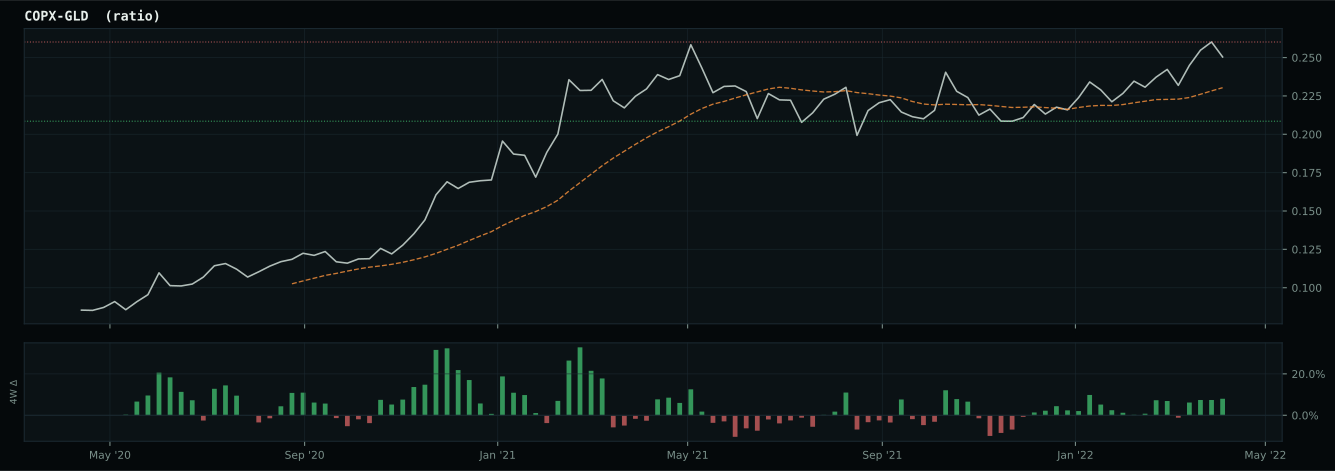
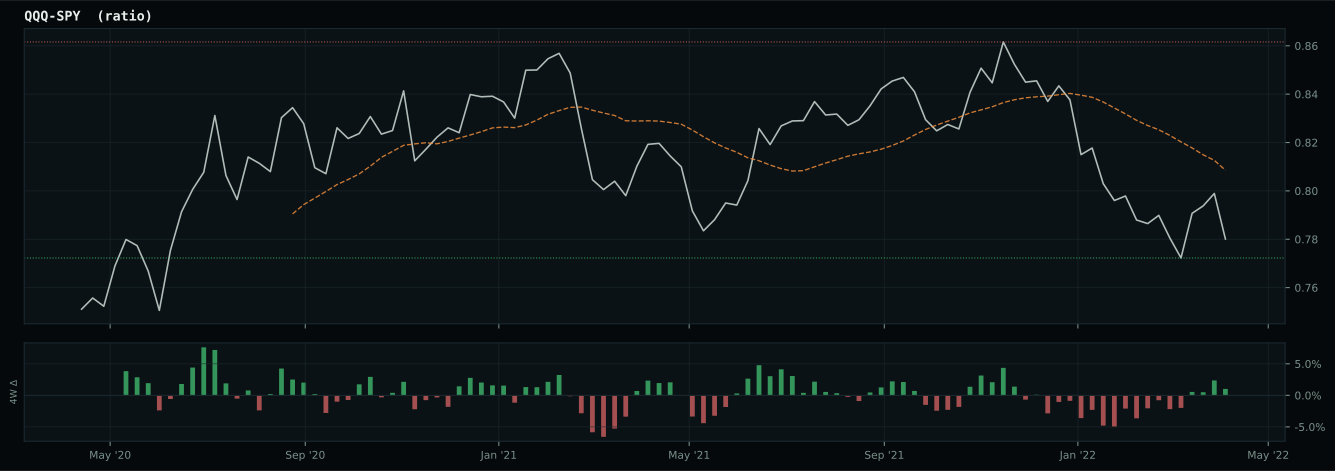
Market-implied signals behind the macro regime scores. Each ratio compares two assets; the direction and slope of the ratio is what the macro engine reads.
Crypto Regime — NoCrypto
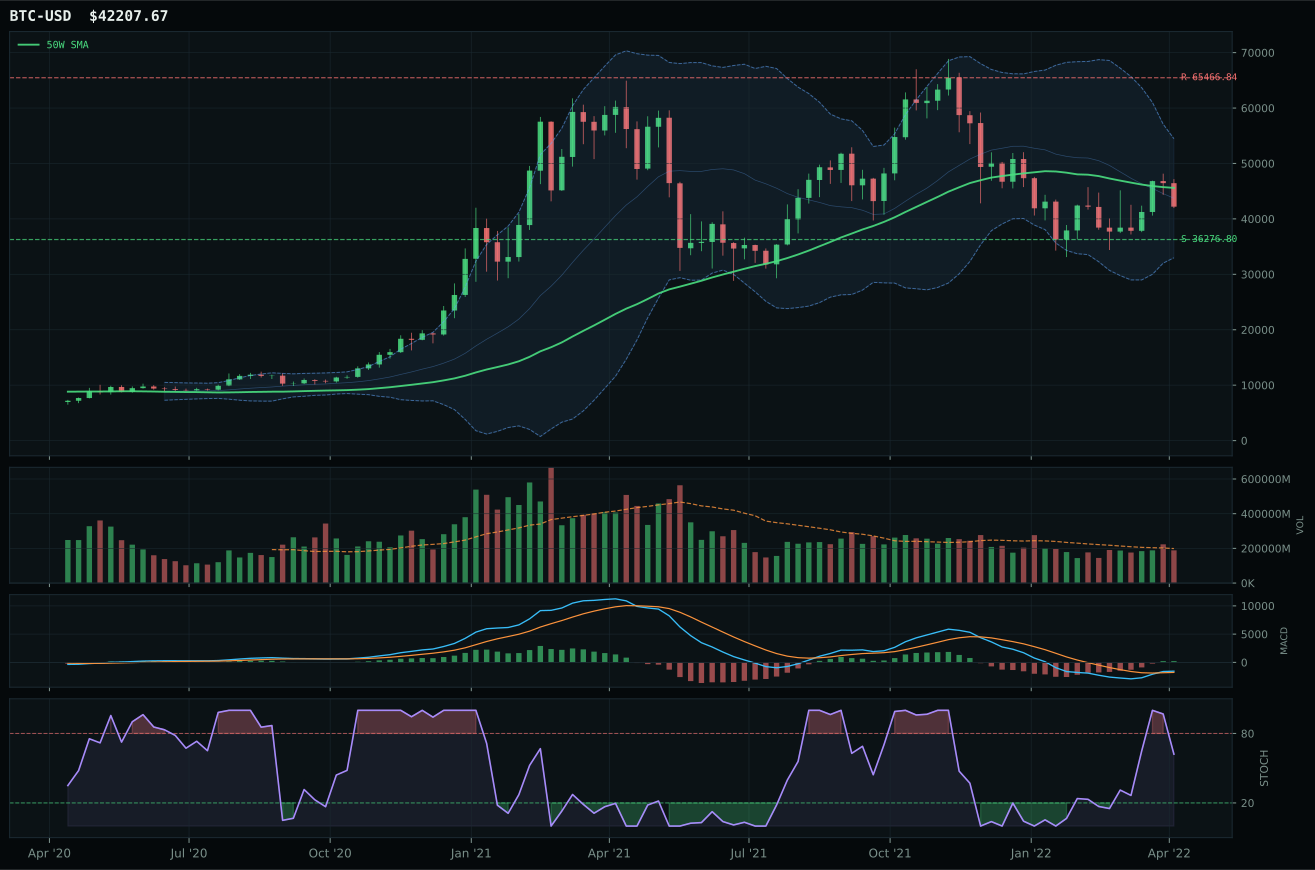
ValueBTC not armed: BTC has not made the first post-breakdown touch of the 200W buy zone after losing the 50W
TrendBTC not confirmed
one or more available conditions failed
Category Rankings
| Rank | Category | Winner | Score | Alloc | 4W Ret | Peers (4W) |
|---|---|---|---|---|---|---|
| 1 | Agriculture & Livestock | VEGI | 87.7 | 20% | -8.89% | MOO -11.2% · WEAT +3.3% |
| 2 | Traditional Energy | XOP | 77.1 | 20% | -0.27% | FCG +0.6% · XLE +3.1% |
| 3 | Industrial Metals | REMX | 76.0 | 10% | -18.82% | PICK -17.6% · COPX -17.8% |
| 4 | Precious Metals | SLV | 75.7 | 10% | -12.91% | GDX -17.0% · GLD -4.9% |
| 5 | Utilities & Infrastructure | XLU | 73.4 | 10% | -6.80% | IGF -5.0% · PAVE -5.7% |
| 6 | Nuclear Energy | URNM | 67.5 | 10% | -25.46% | URA -22.4% · NLR -7.9% |
| 7 | Defense & Aerospace | ITA | 54.1 | 10% | -6.68% | XAR -10.1% · ROKT -8.3% |
| 8 | Technology | CIBR | 50.5 | 10% | -17.30% | XLK -8.3% · IGV -14.9% |
| 9 | Emerging Markets | ILF | 46.8 | 0% | -16.50% | INDA -8.9% · IEMG -9.7% |
| 10 | AI | SMH | 20.4 | 0% | -6.43% | BOTZ -14.6% · AIQ -12.6% |
Agriculture & Livestock — VEGI
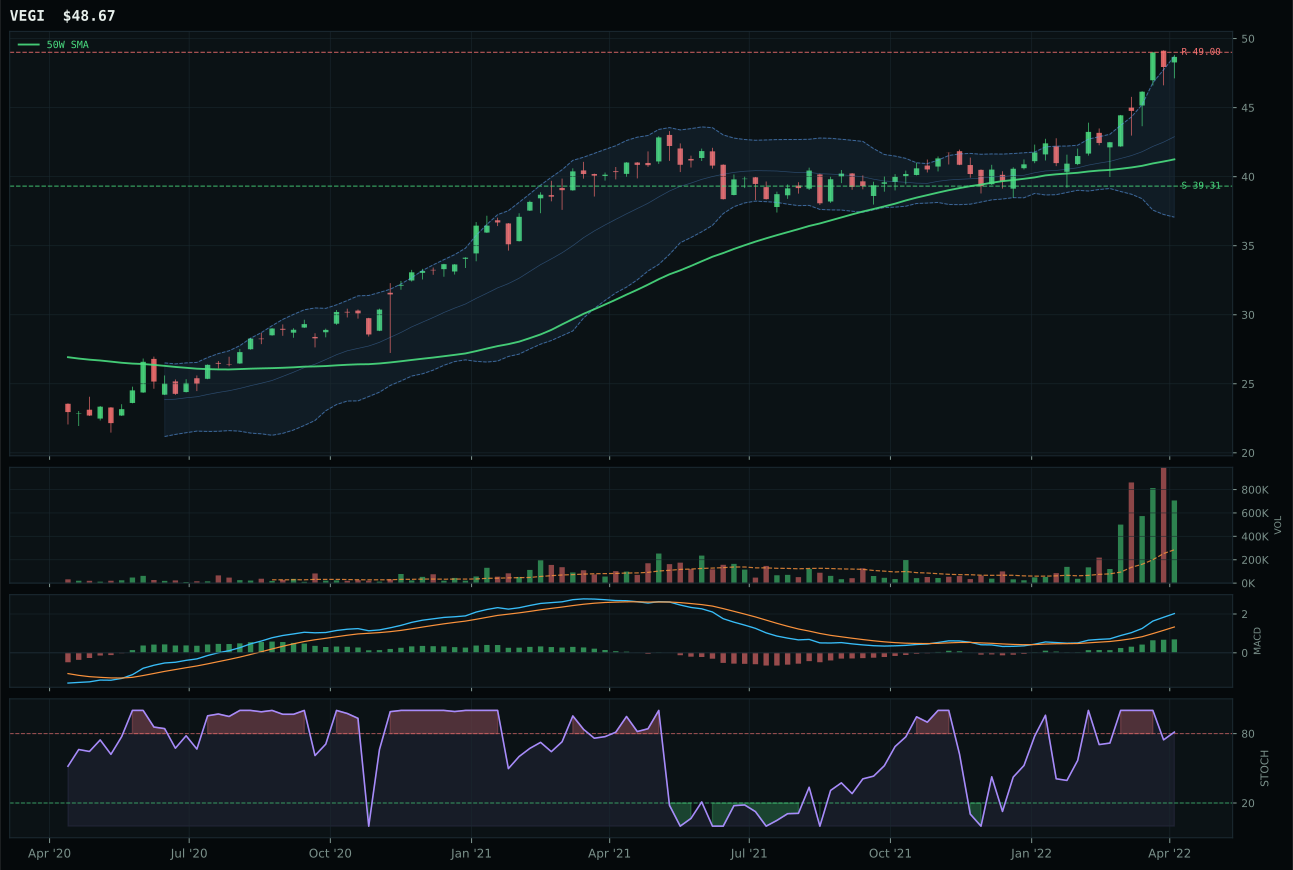
VEGI has a vertical extension profile with 20.5% 13-week relative strength versus SPY.
A failed hold above support would weaken the setup.
Actionable but governed by invalidation levels.
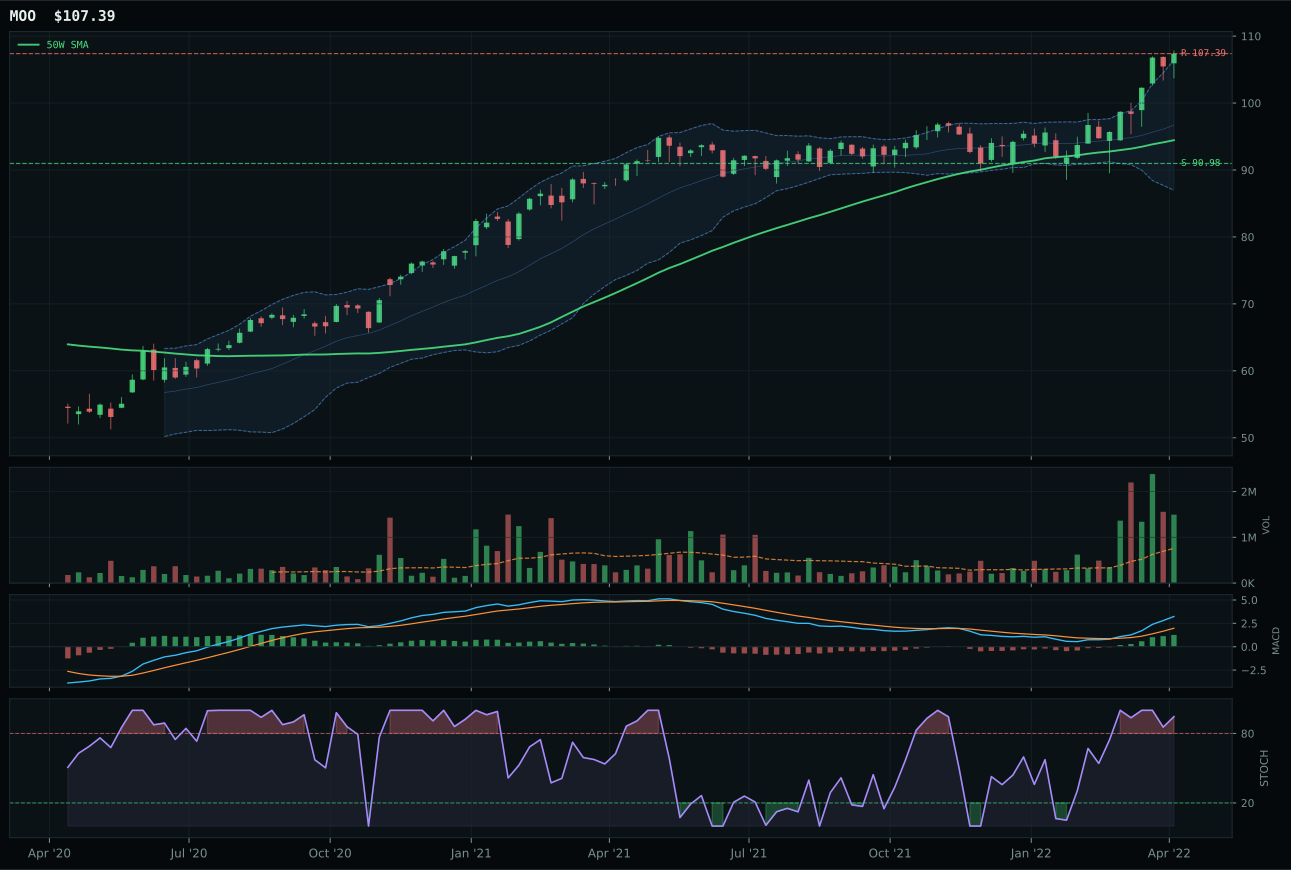
MOO has a neutral structure profile with 18.3% 13-week relative strength versus SPY.
A failed hold above support would weaken the setup.
Actionable but governed by invalidation levels.
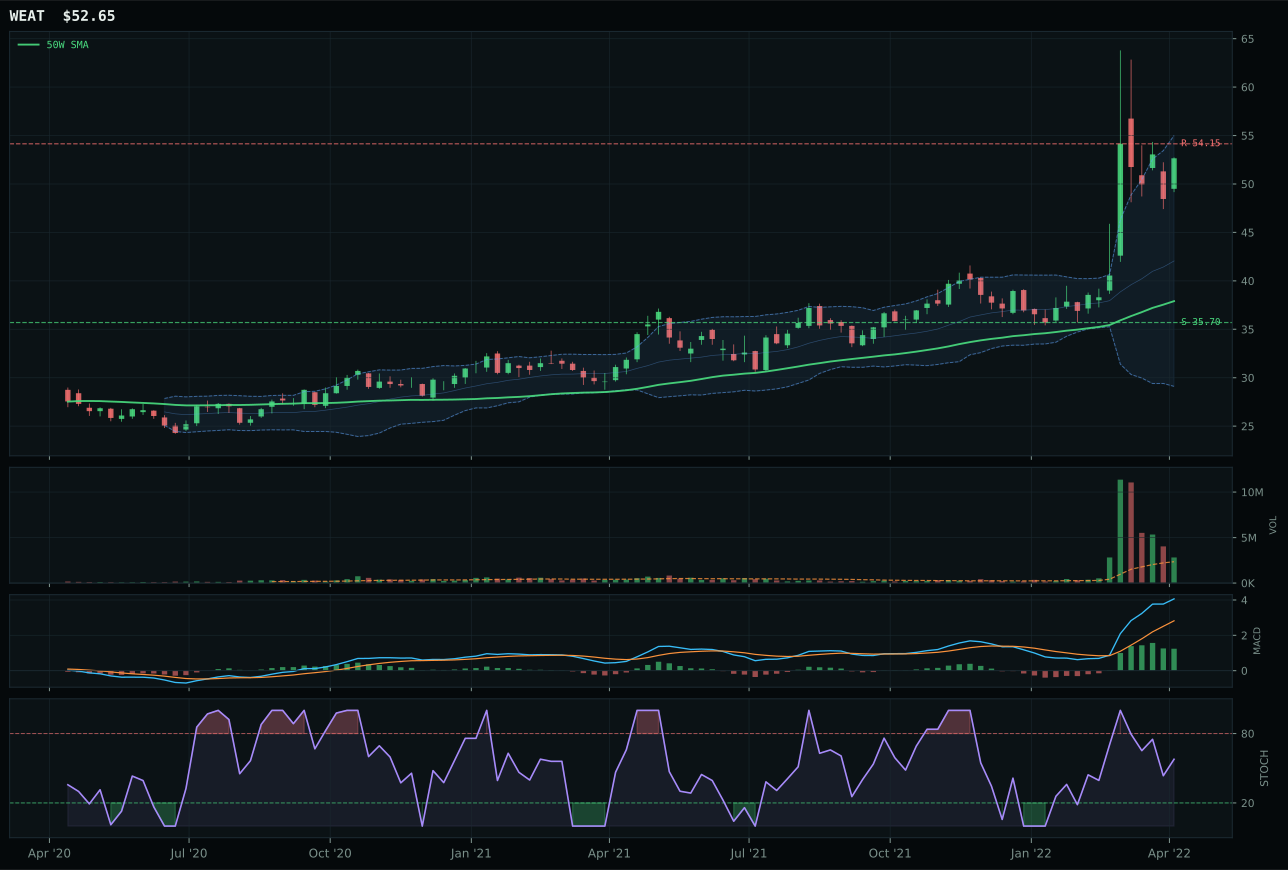
WEAT has a vertical extension profile with 48.0% 13-week relative strength versus SPY.
A failed hold above support would weaken the setup.
Actionable but governed by invalidation levels.
VEGI wins despite being extended 18.0% above the 50W because the technical sponsorship is overwhelming: 100.0/100 trend score, 100.0/100 momentum confirmation, and 78.8% volume-price participation rate prove this is institutional accumulation, not retail chasing. The 16.6% 13-week return and 20.5% SPY-relative strength reveal that agricultural producers have been in a structural upmove for months, not weeks, and the current extension sits at Fib 0.236 (46.36), a natural resistance zone that VEGI at 47.20 is testing. MOO loses because structure is marginally less clean (80.6 vs 82.7) and more critically because its -2.3% category-relative weakness signals capital is rotting into VEGI's broader producer exposure over MOO's agribusiness equity tilt. Stochastic RSI overbought rolling over at 0.81 is a timing penalty (27.0/100), but the 2.48x 20-week volume accumulation and persistence score of 91.5% confirm that this extension is being sustained, not abandoned. Supply shortage is active (+8) and inflation pressure is active (+6)—the macro is sponsoring every dollar of this move.
Agriculture earns top-2 overweight at 10% allocation because its 87.7 final category score represents the highest quality risk-adjusted entry after Energy, combining elite technical evidence (85.2/100 for VEGI) with the strongest category-level macro fit at 86.0/100. Supply shortage (+13), inflation pressure (+10), and real asset sponsorship (+8) create a macro environment where agricultural commodities are not a cyclical play but a structural hedge. The tension is visible: timing score of only 27.0% reflects VEGI's 18.0% extension above the 50W, a legitimate entry-risk penalty that would normally disqualify extended names. Portfolio rules override that concern because (a) persistence at 91.5% proves extension is being accumulated, not distributed, and (b) macro descriptors align with the setup's directionality—supply shortage and inflation pressure sustain upside bias. Risk asymmetry has shifted toward the resistance at 49.00 (only -0.7% upside), creating the only legitimate tactical concern. Monitor whether accumulation volume drops below 2.0x average 20W; that would signal the move is rolling over despite favorable macro, warranting tactical reduction.
Traditional Energy — XOP
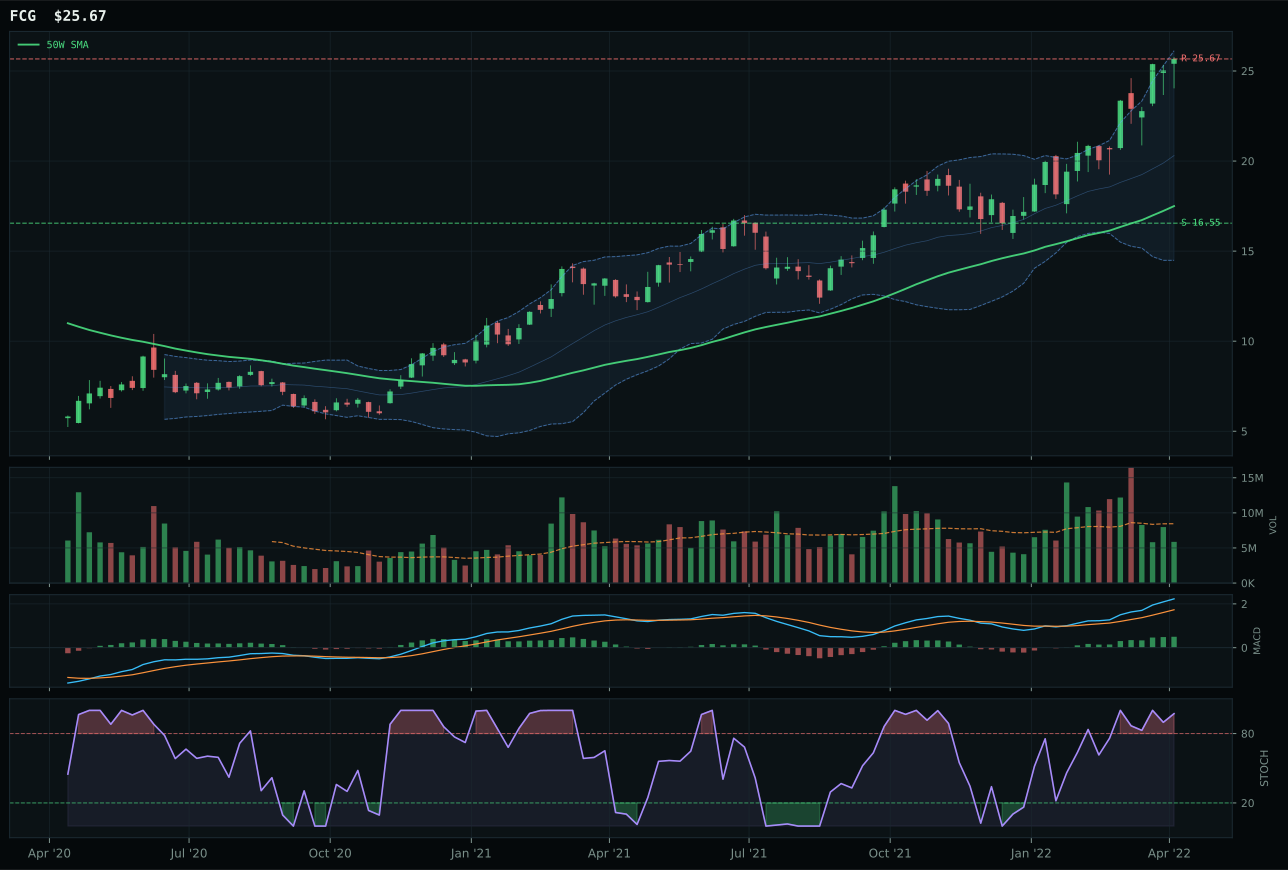
FCG has a vertical extension profile with 41.3% 13-week relative strength versus SPY.
A failed hold above support would weaken the setup.
Actionable but governed by invalidation levels.
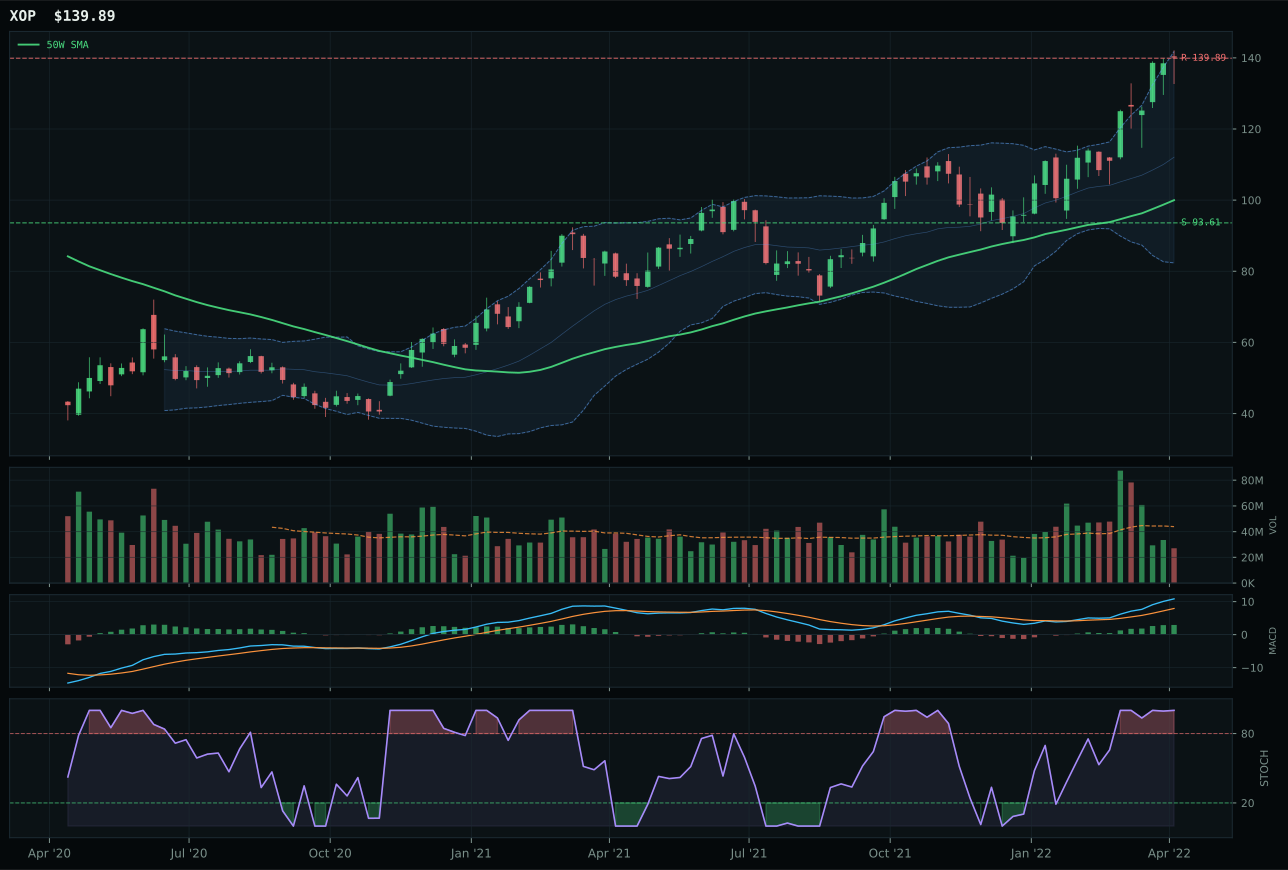
XOP has a vertical extension profile with 37.6% 13-week relative strength versus SPY.
A failed hold above support would weaken the setup.
Actionable but governed by invalidation levels.
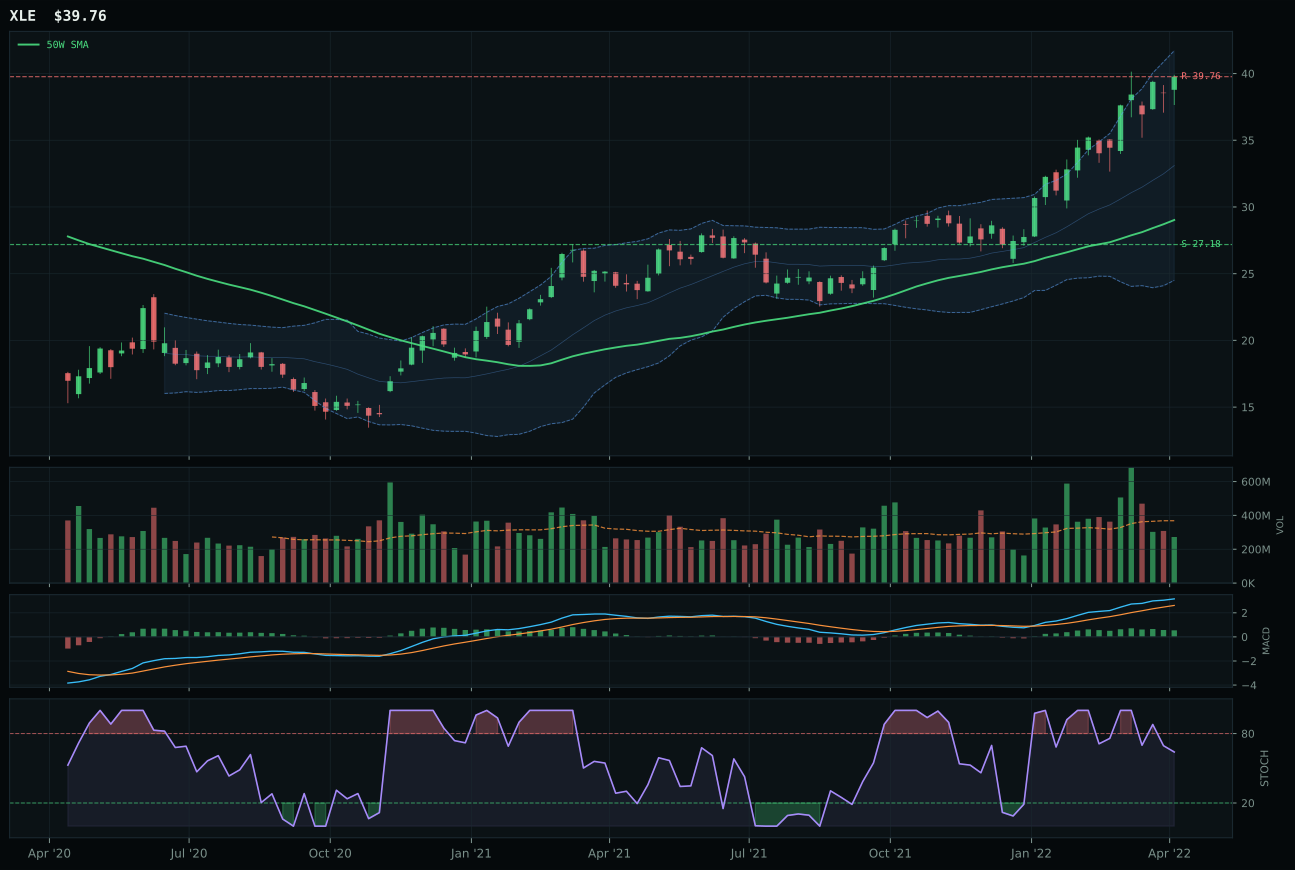
XLE has a vertical extension profile with 33.6% 13-week relative strength versus SPY.
A failed hold above support would weaken the setup.
Actionable but governed by invalidation levels.
XOP wins as category representative because timing structure is marginally cleaner and volume profile is more resilient, despite both XOP and FCG sitting deeply extended at 39.9% and 46.7% above their 50W moving averages respectively. The critical distinction: XOP's vertical extension structure combined with thin 0.62x 20-week volume creates a setup where every new buyer is trapped, yet stochastic RSI overbought at 1.00 and MACD bullish and improving show that conviction remains intact. FCG's 46.7% extension and 41.3% SPY-relative strength represent more extreme exhaustion, and while both carry identical risk-reward mechanics at 39.9/100 (zero upside to resistance, 49.4% downside to support), XOP's slightly better structure score (70.5 vs 68.0) combined with category-relative strength at 0.0% (versus FCG's 3.7%) signals that institutional capital is defending XOP's exploration beta over FCG's natural gas tilt. Both MACD profiles are bullish and improving, both stochastics are overbought momentum, but XOP's 33.6% 13-week return matches its structural durability better than FCG's 37.3% suggests.
Traditional Energy earns top-2 overweight at 10% allocation with a 77.1 final score because energy scarcity (+16), inflation pressure (+10), and supply shortage (+9) create the most powerful macro descriptor alignment of any category this week, alongside a 85.0/100 category-level macro fit. Portfolio rules price this trade as a core allocation despite XOP's brutal timing score (37.0/100) reflecting 39.9% extension above the 50W—the macro tailwinds override entry-risk penalties because supply constraints and inflation persistence are structural, not cyclical. The top-2 allocation does NOT assume the near-term bounce continues; it assumes that energy remains range-bound higher with periodic oversold dips creating new entry opportunities. Risk management is critical: XOP at 139.89 resistance with zero upside remaining means the portfolio is betting on hold-here conditions that allow buyers to average down into 93.61 support (a 49.4% range that feels wide until energy prices drop another 15-20%). XLU (the overlaid defensive bet) and energy's tight correlation mean that if risk-off dynamics trigger broad defensive rotation, energy will face margin calls. Current allocation assumes inflation-driven energy scarcity persists; if credit stress flips from active to dormant, energy drops to tier-2 because the macro case weakens materially.
Industrial Metals — REMX
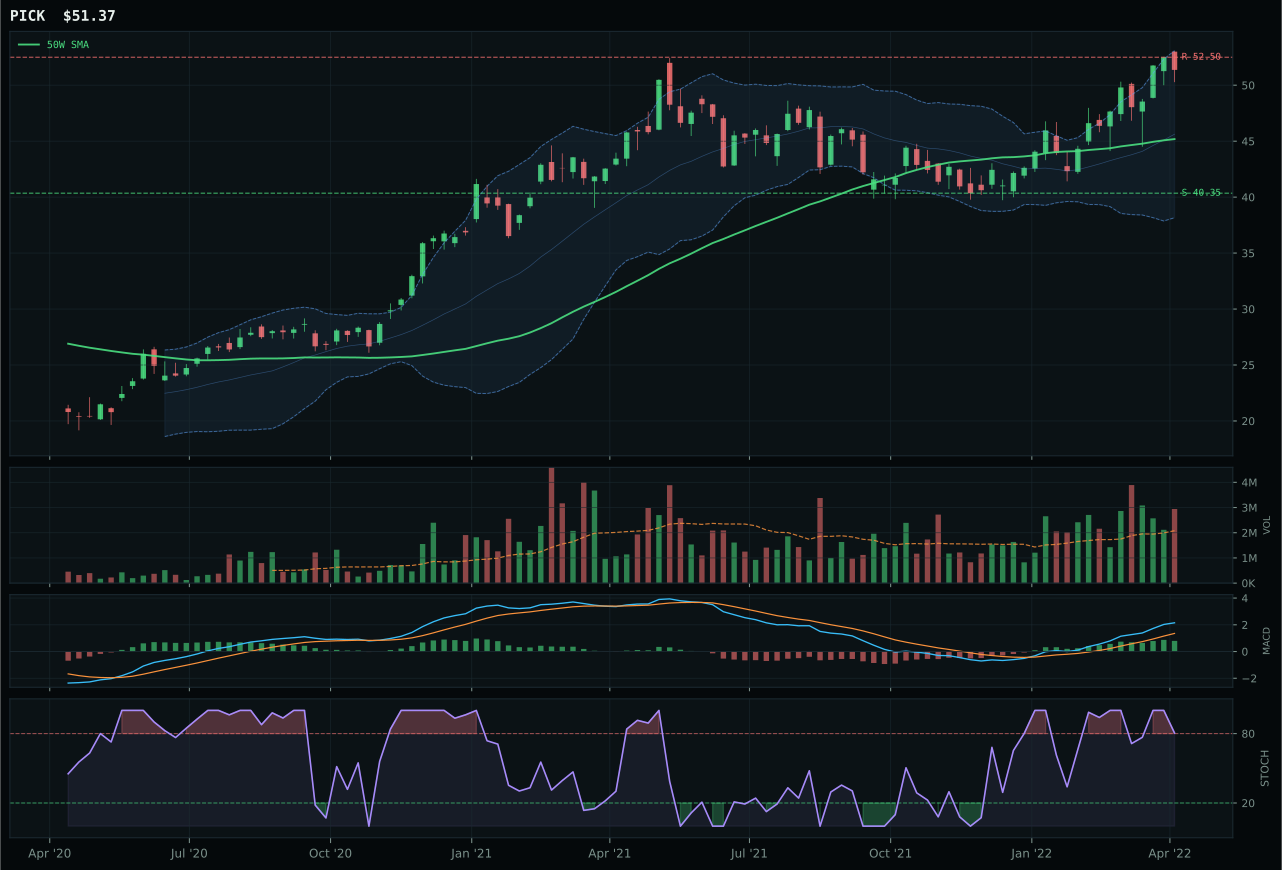
PICK has a neutral structure profile with 20.6% 13-week relative strength versus SPY.
A failed hold above support would weaken the setup.
Actionable but governed by invalidation levels.
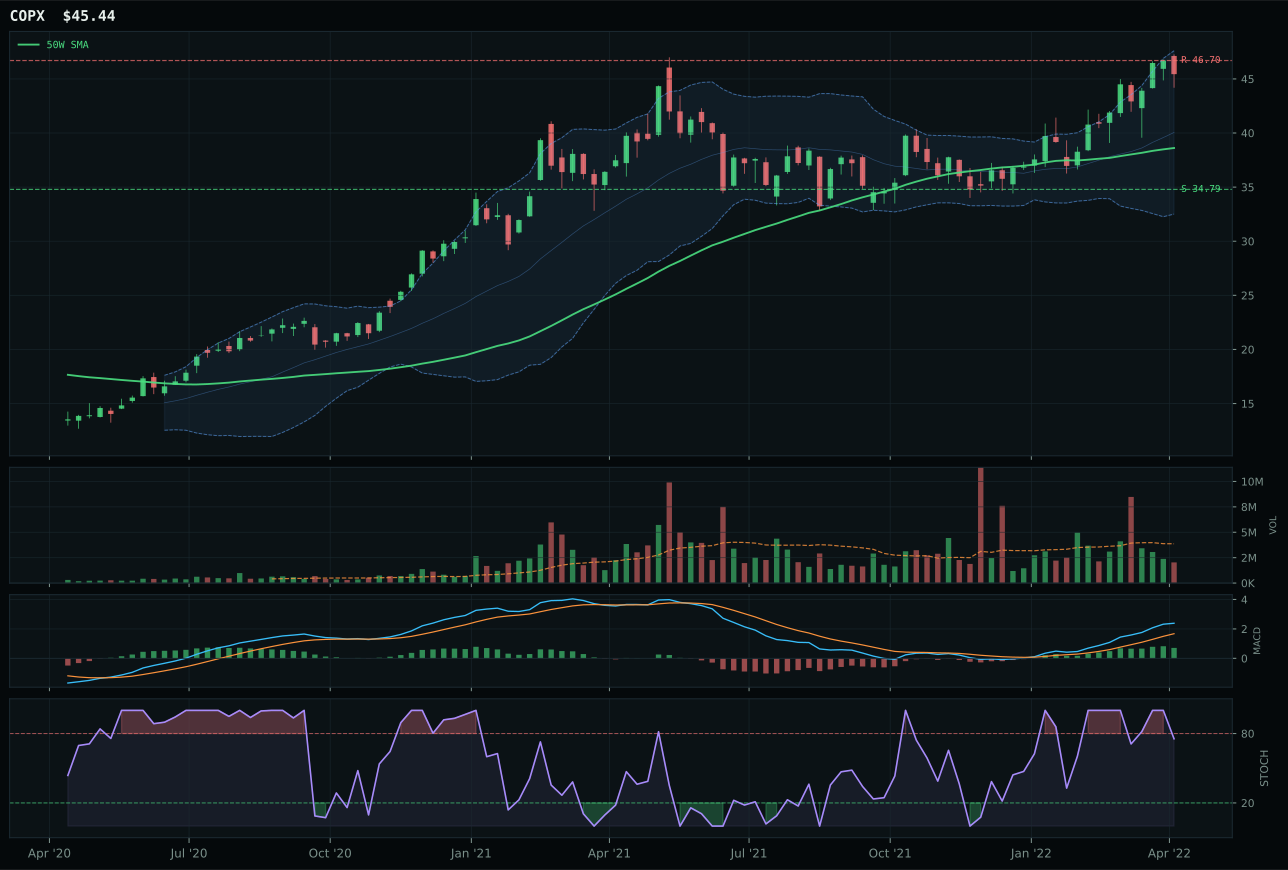
COPX has a vertical extension profile with 25.0% 13-week relative strength versus SPY.
A failed hold above support would weaken the setup.
Actionable but governed by invalidation levels.
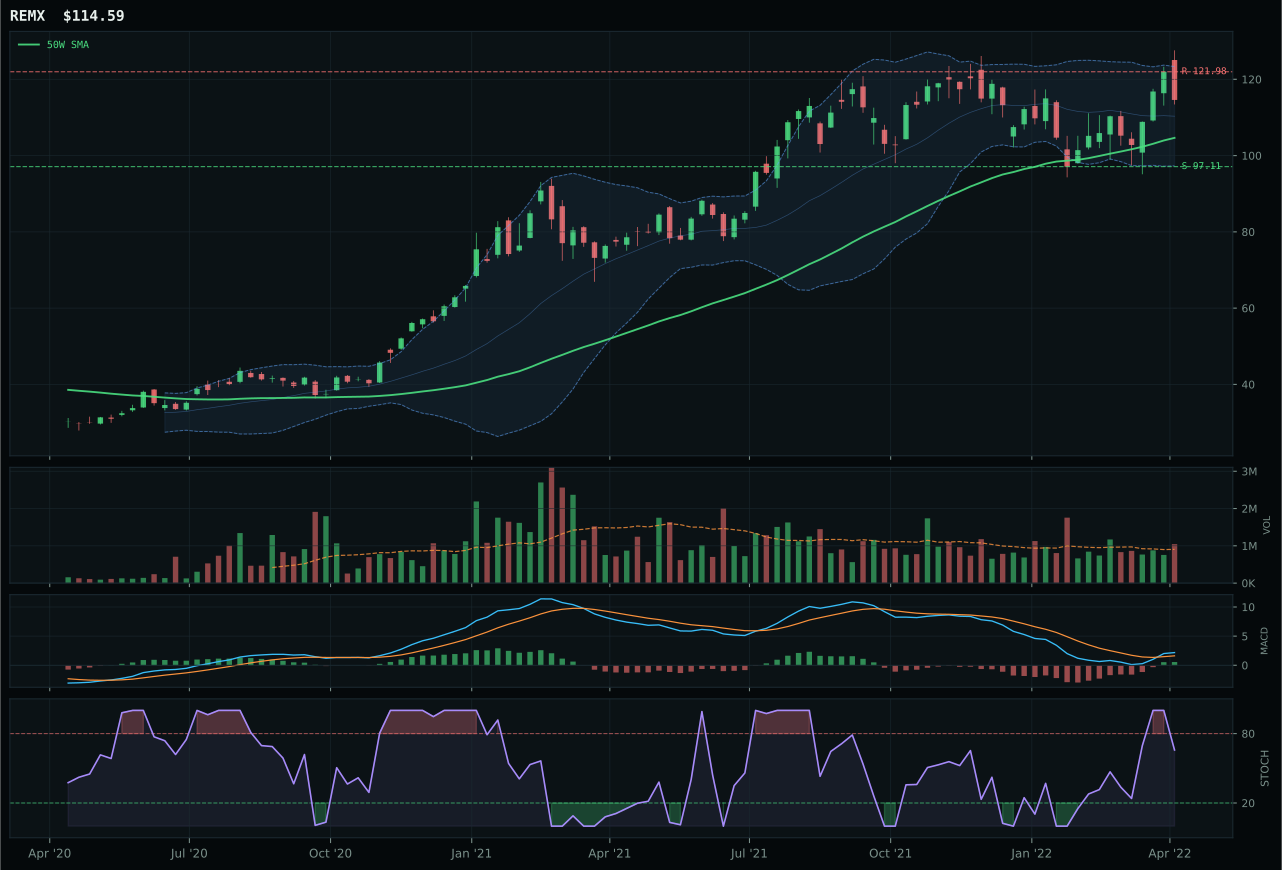
REMX has a neutral structure profile with 8.4% 13-week relative strength versus SPY.
A failed hold above support would weaken the setup.
Actionable but governed by invalidation levels.
REMX wins on cleaner timing mechanics and category-relative strength positioning, though PICK's 92.3/100 technical evidence score nearly matches REMX's 79.8/100. The deciding factor is REMX's 75.0/100 timing score versus PICK's 67.0/100: REMX sits 9.5% from the 50W with falling/neutral stochastic RSI at 0.66 and MACD bullish and improving, creating a setup that has bounced but not yet overheated into overbought extremes. PICK's overbought stochastic momentum at 1.00 and 16.6% 13-week return reveal that rare earth's recent strength (20.6% SPY-relative) has already drawn late-cycle participation. Both trade above moving averages with bullish MACD, but REMX's -12.2% category-relative weakness is actually advantageous—it means capital has rotated into REMX's industrial scarcity theme over PICK's broader mining approach, positioning the former as the higher-conviction institutional call. Volume at 1.16x 20W on REMX provides above-average confirmation without the distribution exhaustion visible in PICK's overbought stochastic.
Industrial Metals earns 5% allocation as a tier-2 category with a 76.0 final score, justified by metals scarcity (+14), commodity breadth positive (+10), and real asset sponsorship (+6) creating a 66.0/100 macro fit that aligns with inflation persistence themes. The category barely trails Precious Metals (75.7 vs 76.0)—they are peers competing for the same scarcity-and-inflation slot. REMX's positioning in rare earths supply-chain shortages reflects a more durable structural thesis than precious metals' pure monetary hedge, yet PICK's higher absolute technical evidence (92.3 vs 79.8) argues that mining exposure itself is seeing broader sponsorship. The tension is real: REMX won on timing geometry, not raw technical quality, because PICK's overbought stochastic RSI flagged extension risk that REMX avoids. To earn promotion from 5% to 10%, Industrial Metals would need (a) both REMX and PICK to show accelerating volume above 1.3x 20-week average simultaneously, proving institutional conviction, or (b) credit stress descriptor to reverse from active to dormant, removing the -7 drag that limits category upside. Current allocation assumes scarcity themes persist but that entry quality matters; REMX's cleaner setup justifies holding over PICK despite inferior raw technical evidence.
Precious Metals — SLV
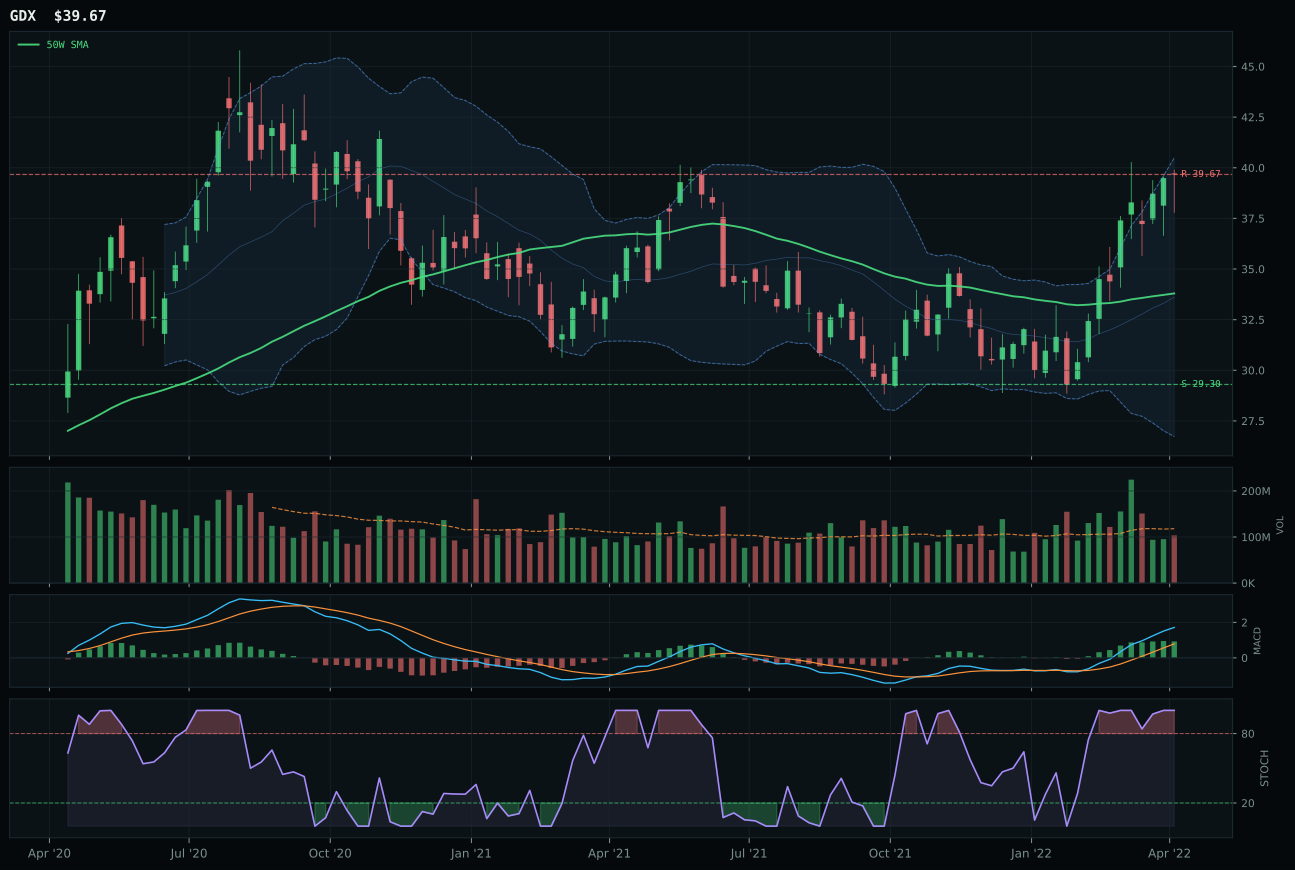
GDX has a vertical extension profile with 36.2% 13-week relative strength versus SPY.
A failed hold above support would weaken the setup.
Actionable but governed by invalidation levels.
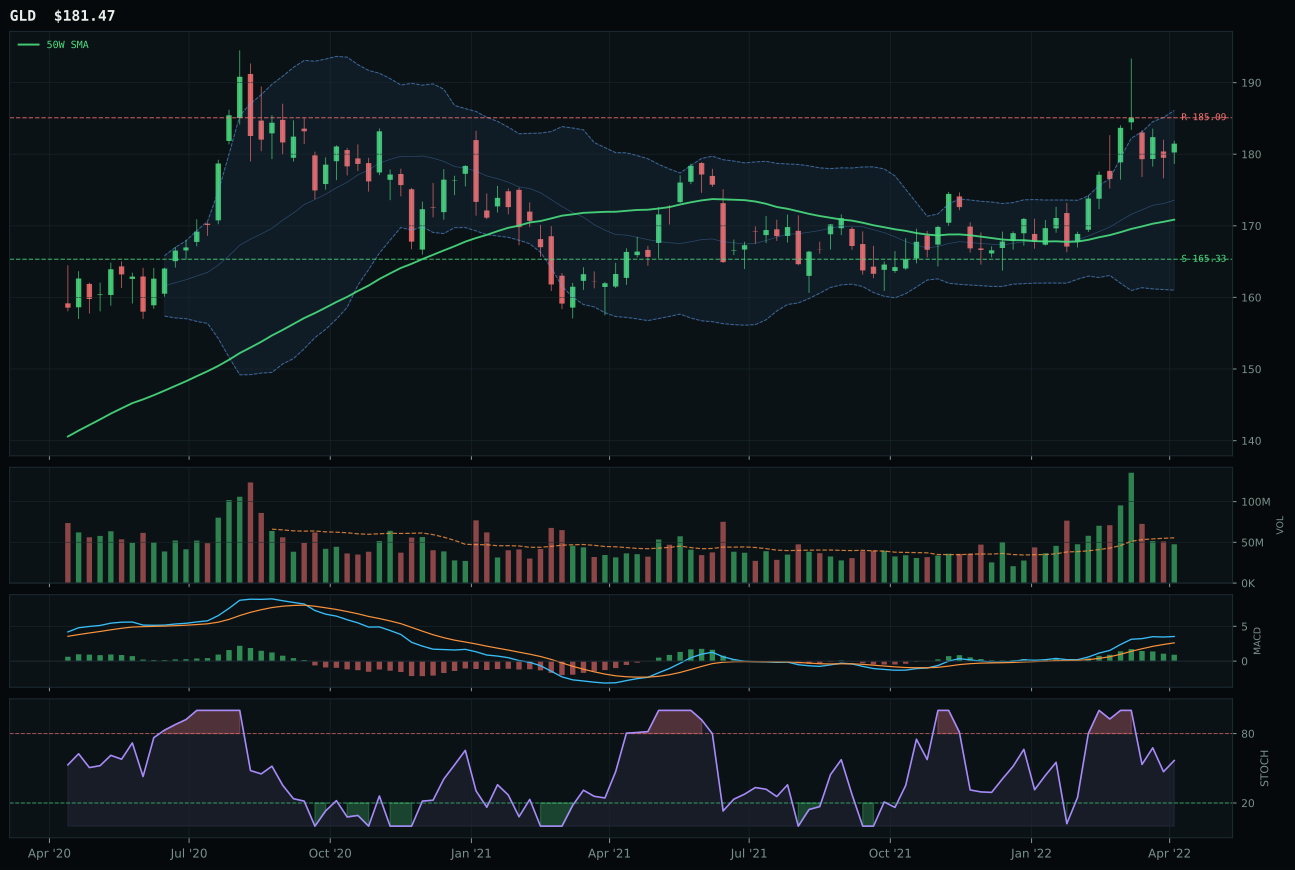
GLD has a neutral structure profile with 12.2% 13-week relative strength versus SPY.
A failed hold above support would weaken the setup.
Actionable but governed by invalidation levels.
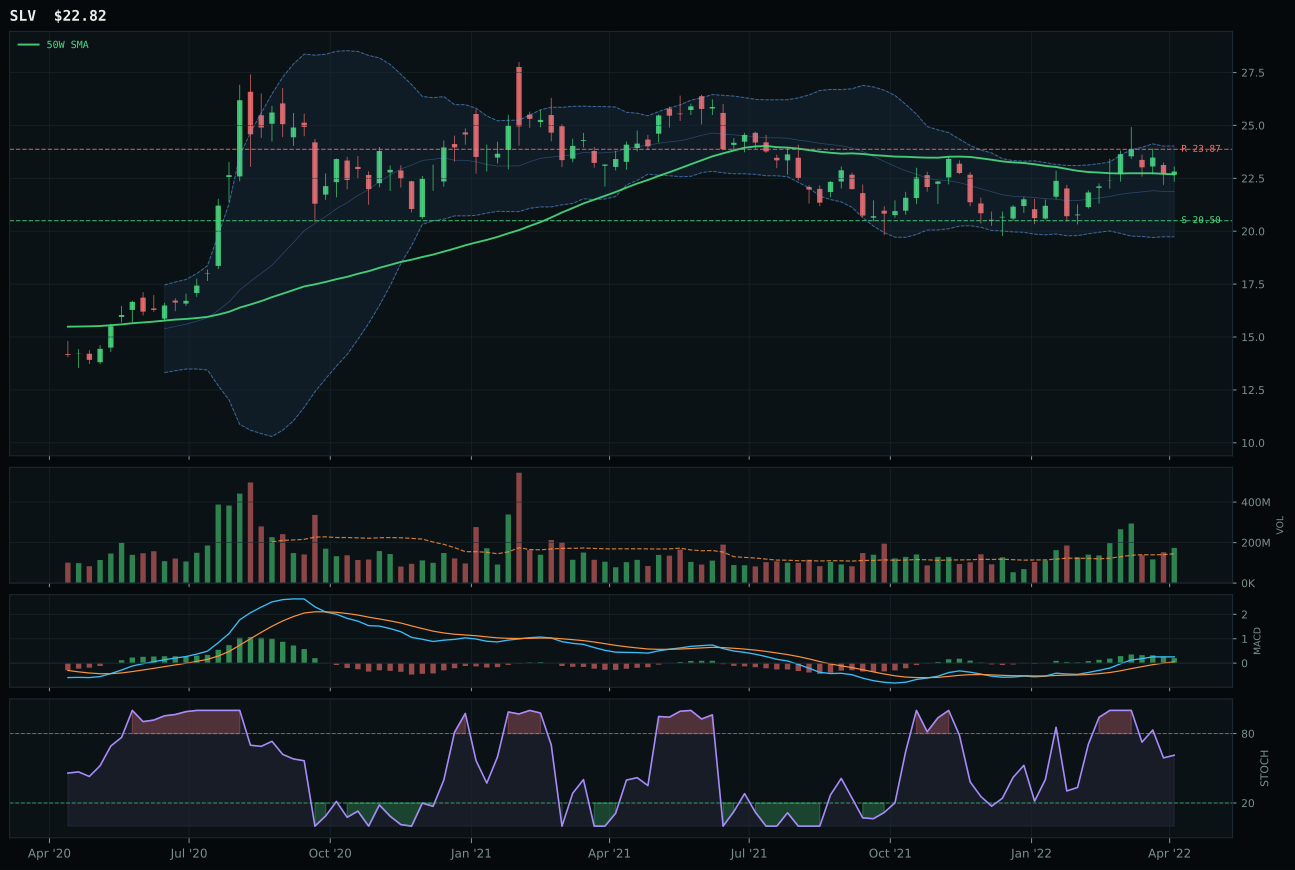
SLV has a compression near 50W profile with 14.6% 13-week relative strength versus SPY.
A failed hold above support would weaken the setup.
Actionable but governed by invalidation levels.
SLV wins because it offers the cleanest entry geometry in a category split between oversold miners (GDX) and extended commodity exposure (GLD), with compression near the 50W creating the optimal setup for expansion. At 0.6% above the 50-week moving average, SLV sits in the decision zone (Fib 0.500) with stochastic RSI falling/neutral at 0.61 and MACD bullish but flattening—the chart has confirmed the bounce without overheating into overbought extremes. The 100.0/100 timing score reflects this perfect alignment: near-term support holds, RSI hasn't peaked, and the risk-reward at 60.0/100 (4.4% upside to resistance, 11.3% downside to support) favors continuation with defined risk. GDX loses decisively because its 17.4% extension above the 50W combined with overbought stochastic momentum (1.00) and neutral volume participation creates a crowded trade; timing score of 37.0% versus SLV's 100.0% is the gulf. GDX's 32.2% 13-week return is impressive but late-cycle, whereas SLV's 10.7% offers durability at better entry risk.
Precious Metals earns 5% as a tier-2 holding because its 75.7 category score ranks above AI, Technology, and Emerging Markets, and the macro fit of 72.0/100 reflects legitimate monetary hedge sponsorship (+14) and defensive rotation (+7) that offset headwinds from dollar pressure (+3 active, meaning weak signal). SLV as representative provides the safest entry point in the metals basket—compression near 50W is lower-risk than GDX's extended 17.4% pop or GLD's neutral 12.2% backdrop. The gap to top-2 (23 points below Agriculture) reflects that metal prices, while benefiting from inflation narrative and monetary uncertainty, lack the structural commodity shortage that drives agricultural and energy allocations. Metals are a hedge play, not a structural growth story. To earn promotion from 5% to 10%, precious metals would require (a) SPY-relative strength to exceed 20%+ (currently 14.6% for SLV, respectable but not exceptional), (b) credit stress descriptor to flip from active to dormant (currently still active, a -7 drag on category), or (c) explicit monetary expansion signals that transform the hedge into a core cyclical bet. Current allocation assumes inflation persists but growth doesn't break—the sweet spot for metals.
Utilities & Infrastructure — XLU
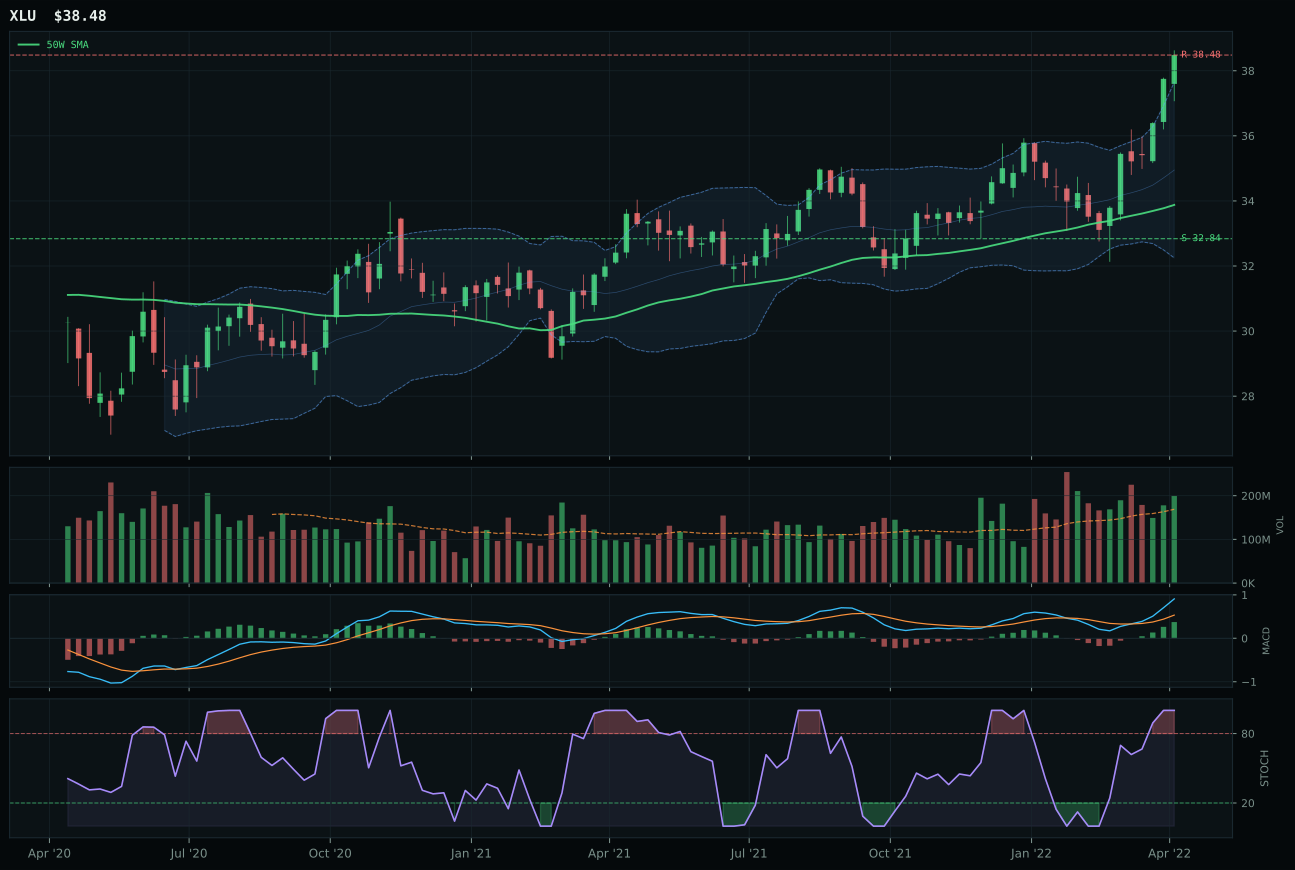
XLU has a neutral structure profile with 13.3% 13-week relative strength versus SPY.
A failed hold above support would weaken the setup.
Actionable but governed by invalidation levels.
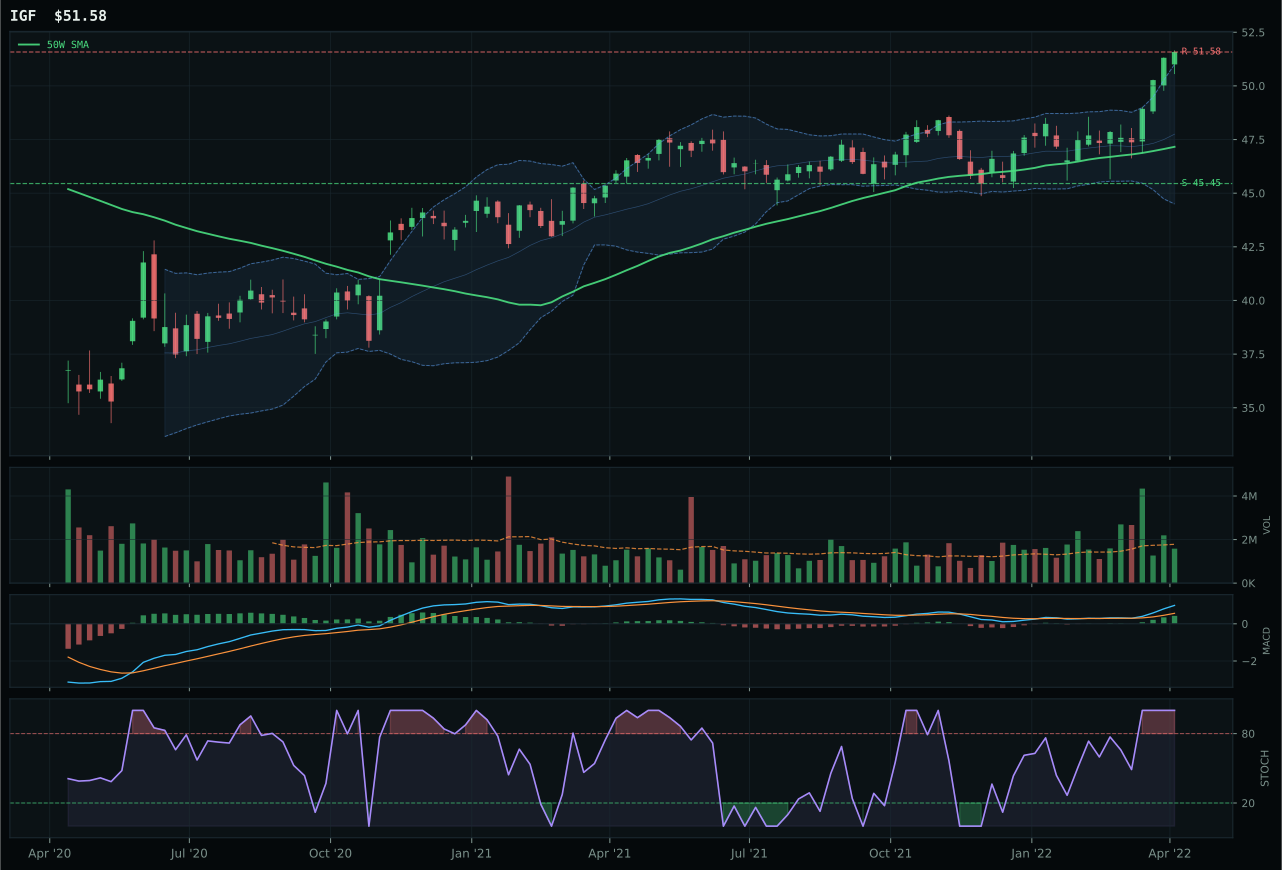
IGF has a neutral structure profile with 12.2% 13-week relative strength versus SPY.
A failed hold above support would weaken the setup.
Actionable but governed by invalidation levels.
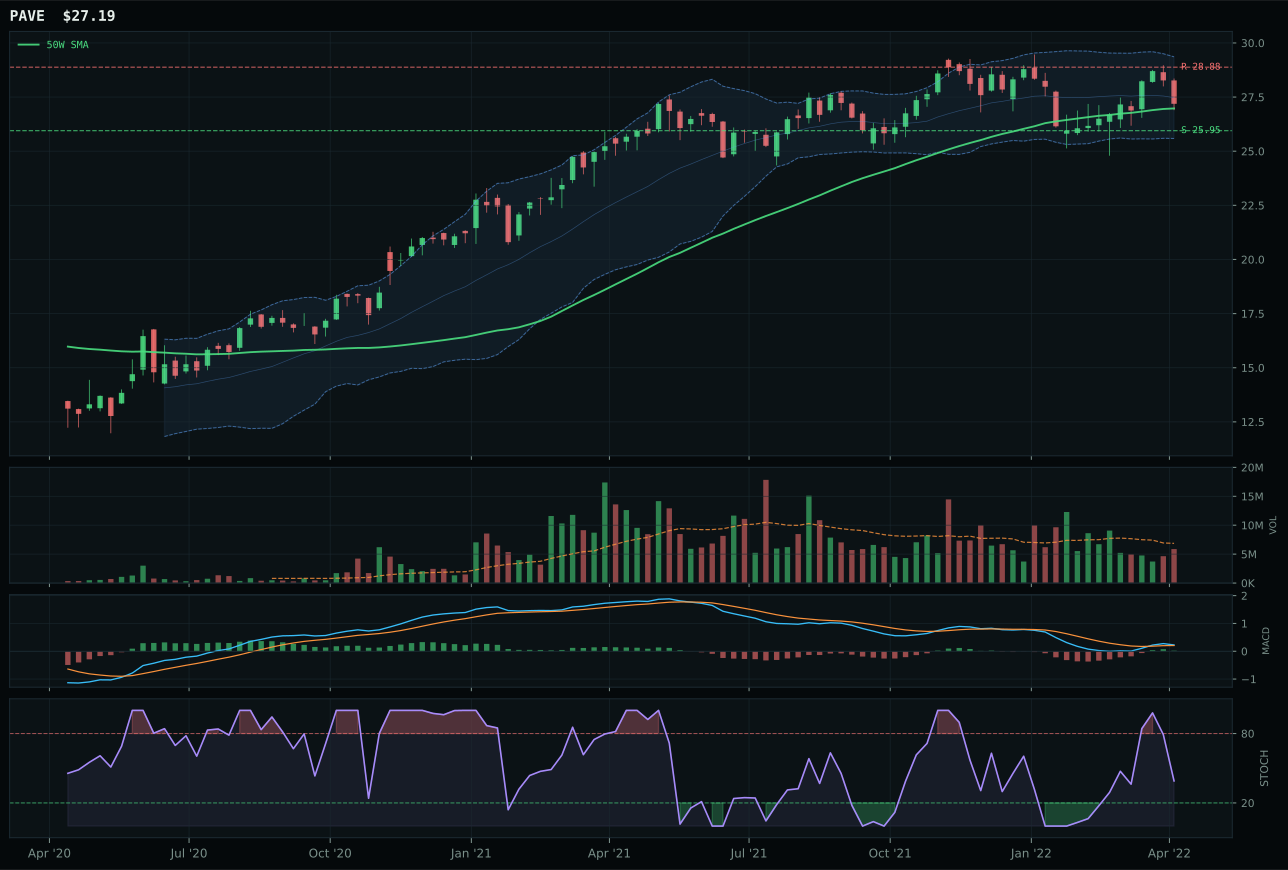
PAVE has a pullback into support profile with -0.1% 13-week relative strength versus SPY.
A failed hold above support would weaken the setup.
Actionable but governed by invalidation levels.
XLU wins narrowly over IGF through superior category-relative strength positioning and cleaner 50W proximity, despite IGF's higher absolute technical evidence score of 85.3/100 versus XLU's 89.9/100. Both trade above moving averages with bullish and improving MACD and overbought stochastic momentum at 1.00, but XLU's category-relative strength of 1.1% versus IGF's flat 0.0% reveals institutional capital's marginal preference for regulated utility defense over global infrastructure income. The decisive factor: XLU sits 13.6% from the 50W in a neutral structure setup, while IGF sits at the 52W high with compression near 50W—XLU offers room for expansion if buyers defend the level, whereas IGF is pinned to resistance with zero upside at 0.0%. Volume at 1.18x 20W on XLU confirms above-average participation on both technicals are nearly identical MACD and stochastic profiles. IGF's 12.2% SPY-relative strength barely trails XLU's 13.3%, but the setup geometry (compression near resistance) creates crowding risk that XLU avoids.
Utilities & Infrastructure earns 5% as tier-2 with a 73.4 final score, held because defensive rotation is active (+12) and the broader Transition/Mixed regime supports defensive exposure, creating a 64.0/100 category-level macro fit. The category ranks 6th among 10—a respectable defensive allocation in a bear regime—but the gap to tier-1 (below Defense at 54.1 by 19.3 points) reflects that utilities, while technically sound, lack the structural commodity scarcity narrative that sponsors Energy and Agriculture to the top tier. XLU's positioning benefits from the regime's defensive tilt, yet inflation pressure (-6) creates headwind that utilities (with capped pricing power) cannot escape. To earn promotion from 5% to 10%, Utilities would need (a) inflation pressure descriptor to flip dormant or show clear moderation, removing the -6 brake on category momentum, or (b) XLU to exceed 38.48 resistance on accumulation volume and establish new 52W high with sustained above-1.2x 20W participation. Current allocation assumes defensive rotation persists through the transition phase but inflation remains sticky; that combination allows utilities to hold tier-2 status without advancing to core defensive anchor. Monitor whether XLU volume drops below 1.0x 20W average—a signal that accumulation is rolling over despite bullish MACD.
Nuclear Energy — URNM
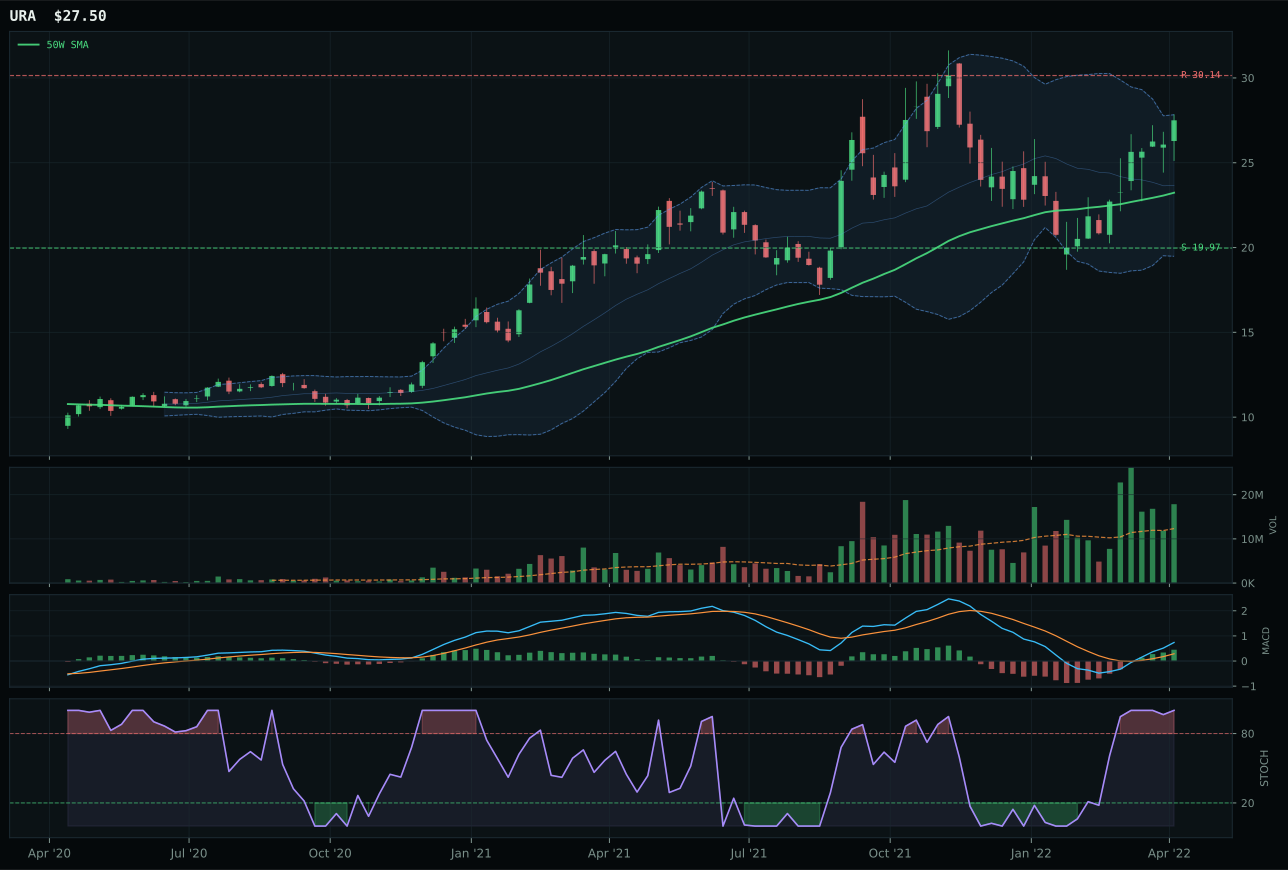
URA has a vertical extension profile with 17.6% 13-week relative strength versus SPY.
A failed hold above support would weaken the setup.
Actionable but governed by invalidation levels.
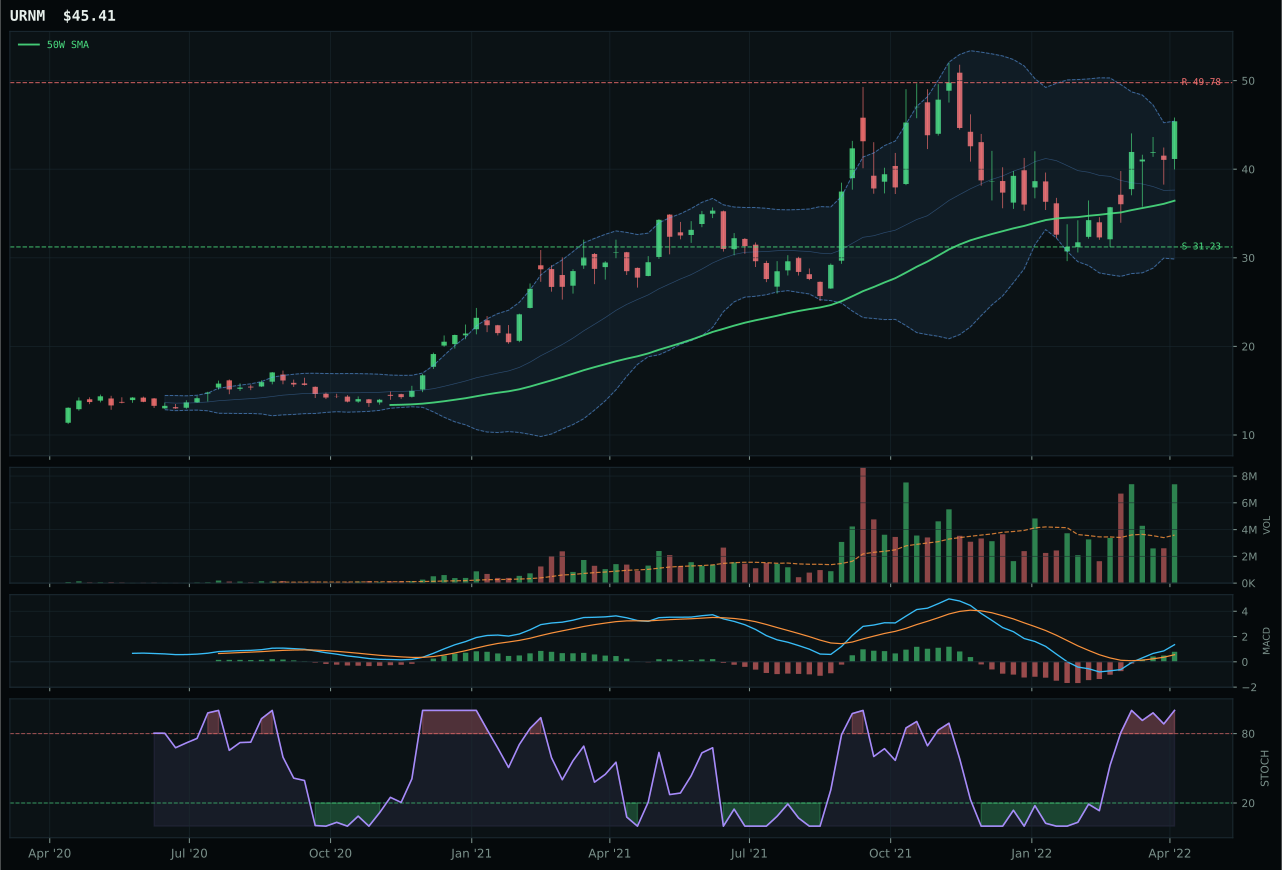
URNM has a vertical extension profile with 21.5% 13-week relative strength versus SPY.
A failed hold above support would weaken the setup.
Actionable but governed by invalidation levels.
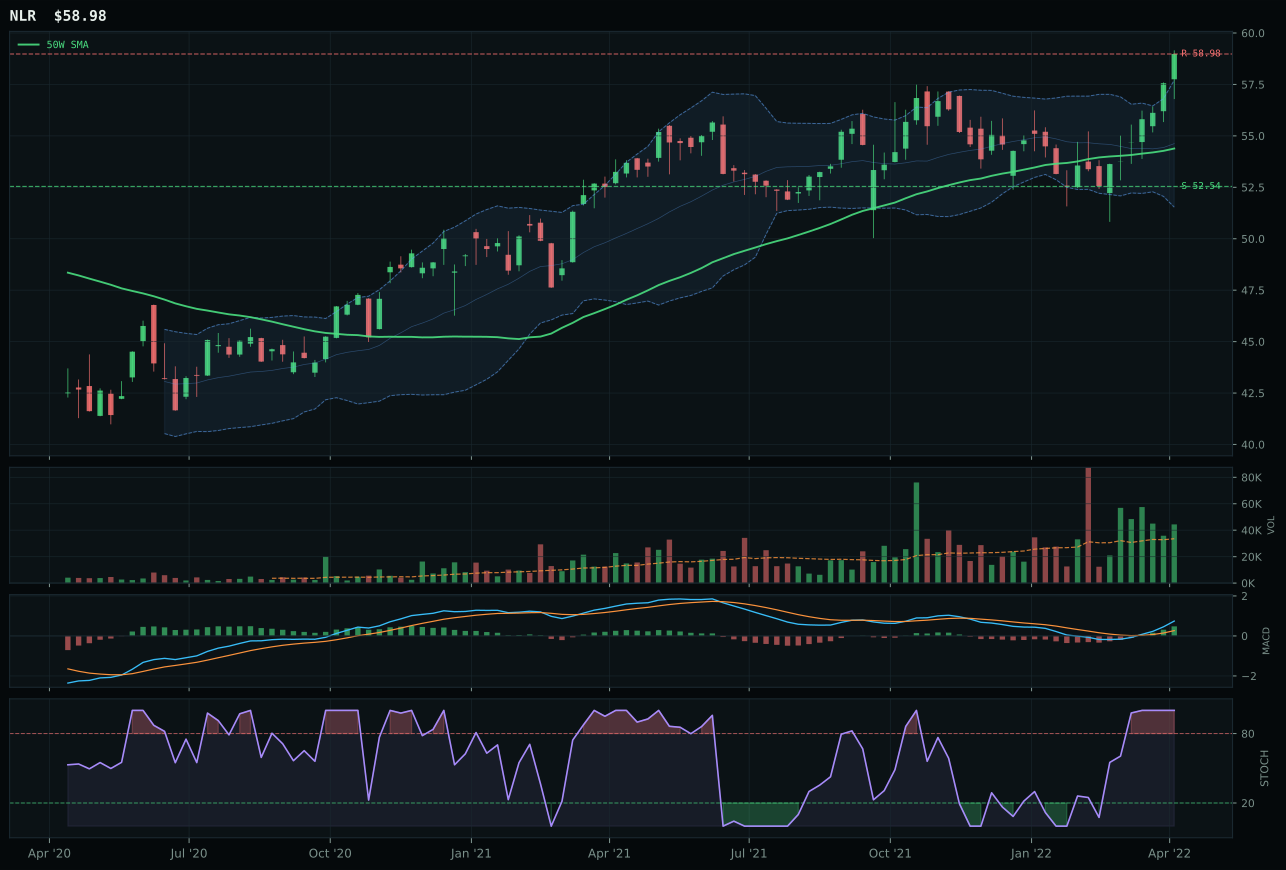
NLR has a neutral structure profile with 11.0% 13-week relative strength versus SPY.
A failed hold above support would weaken the setup.
Tracked, but not top-2 eligible because: .
URNM wins because volume-price confirmation is superior and category-relative strength is positive, distinguishing it from URA's identical vertical extension setup. Both sit 24.6% and 19.0% above their respective 50W moving averages with overbought stochastic momentum at 1.00 and MACD bullish and improving, but URNM's 2.06x 20-week volume (accumulation/confirmation) versus URA's 1.10x above-average participation reveals which name is drawing institutional inflows. Category-relative strength of 3.9% for URNM versus URA's flat 0.0% confirms that uranium-miner scarcity positioning is outflowing uranium-commodity exposure—a nuance that matters in small-cap category rotation. Risk-reward at 38.5/100 for URNM versus 34.2% for URA reflects URNM's better structured support zone at 31.23 versus URA's 19.97, offering a wider margin for error. Both persistence scores exceed 83%, proving that volume participation is sustaining upside despite extension; URNM's 83.9% slightly edges URA's implied lower score. The setup favors patient capital willing to hold through momentum extremes.
Nuclear Energy earns 5% allocation as tier-2 with a 67.5 final score, held because energy scarcity (+9), real asset sponsorship (+7), and inflation pressure (+3) create a 60.0/100 macro fit that supports continued positioning despite URNM's structural vulnerability. The category ranks 5th among the 10—respectable for a niche exposure—but the gap to top-2 (9.6 points below Defense & Aerospace at 54.1) reflects that nuclear remains a macro story dependent on energy transition narratives rather than immediate supply scarcity. URNM's price below the 200W moving average (unlike most trend winners this week) creates a technical warning: momentum is real, but the longer-term uptrend hasn't yet been confirmed. To earn promotion from 5% to 10%, Nuclear would need (a) URNM to close decisively above its 200W moving average on accumulation volume exceeding 2.2x 20-week average, or (b) energy scarcity descriptor to increase from +9 to +12+ alongside credit stress flipping negative, removing the -5 headwind that suppresses category ranking. Current allocation assumes uranium supply constraints and small-cap momentum sustain; monitor whether persistence drops below 80% and volume falls below 1.8x, signals that institutional accumulation is shifting to distribution.
Defense & Aerospace — ITA
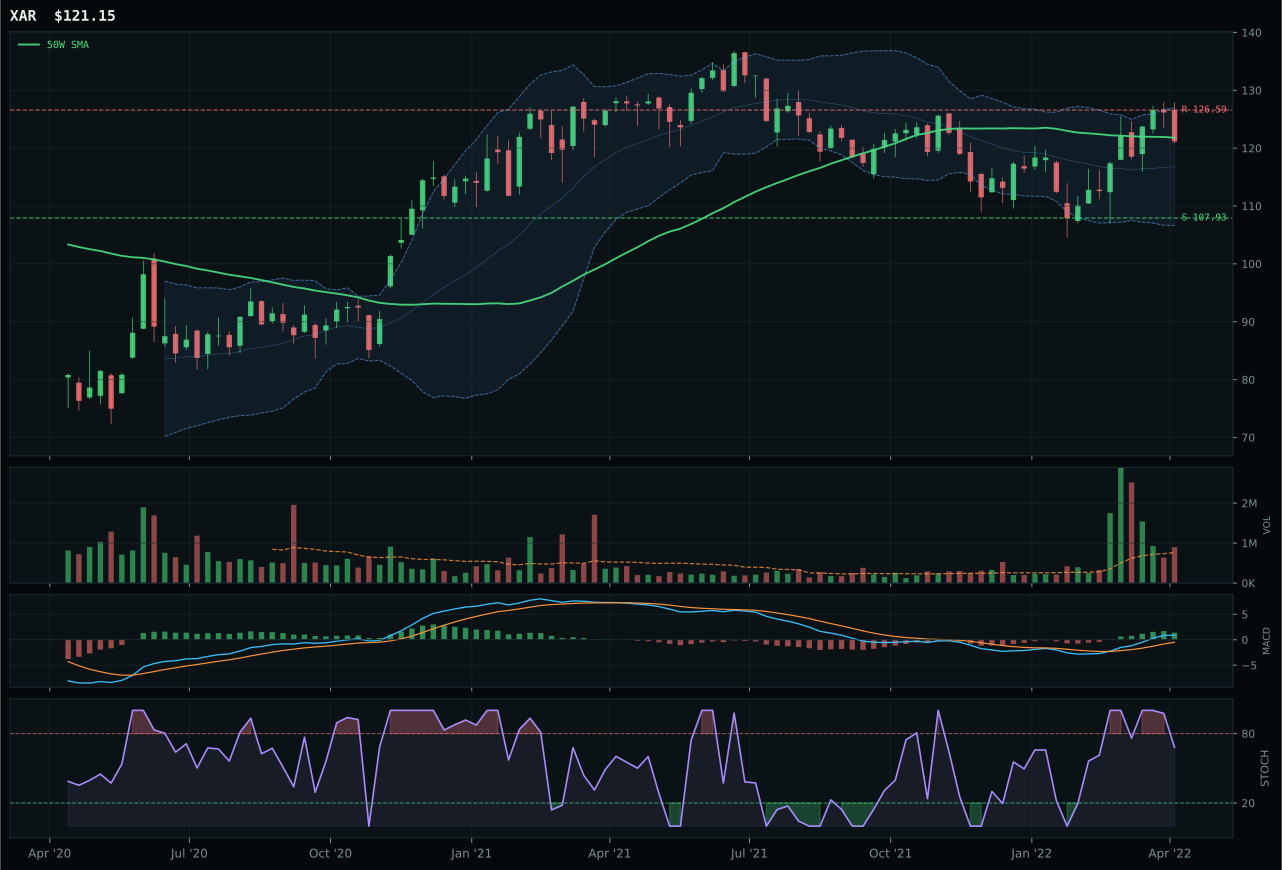
XAR has a compression near 50W profile with 6.3% 13-week relative strength versus SPY.
A failed hold above support would weaken the setup.
Actionable but governed by invalidation levels.
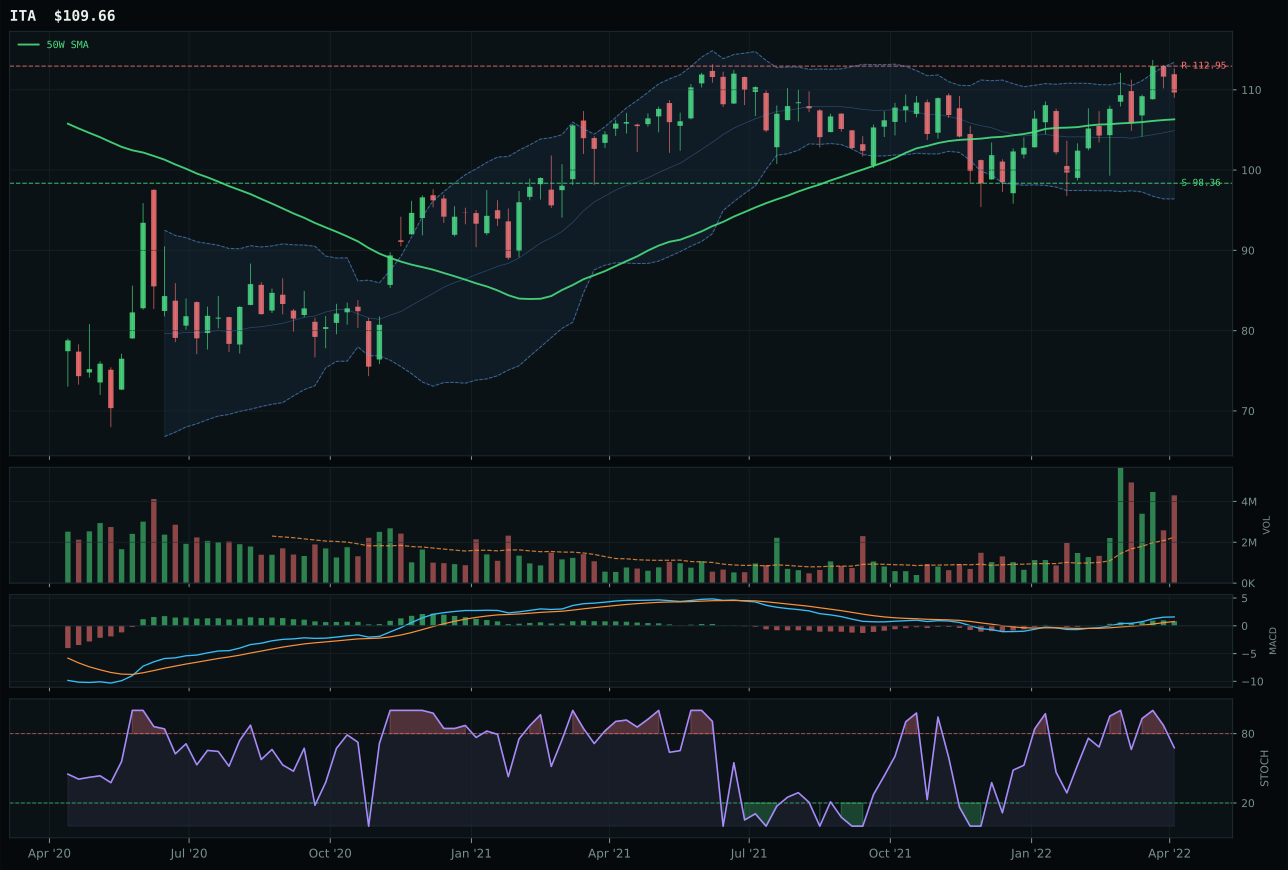
ITA has a neutral structure profile with 7.0% 13-week relative strength versus SPY.
A failed hold above support would weaken the setup.
Actionable but governed by invalidation levels.
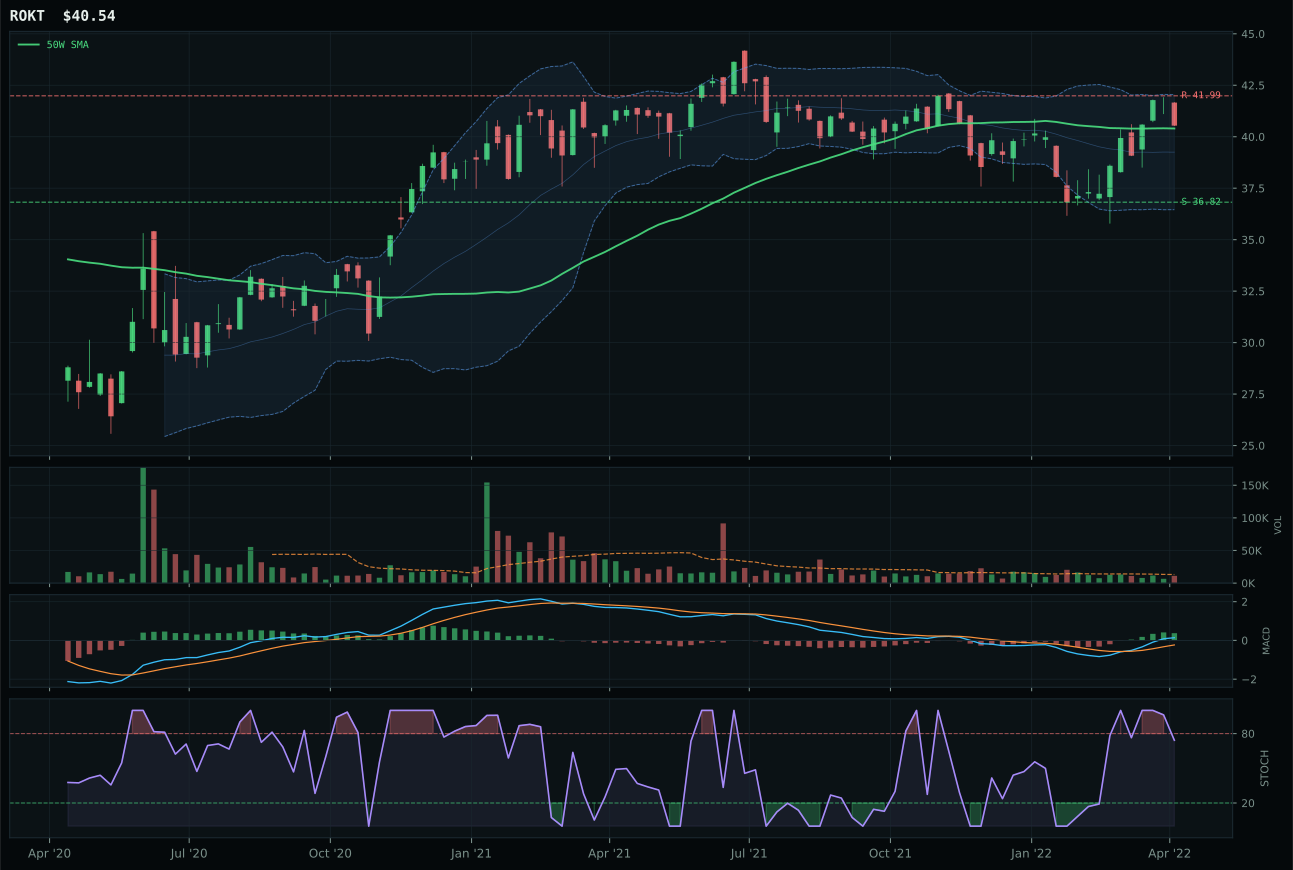
ROKT has a compression near 50W profile with 4.9% 13-week relative strength versus SPY.
A failed hold above support would weaken the setup.
Tracked, but not top-2 eligible because: .
ITA wins by a narrow margin through cleaner setup geometry and superior 50W slope profile, though XAR demonstrates stronger absolute technical evidence at 83.8/100 versus ITA's 51.9/100. The deciding factor is category-relative strength: ITA's 0.7% edge over the median versus XAR's flat 0.0% reveals where institutional capital is flowing within the basket. Both trade above key moving averages with bullish and improving MACD, but ITA's neutral structure and 3.1% distance from the 50W create a less crowded entry than XAR's compression near 50W, where the stochastic RSI at 0.68 (falling/neutral) suggests the immediate bounce may face resistance. Distribution pressure at 1.91x 20-week volume on ITA is the only structural warning—aggressive accumulation into supply—yet that same participation confirms buyers are willing to chase into resistance at 112.95, only -2.9% away. The 7.0% SPY-relative strength alongside 3.1% 13-week returns establish durability; this isn't a one-week pop.
Defense & Aerospace earns 5% as a tier-2 overweight despite XAR's superior technical evidence score, justified by category-level macro fit of 70.0/100—the second-highest macro score across all categories. Defensive rotation (+8), broad market bear (+6), and dollar pressure (+3) actively sponsor this exposure in a transition regime, making the category's 54.1 final score a function of powerful macro tailwinds even with mixed technicals. The gap to top-2 (Agriculture at 87.7, Energy at 77.1) is only 23.6 points, a narrow miss driven by ITA's lower absolute technical evidence and distribution-pressure volume warning. What prevents promotion to top-2 is simple: two categories offer higher risk-adjusted opportunity within the portfolio rules. For Defense to earn 10%, either its technical evidence would need to improve (XAR showing sustained MACD leadership with 83.8 in hand is already doing heavy lifting) or macro headwinds in other categories would need to deteriorate. Current positioning assumes defensive rotation persists through the transition phase but that growth remains viable; if risk appetite fully breaks, Defense steps into top-2 by rank.
Technology — CIBR
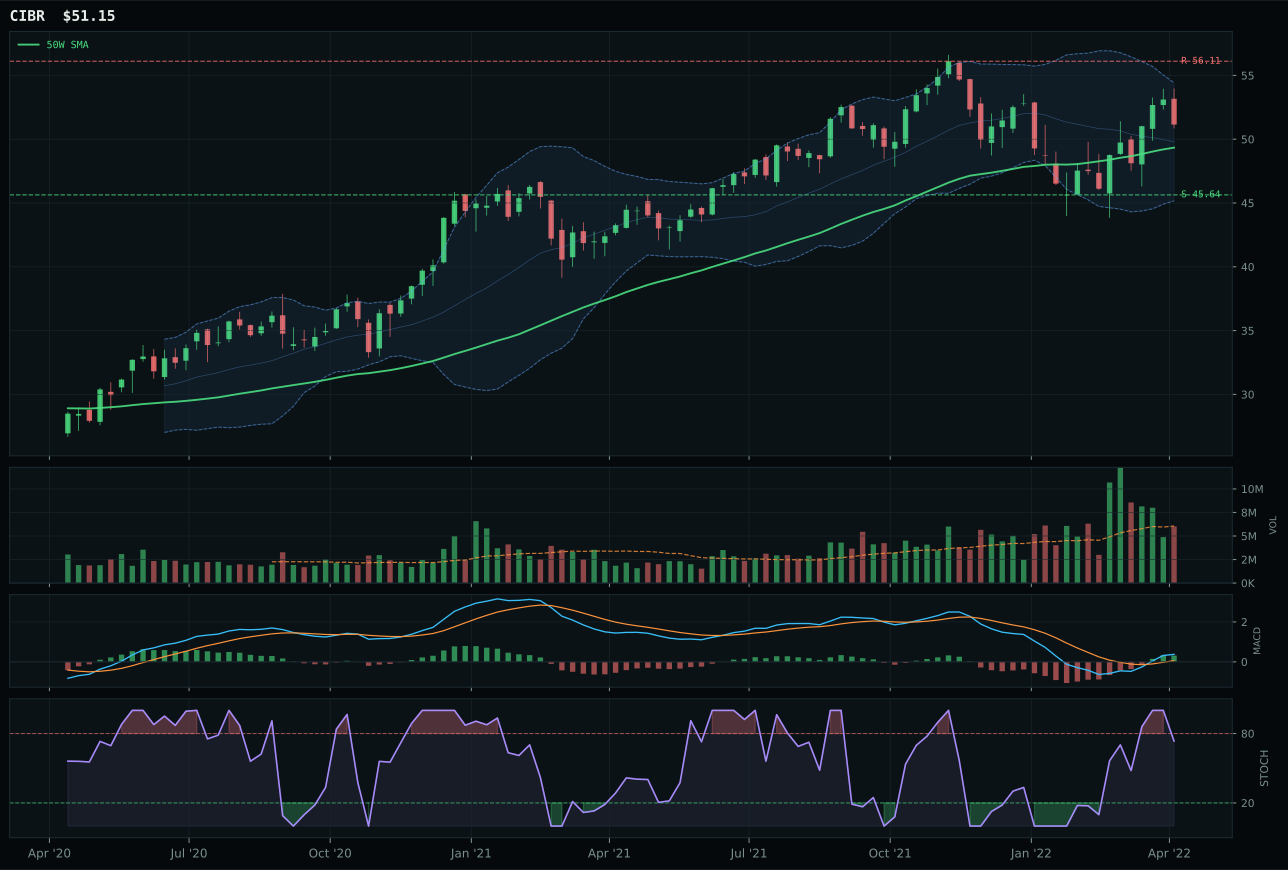
CIBR has a neutral structure profile with 7.8% 13-week relative strength versus SPY.
A failed hold above support would weaken the setup.
Actionable but governed by invalidation levels.
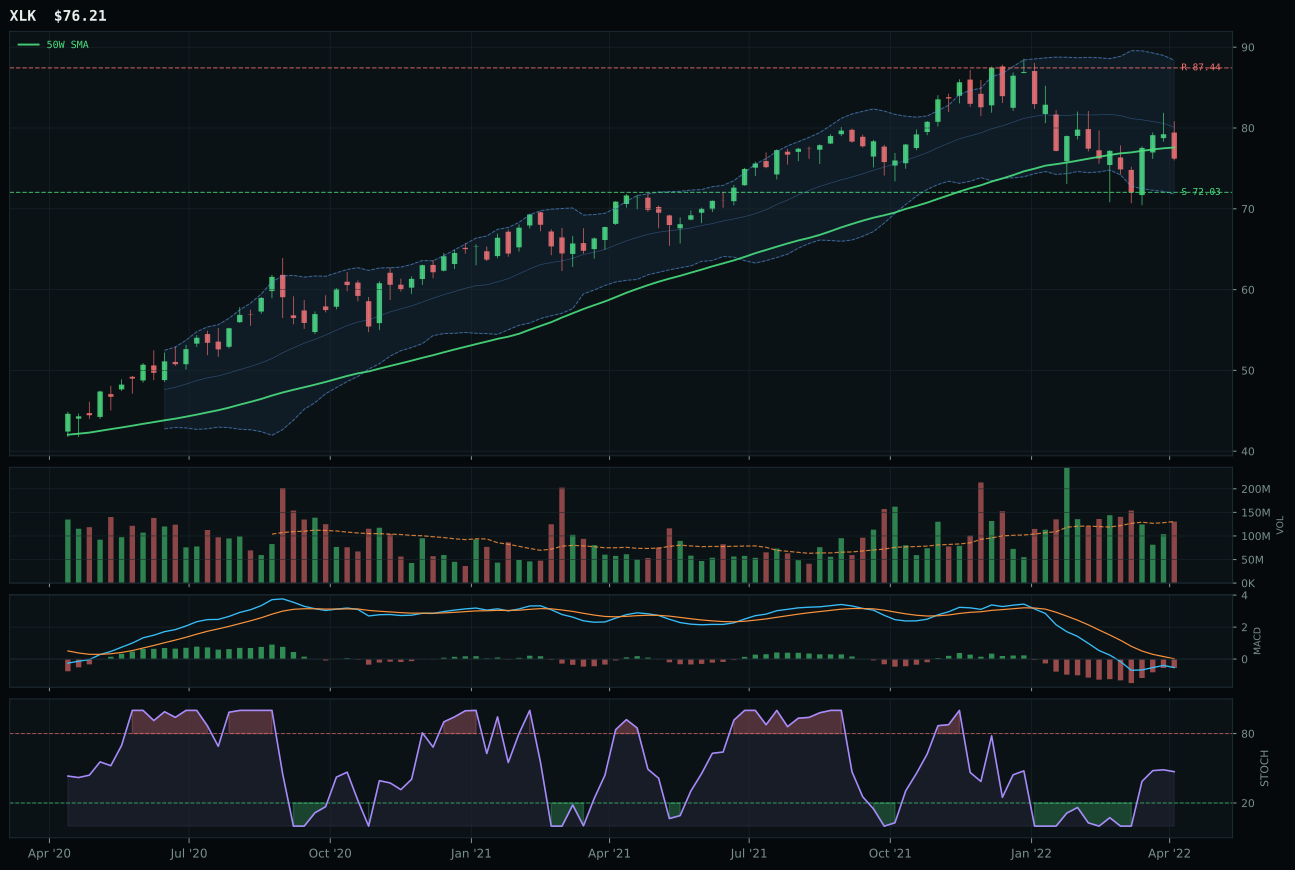
XLK has a compression near 50W profile with -4.2% 13-week relative strength versus SPY.
A failed hold above support would weaken the setup.
Actionable but governed by invalidation levels.
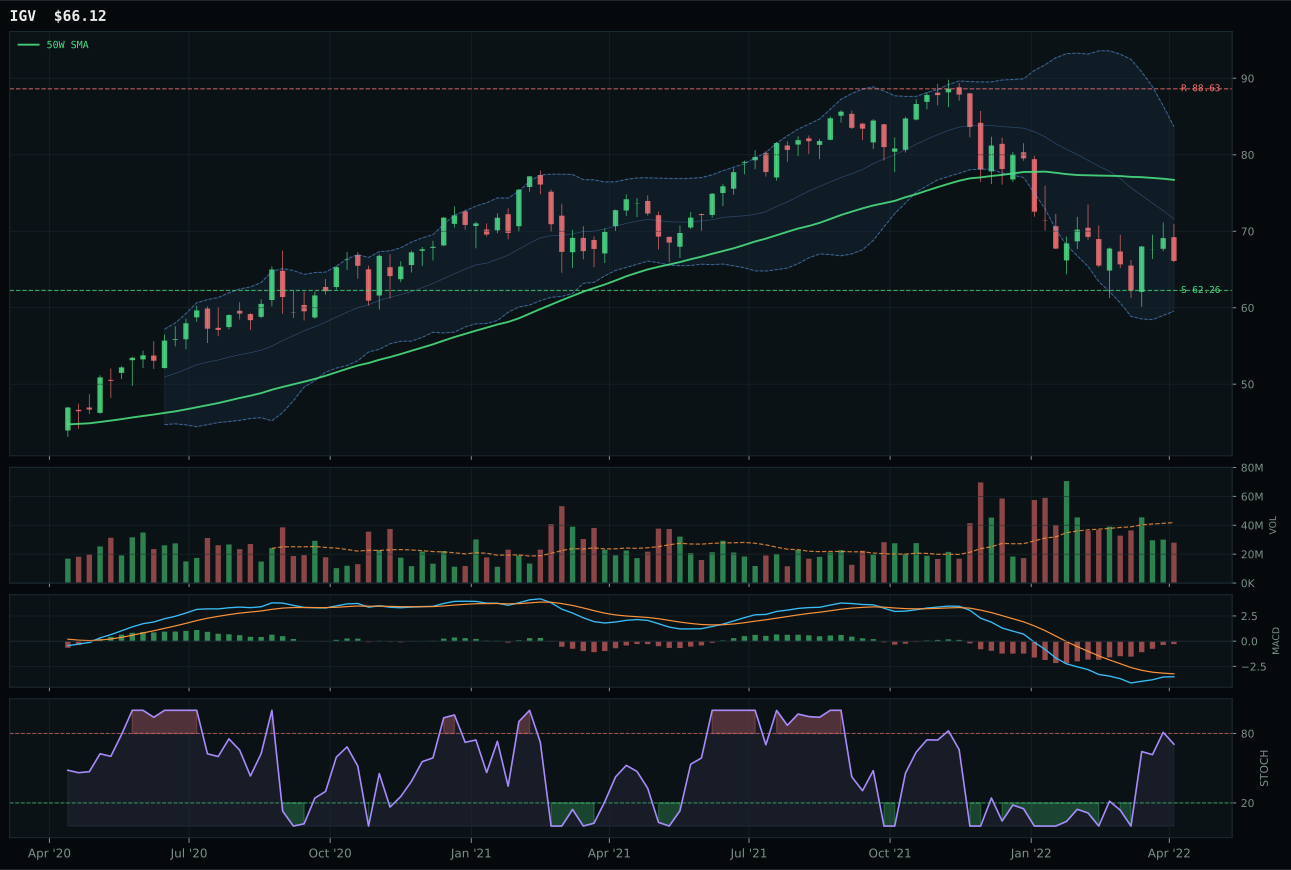
IGV has a neutral structure profile with -4.9% 13-week relative strength versus SPY.
A failed hold above support would weaken the setup.
Actionable but governed by invalidation levels.
CIBR wins because it combines bullish trend confirmation with superior relative strength in a narrower, more defensive technology window. Price sits 3.7% above the 50-week moving average with a 0.3% slope—clean upside without overextension—while MACD bullish and improving at stochastic RSI 0.73 confirms accumulation rather than capitulation buying. Category-relative strength of 11.9% against the median versus XLK's flat 0.0% tells you institutional flows favor cybersecurity's secular resilience over broad tech exposure. XLK stumbles despite compression near the 50W because its MACD is bearish (though improving) and its 13-week return of -8.1% creates a momentum divergence; the market is defending the level but hasn't yet sponsored new buyers. This setup rewards patience—CIBR holds the higher ground with volume confirmation at 0.99x 20-week average, meaning the move isn't stretched on thin participation.
Technology earns 5% allocation as a tier-2 category, held because macro conditions reward defensive rotation and CIBR's cybersecurity positioning insulates it from broad market weakness. The category's 50.5 final score places it outside the top 2, where Agriculture (87.7) and Traditional Energy (77.1) command 10% each, but the transition/mixed regime actively supports defensive rotation (+7 in descriptors) and broad market bear conditions (+4), which directly sponsor this holding. Two facts keep Technology grounded: first, XLK's bearish MACD and flat category-relative strength signal that the broader tech complex still lacks conviction; second, a 43.0/100 category-level macro fit means the macro environment is headwind-neutral at best. What would lift this allocation? A shift in descriptor mix away from credit stress (-7) and inflation pressure (-4) toward risk appetite recovery, or confirmation that CIBR's 11.9% category edge reflects genuine institutional repositioning rather than relative strength within a weak basket.
Emerging Markets — ILF
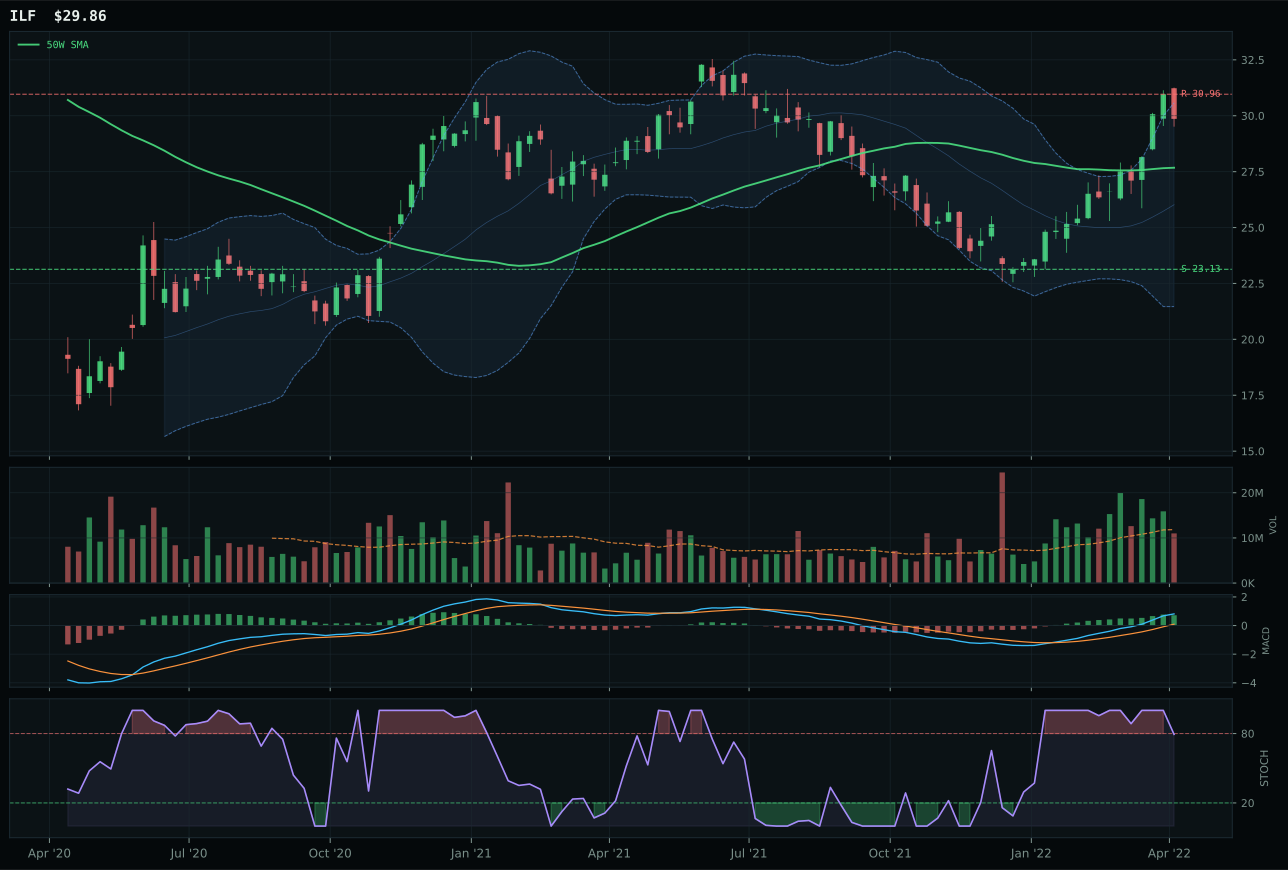
ILF has a neutral structure profile with 30.6% 13-week relative strength versus SPY.
A failed hold above support would weaken the setup.
Actionable but governed by invalidation levels.
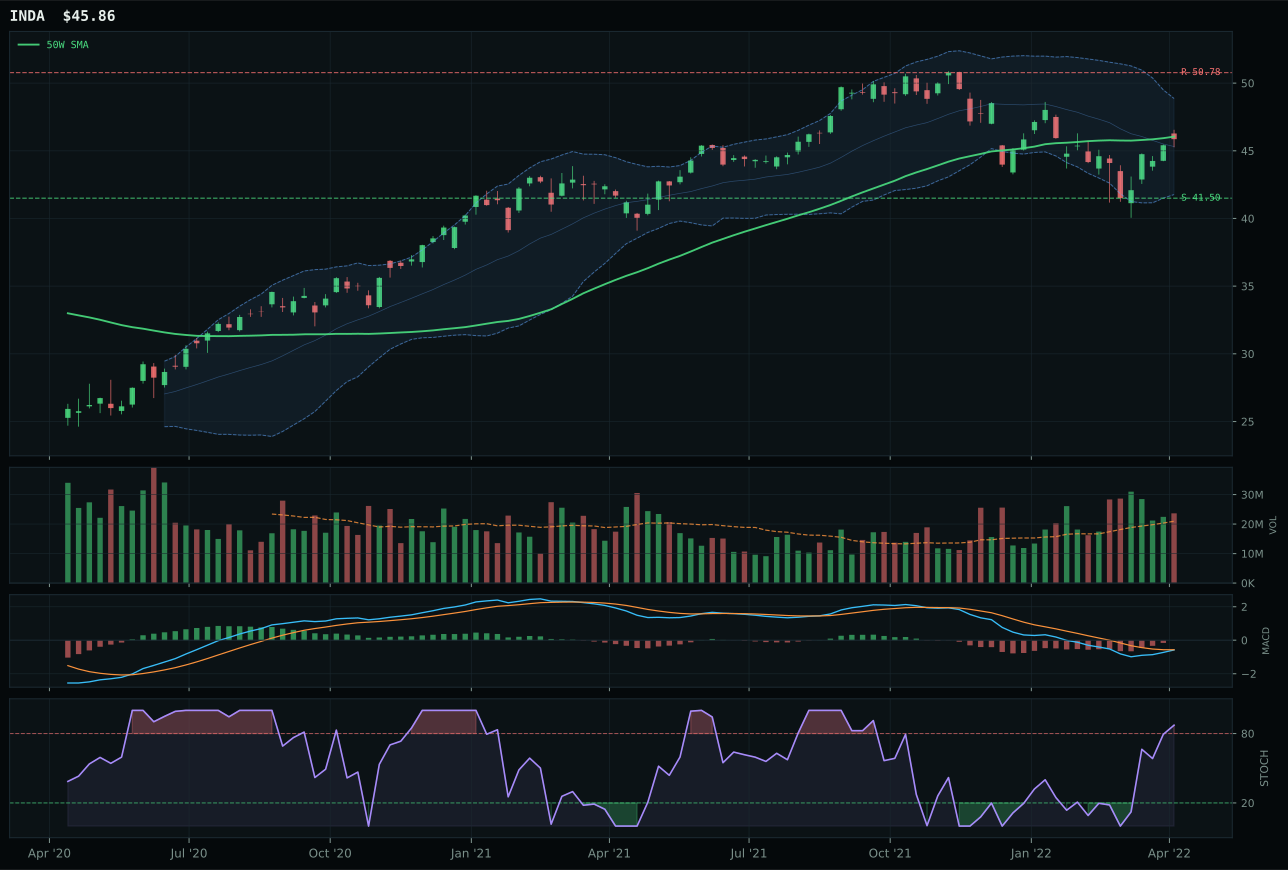
INDA has a compression near 50W profile with 1.3% 13-week relative strength versus SPY.
A failed hold above support would weaken the setup.
Actionable but governed by invalidation levels.
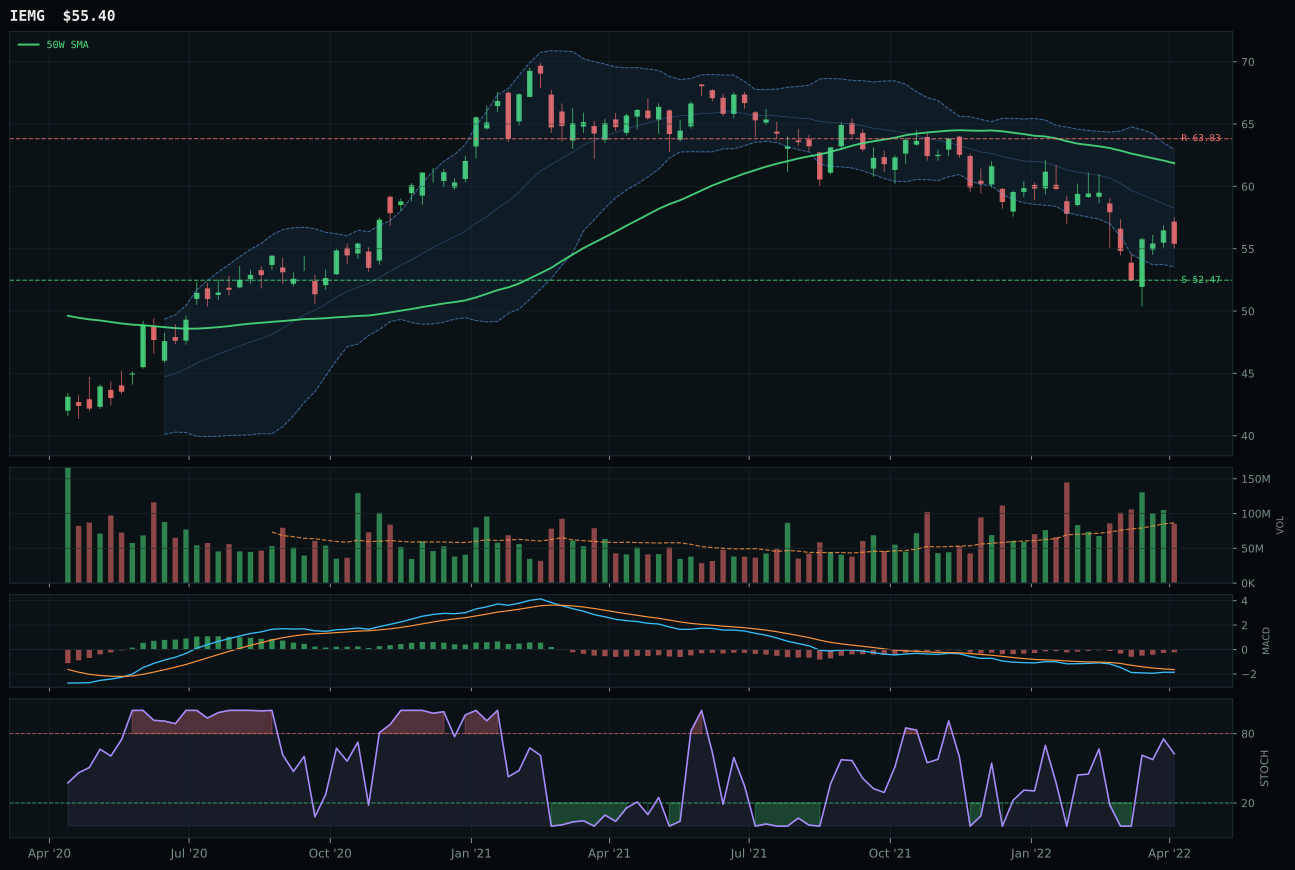
IEMG has a neutral structure profile with -3.4% 13-week relative strength versus SPY.
A failed hold above support would weaken the setup.
Actionable but governed by invalidation levels.
ILF wins decisively because it combines bullish and improving MACD with category-relative strength of 29.3% versus INDA's flat 0.0%, revealing stark institutional preference for commodity-sensitive Latin America over India's quality-growth exposure. Price sits 7.9% above the 50W with stochastic RSI falling/neutral at 0.79—early-stage uptrend without overbought extremes—while persistence at 100.0% and volume-price confirmation at 92.9% indicate that the 26.6% 13-week move is being accumulated rather than exhausted. INDA loses because its MACD is bearish but improving (versus ILF's bullish and improving) and compression near the 50W structure at 100.0% timing score masks a deeper problem: its -2.7% 13-week return directly contradicts INDA's strong composite score of 83, revealing that the technical setup is timing-optimal but directionally negative. ILF's 100.0/100 trend score paired with 30.6% SPY-relative strength creates a momentum narrative that dominates INDA's superior risk-reward ratio (70 vs 47)—in this regime, direction wins over ratio.
Emerging Markets receives 0% allocation this week despite ILF's impressive 100.0/100 trend score and 92.9% volume-price confirmation, because the category's 25.0/100 macro fit is the worst across all 10 categories and the final 46.8 score ranks 10th. Dollar pressure is active (-14) and credit stress is active (-10) and broad market bear is active (-9)—a triple headwind that overwhelms ILF's technical strength. The portfolio recognizes that EM performance is structurally dependent on dollar weakness and risk appetite recovery; when both are broken, even the best technical setups in emerging-market equity baskets are swimming against macro gravity. Reinstatement requires one of two scenarios. First, dollar pressure descriptor must flip from active to dormant (indicating USD weakness has peaked), alongside credit stress showing signs of abatement; currently, these headwinds combine to subtract 24 basis points from category macro fit. Second, ILF would need to break above 30.96 resistance and establish new 52-week highs on volume exceeding 1.2x 20W average sustained for 3+ weeks, proving that the uptrend survives despite macro headwinds—a high bar in a dollar-strong, risk-off regime. Hold on watchlist; do not chase.
AI — SMH
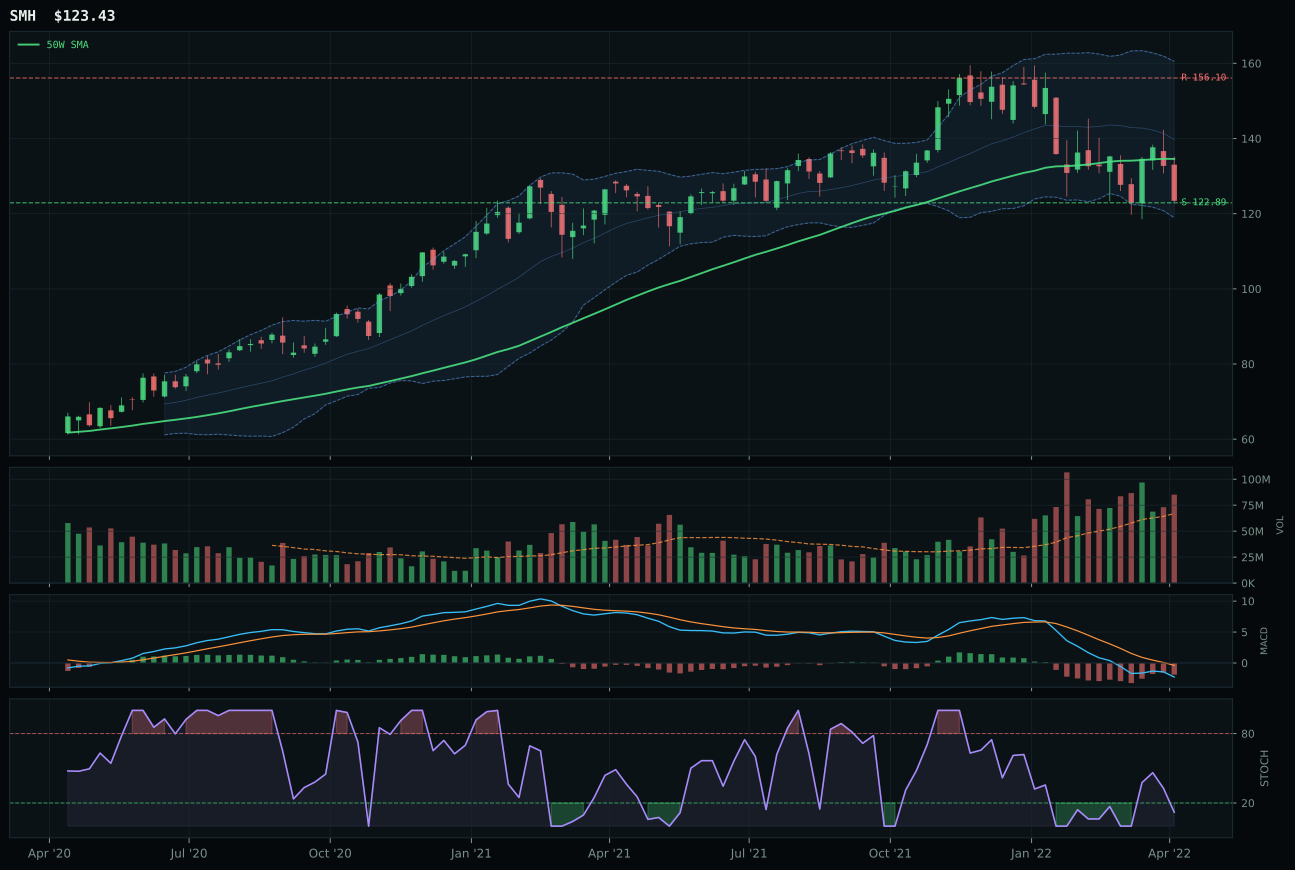
SMH has a pullback into support profile with -12.9% 13-week relative strength versus SPY.
A failed hold above support would weaken the setup.
Actionable but governed by invalidation levels.
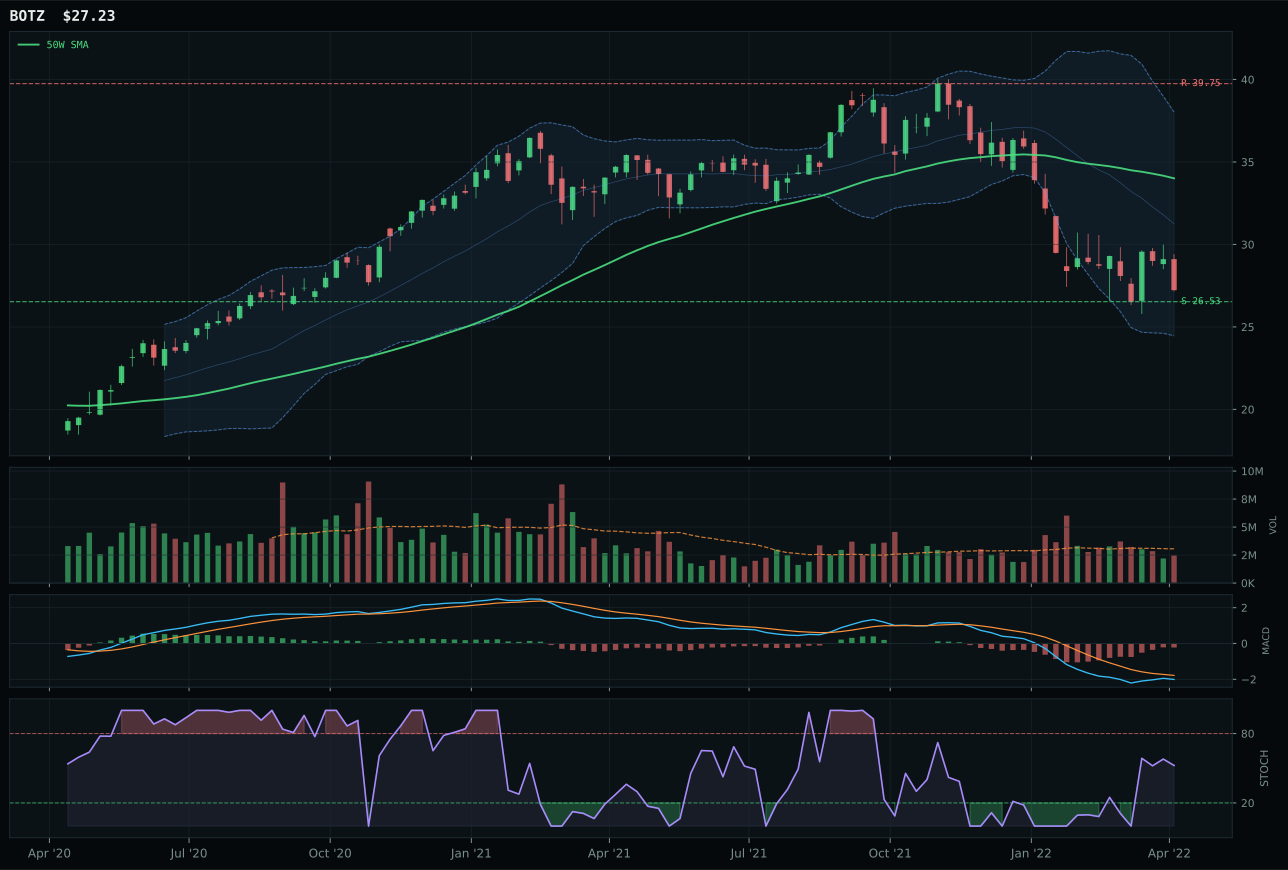
BOTZ has a pullback into support profile with -15.7% 13-week relative strength versus SPY.
A failed hold above support would weaken the setup.
Actionable but governed by invalidation levels.
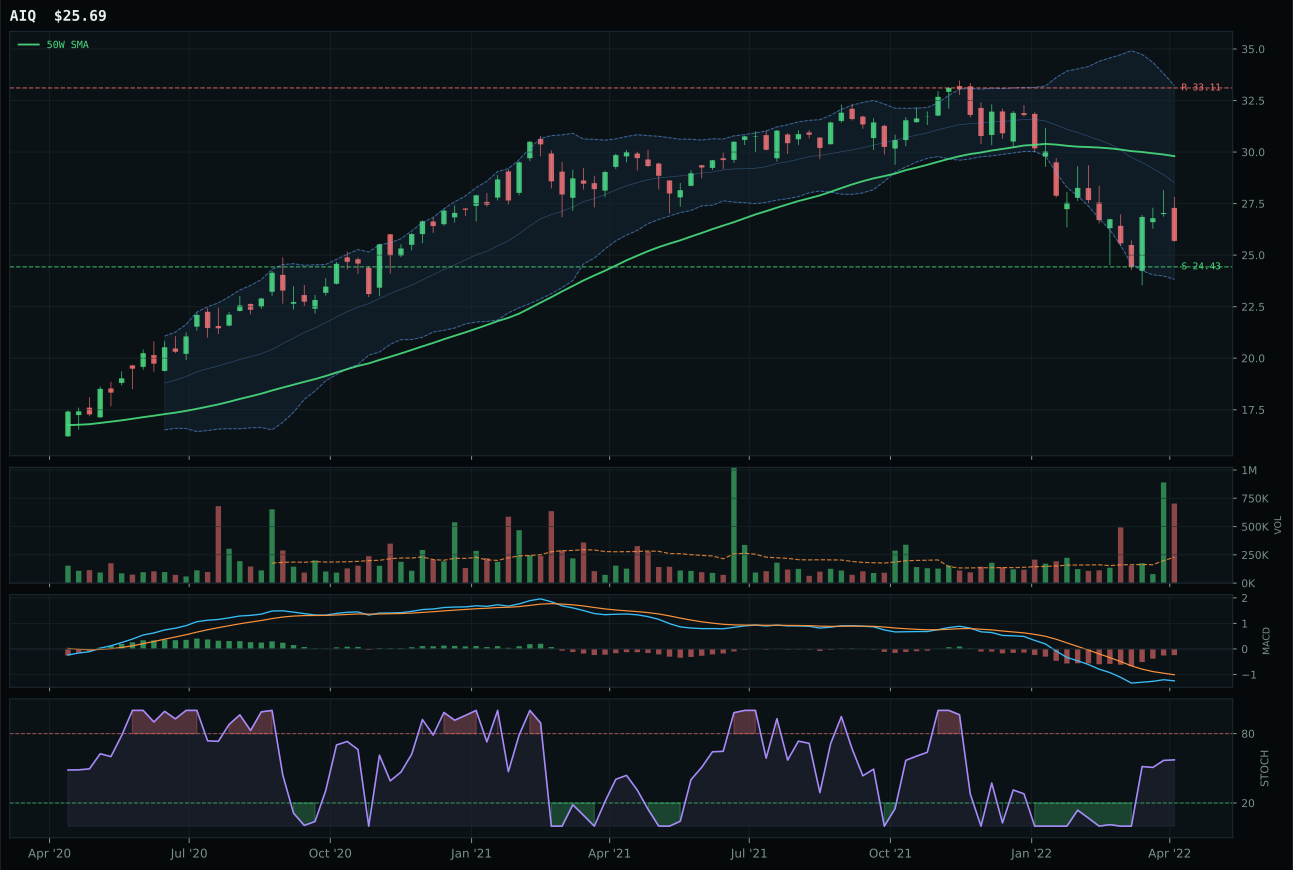
AIQ has a neutral structure profile with -10.9% 13-week relative strength versus SPY.
A failed hold above support would weaken the setup.
Tracked, but not top-2 eligible because: .
SMH wins because it sits at the inflection point between capitulation and reversal, with SMH trading -8.3% below the 50W at extreme oversold conditions (stochastic RSI 0.12) while still maintaining price above the 200W. This pullback-into-support setup carries 83.0/100 risk-reward due to a tight 0.4% downside to support against -20.9% upside to resistance, giving new buyers a clean entry with defined invalidation. Volume participation at 1.27x the 20-week average shows accumulation during the reset; MACD bearish but improving confirms the washout is being absorbed rather than accelerating. BOTZ loses despite a similar setup because its timing score of 65.0 versus SMH's 92.0 reflects deeper oversold conditions in SMH, paired with BOTZ's falling/neutral stochastic RSI (less extreme) and -15.7% SPY-relative weakness that lags SMH's -12.9%. The deciding factor: SMH's oversold stochastic (0.12) offers better reward-to-risk mechanics for mean reversion into the 50W.
AI receives 0% allocation this week, ranked 9th among the 10 categories with a final score of 20.4 that reflects systematic damage across the entire semiconductor and robotics complex. The macro regime—transition/mixed with credit stress (-8), broad market bear (-8), and risk appetite broken—creates a headwind that no single oversold setup can overcome. SMH's 46.8 reasoned ETF score masks a fundamental problem: the category's 40.0/100 macro fit means the landscape actively penalizes technology hardware exposure, and even the best timing cannot rebuild institutional conviction. The path to reinstatement requires two conditions. First, credit stress must ease and risk appetite must show signs of recovery through descriptor changes; currently, broad market bear and credit stress each subtract eight points from the category's macro profile. Second, the semiconductor and AI-compute complex would need to prove that current support levels hold with volume confirmation lifting above 1.3x average—a signal that accumulation is turning into distribution. Until then, AI remains uninvestable despite tactical oversold conditions.