
2022-04-01
Informational purposes only. The content in this report, including allocations, analysis, and commentary, is provided solely for informational and educational purposes. It does not constitute financial advice, investment advice, trading advice, or any other type of advice. Past performance does not guarantee future results. Always conduct your own research and consult a qualified financial professional before making investment decisions.
GLD defensive overlay excluded: price is below its 8W SMA. Cause selector will use cash alternative.
Macro risk engine requires the 50% Defensive overlay for this run; payload selected by cause: Inflation Scarcity.
Weekly Allocation
| Ticker | Category | Weight | Role |
|---|---|---|---|
| XLE | 50% | Overlay | |
| XOP | Traditional Energy | 10% | Top-2 (10%) |
| GLD | Precious Metals | 10% | Top-2 (10%) |
| IGF | Utilities & Infrastructure | 5% | Tier-2 (5%) |
| REMX | Industrial Metals | 5% | Tier-2 (5%) |
| XAR | Defense & Aerospace | 5% | Tier-2 (5%) |
| MOO | Agriculture & Livestock | 5% | Tier-2 (5%) |
| URNM | Nuclear Energy | 5% | Tier-2 (5%) |
| ILF | Emerging Markets | 5% | Tier-2 (5%) |
Trade Instructions — Monday Open
Sell the tranche from 2022-03-04 (completing its 4-week hold). Buy the new tranche. Instructions show net portfolio changes — same-asset positions cancel, weight changes show the delta.
| Action | Ticker | Instruction |
|---|---|---|
| SELL | XLE | Sell 5% of XLE position (reduce 55.00% → 52.50%) |
| SELL | WEAT | Sell 20% of WEAT position (reduce 6.25% → 5.00%) |
| SELL | COPX | Sell 25% of COPX position (reduce 5.00% → 3.75%) |
| SELL | XLU | Sell 25% of XLU position (reduce 5.00% → 3.75%) |
| SELL | CIBR | Sell 33% of CIBR position (reduce 3.75% → 2.50%) |
| BUY | XOP | Buy XOP — 33.33% of freed cash (adds 2.50% to portfolio) |
| BUY | ILF | Buy ILF — 16.67% of freed cash (adds 1.25% to portfolio) |
| BUY | IGF | Buy IGF — 16.67% of freed cash (adds 1.25% to portfolio) |
| BUY | REMX | Buy REMX — 16.67% of freed cash (adds 1.25% to portfolio) |
| BUY | MOO | Buy MOO — 16.67% of freed cash (adds 1.25% to portfolio) |
Current Portfolio After Trade
Combined holdings across all 4 active tranches. Each tranche is 25% of the portfolio.
| Ticker | % of Portfolio | Weight Bar |
|---|---|---|
| XLE | 52.50% | |
| GLD | 8.75% | |
| XOP | 7.50% | |
| WEAT | 5.00% | |
| XAR | 5.00% | |
| URNM | 5.00% | |
| COPX | 3.75% | |
| XLU | 3.75% | |
| CIBR | 2.50% | |
| ILF | 2.50% | |
| IGF | 1.25% | |
| REMX | 1.25% | |
| MOO | 1.25% |
Macro Regime — Transition / Mixed
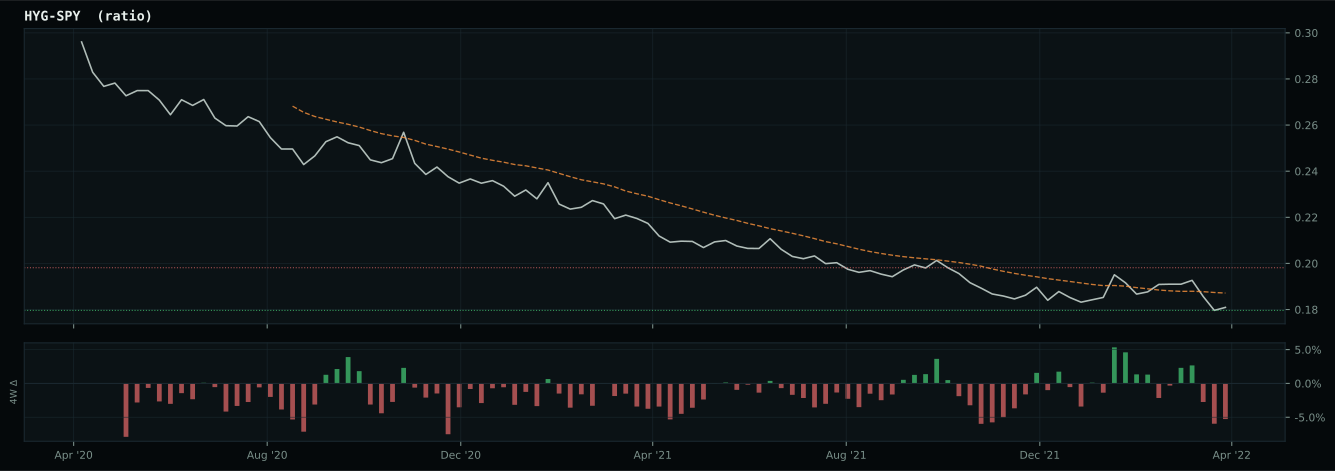
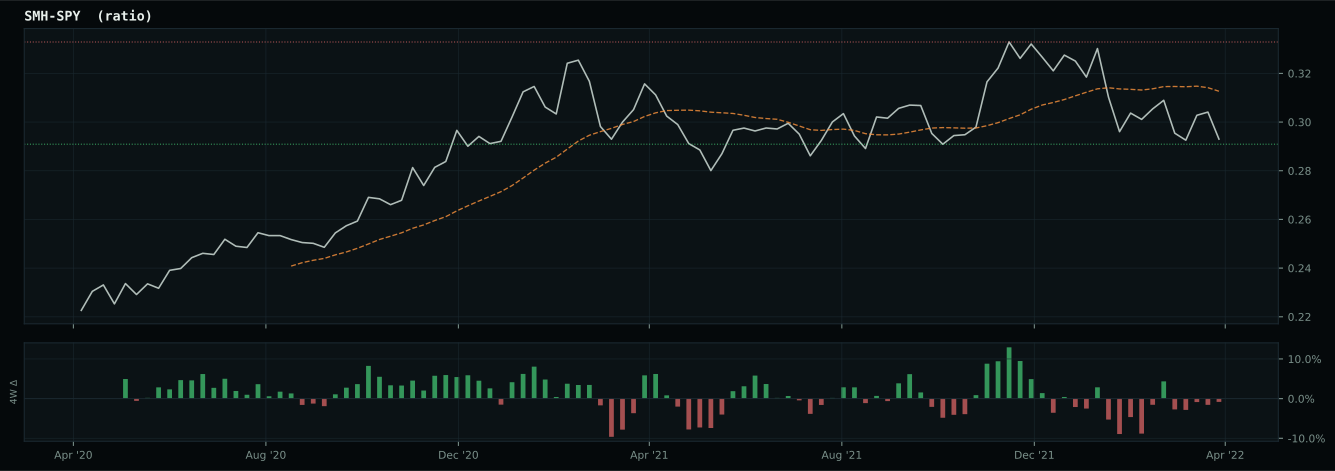
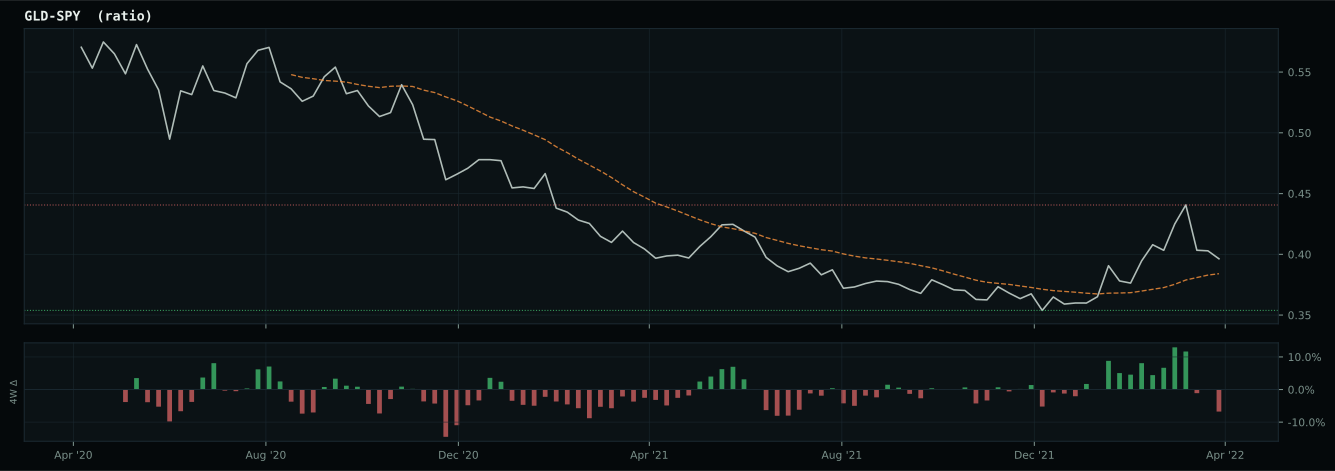
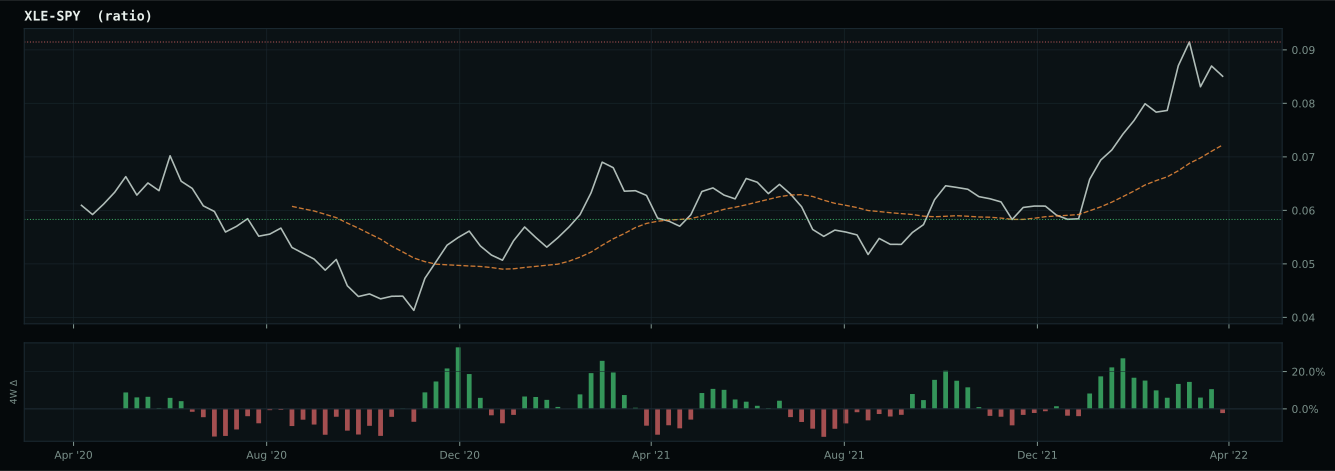
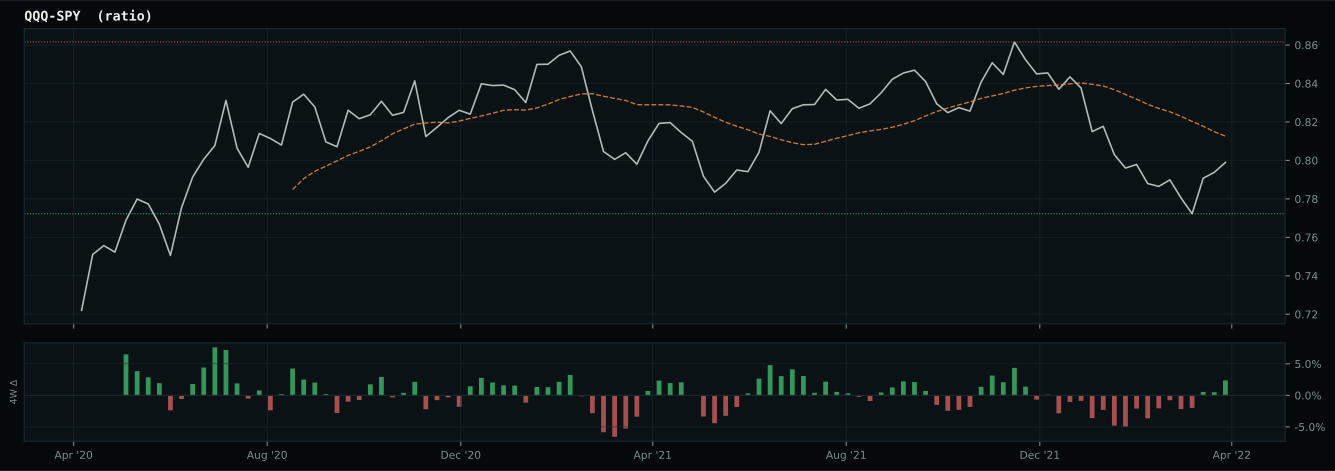
growth data is not confirming the weak market-implied risk appetite signal
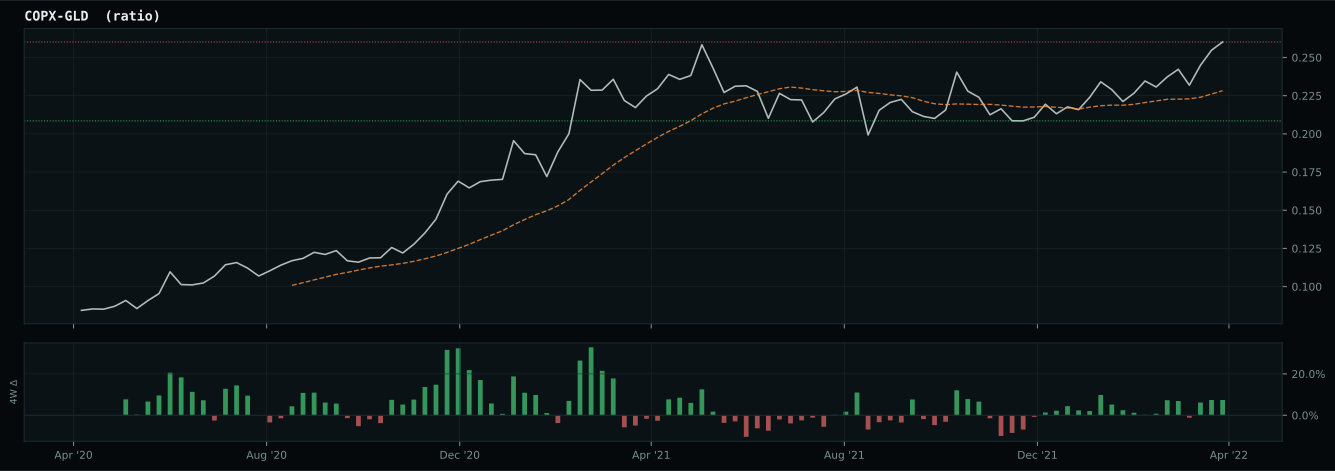
Defensive overlay cause is inflation/scarcity: energy, commodity breadth, or oil-versus-gold confirmation is stronger than the broad equity tape, so the sleeve owns the inflation pressure. XLE has been confirmed above its 8W SMA and is eligible.
Macro Evidence Charts
Market-implied signals behind the macro regime scores. Each ratio compares two assets; the direction and slope of the ratio is what the macro engine reads.
Crypto Regime — NoCrypto
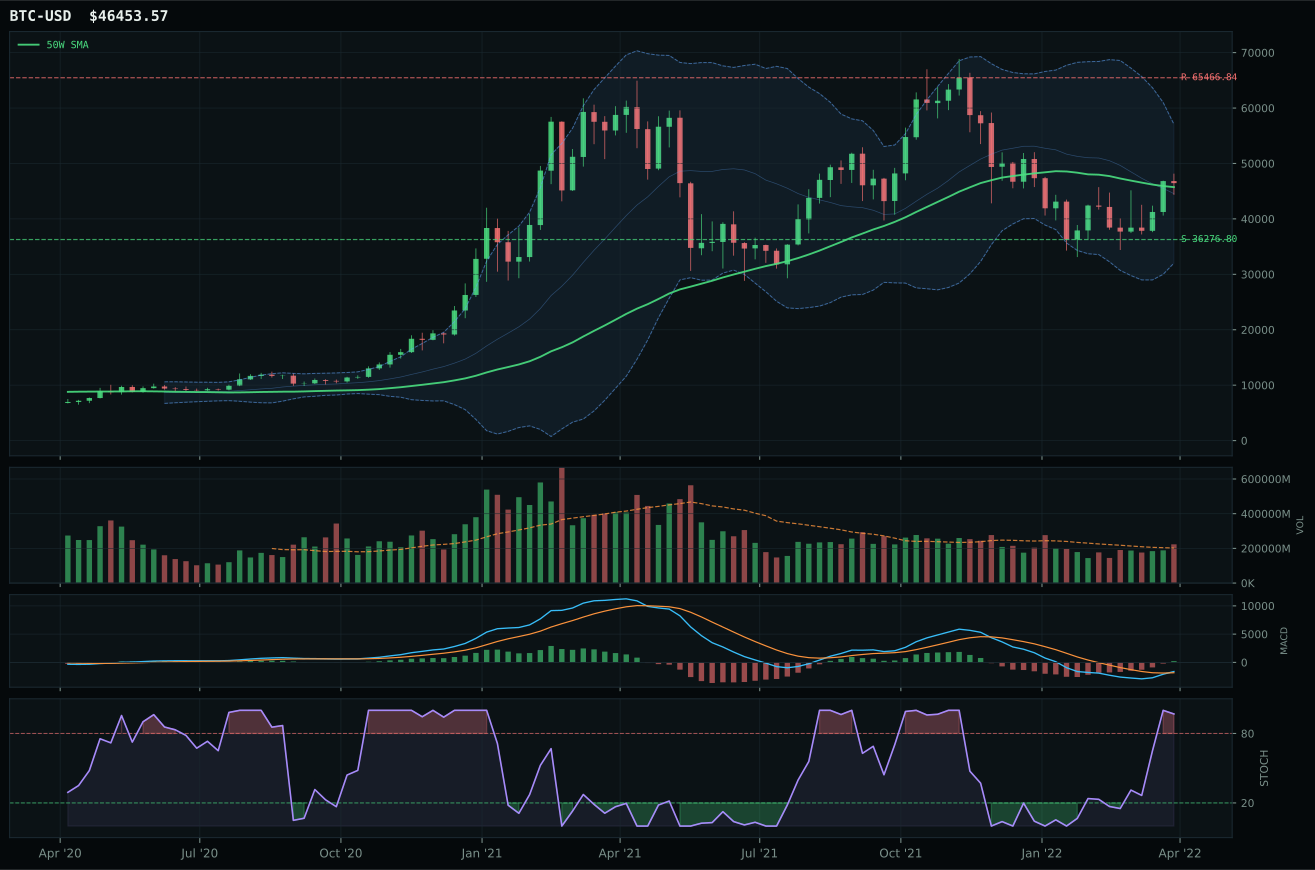
ValueBTC not armed: BTC has not made the first post-breakdown touch of the 200W buy zone after losing the 50W
TrendBTC not confirmed
one or more available conditions failed
Category Rankings
| Rank | Category | Winner | Score | Alloc | 4W Ret | Peers (4W) |
|---|---|---|---|---|---|---|
| 1 | Traditional Energy | XOP | 78.8 | 20% | -7.72% | FCG -6.0% · XLE -3.7% |
| 2 | Precious Metals | GLD | 74.0 | 20% | -3.68% | GDX -14.2% · SLV -9.0% |
| 3 | Utilities & Infrastructure | IGF | 73.3 | 10% | -3.90% | XLU -4.8% · PAVE -7.0% |
| 4 | Industrial Metals | REMX | 70.0 | 10% | -24.00% | PICK -14.9% · COPX -15.9% |
| 5 | Defense & Aerospace | XAR | 70.0 | 10% | -11.31% | ITA -8.2% · ROKT -8.7% |
| 6 | Agriculture & Livestock | MOO | 63.6 | 10% | -6.84% | VEGI -5.8% · WEAT +5.3% |
| 7 | Nuclear Energy | URNM | 58.8 | 10% | -12.81% | URA -13.1% · NLR -4.2% |
| 8 | Emerging Markets | ILF | 50.9 | 10% | -17.07% | INDA -5.4% · IEMG -8.9% |
| 9 | Technology | CIBR | 49.7 | 0% | -11.68% | XLK -11.1% · IGV -13.5% |
| 10 | AI | SMH | 27.1 | 0% | -13.60% | BOTZ -18.8% · AIQ -14.9% |
Traditional Energy — XOP
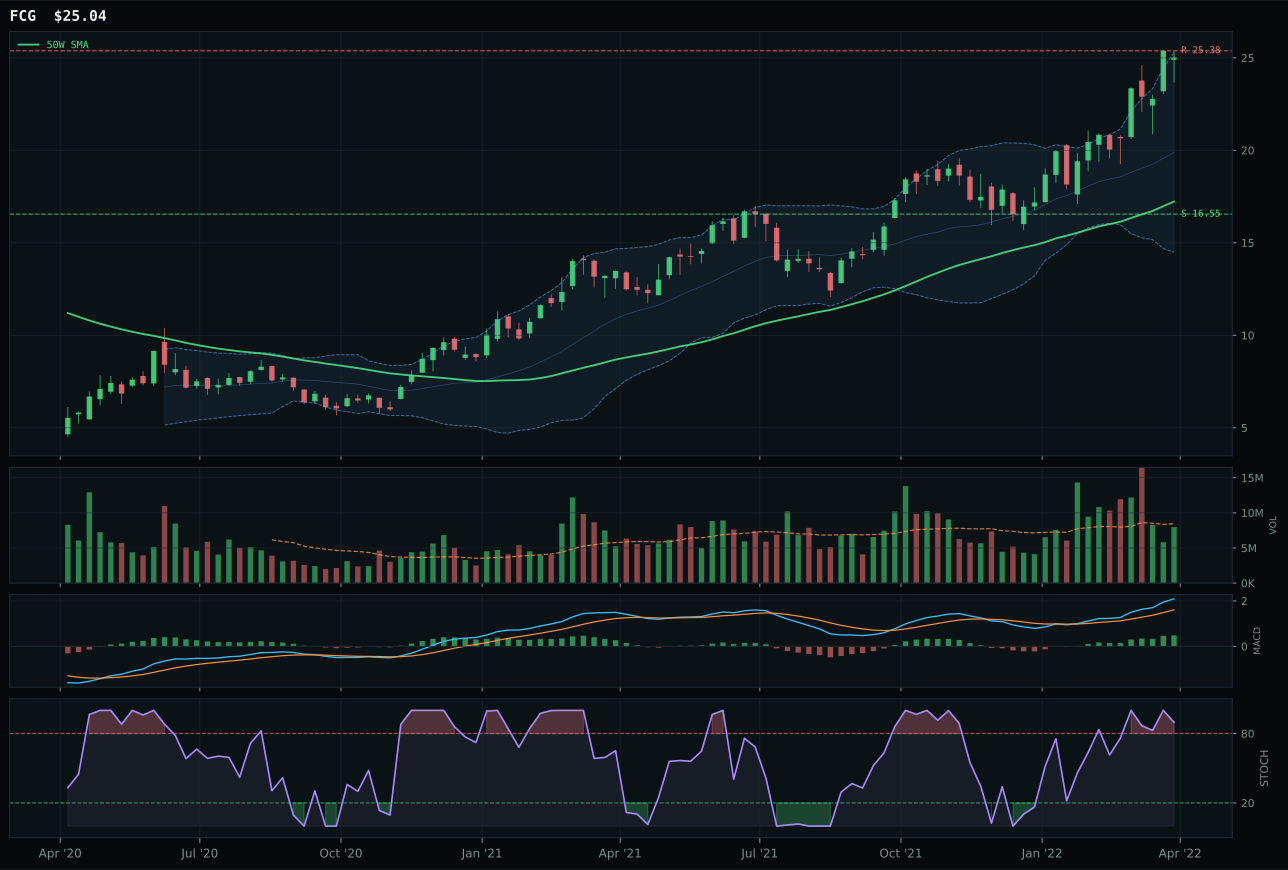
FCG has a vertical extension profile with 50.4% 13-week relative strength versus SPY.
A failed hold above support would weaken the setup.
Actionable but governed by invalidation levels.
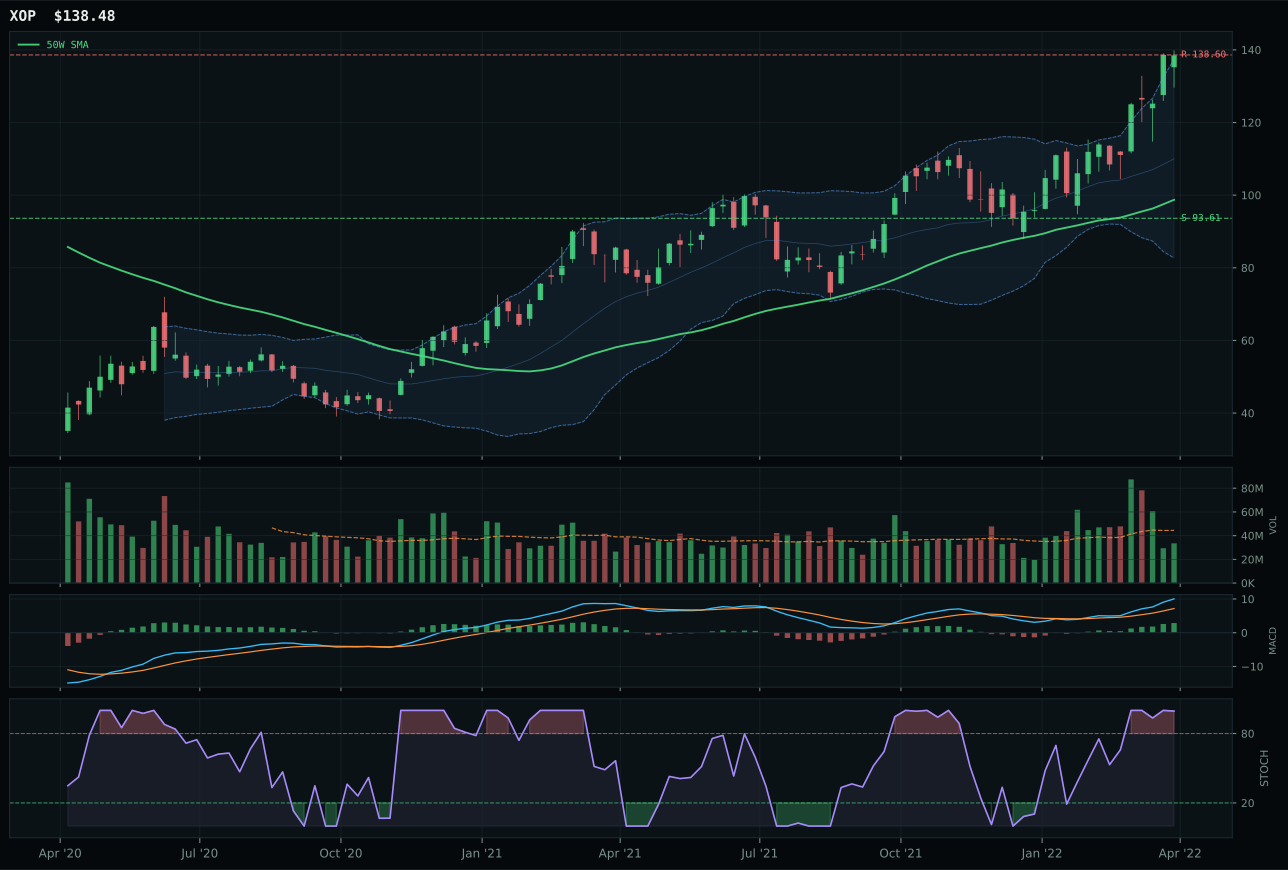
XOP has a vertical extension profile with 49.1% 13-week relative strength versus SPY.
A failed hold above support would weaken the setup.
Actionable but governed by invalidation levels.
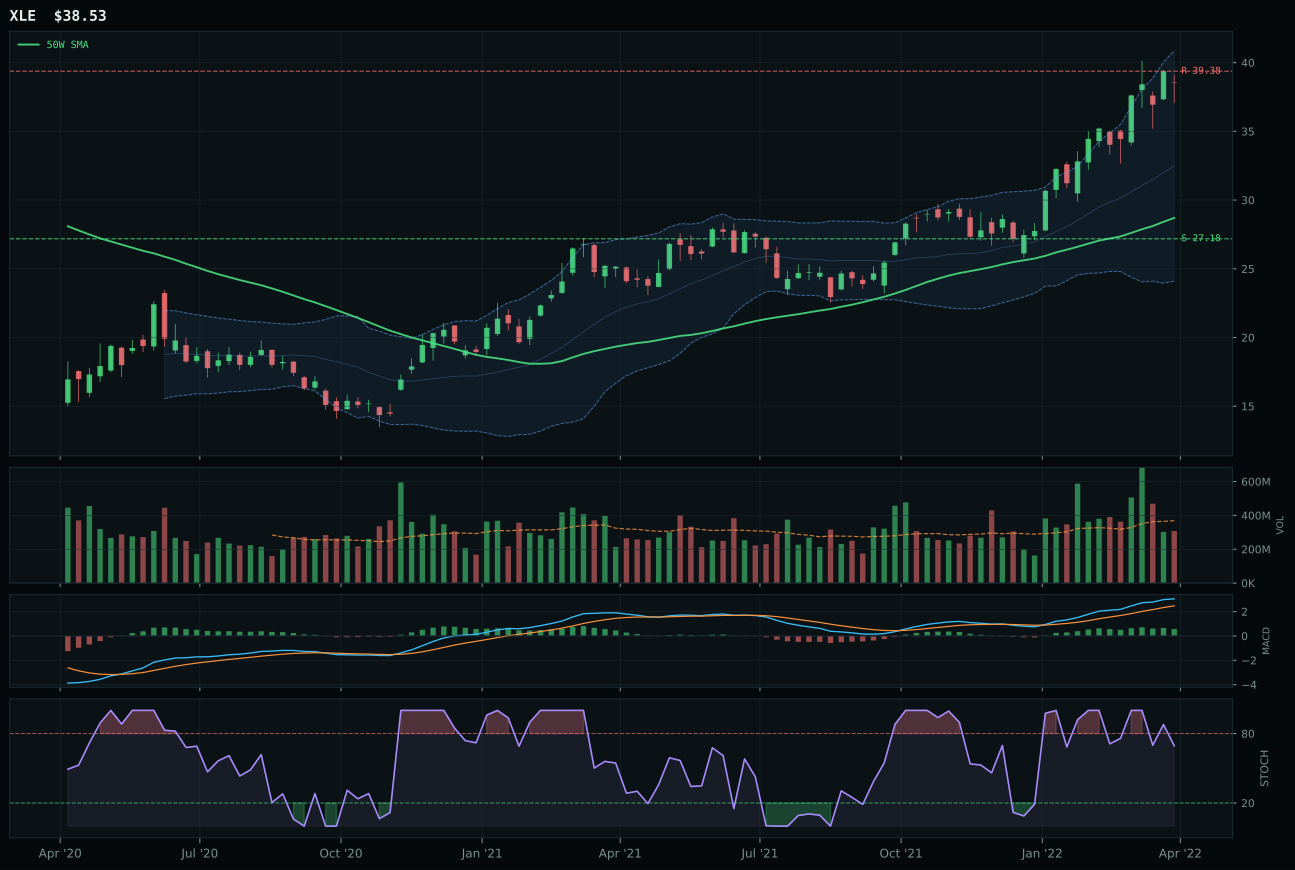
XLE has a vertical extension profile with 43.5% 13-week relative strength versus SPY.
A failed hold above support would weaken the setup.
Actionable but governed by invalidation levels.
XOP wins despite appearing weaker on several technical metrics because it is the only ETF in the basket that combines perfect momentum (100.0 score from 44.4% 13W return and 49.1% RS versus SPY) with acceptable structure (72.4) and the cleanest representation of the category narrative. Price is 40.3% above the 50W, which is brutal for timing (27.0) and risk/reward (37.0), but the runner-up FCG is even more extended at 45.3% above the 50W and suffers a weaker structure score (69.8 vs 72.4), making XOP the lesser extension risk. MACD is bullish and improving on both, stochastic is overbought rolling over on XOP versus overbought momentum on FCG, and volume is neutral on both, but persistence is 95.2 on XOP, which is nearly perfect—meaning this 44.4% 13W run has been bought and confirmed, not forced. The 4.3-point gap versus FCG reflects XOP's marginally cleaner structure and the fact that exploration beta has less downside risk when energy cycles turn than crude-focused vehicles do.
Traditional Energy earns 10% allocation as a top-2 overweight category, ranking second-highest at 78.8, just behind Precious Metals. The macro case is dominant: energy scarcity is scoring +16, inflation pressure is scoring +10, supply shortage is scoring +9, and real asset sponsorship is scoring +7. This creates a 85.0 macro fit at the category level, one of the strongest in the portfolio. Technical evidence from XOP is lower at 63.7 because of the extreme extension and weak timing score, but the momentum confirmation is perfect at 100.0 and persistence is 95.2, meaning the setup has been accumulated and confirmed despite the bad entry risk. The allocation of 10% recognizes that XOP's 49.1% RS versus SPY and 44.4% 13W return represent real outperformance in a macro environment where energy supply is tight and inflation is persistent. The extension is a real risk—there is virtually no upside left to resistance—but the top-2 allocation reflects the view that the macroeconomic backdrop is strong enough to justify sitting through consolidation rather than waiting for a deeper pullback. This is the most offensively positioned trade in the portfolio.
Precious Metals — GLD
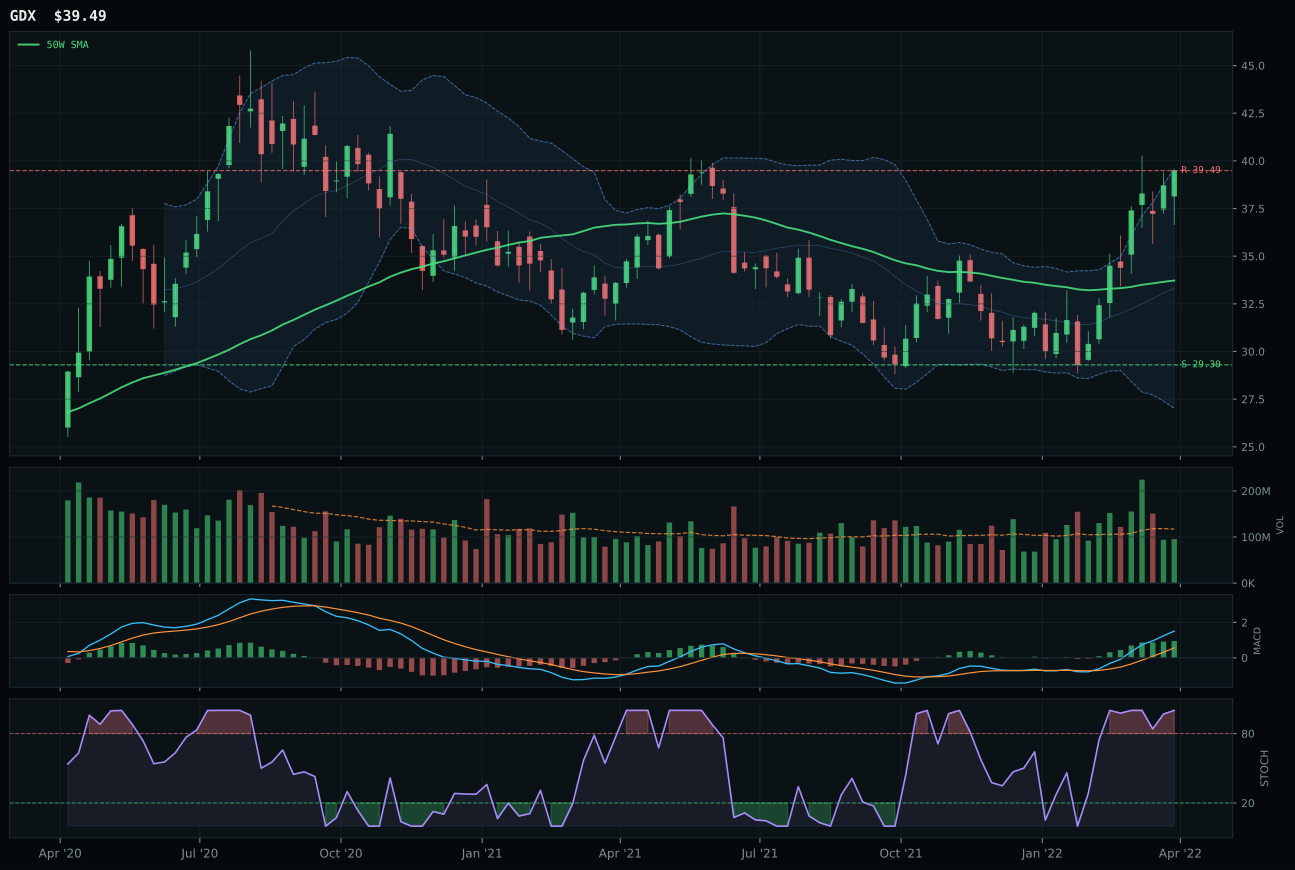
GDX has a vertical extension profile with 27.9% 13-week relative strength versus SPY.
A failed hold above support would weaken the setup.
Actionable but governed by invalidation levels.
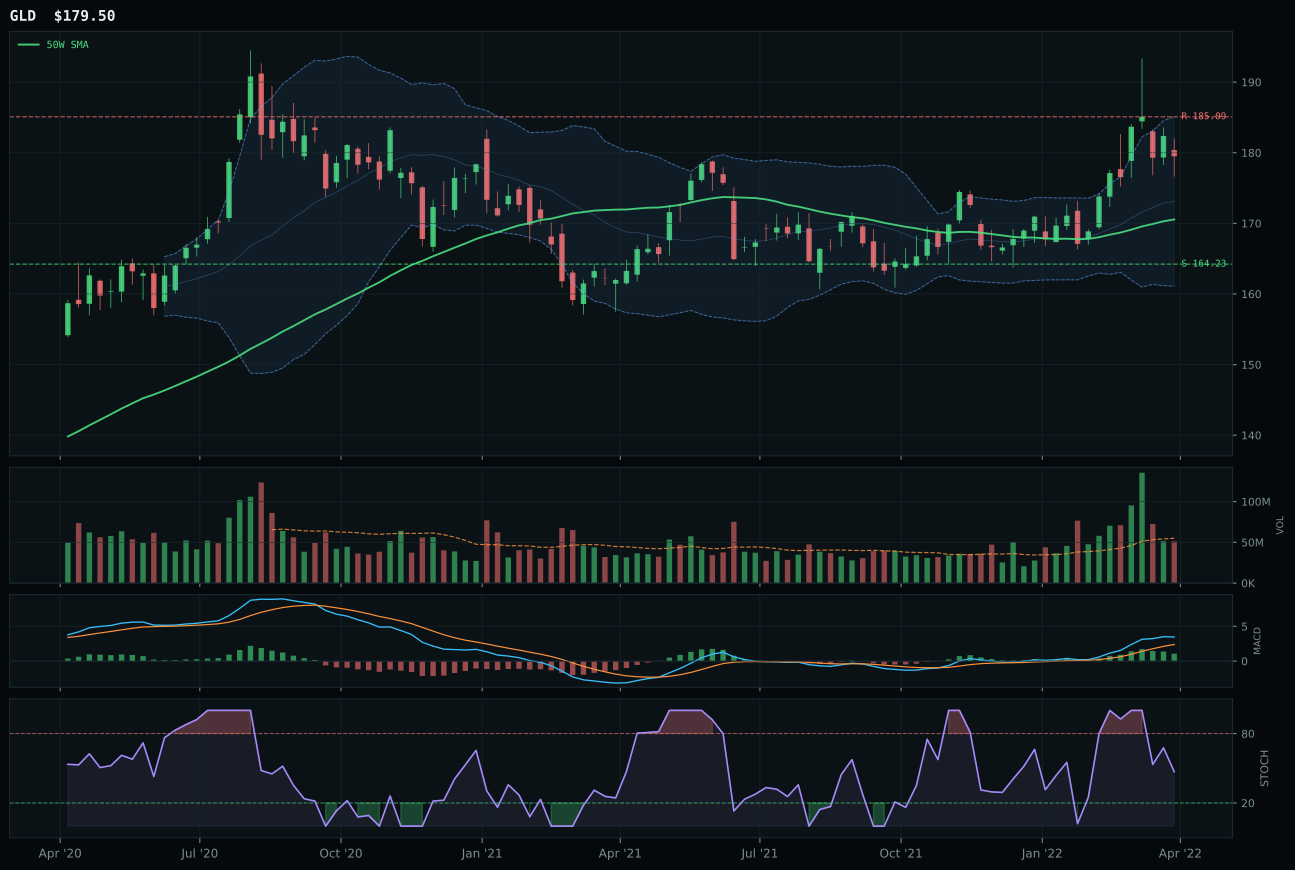
GLD has a neutral structure profile with 9.6% 13-week relative strength versus SPY.
A failed hold above support would weaken the setup.
Actionable but governed by invalidation levels.
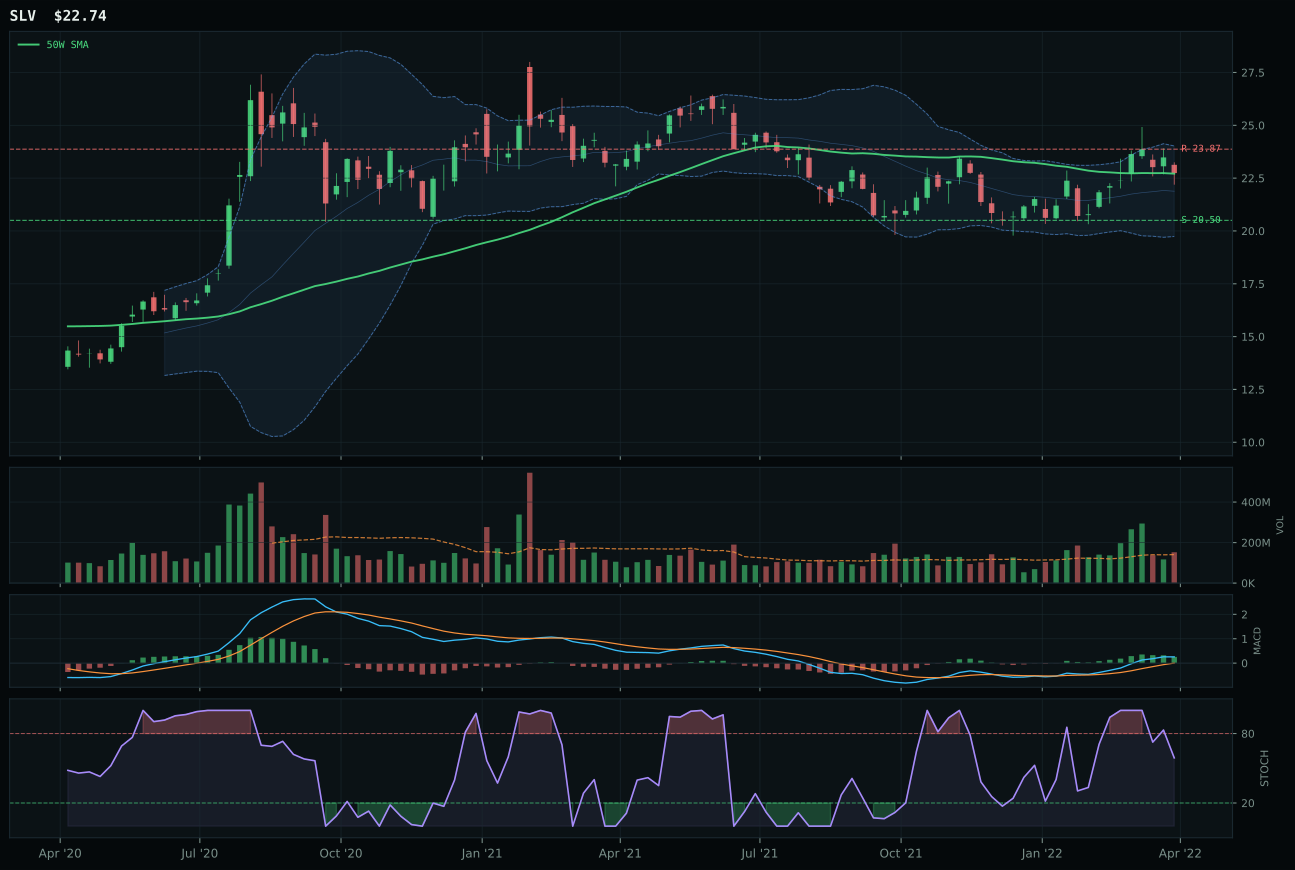
SLV has a compression near 50W profile with 10.4% 13-week relative strength versus SPY.
A failed hold above support would weaken the setup.
Actionable but governed by invalidation levels.
GLD wins because it is the only ETF in the basket offering clean bullish structure without the extension trap that has caught GDX and SLV. Price is 5.2% above the 50W with MACD bullish but flattening (not the improving signature, but not a reversal signal either), and stochastic RSI falling/neutral at 0.47 means this is consolidation, not euphoria. The 13W return of 5.0% with 9.6% RS versus SPY is solid and sustainable, and the 0.93x neutral volume means there is no distribution spike to worry about. GDX loses decisively because it is 17.1% above the 50W, overbought on stochastic, and in vertical extension—a classic extended leader setup where every new buyer is overpaying for the same trade that worked three weeks ago. The runner-up gap of 10.5 points is not close; GDX is a higher-beta expression of the same monetary hedge that GLD offers with better entry risk and timing confirmation.
Precious Metals earns 10% allocation as a top-2 overweight category, ranking among the highest two eligible final scores at 74.0. The macro case is compelling: monetary hedge bid is scoring +14, defensive rotation is scoring +7, and the transition regime itself aligns with gold's traditional bid during regime uncertainty. Technical evidence from GLD is 73.5, which is good but not exceptional, but when paired with a macro fit of 72.0, the total package of 74.0 puts this category in elite company with only Traditional Energy at 78.8 ranking higher. The allocation of 10% reflects the top-2 status and recognizes that in a credit-stressed, dollar-weak, inflation-pressured environment, gold is both a hedge and a tactical long. GLD's neutral structure with falling momentum actually makes it more reliable than GDX's overbought setup; you are buying consolidation, not chasing extension. This is the purest risk-off portfolio bet available this week.
Utilities & Infrastructure — IGF
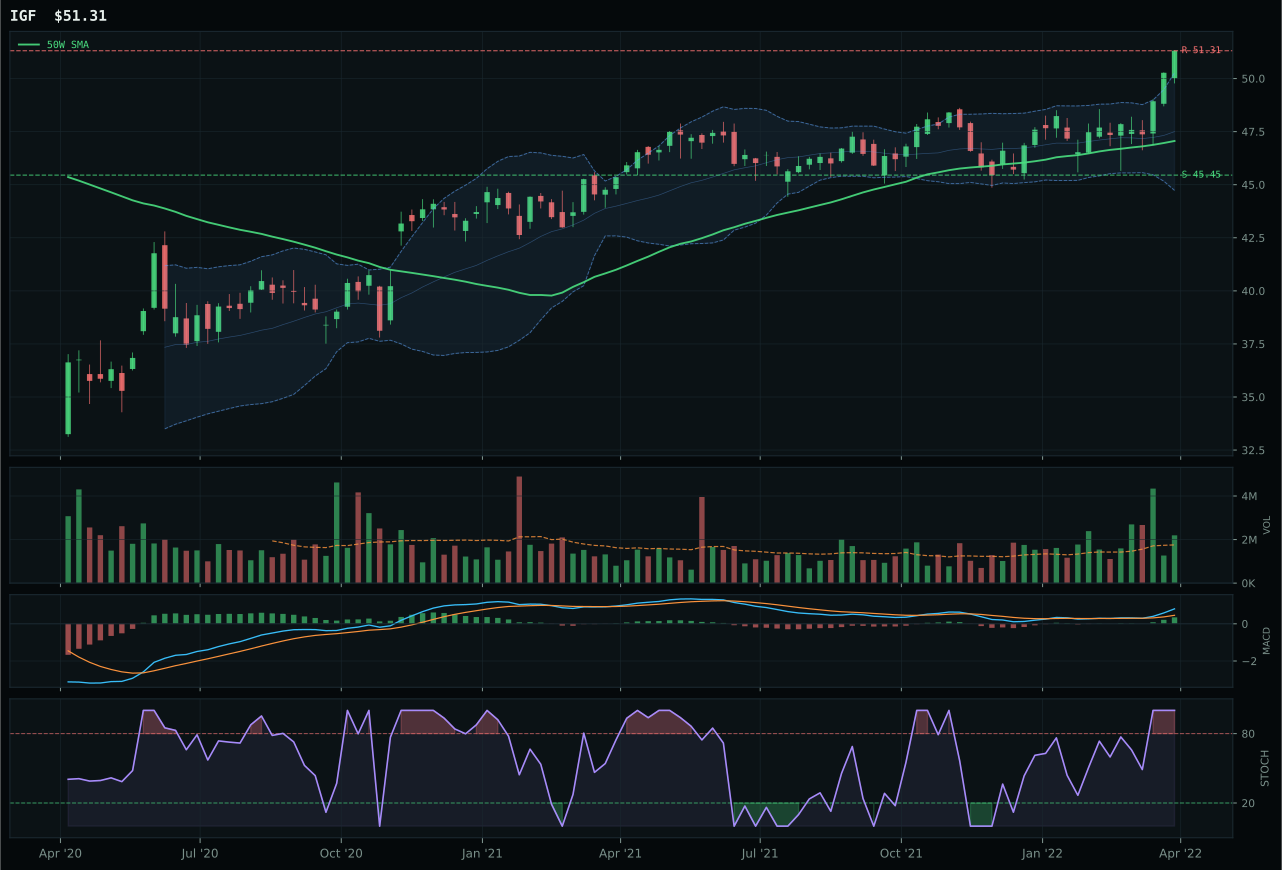
IGF has a neutral structure profile with 12.5% 13-week relative strength versus SPY.
A failed hold above support would weaken the setup.
Actionable but governed by invalidation levels.
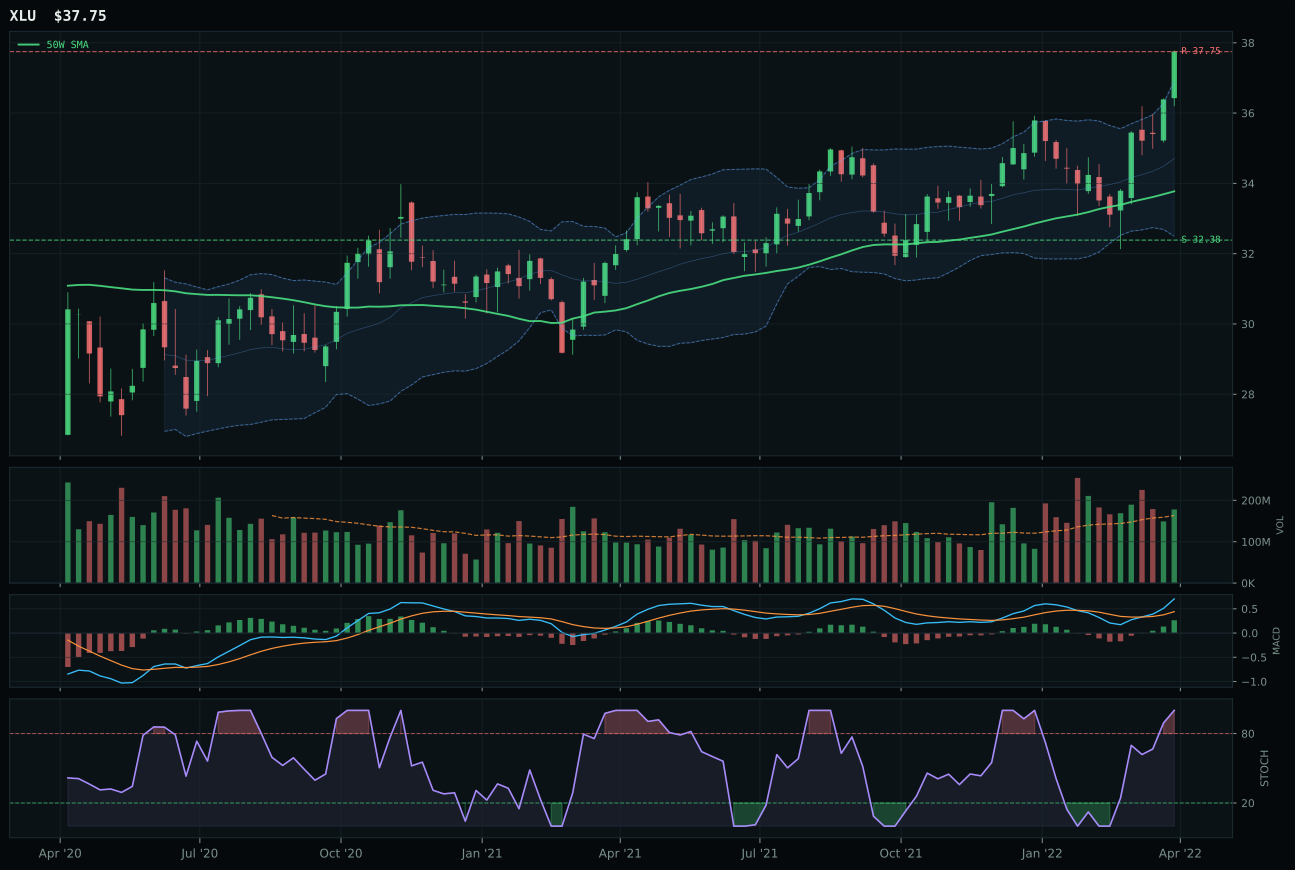
XLU has a neutral structure profile with 10.1% 13-week relative strength versus SPY.
A failed hold above support would weaken the setup.
Actionable but governed by invalidation levels.
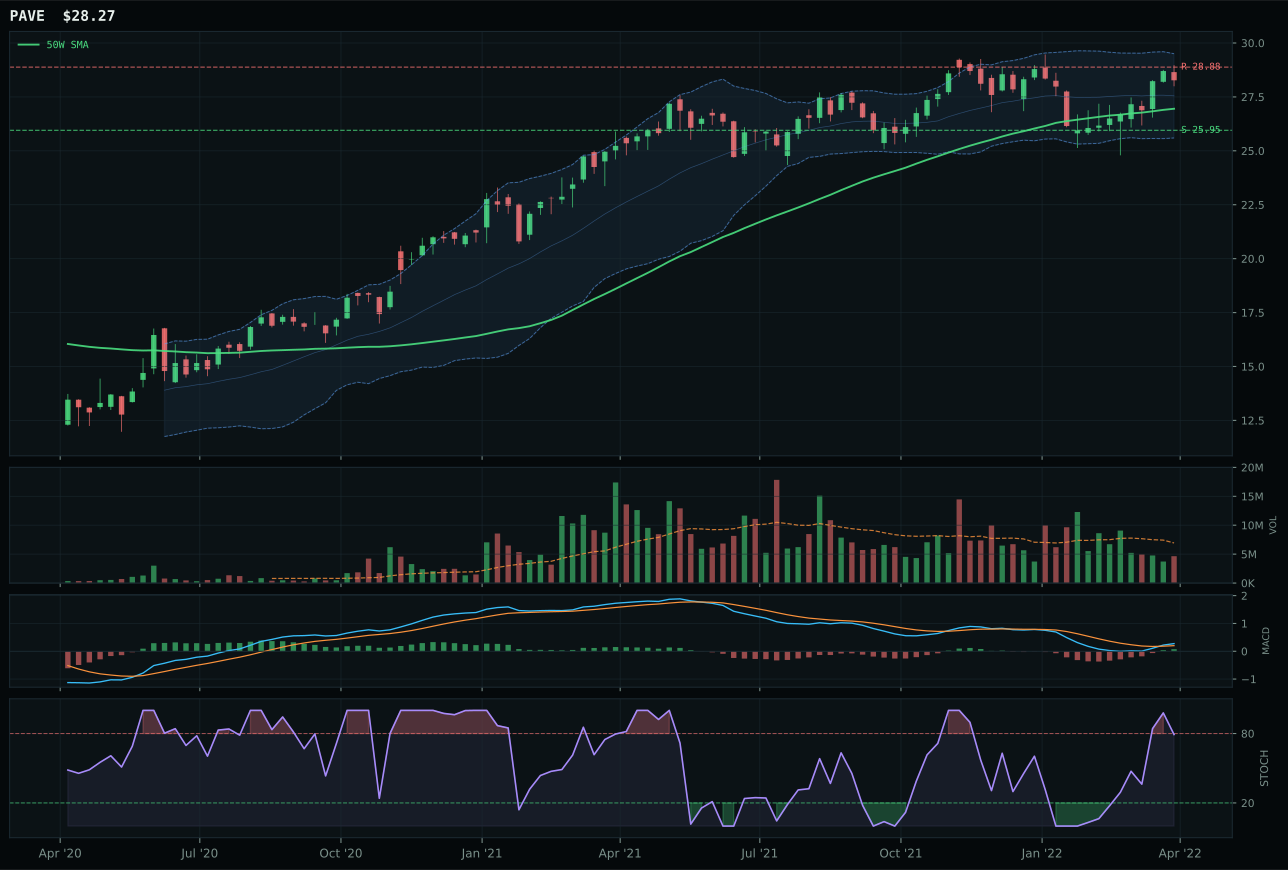
PAVE has a neutral structure profile with 2.8% 13-week relative strength versus SPY.
A failed hold above support would weaken the setup.
Actionable but governed by invalidation levels.
IGF wins because it combines perfect momentum confirmation (100.0 score from 7.8% 13W return with 12.5% RS versus SPY) with the strongest structure in the basket (78.2) and above-average volume participation at 1.25x the 20W average. Price is 9.0% above the 50W, which is extended but not dangerous, and MACD is bullish and improving with stochastic overbought at 1.00, a clean setup. The runner-up XLU has identical trend at 100.0, but loses on timing (59.0 vs 75.0) because it is positioned closer to the 52W high and has neutral volume rather than accumulation, which signals less sponsorship underneath the move. Structure on XLU is 72.4 versus IGF's 78.2, and the volume score is 77 versus IGF's 83, creating a multi-point deficit that is decisive. Risk/reward on IGF is 48.2 versus 45.7, and category-relative strength is 2.3% versus 0.0%, all favoring IGF. The 4.4-point gap makes this a clear category decision despite both ETFs being in the overbought zone.
Utilities & Infrastructure receives 5% allocation as a tier-2 position, ranking 3-8 in the portfolio. The category score of 73.3 is strong and justified by a combination of solid technical evidence from IGF (91.5) and respectable macro fit (47.0). Defensive rotation is scoring +12, which is the dominant factor, and the transition regime itself adds +4 to category fit. However, inflation pressure is scoring -6 and dollar pressure is scoring -4, which creates a partial headwind because utilities are rate-sensitive and real asset inflation is less favorable for fixed-income proxies. The reason this category ranks tier-2 rather than top-2 is that both the momentum and macro sponsorship are stronger in Precious Metals (74.0) and especially in Traditional Energy (78.8). IGF's momentum confirmation is perfect, but its absolute returns are more modest—7.8% 13W versus XOP's 44.4%—and the macro tailwinds are weaker (47.0 versus 85.0). The 5% allocation is appropriate as a defensive satellite that captures the utility bid without overcommitting to a sector whose interest-rate sensitivity creates tension with the inflation narrative that is still active.
Industrial Metals — REMX
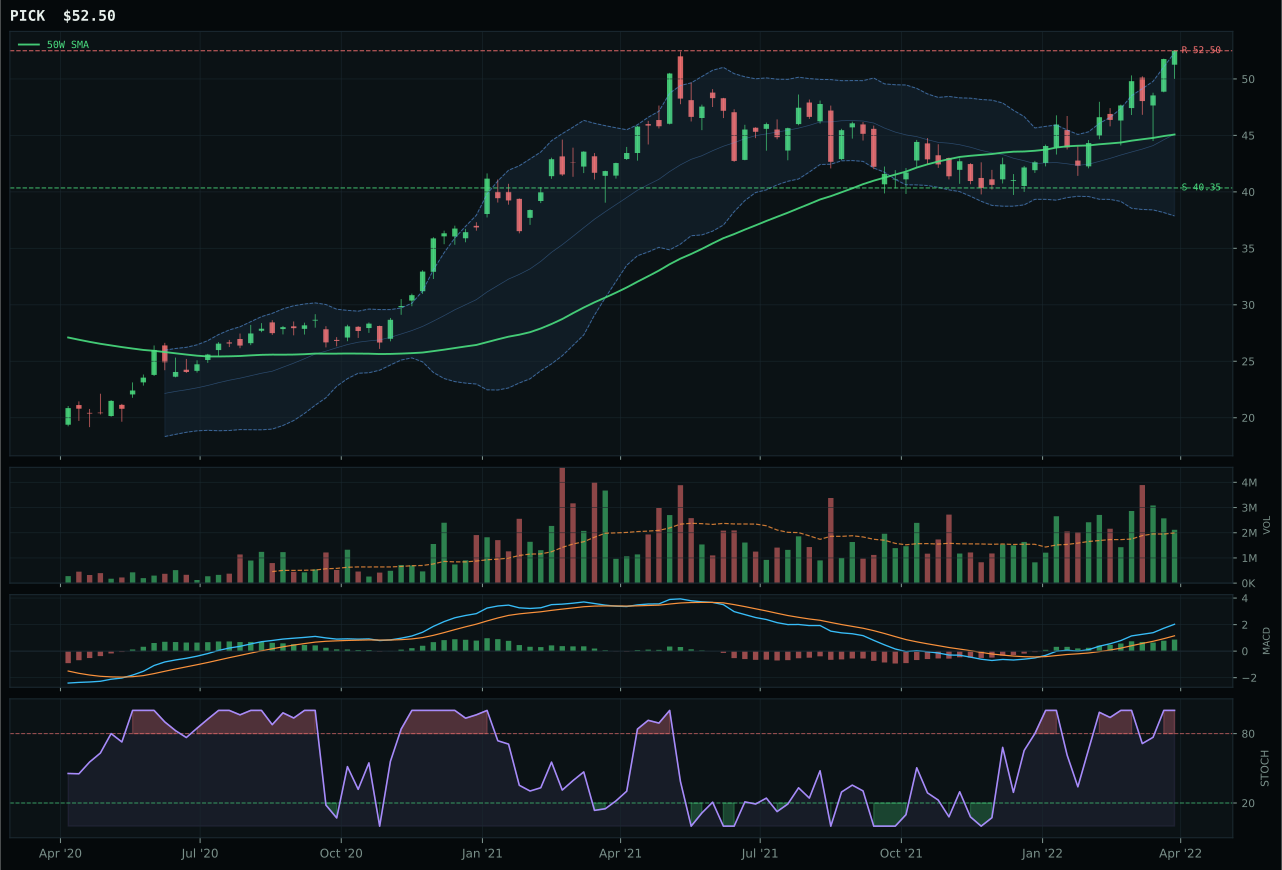
PICK has a vertical extension profile with 27.8% 13-week relative strength versus SPY.
A failed hold above support would weaken the setup.
Actionable but governed by invalidation levels.
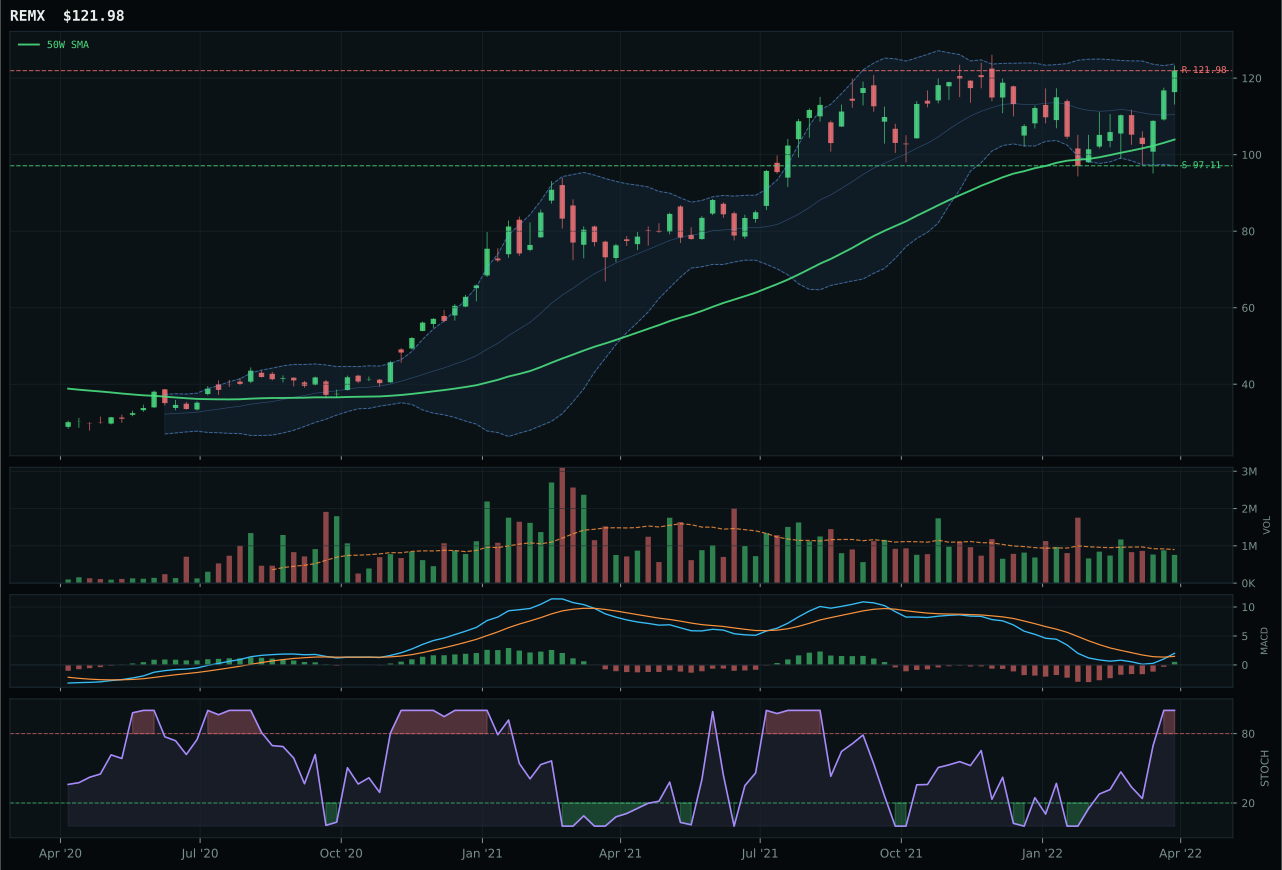
REMX has a vertical extension profile with 13.4% 13-week relative strength versus SPY.
A failed hold above support would weaken the setup.
Actionable but governed by invalidation levels.
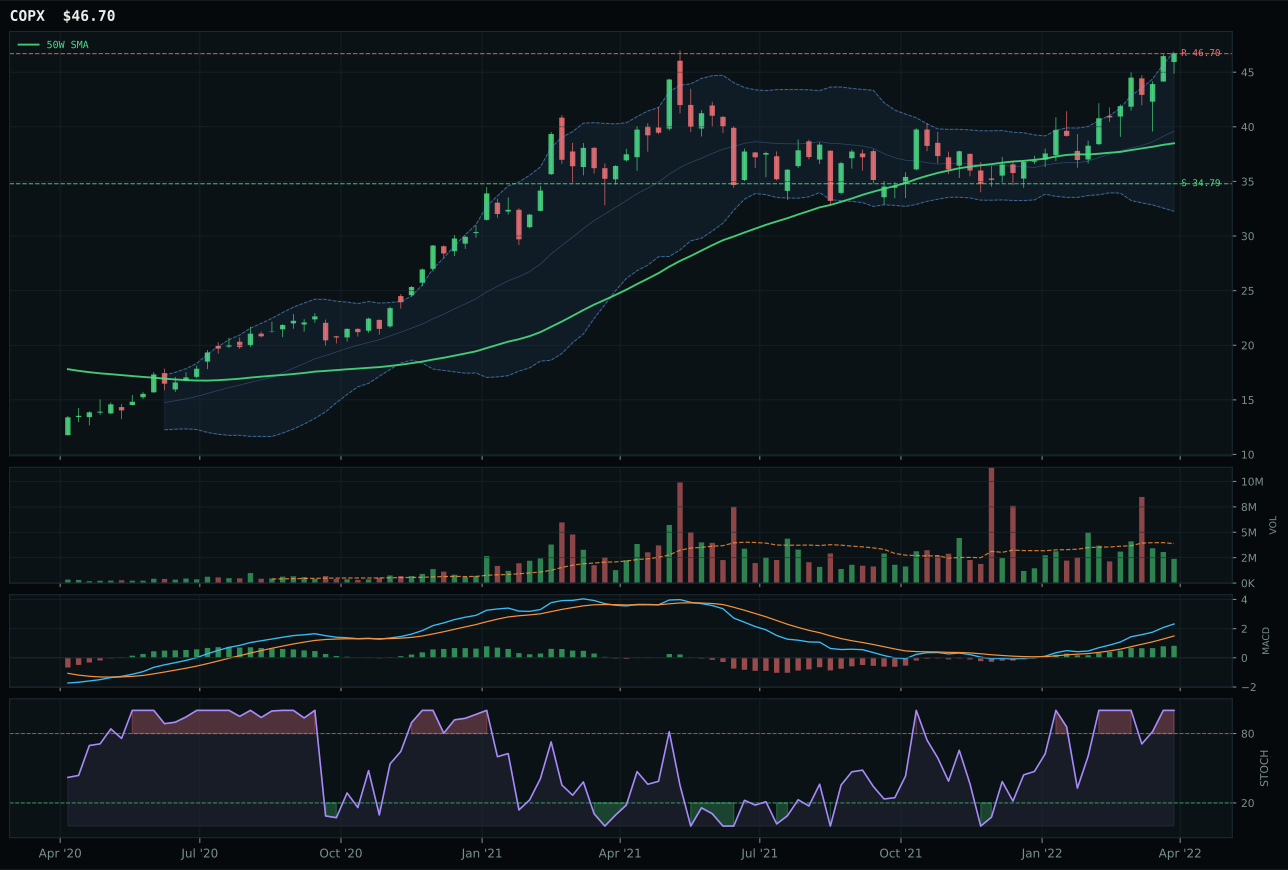
COPX has a vertical extension profile with 31.2% 13-week relative strength versus SPY.
A failed hold above support would weaken the setup.
Actionable but governed by invalidation levels.
REMX wins because it is the cleanest expression of strong trend despite being extended 17.3% above the 50W. The 13W return is 8.7% with 13.4% RS versus SPY, and MACD is bullish and improving with stochastic overbought at 1.00—a powerful setup even if timing is weak at 37.0 due to the distance from the moving average. The runner-up PICK actually offers 27.8% RS versus SPY with a 23.2% 13W return and looks much stronger on momentum, but the risk/reward is marginally worse at 41.8 versus 42.6, and the category-relative strength on PICK is flat at 0.0% versus REMX's -14.5%, which signals that REMX is outperforming on absolute strength. Both are in vertical extension, both have neutral volume, and both sit near 52W highs, so the decision comes down to which ETF has the cleanest structure underneath the extension. REMX's 72.4 structure score edges PICK's, and that 0.8-point margin is enough to win a tight category.
Industrial Metals receives 5% allocation as a tier-2 position in the portfolio, ranking 3-8. The category score of 70.0 is justified by the macro tailwinds: metals scarcity is scoring +14, commodity breadth positive is scoring +10, and real asset sponsorship is scoring +6. Technical evidence from REMX is 66.0, which is respectable but held back by the timing score of 37.0 and the tight risk/reward of 42.6 where upside to resistance is essentially flat. The reason this category stays at tier-2 rather than climbing to top-2 is that both the technical setup and macro narrative are better expressed in Precious Metals (GLD) and Traditional Energy (XOP), which occupy the top tier. To move REMX or the category into top-2 would require a consolidation below the 50W that allows the timing score to reset, or macro confirmation that rare-earth scarcity is tighter than energy or monetary hedge narratives. For now, 5% is appropriate as a second-wave real asset play that benefits from the same supply-shortage and inflation-pressure descriptors without the front-line capital allocation.
Defense & Aerospace — XAR
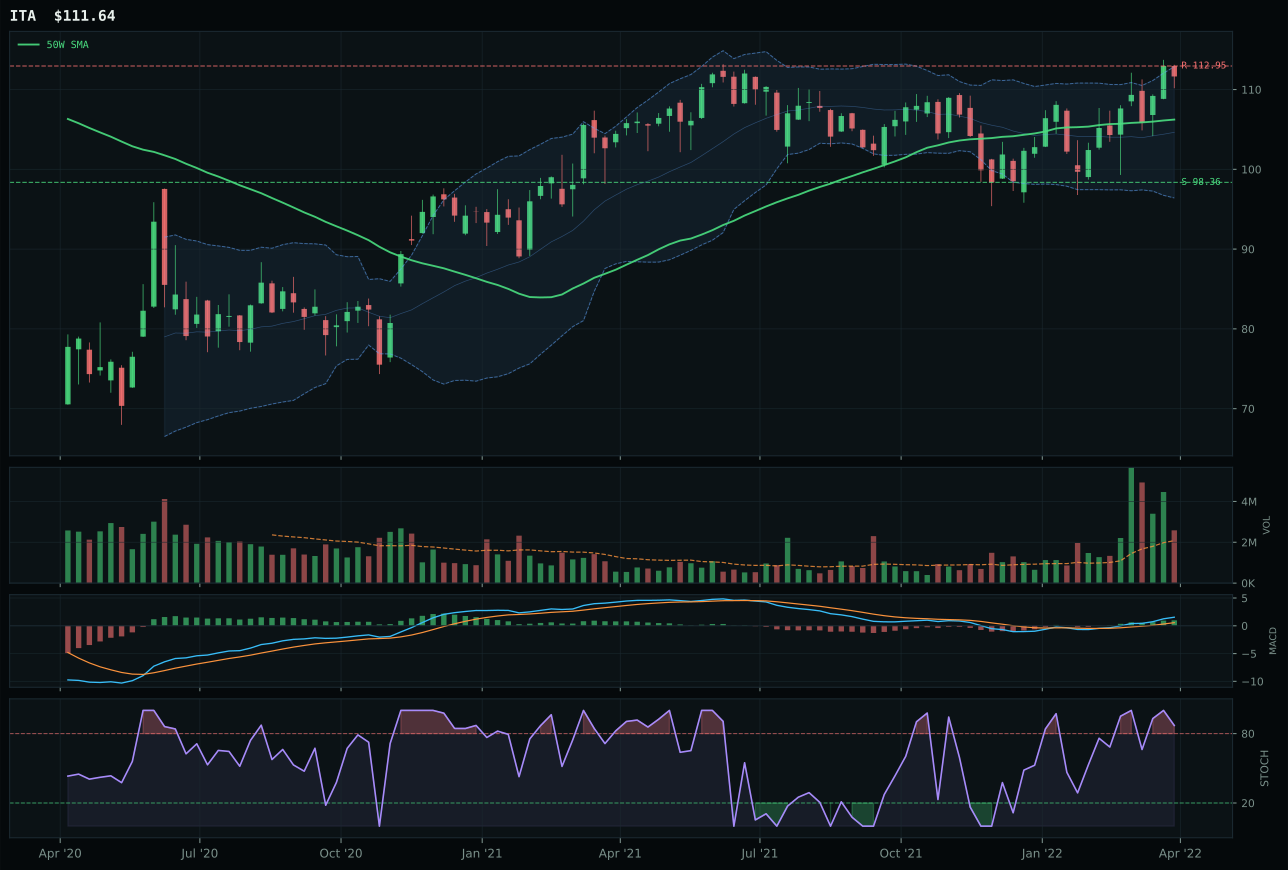
ITA has a neutral structure profile with 13.3% 13-week relative strength versus SPY.
A failed hold above support would weaken the setup.
Actionable but governed by invalidation levels.
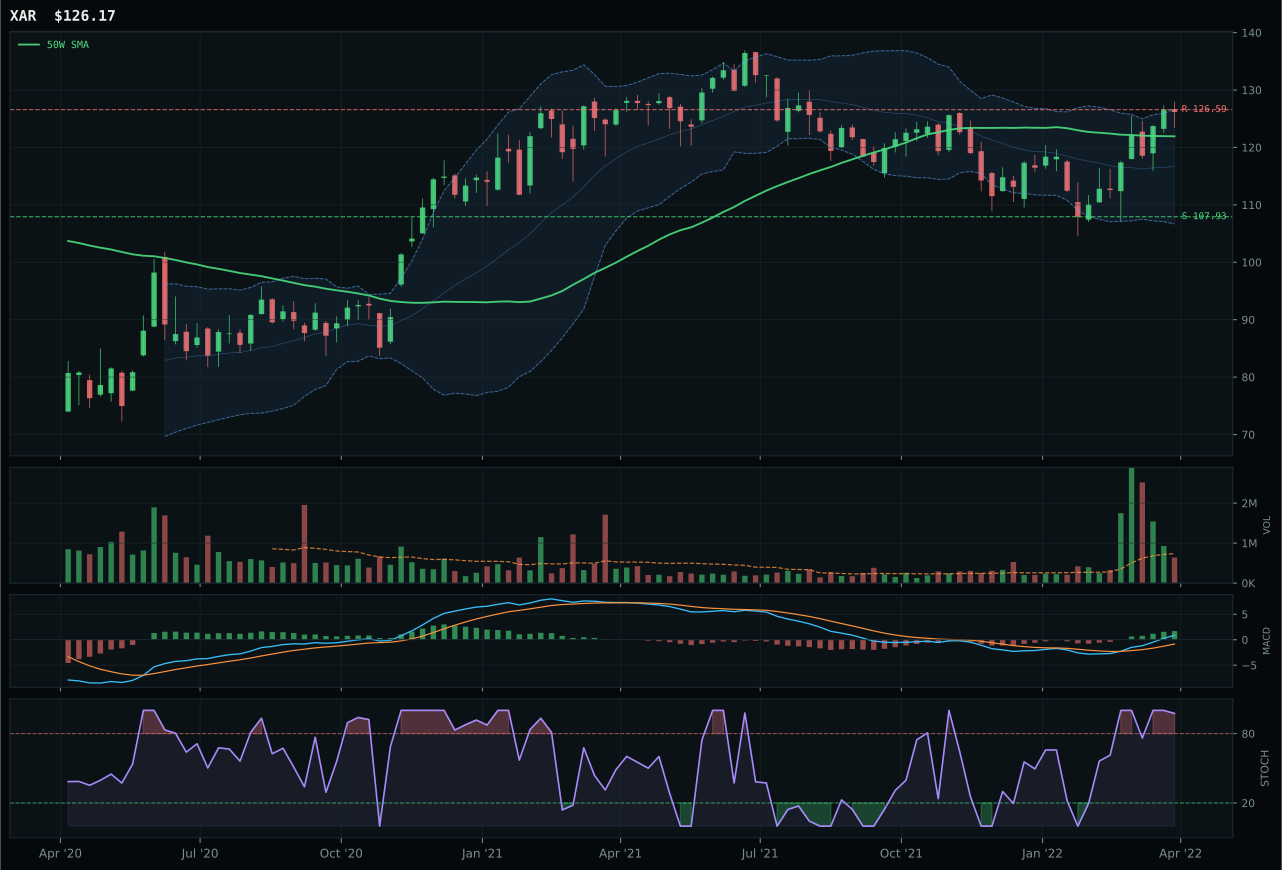
XAR has a neutral structure profile with 13.0% 13-week relative strength versus SPY.
A failed hold above support would weaken the setup.
Actionable but governed by invalidation levels.
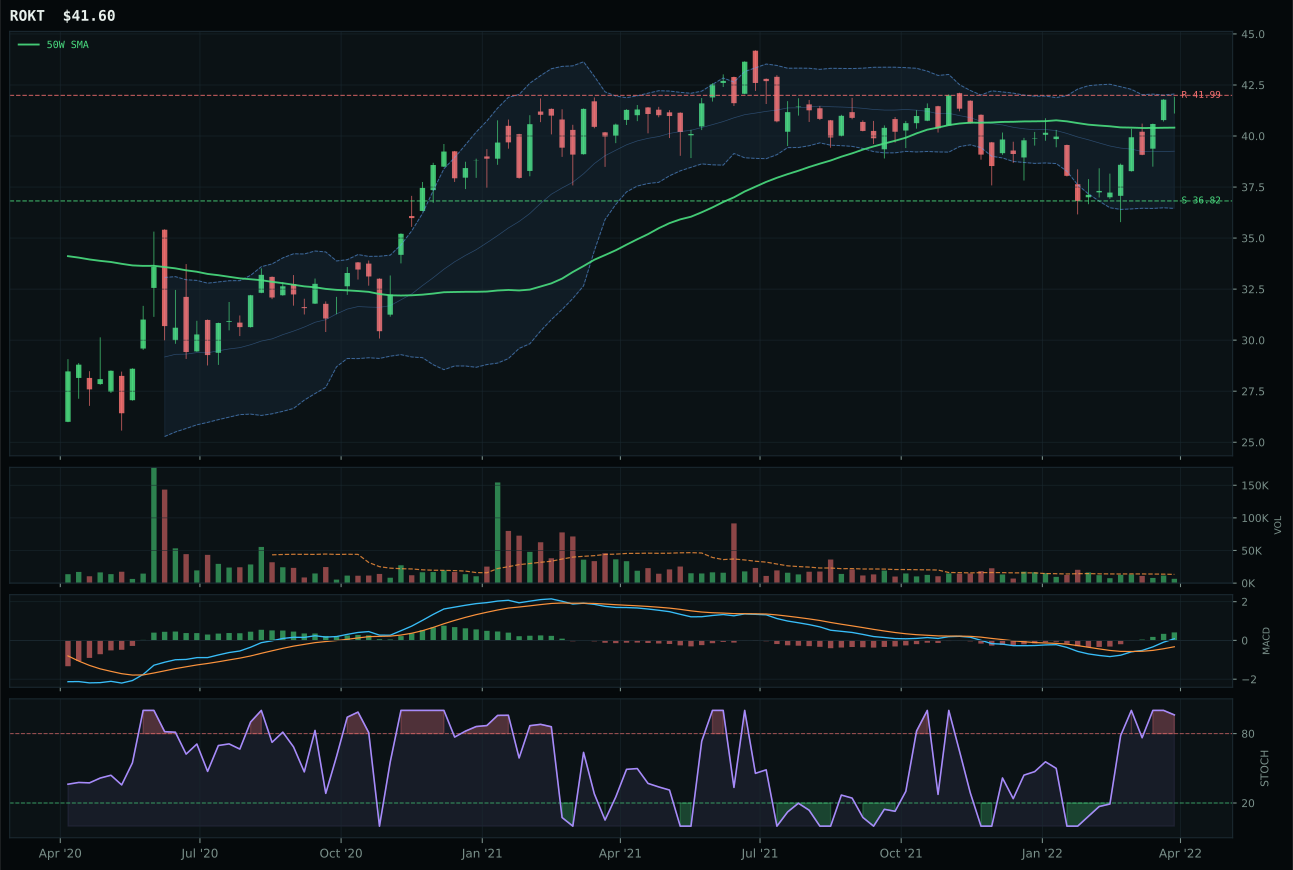
ROKT has a compression near 50W profile with 8.9% 13-week relative strength versus SPY.
A failed hold above support would weaken the setup.
Tracked, but not top-2 eligible because: .
XAR wins by delivering clean momentum with the minimal entry risk that comes from being only 3.5% above the 50W. The 13W return is 8.3%, RS versus SPY is 13.0%, and MACD is bullish and improving with stochastic RSI overbought at 0.97—all the signals you want in a defensive rotation play. The runner-up ITA actually has higher trend and better volume confirmation, but it loses the timing contest by 15 points because it scored 75.0 versus XAR's 90.0, which reflects ITA being further stretched and closer to resistance. Structure is neutral in both cases, and both sit in the upper retracement zone, but XAR's position just 0.3% from resistance creates a tighter risk-reward even if ITA has more momentum in absolute terms. The 2.0-point gap is decisive because the allocator needs the representative to offer both trend proof and entry room, not just one.
Defense & Aerospace earns 5% allocation as a tier-2 category, ranking among positions 3-8. The category score of 70.0 is healthy and justified by strong macro tailwinds: defensive rotation is scoring +8, broad market bear is scoring +6, and the transition regime itself adds +3 to the fit score. Technical evidence from XAR is solid at 85.1, though the macro fit of 50.0 is neutral because no category-specific descriptor profile is available for this exposure. What pushes this category into allocation is the combination of strong technical setup, bullish MACD confirmation across the basket via the 3/2/1 weighting, and the fact that in a risk-off environment, defense outperforms growth. To move into the top-2 tier would require either more aggressive macro sponsorship or one of the three ETFs breaking out of overbought conditions and retesting support at higher volume—neither is likely in the near term. The 5% allocation is appropriate as a satellite position that captures the defensive bid without overcommitting to a crowded trade.
Agriculture & Livestock — MOO
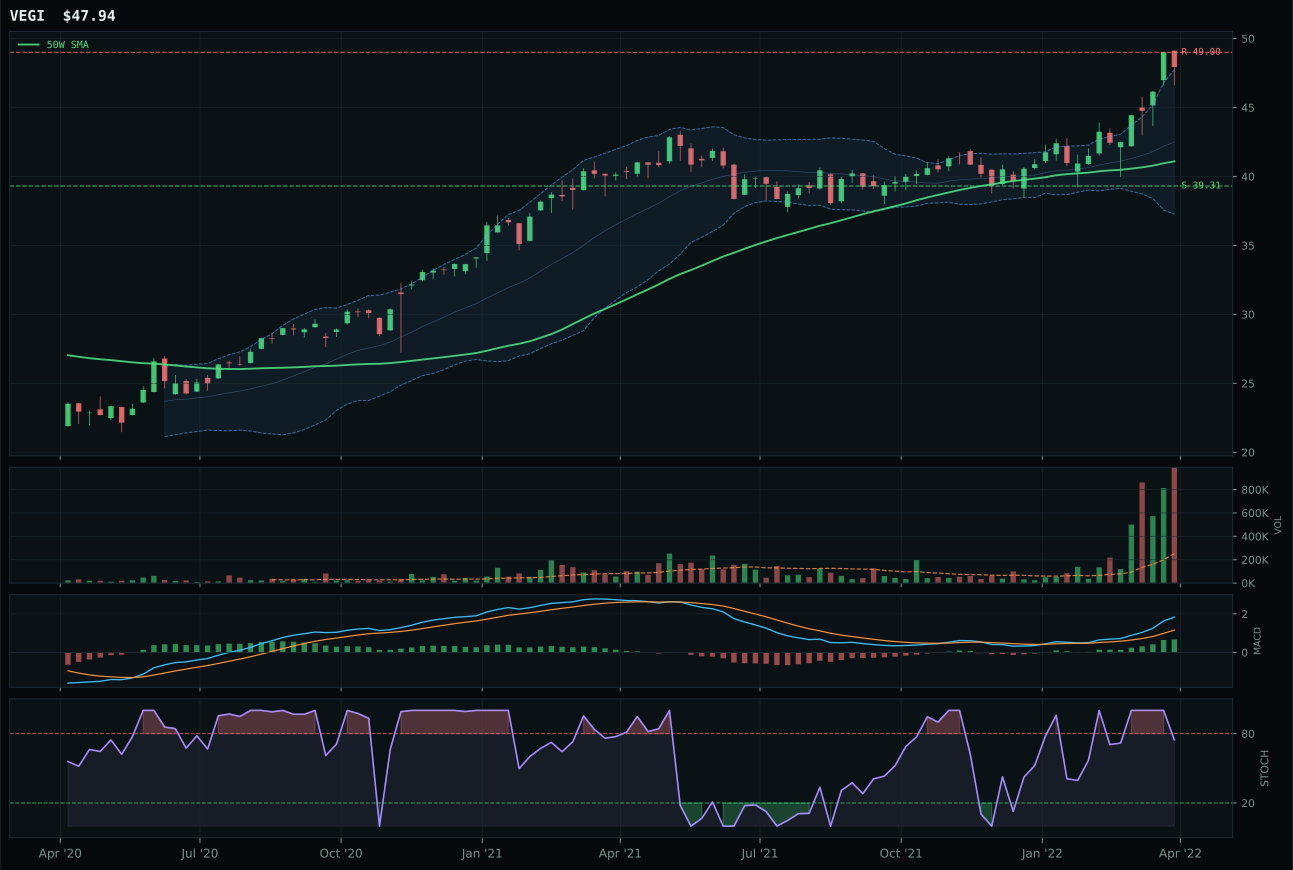
VEGI has a vertical extension profile with 21.9% 13-week relative strength versus SPY.
A failed hold above support would weaken the setup.
Actionable but governed by invalidation levels.
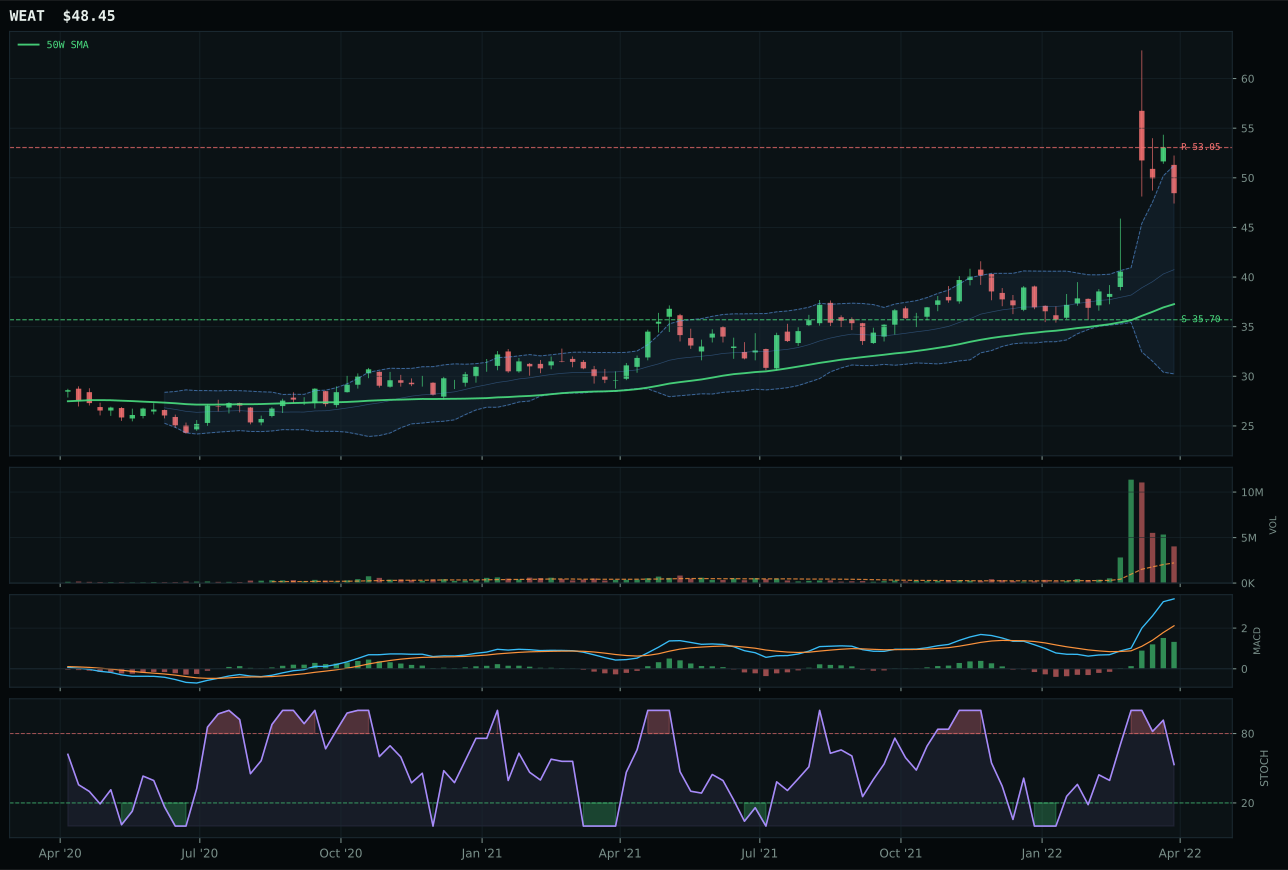
WEAT has a vertical extension profile with 35.8% 13-week relative strength versus SPY.
A failed hold above support would weaken the setup.
Actionable but governed by invalidation levels.
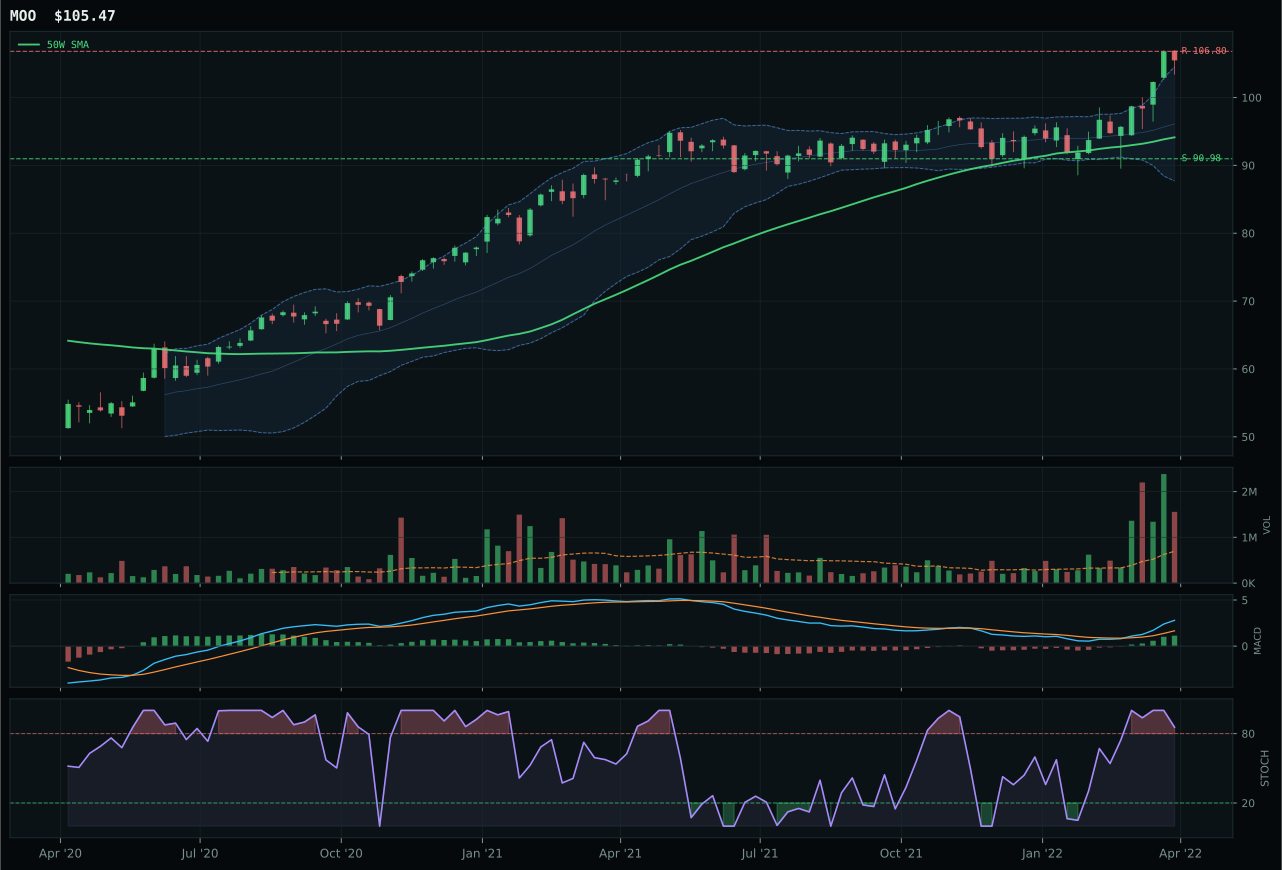
MOO has a neutral structure profile with 15.2% 13-week relative strength versus SPY.
A failed hold above support would weaken the setup.
Actionable but governed by invalidation levels.
MOO wins because it is the only ETF in the basket offering both bullish trend and neutral structure without extended technical stretch. Price is 12.0% above the 50W with MACD bullish and improving, stochastic RSI overbought but rolling over at 0.86, and category-relative strength actually negative at -6.7%, which tells you MOO is outperforming on absolute strength, not relative breadth. The 13W return of 10.5% with 15.2% RS versus SPY is powerful, and the volume at 2.24x the 20W average shows distribution pressure—meaning smart money is taking profits, not chasing. VEGI looks better on paper at 21.9% RS versus SPY with a 17.2% 13W return, but it is in vertical extension and the stochastic RSI is falling neutral, suggesting exhaustion, whereas MOO's setup is still neutral structure with room to compress and reset. The timing score of 49.0 on MOO is weak, which costs it in absolute terms, but that weakness also means it has not yet run into a timing cliff like VEGI.
Agriculture & Livestock receives 5% allocation as a tier-2 position, ranking 3-8 in the portfolio. The category score of 63.6 is anchored by exceptional macro fit of 86.0, driven by supply shortage scoring +13, inflation pressure scoring +10, and real asset sponsorship scoring +8. Technical evidence from MOO is only 37.2, reflecting the distribution pressure and weak timing (49.0), but the macro case is so strong that the category clears the bar for allocation. The ETF supply structure shows that the reasoned proof order is actually VEGI first at 57.9, but the representative function selects MOO at 49.6 because it offers better risk-adjusted entry with less extension. To move into top-2 would require either a macro reset toward deflationary risk (unlikely given active descriptors), or MOO to consolidate and build a second-leg setup with fresh volume sponsorship. For now, 5% captures the real asset inflation hedge without taking on the extended valuation risk embedded in VEGI or WEAT.
Nuclear Energy — URNM
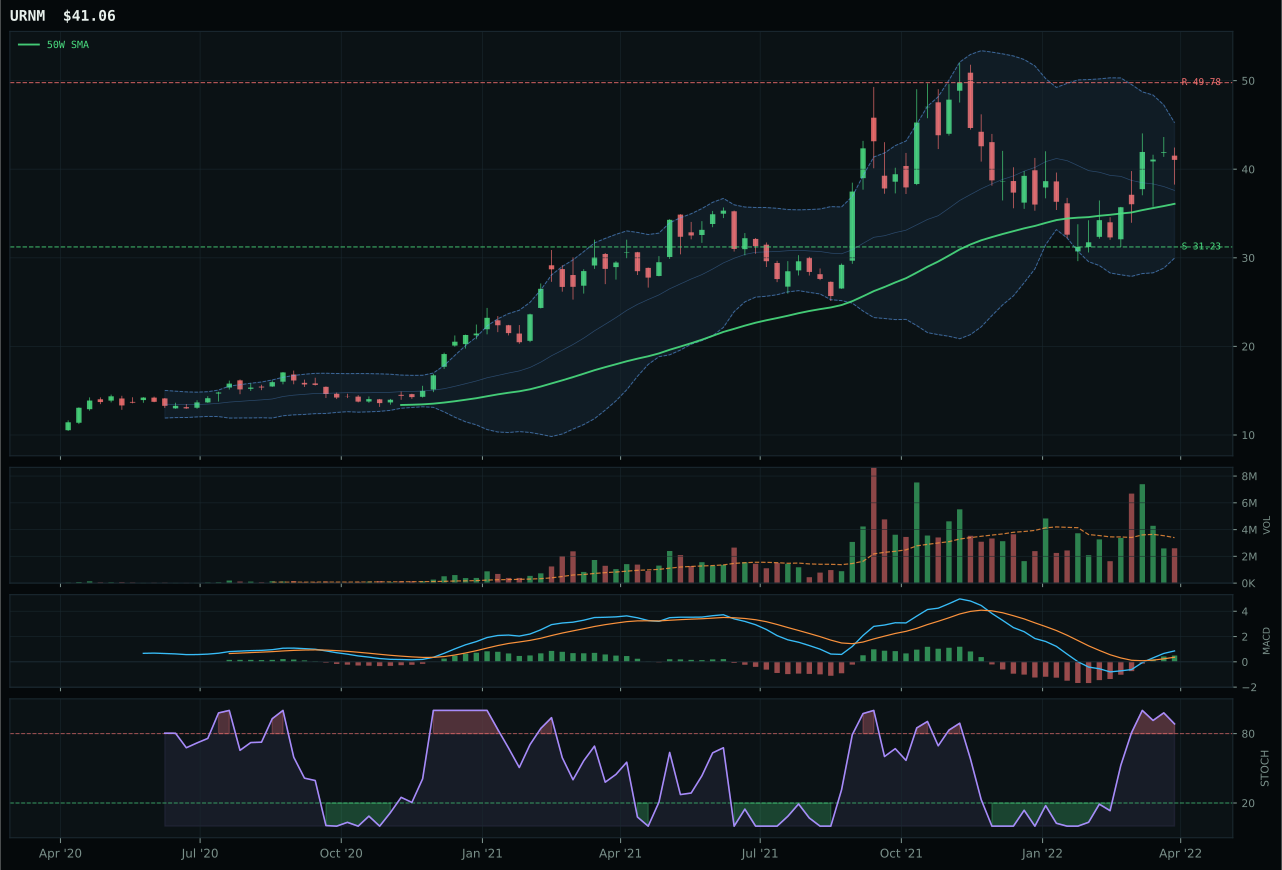
URNM has a neutral structure profile with 18.7% 13-week relative strength versus SPY.
A failed hold above support would weaken the setup.
Actionable but governed by invalidation levels.
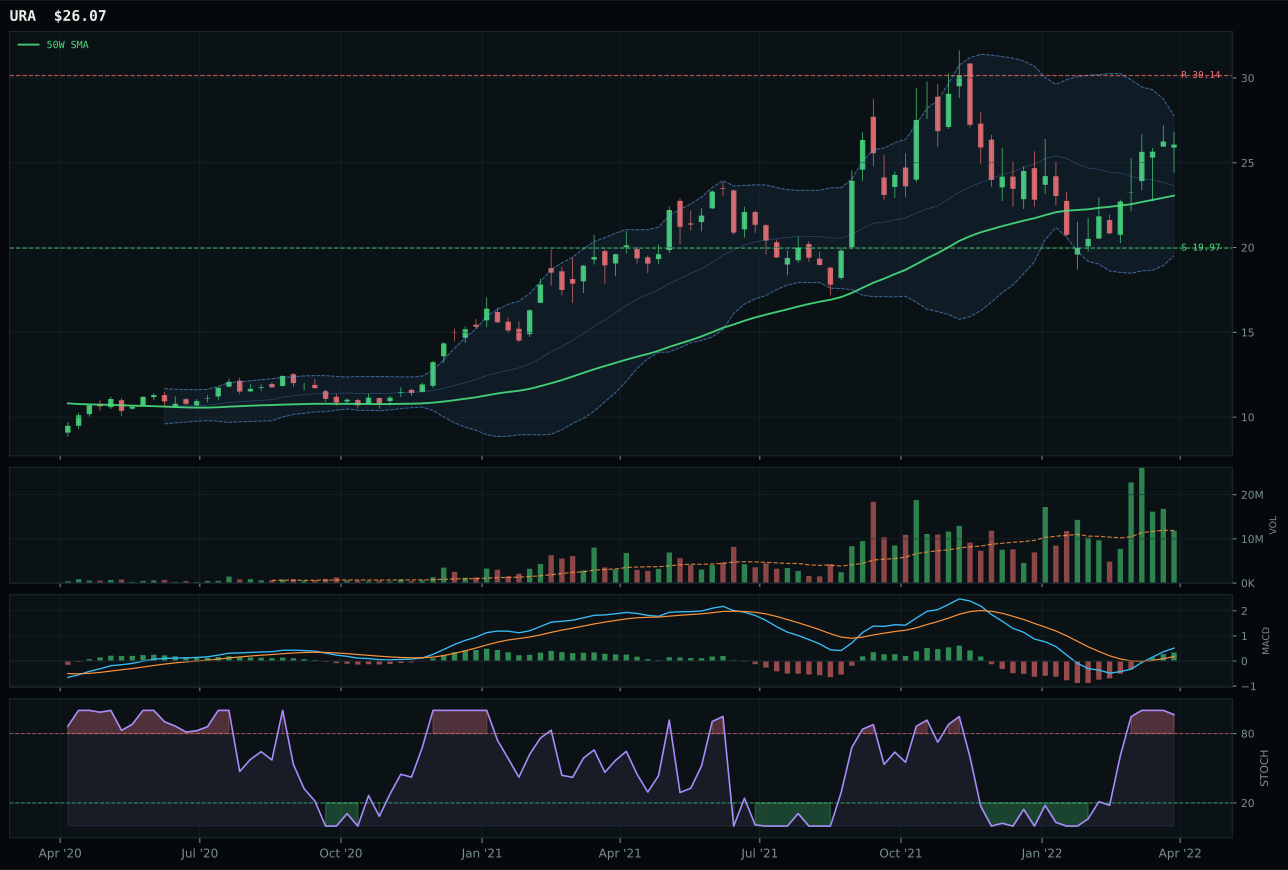
URA has a neutral structure profile with 18.9% 13-week relative strength versus SPY.
A failed hold above support would weaken the setup.
Actionable but governed by invalidation levels.
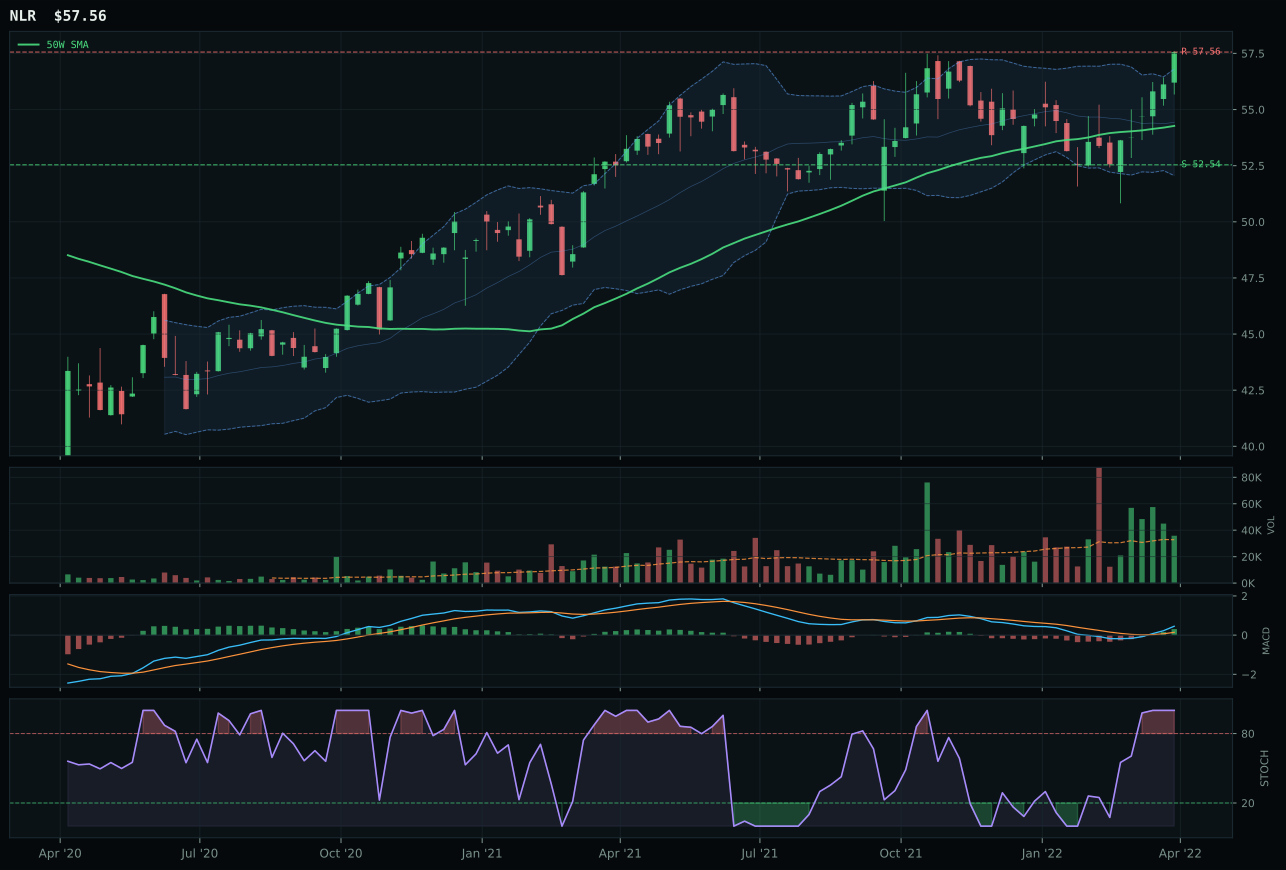
NLR has a neutral structure profile with 9.7% 13-week relative strength versus SPY.
A failed hold above support would weaken the setup.
Tracked, but not top-2 eligible because: .
URNM wins because it is the only ETF in the basket offering both bullish MACD with improving slope and acceptable trend confirmation without overextension. Price is 13.7% above the 50W, which is stretched but manageable, and the stochastic RSI is overbought rolling over at 0.88, suggesting consolidation rather than euphoria. The 13W return of 14.0% with 18.7% RS versus SPY is excellent, and the momentum confirmation score is perfect at 100.0 despite the category-relative strength being flat at 0.0%, which means URNM is outperforming on absolute energy scarcity narrative rather than relative uranium breadth. The runner-up URA actually has better technical evidence at 74.2 versus 62.4, and the timing score is better at 64.0 versus 57.0, but the risk/reward is weaker (46.0 vs 48.0), and URNM's structure at 63.4 edges URA's. The 7.9-point gap is decisive because the allocator needs the representative to avoid overextension into resistance, and at 13.7% above the 50W, URNM still has room to move higher without risking a setup breakdown.
Nuclear Energy receives 5% allocation as a tier-2 position, ranking 3-8 in the portfolio. The category score of 58.8 reflects a split between excellent momentum—both URNM and URA have perfect momentum confirmation at 100.0 with 13W returns near 14%—and a weaker macro fit of 60.0 at the category level. Energy scarcity is scoring +9, real asset sponsorship is scoring +7, and inflation pressure is scoring +3, but credit stress is active at -5 and risk appetite broken is active at -4, creating headwinds. The technical evidence from URNM is 62.4, which is respectable for a category that is fundamentally a real asset play rather than a core energy bet. To move into top-2 would require either a deeper consolidation that improves the timing score back to equilibrium, or macro confirmation that nuclear supply scarcity is accelerating faster than commodity or precious metals scarcity. For now, 5% is appropriate as a real asset satellite that benefits from the energy-scarcity narrative without taking the full beta of XOP. The setup is clean enough to hold, but not extended enough to justify overweighting.
Emerging Markets — ILF
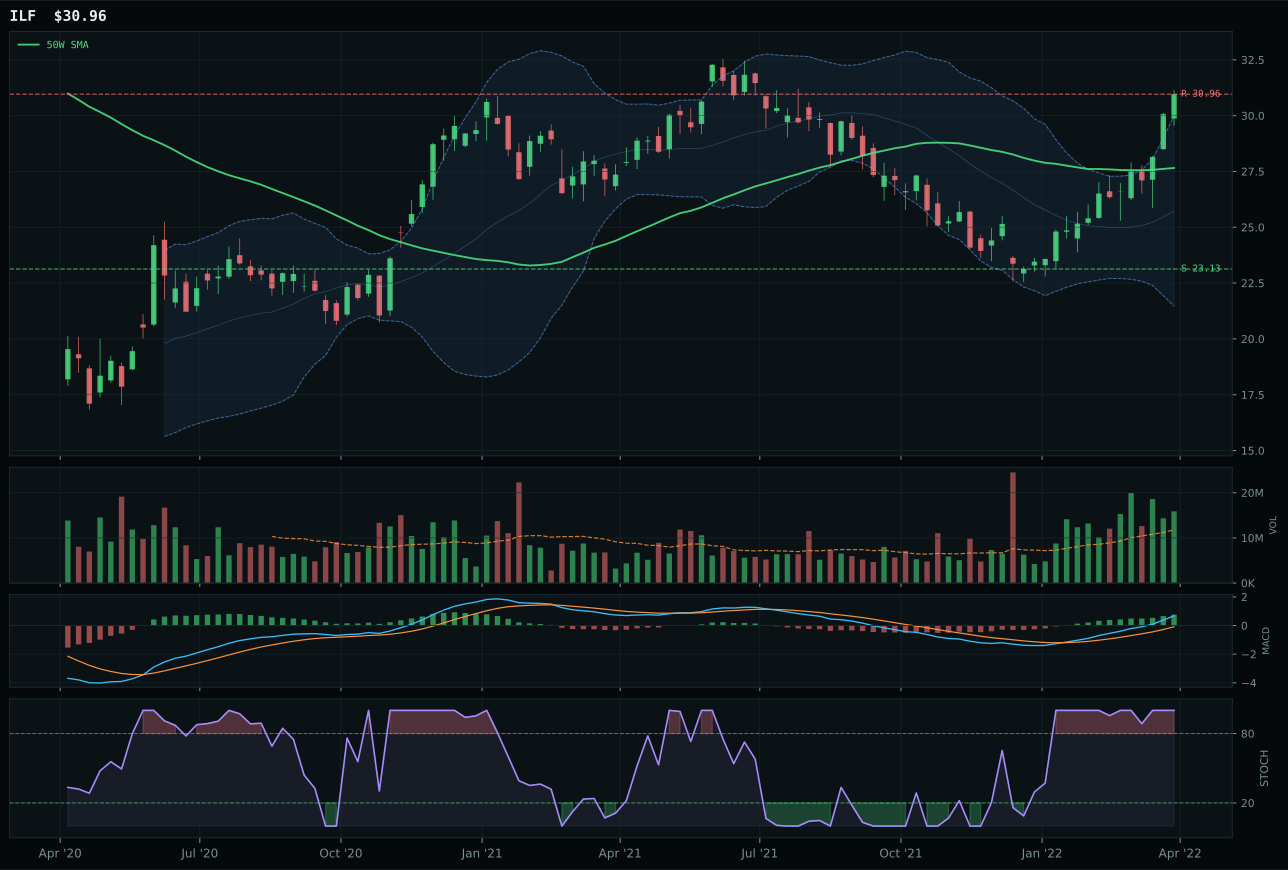
ILF has a neutral structure profile with 36.6% 13-week relative strength versus SPY.
A failed hold above support would weaken the setup.
Actionable but governed by invalidation levels.
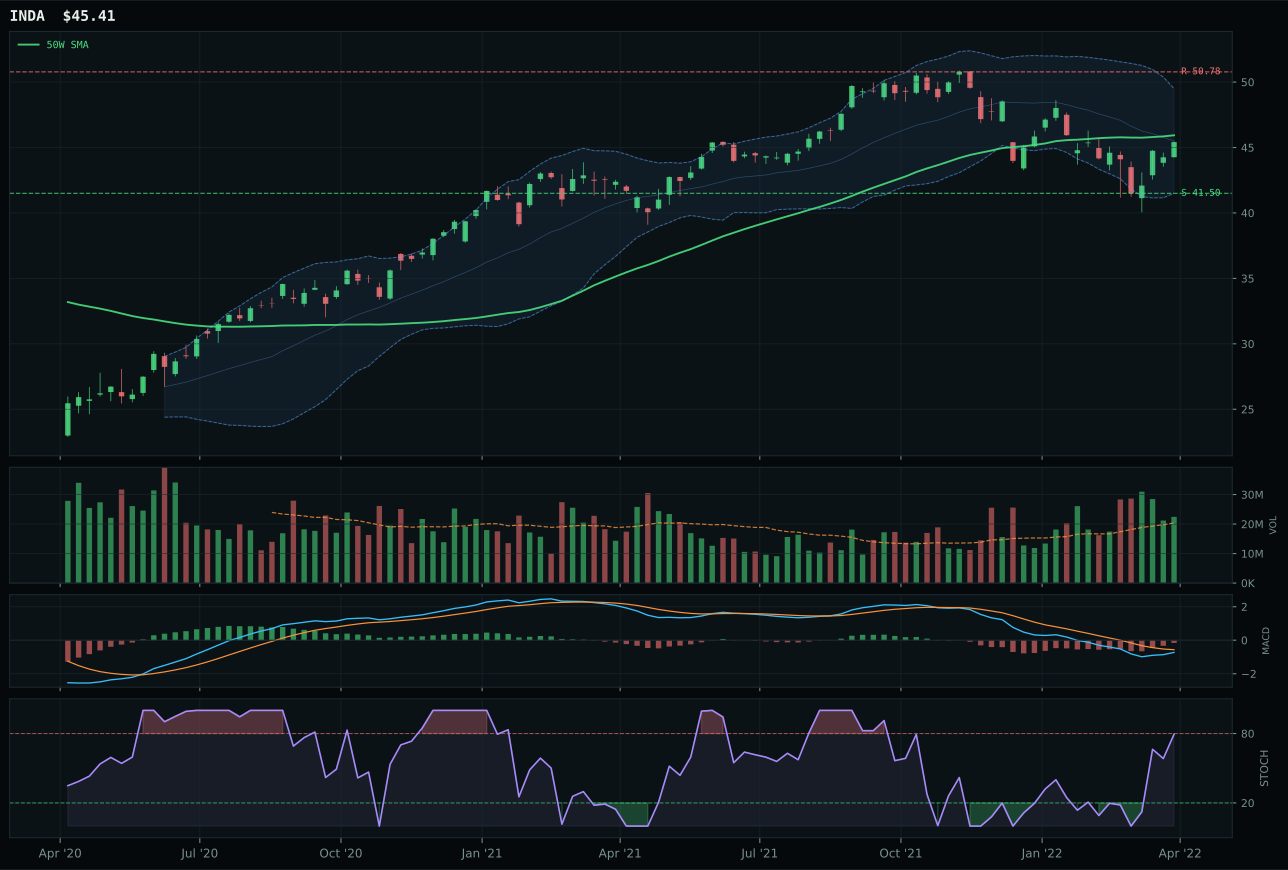
INDA has a compression near 50W profile with 3.7% 13-week relative strength versus SPY.
A failed hold above support would weaken the setup.
Actionable but governed by invalidation levels.
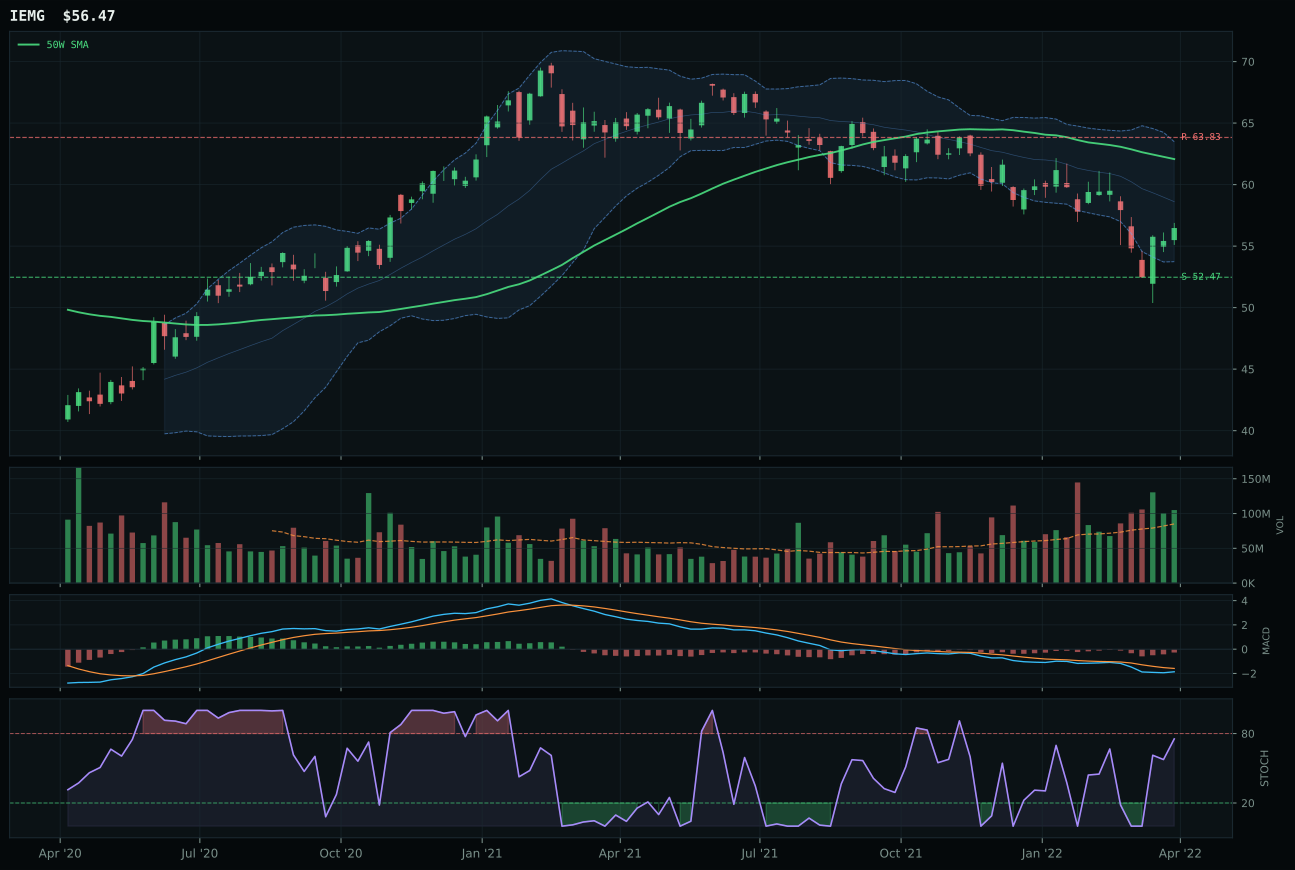
IEMG has a neutral structure profile with -1.0% 13-week relative strength versus SPY.
A failed hold above support would weaken the setup.
Actionable but governed by invalidation levels.
ILF wins decisively by delivering exceptional relative strength and breadth in a category where most peers are still broken. The 13W return is 32.0% with 36.6% RS versus SPY and 32.9% category-relative strength—the highest relative strength score in the entire portfolio—and the volume-price confirmation is 98.4 with persistence of 100.0, which is nearly perfect. Price is 11.9% above the 50W with MACD bullish and improving and stochastic overbought at 1.00, and structure is the cleanest in the category at 83.7. The runner-up INDA is actually higher-ranked in the reasoned ETF proof order at 64.9 versus ILF's 81.7, but INDA is still in compression near the 50W with MACD bearish but improving and zero category-relative strength, which means it has not yet broken out of a defensive posture. The 4.5-point gap is meaningful because INDA is a quality-growth story while ILF is a commodity-and-value story, and in this regime, the latter is working and the former is stuck.
Emerging Markets receives 5% allocation as a tier-2 position, ranking 3-8 despite ILF's exceptional technical merit. The category score of 50.9 masks a powerful tension: the technical evidence from ILF is perfect at 100.0, but the macro fit is only 25.0, dragged down by dollar pressure scoring -14, credit stress scoring -10, and broad market bear scoring -9. These macro headwinds nearly cancel out the strong momentum, and the 3/2/1 weighted basket average of 69.2 has to be tested down to 50.9 after the category reasoner accounts for the weak macro regime. This is the clearest example in the portfolio of a setup that works technically but fights a macro headwind. The 5% allocation recognizes ILF's exceptional 36.6% RS versus SPY and 32.0% 13W return as real money flows, but the allocation size reflects the fact that dollar pressure and credit stress are structural headwinds, not tactical setups. To move into top-2 would require either dollar pressure to flip dormant or the broad market bear descriptor to become inactive. Until that macro regime shift, ILF is a tactical satellite position that captures EM commodity and value strength without taking on systemic leverage to a regime that is still hostile to risk assets.
Technology — CIBR
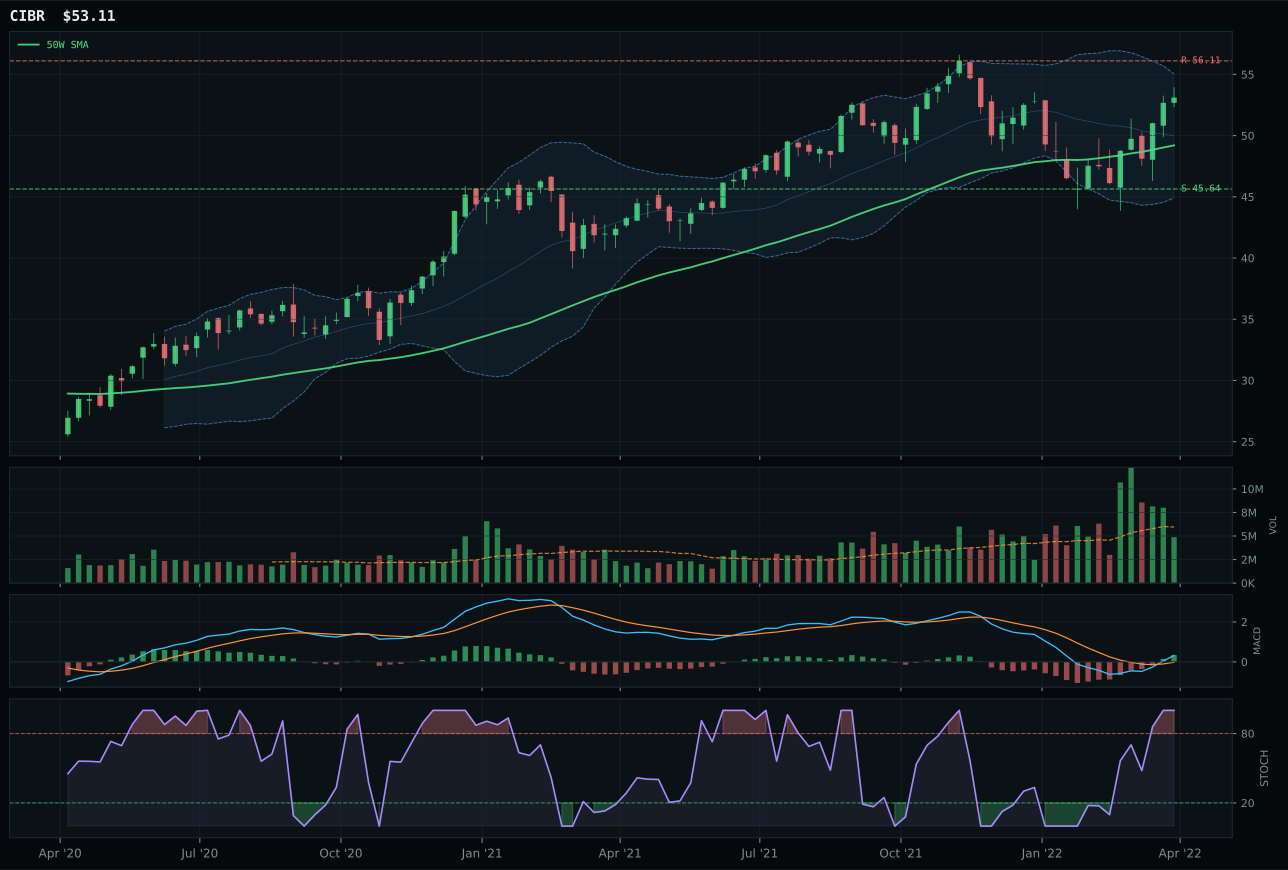
CIBR has a neutral structure profile with 5.2% 13-week relative strength versus SPY.
A failed hold above support would weaken the setup.
Actionable but governed by invalidation levels.
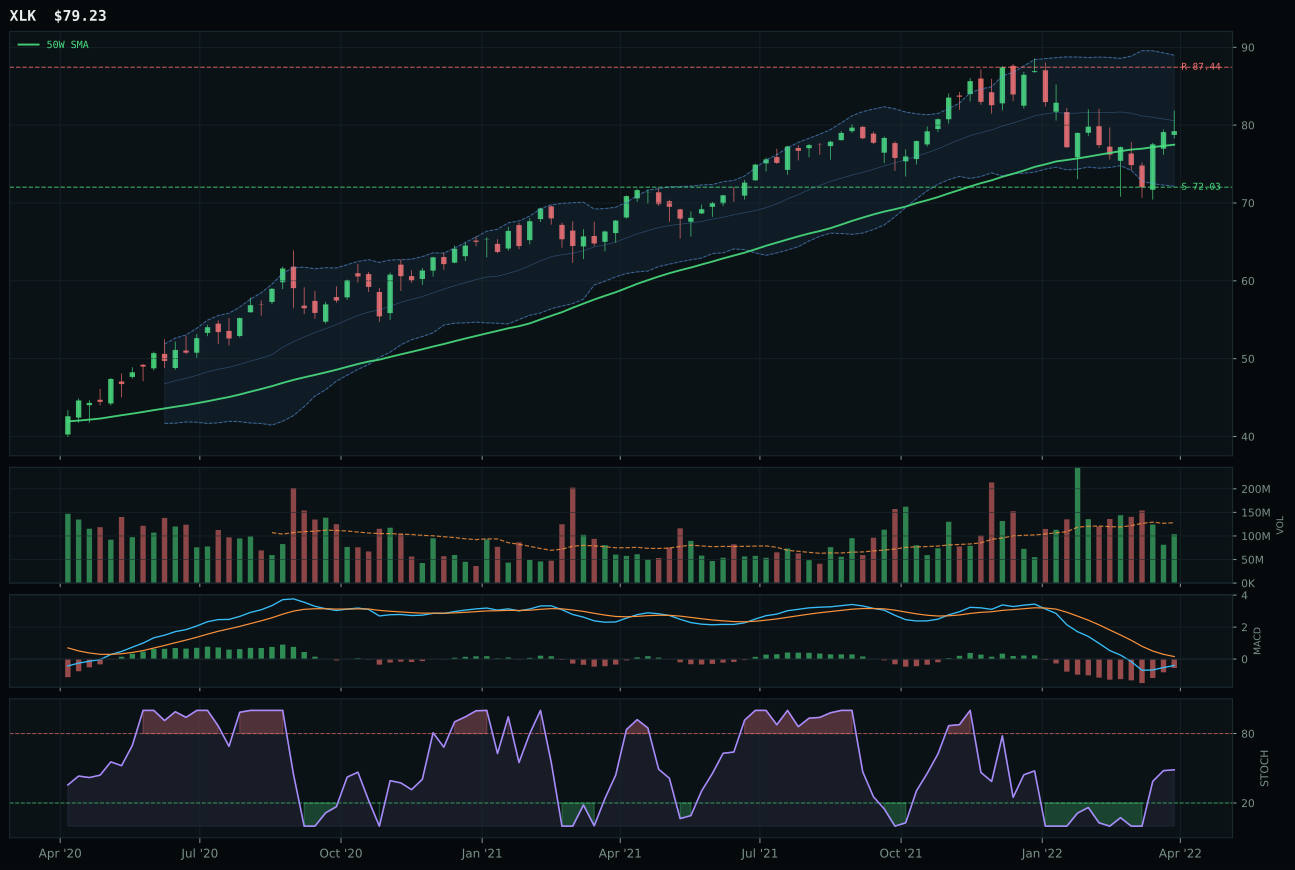
XLK has a compression near 50W profile with -4.2% 13-week relative strength versus SPY.
A failed hold above support would weaken the setup.
Actionable but governed by invalidation levels.
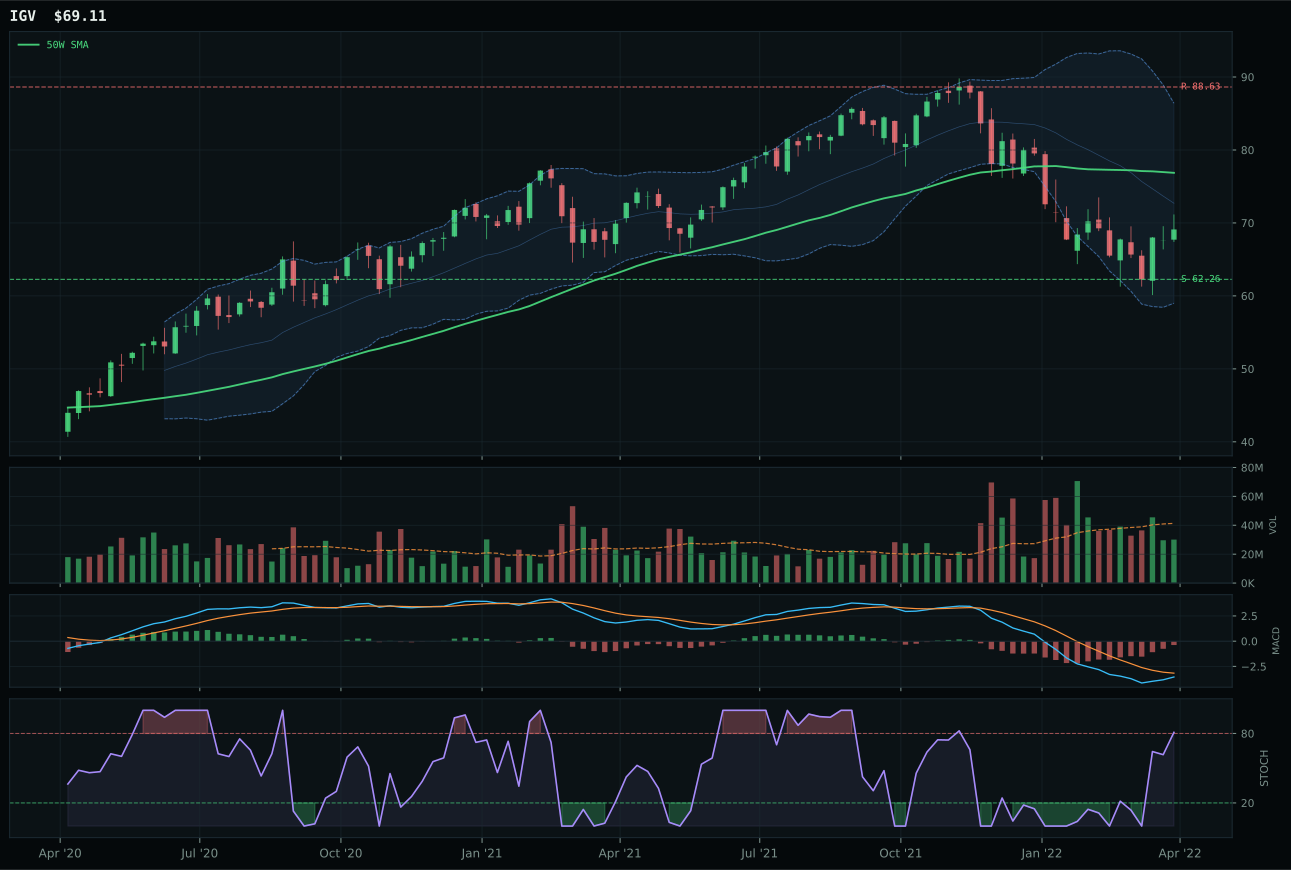
IGV has a neutral structure profile with -8.5% 13-week relative strength versus SPY.
A failed hold above support would weaken the setup.
Actionable but governed by invalidation levels.
CIBR wins the category because cybersecurity has maintained bullish structure and relative momentum where the broad technology peer group has not. Price sits 7.9% above the 50W moving average with a 50W slope that remains positive at 0.4%, and the MACD is bullish and improving—precisely the confirmation that separates this from XLK, which is bearish but improving with category-relative strength lagging at 0.0% versus CIBR's 9.5%. The stochastic RSI is overbought, but that matters less than the fact that volume is neutral at 0.82x the 20W average, meaning this move has not been forced by panic buying or distribution. CIBR's 13W return of 0.6% paired with a 5.2% advantage versus SPY tells you that defensive rotation is taking place inside tech, not a sector-wide collapse—buyers are choosing the quieter sub-theme over the momentum wreckage elsewhere.
Technology receives 0% allocation this week and ranks 9th or 10th in the portfolio—outside the allocation entirely. The category score of 49.7 reflects a macro regime that is actively hostile to growth, with credit stress, risk appetite broken, and dollar pressure all pulling down the narrative fit to just 61.0 at the representative level despite strong technical evidence of 86.8 from CIBR. In a transition regime where defensive rotation is scoring +7 and broad market bear is scoring +4, technology has become a value trap for patient allocators rather than a current opportunity. The path back to allocation is clear: the MACD confirmation needs to extend across all three ETFs in the basket, category-relative strength spreads need to widen, and macro descriptors like credit stress would need to flip from active to dormant. Until that regime shift, this category sits on the bench despite CIBR's clean setup.
AI — SMH
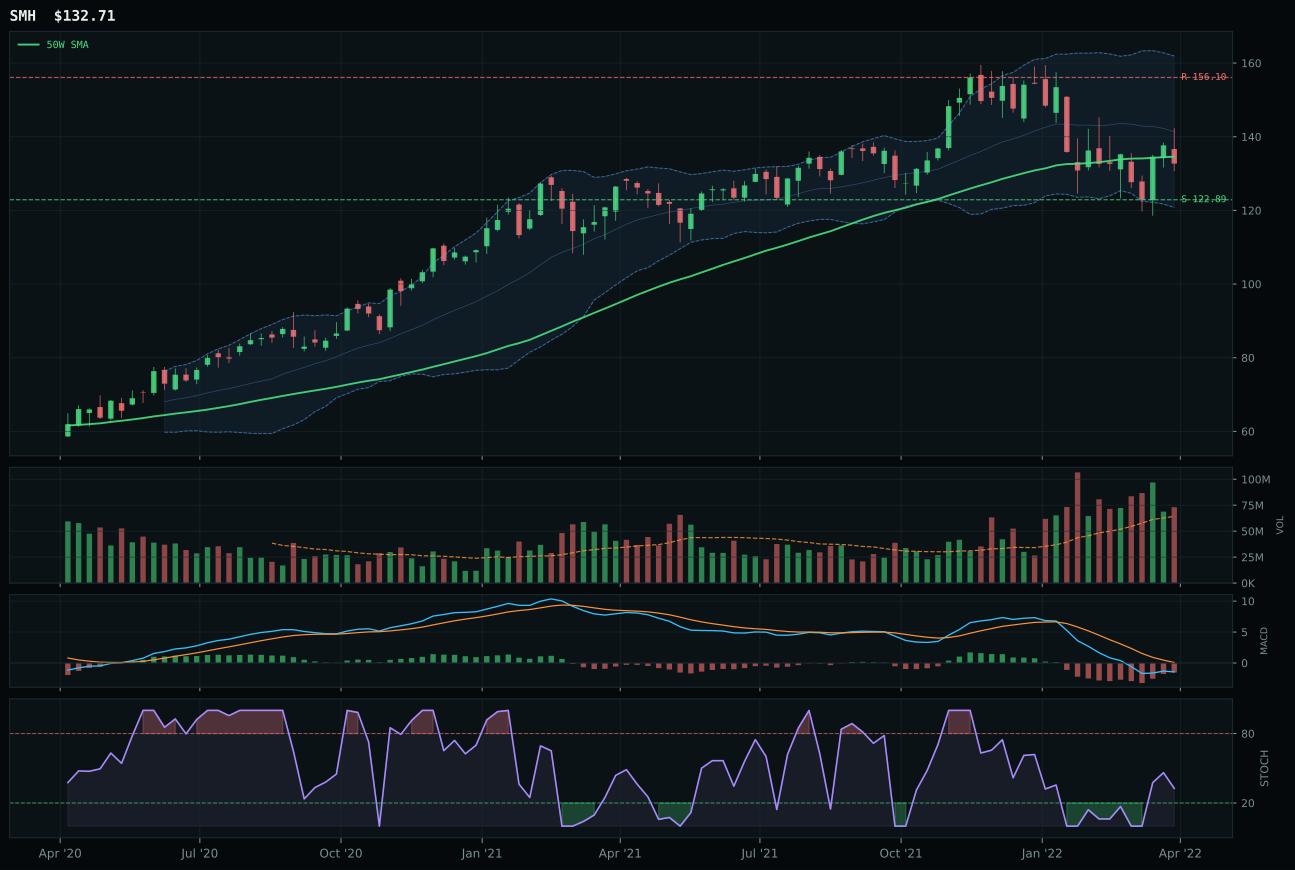
SMH has a compression near 50W profile with -9.4% 13-week relative strength versus SPY.
A failed hold above support would weaken the setup.
Actionable but governed by invalidation levels.
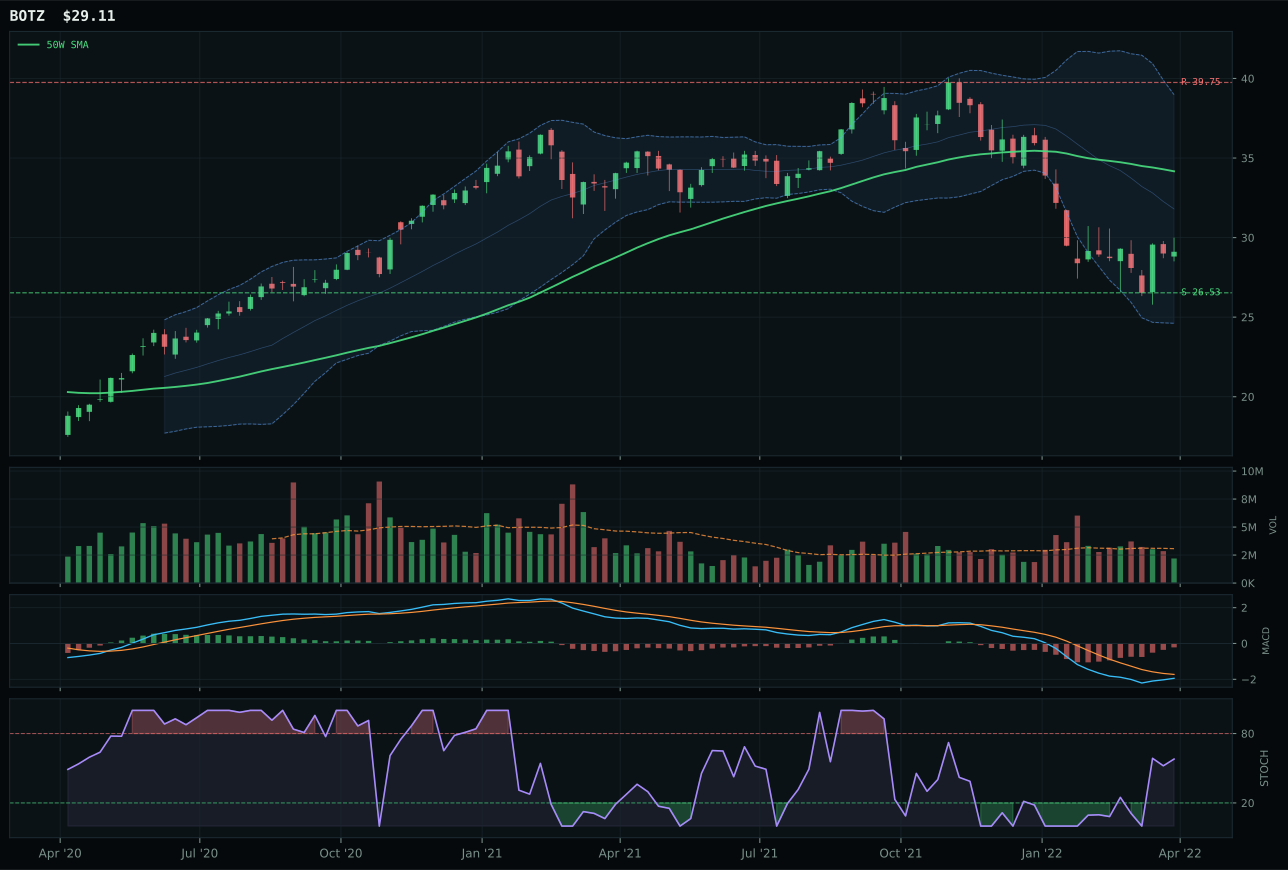
BOTZ has a neutral structure profile with -14.4% 13-week relative strength versus SPY.
A failed hold above support would weaken the setup.
Actionable but governed by invalidation levels.
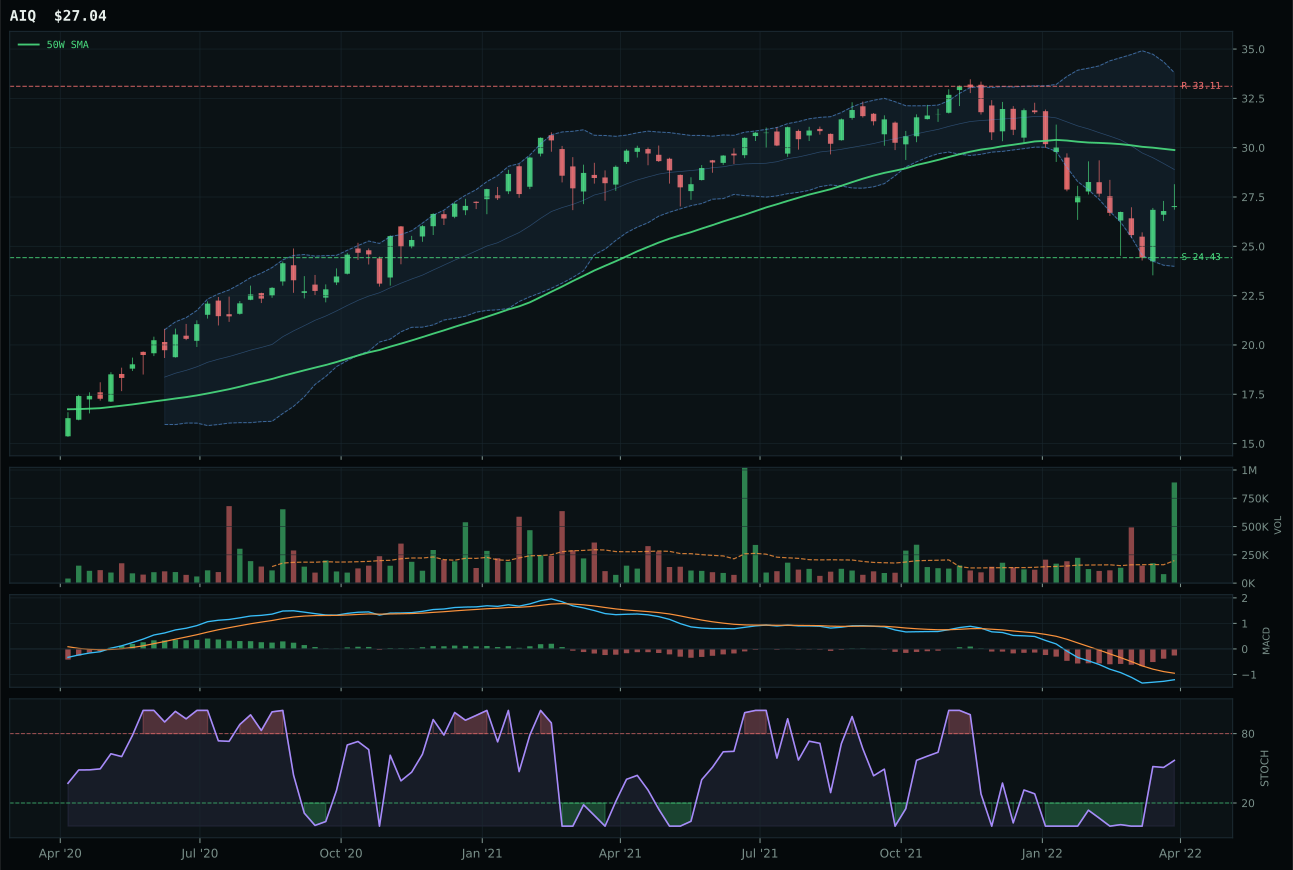
AIQ has a neutral structure profile with -10.3% 13-week relative strength versus SPY.
A failed hold above support would weaken the setup.
Tracked, but not top-2 eligible because: .
SMH wins the category by being the only ETF still positioned near the 50W moving average, where support-and-bounce setups live. Price is 1.4% below the 50W, above the 200W, and the stochastic RSI is rising from mid-zone at 0.33—the textbook reset configuration that allows timing to score a perfect 100.0 despite terrible momentum. The 13W return is -14.0% and the category-relative strength is nearly flat at 0.9%, but MACD is bearish but improving, and volume is above-average at 1.14x the 20W average, which means accumulation may be beginning rather than capitulation continuing. BOTZ lost by 31.7 points primarily because it is stretched 13.7% above the 50W with thinner participation and worse timing (63.0 vs 100.0), making it a worn-out leader rather than a coiled spring.
AI receives 0% allocation this week and ranks outside the top-8 slots. The category score of 27.1 is the second-worst in the portfolio, reflecting both poor technical breadth across the three-ETF basket and a macro regime where risk appetite is broken scoring -7 and broad market bear is scoring -8 at the category level. Even with SMH's perfect timing score, the technical evidence underneath is only 68.9 across the representative, dragged down by a 13W return of -14.0% and persistent underperformance versus SPY. The macro fit is 40.0 at the category level—slightly above neutral—but that is not enough to overcome the fact that this is a pure growth sector in a risk-off environment. For AI to earn allocation, either the broad market bear descriptor would need to flip dormant, or one of these ETFs would need to show volume sponsorship and positive 4W/13W returns that confirm a new cycle beginning. Neither condition is met.