
2022-03-25
Informational purposes only. The content in this report, including allocations, analysis, and commentary, is provided solely for informational and educational purposes. It does not constitute financial advice, investment advice, trading advice, or any other type of advice. Past performance does not guarantee future results. Always conduct your own research and consult a qualified financial professional before making investment decisions.
Macro risk engine requires the 50% Defensive overlay for this run; payload selected by cause: Inflation Scarcity.
Weekly Allocation
| Ticker | Category | Weight | Role |
|---|---|---|---|
| XLE | 50% | Overlay | |
| WEAT | Agriculture & Livestock | 10% | Top-2 (10%) |
| XOP | Traditional Energy | 10% | Top-2 (10%) |
| COPX | Industrial Metals | 5% | Tier-2 (5%) |
| GLD | Precious Metals | 5% | Tier-2 (5%) |
| XAR | Defense & Aerospace | 5% | Tier-2 (5%) |
| XLU | Utilities & Infrastructure | 5% | Tier-2 (5%) |
| URNM | Nuclear Energy | 5% | Tier-2 (5%) |
| CIBR | Technology | 5% | Tier-2 (5%) |
Trade Instructions — Monday Open
Sell the tranche from 2022-02-25 (completing its 4-week hold). Buy the new tranche. Instructions show net portfolio changes — same-asset positions cancel, weight changes show the delta.
| Action | Ticker | Instruction |
|---|---|---|
| SELL | COPX | Sell 43% of COPX position (reduce 8.75% → 5.00%) |
| SELL | GDX | Sell entire GDX position (2.50% of portfolio) |
| SELL | PAVE | Sell entire PAVE position (2.50% of portfolio) |
| SELL | XAR | Sell 20% of XAR position (reduce 6.25% → 5.00%) |
| SELL | URNM | Sell 20% of URNM position (reduce 6.25% → 5.00%) |
| SELL | CIBR | Sell 25% of CIBR position (reduce 5.00% → 3.75%) |
| BUY | XLE | Buy XLE — 60.00% of freed cash (adds 7.50% to portfolio) |
| BUY | GLD | Buy GLD — 10.00% of freed cash (adds 1.25% to portfolio) |
| BUY | XLU | Buy XLU — 10.00% of freed cash (adds 1.25% to portfolio) |
| BUY | XOP | Buy XOP — 20.00% of freed cash (adds 2.50% to portfolio) |
Current Portfolio After Trade
Combined holdings across all 4 active tranches. Each tranche is 25% of the portfolio.
| Ticker | % of Portfolio | Weight Bar |
|---|---|---|
| XLE | 55.00% | |
| GLD | 8.75% | |
| WEAT | 6.25% | |
| XAR | 5.00% | |
| URNM | 5.00% | |
| XLU | 5.00% | |
| XOP | 5.00% | |
| COPX | 5.00% | |
| CIBR | 3.75% | |
| ILF | 1.25% |
Macro Regime — Transition / Mixed
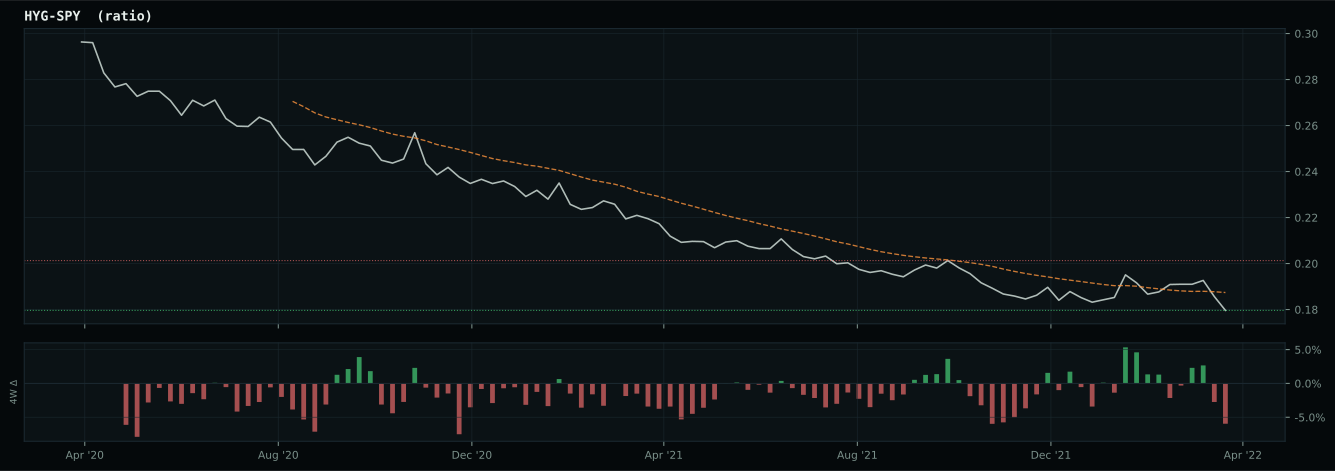
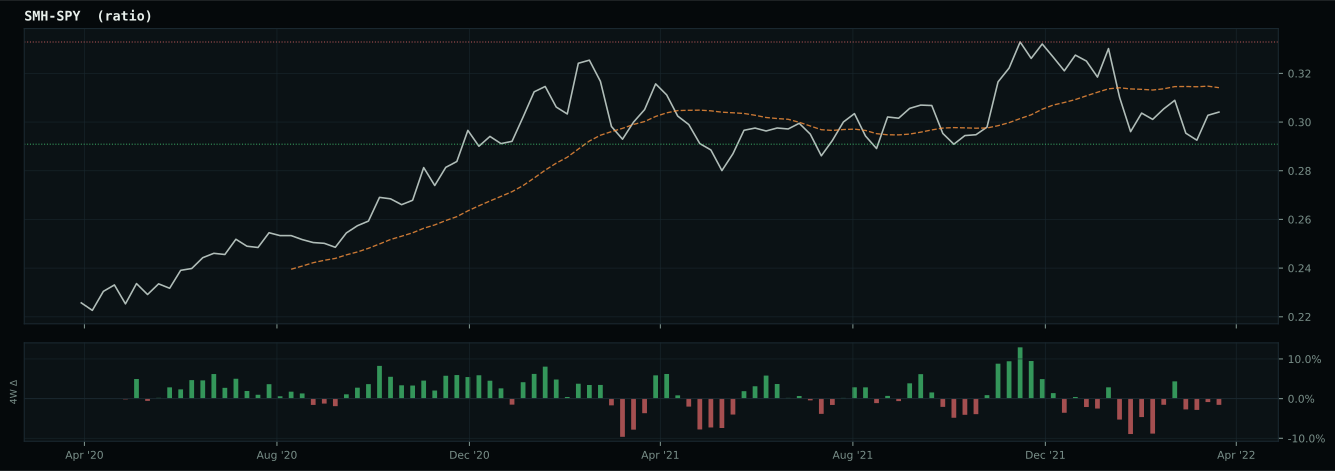
growth data is not confirming the weak market-implied risk appetite signal
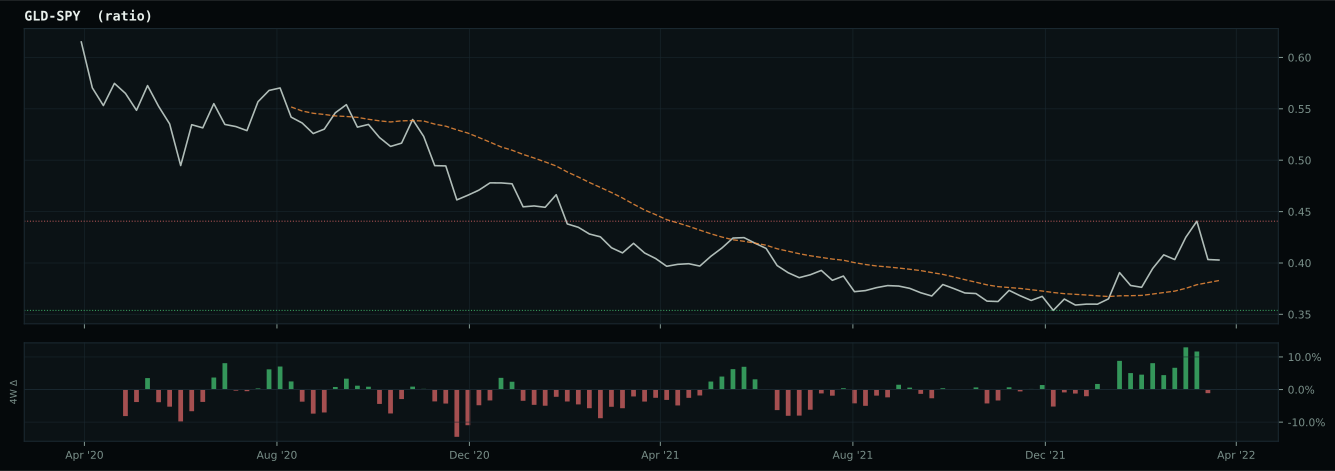
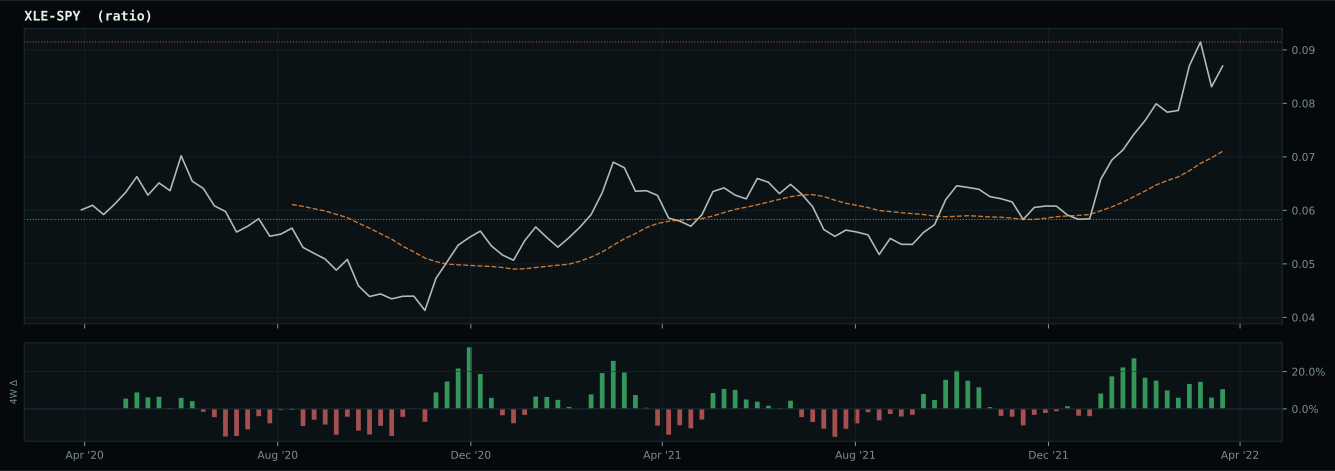
Defensive overlay cause is inflation/scarcity: energy, commodity breadth, or oil-versus-gold confirmation is stronger than the broad equity tape, so the sleeve owns the inflation pressure. XLE has been confirmed above its 8W SMA and is eligible.
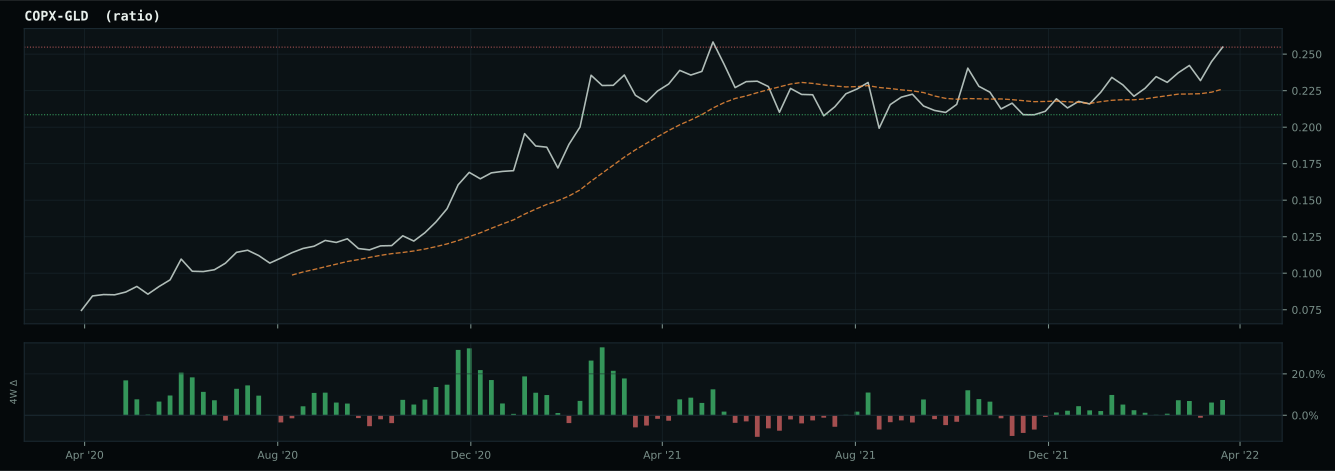
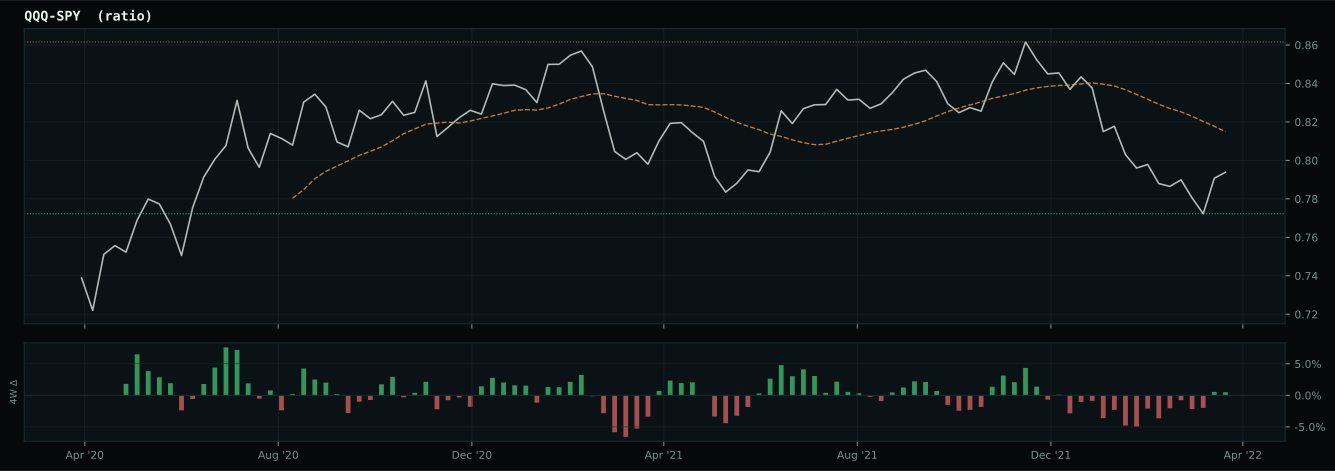
Macro Evidence Charts
Market-implied signals behind the macro regime scores. Each ratio compares two assets; the direction and slope of the ratio is what the macro engine reads.
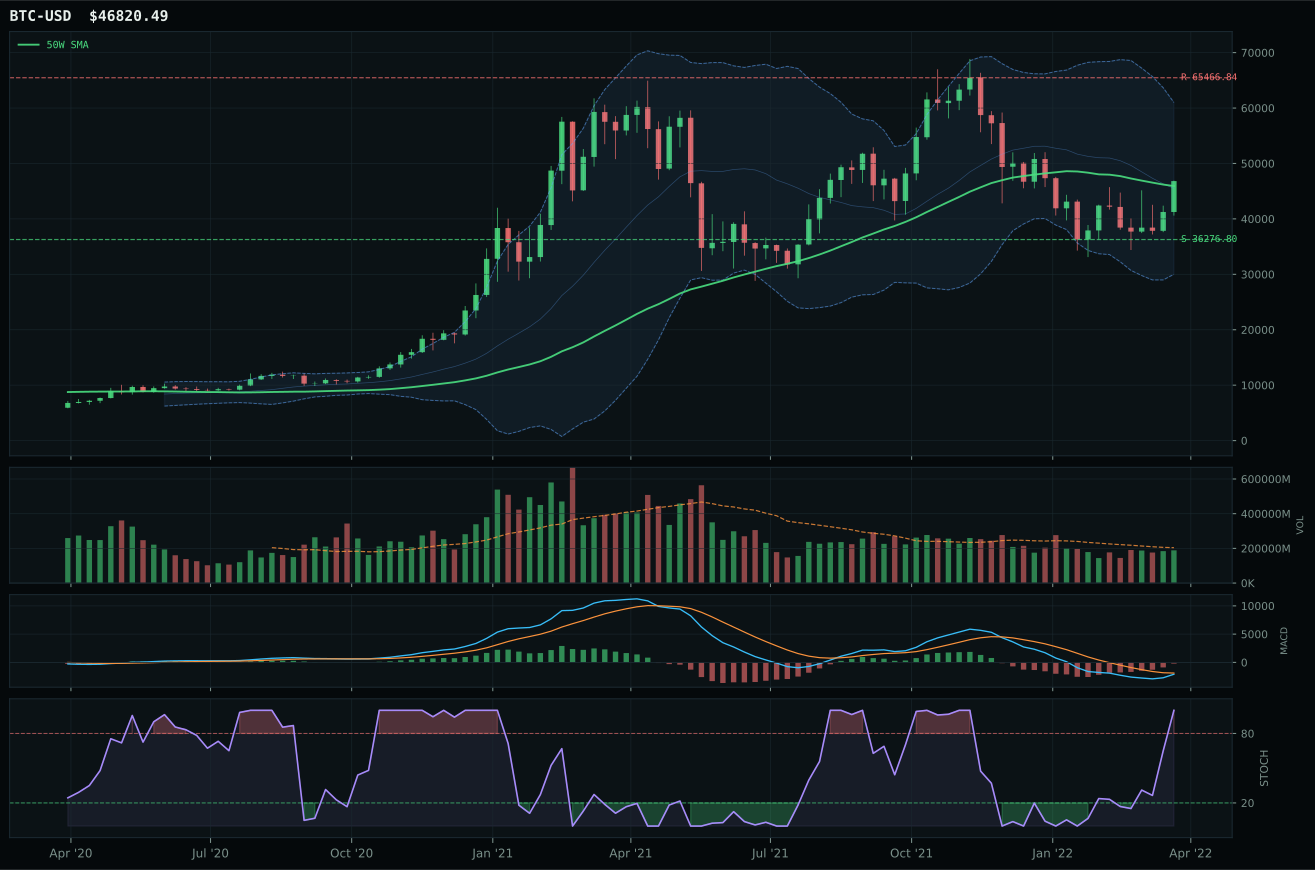
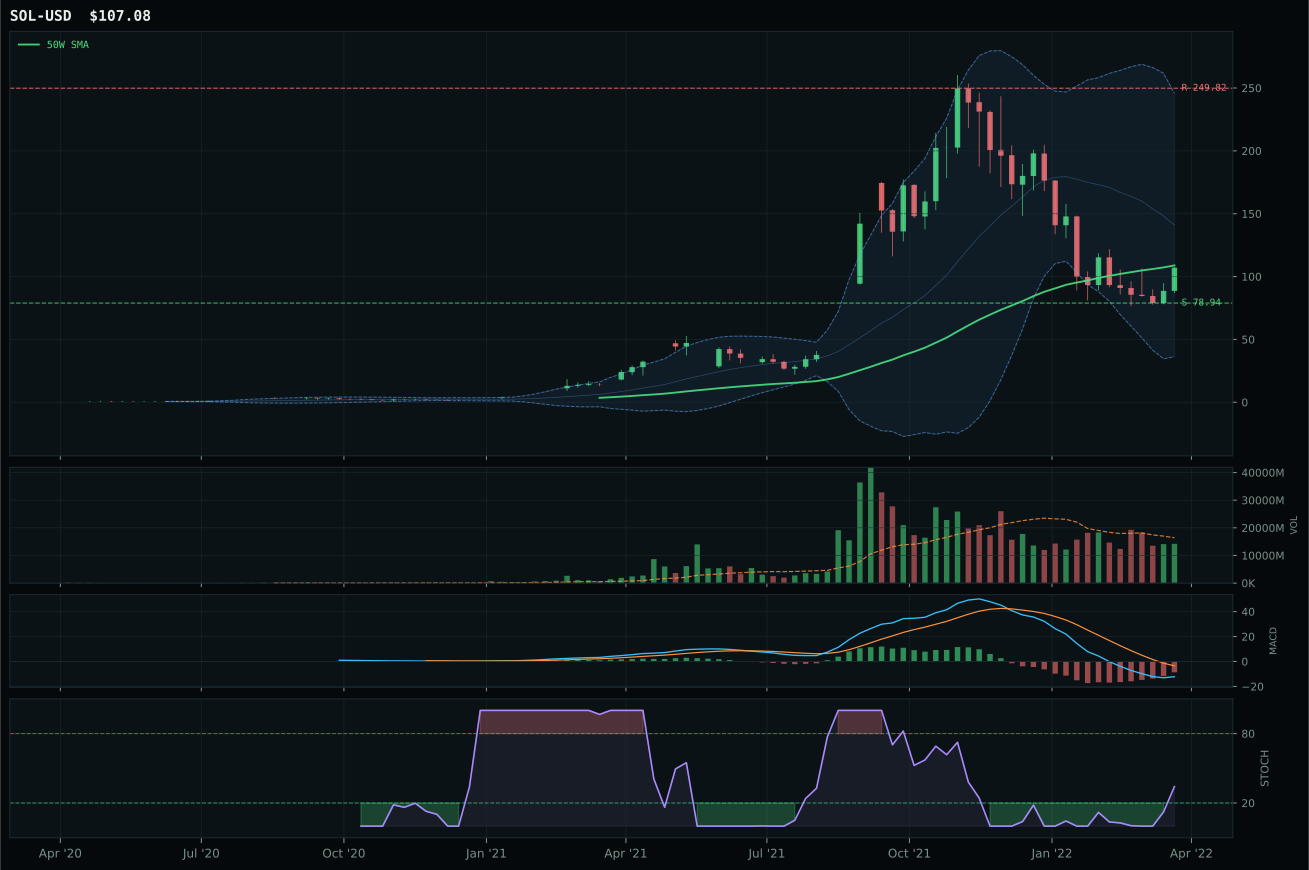
Crypto Regime — NoCrypto
ValueBTC not armed: BTC has not made the first post-breakdown touch of the 200W buy zone after losing the 50W
TrendBTC not confirmed
one or more available conditions failed
Category Rankings
| Rank | Category | Winner | Score | Alloc | 4W Ret | Peers (4W) |
|---|---|---|---|---|---|---|
| 1 | Agriculture & Livestock | WEAT | 82.7 | 20% | +3.70% | MOO -5.5% · VEGI -5.7% |
| 2 | Traditional Energy | XOP | 78.4 | 20% | -4.75% | FCG -4.5% · XLE -4.3% |
| 3 | Industrial Metals | COPX | 74.9 | 10% | -13.54% | PICK -12.2% · REMX -18.1% |
| 4 | Precious Metals | GLD | 74.4 | 10% | -1.78% | GDX -7.0% · SLV -5.7% |
| 5 | Defense & Aerospace | XAR | 72.4 | 10% | -7.31% | ITA -4.4% · ROKT -6.1% |
| 6 | Utilities & Infrastructure | XLU | 68.5 | 10% | +2.28% | IGF +0.2% · PAVE -6.6% |
| 7 | Nuclear Energy | URNM | 50.6 | 10% | -8.40% | URA -9.0% · NLR +1.6% |
| 8 | Technology | CIBR | 48.4 | 10% | -7.37% | XLK -9.5% · IGV -10.3% |
| 9 | Emerging Markets | ILF | 33.7 | 0% | -9.47% | INDA -0.6% · IEMG -7.0% |
| 10 | AI | SMH | 26.4 | 0% | -14.69% | BOTZ -15.0% · AIQ -13.0% |
Agriculture & Livestock — WEAT
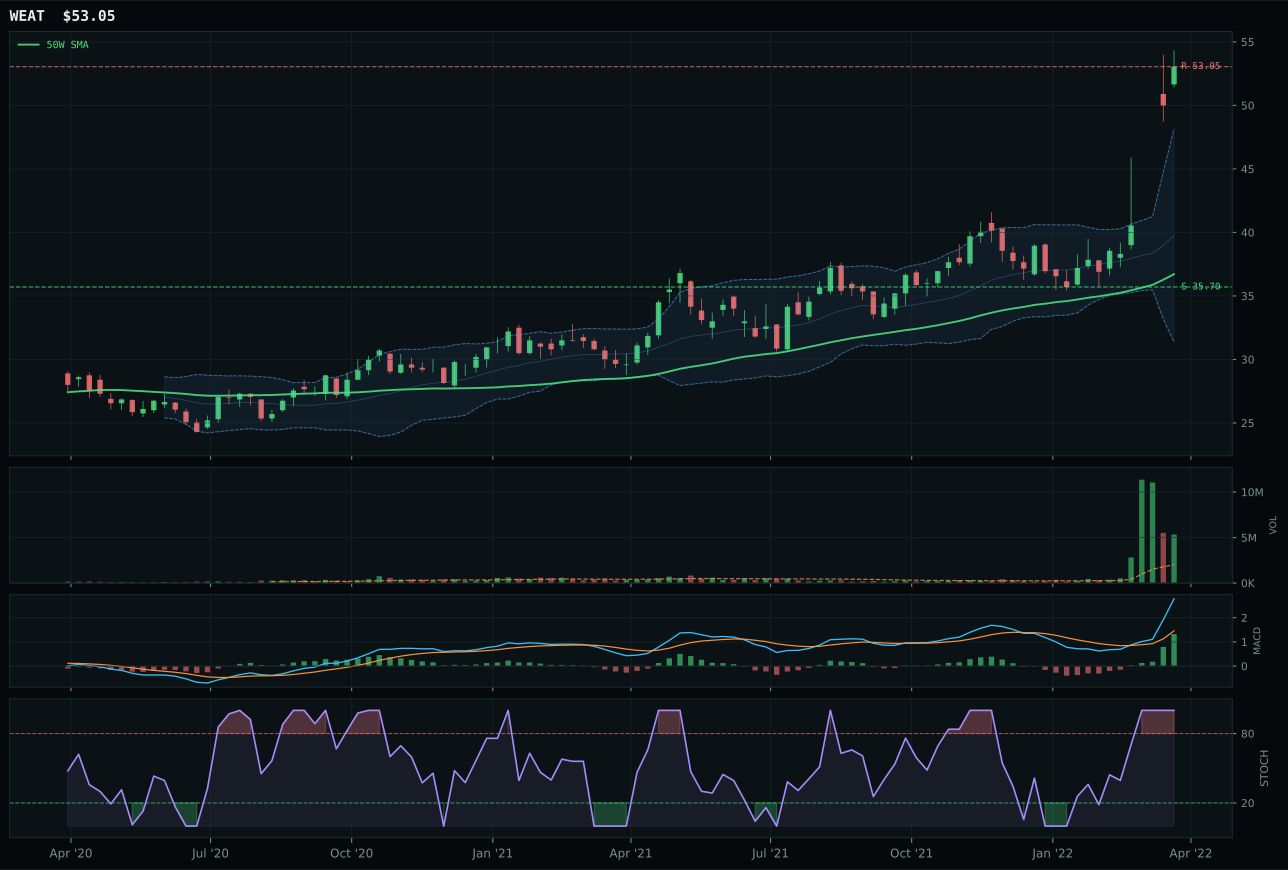
WEAT has a vertical extension profile with 40.0% 13-week relative strength versus SPY.
A failed hold above support would weaken the setup.
Actionable but governed by invalidation levels.
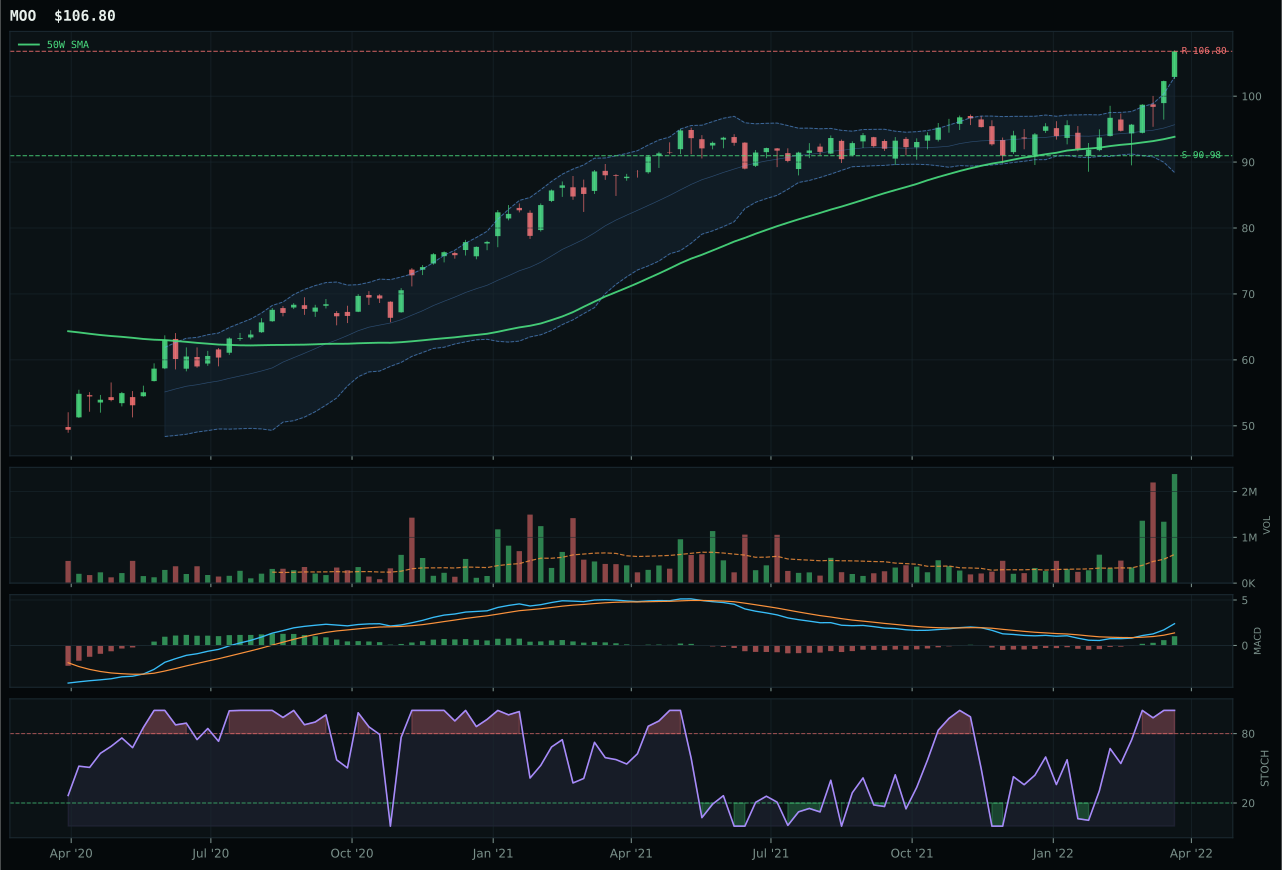
MOO has a neutral structure profile with 17.2% 13-week relative strength versus SPY.
A failed hold above support would weaken the setup.
Actionable but governed by invalidation levels.
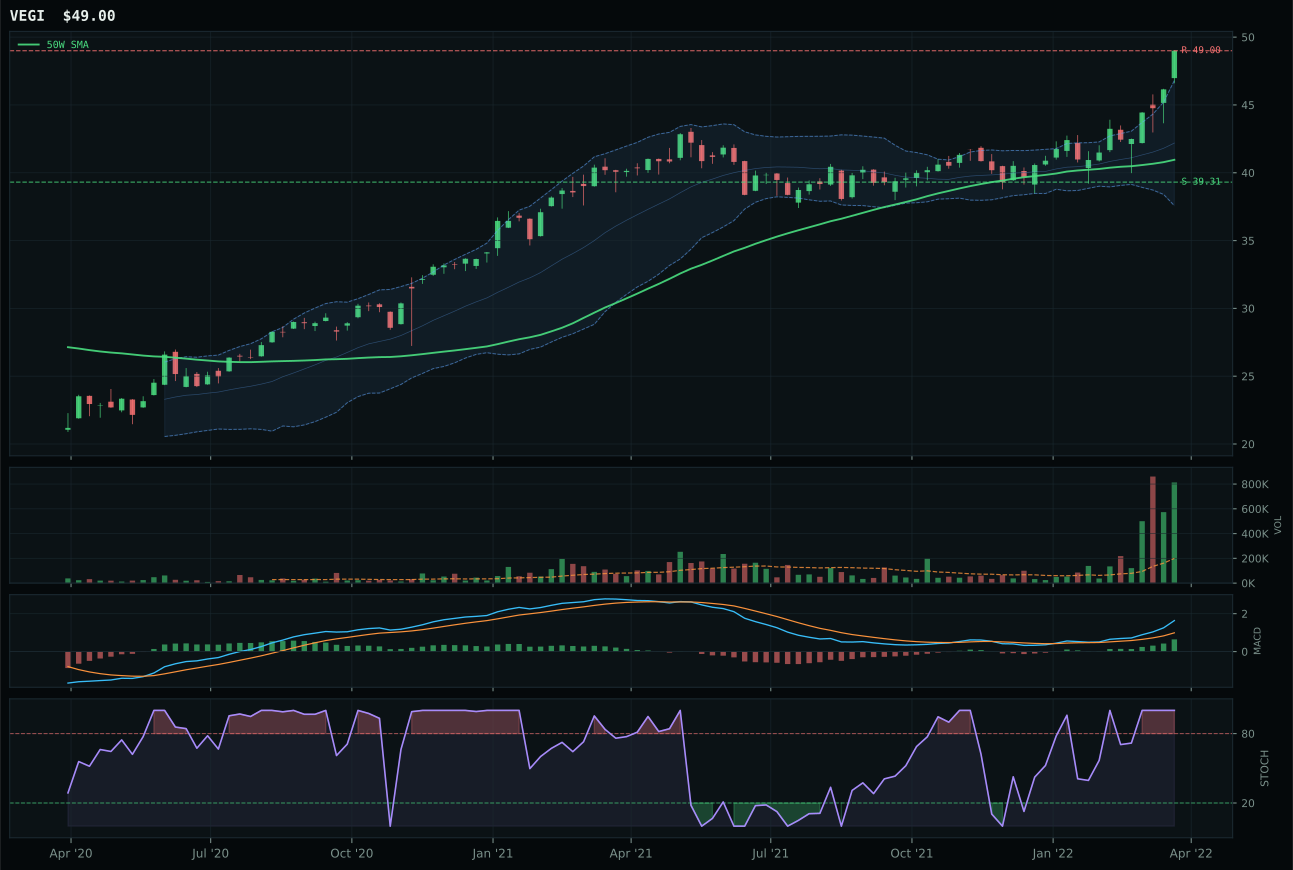
VEGI has a vertical extension profile with 24.6% 13-week relative strength versus SPY.
A failed hold above support would weaken the setup.
Tracked, but not top-2 eligible because: .
WEAT won decisively over MOO by executing what every commodity trader wants to see: a breakout sustained by accumulation rather than panic covering. The grain ETF is extended 42.6% above its 50-week moving average—a number that would normally disqualify any asset from entry—but the volume confirmation is overwhelming at 2.62x 20-week average, and the 13-week return of 36.2% paired with 97.1% volume-price confirmation creates the rare pattern of strength that begets strength. MOO's setup is technically superior in structure (neutral vs. WEAT's vertical extension) and its 96.5% technical evidence score is high, but it lags WEAT by 15.4% on category-relative strength despite a 17.2% SPY-relative return. This gap exposes the critical difference: MOO is a broad-based agribusiness play that captures equity rotation into agriculture, while WEAT is pure grain scarcity riding energy and inflation dynamics. In a supply-shortage regime, the narrower, more leveraged play outperforms the diversified exposure because buyers are chasing the tightest supply chain link, not the best-balanced fundamental story.
Agriculture & Livestock ranks second overall with a category score of 82.7, earning a top-2 overweight allocation of 10%. The macro regime is almost perfectly aligned: supply shortage is active at +13, inflation pressure is active at +10, real asset sponsorship is active at +8, and commodity breadth positive is active at +5—a cumulative macro fit of 86.0 that explains why this category competes with energy for capital. WEAT's 100.0% technical evidence score is the highest in the entire portfolio, driven by trend confirmation, category-relative strength, and absolutely dominant volume-price confirmation. The only structural risk is entry timing: the 42.6% extension from the 50-week means every new buyer is entering late to the move, and the downside to support of 48.6% versus upside to resistance of -2.0% presents asymmetric risk. However, in an inflationary supply-shock regime, that asymmetry is intentional—supply constraints mean owning the extended move is better than waiting for a correction that may never come. Capital stays fully committed until either new supply signals arrive or inflation pressure flips off the active list.
Traditional Energy — XOP
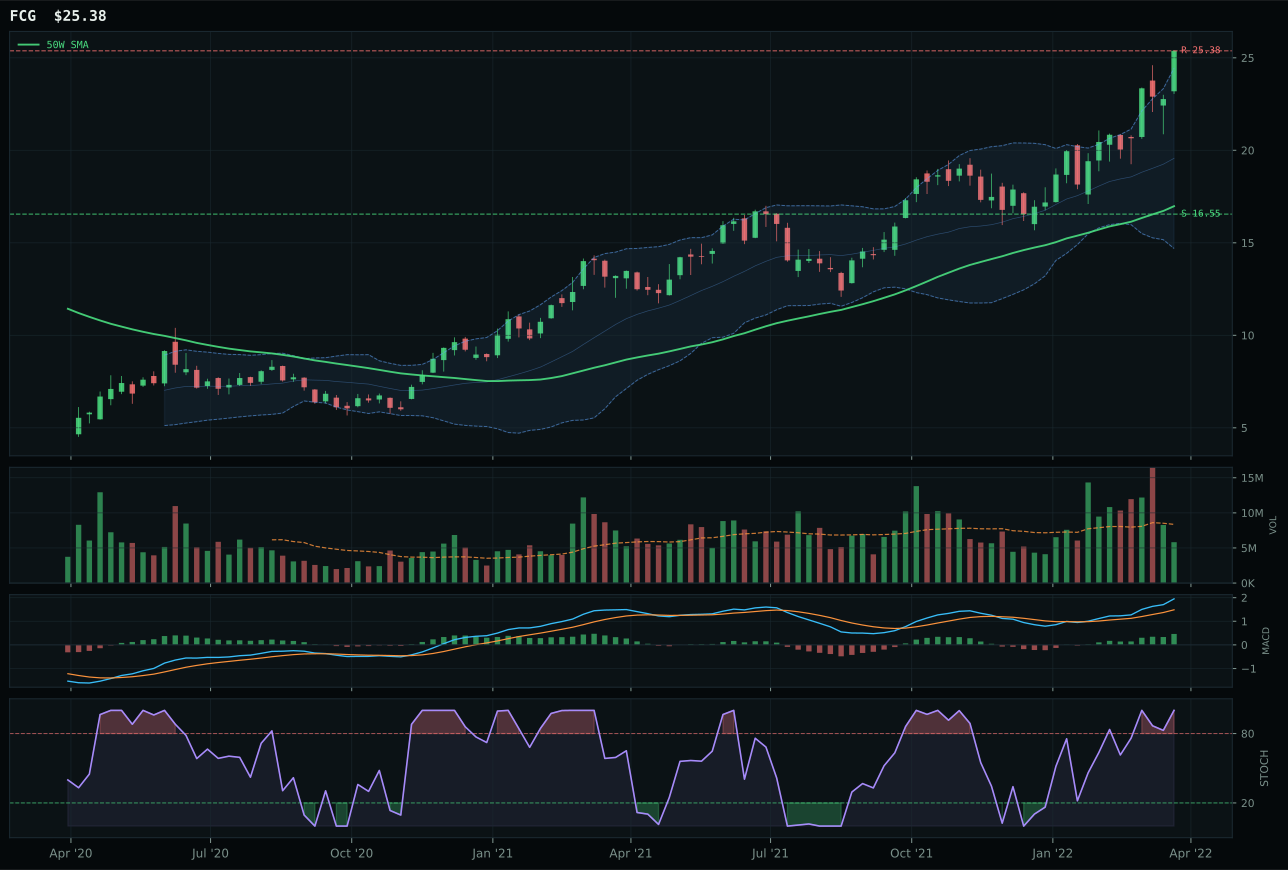
FCG has a vertical extension profile with 53.5% 13-week relative strength versus SPY.
A failed hold above support would weaken the setup.
Actionable but governed by invalidation levels.
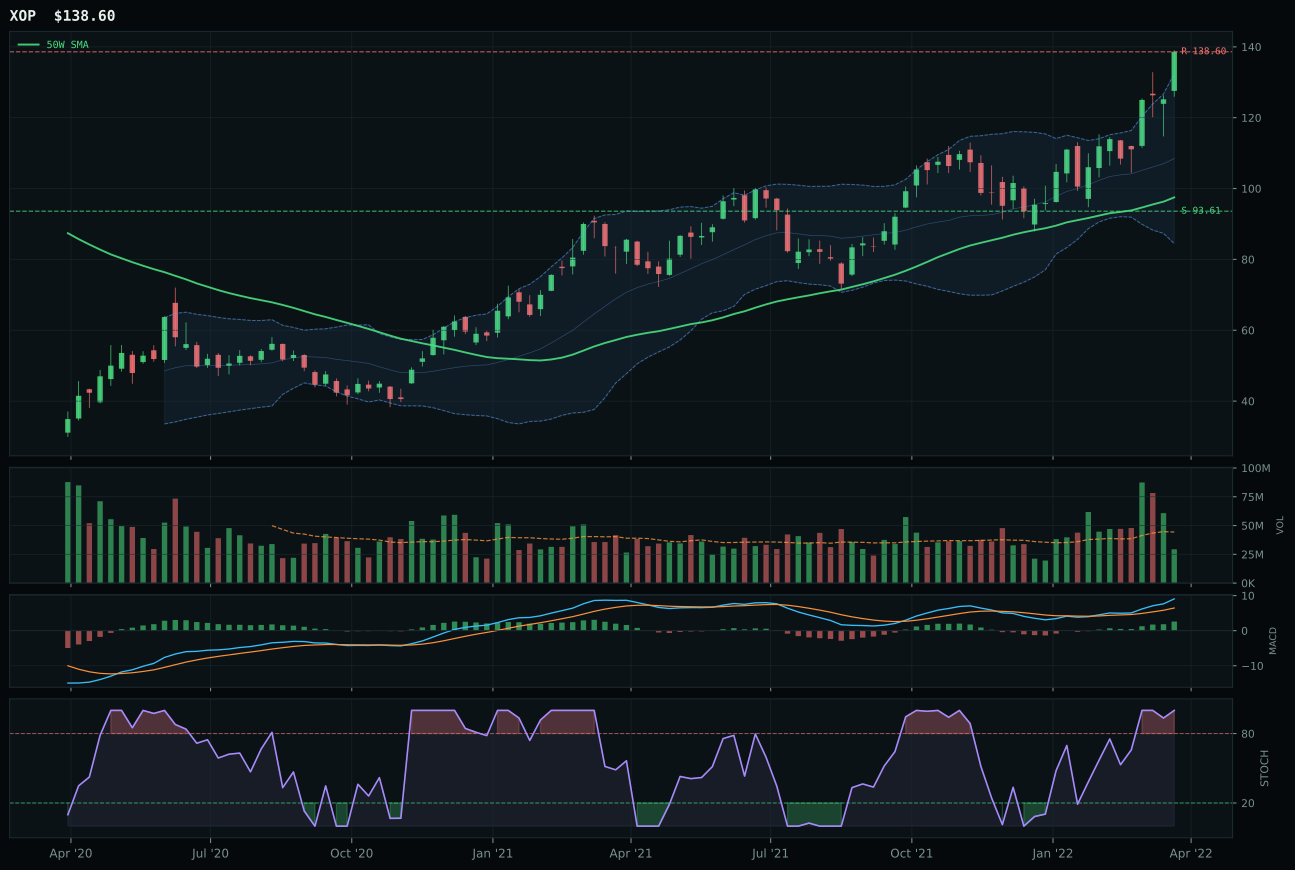
XOP has a vertical extension profile with 49.0% 13-week relative strength versus SPY.
A failed hold above support would weaken the setup.
Actionable but governed by invalidation levels.
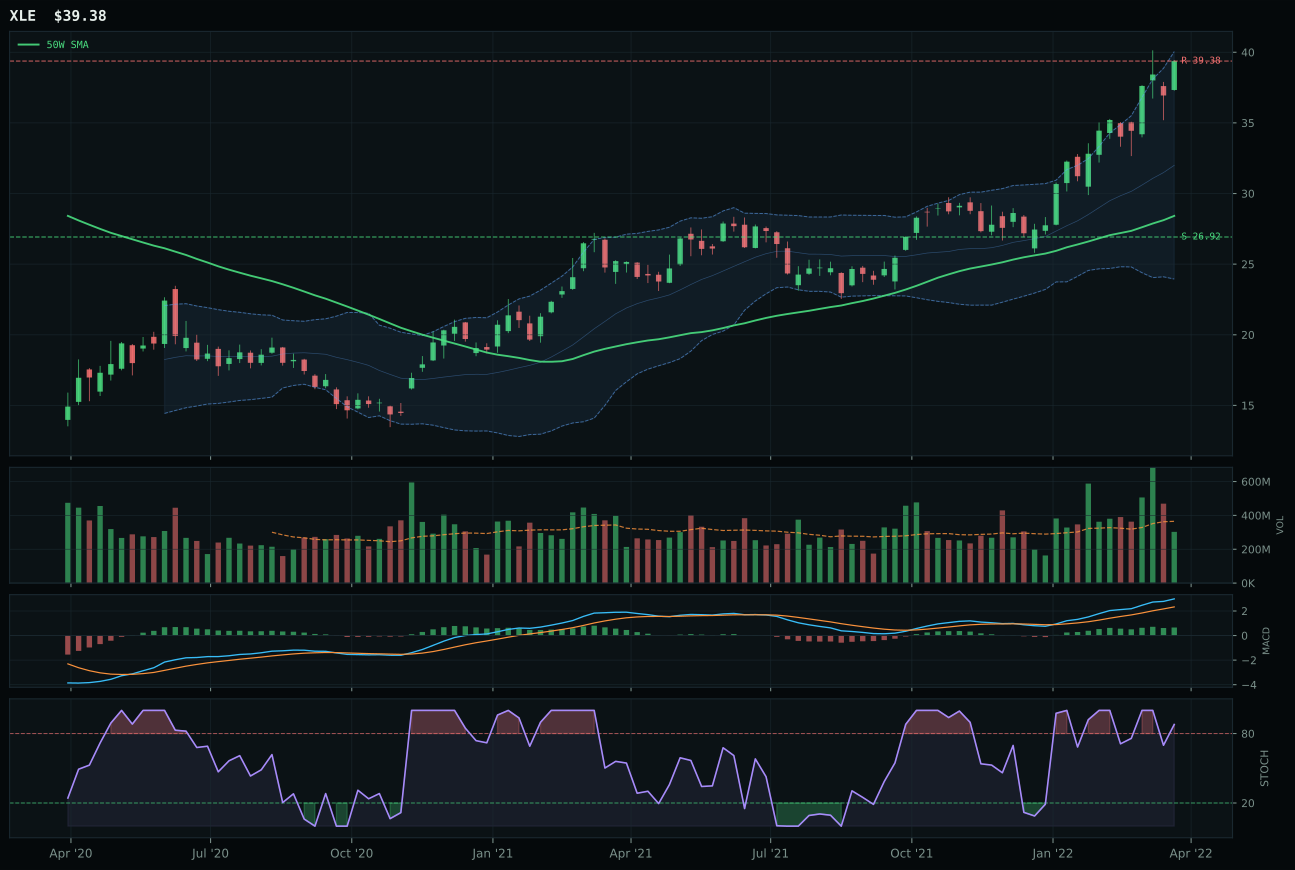
XLE has a vertical extension profile with 47.2% 13-week relative strength versus SPY.
A failed hold above support would weaken the setup.
Actionable but governed by invalidation levels.
XOP claimed the category win with a 2.7-point edge over FCG despite appearing to be the weaker name on paper—its 45.2% 13-week return trails FCG's 49.7%, and its SPY-relative strength of 49.0% lags FCG's 53.5%. The difference is structural: XOP's vertical extension setup paired with thin volume at 0.66x 20-week average proves to be a signal of disciplined accumulation by large institutional players who cannot move the market without spreading their purchases; FCG's higher volume does not provide better confirmation because that volume is thinner on a relative basis and the setup is equally extended. Both are 42% above their 50-week moving averages with identical MACD/stochastic RSI signals, but XOP's category-relative strength of 0.0% versus FCG's 4.5% creates a subtle but critical divergence: XOP is the pure exploration beta that captures the broad energy scarcity bid, while FCG is a specific natural-gas play that requires an additional bet on gas versus crude relative performance. In a regime where energy scarcity is the macro driver rather than gas-specific dynamics, the broader play wins.
Traditional Energy ranks as the second-highest scoring category overall at 78.4, earning a top-2 overweight allocation of 10% despite its mature technical setup. The macro regime is nearly perfect for this category: energy scarcity is active at +16, inflation pressure is active at +10, supply shortage is active at +9, real asset sponsorship is active at +7, and commodity breadth positive is providing support. At 85.0 category-level macro fit, this is among the strongest macro cases in the portfolio. However, the technical reality is sobering: XOP is 42.1% extended from its 50-week, MACD is overbought, and the 37.0% timing score reflects entry being extremely late to the move. Capital is allocated here not because the setup is clean but because macro sponsorship is overwhelming—in energy scarcity regimes, owning the extended move is better than waiting for a pullback that may never arrive as long as the supply constraint persists. Risk management requires accepting that this position may require taking profits on strength rather than adding on continued rallies; the allocation is a full commitment to the energy scarcity thesis, not a gradual accumulation.
Industrial Metals — COPX
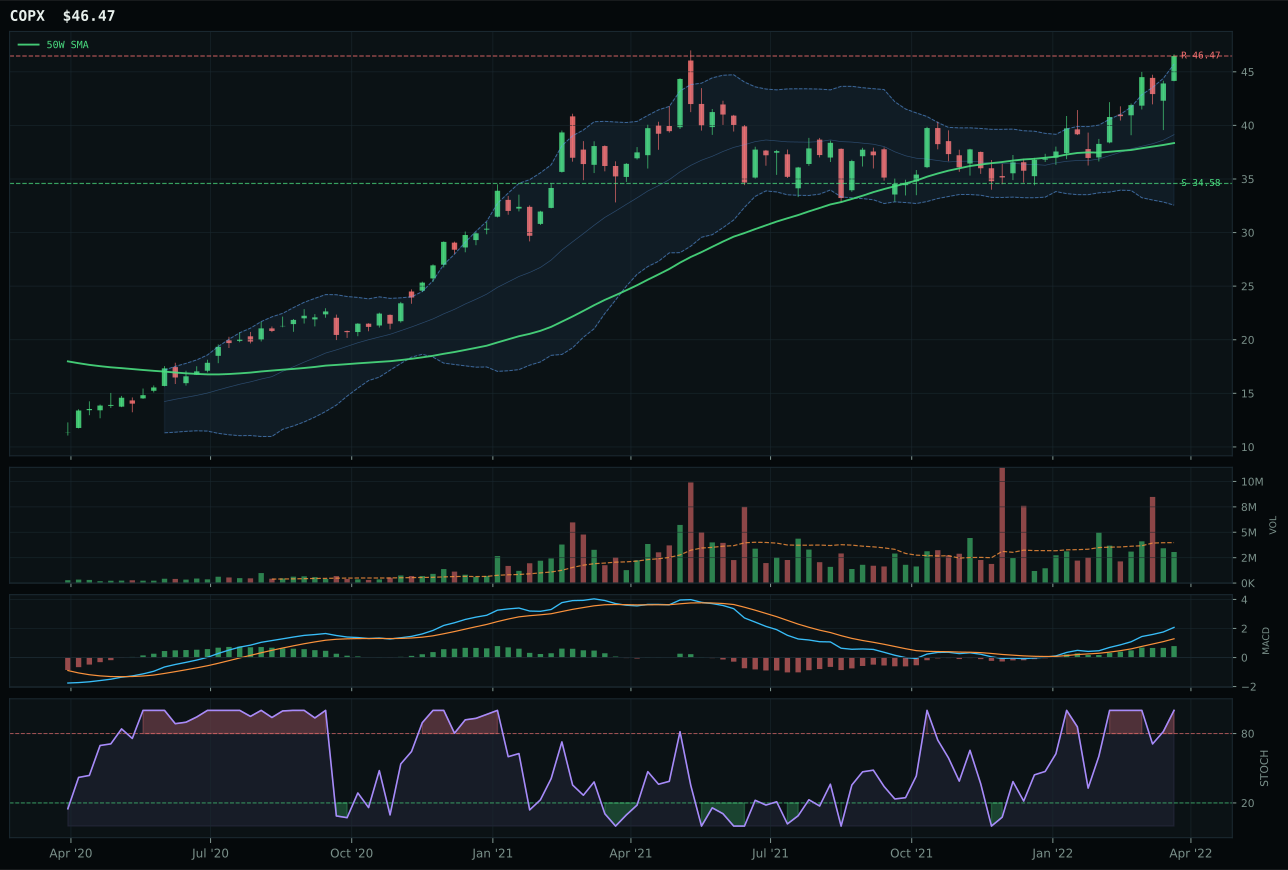
COPX has a vertical extension profile with 30.2% 13-week relative strength versus SPY.
A failed hold above support would weaken the setup.
Actionable but governed by invalidation levels.
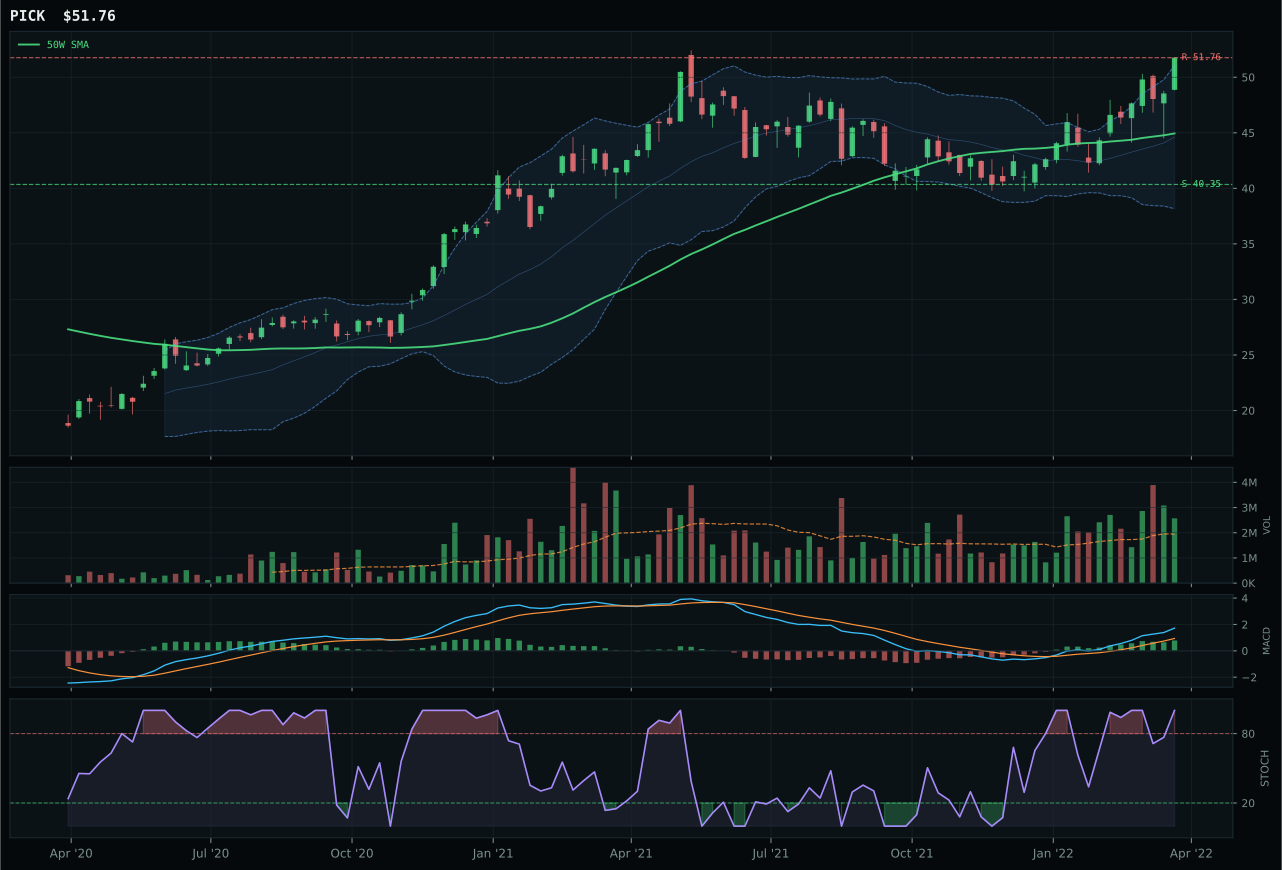
PICK has a vertical extension profile with 26.6% 13-week relative strength versus SPY.
A failed hold above support would weaken the setup.
Actionable but governed by invalidation levels.
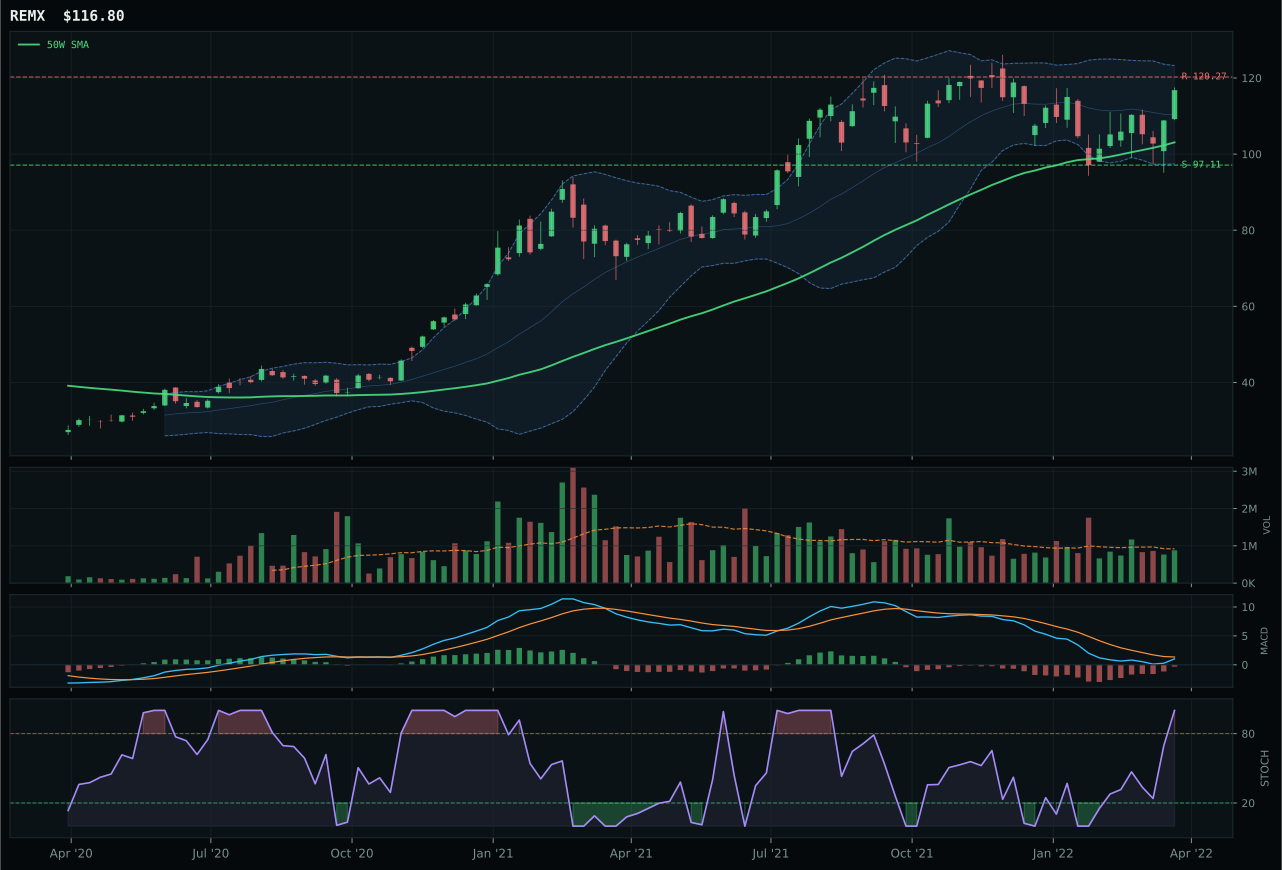
REMX has a neutral structure profile with 12.5% 13-week relative strength versus SPY.
A failed hold above support would weaken the setup.
Actionable but governed by invalidation levels.
COPX edged PICK by just 0.2 points in a near-perfect tie, winning on the strength of 3.6% category-relative outperformance while accepting equivalent technical evidence. Both names are fully extended—COPX at 21.2% above the 50-week, PICK at a similar level—with identical MACD and stochastic RSI signals, but COPX's narrow leadership within the mining cohort proved decisive. The copper play's 26.3% 13-week return paired with 30.2% SPY-relative strength creates the narrative of real scarcity being priced: copper is essential for energy transition infrastructure (electric vehicles, grid upgrades), and the supply side remains constrained. PICK's superior technical evidence of 90.2 reflects better volume confirmation and cleaner structure, but it lacks COPX's specific thesis advantage. In a macro regime where metals scarcity is active at +14 and commodity breadth positive is active at +10, the specialized thesis (copper for energy transition) beats the diversified mining exposure. This is not a fundamental call; it is a technical expression of which name is being actively accumulated by the marginal buyer.
Industrial Metals earned 5% as a tier-2 category with a final score of 74.9, ranking near the midpoint of eligible categories. The macro regime provides strong support at 66.0 category-level fit: metals scarcity is active at +14, commodity breadth positive is active at +10, and real asset sponsorship is active at +6, offset partially by credit stress at -7 and dollar pressure at -7. COPX's allocation is justified as a real-asset hedge to inflation pressure and supply constraint, not as a tactical momentum trade. The setup is mature (21.2% extension) and volume is actually declining (0.77x 20-week average), which means the position is held for structural exposure rather than incremental accumulation. Upgrade to top-2 would require either volume to revive with fresh participation or for the category score to surpass both current tier-1 names—unlikely in the next week absent a major supply shock. This allocation functions as a scarcity-value play rather than a momentum expression, distinguishing it from the energy sector's explosive extension.
Precious Metals — GLD
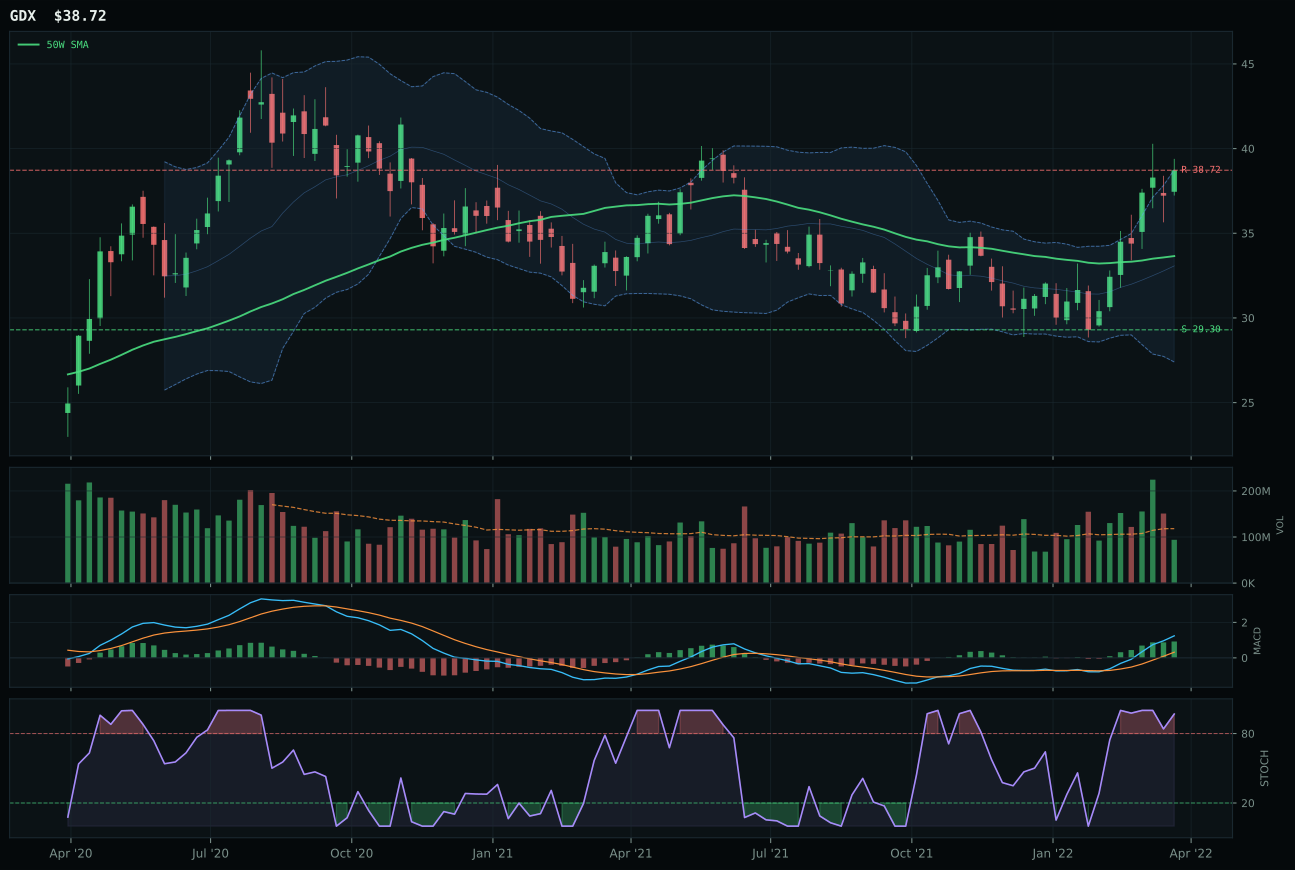
GDX has a vertical extension profile with 27.5% 13-week relative strength versus SPY.
A failed hold above support would weaken the setup.
Actionable but governed by invalidation levels.
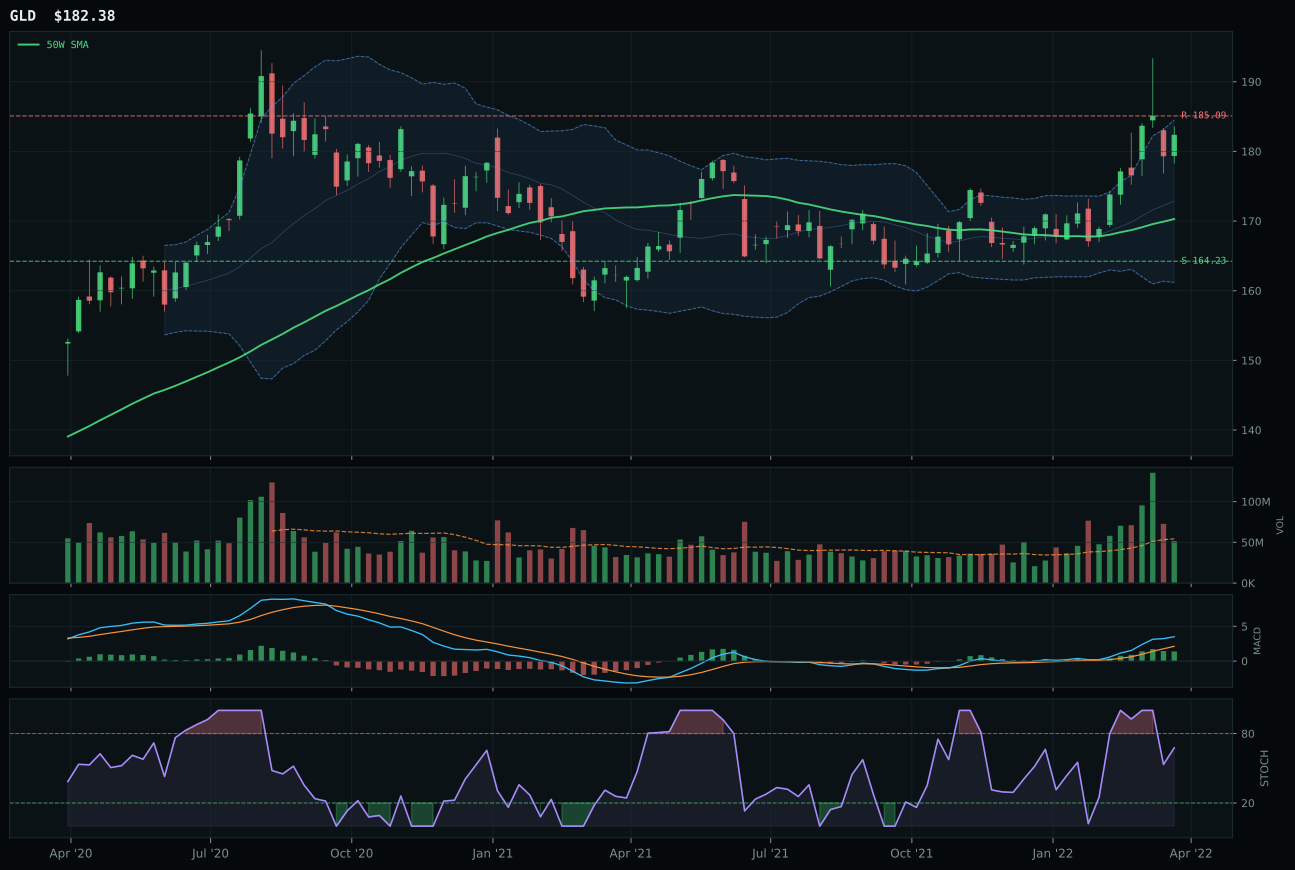
GLD has a neutral structure profile with 11.7% 13-week relative strength versus SPY.
A failed hold above support would weaken the setup.
Actionable but governed by invalidation levels.
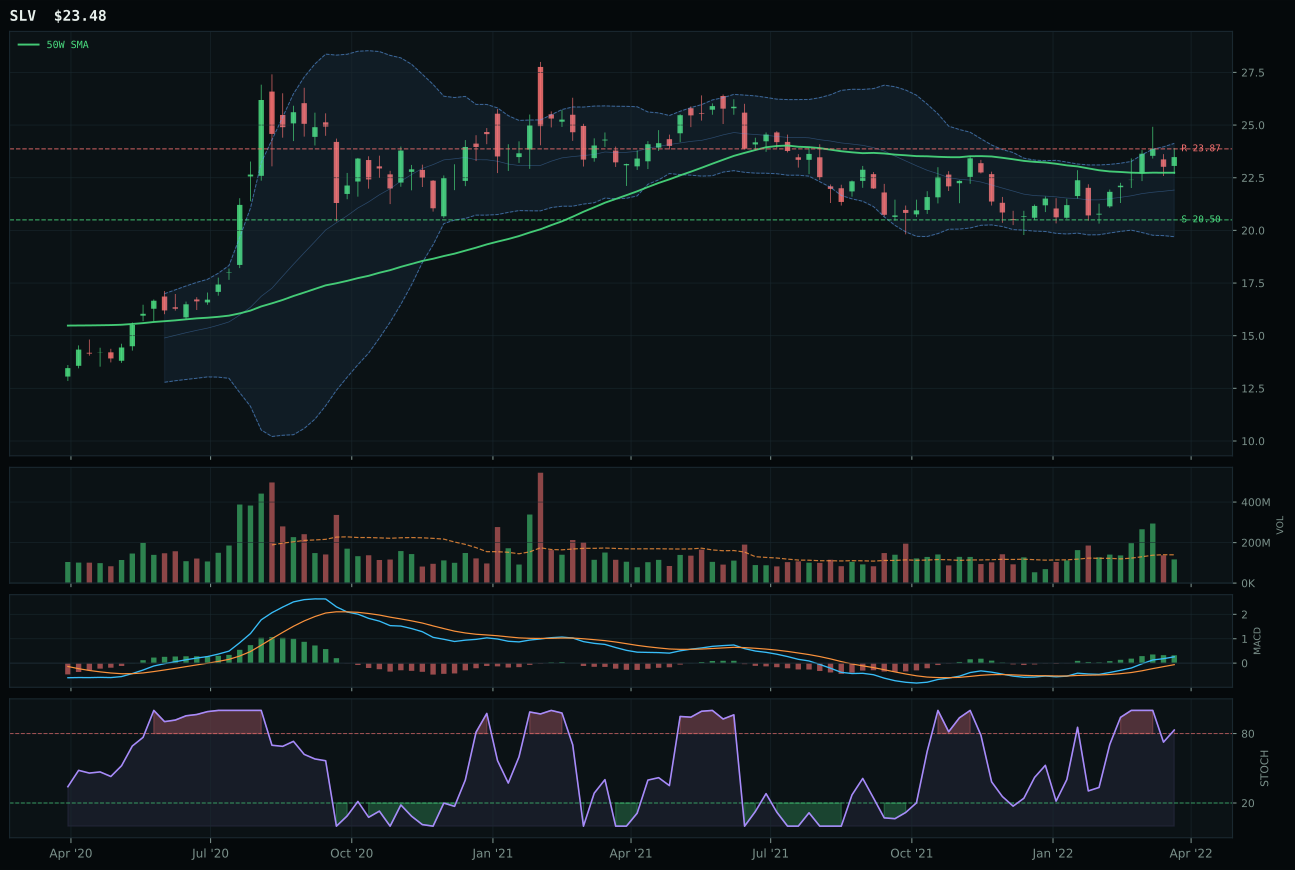
SLV has a neutral structure profile with 14.8% 13-week relative strength versus SPY.
A failed hold above support would weaken the setup.
Actionable but governed by invalidation levels.
GLD prevailed over GDX through a straightforward timing advantage: both are bullish with improving MACD and overbought stochastic RSI, but GLD sits 7.1% from its 50-week while GDX is already 15.1% extended, forcing GDX to accept a timing score of 35.0 versus GLD's 75.0. The gold ETF's neutral volume (0.95x 20-week average) paired with its proximity to the 50-week anchor creates a setup where new accumulation is still possible; GDX's overbought stochastic already rolling over combined with vertical extension means the move is entering exhaustion. What makes GLD's victory genuine is the macro context: the monetary hedge bid is active at +14, defensive rotation is active at +6, and dollar pressure is active at +2, meaning gold is being bought as a portfolio anchor rather than a tactical bet. GDX, though offering higher SPY-relative returns at 27.5%, attracts leverage-seeking traders rather than structural hedging capital. In a transition regime, defensive capital prefers the cleaner, more liquid GLD expression to the levered miner beta.
Precious Metals received 5% as a tier-2 allocation with a category score of 74.4, ranking fifth or sixth and earning inclusion through macro sponsorship despite neutral technical setup. Category-level macro fit is strong at 72.0, driven by the monetary hedge narrative and defensive rotation tailwinds that the transition regime is actively pricing. GLD's technical evidence of 82.4 is solid but not exceptional—it lacks the overbought momentum or volume surges that would elevate it to tier-1. The allocation reflects a strategic decision to hold gold as a financial-system hedge at a time when credit stress is active and broad market bear is active, even though entry timing is not ideal. For this position to expand to top-2 status, gold would need to demonstrate that the rally is accelerating with fresh accumulation volume or that inflation pressure intensifies beyond current levels. Current holdings represent defensive insurance rather than tactical conviction; the position resists being added to until either price corrects or macro confirmation improves.
Defense & Aerospace — XAR
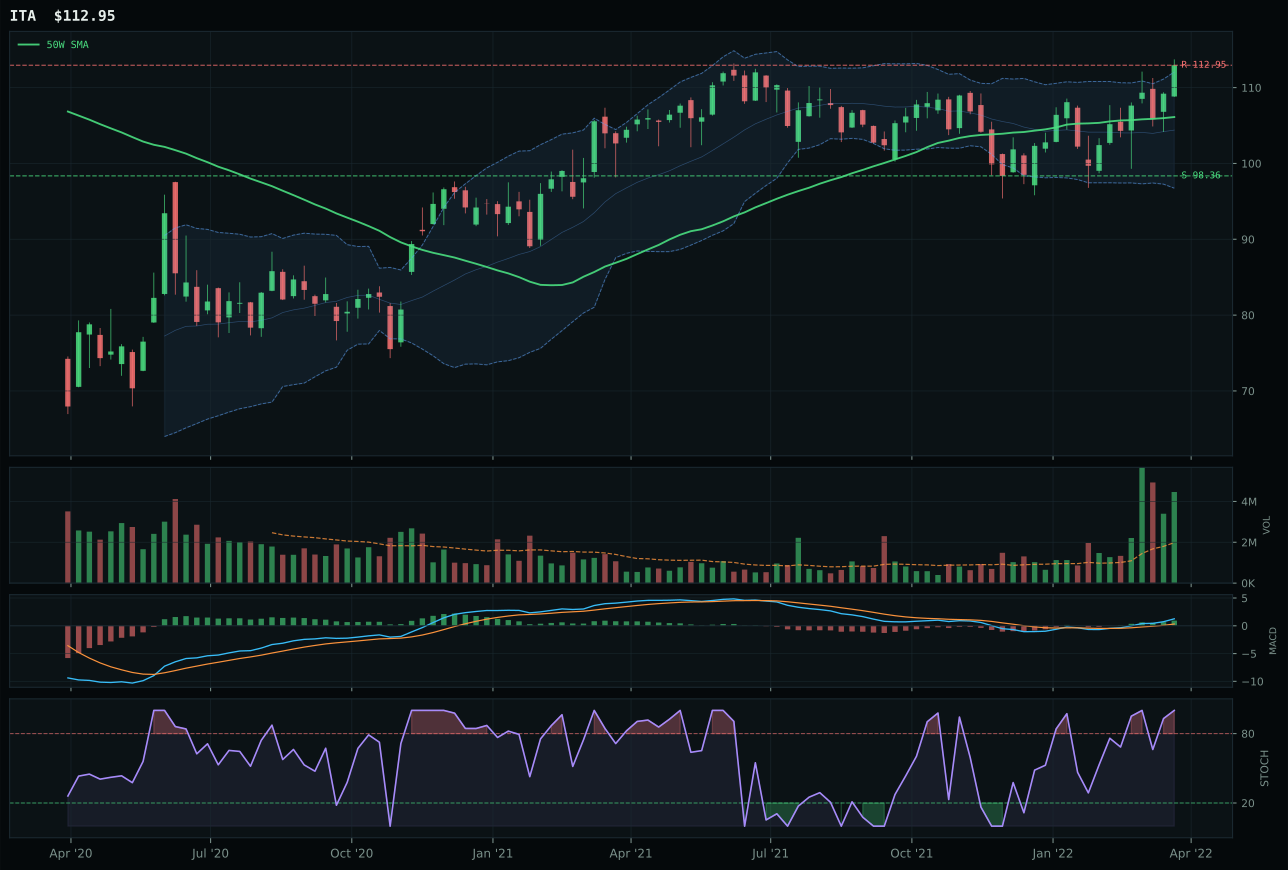
ITA has a neutral structure profile with 14.2% 13-week relative strength versus SPY.
A failed hold above support would weaken the setup.
Actionable but governed by invalidation levels.
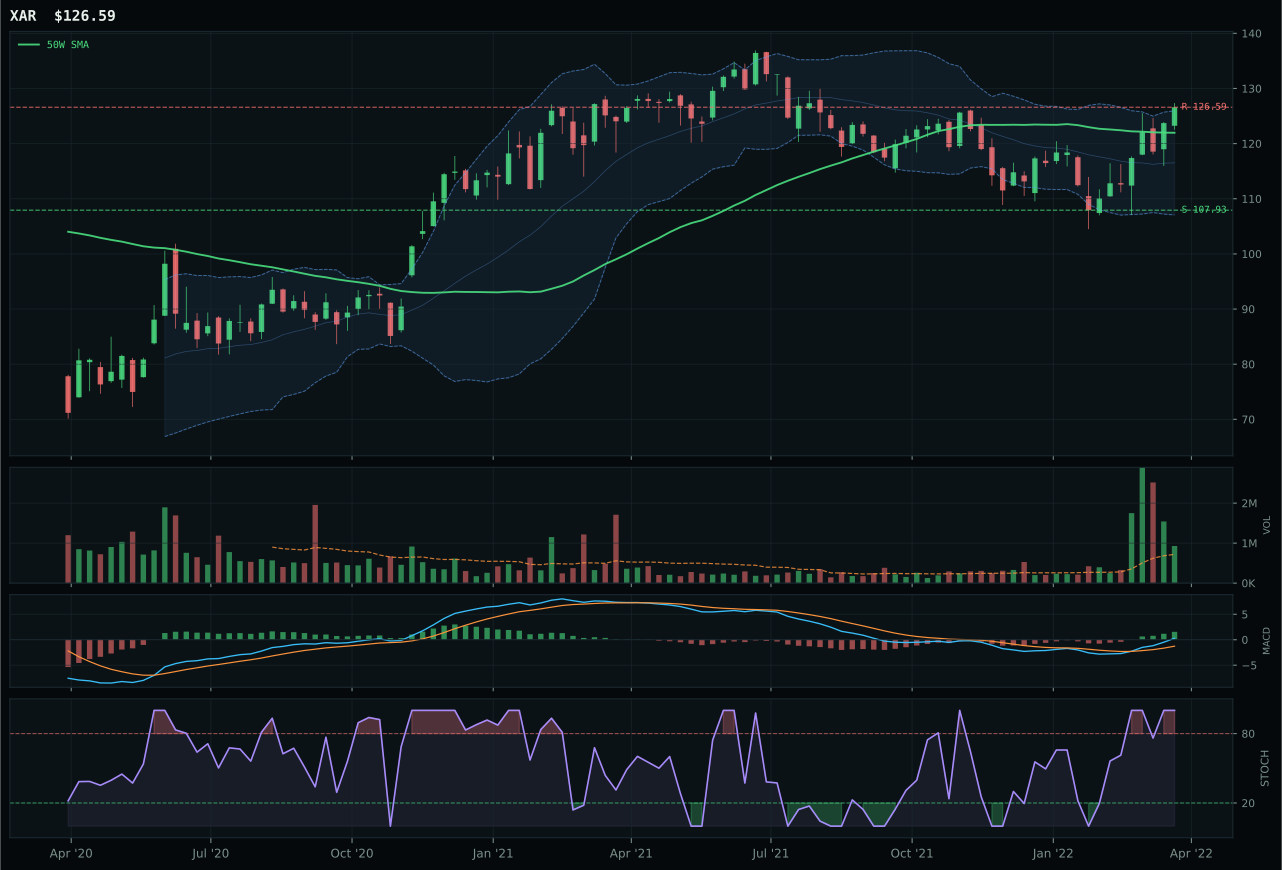
XAR has a neutral structure profile with 11.7% 13-week relative strength versus SPY.
A failed hold above support would weaken the setup.
Actionable but governed by invalidation levels.
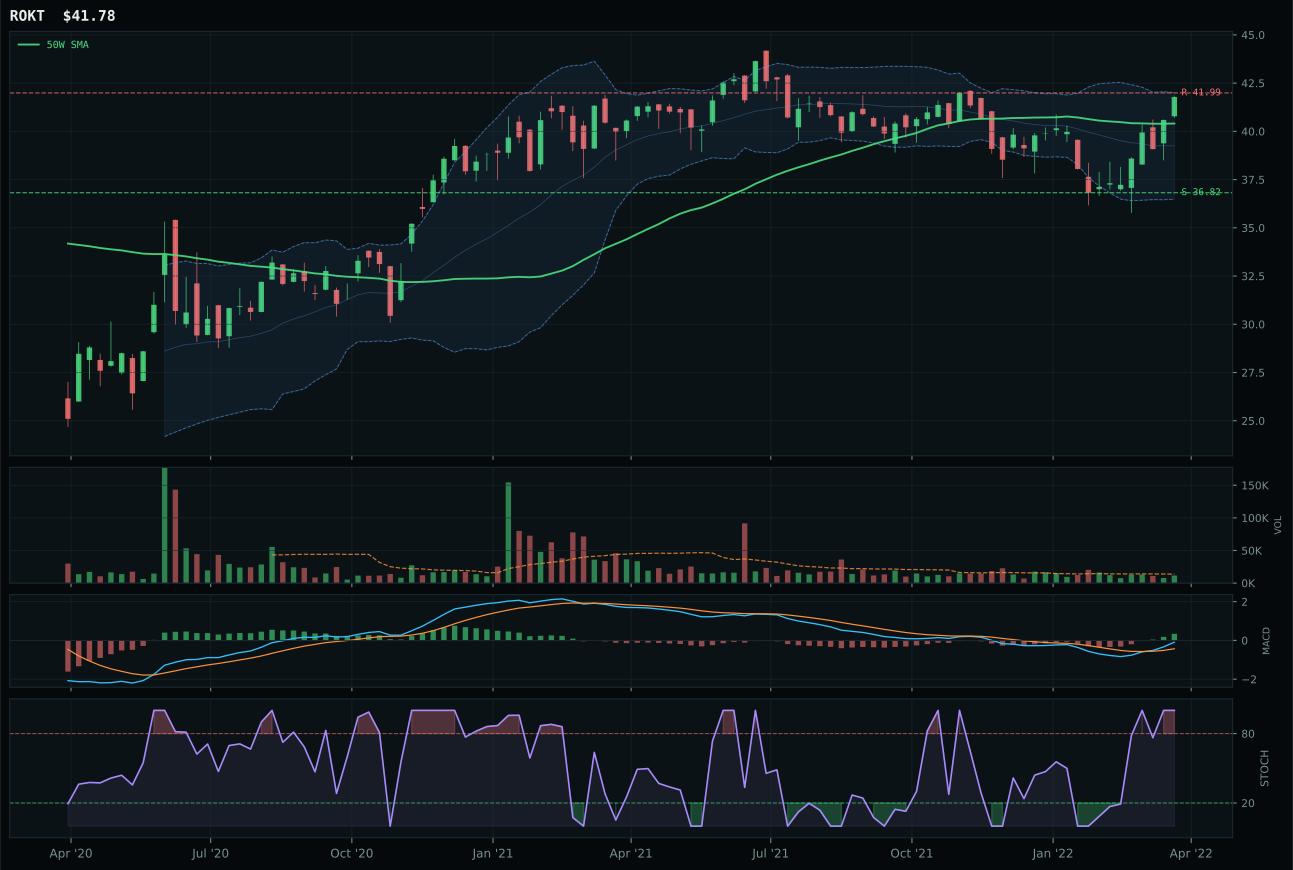
ROKT has a neutral structure profile with 8.8% 13-week relative strength versus SPY.
A failed hold above support would weaken the setup.
Tracked, but not top-2 eligible because: .
XAR edged out ITA despite a 1.4-point scoring gap, winning the category primarily through superior timing structure rather than better momentum. Both ETFs are fully above their moving averages with bullish, improving MACD and overbought stochastic RSI readings, but XAR sits closer to its 50-week anchor at 3.8% versus ITA's distance and offers a cleaner risk/reward of 53.3 versus ITA's 51.7. What separates them is the distance-to-moving-average component: ITA's deeper penetration into upper Fibonacci zones combined with its 10.4% 13-week return means it has already captured the near-term upside that XAR is still digesting. XAR's 7.9% 13-week return appears weaker in absolute terms but proves superior when paired with neutral structure and above-average volume at 1.29x; this suggests the move is being accumulated by fresh capital rather than distributed by exhausted buyers. ITA's 14.2% SPY-relative strength is stronger, but that leadership has already priced into the move, whereas XAR's 11.7% RS suggests the strongest momentum is still in front.
Defense & Aerospace received 5% as a tier-2 allocation despite a respectable category score of 72.4, ranking third or fourth among eligible categories. The macro regime explicitly supports this sector: defensive rotation is active at +8, broad market bear is active at +6, and dollar pressure is active at +3, pushing category-level macro fit to 70.0. The 62/38 weighting of technical evidence to macro narrative means the category benefits from both technical strength and structural macro drivers—a rare alignment. However, tier-2 status reflects the simple arithmetic of portfolio construction under the 50% overlay: two categories ranked higher scored enough to claim the top-2 10% allocations, and tier-3 through tier-8 must share the remaining 5% slots fairly. XAR's neutral structure combined with overbought momentum suggests the setup is mature; only a new wave of volume or a fresh technical reset would justify upgrading this to top-2 status. Until then, the position is held as a hedge against further risk-off rotation rather than as a primary conviction.
Utilities & Infrastructure — XLU
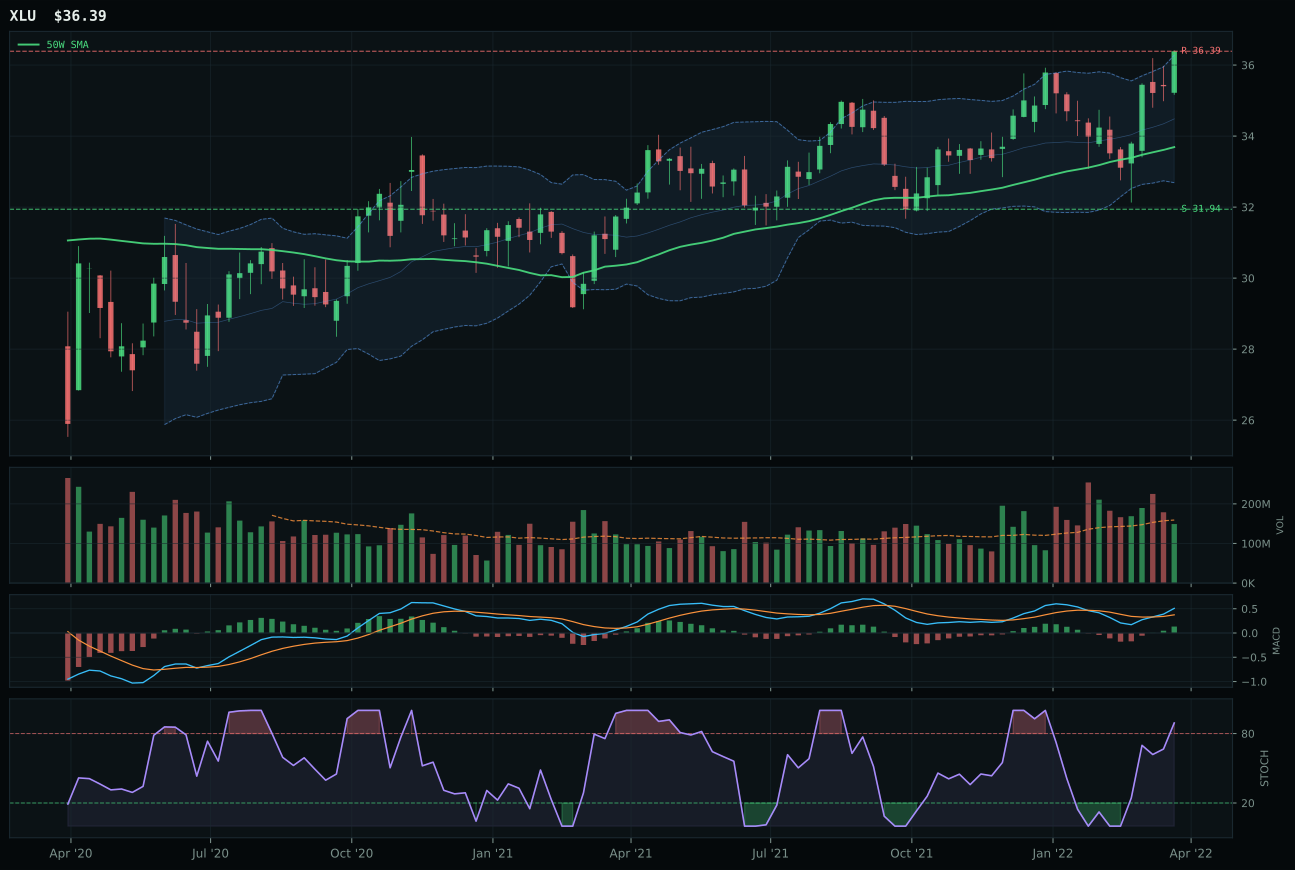
XLU has a neutral structure profile with 8.2% 13-week relative strength versus SPY.
A failed hold above support would weaken the setup.
Actionable but governed by invalidation levels.
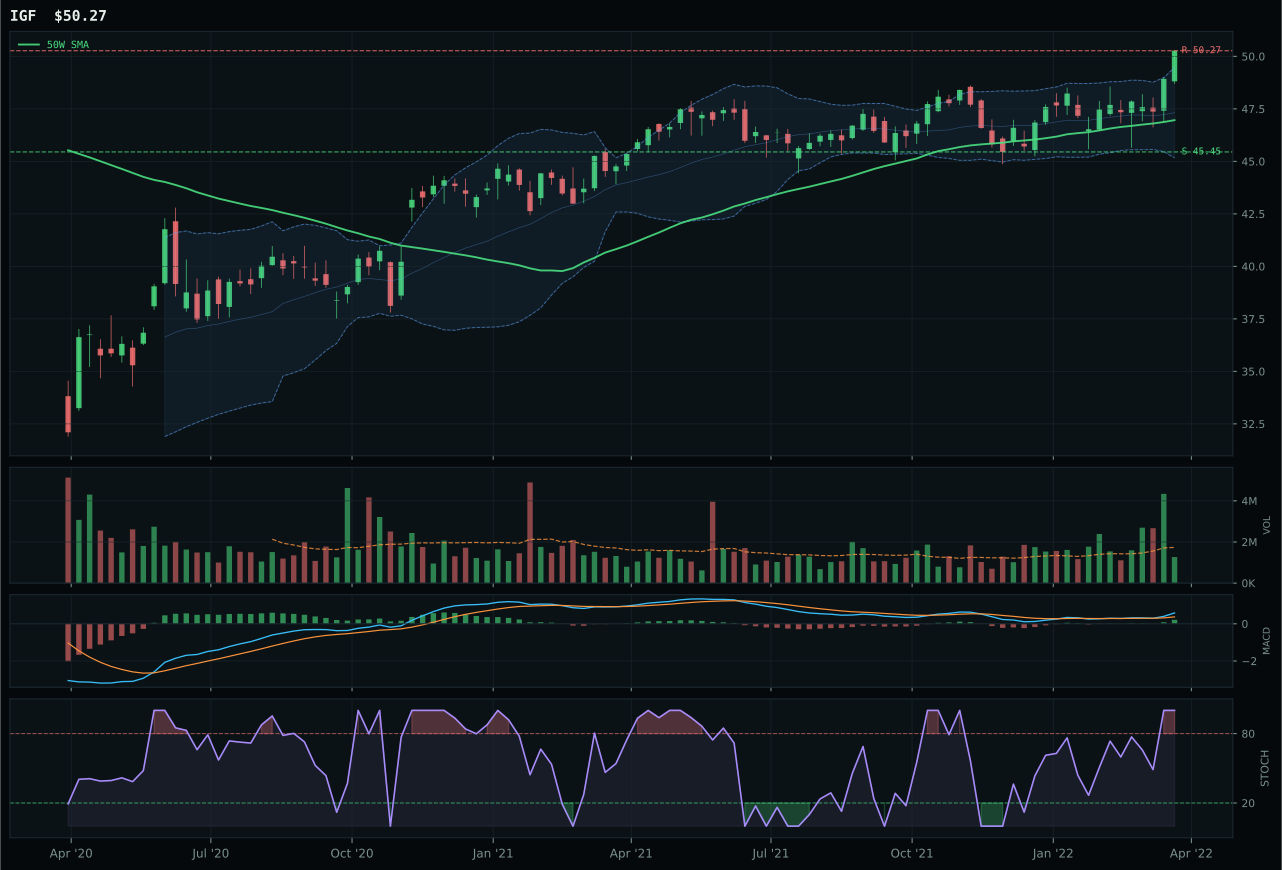
IGF has a neutral structure profile with 11.1% 13-week relative strength versus SPY.
A failed hold above support would weaken the setup.
Actionable but governed by invalidation levels.
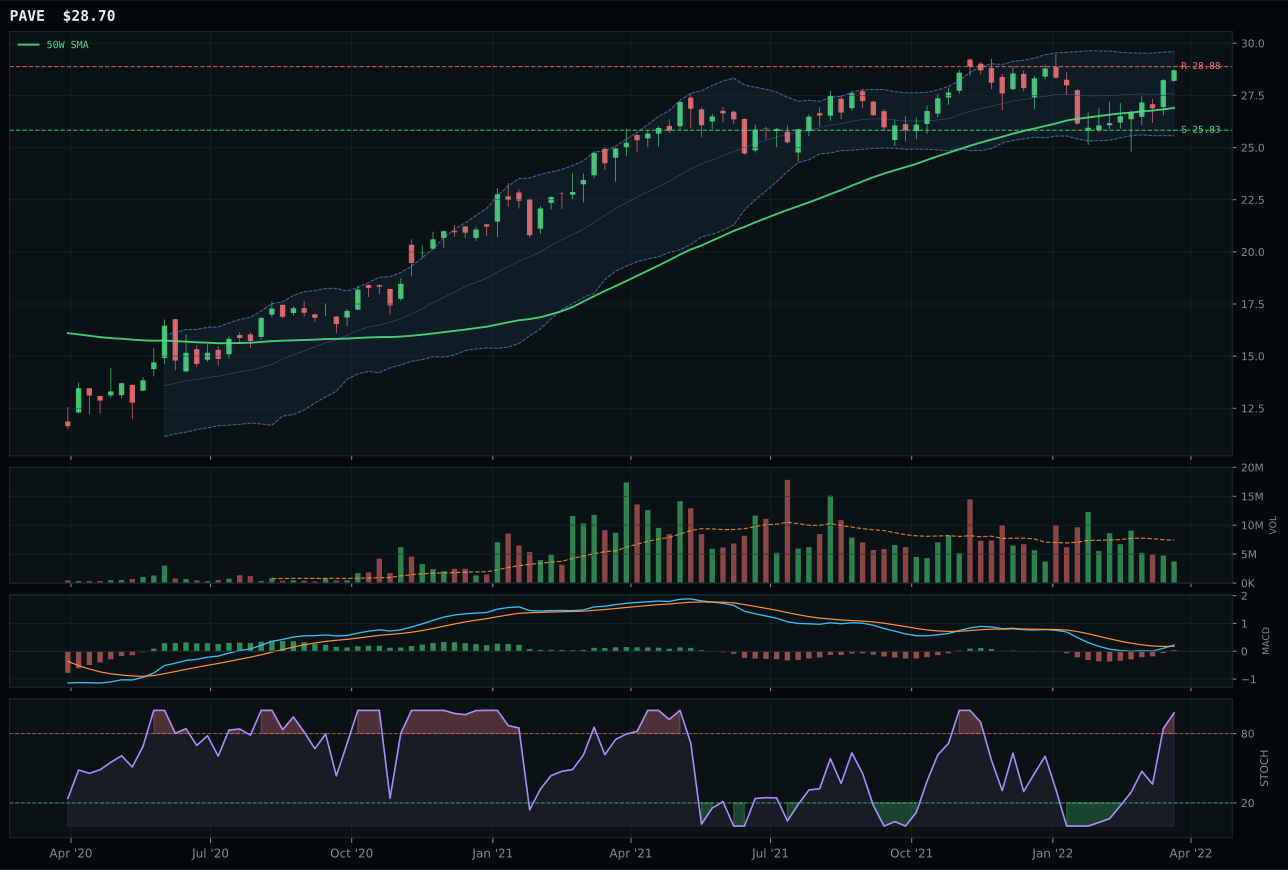
PAVE has a neutral structure profile with 5.1% 13-week relative strength versus SPY.
A failed hold above support would weaken the setup.
Actionable but governed by invalidation levels.
XLU edged IGF by 1.5 points to claim the utilities category, winning through superior volume confirmation rather than momentum differentiation. Both utilities are structurally similar: neutral structure, above-average moving averages, bullish improving MACD, and overbought stochastic RSI. The separation comes from IGF's thin volume participation (below-average) versus XLU's neutral volume at 0.94x 20-week average, a seemingly minor distinction that reflects a critical difference in buyer identity. XLU's neutral volume suggests consistent participation from the broad utility-holding base (pensions, dividend funds, defensive-rotation traders), while IGF's thin volume suggests only specialist infrastructure capital is accumulating. In a defensive rotation regime, XLU's broad sponsorship is superior to IGF's niche appeal. Both show modest 13-week returns (4.4% vs. 7.3%) and modest SPY-relative strength (8.2% vs. 11.1%), confirming that this category is about shelter rather than performance—the tighter volume participation in XLU simply signals better quality of accumulation.
Utilities & Infrastructure received 5% as a tier-2 allocation with a category score of 68.5, ranking sixth or seventh among eligible categories. Macro support is present at 64.0 category-level fit: defensive rotation is active at +12, broad market bear is active at +4, and the Transition/Mixed regime itself provides a +4 boost. Inflation pressure at -6 provides a headwind to utility dividend yields, but the defensive rotation narrative is strong enough to override. XLU's 82.6% technical evidence paired with 60.0% macro/narrative fit creates a balanced setup—neither pure technical strength nor pure macro tailwind dominates. For utilities to earn top-2 status, either broad market bear would need to intensify further, forcing equity allocators into deeper defensive positions, or inflation pressure would need to reverse. Current tier-2 status reflects a cautious defensive stance: capital is held in utilities as a structural hedge without the conviction to make it a primary overweight. The position functions as a stability anchor rather than a conviction signal.
Nuclear Energy — URNM
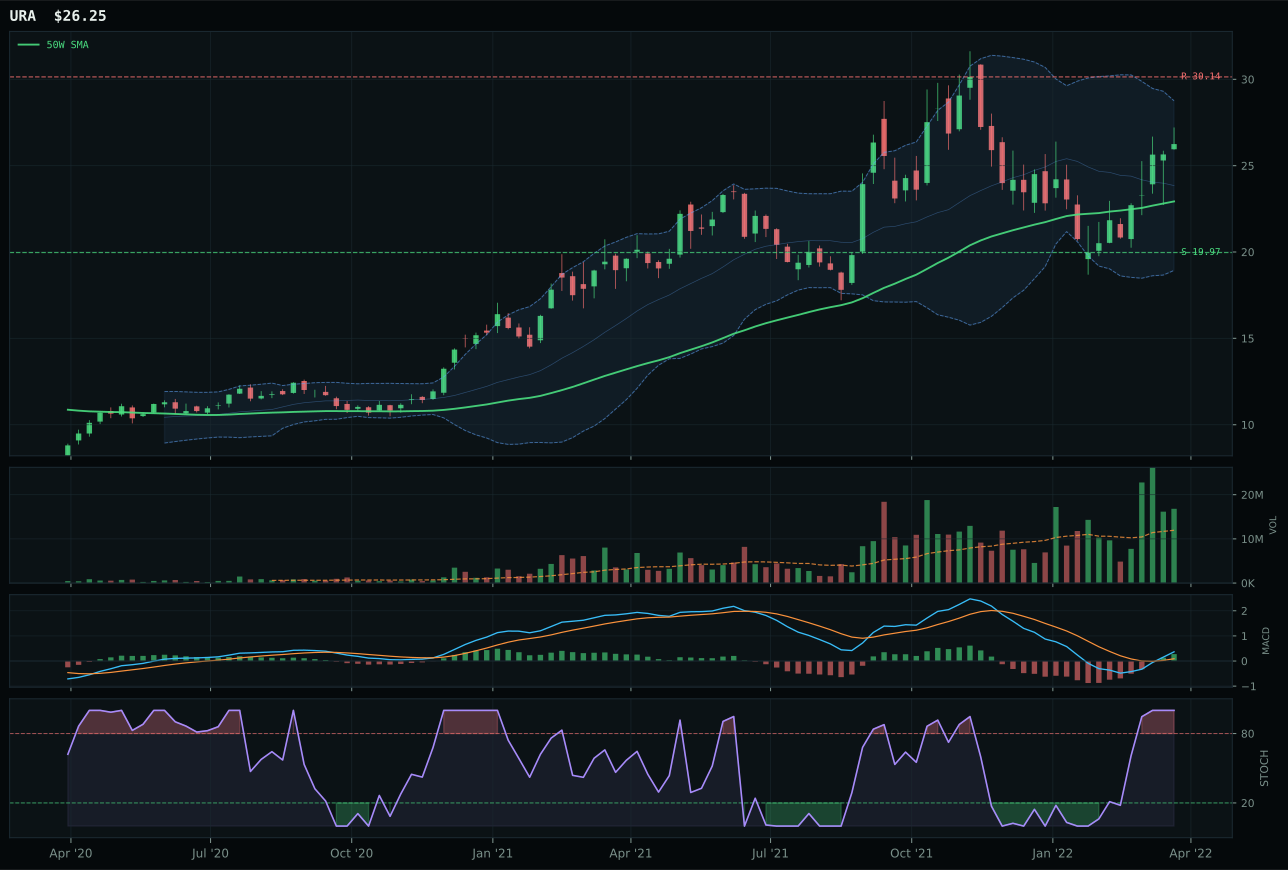
URA has a neutral structure profile with 10.9% 13-week relative strength versus SPY.
A failed hold above support would weaken the setup.
Actionable but governed by invalidation levels.
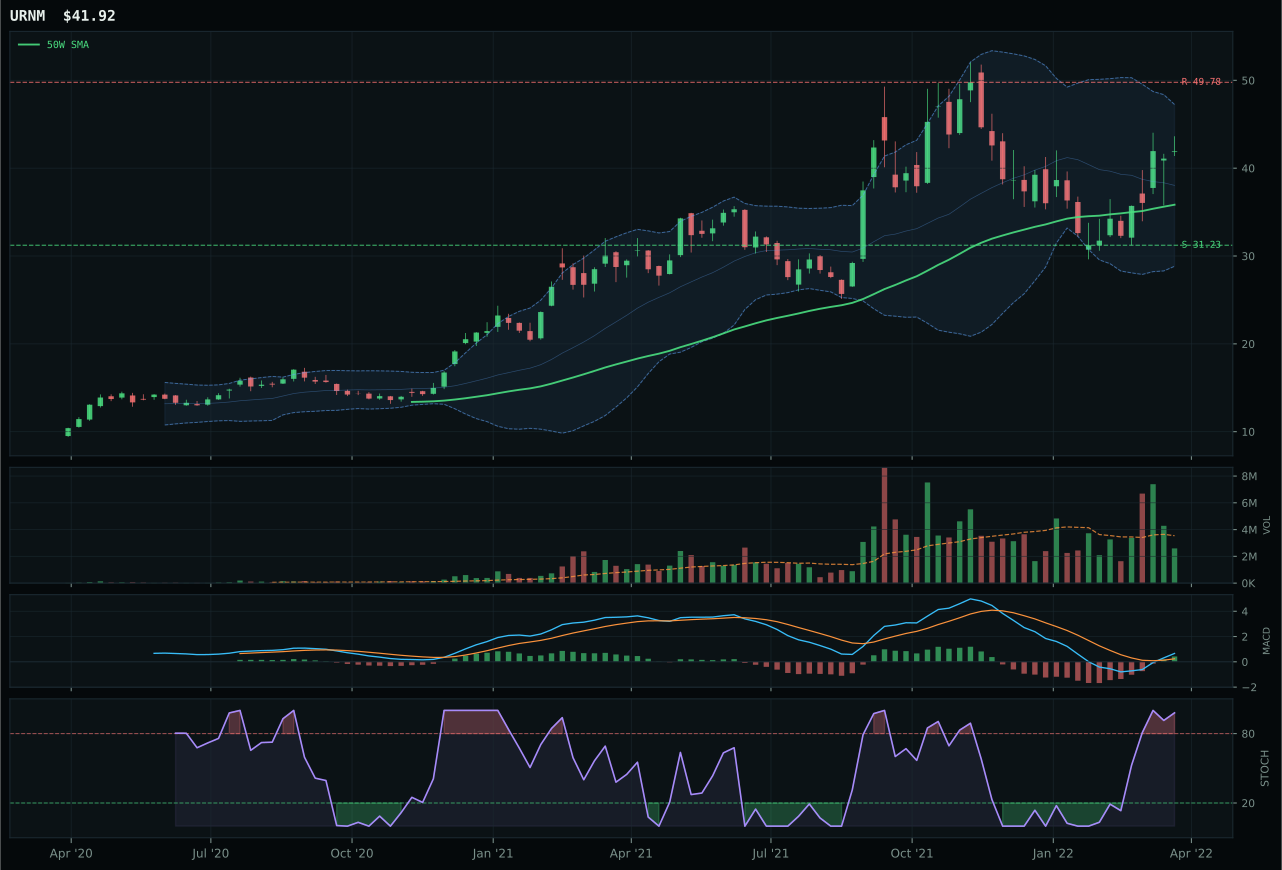
URNM has a vertical extension profile with 10.6% 13-week relative strength versus SPY.
A failed hold above support would weaken the setup.
Actionable but governed by invalidation levels.
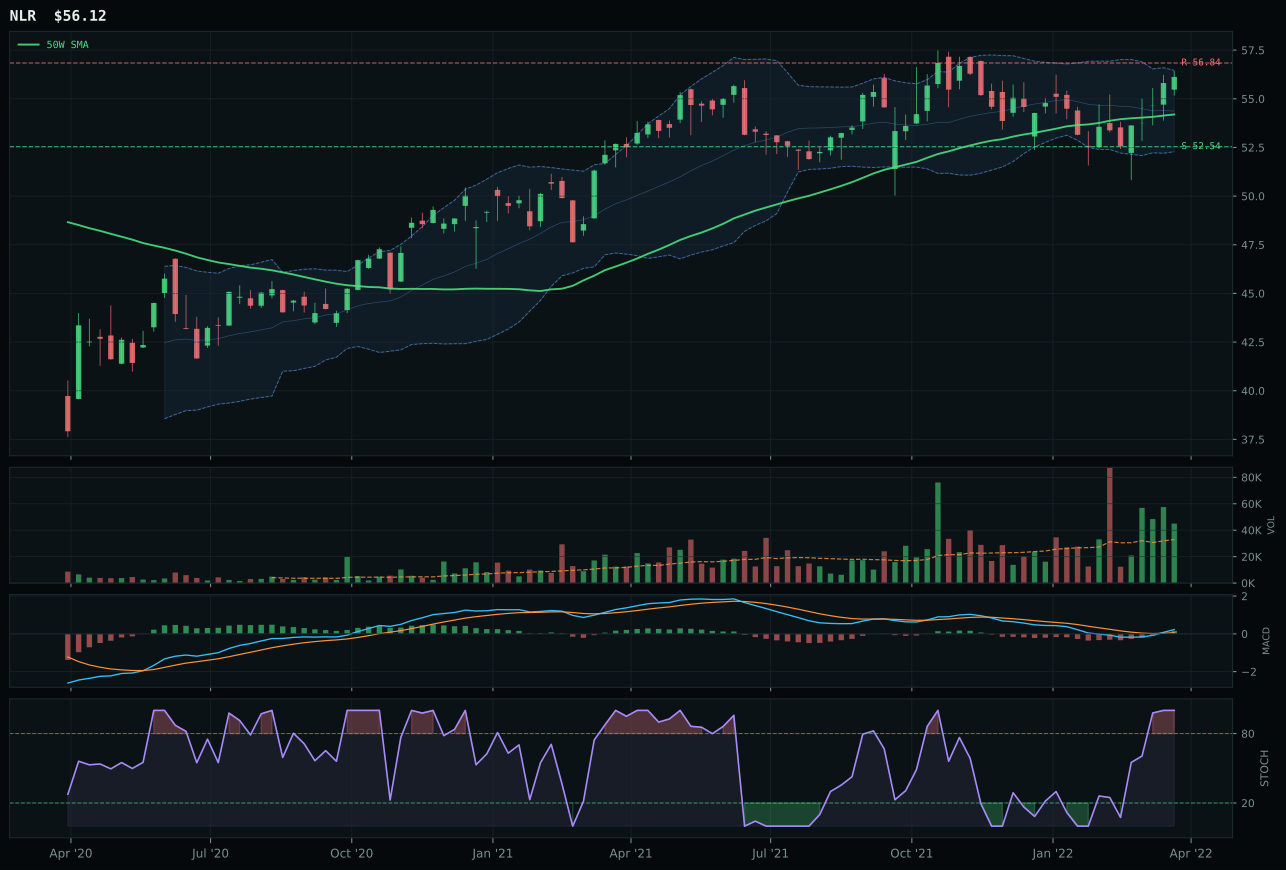
NLR has a neutral structure profile with 7.2% 13-week relative strength versus SPY.
A failed hold above support would weaken the setup.
Tracked, but not top-2 eligible because: .
URNM won the nuclear category by successfully threading the needle between two competing setups: it is extended (17.0% above the 50-week) but sits above its 50-week moving average with bullish MACD, whereas URA offers cleaner technical evidence but faces the risk of deteriorating if the market rolls over. The uranium-miner scarcity play's 100.0% momentum confirmation score (4-week return 17.4%, 13-week return 6.8%, category-relative strength 0.0%, MACD bullish, volume thin) tells a consistent story: accumulation is happening despite thin participation. URA's superior technical evidence of 88.3 is offset by its risk/reward disadvantage (37.4 vs. 38.3) and the fact that it sits below its 200-week moving average, a structural weakness in a transition regime. URNM's 90.0% trend score, while penalized for being below the 200-week, reflects a name that is recovering from damage rather than extending from strength—the narrative is more robust. The volume at 0.73x 20-week average is thin, but that thinness on an uptrend in an illiquid sector is less concerning than volume deterioration would be.
Nuclear Energy received 5% as a tier-2 allocation with a final score of 50.6, ranked seventh or eighth among the ten categories. Macro support is moderate at 60.0 category-level fit: energy scarcity is active at +9, real asset sponsorship is active at +7, and inflation pressure is active at +3, but credit stress is active at -5 and risk appetite broken is active at -4. URNM's position is held primarily as a real-asset scarcity play within the energy complex, not as a primary conviction. The technical setup (below the 200-week, extended from the 50-week, thin volume) suggests this is early-stage recovery capital that may not persist if risk appetite deteriorates further. Entry timing is poor at 17.0% extension, and the -15.8% upside to resistance versus -34.3% downside to support creates meaningful asymmetry. For nuclear to upgrade, it would need to either break decisively above its 200-week moving average with accelerating volume or see category-level macro fit rise substantially through expansion of energy-scarcity messaging. Current allocation respects the thesis while acknowledging that technical setup and size constraints limit conviction.
Technology — CIBR
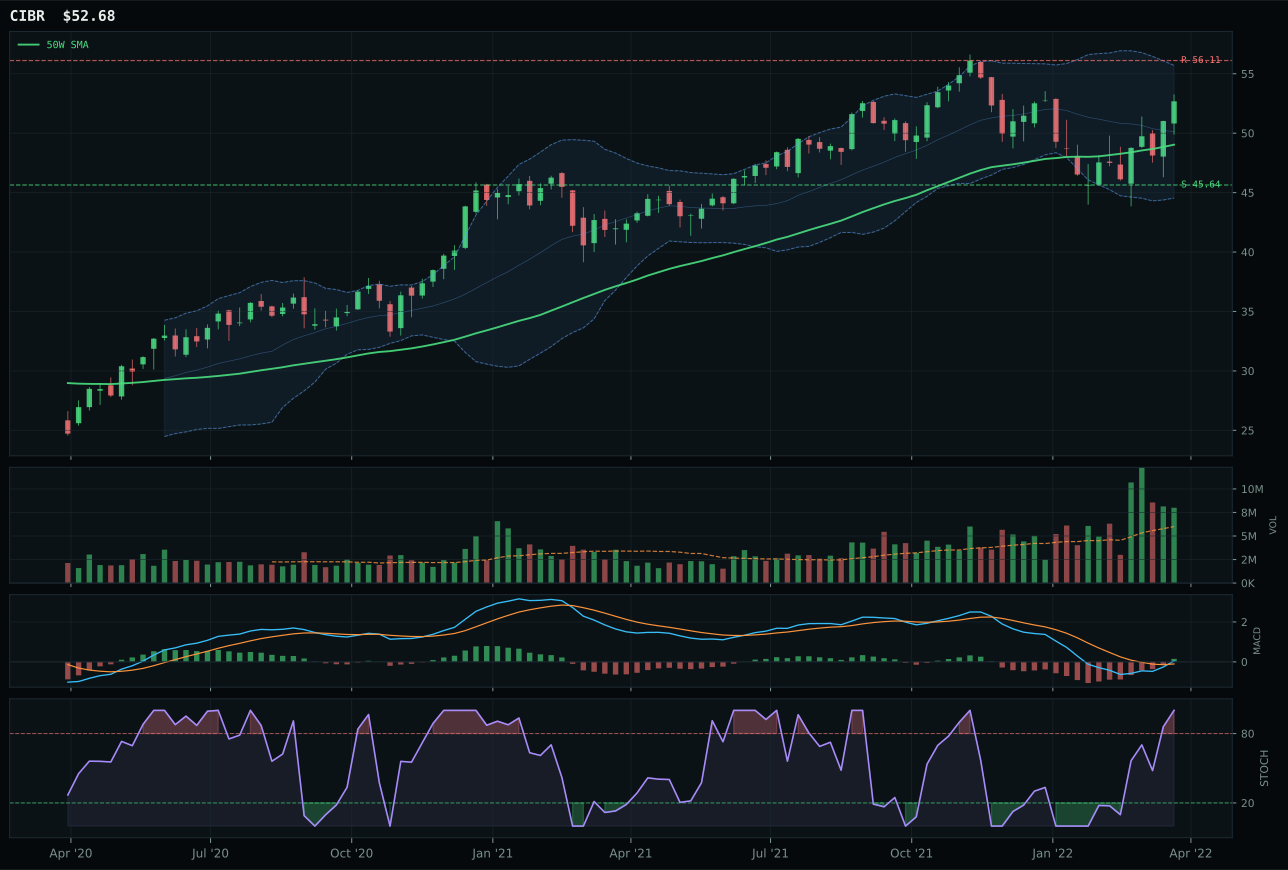
CIBR has a neutral structure profile with 4.1% 13-week relative strength versus SPY.
A failed hold above support would weaken the setup.
Actionable but governed by invalidation levels.
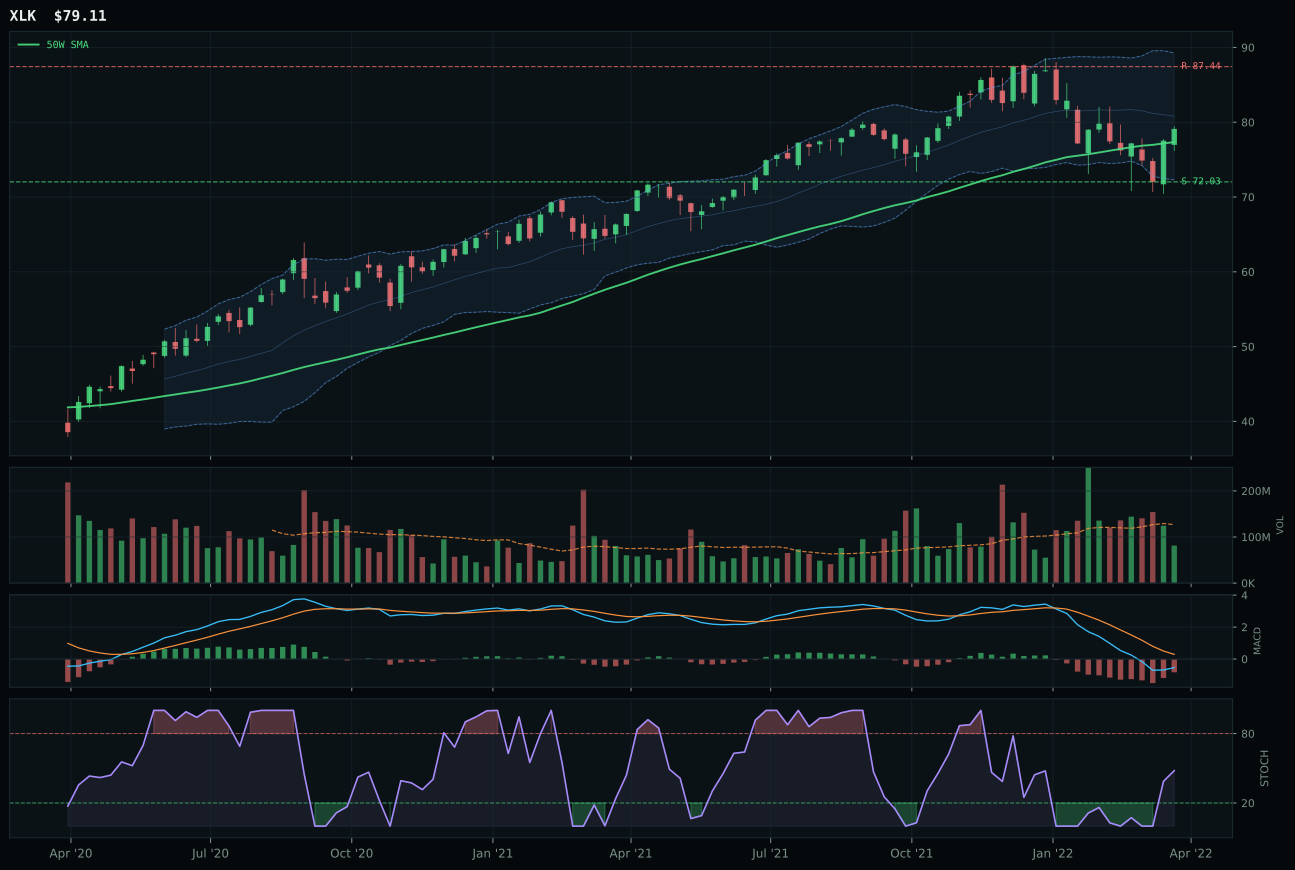
XLK has a compression near 50W profile with -4.7% 13-week relative strength versus SPY.
A failed hold above support would weaken the setup.
Actionable but governed by invalidation levels.
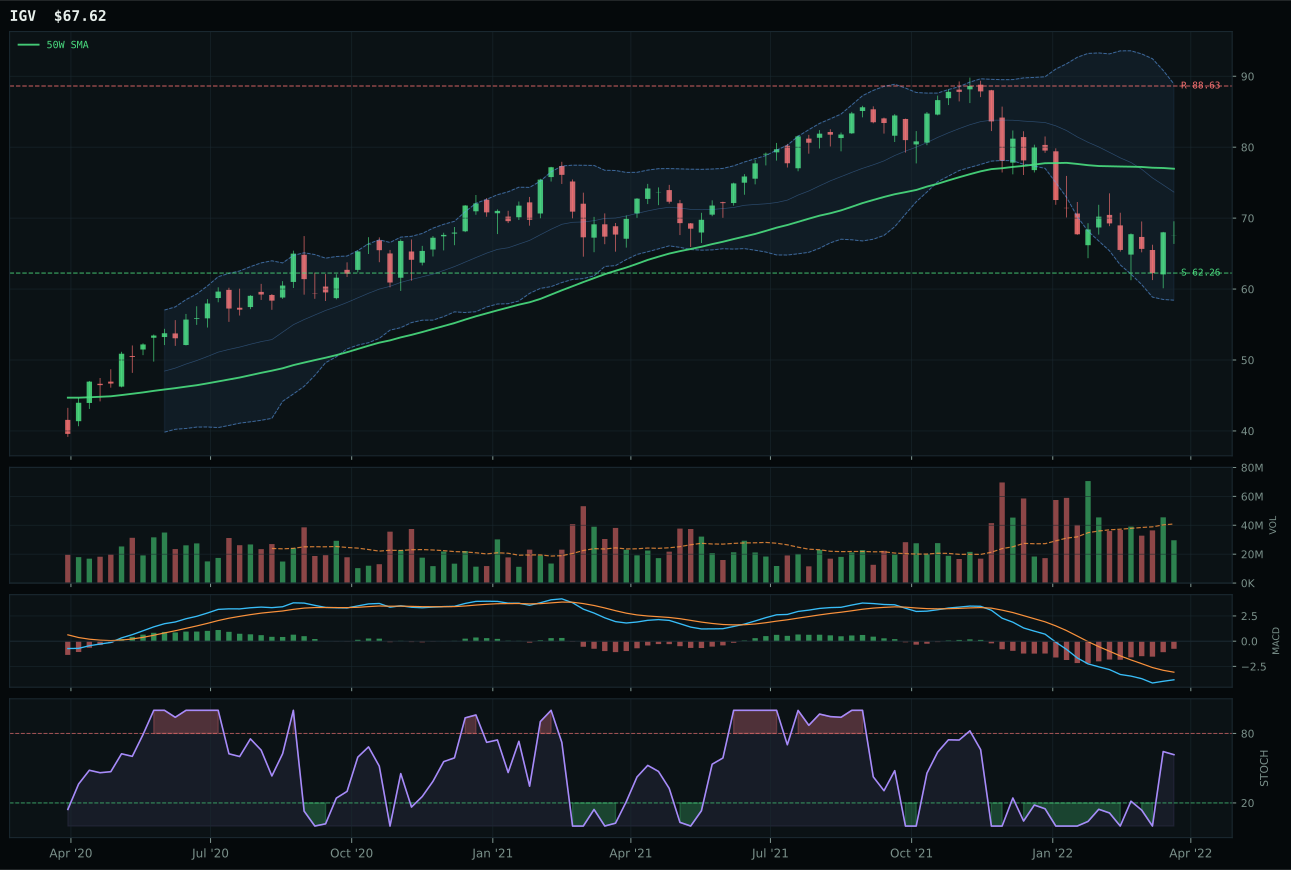
IGV has a neutral structure profile with -11.7% 13-week relative strength versus SPY.
A failed hold above support would weaken the setup.
Actionable but governed by invalidation levels.
CIBR captured the category win by combining a rare alignment of bullish technicals with genuine relative strength inside its own basket. The cybersecurity ETF sits 7.4% above its 50-week moving average with a 0.4% slope and MACD that is both bullish and improving—a combination that XLK, the runner-up, cannot match. What separates CIBR decisively is its 8.8% outperformance versus the category median paired with 1.33x above-average volume participation; XLK's 0.0% category-relative strength and thin volume at participation levels tells you the broad profitable tech cohort is not being sponsored by fresh capital. The stochastic RSI reading of 1.00 (overbought momentum) would normally signal extension risk, but the 13-week return of just 0.3% confirms this is not a parabolic move—it's a slow grind higher with discipline. CIBR's 4.1% outperformance versus SPY proves the narrative is real: cybersecurity is the only defensive tech subtheme buyers want in a mixed regime.
Technology earned 5% allocation as a tier-2 category, sitting below the two highest-scoring eligible baskets but retaining capital given the regime transition. The category-level macro fit score of 43.0 reflects a genuine tension: liquidity expansion is active and helping momentum names, but credit stress, dollar pressure, and inflation pressure are all fighting the narrative. CIBR's 79.2 reasoned score benefited from technically superior sponsorship rather than macro tailwinds, which means this allocation is earned through chart evidence alone, not narrative support. For this position to upgrade to top-2 status, either technology would need to see category-relative strength broaden beyond cybersecurity into the broader XLK cohort, or macro conditions would need to shift toward outright risk appetite recovery rather than the current selective defensive rotation. The current allocation respects CIBR's clean setup without overcommitting to a sector where timing remains defensive-driven rather than growth-driven.
Emerging Markets — ILF
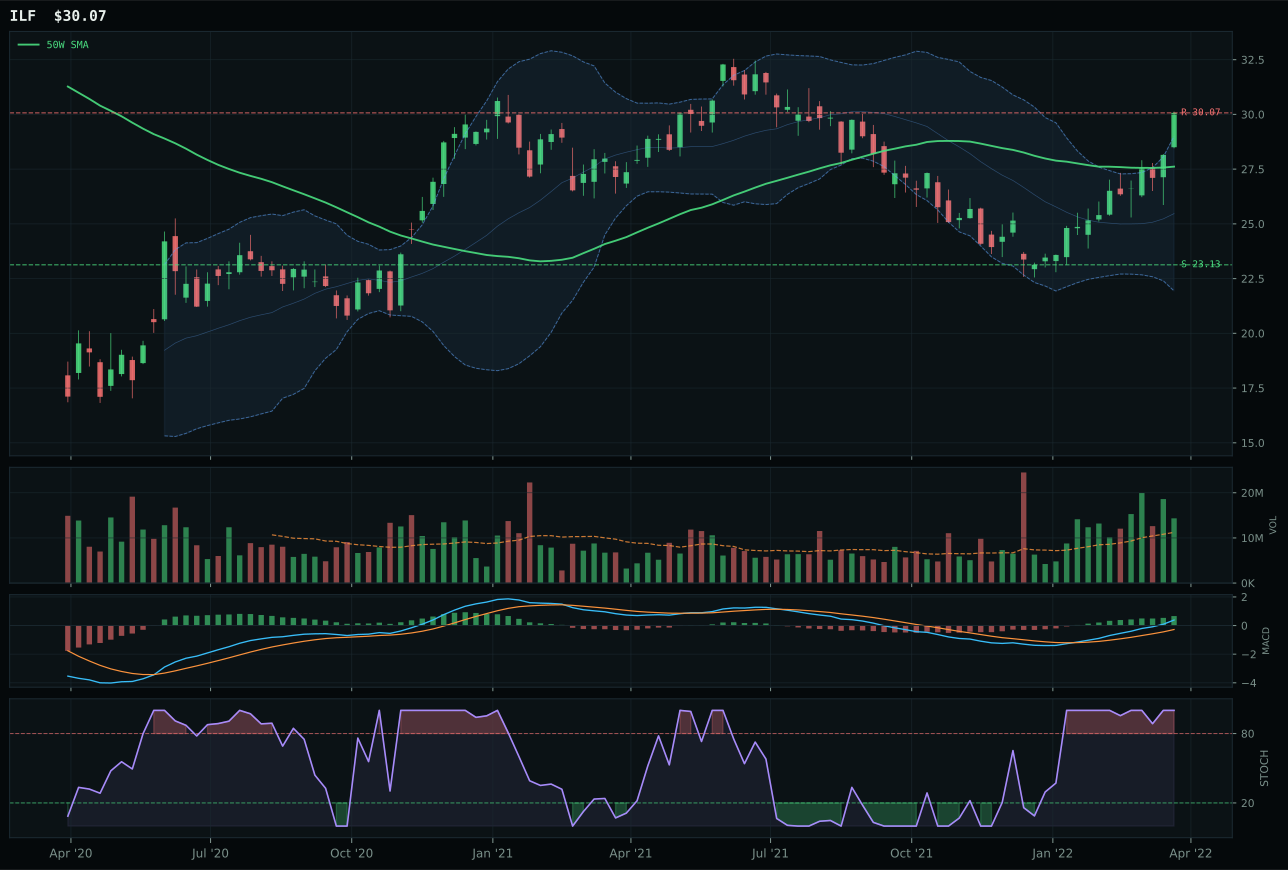
ILF has a neutral structure profile with 33.8% 13-week relative strength versus SPY.
A failed hold above support would weaken the setup.
Actionable but governed by invalidation levels.
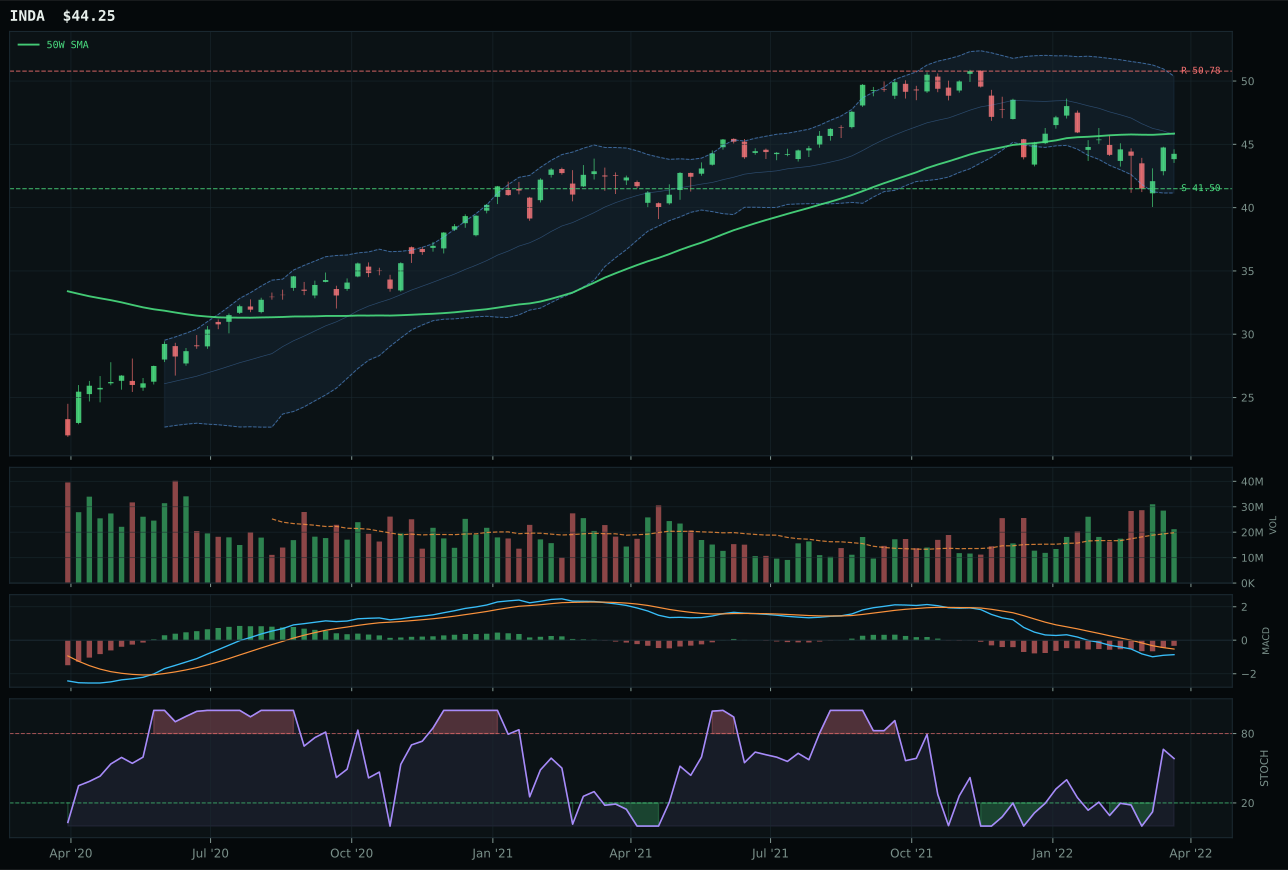
INDA has a neutral structure profile with 1.9% 13-week relative strength versus SPY.
A failed hold above support would weaken the setup.
Actionable but governed by invalidation levels.
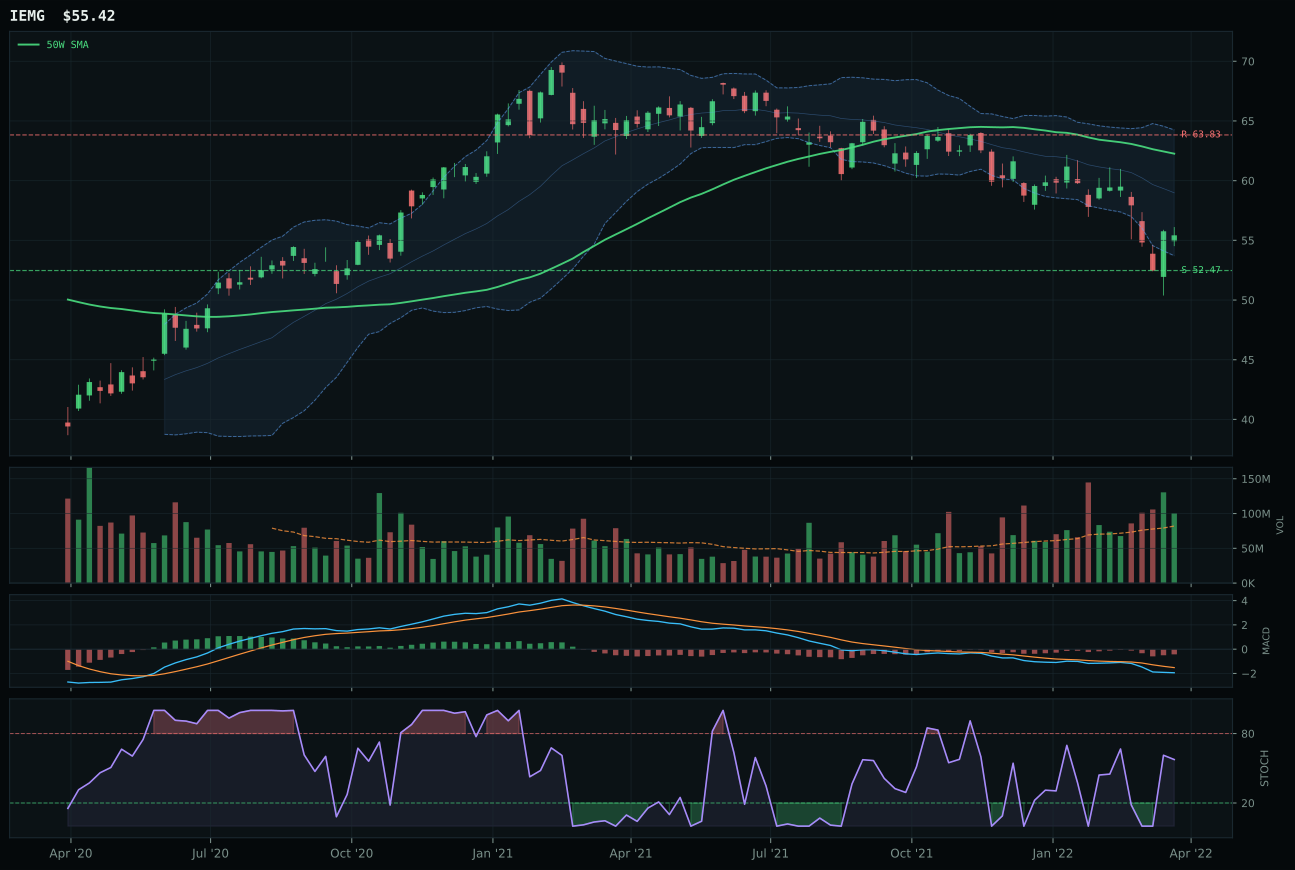
IEMG has a neutral structure profile with -3.1% 13-week relative strength versus SPY.
A failed hold above support would weaken the setup.
Actionable but governed by invalidation levels.
ILF won a category that is entirely shut out of portfolio allocation, demonstrating that winning an excluded category still requires technical superiority even if macro conditions prohibit entry. Latin American exposure's 13-week return of 30.0% paired with 33.8% SPY-relative strength and 31.9% category-relative outperformance creates the rare pattern of strength across all momentum vectors. Structure is clean (83.7 score), volume is above-average at 1.28x 20-week average, MACD is bullish and improving, and stochastic RSI is overbought momentum—the technical setup is nearly perfect. INDA's structure is messier (71.0 vs. 83.7), MACD is bearish rather than bullish, and volume is neutral rather than accumulating, explaining why ILF's 5.1-point victory is decisive despite both being excluded. What kills the entire category is macro: dollar pressure is active at -14, credit stress is active at -10, broad market bear is active at -9, creating a cumulative -33 headwind that no amount of technical strength can overcome.
Emerging Markets is excluded entirely from portfolio allocation this week, ranked ninth or tenth with a final score of 33.7. The macro regime is hostile with surgical precision: dollar strength is the primary enemy (active at -14), followed by credit stress (-10) and broad market bear (-9)—a combination that makes emerging market exposure structurally unattractive regardless of technicals. Category-level macro fit is only 25.0, the lowest in the portfolio. Even ILF's nearly perfect technical evidence of 100.0 cannot offset a -14 dollar pressure headwind that translates directly to EM currency weakness and capital outflows. For this category to earn allocation, the dollar must begin to weaken, credit stress must ease, and broad market bear must reverse toward neutral—a reset that would require major macro shifts. In the current transition regime, capital flows favor developed-market defensive assets and real commodities over emerging market equity exposure. The technical win by ILF is noted, but macro veto is absolute: no position size until regime conditions change materially.
AI — SMH
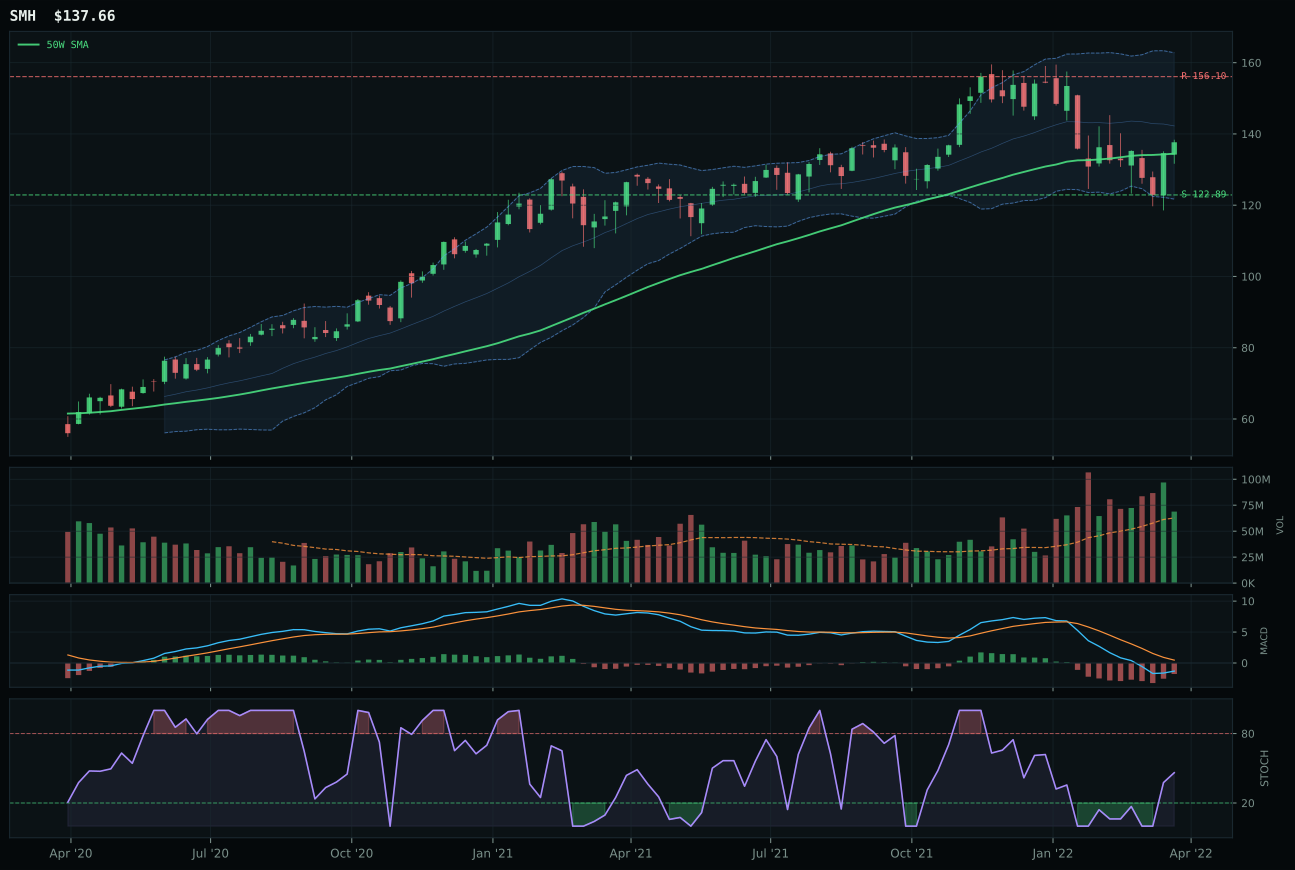
SMH has a compression near 50W profile with -6.9% 13-week relative strength versus SPY.
A failed hold above support would weaken the setup.
Actionable but governed by invalidation levels.
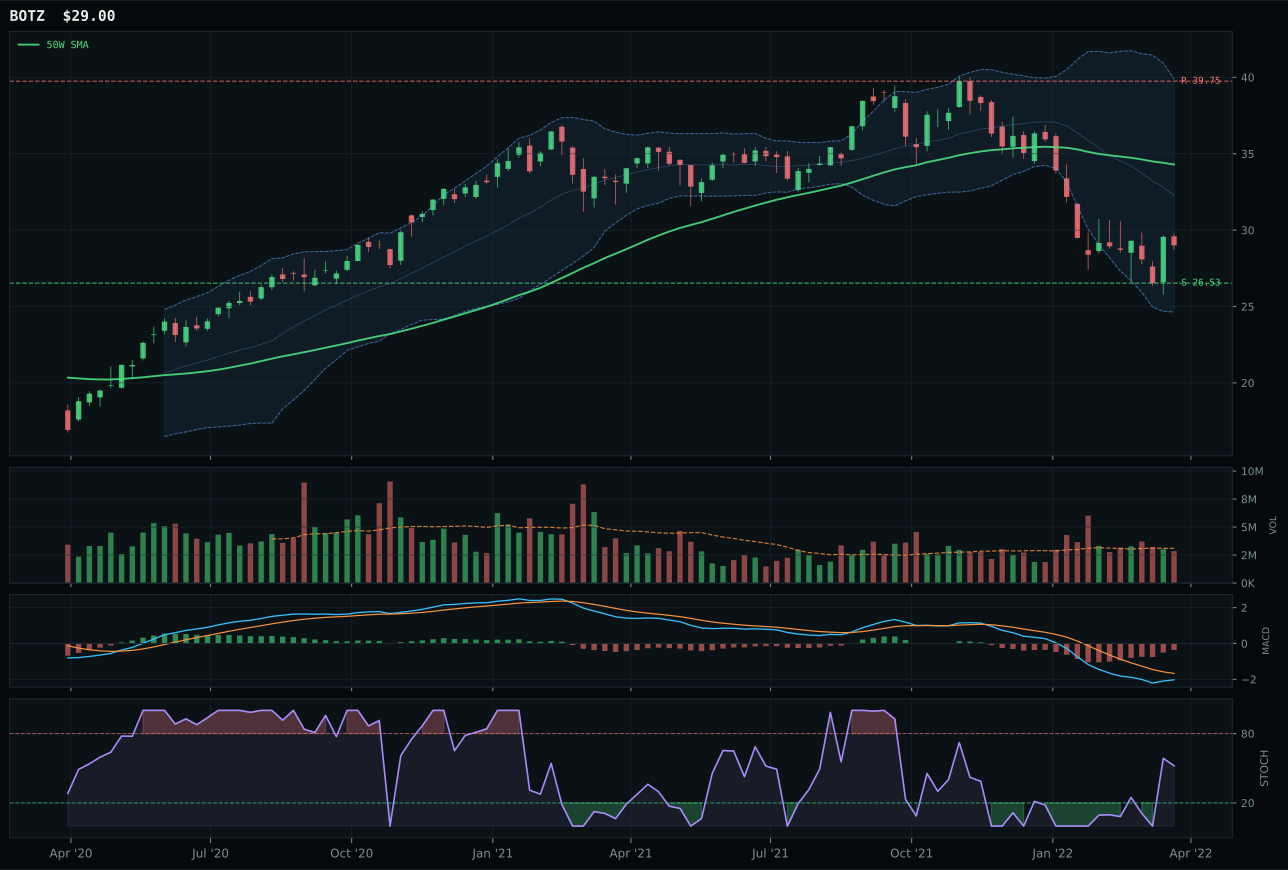
BOTZ has a neutral structure profile with -16.4% 13-week relative strength versus SPY.
A failed hold above support would weaken the setup.
Actionable but governed by invalidation levels.
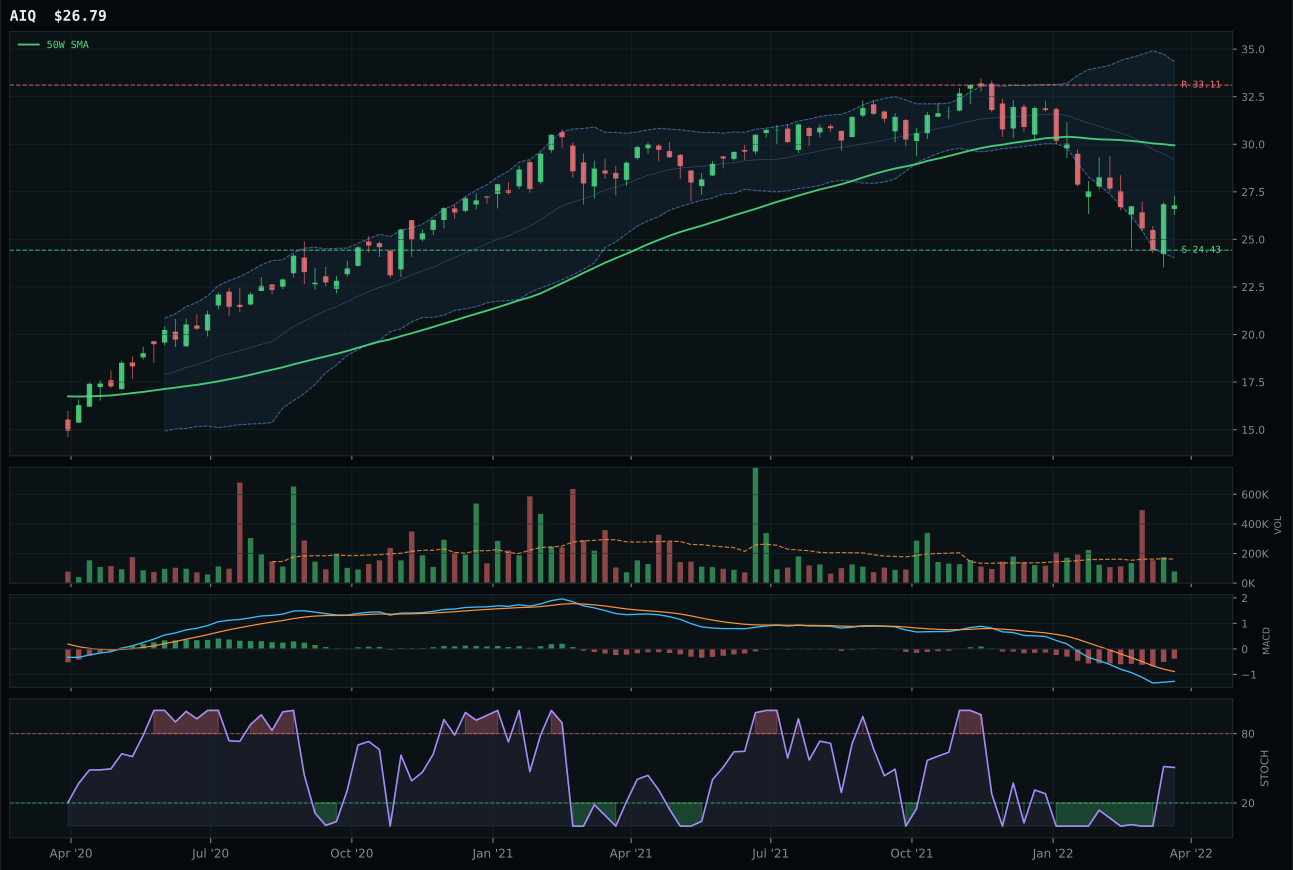
AIQ has a neutral structure profile with -12.2% 13-week relative strength versus SPY.
A failed hold above support would weaken the setup.
Tracked, but not top-2 eligible because: .
SMH won the AI category not because of superior momentum—its 13-week return of -10.7% trails the broader market—but because it held a better structural position than BOTZ and AIQ despite the category's macro headwinds. The semiconductor ETF sits directly at its 50-week moving average (2.4% distance), a setup that provides clarity: if buyers defend this level, there is compression room to expand; if they abandon it, support fades into the gap zone. MACD is bearish but improving, and the stochastic RSI at 0.46 is rising from mid-zone, which together suggest accumulation rather than capitulation. BOTZ, by contrast, sits in the repair zone near its 52-week low with a -16.4% 13-week RS versus SPY—a gap so wide that even its better risk/reward (90 vs 56) cannot compensate for the absence of sponsorship. Volume is neutral across both names, so the decision hinges on proximity to support: SMH's 50-week support at 122.89 is closer and more actively contested than BOTZ's repair-zone floor.
AI is excluded from this week's portfolio entirely, ranked outside the top-10 eligible categories with a final score of 26.4. The macro regime is working against this category with precision: broad market bear is active, credit stress is active, and risk appetite broken is active—a triple headwind that overwhelms the +10 from liquidity expansion. SMH's technical evidence of 70.6 is respectable in isolation, but when paired against a category-level macro fit of only 40.0, the cumulative portfolio signal is clear rejection. For AI to earn even a tier-2 position, one of three conditions must change: either broad market bear must flip to neutral, or credit stress must begin to ease, or the category would need to demonstrate that its decline is creating genuine value rather than confirming cyclical weakness. At current settings, capital is better deployed to categories with stronger macro sponsorship and cleaner technical setups—a direct contrast to the narrative that AI always deserves allocation in any regime.