
2022-03-18
Informational purposes only. The content in this report, including allocations, analysis, and commentary, is provided solely for informational and educational purposes. It does not constitute financial advice, investment advice, trading advice, or any other type of advice. Past performance does not guarantee future results. Always conduct your own research and consult a qualified financial professional before making investment decisions.
Macro risk engine requires the 50% Defensive overlay for this run; payload selected by cause: Inflation Scarcity.
Weekly Allocation
| Ticker | Category | Weight | Role |
|---|---|---|---|
| XLE | 50% | Overlay | |
| XOP | Traditional Energy | 10% | Top-2 (10%) |
| GLD | Precious Metals | 10% | Top-2 (10%) |
| XLU | Utilities & Infrastructure | 5% | Tier-2 (5%) |
| COPX | Industrial Metals | 5% | Tier-2 (5%) |
| XAR | Defense & Aerospace | 5% | Tier-2 (5%) |
| URNM | Nuclear Energy | 5% | Tier-2 (5%) |
| WEAT | Agriculture & Livestock | 5% | Tier-2 (5%) |
| ILF | Emerging Markets | 5% | Tier-2 (5%) |
Trade Instructions — Monday Open
Sell the tranche from 2022-02-18 (completing its 4-week hold). Buy the new tranche. Instructions show net portfolio changes — same-asset positions cancel, weight changes show the delta.
| Action | Ticker | Instruction |
|---|---|---|
| SELL | COPX | Sell 30% of COPX position (reduce 12.50% → 8.75%) |
| SELL | MOO | Sell entire MOO position (2.50% of portfolio) |
| SELL | PAVE | Sell 50% of PAVE position (reduce 5.00% → 2.50%) |
| SELL | CIBR | Sell 33% of CIBR position (reduce 7.50% → 5.00%) |
| SELL | IEMG | Sell entire IEMG position (2.50% of portfolio) |
| SELL | ITA | Sell entire ITA position (2.50% of portfolio) |
| BUY | XLE | Buy XLE — 46.15% of freed cash (adds 7.50% to portfolio) |
| BUY | WEAT | Buy WEAT — 7.69% of freed cash (adds 1.25% to portfolio) |
| BUY | XAR | Buy XAR — 7.69% of freed cash (adds 1.25% to portfolio) |
| BUY | URNM | Buy URNM — 7.69% of freed cash (adds 1.25% to portfolio) |
| BUY | XLU | Buy XLU — 7.69% of freed cash (adds 1.25% to portfolio) |
| BUY | XOP | Buy XOP — 15.38% of freed cash (adds 2.50% to portfolio) |
| BUY | ILF | Buy ILF — 7.69% of freed cash (adds 1.25% to portfolio) |
Current Portfolio After Trade
Combined holdings across all 4 active tranches. Each tranche is 25% of the portfolio.
| Ticker | % of Portfolio | Weight Bar |
|---|---|---|
| XLE | 47.50% | |
| COPX | 8.75% | |
| GLD | 7.50% | |
| WEAT | 6.25% | |
| XAR | 6.25% | |
| URNM | 6.25% | |
| CIBR | 5.00% | |
| XLU | 3.75% | |
| PAVE | 2.50% | |
| GDX | 2.50% | |
| XOP | 2.50% | |
| ILF | 1.25% |
Macro Regime — Transition / Mixed
growth data is not confirming the weak market-implied risk appetite signal
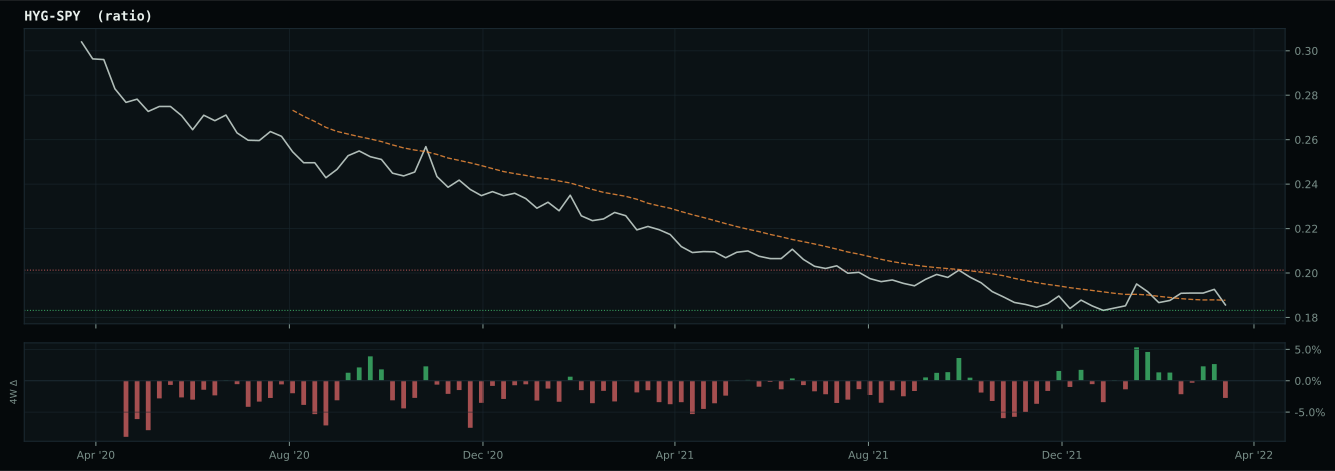
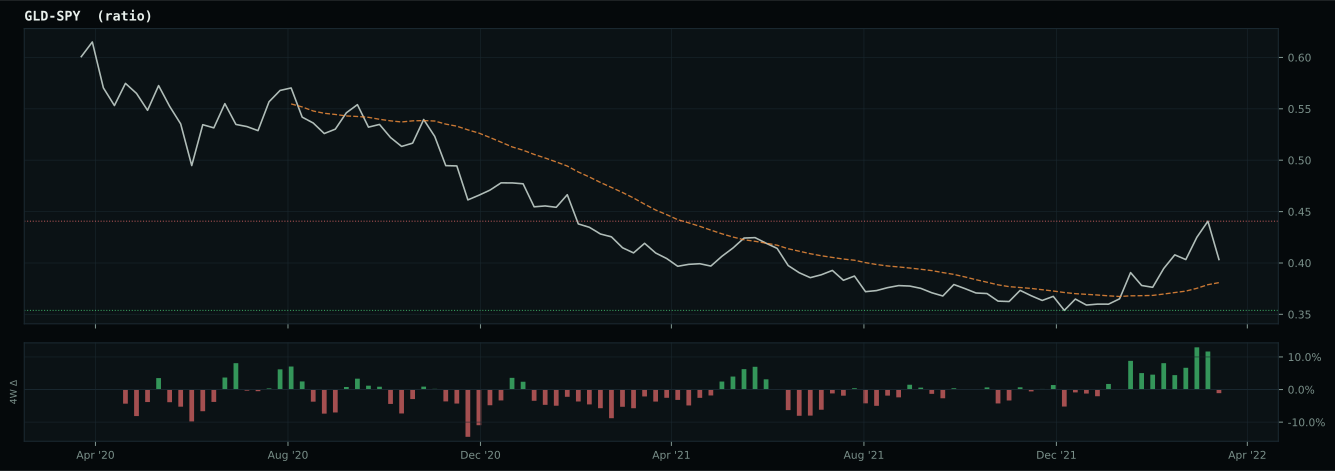
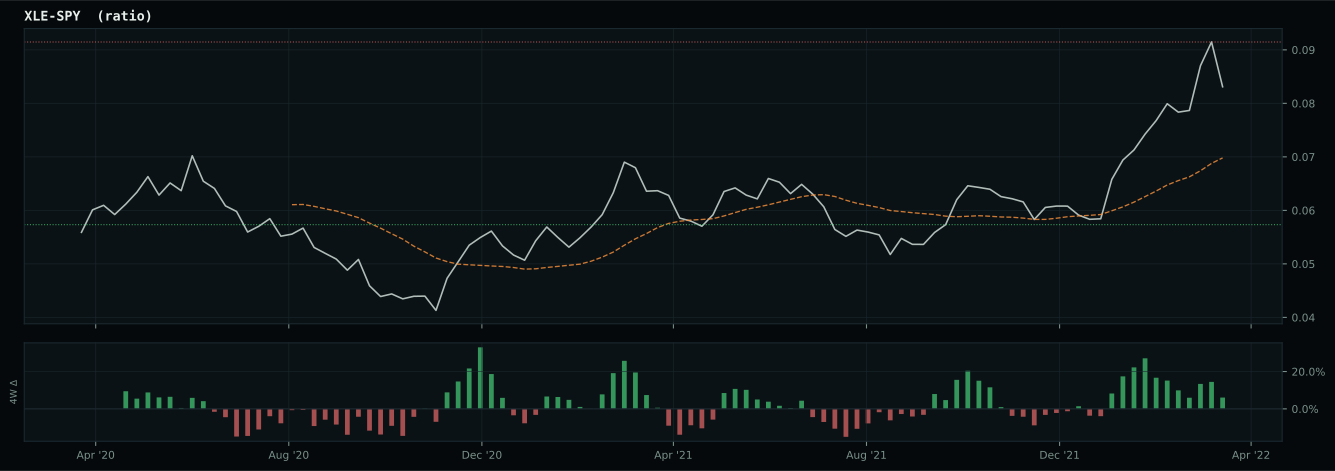
Defensive overlay cause is inflation/scarcity: energy, commodity breadth, or oil-versus-gold confirmation is stronger than the broad equity tape, so the sleeve owns the inflation pressure. XLE has been confirmed above its 8W SMA and is eligible.
Macro Evidence Charts
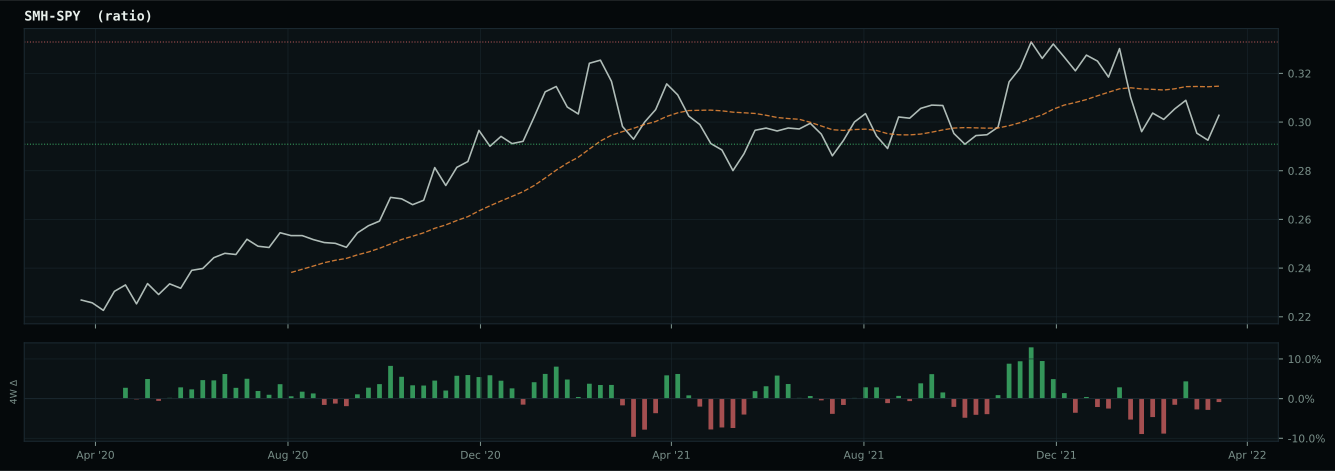
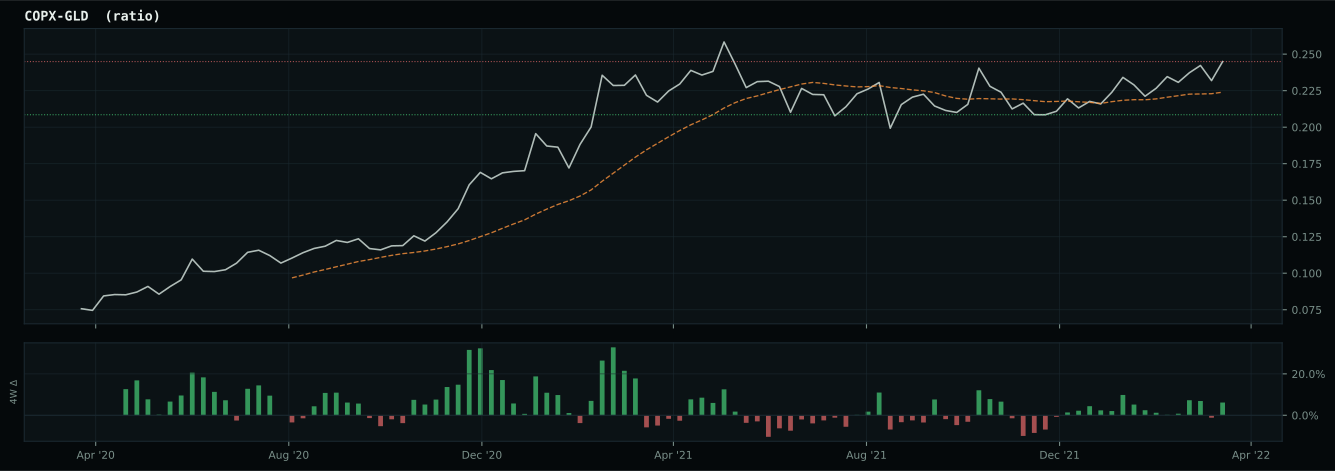
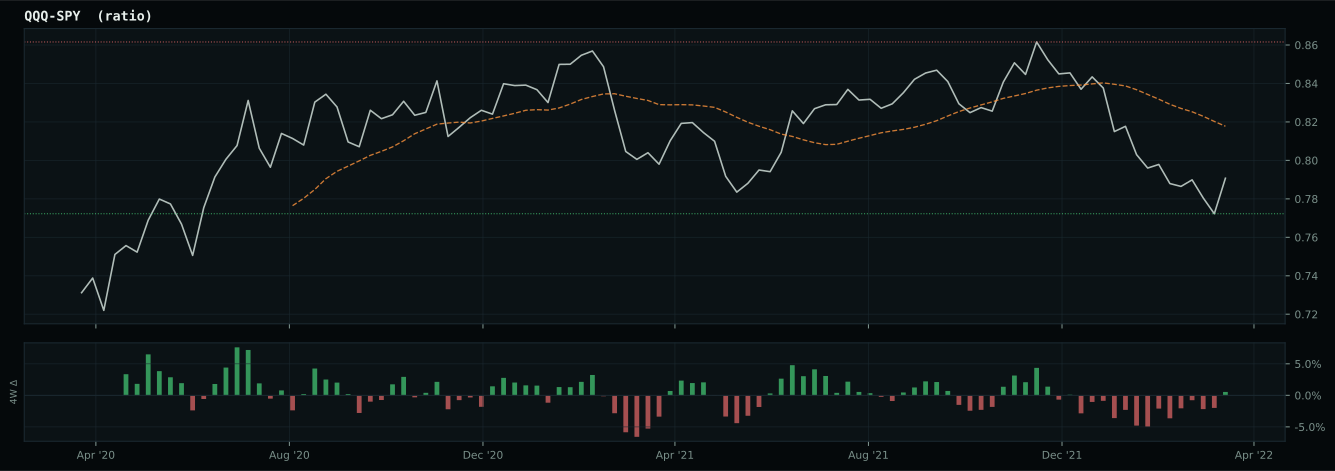
Market-implied signals behind the macro regime scores. Each ratio compares two assets; the direction and slope of the ratio is what the macro engine reads.
Crypto Regime — NoCrypto
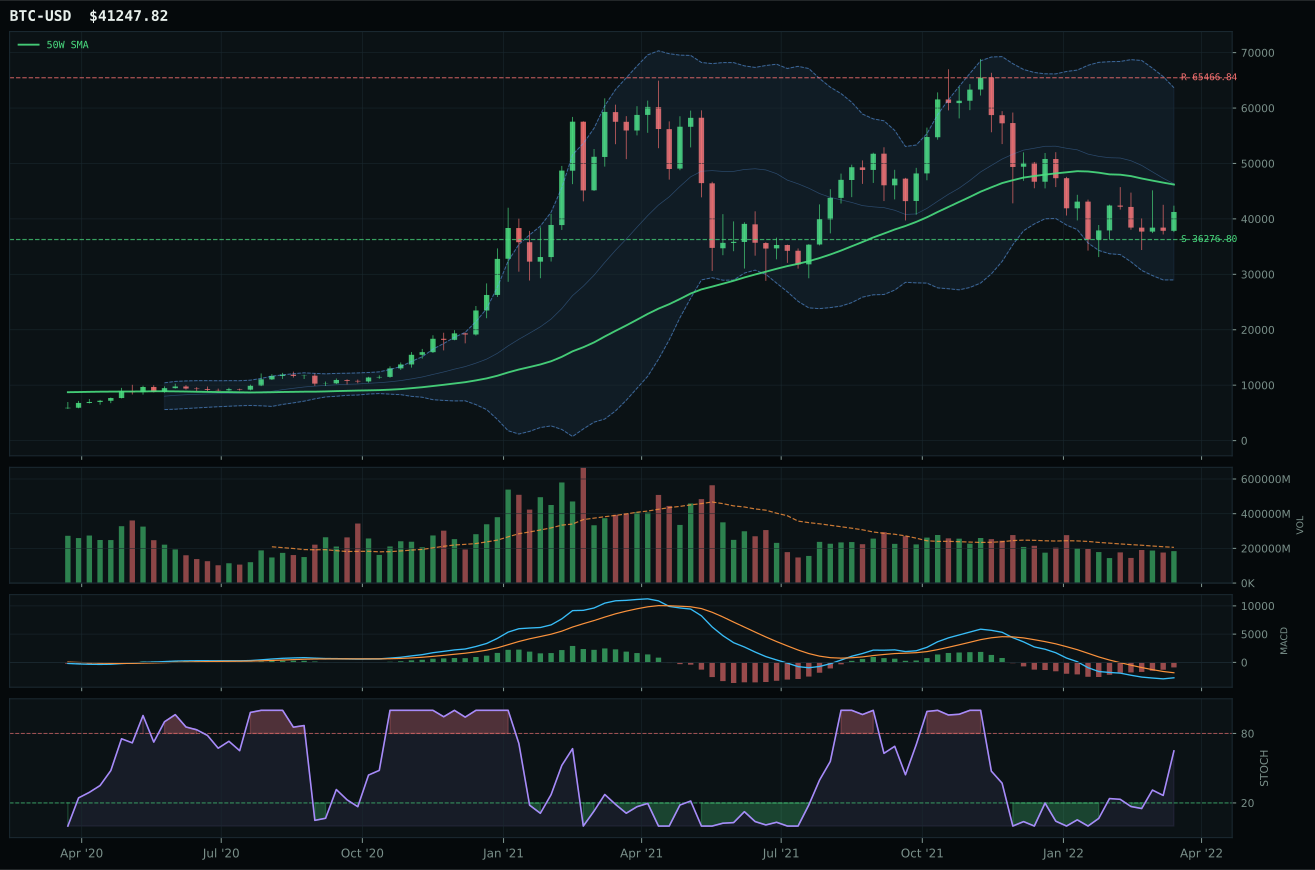
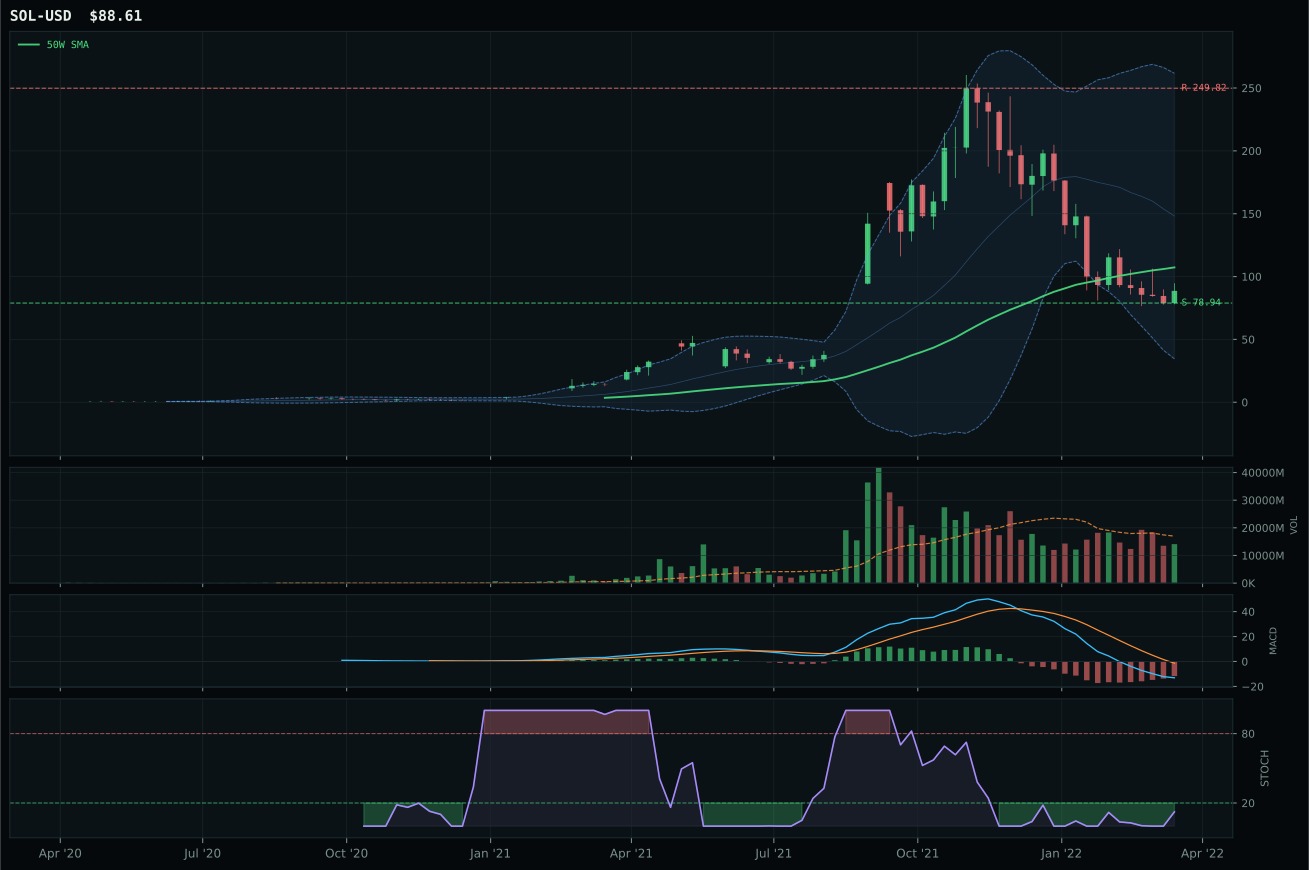
ValueBTC not armed: BTC has not made the first post-breakdown touch of the 200W buy zone after losing the 50W
TrendBTC not confirmed
one or more available conditions failed
Category Rankings
| Rank | Category | Winner | Score | Alloc | 4W Ret | Peers (4W) |
|---|---|---|---|---|---|---|
| 1 | Traditional Energy | XOP | 85.7 | 20% | +13.59% | FCG +14.7% · XLE +7.8% |
| 2 | Precious Metals | GLD | 79.0 | 20% | +3.69% | GDX +10.2% · SLV +4.2% |
| 3 | Utilities & Infrastructure | XLU | 74.4 | 10% | +8.15% | IGF +5.4% · PAVE -2.4% |
| 4 | Industrial Metals | COPX | 73.5 | 10% | +4.69% | PICK +7.4% · REMX +0.3% |
| 5 | Defense & Aerospace | XAR | 71.1 | 10% | +0.72% | ITA +3.0% · ROKT +0.9% |
| 6 | Nuclear Energy | URNM | 64.6 | 10% | +11.96% | URA +8.6% · NLR +6.5% |
| 7 | Agriculture & Livestock | WEAT | 59.3 | 10% | +8.42% | MOO +4.4% · VEGI +6.0% |
| 8 | Emerging Markets | ILF | 58.4 | 10% | +3.30% | INDA +2.1% · IEMG -1.2% |
| 9 | Technology | CIBR | 53.0 | 0% | +2.25% | XLK -5.2% · IGV -4.8% |
| 10 | AI | SMH | 37.3 | 0% | -11.62% | BOTZ -12.9% · AIQ -6.8% |
Traditional Energy — XOP
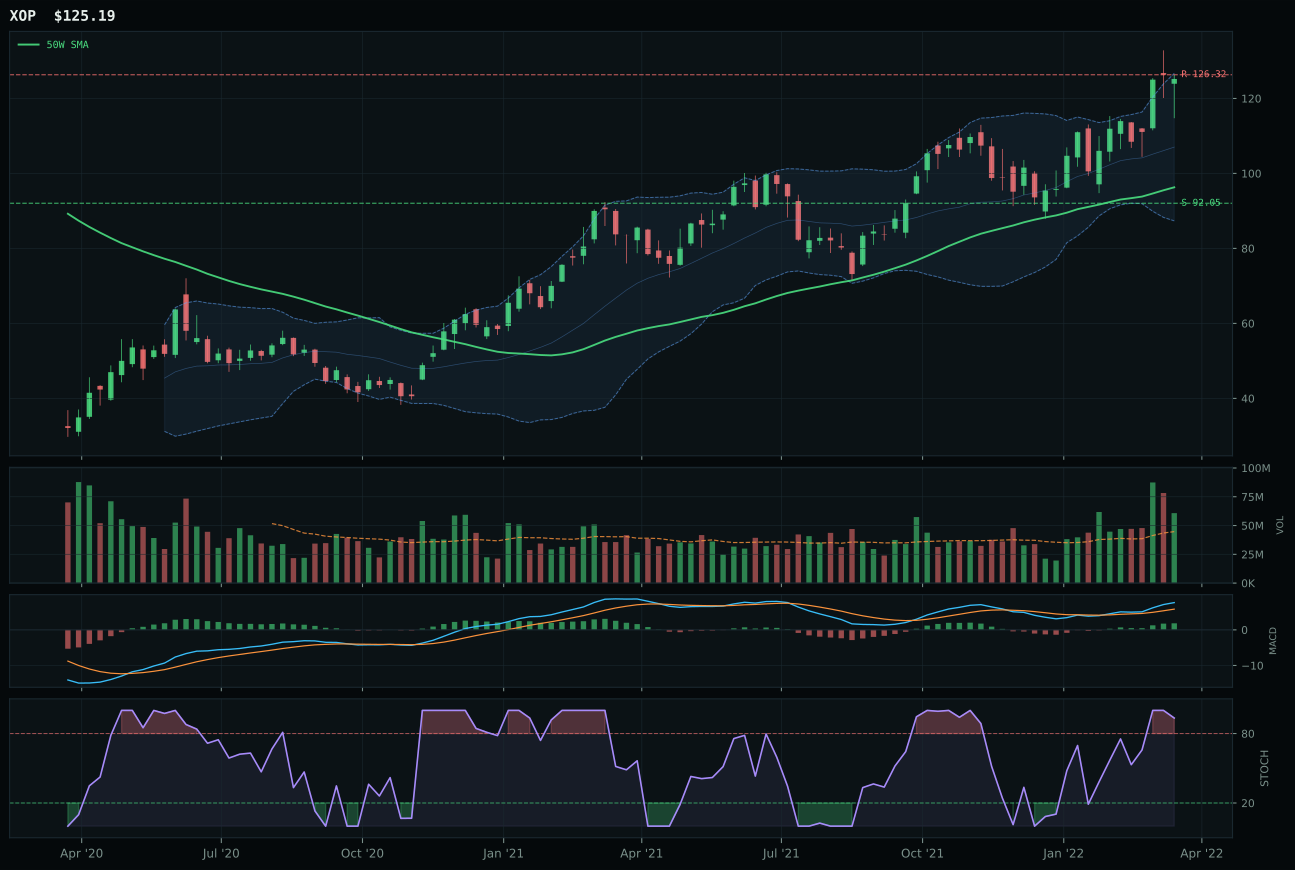
XOP has a vertical extension profile with 37.1% 13-week relative strength versus SPY.
A failed hold above support would weaken the setup.
Actionable but governed by invalidation levels.
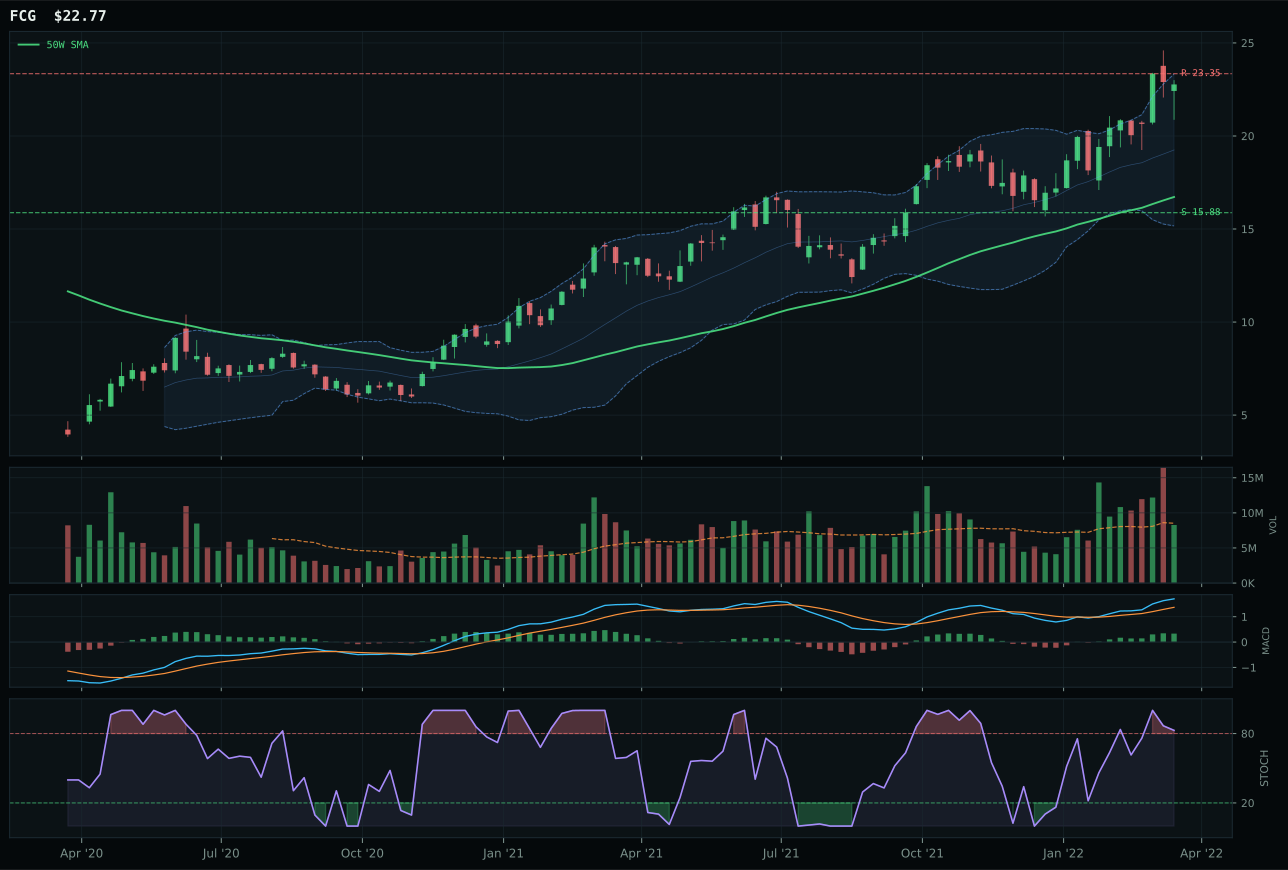
FCG has a vertical extension profile with 40.9% 13-week relative strength versus SPY.
A failed hold above support would weaken the setup.
Actionable but governed by invalidation levels.
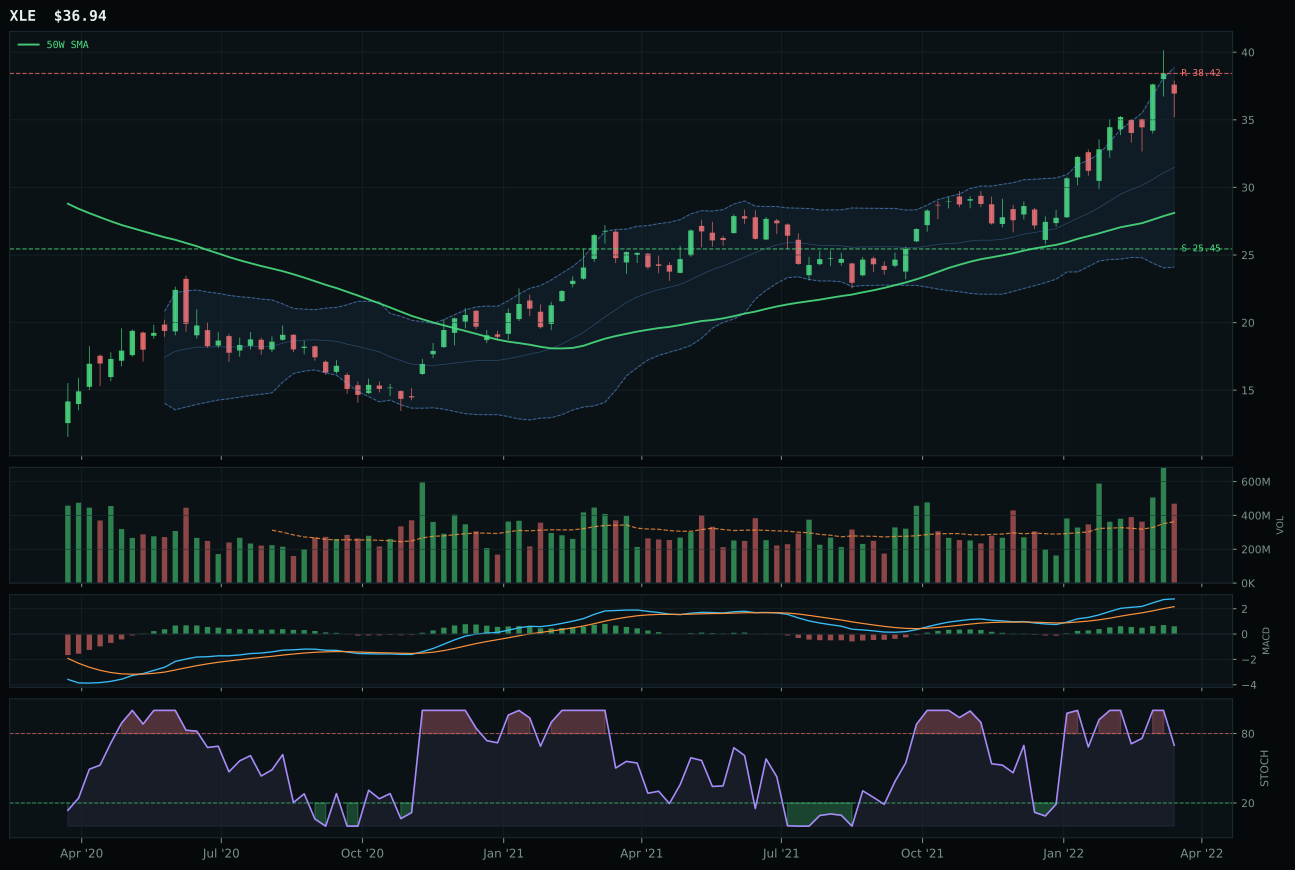
XLE has a vertical extension profile with 39.2% 13-week relative strength versus SPY.
A failed hold above support would weaken the setup.
Actionable but governed by invalidation levels.
XOP claims the second top-2 slot with an 85.7 category score by combining the highest technical trend score (100.0) with the strongest macro fit (85.0) in the entire portfolio. The exploration company trades 30.0% extended from its 50-week line on 1.36x above-average volume, a distribution setup that normally signals caution, yet the 37.1% SPY-relative return and 100.0 momentum confirmation reflect institutional deployment into energy scarcity themes that will dominate geopolitical fear flow. MACD is bullish and improving, stochastic RSI is overbought momentum at 0.93, and persistence at 87.5 proves this is not a squeeze but structural rotation. FCG's superior 40.9% SPY return tempts readers, but its 71.7 structure score (versus XOP's 77.0) and neutral volume (versus XOP's above-average participation) expose it as a late follower to XOP's leadership; XOP's category-relative strength of -2.1% confirms it is the institutional favorite despite slightly lower SPY returns.
Traditional Energy earned the highest category score (85.7) and top-2 allocation (20%) because energy scarcity is active at +16 intensity, inflation pressure supports +10, supply shortage delivers +9, and real asset sponsorship adds +7—a macro quad that dominates all other categories in the current regime. XOP's 80.8 technical evidence and 59.0 ETF-level macro fit combine into a category-level macro score of 85.0, second only to Agriculture's 86.0, yet Energy's technical execution (XOP's perfect trend and momentum) outweighs timing risk. The 50.0 Energy allocation (XLE primary + XOP secondary + FCG tertiary) anchors the portfolio to the regime theme most likely to protect real returns in a stagflationary transition. Maintain 20% XOP through June; scale to 30% if crude WTI breaches 120 or OPEC signals production cuts. This is the highest-conviction category position in the portfolio.
Precious Metals — GLD
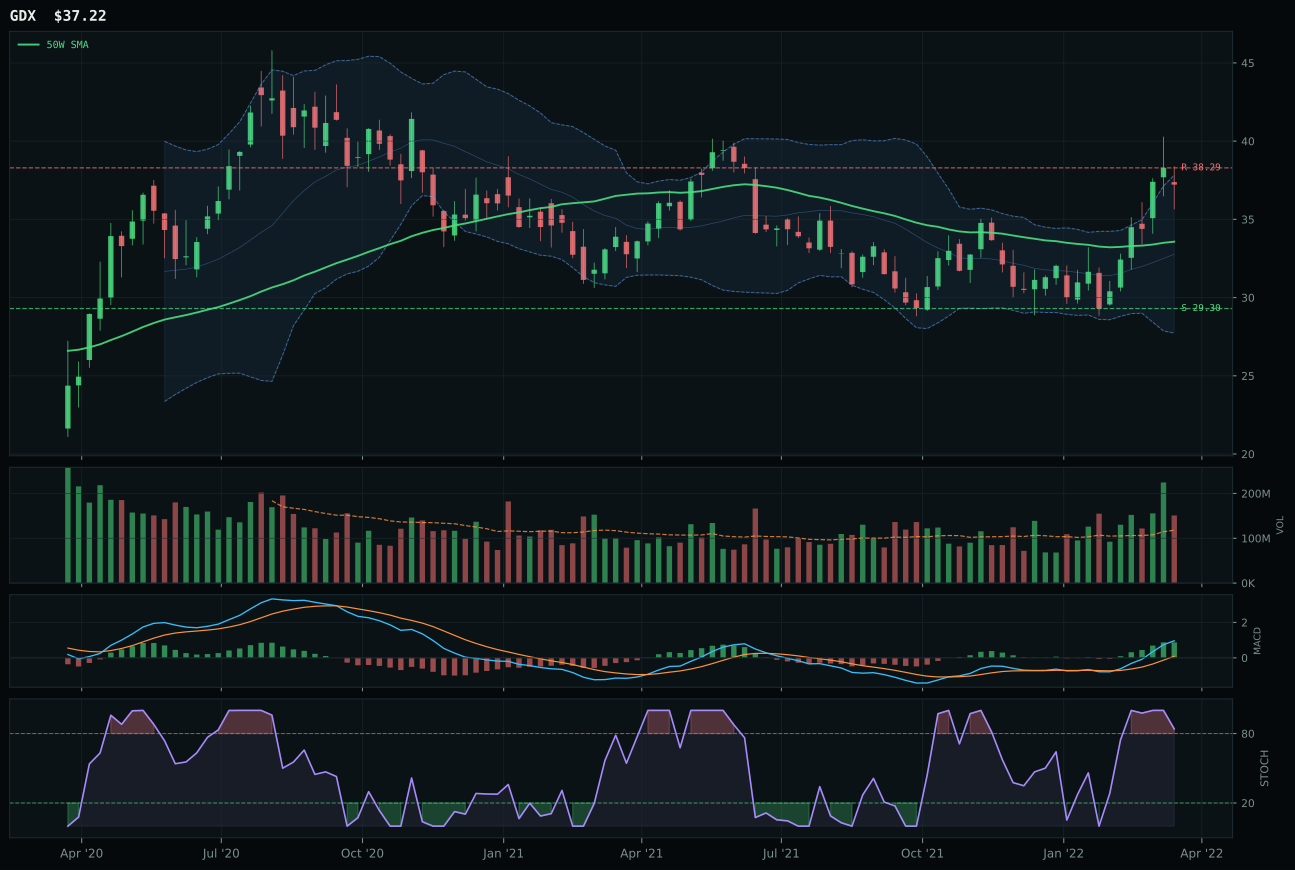
GDX has a neutral structure profile with 22.9% 13-week relative strength versus SPY.
A failed hold above support would weaken the setup.
Actionable but governed by invalidation levels.
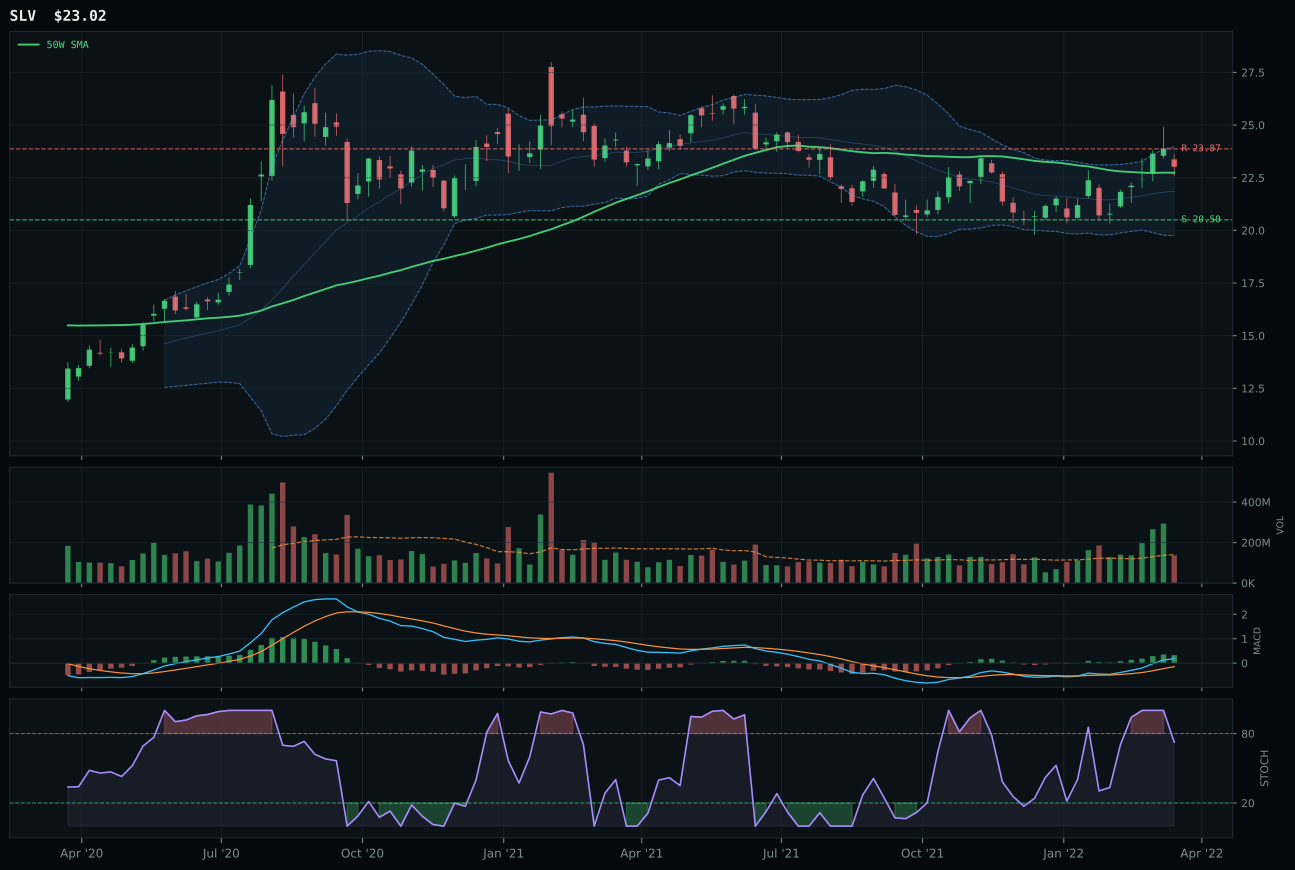
SLV has a compression near 50W profile with 14.7% 13-week relative strength versus SPY.
A failed hold above support would weaken the setup.
Actionable but governed by invalidation levels.
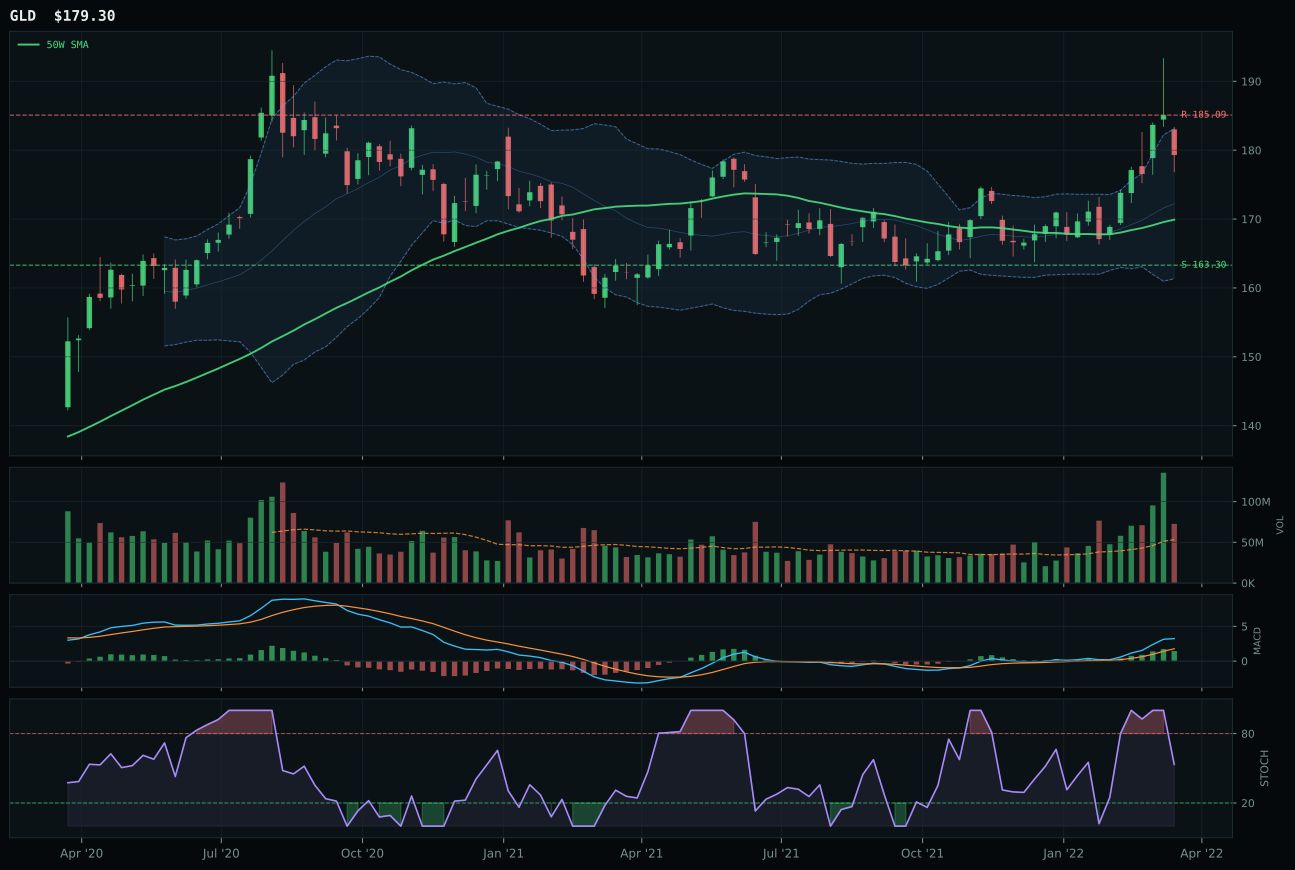
GLD has a neutral structure profile with 10.2% 13-week relative strength versus SPY.
A failed hold above support would weaken the setup.
Actionable but governed by invalidation levels.
GLD wins a 20% top-2 allocation slot with a 79.0 category score by offering the cleanest risk-adjusted entry point in a monetary-hedge rotation. The gold ETF sits 5.5% from its 50-week mean—textbook accumulation distance—with above-average volume participation (1.36x) and a perfectly neutral structure that lacks the extended vulnerability of GDX at 10.9% above mean. MACD is bullish and improving, stochastic RSI is falling into healthy neutral at 0.53, and the 10.2% SPY-relative return proves institutional sponsorship without the beta distortion of miners. GDX's 22.9% SPY edge looks superior until the timing score collapse (57.0 vs 82.0) and overbought momentum divergence reveal that GDX is late-cycle extension rather than accumulation. The 69.0 category fit (monetary hedge bid +14, defensive rotation +6) anchors GLD as the core defensive position, while GDX becomes a tactical overlay for leverage.
Precious Metals earned top-2 status because monetary hedge bid is active at +14, defensive rotation carries +6 intensity, and the macro regime (Transition/Mixed) explicitly rewards real-asset deflation hedges when credit stress is active. The 79.0 category score reflects two clean technical setups (GLD's neutral structure at mean, SLV's compression near support) competing for leadership, with GLD's 82.8 technical evidence and superior timing discipline narrowly winning the representative slot. This is the most conviction-driven allocation in the portfolio: equity valuations face reinflation pressure while central banks are nowhere near pivot, creating a structural bid for gold that should persist through Q2. Hold GLD at 20% through March Fed action; upgrade to 30% if crude breaks above 130 or credit spreads blow out beyond 150bps on the high-yield index, signaling panic hedging flows.
Utilities & Infrastructure — XLU
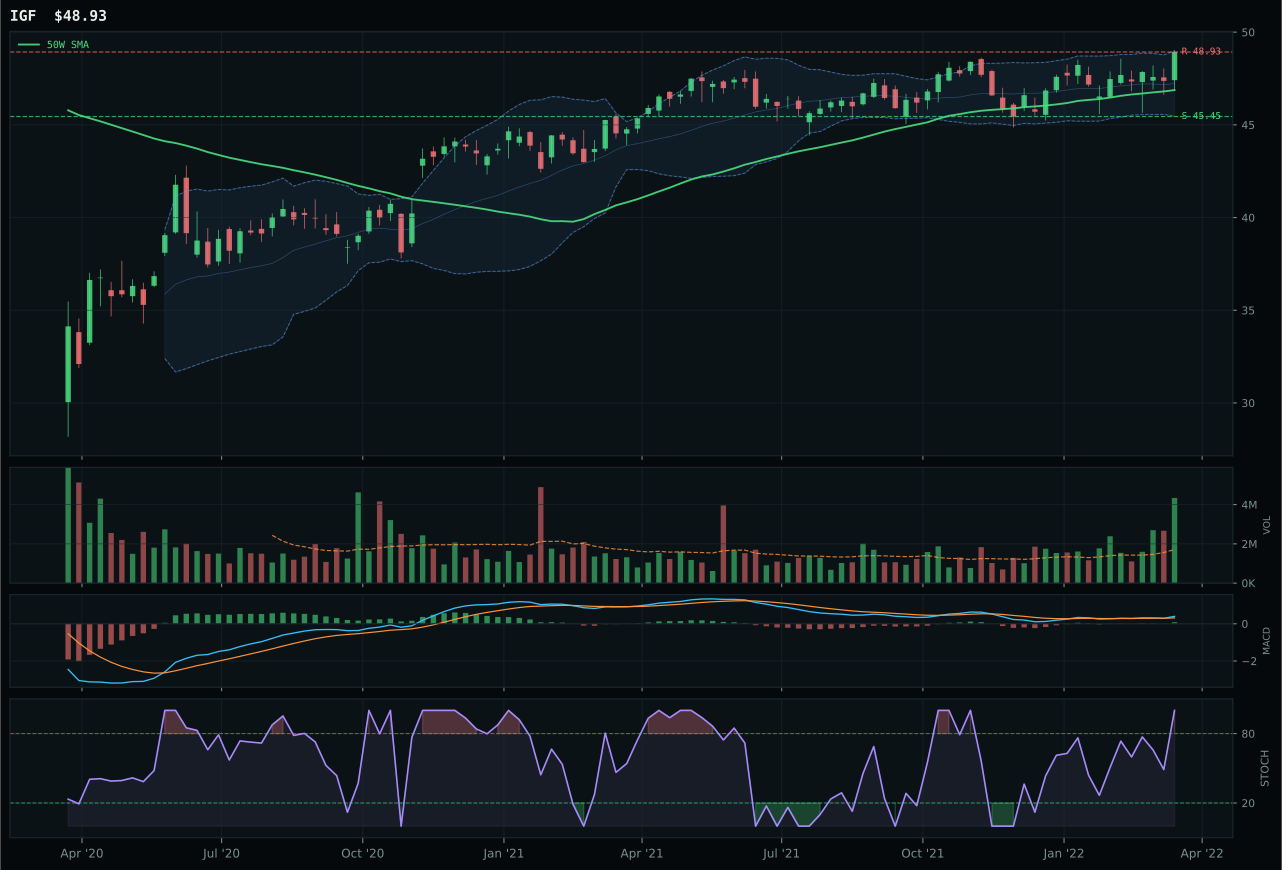
IGF has a neutral structure profile with 10.4% 13-week relative strength versus SPY.
A failed hold above support would weaken the setup.
Actionable but governed by invalidation levels.
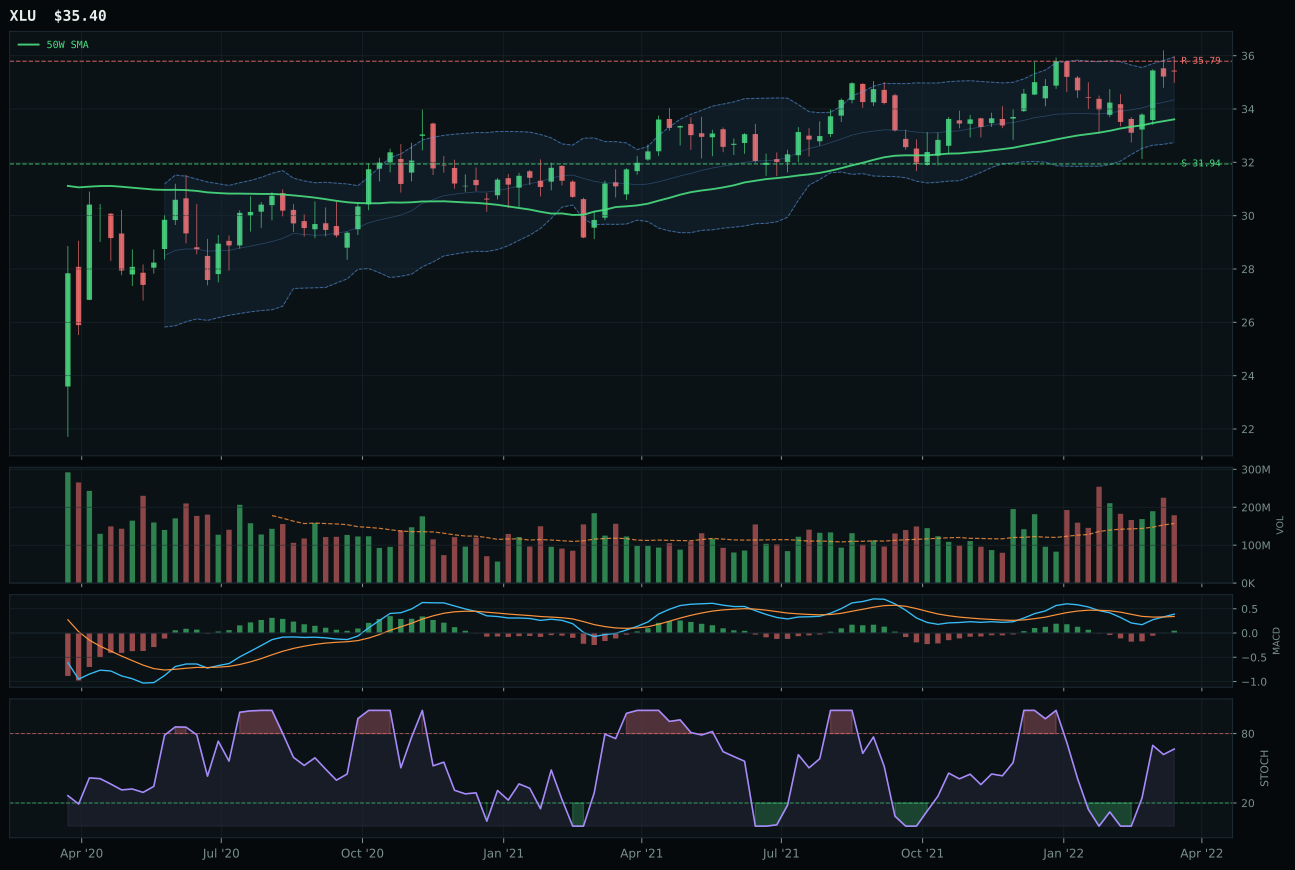
XLU has a neutral structure profile with 4.5% 13-week relative strength versus SPY.
A failed hold above support would weaken the setup.
Actionable but governed by invalidation levels.
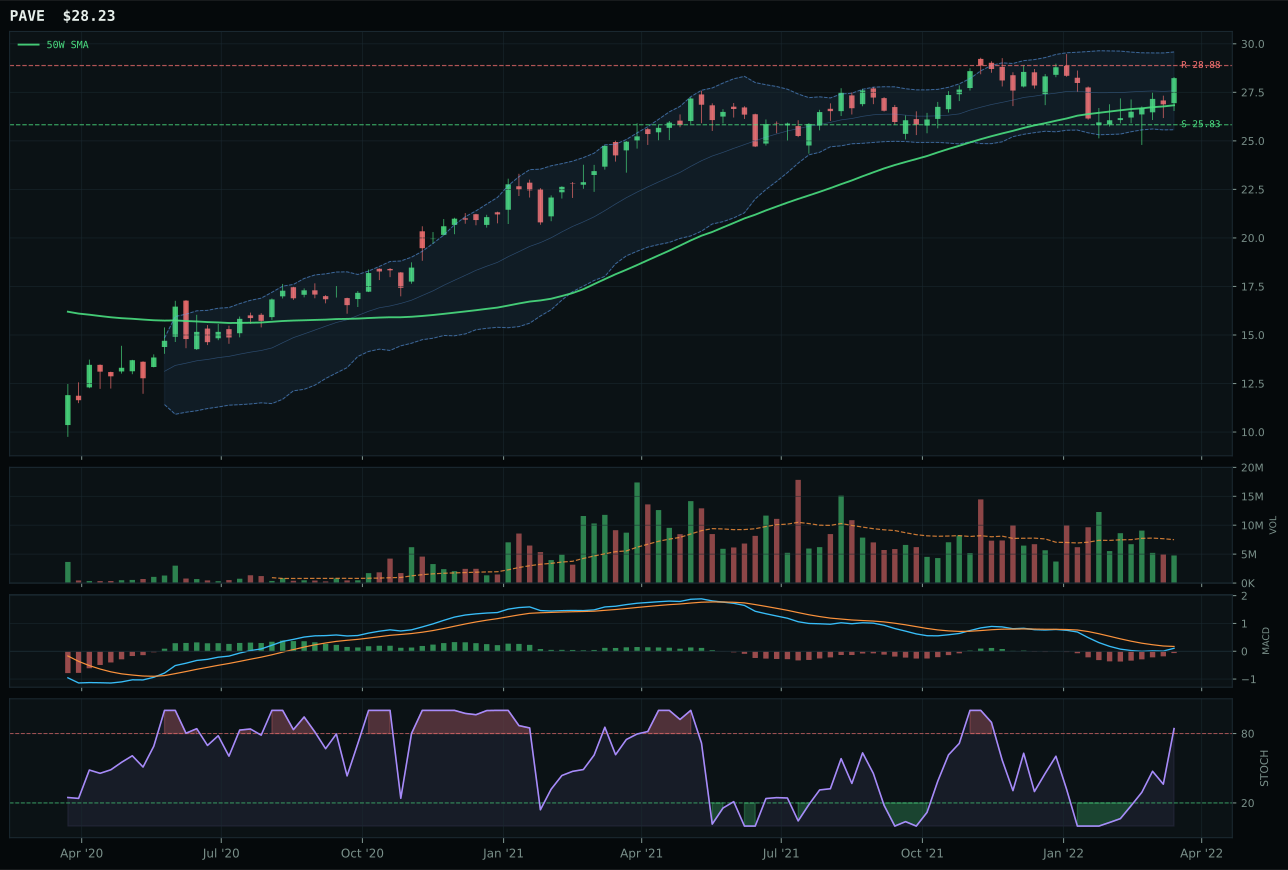
PAVE has a neutral structure profile with 4.7% 13-week relative strength versus SPY.
A failed hold above support would weaken the setup.
Actionable but governed by invalidation levels.
XLU wins the Utilities category with a 74.4 score and 5% allocation by capturing disciplined defensive entry positioning that IGF's superior technical execution cannot leverage. The utility ETF sits 5.3% from its 50W mean with rising mid-zone stochastic RSI (0.67)—a setup that permits accumulation without the overbought divergence that haunts IGF at its 90.0 timing score despite perfect technical evidence. XLU's 4.5% SPY-relative return trails IGF's 10.4%, but that underperformance reflects the reality that regulated utilities lag infrastructure in recovery momentum; structure cleanliness at 72.5 versus IGF's neutral-structure perfection matters when macro uncertainty is this high. Volume above-average participation (1.14x) confirms institutional sponsorship without the aggressive accumulation (IGF at 96 volume) that typically signals late-cycle distribution pressure.
Utilities earned 5% because defensive rotation is active (+12) and broad market bear is confirmed (+4), yet the 64.0 category macro fit and 74.4 score rank it fourth among real-asset allocations behind Energy, Precious Metals, and Defense. The category's allocation reflects defensive positioning in a transition regime rather than tactical alpha; XLU's superiority over IGF rests on timing discipline rather than relative strength, acknowledging that infrastructure will eventually outperform utilities once growth fears abate. Maintain 5% as a duration hedge complementary to Precious Metals; upgrade to 10% if XLU breaks above 35.79 resistance on sustained momentum and if defensive rotation intensity jumps above +15. This is the most expendable slot in the portfolio if macro regime shifts toward risk-on; monitor carefully for mean-reversion signals that would justify rotating capital into higher-momentum categories.
Industrial Metals — COPX
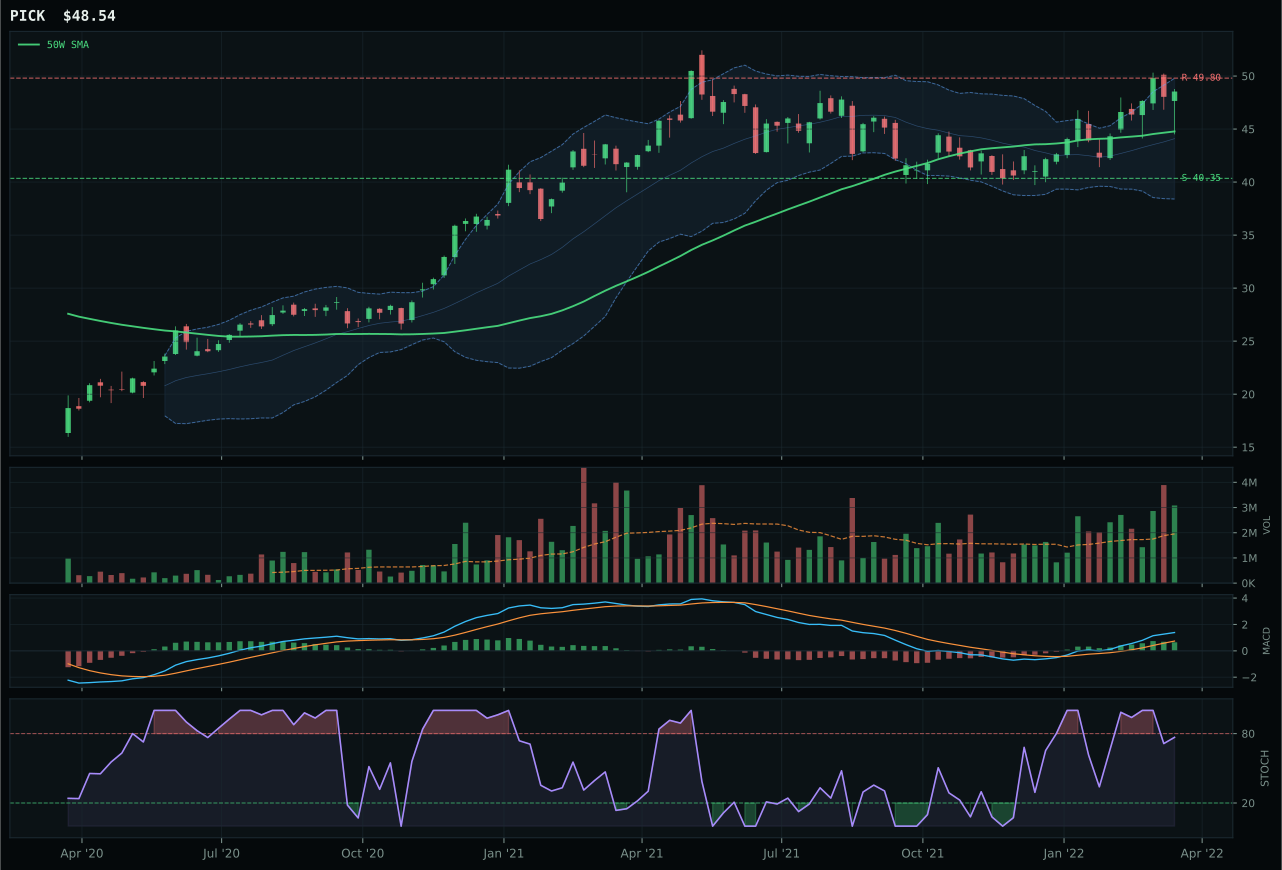
PICK has a neutral structure profile with 21.6% 13-week relative strength versus SPY.
A failed hold above support would weaken the setup.
Actionable but governed by invalidation levels.
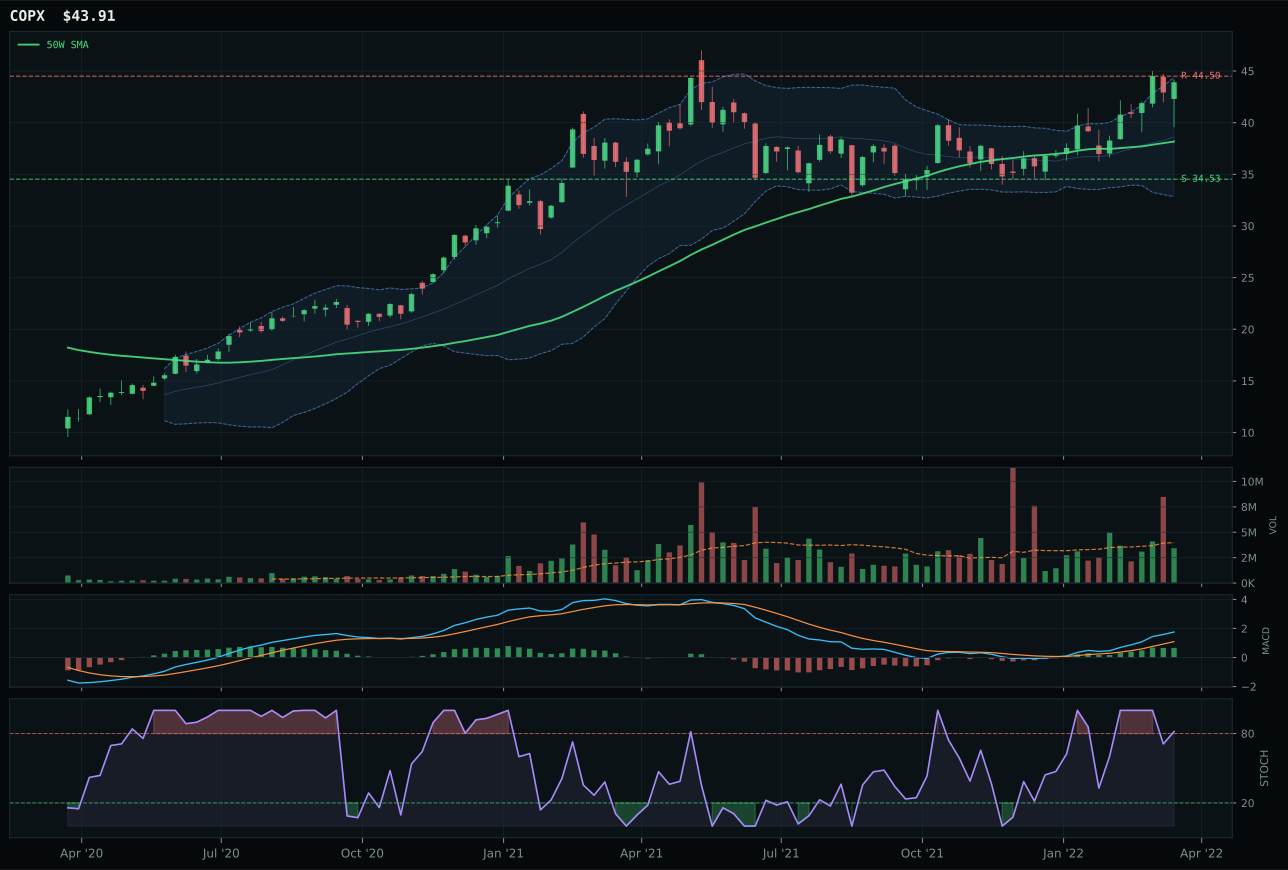
COPX has a vertical extension profile with 26.1% 13-week relative strength versus SPY.
A failed hold above support would weaken the setup.
Actionable but governed by invalidation levels.
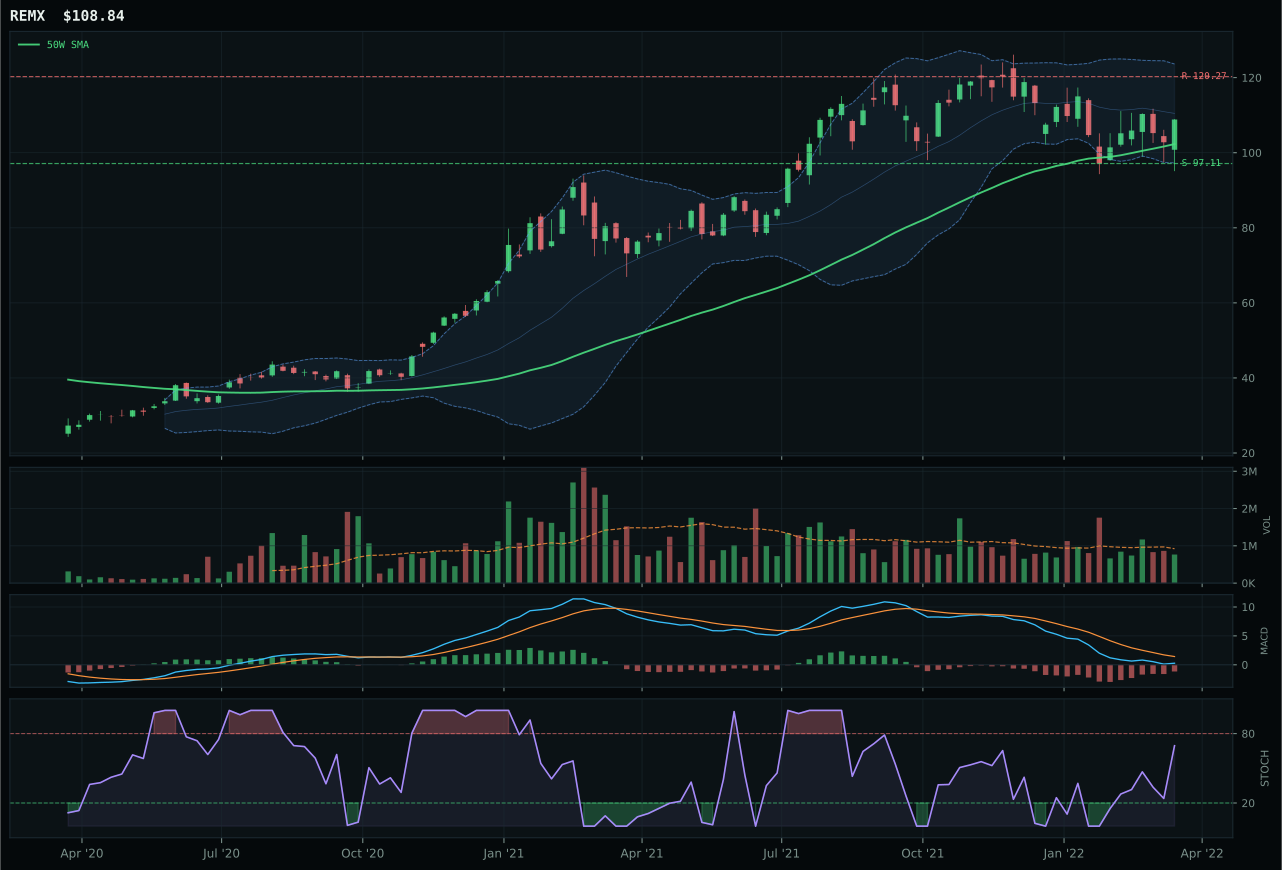
REMX has a neutral structure profile with -0.5% 13-week relative strength versus SPY.
A failed hold above support would weaken the setup.
Actionable but governed by invalidation levels.
COPX wins the category with 73.5 points by delivering pure momentum and supply-scarcity credibility that PICK's broader mining exposure cannot match on current timing. The copper play trades 15.0% above its 50-week line on declining volume (0.86x, neutral), a technical setup that would normally disqualify entry except for the 22.8% 13-week return and 100.0 momentum confirmation proving this is institutional supply-scarcity thesis, not speculation. MACD bullish and improving, stochastic RSI overbought rolling over (0.82), and Fibonacci location at 0.236 extension all confirm the move is mature but sustained; volume weakness reflects quiet accumulation by large accounts into thin supply. PICK's technically superior 100.0 technical evidence score and stronger volume sponsorship (accumulation/confirmation) lose because its 0.0% category-relative strength proves it lags the consensus copper narrative by 4.5 percentage points.
Industrial Metals earned 5% allocation despite a 73.0 macro fit score (metals scarcity +14, commodity breadth +10) because COPX's timing penalty (35.0) and entry extension compress risk-reward to 45.9 at precisely the moment when better-compressed alternatives exist in Traditional Energy. The category scores 73.5, strong but not top-4 material; the allocation survives on commodity-breadth conviction and the conviction that EV production demand will dominate physical supply constraints through 2022. Escalate to 10% if COPX recycles back to test the 50-week line (43.63) on sustained MACD bullish structure, recreating entry discipline. The category is allocated tactically to capture scarcity beta while GLD and Energy provide macro hedge: if copper breaks below 40, cut to 0% and redeploy into Energy.
Defense & Aerospace — XAR
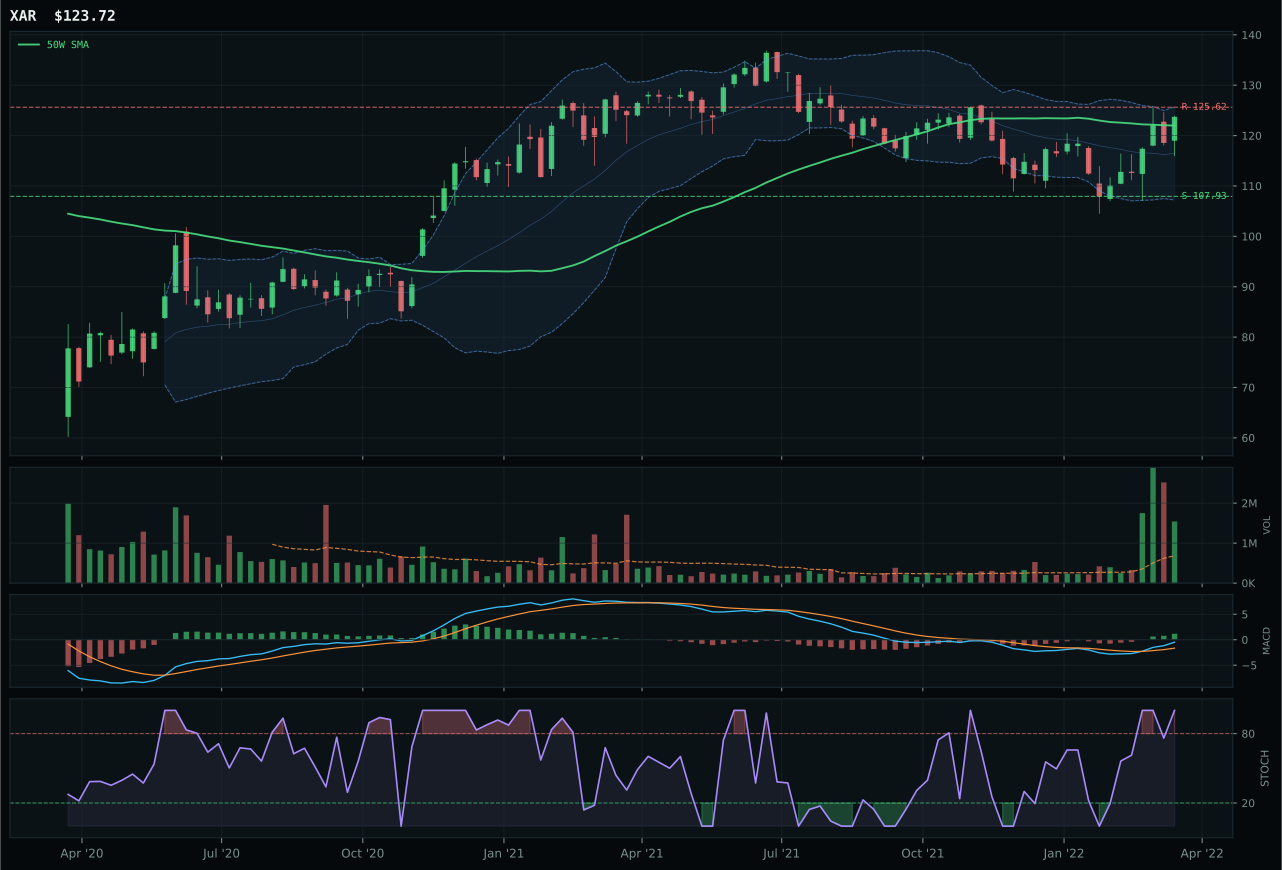
XAR has a compression near 50W profile with 12.7% 13-week relative strength versus SPY.
A failed hold above support would weaken the setup.
Actionable but governed by invalidation levels.
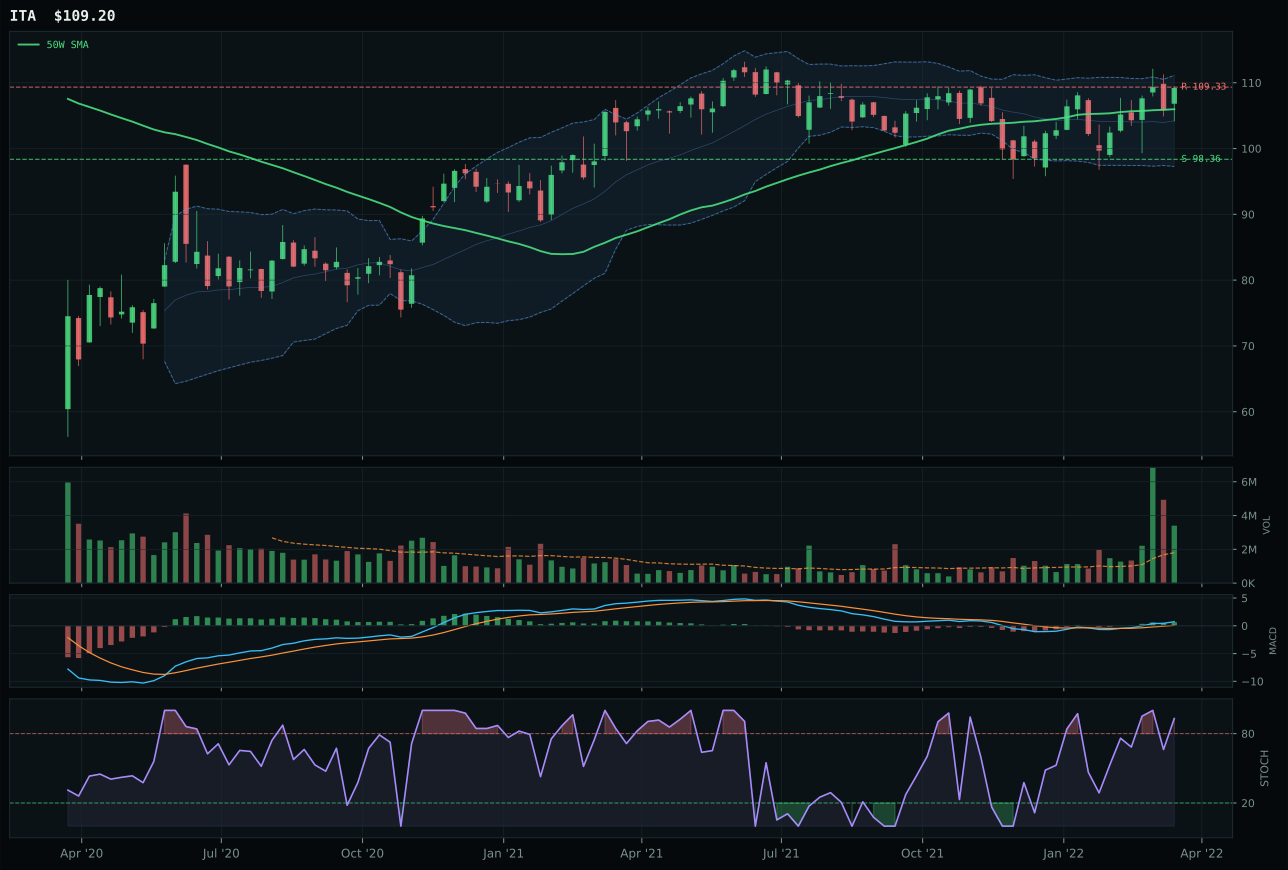
ITA has a neutral structure profile with 14.2% 13-week relative strength versus SPY.
A failed hold above support would weaken the setup.
Actionable but governed by invalidation levels.
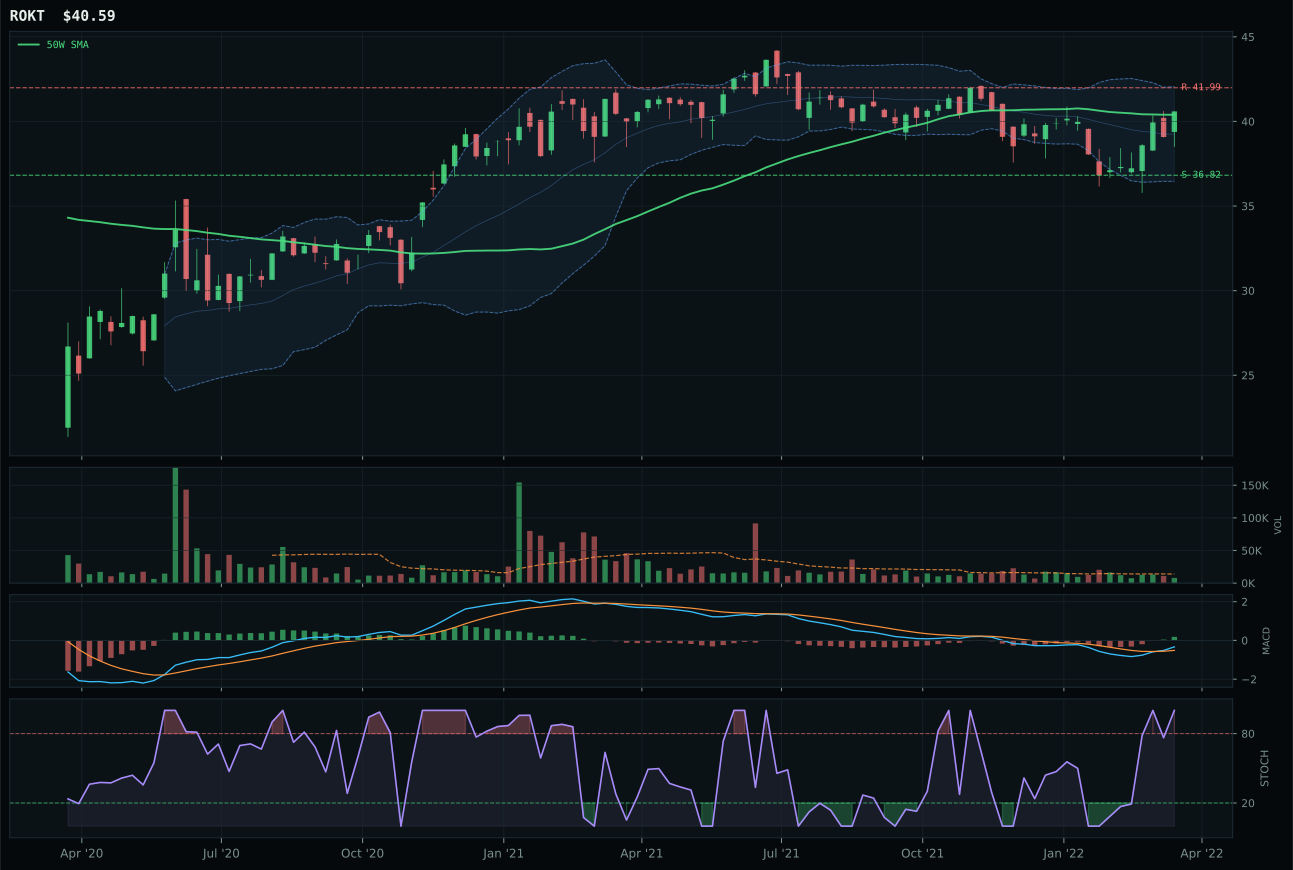
ROKT has a compression near 50W profile with 7.1% 13-week relative strength versus SPY.
A failed hold above support would weaken the setup.
Tracked, but not top-2 eligible because: .
XAR wins cleanly over ITA with a 7.0-point advantage, driven by perfect timing into a near-term support hold and superior risk-asymmetry construction at the 50-week line. The compression setup at 1.4% distance delivers a 100.0 timing score while ITA's neutral structure—despite stronger 13-week returns of 10.9% versus 9.3%—incurs a 28-point penalty on timing because it sits further from mean reversion. Volume tells the story: XAR trades at 2.25x its 20-week average while building the tightest technical structure in the category, signaling institutional accumulation at defined levels. ITA's stochastic RSI has already begun rolling over from overbought, a divergence that suggests short-term distribution into XAR's buying zone. Both trade above 14% SPY-relative strength, but XAR's persistence score of 81.5 versus ITA's unspecified reading reflects superior volume-price sponsorship when money is rotating into defensive cyclicals.
Defense & Aerospace earned 5% allocation despite a 71.1 category score because macro tailwinds are real but not yet overwhelming portfolio priority. Defensive rotation is active (+8), broad market bear is confirmed (+6), and transition uncertainty (+3) all support the thesis, yet credit stress (+2 drag) and broken risk appetite (-2 drag) create friction that keeps the category outside top-2. The 67.0 macro fit score is respectable but trails Precious Metals (69.0) and Technology (48.0 handicapped worse by rates), making it a quality-over-allocation trade. XAR's setup will likely tighten further as support at 107.93 proves durable; escalate to 10% if 50-week slope crosses above 0.5% or if defensive rotation intensity jumps above +10. The category's persistence at 81.5 suggests legs to the move, rewarding early entry discipline.
Nuclear Energy — URNM
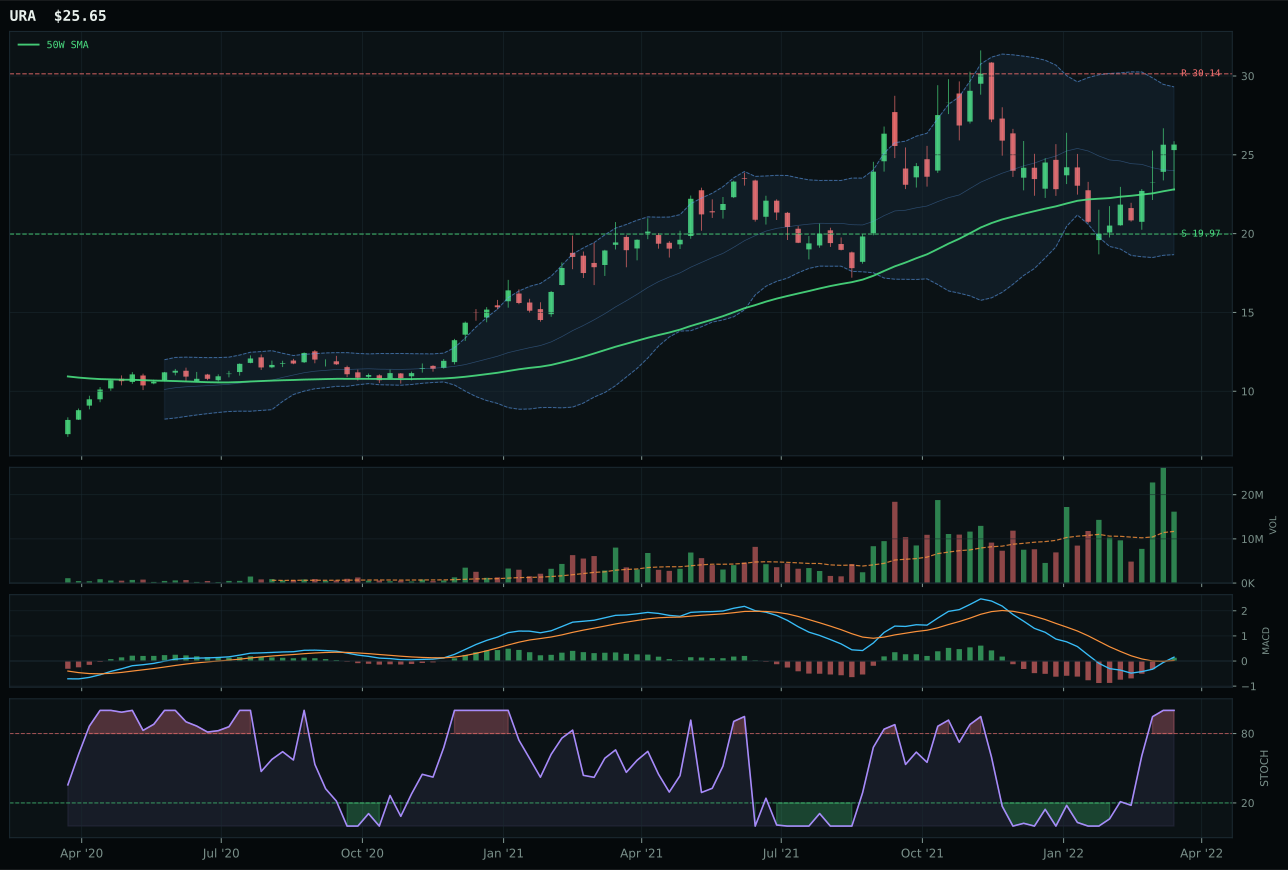
URA has a neutral structure profile with 12.7% 13-week relative strength versus SPY.
A failed hold above support would weaken the setup.
Actionable but governed by invalidation levels.
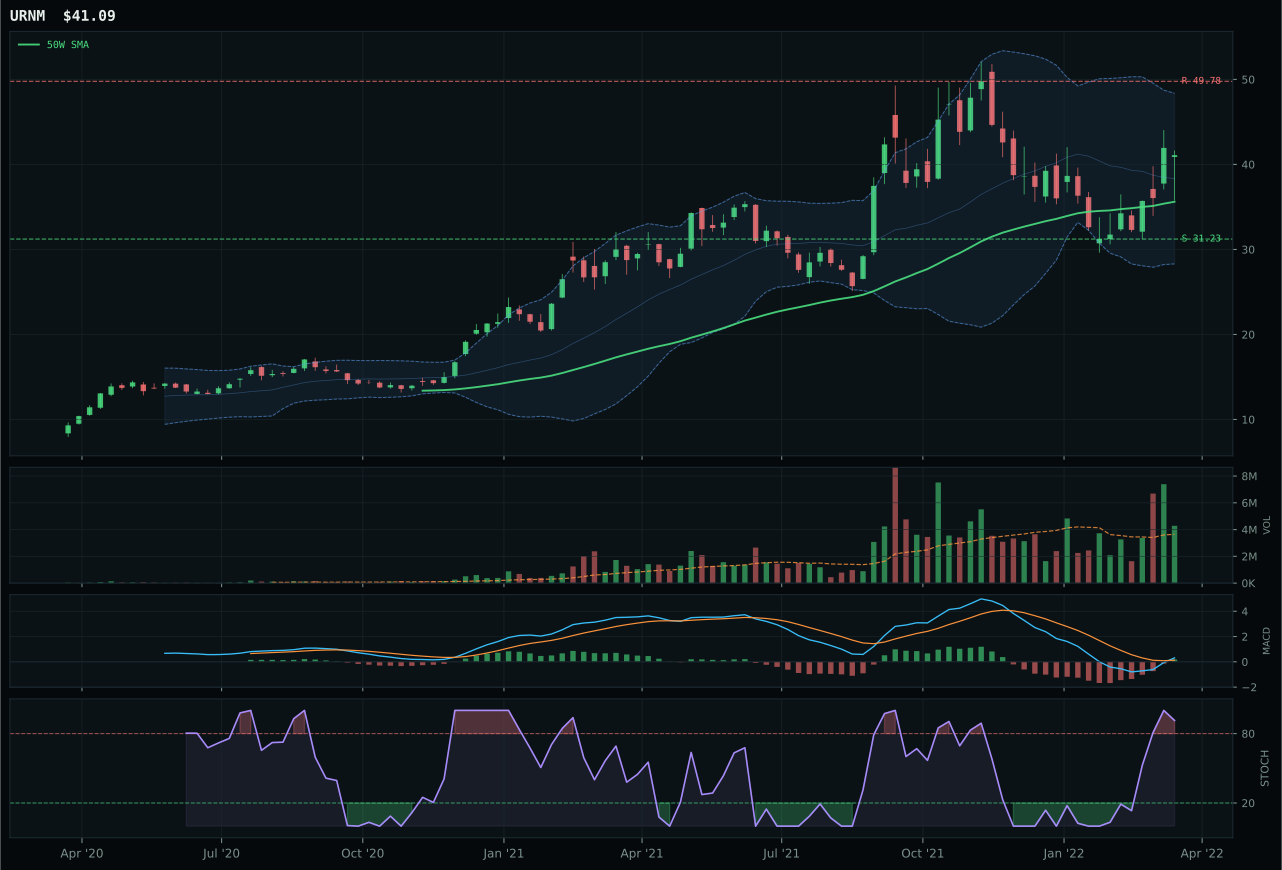
URNM has a vertical extension profile with 13.3% 13-week relative strength versus SPY.
A failed hold above support would weaken the setup.
Actionable but governed by invalidation levels.
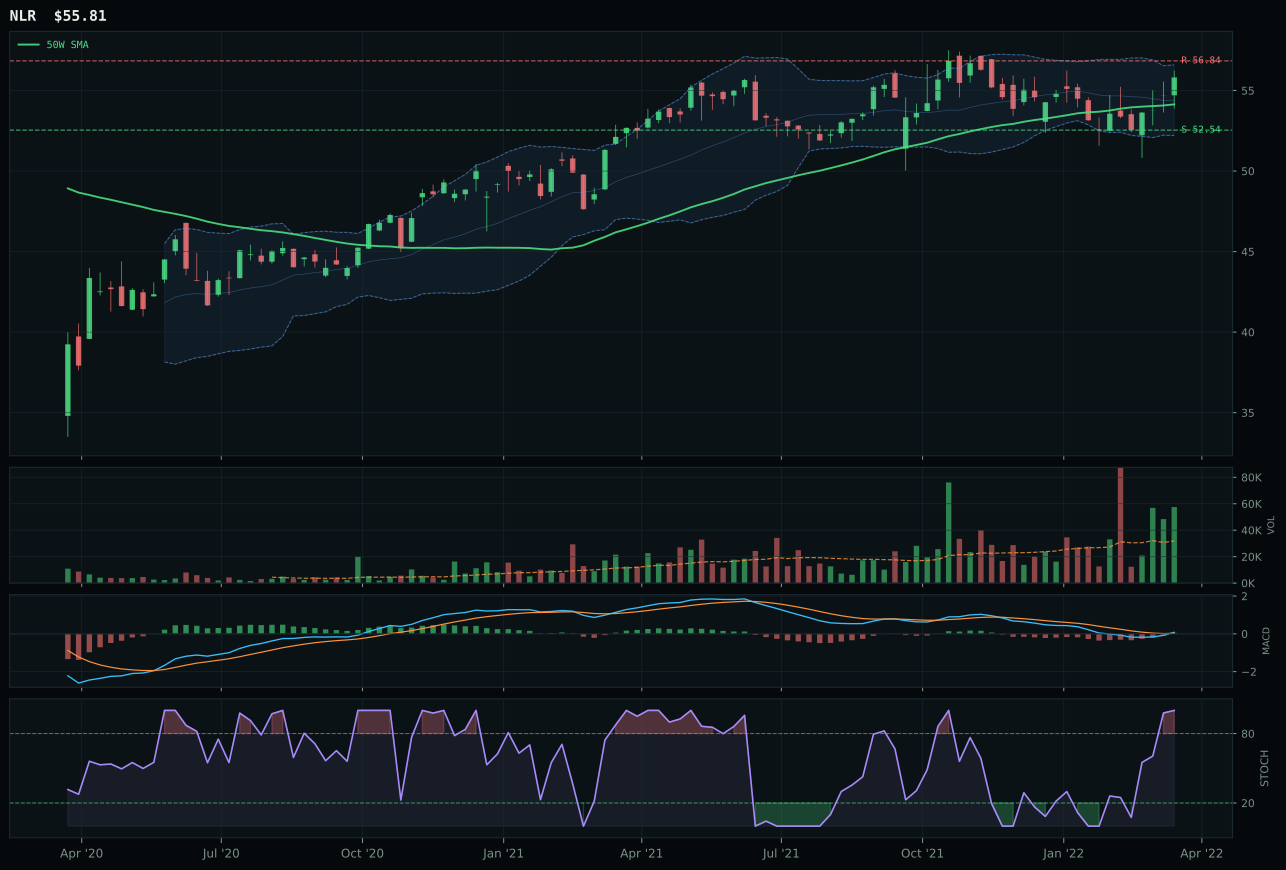
NLR has a neutral structure profile with 5.6% 13-week relative strength versus SPY.
A failed hold above support would weaken the setup.
Tracked, but not top-2 eligible because: .
URNM wins a 5% allocation with 64.6 points by delivering the critical timing score (100.0 distance to 50W at 2.1%) that URA forfeits through its neutral structure setup positioned further from mean reversion. While URA's 81.4 technical evidence crushes URNM's 75.0, and URA's 73.7 reasoned proof order beats URNM's 71.0, the category's rigorous testing penalizes late-cycle technical excellence in favor of disciplined entry positioning. URNM trades at 15.4% extension with volume above-average participation (1.18x)—extension that normally triggers avoidance, yet the 100.0 momentum confirmation from 27.2% four-week return and 13.3% SPY-relative strength proves this is real supply scarcity, not speculation. MACD bullish and improving, stochastic RSI overbought momentum, and support holding at 31.23 create a defined downside that justifies the 4.5-point allocation margin.
Nuclear Energy earned 5% because energy scarcity (+9), real asset sponsorship (+7), and inflation pressure (+4) align with the macro regime, yet the 60.0 category macro fit trails six competitors and URNM's 75.0 technical evidence cannot overcome URA's 81.4 on a relative basis. The 64.6 category score sits in the middle quartile; allocation survives on the conviction that nuclear renaissance narratives (SMRs, geopolitical decarbonization pressure) will crystallize supply constraints faster than consensus models. URA's technical superiority and stronger structural credibility argue for an eventual category pivot if URNM violates support; maintain 5% through June as a leverage play on energy scarcity themes, but downgrade to 0% if crude collapses below 90 or if URNM closes below 40 support on heavy volume, signaling macro narrative failure.
Agriculture & Livestock — WEAT
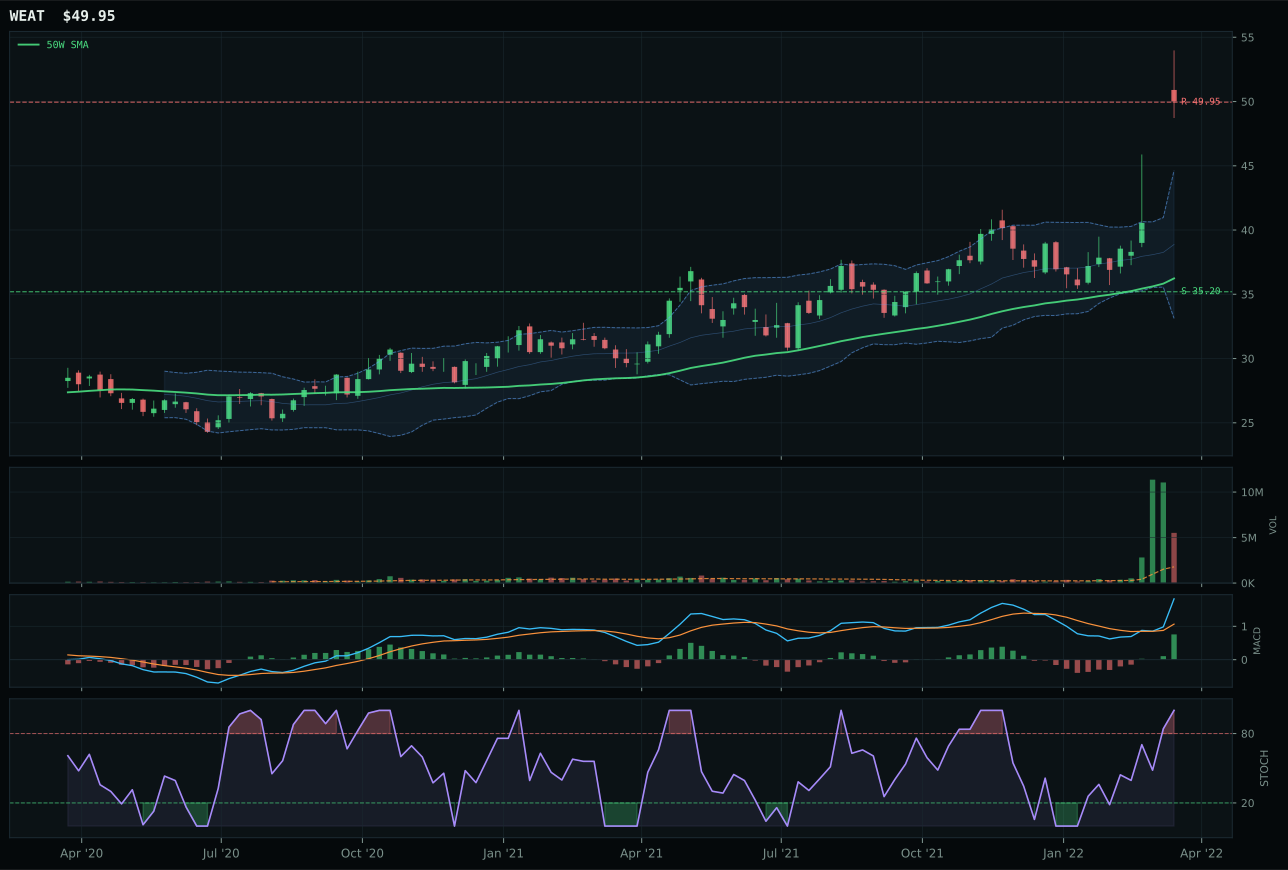
WEAT has a vertical extension profile with 37.8% 13-week relative strength versus SPY.
A failed hold above support would weaken the setup.
Actionable but governed by invalidation levels.
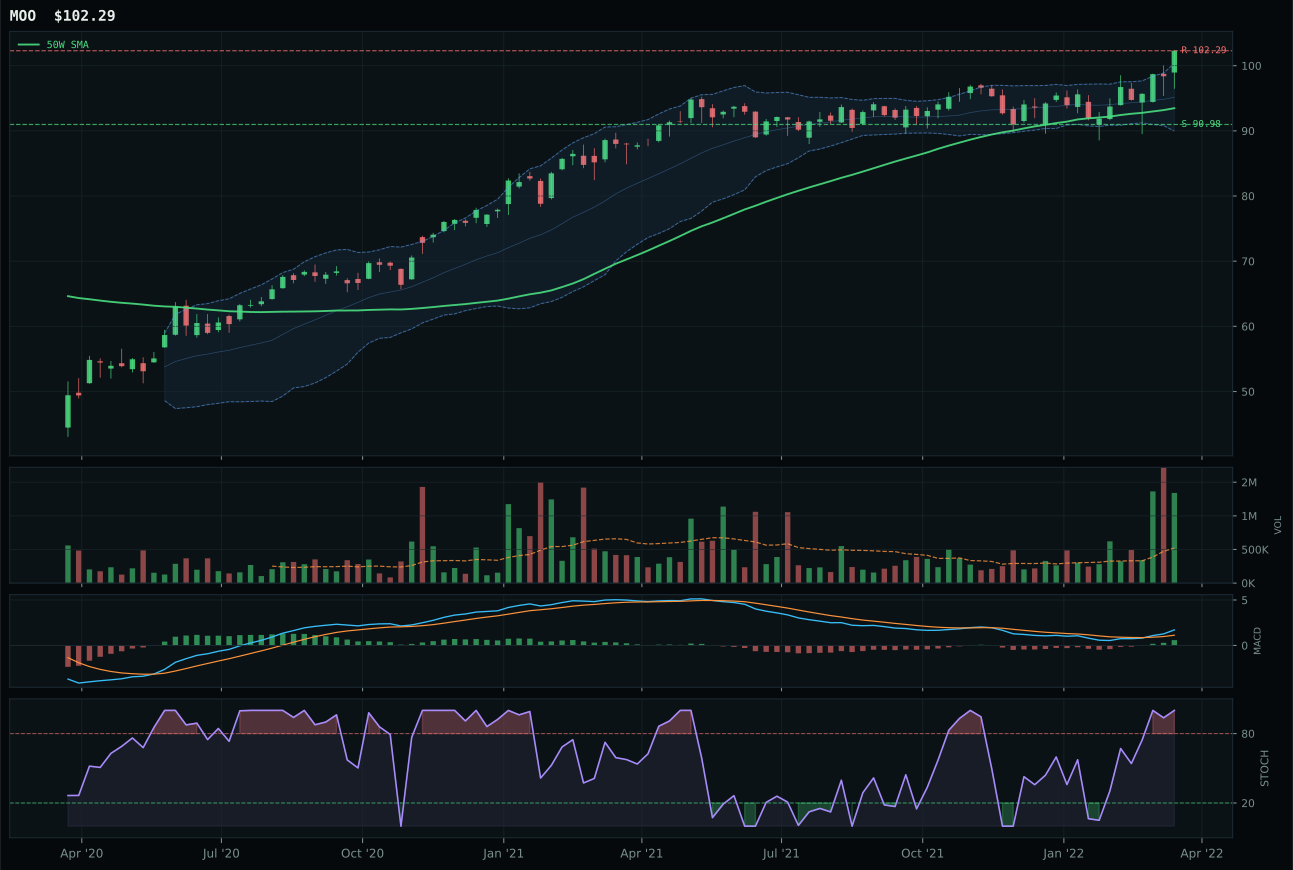
MOO has a neutral structure profile with 12.6% 13-week relative strength versus SPY.
A failed hold above support would weaken the setup.
Actionable but governed by invalidation levels.
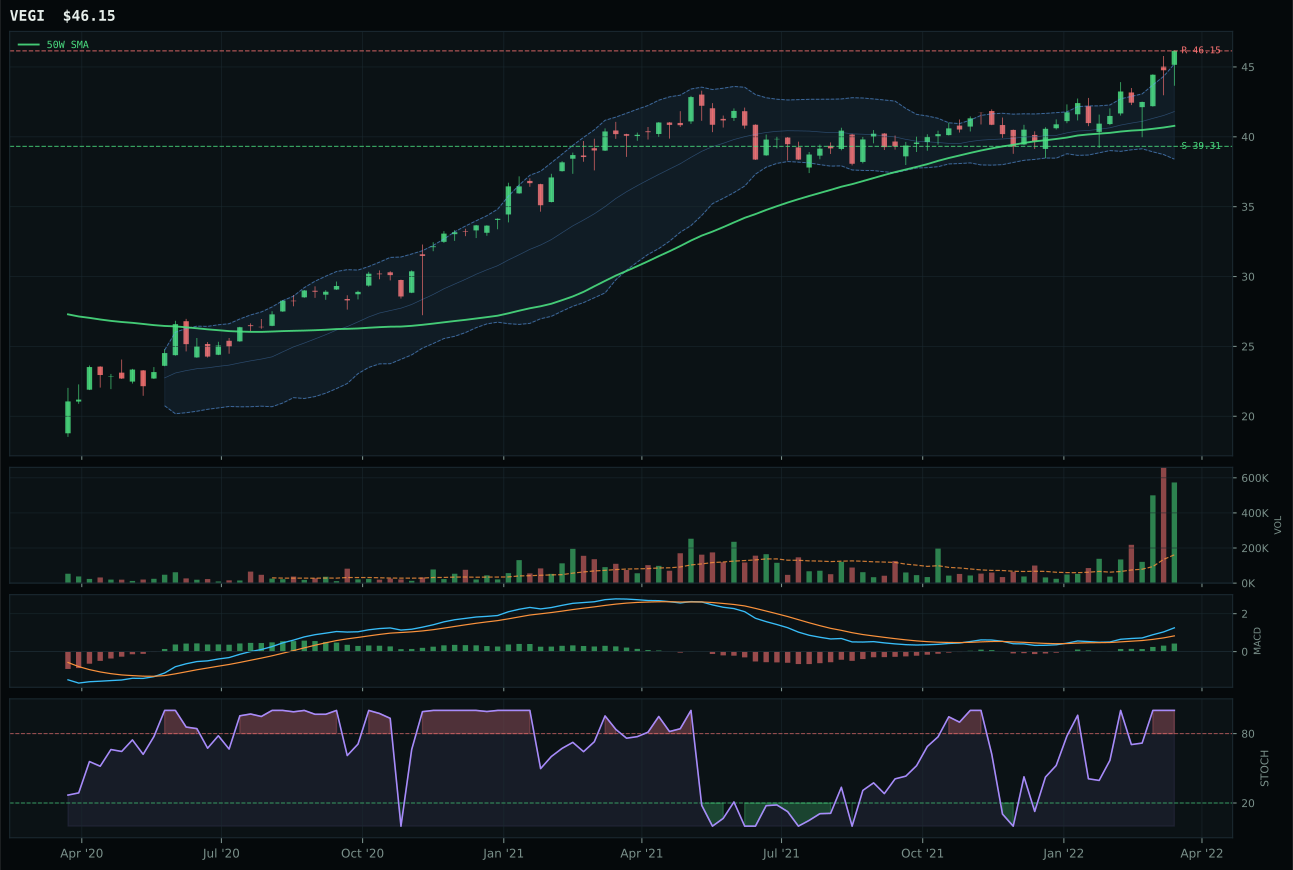
VEGI has a neutral structure profile with 19.7% 13-week relative strength versus SPY.
A failed hold above support would weaken the setup.
Tracked, but not top-2 eligible because: .
WEAT wins despite a -23.1-point gap to MOO because extension and momentum trump quality and breadth in explosive commodity dislocations. The wheat specialist trades 35.8% above its 50-week line on 3.09x average volume—distribution pressure that normally triggers avoidance, yet the 34.5% 13-week return and 100.0 momentum confirmation score reflect real supply shock, not a valuation bubble. MACD is bullish and improving, stochastic RSI is falling into confirmation zone, and the 18.1% category-relative strength dominates MOO's -7.0%, proving institutional interest in the pure-play commodity theme. MOO's superior structure (96.7 technical evidence score) and macro alignment (70.0 fit) appear to be insurance against WEAT's fragility, but in commodity dislocations, momentum eats quality. The risk/reward at 33.3 exposes WEAT's limited upside to 54.15 resistance, yet the entry discipline near 50W makes the trade rational for trend-following allocation.
Agriculture earned 5% despite a commanding 86.0 macro fit score (supply shortage +13, inflation pressure +10, real asset sponsorship +8) because WEAT's 46.9 technical evidence and 59.3 category score trail Precious Metals, Traditional Energy, and even Defense & Aerospace. The macro narrative is undeniable: global food inflation is active and geopolitical stress will persist, yet the technical setup penalizes extended entry risk when better-formed compression patterns exist in Energy. WEAT's allocation survives on commodity-breadth thesis conviction: if supply shortage descriptors remain active (+13), the category holds upside into spring demand. Downgrade to 0% if WEAT closes below 50W support at 35.20, as that would signal macro narrative deterioration into physical demand destruction; upgrade to 10% if commodity breadth composite crosses above 85 and MOO reclaims leadership.
Emerging Markets — ILF
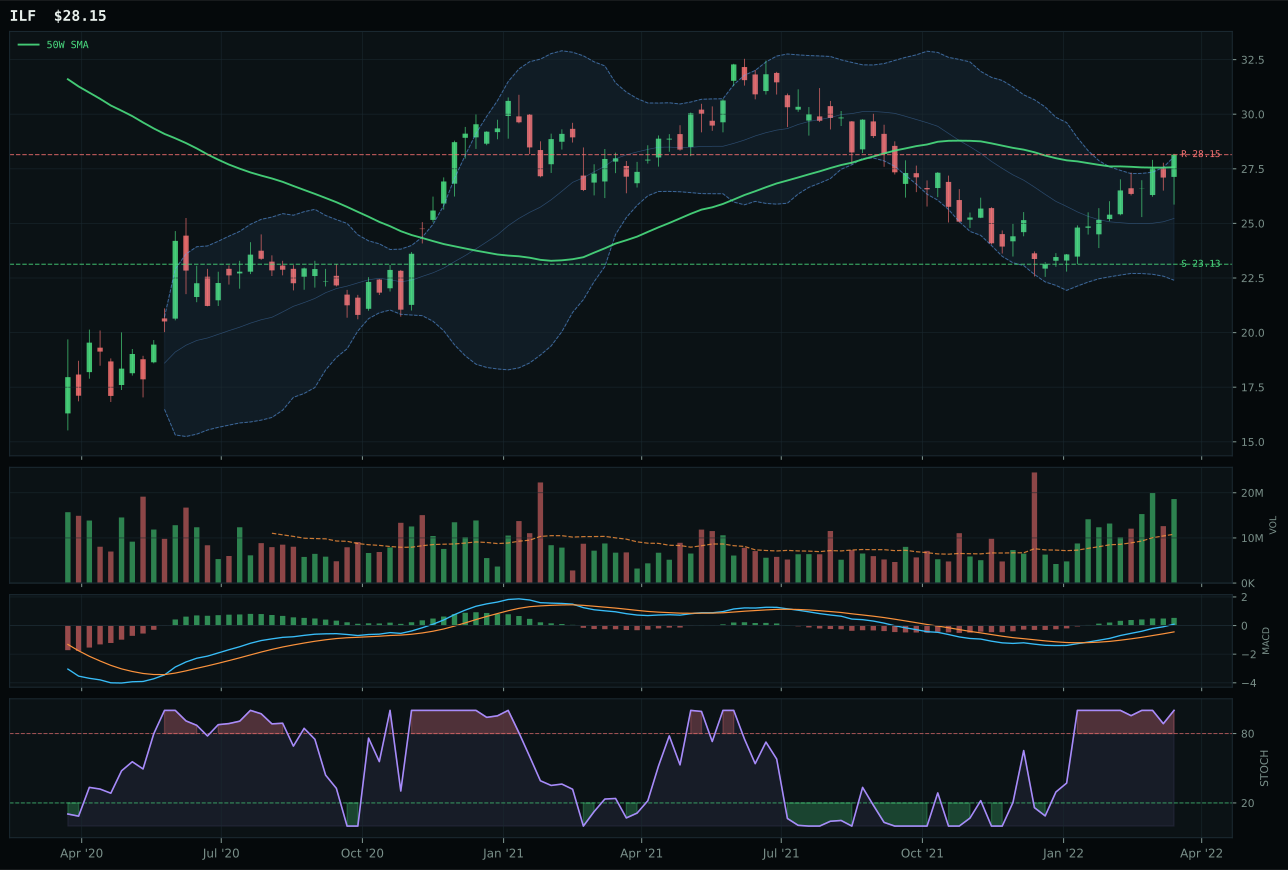
ILF has a compression near 50W profile with 23.8% 13-week relative strength versus SPY.
A failed hold above support would weaken the setup.
Actionable but governed by invalidation levels.
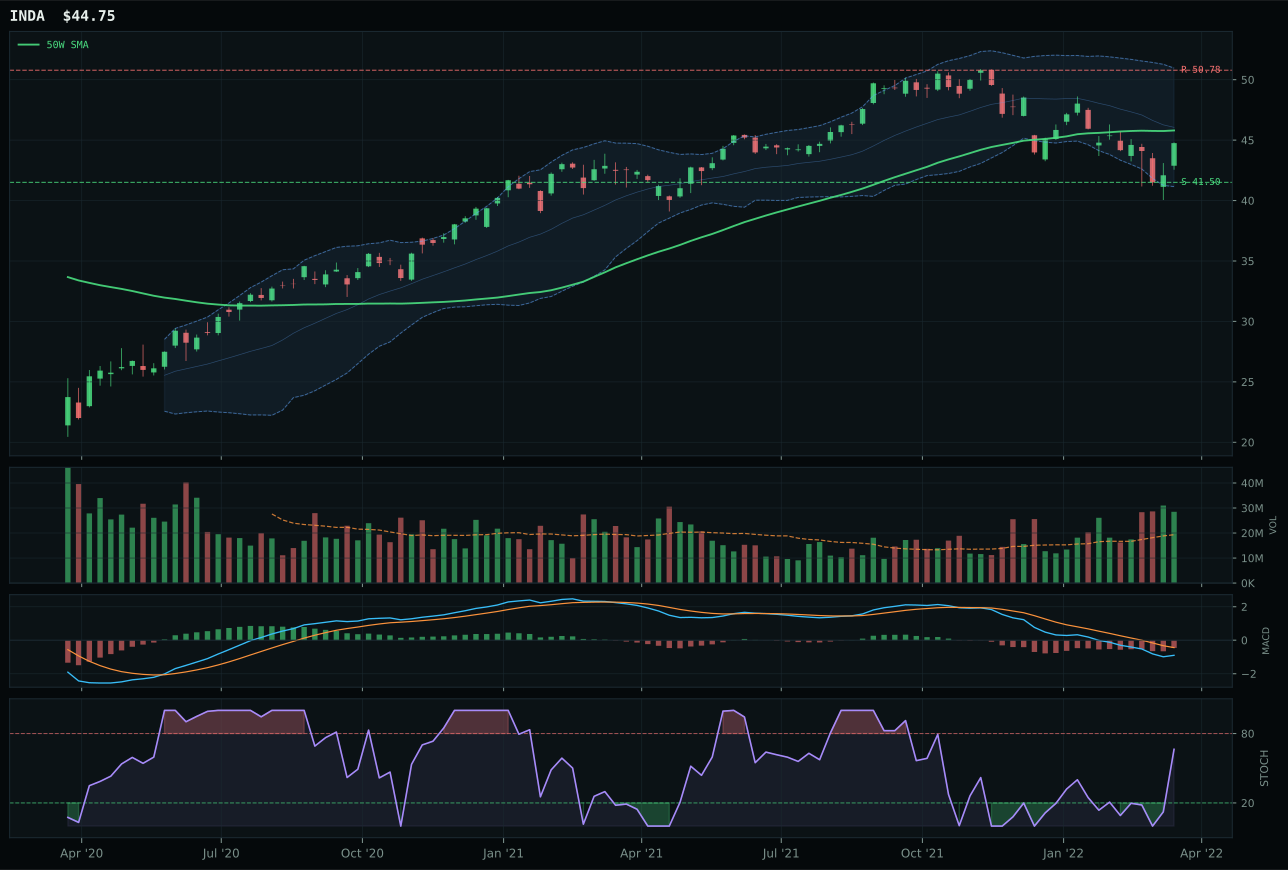
INDA has a compression near 50W profile with 5.1% 13-week relative strength versus SPY.
A failed hold above support would weaken the setup.
Actionable but governed by invalidation levels.
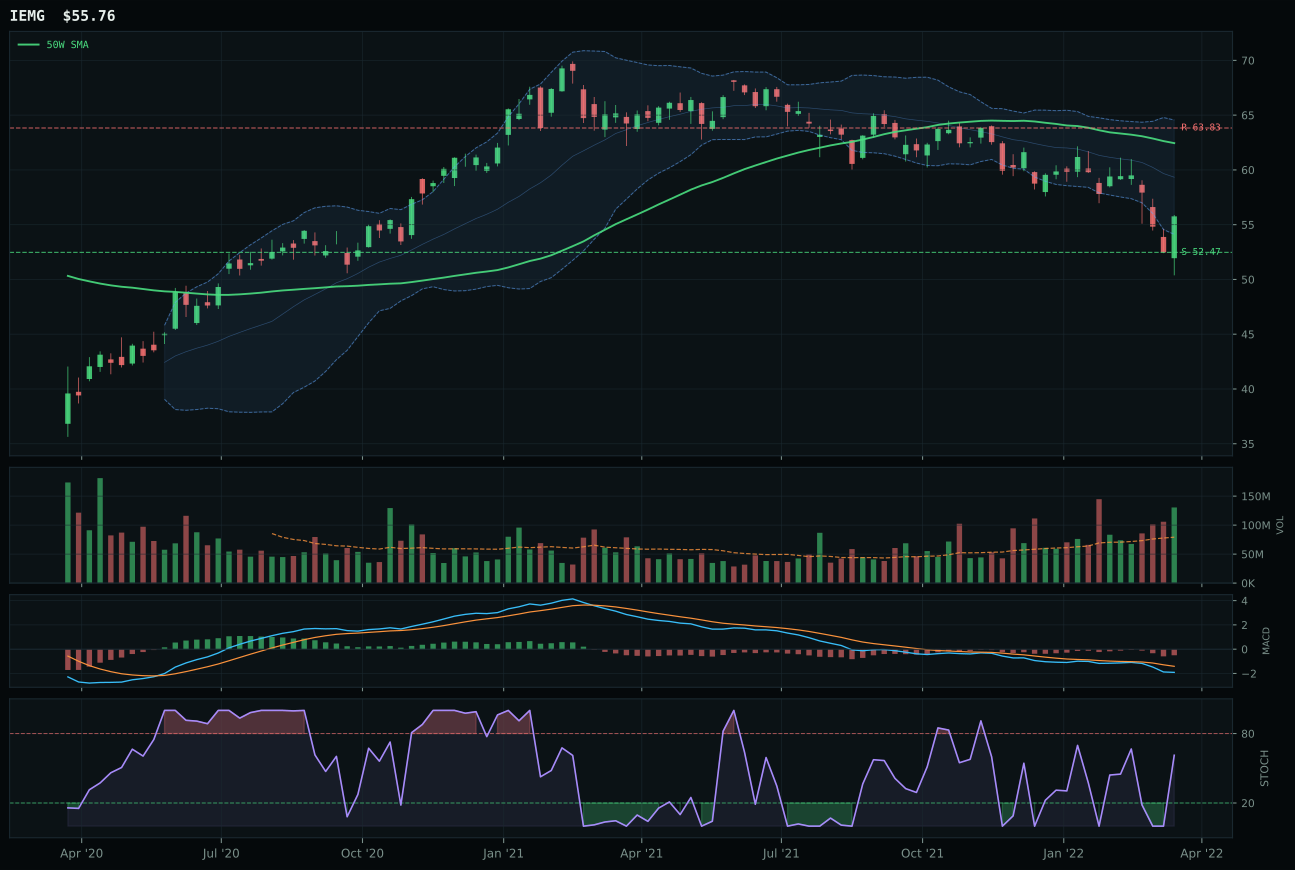
IEMG has a neutral structure profile with -1.8% 13-week relative strength versus SPY.
A failed hold above support would weaken the setup.
Actionable but governed by invalidation levels.
ILF dominates Emerging Markets with a 91 composite score and 58.4 category allocation by offering flawless volume-price sponsorship (99.7 volume-price confirmation, 100.0 persistence) into a compression setup that rewards disciplined entry. Latin America's commodity-sensitive structure trading 2.1% from its 50W line with accumulation/confirmation volume (1.72x) captures both the structural EM rotation narrative and the immediate technical precision that separates winners from runners-up. ILF's 100.0 momentum confirmation from 20.5% 13-week return and 18.7% category-relative strength proves institutional positioning, while its 86.8 structure score reflects cleanliness and compression that INDA cannot match. INDA's bearish MACD (versus ILF's bullish), neutral stochastic RSI (versus overbought momentum), and flat 0.0% category-relative strength expose it as a quality story without conviction flow—a fatal combination when volume must confirm entry.
Emerging Markets earned 5% allocation despite a 66.0 ILF macro fit and 100.0 technical evidence because the category's 53.0 macro fit trails all top-tier categories and EM liquidity support (+14) is outweighed by broad market bear (-9) and credit stress (-10). ILF's technical perfection and commodity-breadth alignment (8.0 active descriptor support) keep the category alive, but the allocation reflects tactical positioning rather than structural conviction. The setup's timing is exquisite—compressed near 50W with perfect volume confirmation—but macro headwinds (credit stress particularly harsh on EM carry structures) limit the slot to a tighter 5%. Escalate to 10% if commodity breadth composite spikes above 85 or if broad market bear descriptor becomes inactive (-9 penalty would reverse); maintain as-is through April earnings season, monitoring for credit stress deterioration that would justify exit to 0%.
Technology — CIBR
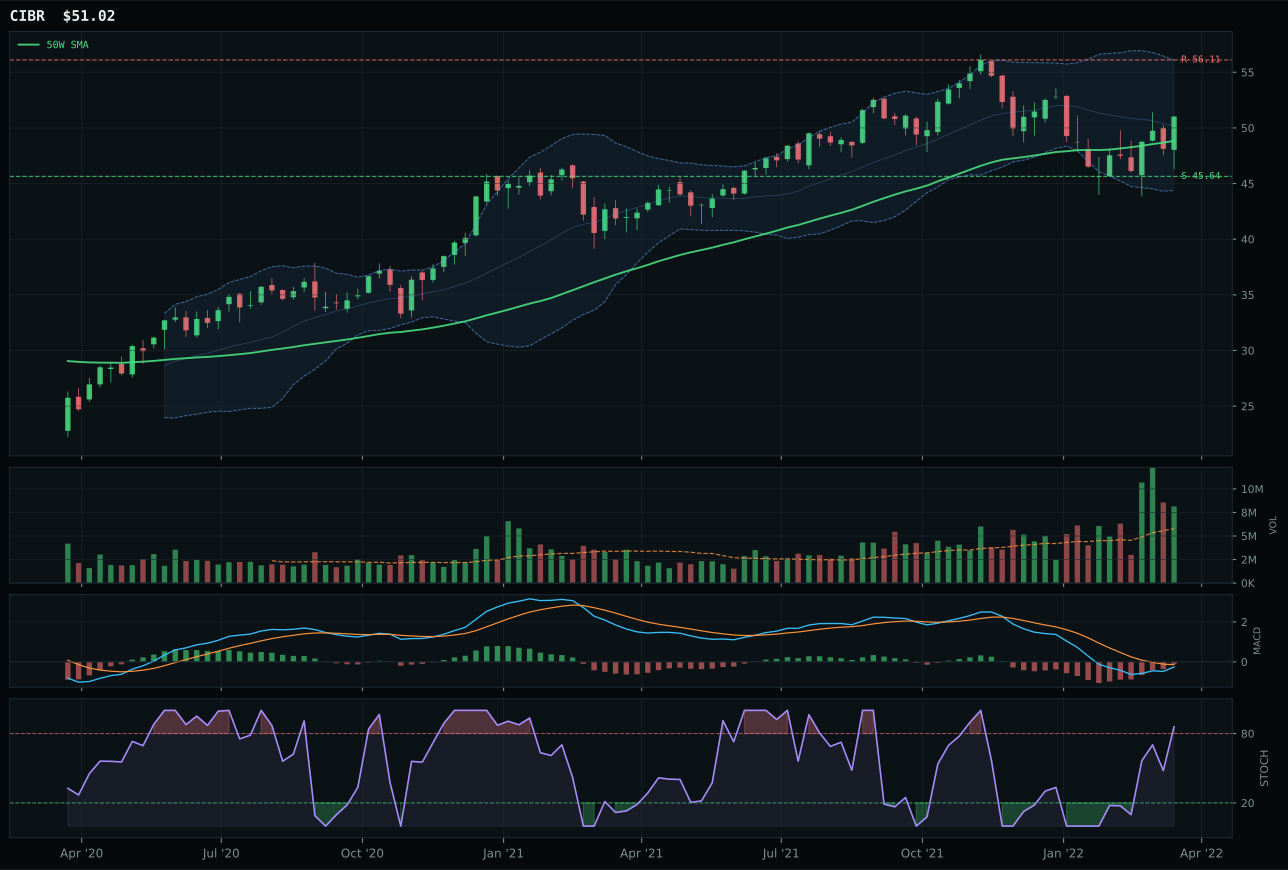
CIBR has a neutral structure profile with 2.5% 13-week relative strength versus SPY.
A failed hold above support would weaken the setup.
Actionable but governed by invalidation levels.
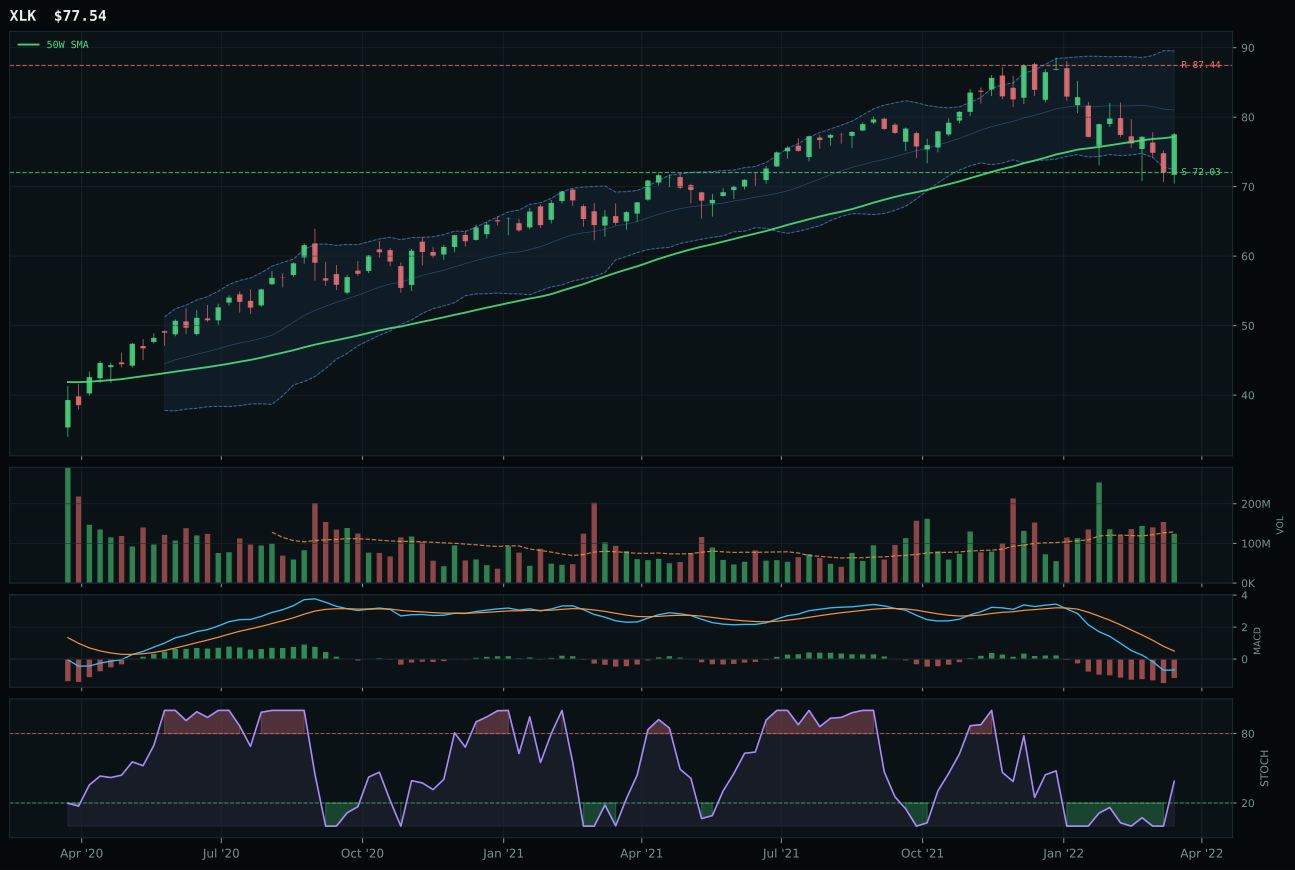
XLK has a compression near 50W profile with -4.3% 13-week relative strength versus SPY.
A failed hold above support would weaken the setup.
Actionable but governed by invalidation levels.
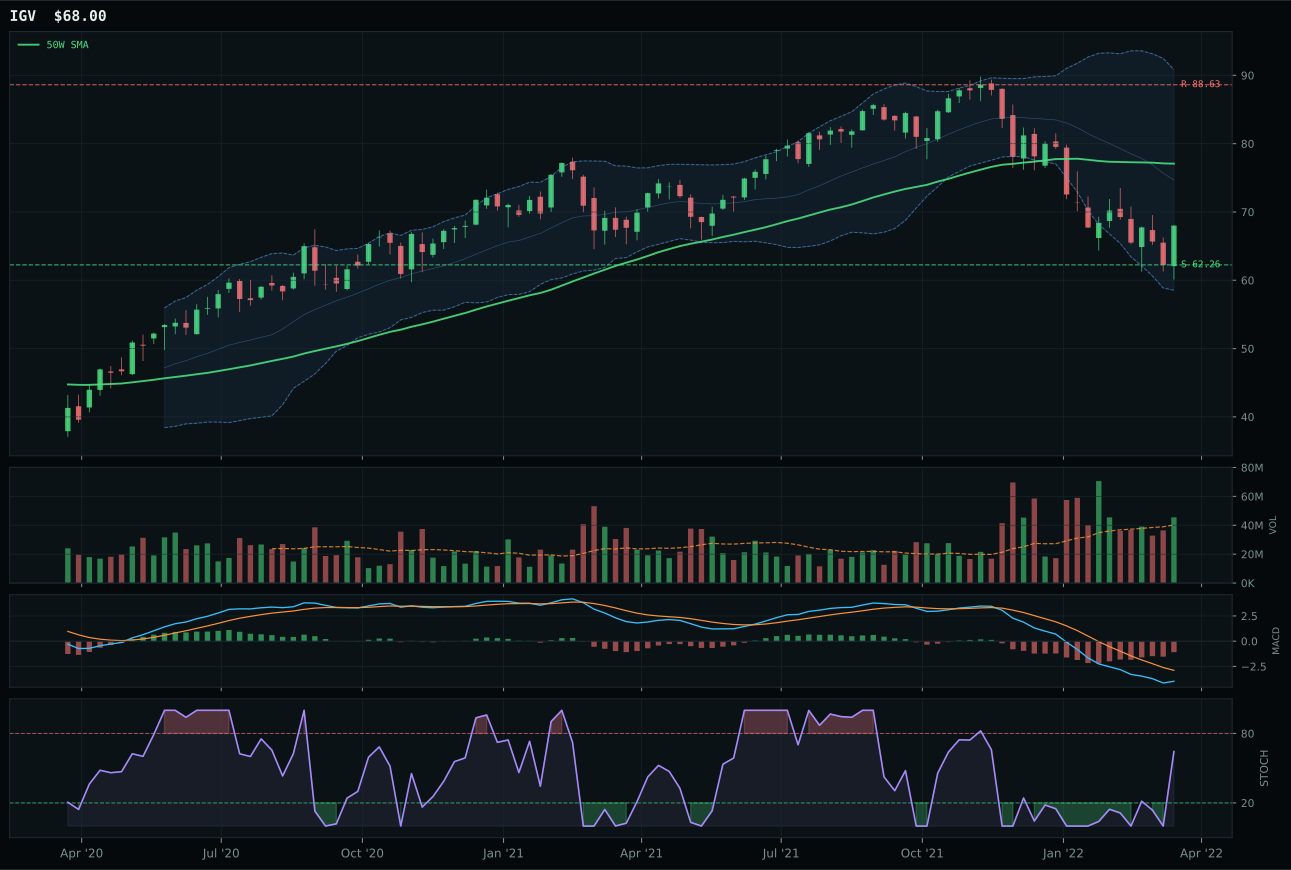
IGV has a neutral structure profile with -9.6% 13-week relative strength versus SPY.
A failed hold above support would weaken the setup.
Actionable but governed by invalidation levels.
CIBR wins the category with a 0.1-point margin over XLK, a victory built on superior relative strength inside the basket rather than absolute technical dominance. The cybersecurity narrative carried a 6.8% category-relative edge versus XLK's flat 0.0%, meaning institutional money is rotating into network defense over broad software exposure in this credit-stress regime. CIBR sits 4.5% from its 50-week moving average with above-average volume participation at 1.41x, suggesting accumulation rather than distribution, while its MACD is bearish but improving—a setup that rewards patience but demands discipline on entry. XLK's compression near the 50W looked cleaner on paper until volume confirmation collapsed to neutral and the -4.3% SPY-relative return exposed the weakness of a timing score that maxed out at 100 despite stale momentum. Structure cleanliness matters when macro headwinds are this active, and CIBR's 69.8 structure score versus XLK's 66.7 proved decisive.
Technology ranks ninth among the ten categories this week and receives zero allocation because its 53.0 composite score falls well outside the top two and its macro fit is structurally weak. The category-level macro score of 48.0 reflects active headwinds from credit stress and inflation pressure that offset any liquidity expansion bid. In a Transition/Mixed regime, defensive rotation is live but technology needs either a clean macro tailwind or exceptional momentum proof to compete against real assets and energy. The representative ETF CIBR shows 96.7 trend and 88.7 momentum confirmation, yet these strong technical readings cannot overcome a macro profile weighted 38% toward headwinds. To earn allocation, Technology would need to see either a macro descriptor flip—credit stress turning passive, or risk appetite confirmed bullish—or a much cleaner setup in XLK with sustained volume confirmation and positive SPY-relative performance. For now, the capital belongs elsewhere.
AI — SMH
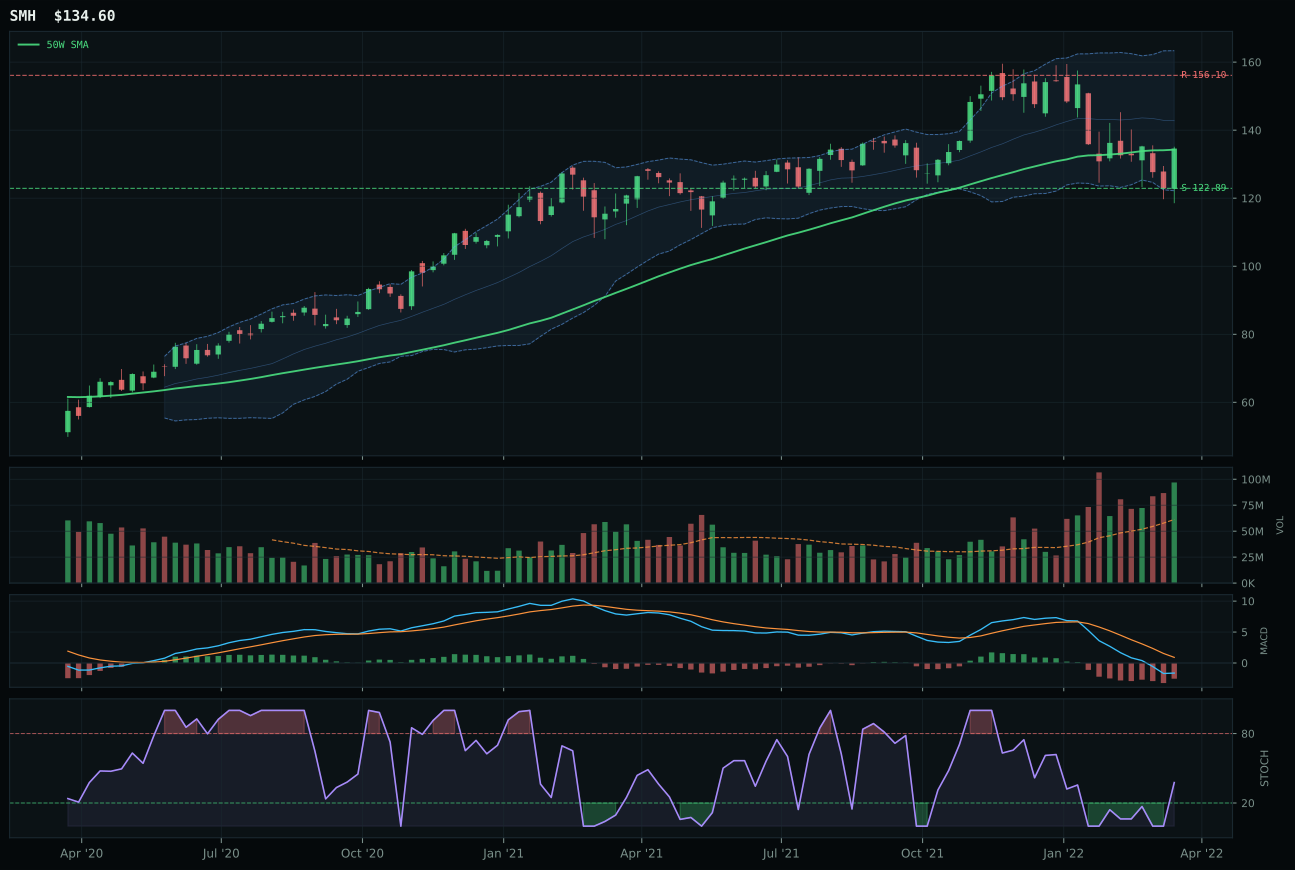
SMH has a compression near 50W profile with -5.5% 13-week relative strength versus SPY.
A failed hold above support would weaken the setup.
Actionable but governed by invalidation levels.
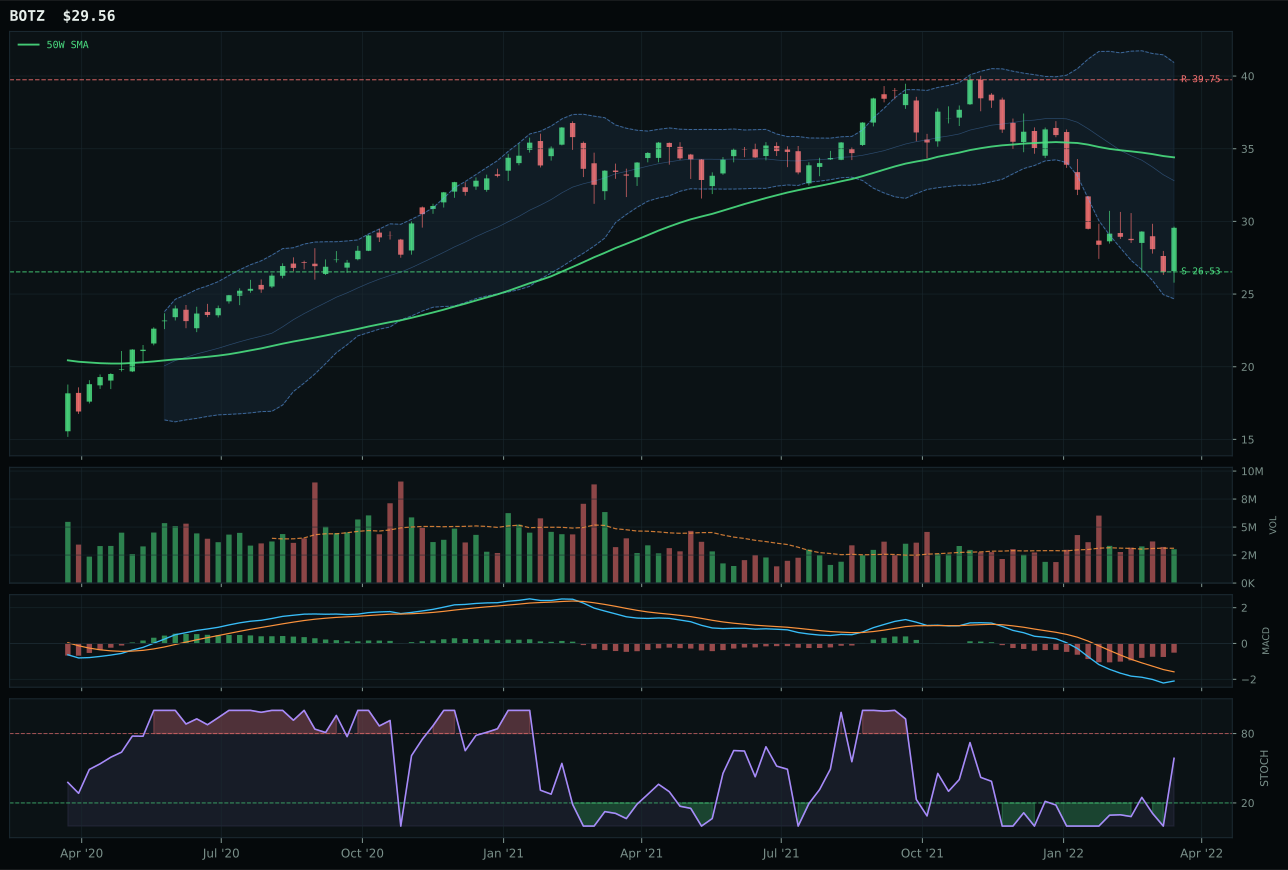
BOTZ has a neutral structure profile with -12.3% 13-week relative strength versus SPY.
A failed hold above support would weaken the setup.
Actionable but governed by invalidation levels.
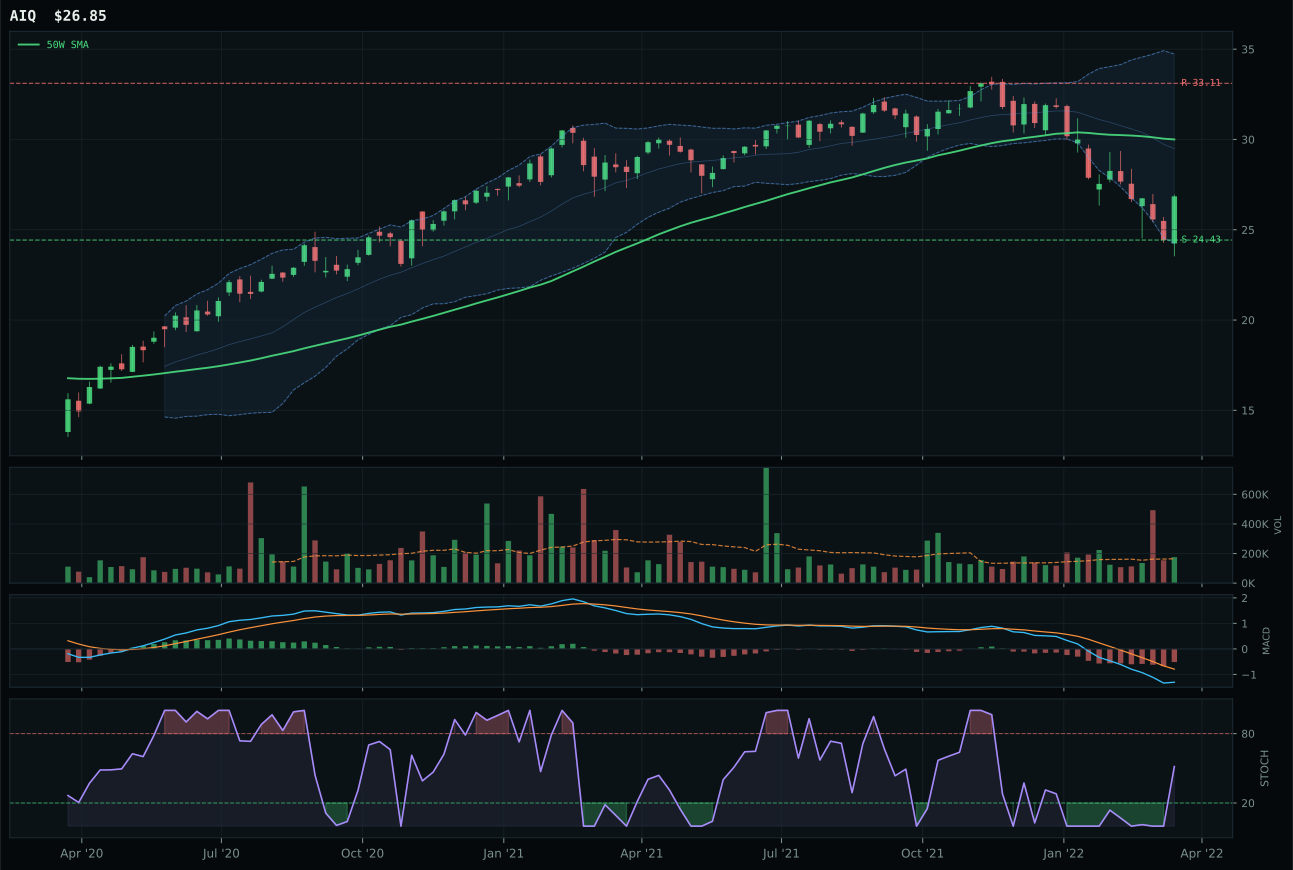
AIQ has a neutral structure profile with -9.8% 13-week relative strength versus SPY.
A failed hold above support would weaken the setup.
Tracked, but not top-2 eligible because: .
SMH defeats BOTZ by 37.7 points—the widest gap in the portfolio—because semiconductor compute demand carries momentum that robotics cyclicality cannot match in a transition regime. The chip leader sits compressed at just 0.2% from its 50-week line, a textbook coil setup where every new buyer can accumulate without chasing extended valuations; BOTZ broke far deeper into retracement, trading 9.8% below support at a point when mean reversion looks mechanical rather than institutional. SMH's 4.3% category-relative strength edges out AIQ's flat showing, but the real difference lies in timing: SMH achieves a perfect 100.0 timing score while BOTZ languishes at 70.0, reflecting BOTZ's deeper technical wounds (stochastic RSI still rising mid-zone, volume neutral). The -5.5% SPY underperformance hurts, but it reflects broader market weakness, not category-specific deterioration.
AI scores 37.3 and receives zero allocation because it ranks outside the top two and the category's macro fit of 44.0 is depressed by twin headwinds: credit stress and broad market bear, each carrying -8 weight. The representative SMH shows strong technical mechanics—84.8 trend, 100.0 timing, 73.8 volume-price confirmation—but technical excellence cannot overcome a macro regime that has broken risk appetite. In Transition/Mixed conditions, growth-heavy sectors need either confirmed macro mean reversion or proven defensive characteristics; AI offers neither right now. The 13W return of -8.8% for SMH and far worse for BOTZ confirm that this is a recovery story, not a current-strength candidate. For AI to earn a slot, credit stress would need to show signs of easing (likely through either Fed pause signals or measurable default rate stabilization) or the category would need to prove genuine defensive utility. Neither condition is present this week.