
2022-03-11
Informational purposes only. The content in this report, including allocations, analysis, and commentary, is provided solely for informational and educational purposes. It does not constitute financial advice, investment advice, trading advice, or any other type of advice. Past performance does not guarantee future results. Always conduct your own research and consult a qualified financial professional before making investment decisions.
Macro risk engine requires the 50% Defensive overlay for this run; payload selected by cause: Inflation Scarcity.
Weekly Allocation
| Ticker | Category | Weight | Role |
|---|---|---|---|
| XLE | Traditional Energy | 60% | Overlay |
| GLD | Precious Metals | 10% | Top-2 (10%) |
| URNM | Nuclear Energy | 5% | Tier-2 (5%) |
| COPX | Industrial Metals | 5% | Tier-2 (5%) |
| WEAT | Agriculture & Livestock | 5% | Tier-2 (5%) |
| XLU | Utilities & Infrastructure | 5% | Tier-2 (5%) |
| XAR | Defense & Aerospace | 5% | Tier-2 (5%) |
| CIBR | Technology | 5% | Tier-2 (5%) |
Trade Instructions — Monday Open
Sell the tranche from 2022-02-11 (completing its 4-week hold). Buy the new tranche. Instructions show net portfolio changes — same-asset positions cancel, weight changes show the delta.
| Action | Ticker | Instruction |
|---|---|---|
| SELL | WEAT | Sell 20% of WEAT position (reduce 6.25% → 5.00%) |
| SELL | IGF | Sell entire IGF position (1.25% of portfolio) |
| SELL | ITA | Sell 33% of ITA position (reduce 3.75% → 2.50%) |
| SELL | IEMG | Sell 33% of IEMG position (reduce 3.75% → 2.50%) |
| BUY | GLD | Buy GLD — 25.00% of freed cash (adds 1.25% to portfolio) |
| BUY | XAR | Buy XAR — 25.00% of freed cash (adds 1.25% to portfolio) |
| BUY | URNM | Buy URNM — 25.00% of freed cash (adds 1.25% to portfolio) |
| BUY | XLU | Buy XLU — 25.00% of freed cash (adds 1.25% to portfolio) |
Current Portfolio After Trade
Combined holdings across all 4 active tranches. Each tranche is 25% of the portfolio.
| Ticker | % of Portfolio | Weight Bar |
|---|---|---|
| XLE | 40.00% | |
| COPX | 12.50% | |
| GLD | 7.50% | |
| CIBR | 7.50% | |
| WEAT | 5.00% | |
| PAVE | 5.00% | |
| XAR | 5.00% | |
| URNM | 5.00% | |
| ITA | 2.50% | |
| IEMG | 2.50% | |
| MOO | 2.50% | |
| GDX | 2.50% | |
| XLU | 2.50% |
Macro Regime — Transition / Mixed
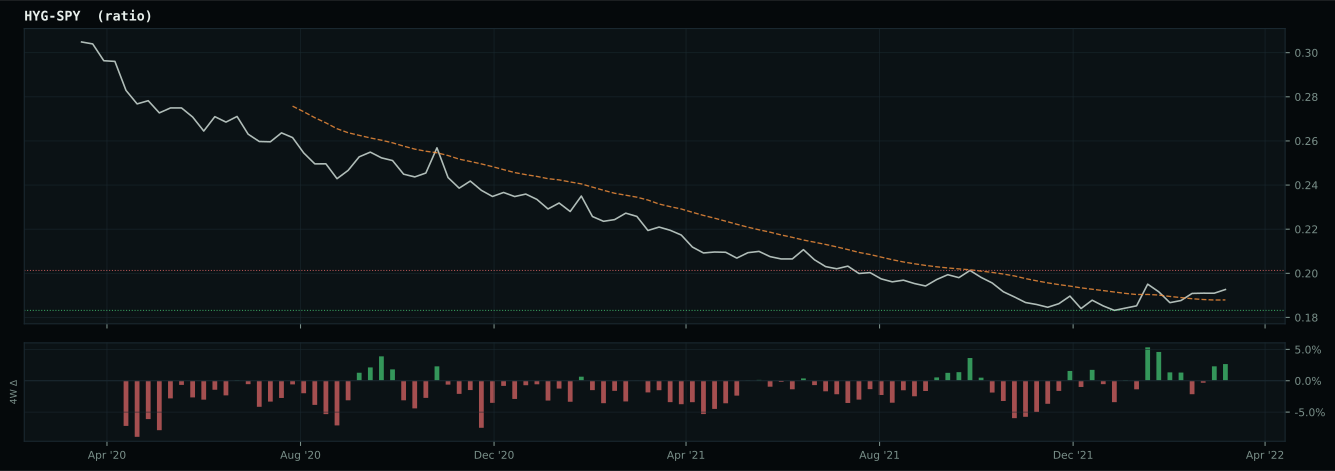
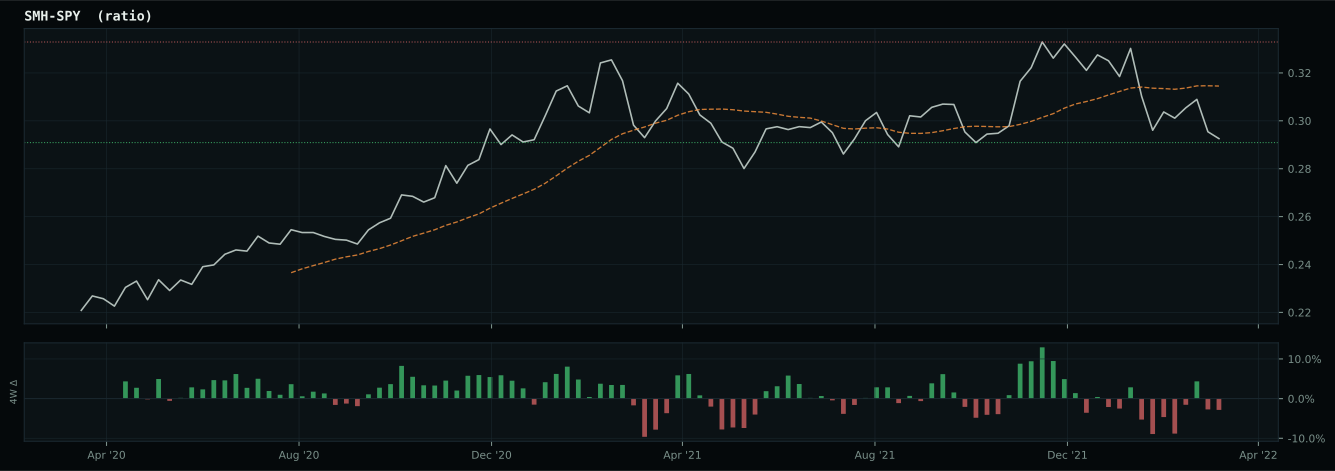
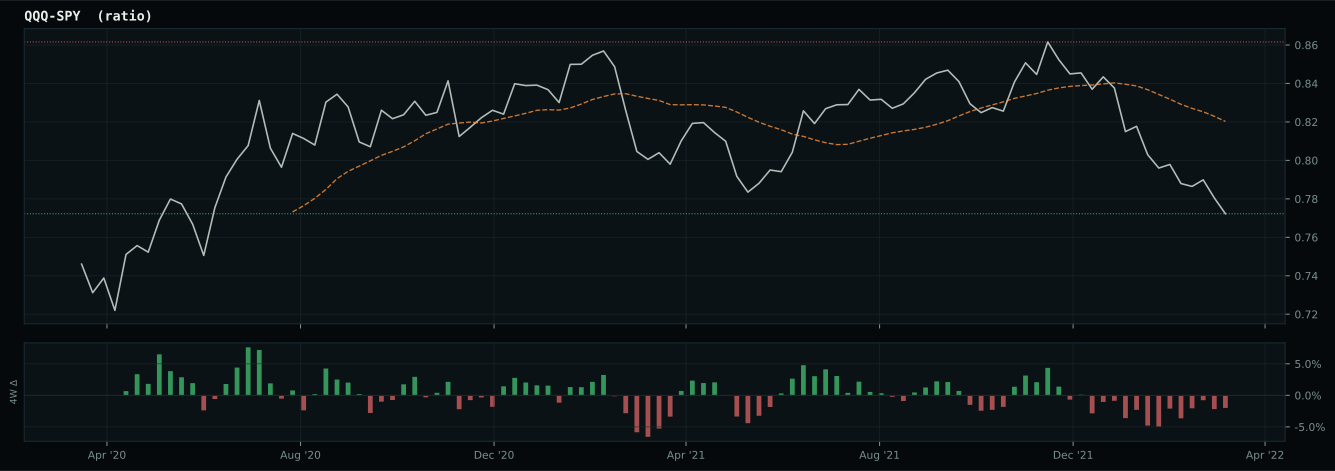
growth data is not confirming the weak market-implied risk appetite signal
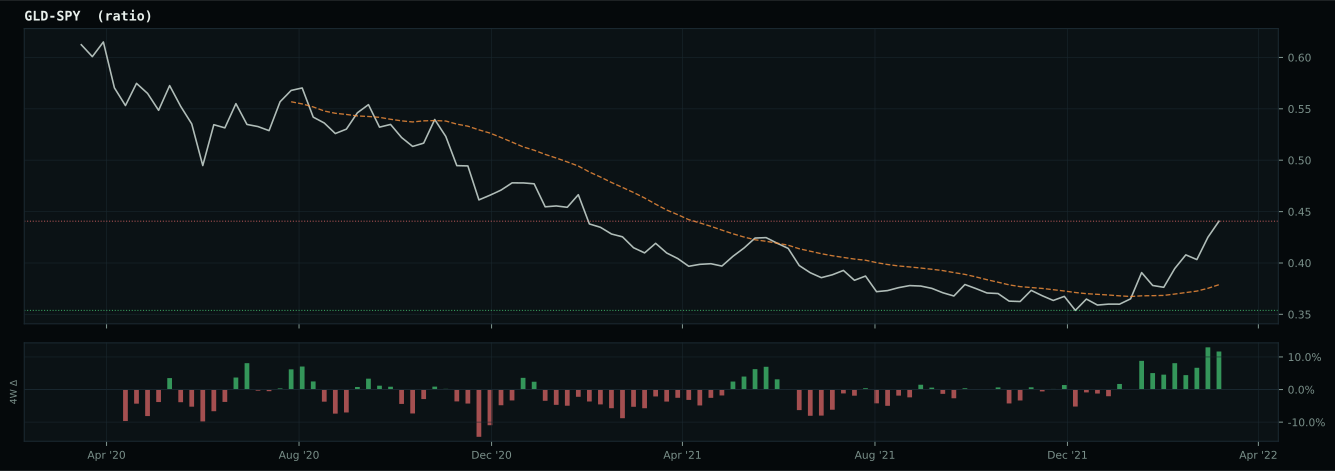
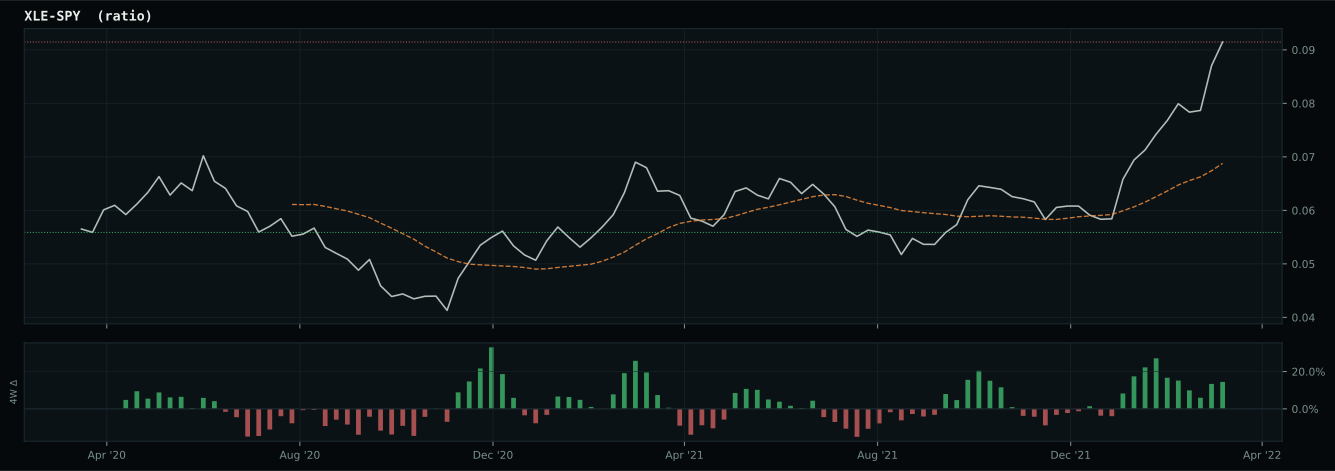
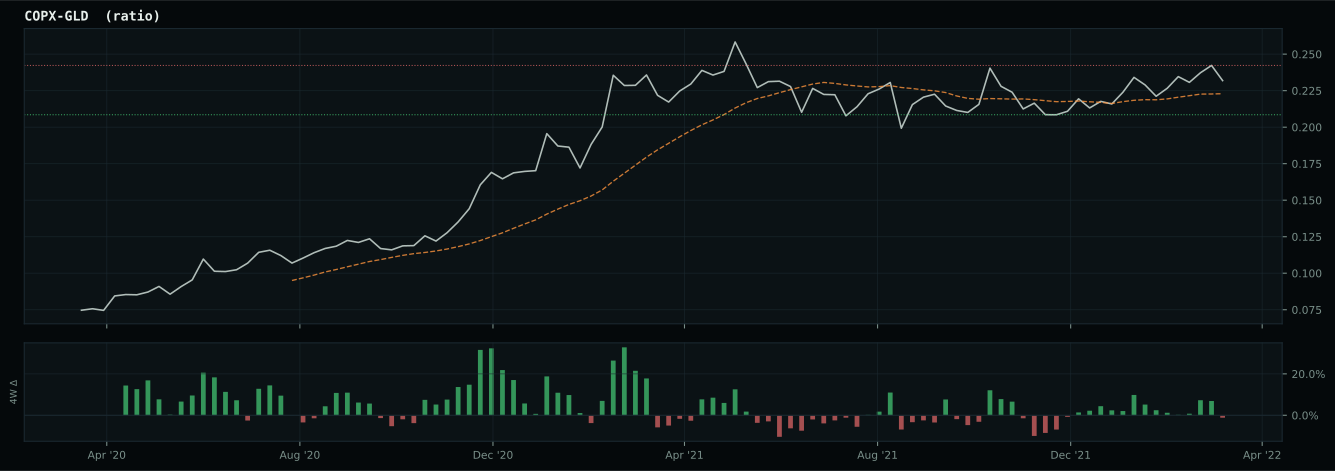
Defensive overlay cause is inflation/scarcity: energy, commodity breadth, or oil-versus-gold confirmation is stronger than the broad equity tape, so the sleeve owns the inflation pressure. XLE has been confirmed above its 8W SMA and is eligible.
Macro Evidence Charts
Market-implied signals behind the macro regime scores. Each ratio compares two assets; the direction and slope of the ratio is what the macro engine reads.
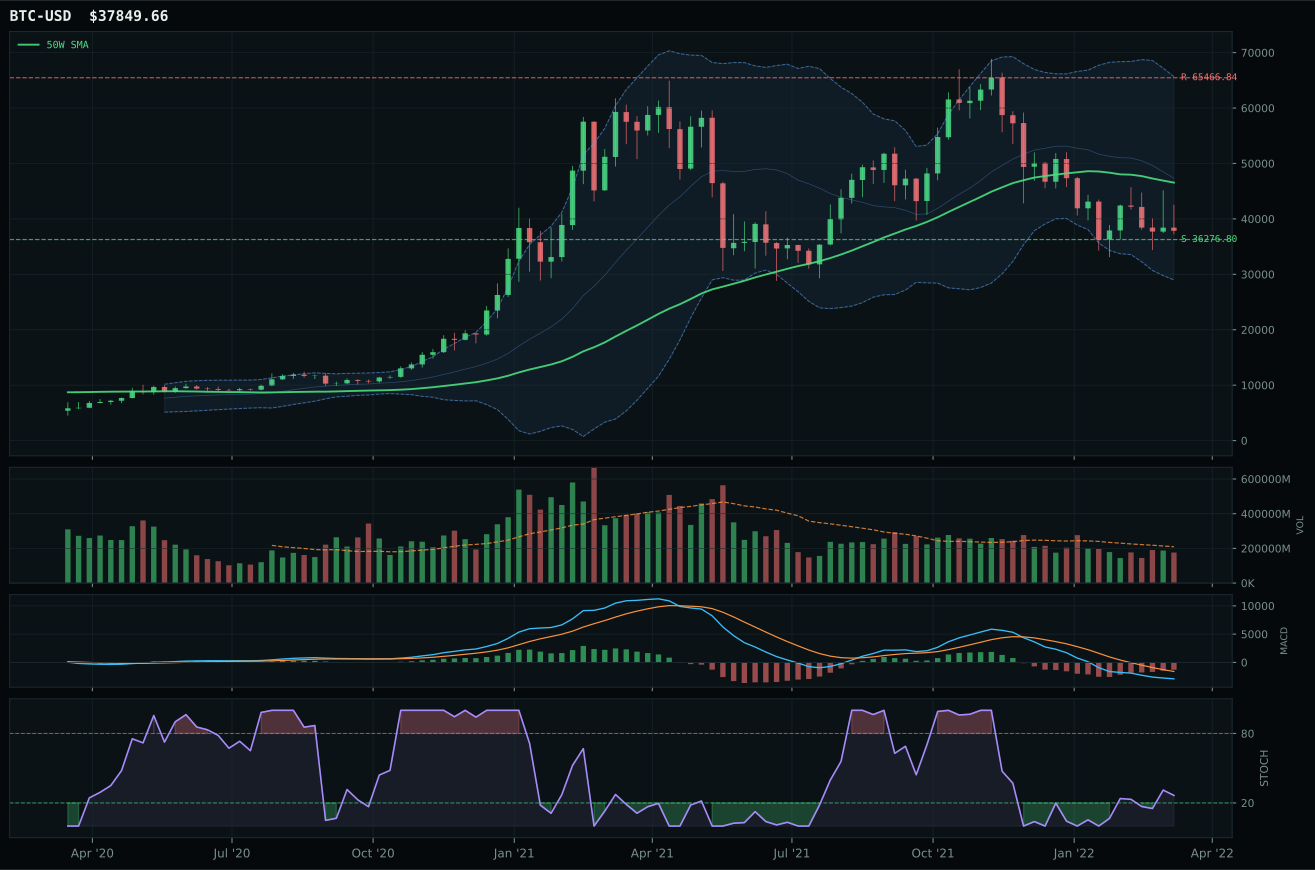
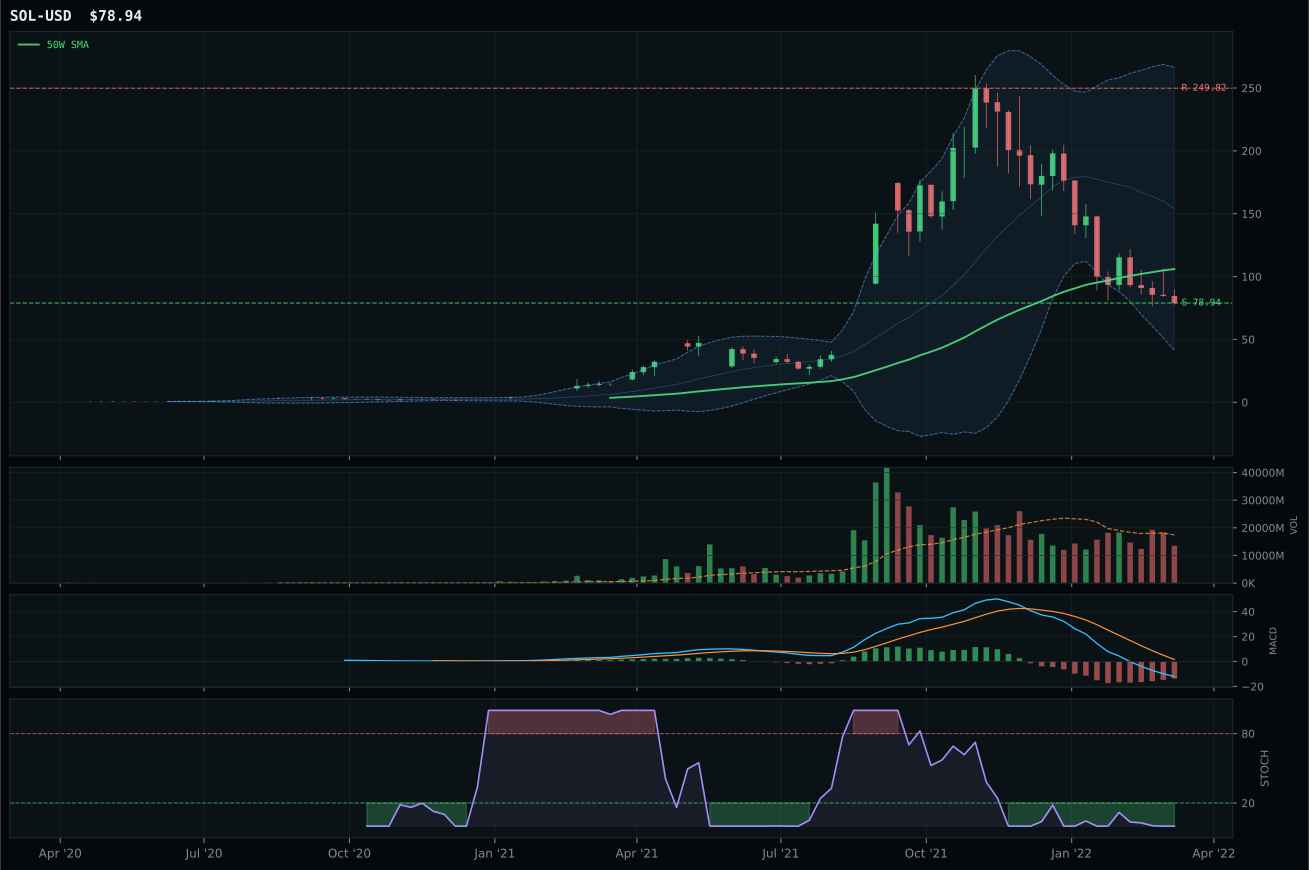
Crypto Regime — NoCrypto
ValueBTC not armed: BTC has not made the first post-breakdown touch of the 200W buy zone after losing the 50W
TrendBTC not confirmed
one or more available conditions failed
Category Rankings
| Rank | Category | Winner | Score | Alloc | 4W Ret | Peers (4W) |
|---|---|---|---|---|---|---|
| 1 | Traditional Energy | XLE | 88.5 | 20% | +4.61% | XOP +11.8% · FCG +13.1% |
| 2 | Precious Metals | GLD | 87.2 | 20% | +0.08% | GDX +7.6% · SLV +0.1% |
| 3 | Nuclear Energy | URNM | 68.6 | 10% | +10.09% | URA +8.3% · NLR +8.1% |
| 4 | Industrial Metals | COPX | 65.5 | 10% | +6.64% | PICK +7.4% · REMX +10.0% |
| 5 | Agriculture & Livestock | WEAT | 63.4 | 10% | +4.91% | MOO +8.6% · VEGI +8.2% |
| 6 | Utilities & Infrastructure | XLU | 58.6 | 10% | +8.65% | PAVE +0.4% · IGF +8.4% |
| 7 | Defense & Aerospace | XAR | 53.0 | 10% | +1.83% | ROKT +3.2% · ITA +2.7% |
| 8 | Technology | CIBR | 42.3 | 10% | +5.93% | XLK +5.0% · IGV +5.5% |
| 9 | AI | SMH | 24.2 | 0% | -0.93% | BOTZ +0.2% · AIQ +4.8% |
| 10 | Emerging Markets | INDA | 11.0 | 0% | +6.58% | ILF +9.7% · IEMG +5.8% |
Traditional Energy — XLE
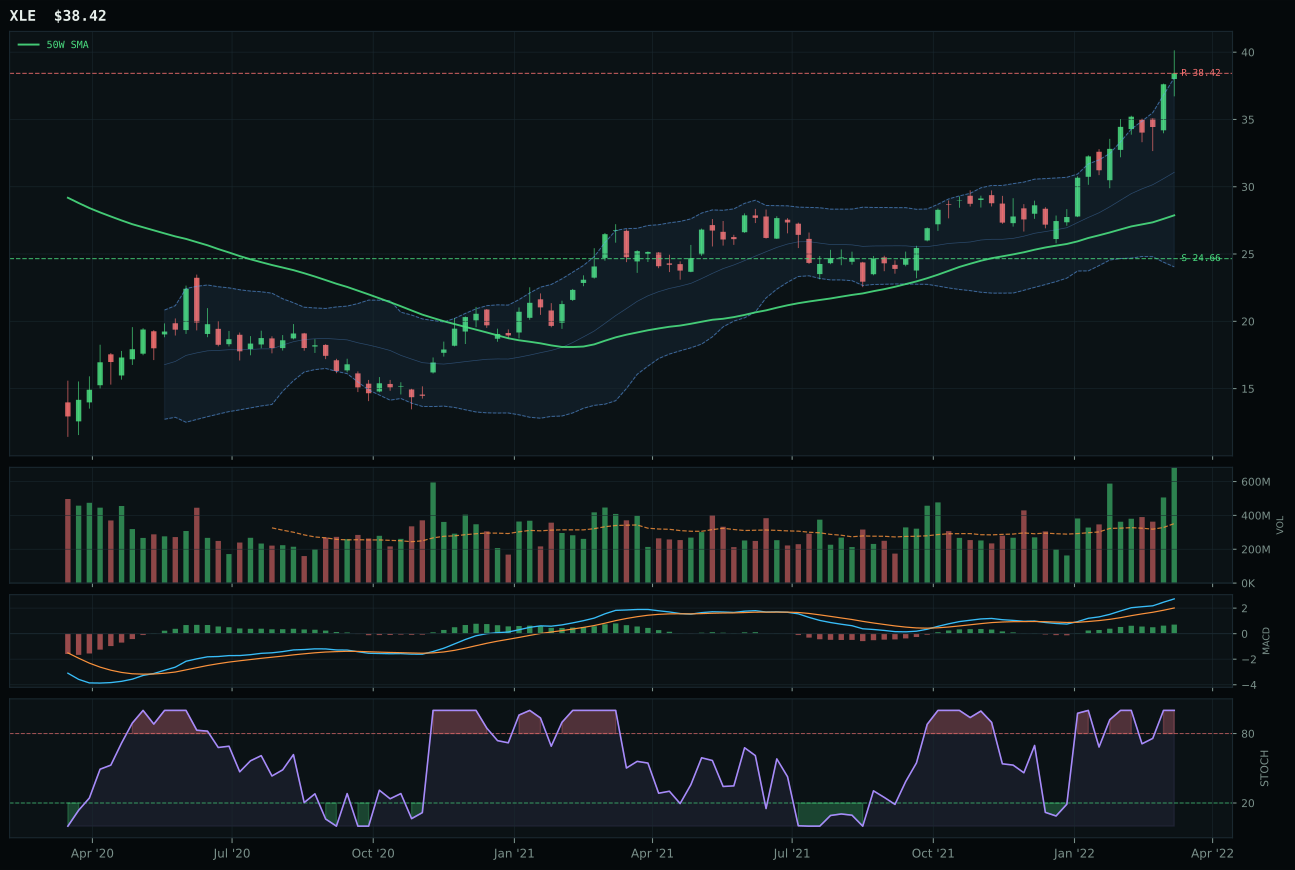
XLE has a vertical extension profile with 45.0% 13-week relative strength versus SPY.
A failed hold above support would weaken the setup.
Actionable but governed by invalidation levels.
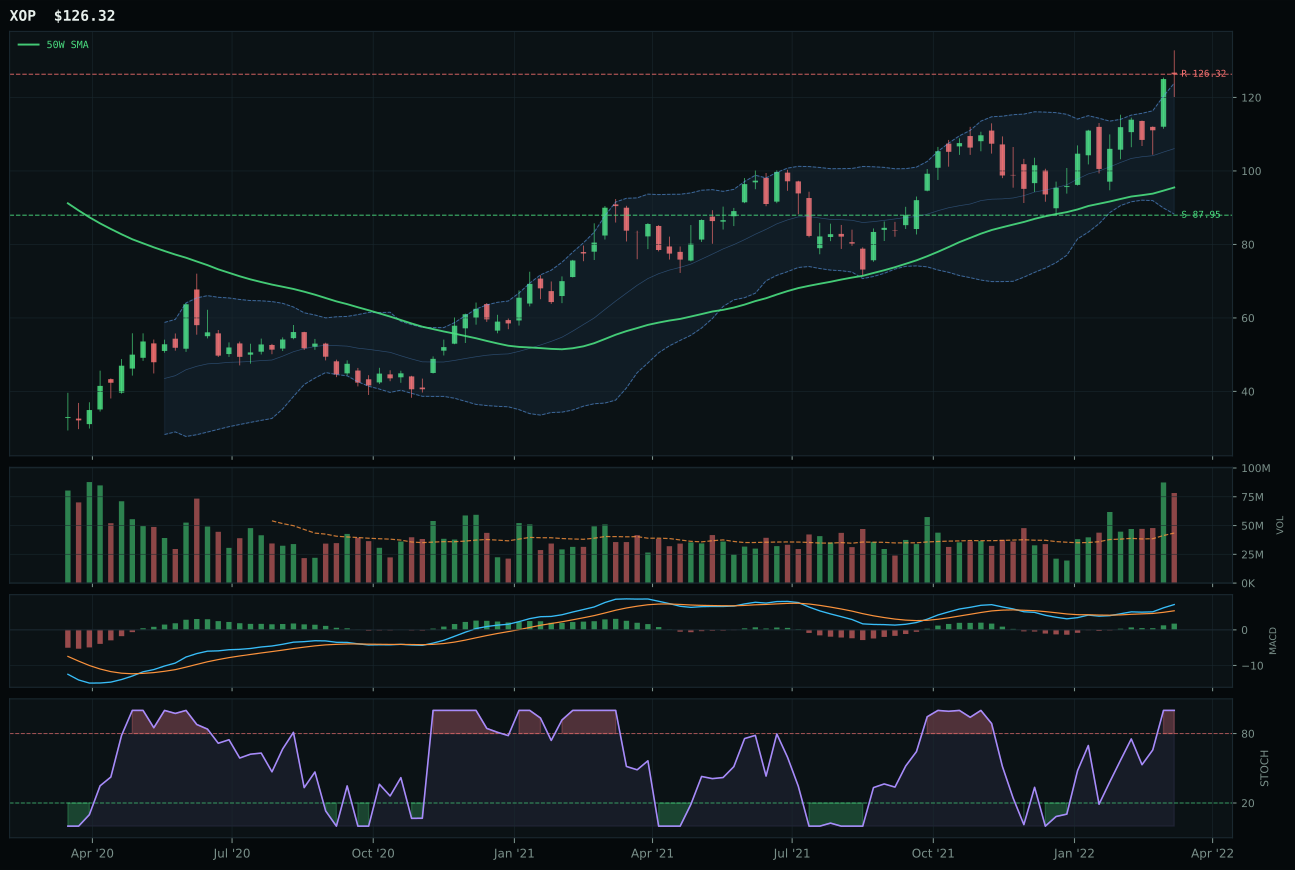
XOP has a vertical extension profile with 35.1% 13-week relative strength versus SPY.
A failed hold above support would weaken the setup.
Actionable but governed by invalidation levels.
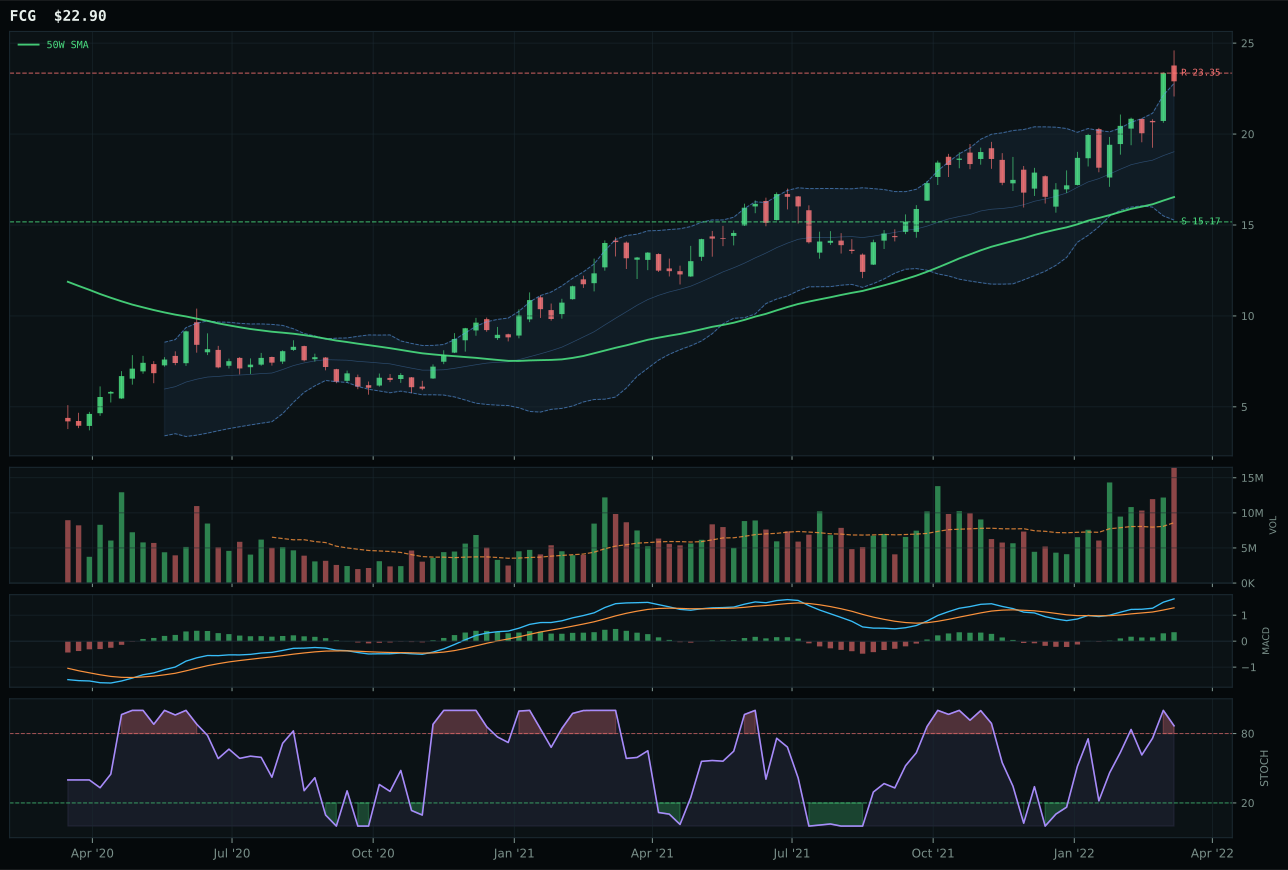
FCG has a vertical extension profile with 38.8% 13-week relative strength versus SPY.
A failed hold above support would weaken the setup.
Actionable but governed by invalidation levels.
XLE wins Traditional Energy and earns top-2 portfolio status with an 88.5 category score, the highest overall, because it combines a vertical extension 37.8% above the 50W with flawless momentum confirmation (100 basis points) and extraordinary volume-price persistence (100.0). The 34.3% 13-week return and 45.0% RS versus SPY are category-leading; stochastic RSI at 1.00 overbought momentum is typically concerning, but MACD bullish and improving plus 2.08x volume showing accumulation/confirmation signal that this is not distribution into resistance—it is buying into strength. The trend score of 100, structure of 85.7, and momentum confirmation of 100 create what is essentially a perfect technical expression of energy strength. XOP, the runner-up at 86.5 reasoned score, has superior risk/reward (38.3 vs 44.6 for XLE, meaning exploration upside is capped less) but lags category-relative strength (-3.7% vs 6.2%), making it secondary to XLE's cleaner execution. The 3.4-point category gap is decisive; XLE is the more anchored expression of energy's structural bull case.
Traditional Energy earned 10% allocation as a top-2 overweight category because the 88.5 final score reflects both exceptional technical evidence (98.7 weighted) and the strongest macro narrative in the portfolio. Energy scarcity is active (+16 basis points), inflation pressure is active (+10), supply shortage is active (+9), and real asset sponsorship is active (+7), creating a 92.0 macro fit score that aligns perfectly with portfolio regime. XLE's vertical extension is a double-edged sword: timing score is only 37 basis points because entry risk is material at 37.8% above the 50W, yet the persistence score of 100 and volume-price confirmation of 92.4 argue that the move has multiple weeks of runway. This allocation reflects conviction that energy supply constraints will persist through the portfolio construction period and that integrated oil majors like those in XLE are capturing supernormal cash flows that justify premium valuations. The 10% slot signals this is a structural macro bet, not tactical; the category's 3/2/1 basket scored 85.7 with exceptional breadth across XLE, XOP, and FCG. For XLE specifically, the risk is geopolitical de-escalation or recession that collapses demand; the macro regime currently rewards the supply-side risk. Top-2 status is earned.
Precious Metals — GLD
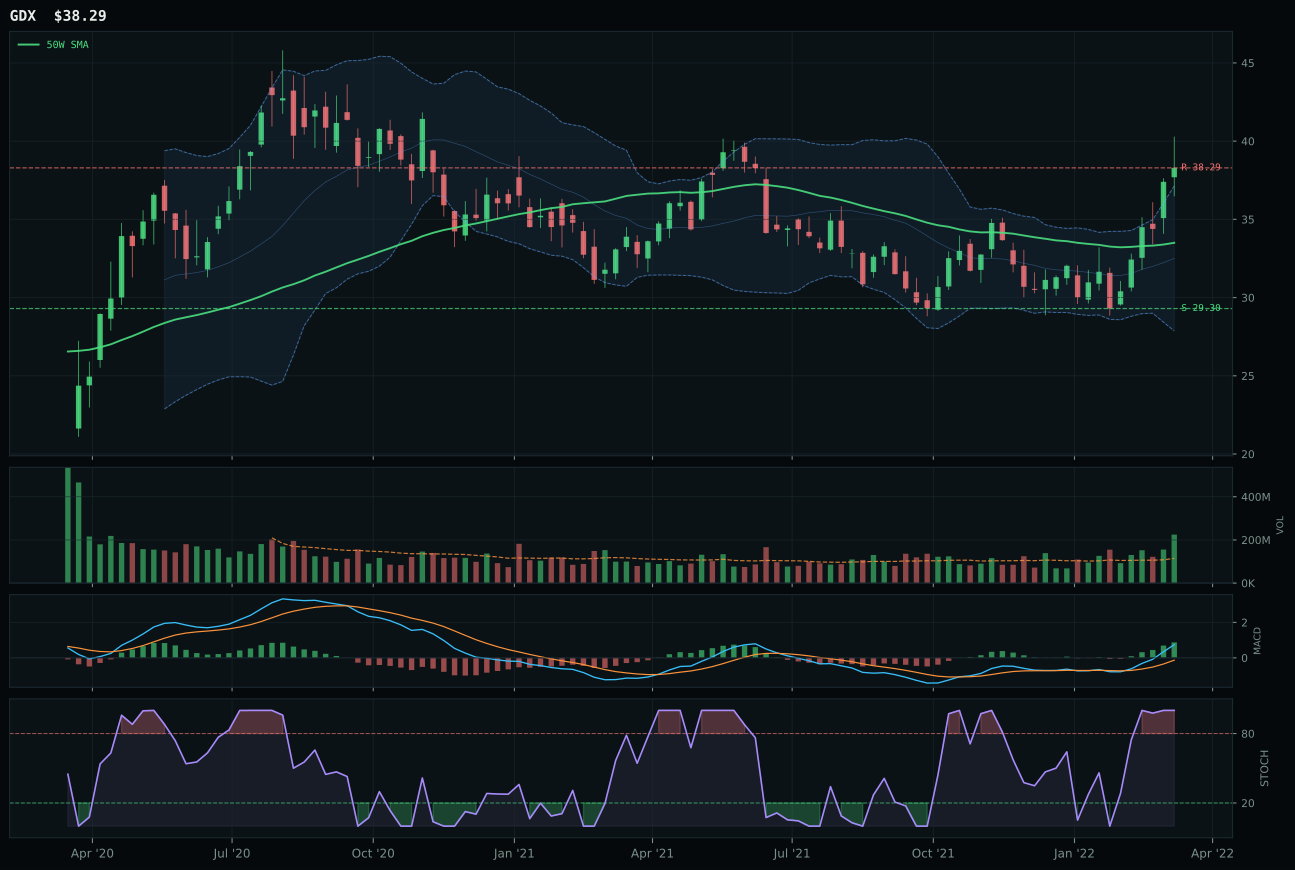
GDX has a neutral structure profile with 36.3% 13-week relative strength versus SPY.
A failed hold above support would weaken the setup.
Actionable but governed by invalidation levels.
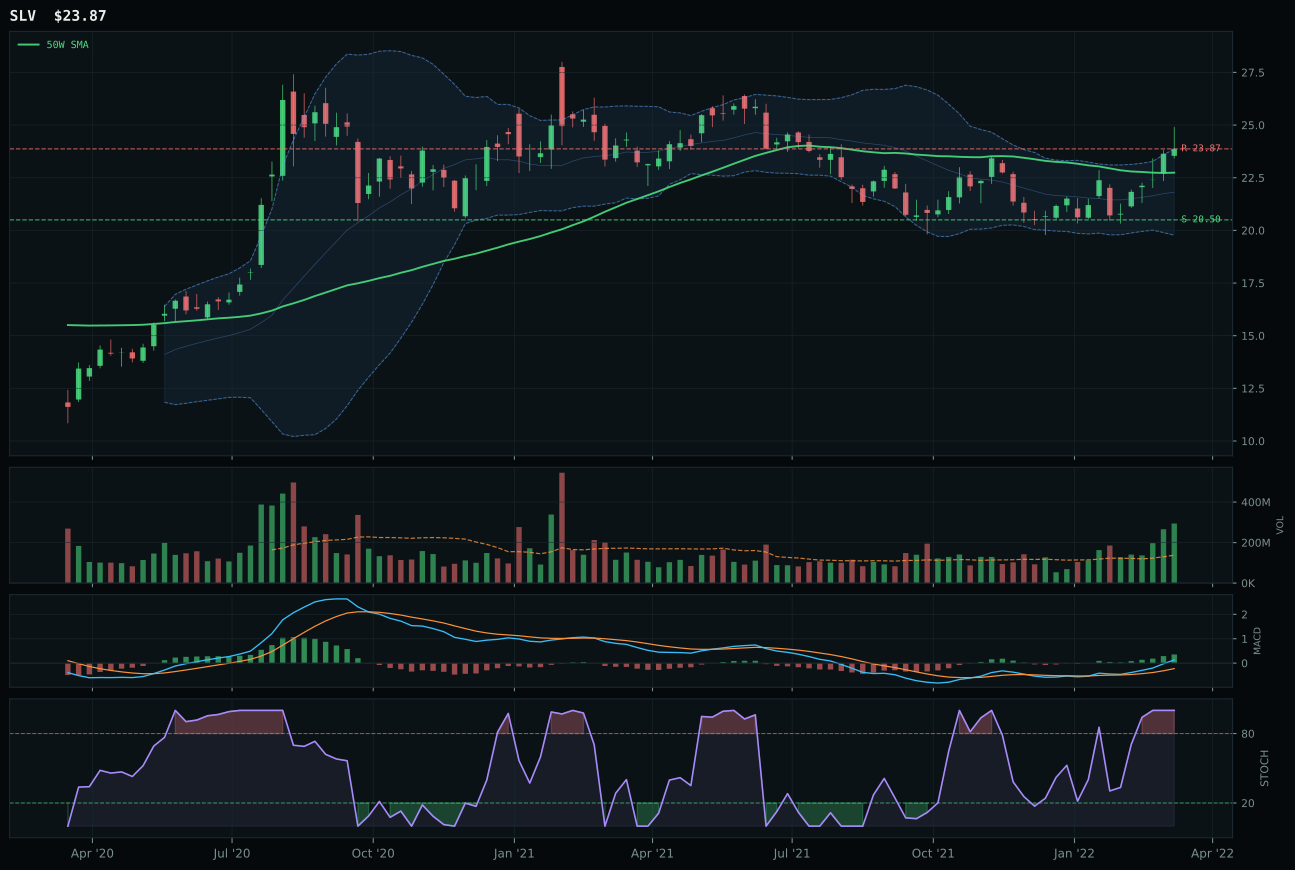
SLV has a neutral structure profile with 27.2% 13-week relative strength versus SPY.
A failed hold above support would weaken the setup.
Actionable but governed by invalidation levels.
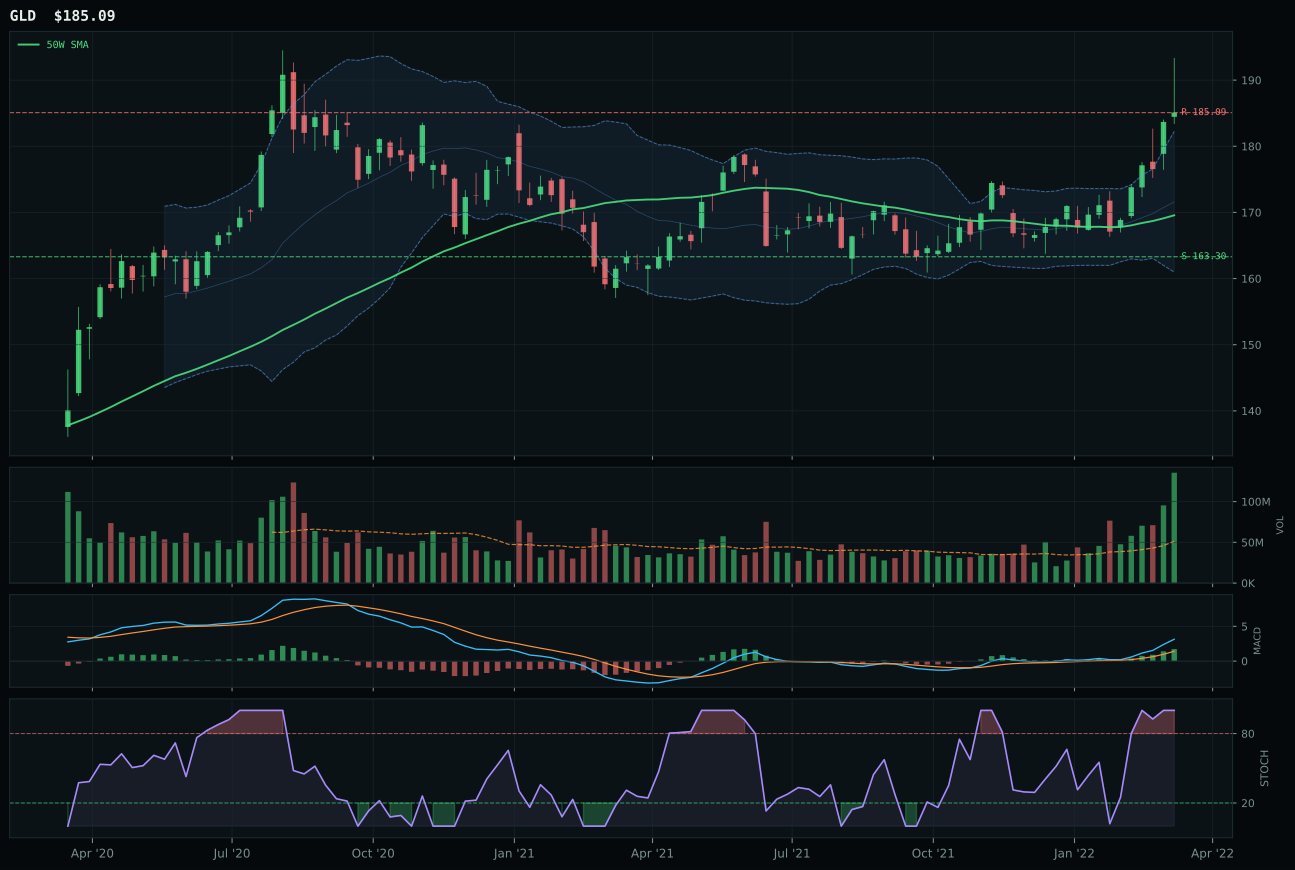
GLD has a neutral structure profile with 21.9% 13-week relative strength versus SPY.
A failed hold above support would weaken the setup.
Actionable but governed by invalidation levels.
GLD wins Precious Metals and earns top-2 portfolio status with a 87.2 category score, combining perfect trend execution (100 basis points: price above 50W and 200W with 0.3% slope) and exceptional volume-price confirmation (91.4). The chart sits just 9.2% above the 50W in what is termed neutral structure—not extended, not squeezed—and this balance is crucial: stochastic RSI at 1.00 (overbought momentum) could signal danger, but MACD is bullish and improving, and volume is 2.64x the 20W average showing accumulation/confirmation rather than distribution pressure. Risk/reward is symmetric (0.0% upside to 185.09 resistance, 13.3% downside to 163.30 support), reflecting a mature move where new buyers have priced in the monetary hedge thesis. GDX, the runner-up with 89.7 reasoned score, carries more leverage (25.6% 13-week return and 36.3% RS vs SPY) but is extended 14.3% above the 50W, creating timing vulnerability (67 vs 75 basis points) and worse structure (82.8 vs 86.9); it is the aggressive version of the same bullish gold narrative, which is why GLD wins on risk-adjusted basis.
Precious Metals earned 10% allocation as a top-2 overweight category because the 87.2 final score reflects both technical momentum and macro sponsorship aligned with current portfolio regime. The monetary hedge bid is active (+14 basis points), defensive rotation is strong (+7), and dollar pressure remains a tailwind (+3), creating a 72.0 macro fit score that justified the category's second-highest ranking after XLE's 92.0. Technical evidence scored 100.0 across the three-ETF basket, an exceptional result that reflects GLD's 100-point trend, SLV's 100-point trend, and GDX's 100-point trend—this category is in unified uptrend. The risk asymmetry favors holding: gold trades at new cycle highs and the macro narrative (geopolitical uncertainty, inflation hedge, monetary policy divergence) supports extension. GLD specifically is the cleanest execution because it is neither extended nor squeezed, offering best risk/reward among the precious metals. This allocation reflects the portfolio's bet that capital will rotate into hard assets as growth concerns intensify and central banks signal caution. The 10% slot signals conviction in the macro narrative, not tactical mean-reversion.
Nuclear Energy — URNM
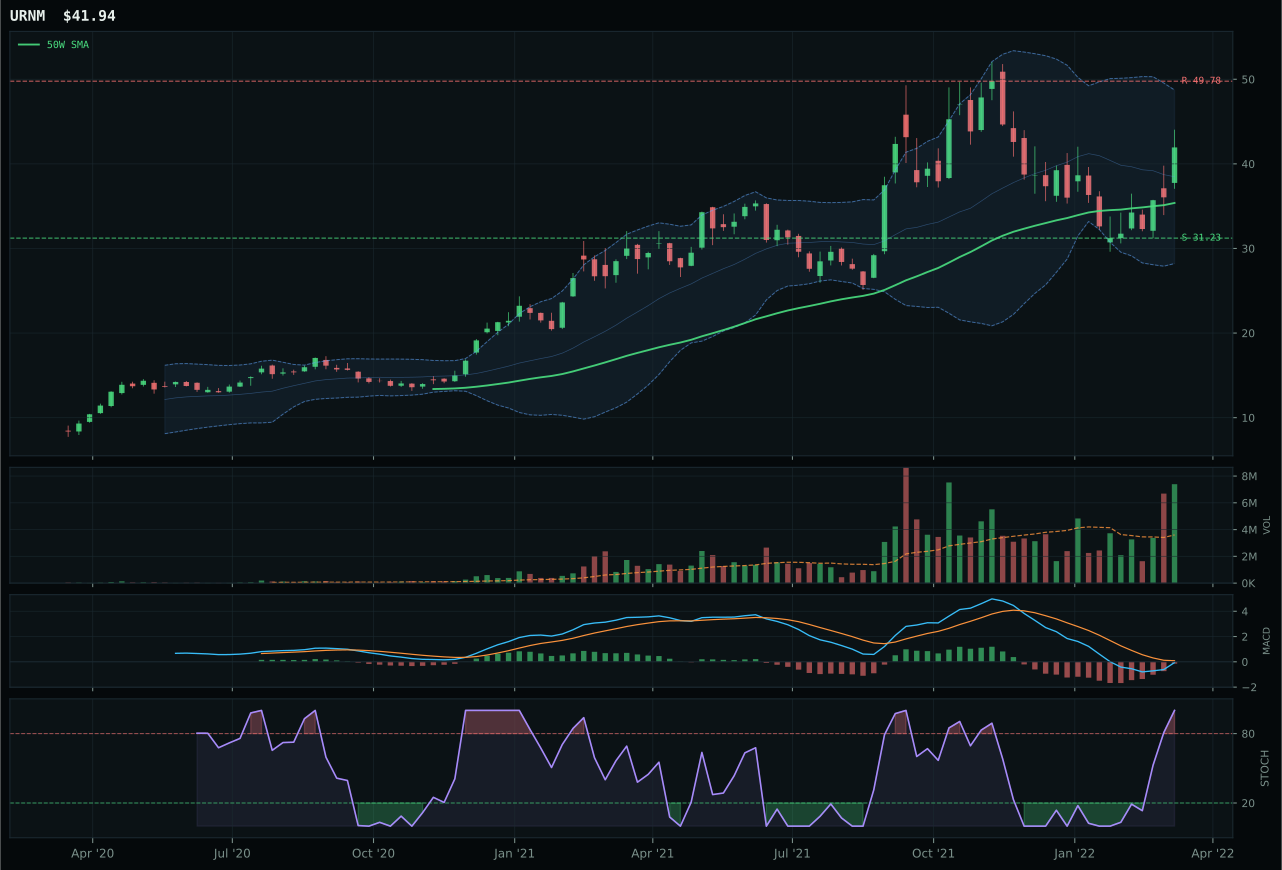
URNM has a vertical extension profile with 19.4% 13-week relative strength versus SPY.
A failed hold above support would weaken the setup.
Actionable but governed by invalidation levels.
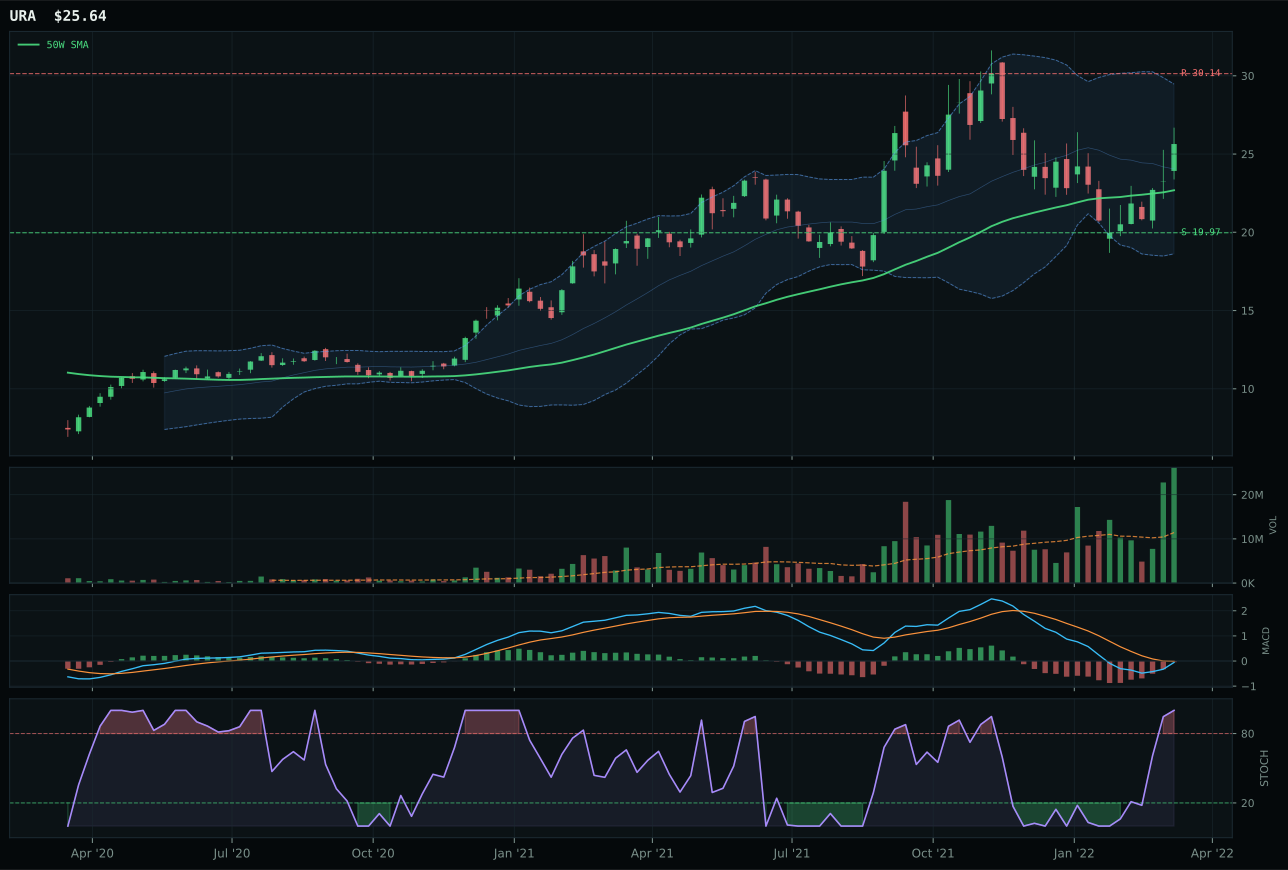
URA has a neutral structure profile with 16.8% 13-week relative strength versus SPY.
A failed hold above support would weaken the setup.
Actionable but governed by invalidation levels.
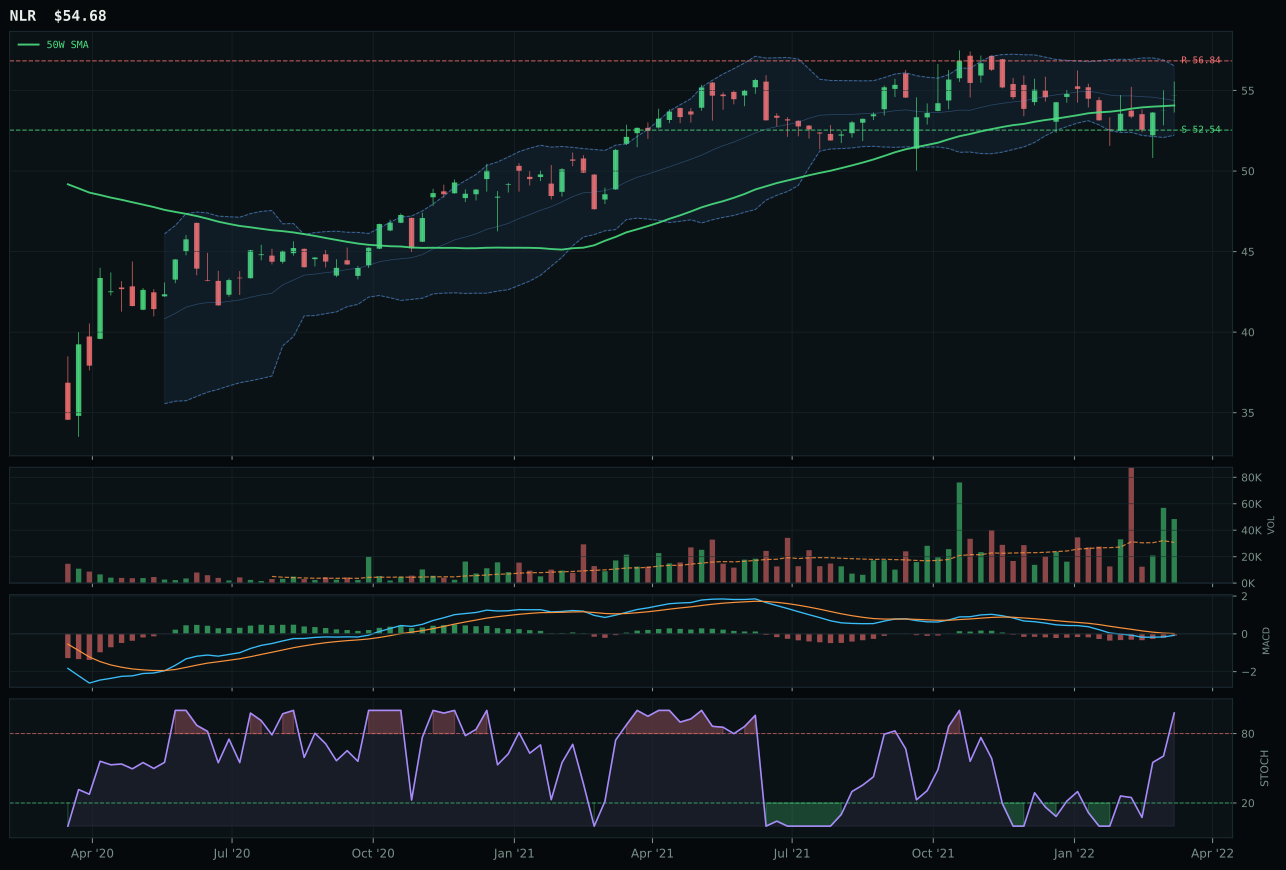
NLR has a pullback into support profile with 10.1% 13-week relative strength versus SPY.
A failed hold above support would weaken the setup.
Tracked, but not top-2 eligible because: .
URNM wins Nuclear Energy with a 68.6 category score based on a 4W return of 22.5% and 8.6% 13-week return showing accelerating momentum, even though price sits 18.5% above the 50W in a vertical extension that typically punishes entry risk. The stochastic RSI at 1.00 overbought momentum and MACD bearish but improving create a setup where buyers are aggressive but technicians recognize extended conditions; timing score of 45 reflects this tension. The deciding factor is momentum confirmation at 100 basis points, driven by the 22.5% 4-week surge and 2.6% category-relative strength, plus volume-price confirmation of 80.8 showing that accumulation is persisting into resistance. URA, the runner-up at 75.7 reasoned score, has cleaner structure (neutral vs vertical extension) and better timing (74 vs 45), but lags category-relative strength at 0.0% versus URNM's 2.6%, making it the secondary play. The category gap of -19.3 points versus URA is misleading; URNM wins because momentum confirmation trumps structure quality when micro-cap nuclear equities are in a supply-narrative bull move.
Nuclear Energy earned 5% allocation as a tier-2 category with a 68.6 final score, held below top-2 status despite favorable macro because technical evidence (79.6) reflects entry risk from the 18.5% extension above the 50W. Energy scarcity is active (+9 basis points), real asset sponsorship is active (+7), and inflation pressure is active (+3), creating a 65.0 macro fit score that is respectable but trails XLE's 92.0 and GLD's 72.0. The category's 3/2/1 ETF basket scored 70.6, with URNM and URA nearly tied at 75.8 and 75.7 reasoned scores—a tight call where URNM edges ahead on 4-week momentum alone. This allocation reflects conviction that the nuclear supply narrative (uranium supply deficit, reactors reopening, climate policy tailwinds) merits inclusion, but the extended price action keeps it in tier-2 rather than tier-1. For elevation to top-2, URNM would need to consolidate the recent gains into a tighter range (compression near 50W) while maintaining 8.6% or higher 13-week returns—a retest of support near 31.23 followed by a higher consolidation would reset timing favorability without killing the trend. Current setup is acceptable for 5%, not yet ideal for 10%.
Industrial Metals — COPX
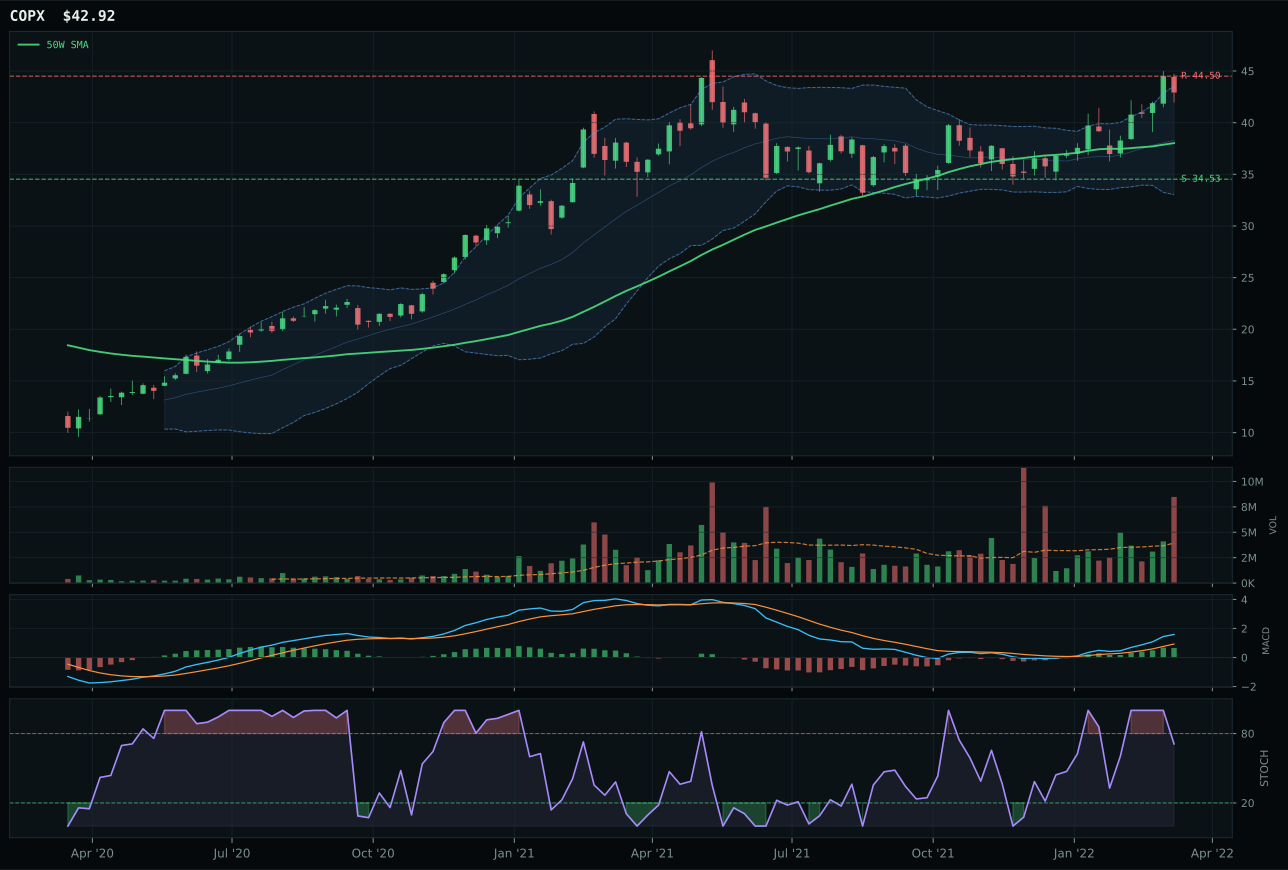
COPX has a neutral structure profile with 28.2% 13-week relative strength versus SPY.
A failed hold above support would weaken the setup.
Actionable but governed by invalidation levels.
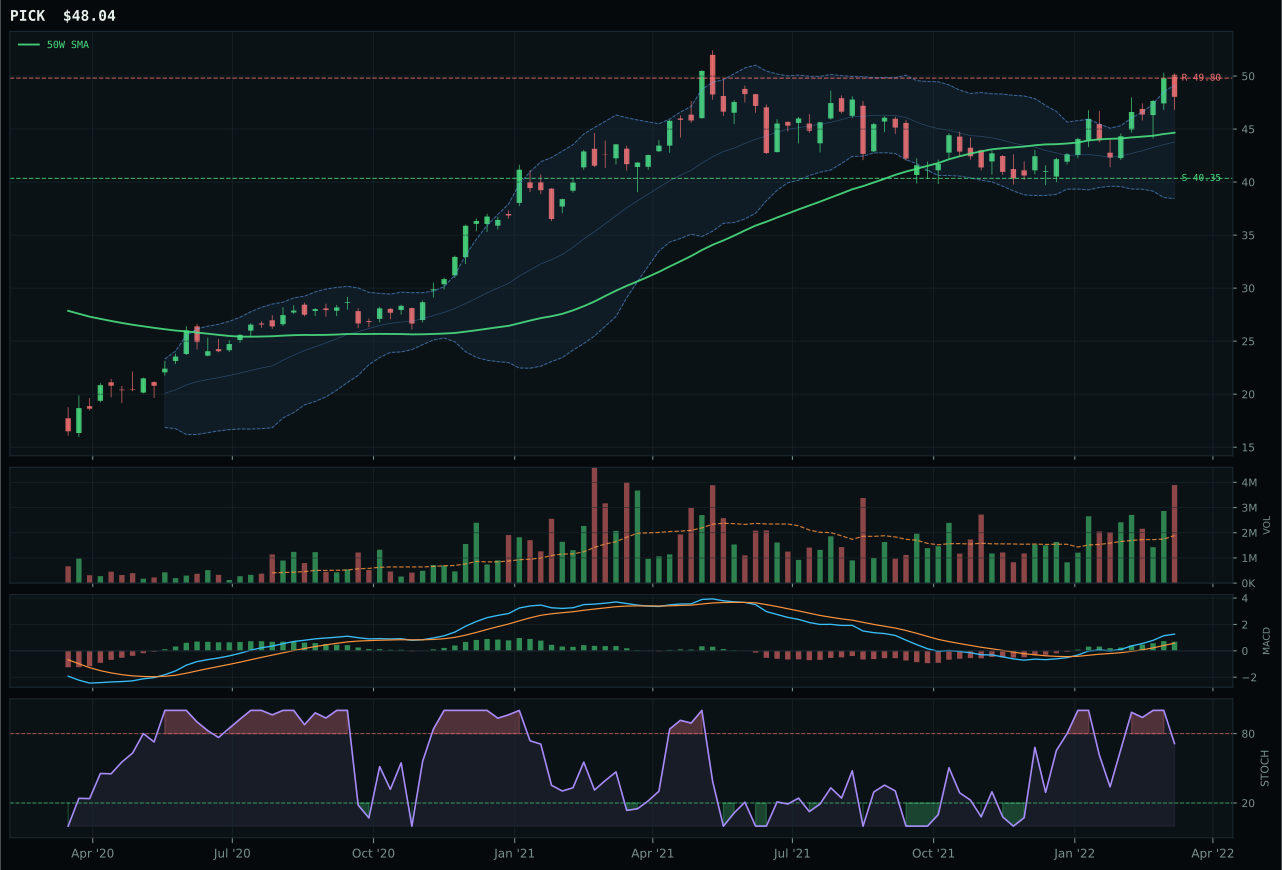
PICK has a neutral structure profile with 24.0% 13-week relative strength versus SPY.
A failed hold above support would weaken the setup.
Actionable but governed by invalidation levels.
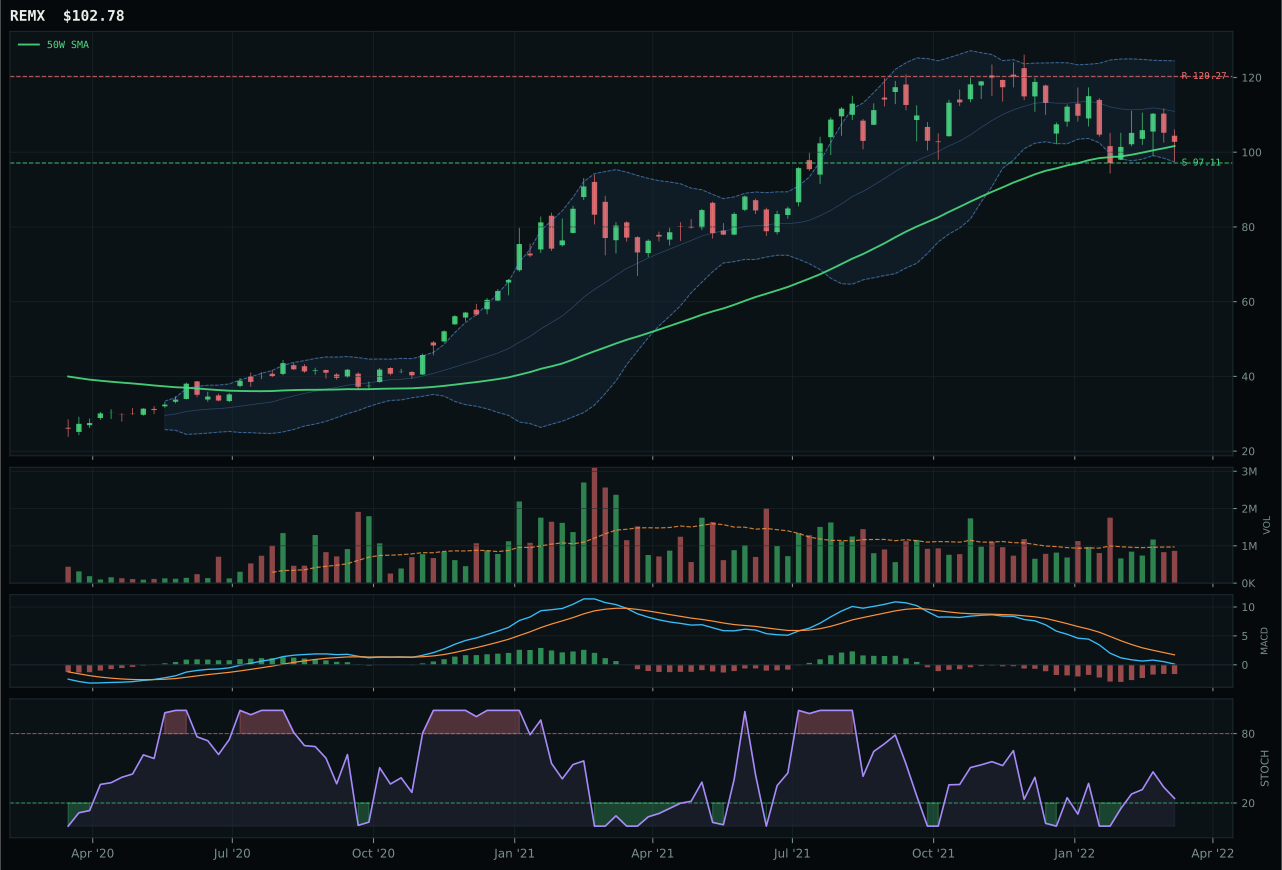
REMX has a compression near 50W profile with -2.7% 13-week relative strength versus SPY.
A failed hold above support would weaken the setup.
Actionable but governed by invalidation levels.
COPX wins Industrial Metals on the strength of a neutral structure setup just 12.9% above the 50W, where 100-point trend and 100-point momentum confirmation (driven by 17.4% 13-week return and 28.2% RS vs SPY) deliver perfect category-relative strength at 4.2% and distribution pressure at 2.15x volume. The stochastic RSI is falling/neutral at 0.71, not yet extended like overbought peers, and MACD is bullish and improving—this is mid-phase strength, not exhaustion. Volume-price confirmation of 66.9 and persistence of 67.7 confirm trend sustainability. PICK, the runner-up at 62.0 reasoned score, has identical bullish technicals but lags category-relative strength at 0.0% and carries slightly weaker structure (72.3 vs 74.5), making COPX the cleaner proof of category strength. The 0.3-point edge is tight, reflecting that both copper and diversified mining ETFs are riding the same metals scarcity narrative; COPX just has fresher volume sponsorship and category-relative outperformance.
Industrial Metals earned 5% allocation as a tier-2 holding with a 65.5 final score, placed below XLE and GLD because technical evidence (63.6) is solid but not exceptional, and the macro fit of 63.0 lags the top-tier categories. Metals scarcity is active (+14 basis points), commodity breadth is positive (+10), and real asset sponsorship is strong (+6), but dollar pressure (-7) and risk appetite concerns (-2 via category-level logic) create a net macro environment that is supportive but not dominant. The category's 3/2/1 weighted ETF basket scored 61.6 before category-reasoner adjustments, indicating a cohesive bullish setup across COPX, PICK, and REMX that merits allocation. COPX's 28.2% RS versus SPY is superior to precious metals' 21.9%, suggesting industrial metals may be capturing more growth-driven demand (reopening, infrastructure) than pure flight-to-safety demand. For tier-2 to top-2 elevation, the category would need either a fresh macro descriptor around supply disruption/reconstruction to activate, or price confirmation that the current strength is escaping the $44.50 resistance level at COPX. Allocation reflects macro tailwind plus clean technical setup, but timing is neither extended enough nor macro-consolidated enough for a top-2 slot.
Agriculture & Livestock — WEAT
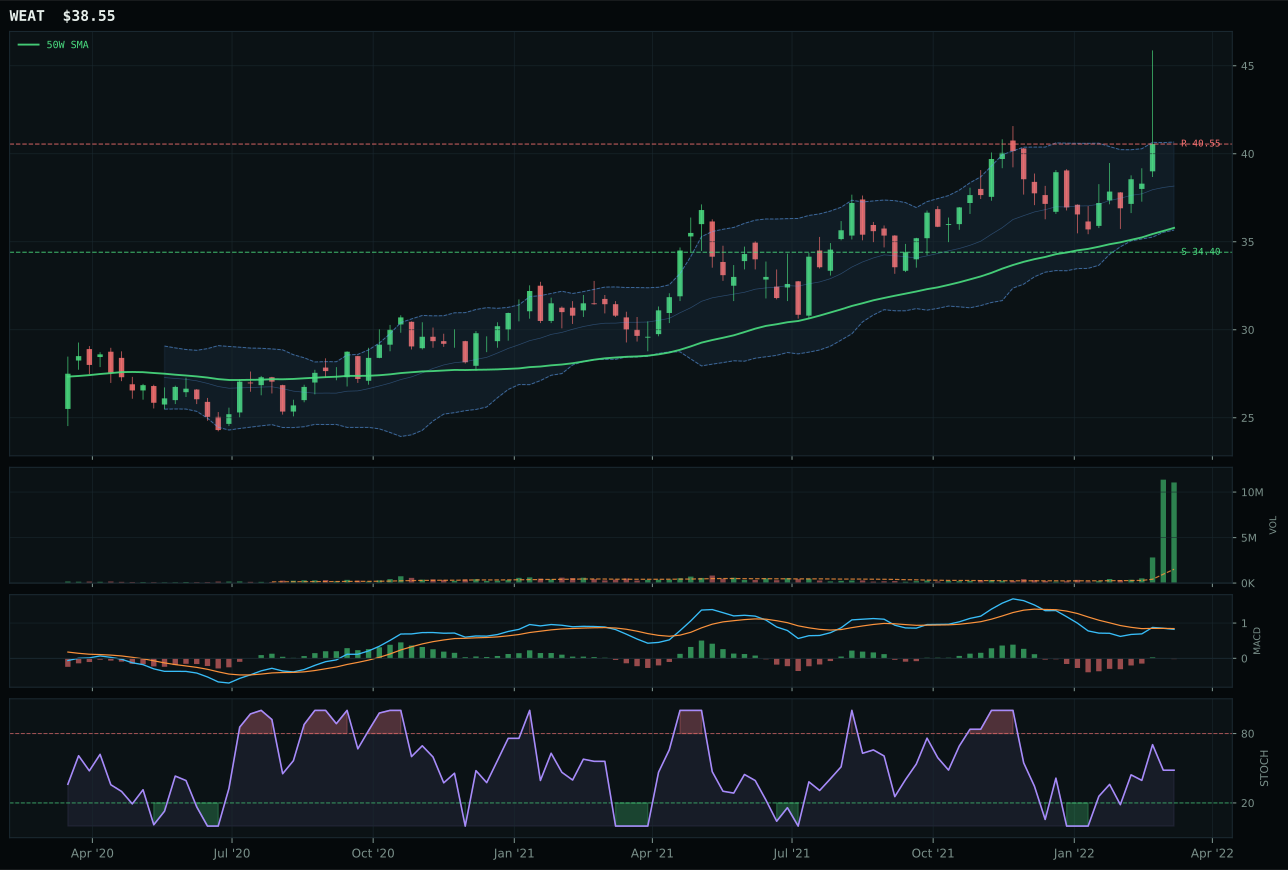
WEAT has a vertical extension profile with 47.8% 13-week relative strength versus SPY.
A failed hold above support would weaken the setup.
Actionable but governed by invalidation levels.
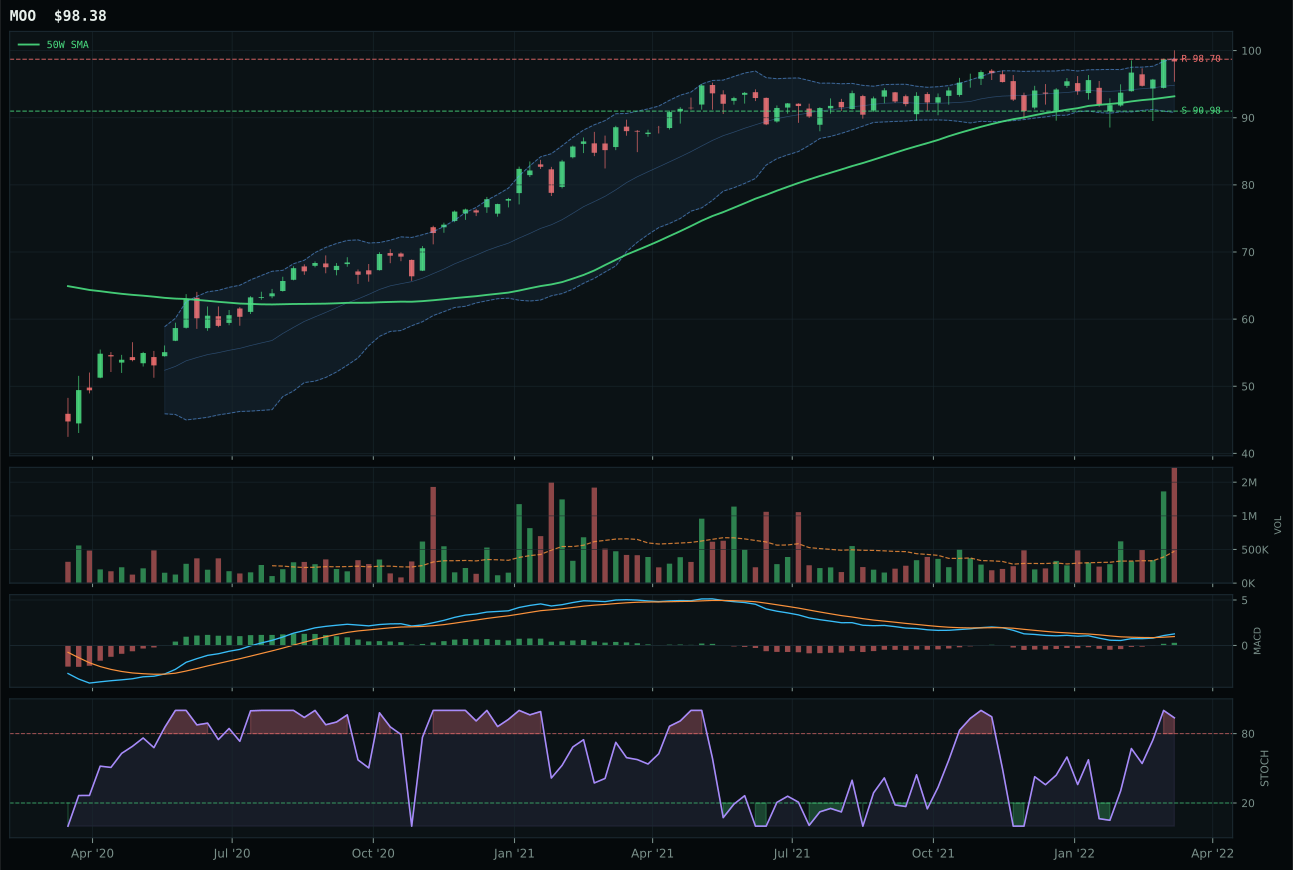
MOO has a neutral structure profile with 15.4% 13-week relative strength versus SPY.
A failed hold above support would weaken the setup.
Actionable but governed by invalidation levels.
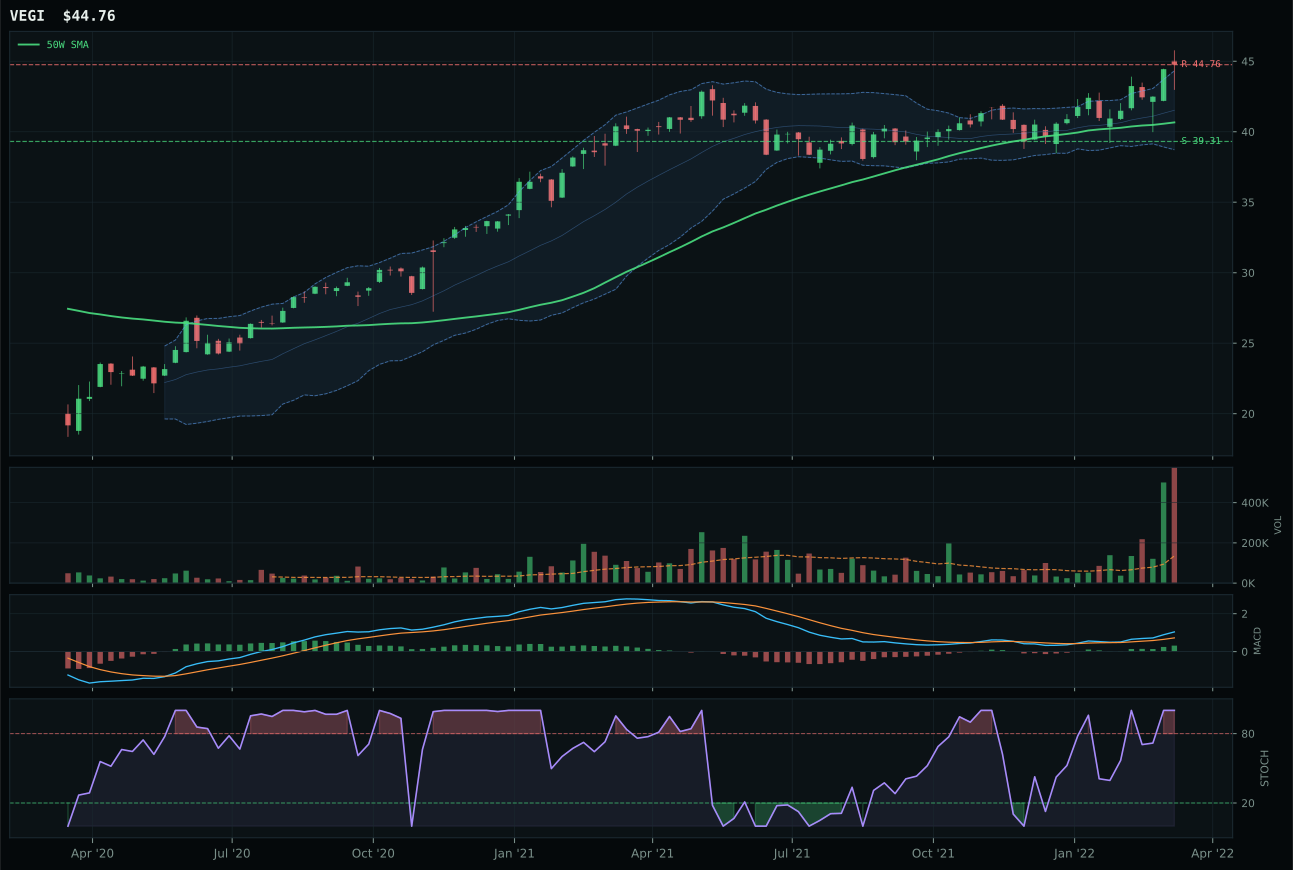
VEGI has a neutral structure profile with 21.3% 13-week relative strength versus SPY.
A failed hold above support would weaken the setup.
Tracked, but not top-2 eligible because: .
WEAT dominates Agriculture & Livestock with a vertical extension that is 42.3% above the 50W, a rarity that typically signals late-stage strength but here is supported by exceptional momentum metrics: 100 basis points for both trend and momentum confirmation, driven by 37.1% 13-week return and 26.6% category-relative strength. The 7.28x volume at the 20W average is distribution pressure in the upper zone, meaning new buying is pushing into resistance, yet stochastic RSI at 0.79 is rising mid-zone (not yet overbought-rolling-over), and MACD is bullish and improving—the setup still has room before invalidation. Volume-price confirmation of 72.4 and persistence of 96.8 confirm that this is not a one-week squeeze; the trend has legs. MOO, the runner-up, carries overbought stochastic RSI already rolling and lagging category-relative strength by 32.5 percentage points, making it the weaker expression of the same bullish narrative. Risk/reward is poor (23.6 basis points) because upside to resistance is only -4.4%, but the trend is so strong and the momentum confirmation so complete that WEAT's extended entry is acceptable on this specific week—the chart is broadcasting that strength is persisting.
Agriculture & Livestock earned 5% allocation as a tier-2 category with a 63.4 final score, held back from top-2 only by the sheer dominance of XLE and GLD in the week's macro environment. The category-level macro fit is 86.0, the highest among all tier-2 slots, because supply shortage (+13), inflation pressure (+10), and real asset sponsorship (+8) create a powerful narrative tailwind for commodity-based agriculture. Technical evidence weighs only 65.0 because WEAT's 42.3% extension above the 50W creates timing risk (61 basis point timing score); however, the combination of 100-basis-point momentum confirmation and 96.8 persistence offsets that entry risk. The story here is macro-driven: Ukraine war supply disruptions, fertilizer scarcity, and inflation hedging all favor this category. WEAT's chart is extended, but the macro wind is so strong that it justifies tier-2 status. For elevation to top-2, the technical setup would need to cool into a cleaner consolidation with better risk/reward—not imminent given the current supply-shock narrative. Allocation reflects macro strength, not ideal technical timing.
Utilities & Infrastructure — XLU
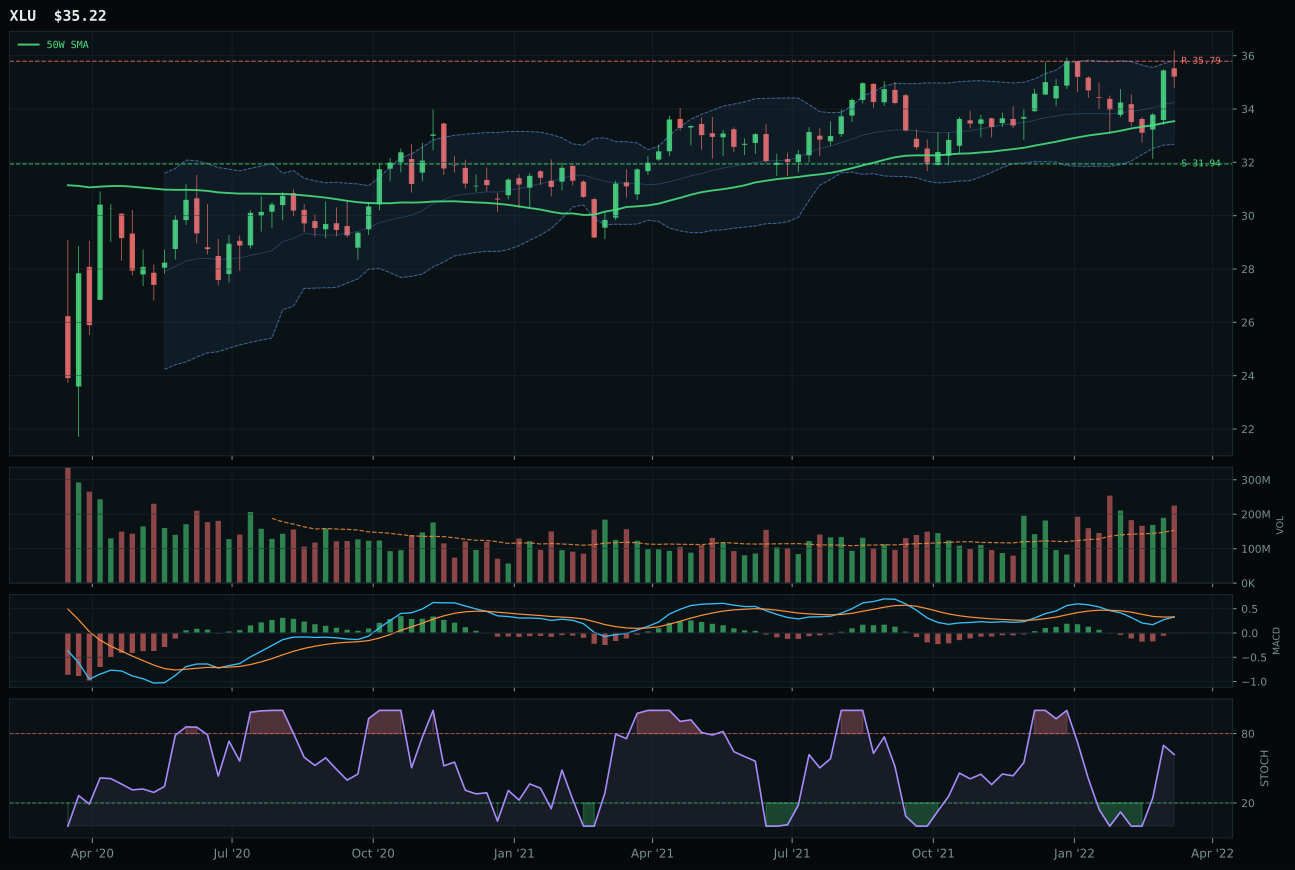
XLU has a neutral structure profile with 12.6% 13-week relative strength versus SPY.
A failed hold above support would weaken the setup.
Actionable but governed by invalidation levels.
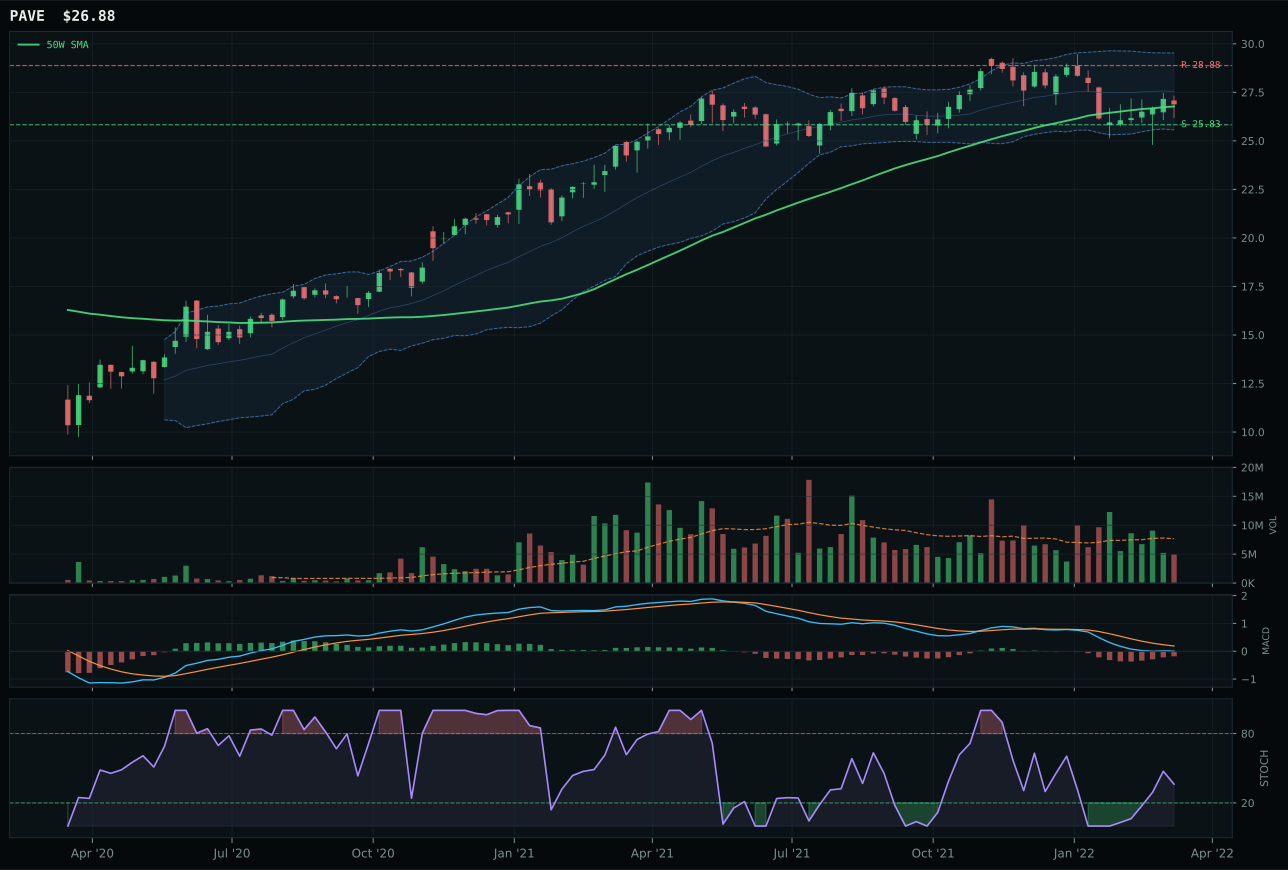
PAVE has a pullback into support profile with 4.9% 13-week relative strength versus SPY.
A failed hold above support would weaken the setup.
Actionable but governed by invalidation levels.
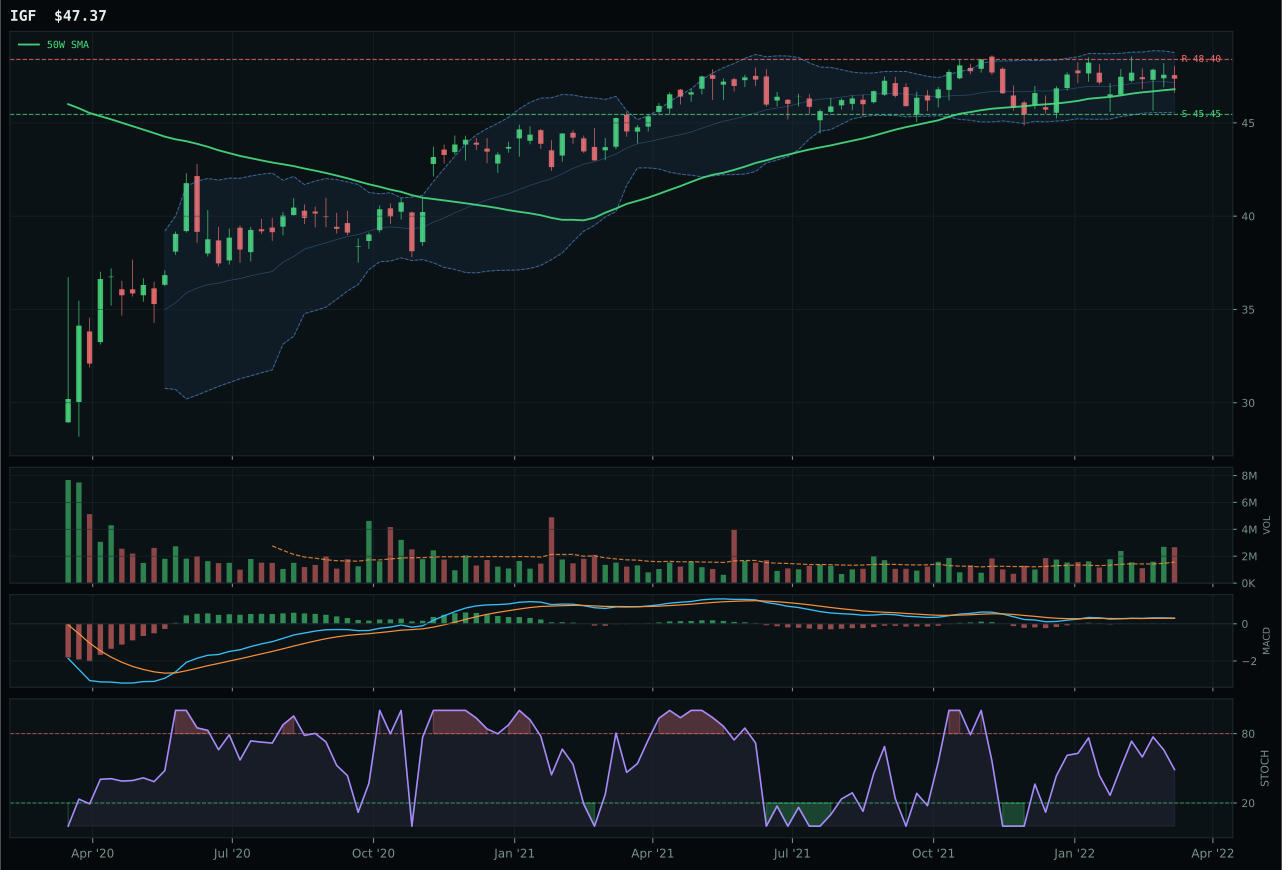
IGF has a pullback into support profile with 12.4% 13-week relative strength versus SPY.
A failed hold above support would weaken the setup.
Actionable but governed by invalidation levels.
XLU wins Utilities & Infrastructure with a neutral structure setup just 5.0% above the 50W where bullish MACD and stochastic RSI at 0.62 rising mid-zone deliver a timing score of 98 basis points—nearly perfect entry geometry. The 100-point trend score reflects price above both 50W and 200W with a steady 0.2% 50W slope; momentum confirmation is 98.5 driven by the 1.9% 13-week return and 12.6% RS versus SPY, confirming that defensive rotation is selecting utilities. Volume-price confirmation of 80.2 shows above-average participation (1.47x 20W) is confirming the setup, and persistence of 69.1 indicates the trend has been building, not just squeezing. PAVE, the runner-up at 70.2 reasoned score, carries superior timing at 100 basis points and better risk/reward (84 vs 48), but MACD is only bearish-but-improving (not fully bullish) and volume is thin participation, creating weaker accumulation proof than XLU's above-average participation. The 0.9-point category gap is extremely tight, reflecting two very different charts (XLU neutral structure near 50W vs PAVE pullback into support) reaching the same conclusion that utilities are safe havens.
Utilities & Infrastructure earned 5% allocation as a tier-2 category with a 58.6 final score, held below top-2 status because technical evidence (94.6 weighted) is exceptional but macro fit (60.0) lags the two overweight categories. Defensive rotation is active (+12 basis points), broad market bear is active (+4), and the Transition / Mixed regime provides modest support (+4), but inflation pressure is active at -6, creating a net macro tailwind of 14 basis points that is positive but not dominant. The 3/2/1 weighted ETF basket scored 71.4 before category-reasoner adjustments; XLU's 84.9 reasoned score and near-perfect timing geometry carry the category into allocation. XLU specifically is the cleanest execution: trend is perfect, timing is nearly perfect, and momentum confirmation is strong, but risk/reward of 47.8 is constrained because upside to resistance is only -1.6%, meaning the next move is likely consolidation rather than breakout. For tier-2 to top-2 elevation, the category would require either a fresh macro descriptor around fiscal stimulus (infrastructure spending) to activate or price breakout above the 35.79 resistance that proves the utility rotation has deeper legs. Current allocation reflects the defensive macro backdrop; the 5% slot is the maximum risk the portfolio wants until structure improves.
Defense & Aerospace — XAR
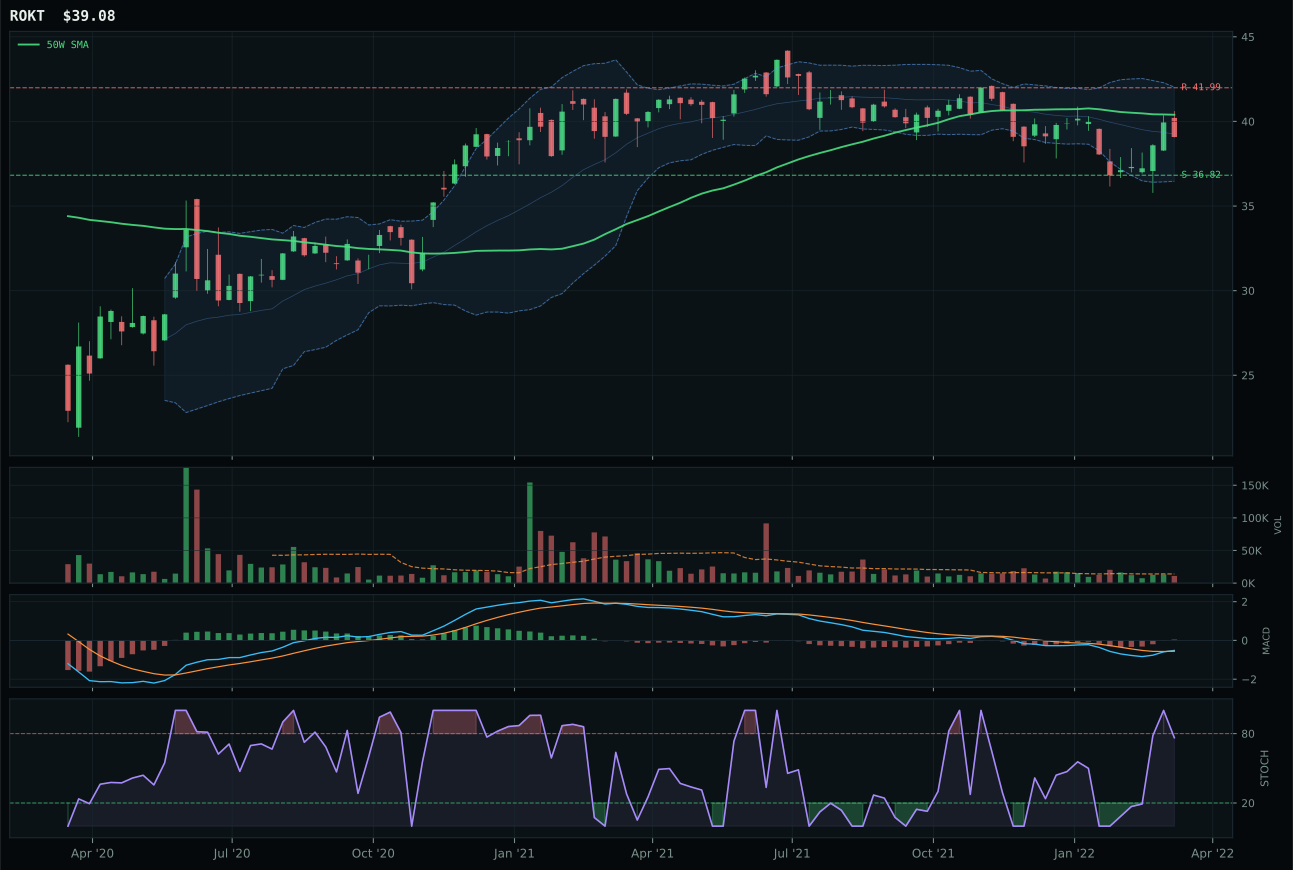
ROKT has a neutral structure profile with 8.9% 13-week relative strength versus SPY.
A failed hold above support would weaken the setup.
Tracked, but not top-2 eligible because: .
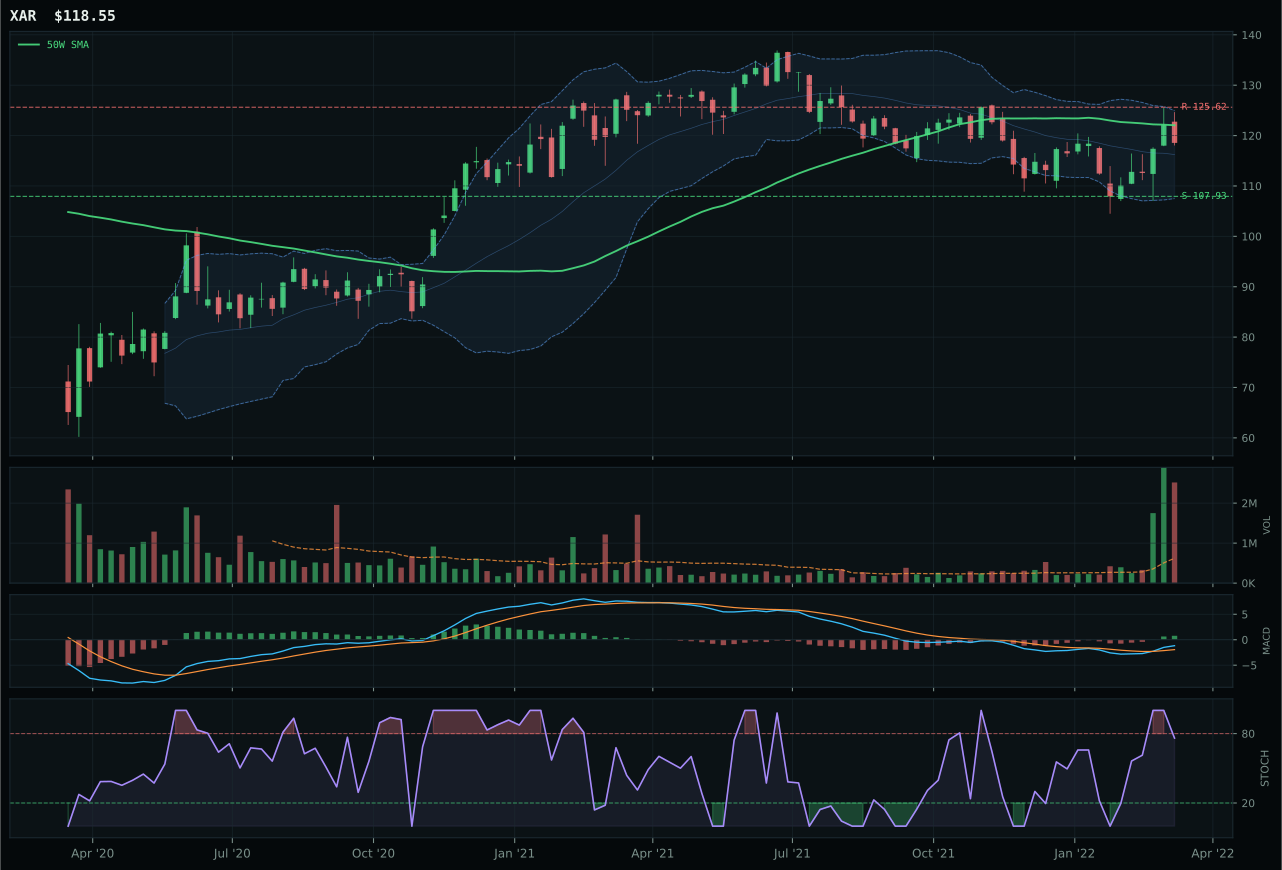
XAR has a compression near 50W profile with 14.0% 13-week relative strength versus SPY.
A failed hold above support would weaken the setup.
Actionable but governed by invalidation levels.
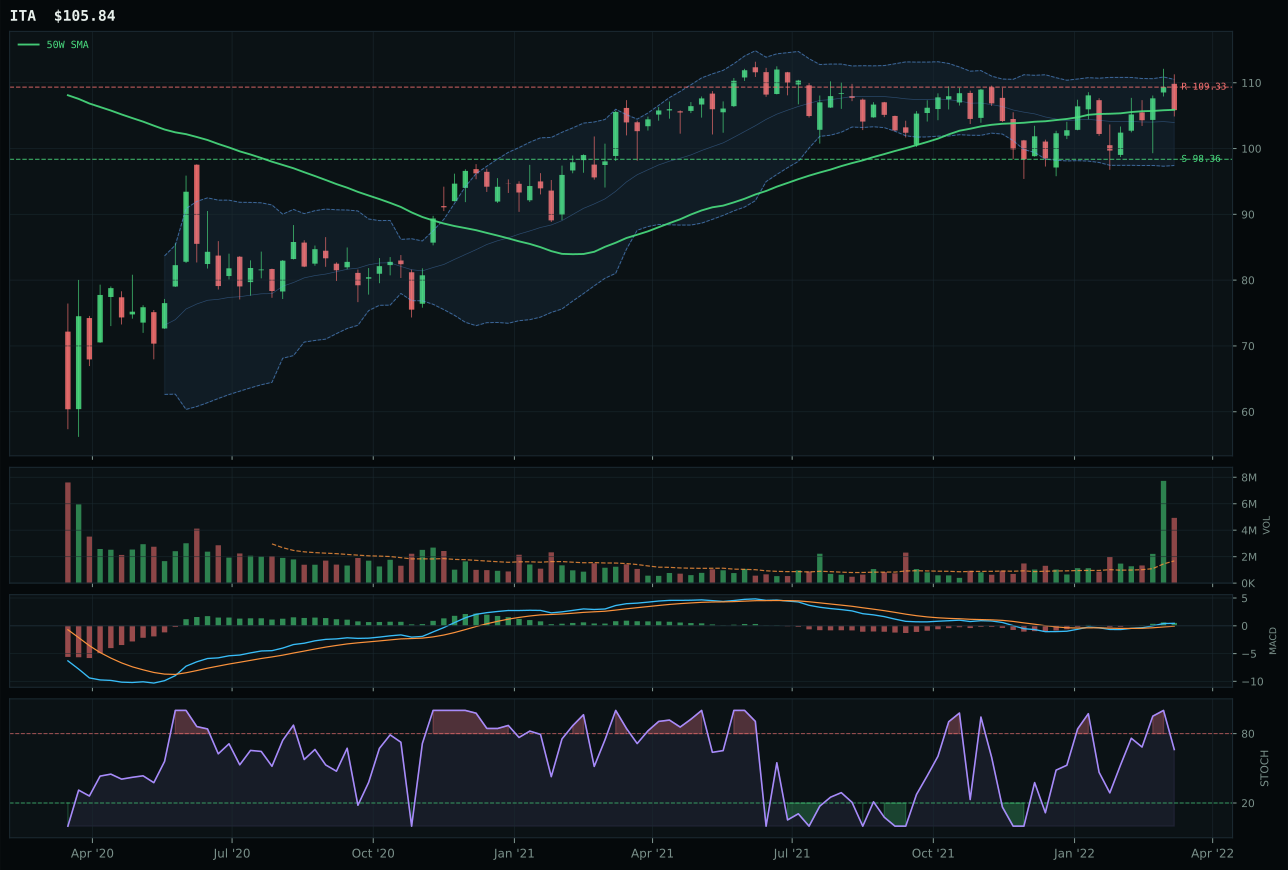
ITA has a compression near 50W profile with 14.7% 13-week relative strength versus SPY.
A failed hold above support would weaken the setup.
Actionable but governed by invalidation levels.
XAR wins Defense & Aerospace with a clean compression setup just 2.9% below the 50W, where bullish MACD and stochastic RSI at 0.76 rising mid-zone create ideal timing for expansion if support holds. The 14.0% relative strength versus SPY paired with 4.05x volume at the 20W average signals that despite a compressed structure, distribution pressure is high—buyers are showing conviction. Volume-price confirmation of 53.3 and persistence of 48.5 indicate that the recent strength has legs; the 3.3% 13-week return, while modest, is positive and confirms the compression is accumulative rather than capitulative. ROKT, the runner-up, has superior timing at 98 basis points (near perfect setup) but category-relative strength of -5.1% reveals it is underperforming the category median; its neutral structure and lack of volume distribution pressure made it secondary to XAR's heavier sponsorship. The 41-point gap is significant because volume and macro narrative alignment are pushing XAR forward even though ROKT's technical setup is tighter.
Defense & Aerospace earned 5% allocation as a tier-2 category with a 53.0 final score, held back from top-2 status despite the fact that macro conditions are structurally favorable. The category-level macro fit is 68.0—the highest percentage in the tier-2 cohort—because defensive rotation (+8), broad market bear (+6), and the Transition / Mixed regime itself (+3) all support defensive themes and capital rotation into aerospace durability. However, the technical evidence score is only 57.5 weighted, creating a tension between strong narrative support and weaker current momentum. XAR's 85-point composite technical score is solid, but it sits in a reset phase rather than an established uptrend; risk/reward is only 55.3, meaning the upside to resistance is constrained at -5.6% while downside to support is 9.8%. For this category to earn a top-2 slot, the price action would need to decisively break resistance at 125.62 and confirm the compression as a genuine bullish reversal rather than a temporary pause in a larger correction. The macro wind is at its back; execution is what lags.
Technology — CIBR
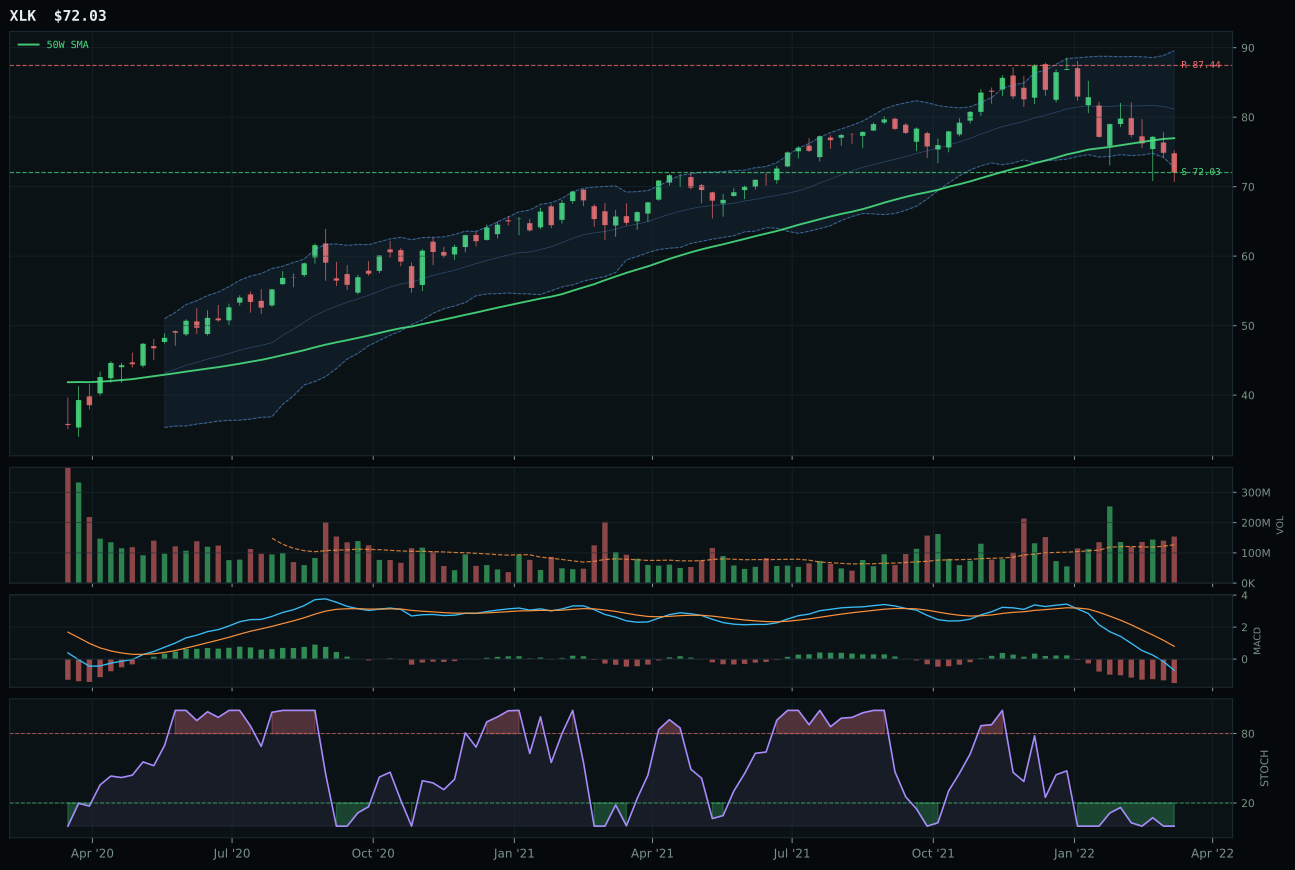
XLK has a pullback into support profile with -6.9% 13-week relative strength versus SPY.
A failed hold above support would weaken the setup.
Actionable but governed by invalidation levels.
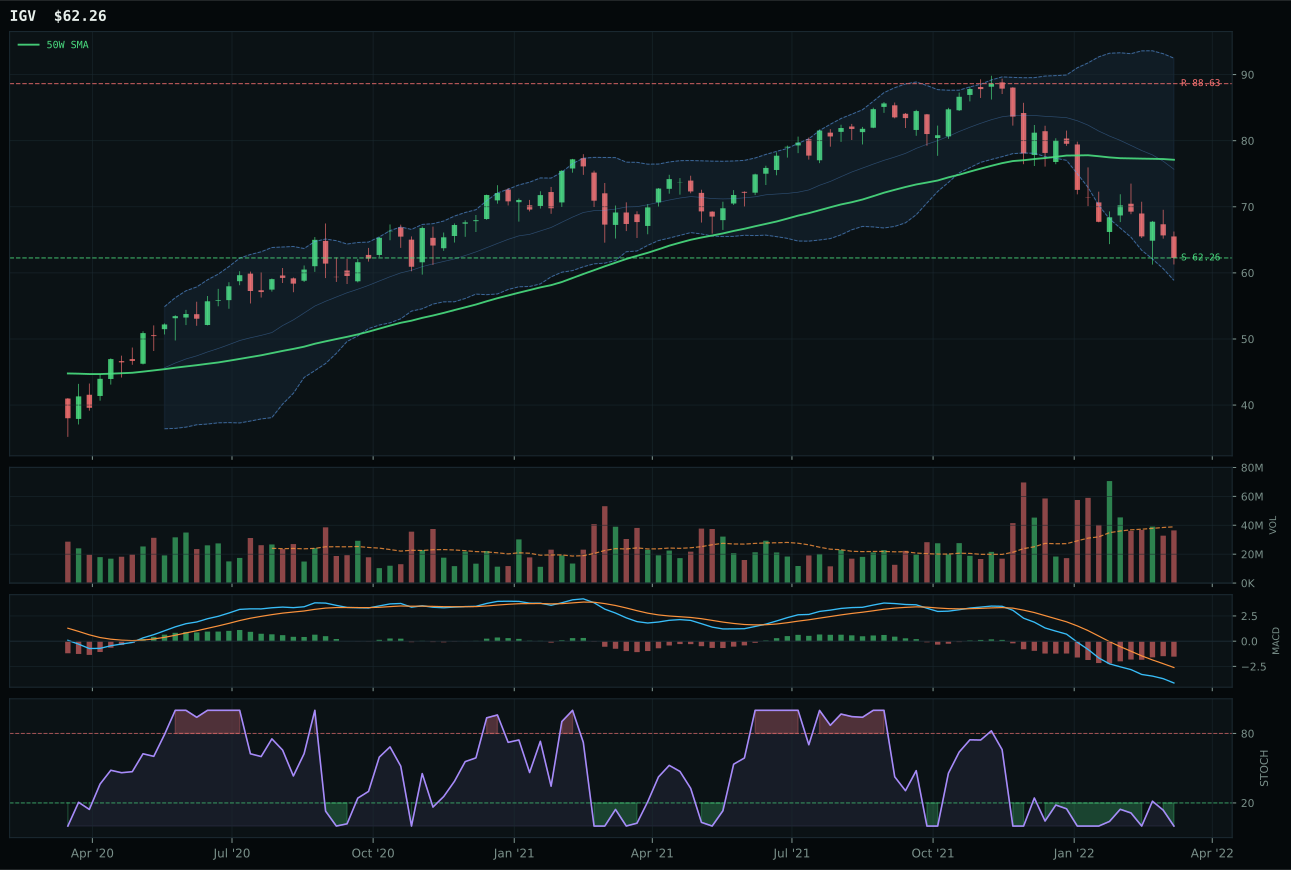
IGV has a pullback into support profile with -12.6% 13-week relative strength versus SPY.
A failed hold above support would weaken the setup.
Actionable but governed by invalidation levels.
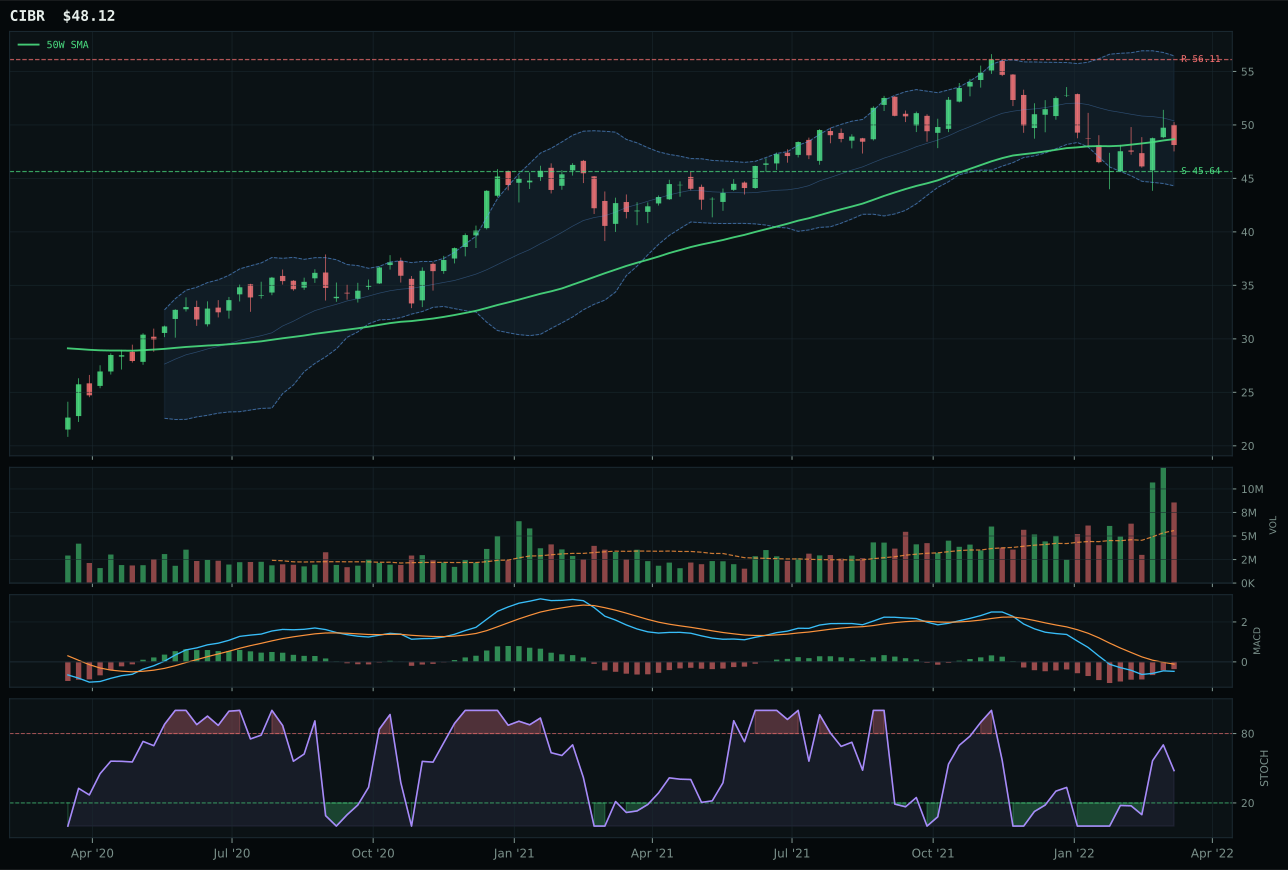
CIBR has a compression near 50W profile with 5.1% 13-week relative strength versus SPY.
A failed hold above support would weaken the setup.
Actionable but governed by invalidation levels.
CIBR wins the technology category because it sits in a compressed reset just 1.1% below the 50-week moving average, where relative strength of 12.0% versus the category median signals selective buying interest despite broad tech weakness. The stochastic RSI rising from oversold into mid-zone while MACD remains bearish-but-improving creates a classic coil setup: timing score of 100 reflects a chart that has defined both its invalidation (support at 45.64) and its expansion zone (resistance at 56.11), requiring new buyers to defend the 50W or admit the pullback was distributive. XLK, the runner-up, carries a -17.6% 13-week return and stochastic RSI still deeply oversold, leaving it vulnerable to one more leg down if broad market pressure intensifies; its -6.9% relative strength versus SPY is materially weaker than CIBR's 5.1%. The score gap of 31.8 points is decisive—this is cybersecurity as a steadier tech subtheme pulling in capital when the category is beaten down.
Technology earned 5% allocation as a tier-2 holding, ranking below the two macro-dominant categories but above the excluded sectors. The 42.3 final score reflects heavy technical sponsorship (57.6 weighted score) fighting against a macro regime that penalizes growth and liquidity-dependent narratives: defensive rotation is active and risk appetite is broken, both structural headwinds that force the category into a waiting pattern. Liquidity expansion offers modest support (+9 basis points) but dollar pressure (-5) and inflation concerns (-4) drag the macro fit down to 50.0, well below the top-tier thresholds. CIBR's 12.0% category-relative strength is the outlier that keeps technology in the allocation; without it, the entire basket would warrant exclusion. For tech to earn a top-2 slot, either momentum confirmation scores would need to turn positive across all three ETFs or macro descriptors around liquidity stabilization would need to reverse the current headwind—neither is imminent given the transition regime.
AI — SMH
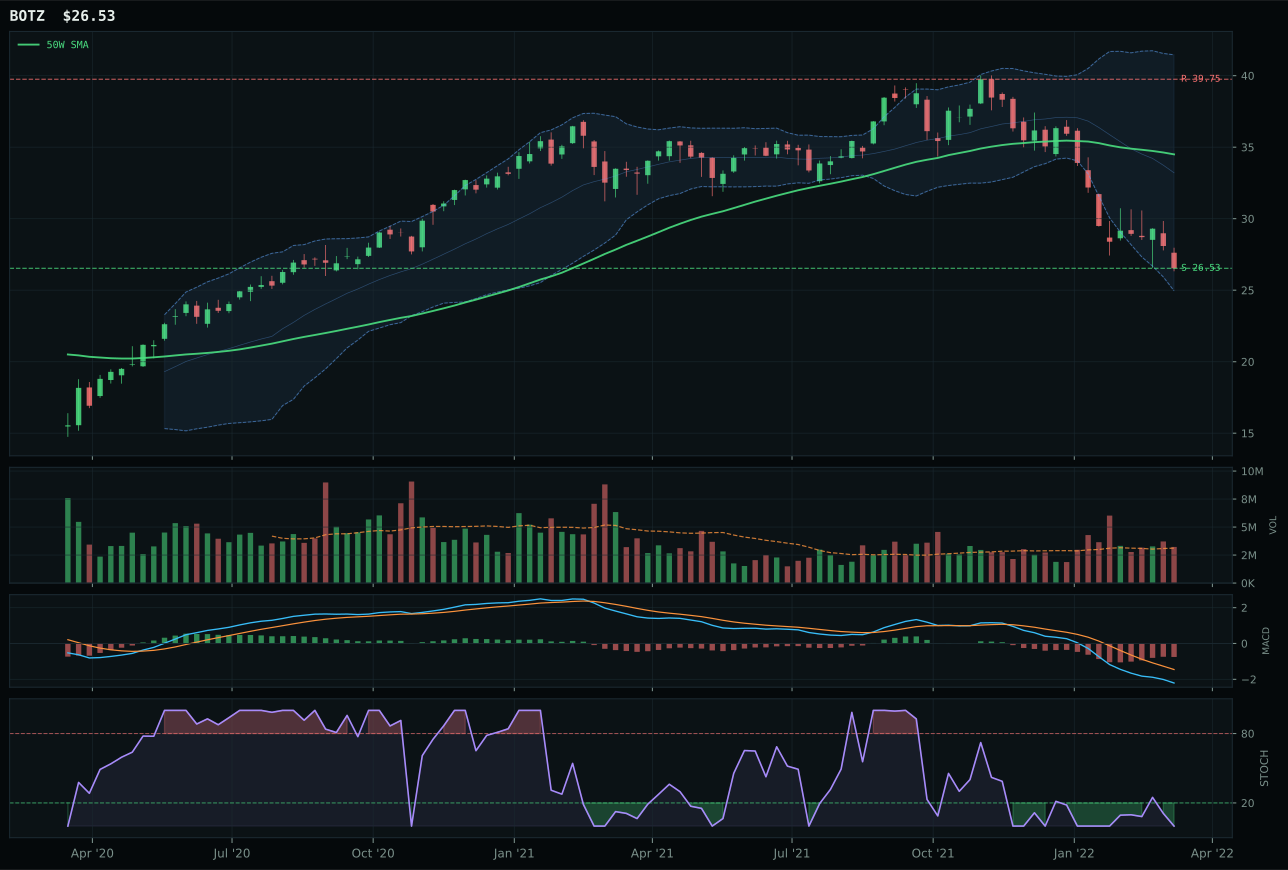
BOTZ has a pullback into support profile with -15.9% 13-week relative strength versus SPY.
A failed hold above support would weaken the setup.
Actionable but governed by invalidation levels.
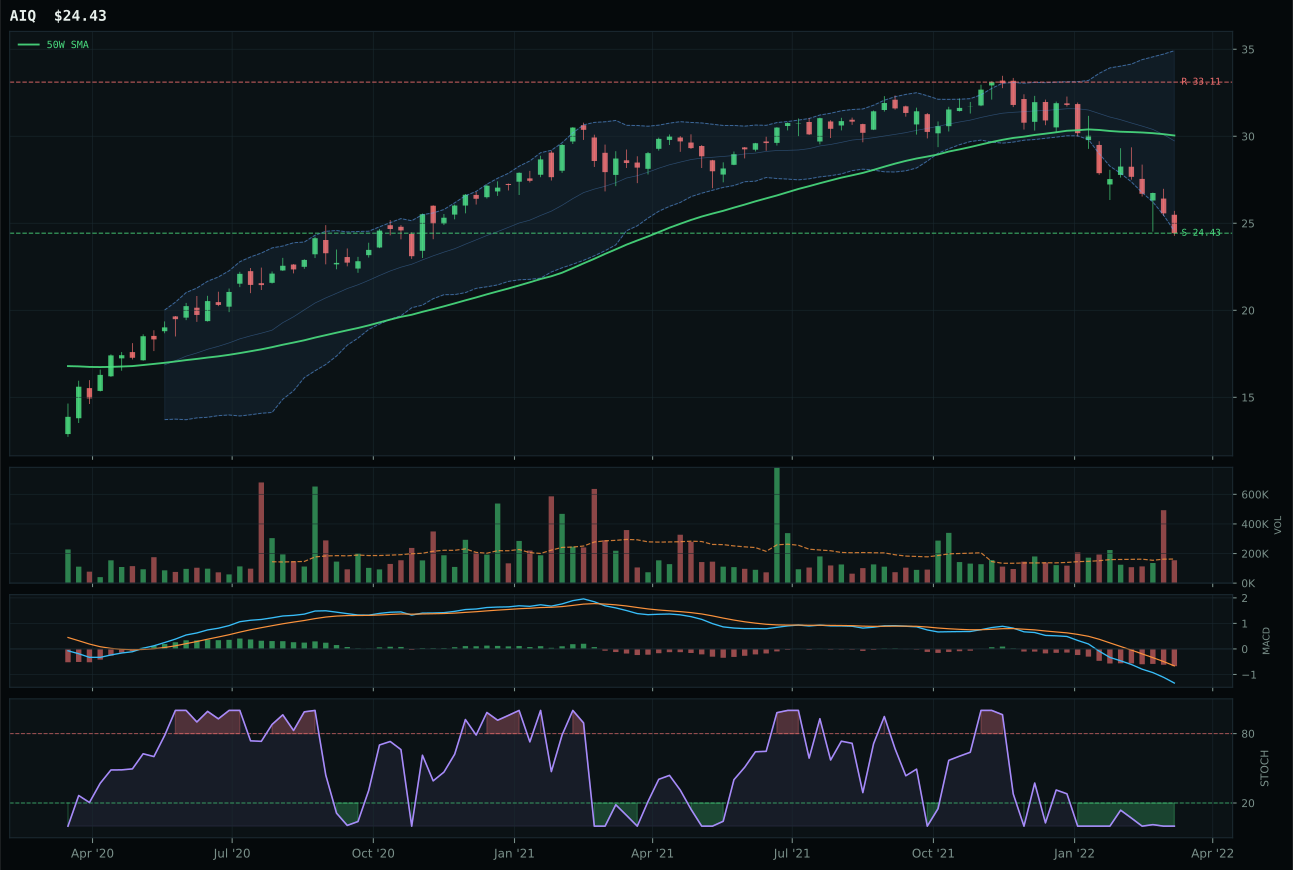
AIQ has a pullback into support profile with -12.8% 13-week relative strength versus SPY.
A failed hold above support would weaken the setup.
Tracked, but not top-2 eligible because: .
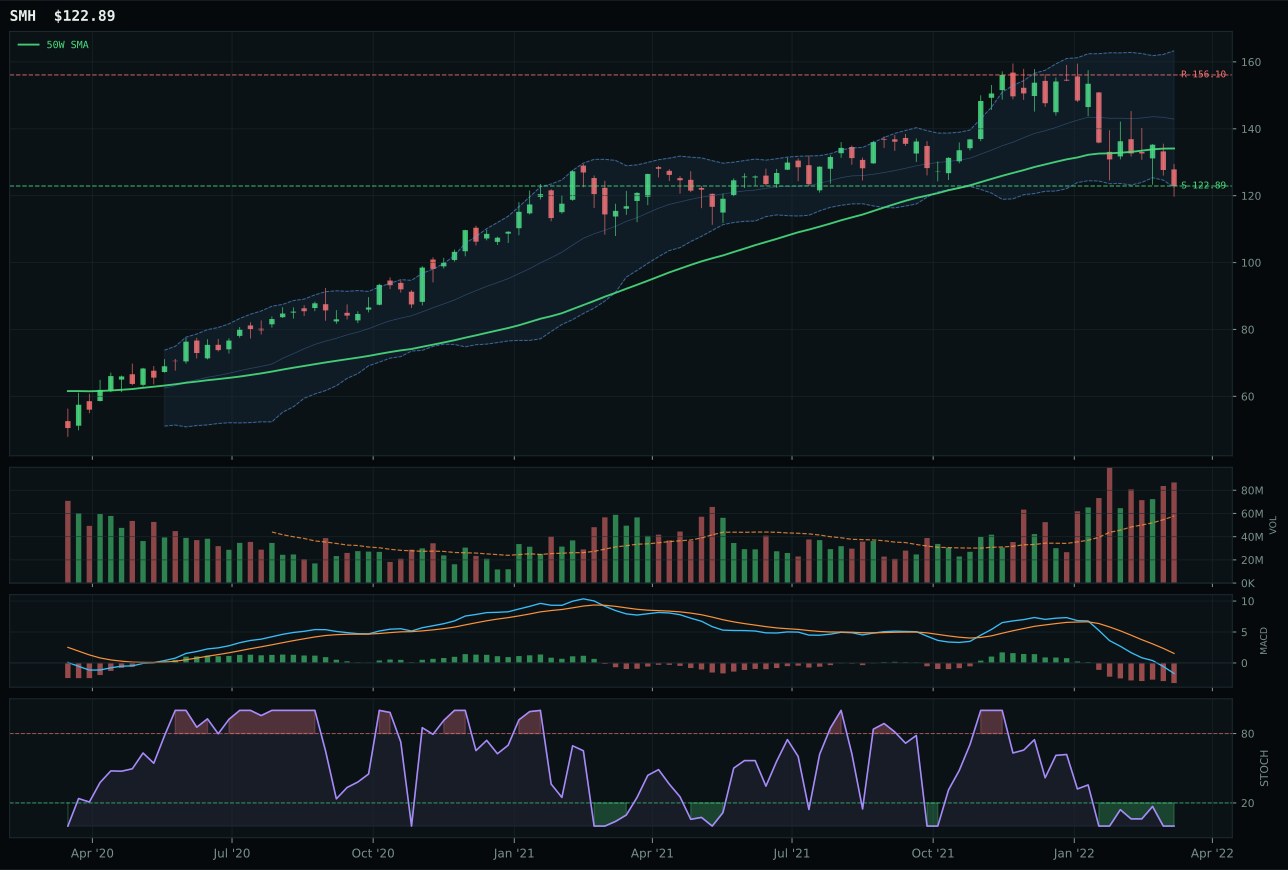
SMH has a pullback into support profile with -9.3% 13-week relative strength versus SPY.
A failed hold above support would weaken the setup.
Actionable but governed by invalidation levels.
SMH wins the AI category in what amounts to a near tie with BOTZ (24.4 scoring points), edging ahead purely on timing superiority. The semiconductor ETF trades just 8.4% below the 50W in a pullback setup with stochastic RSI deeply oversold at 0.00, offering the category's cleanest mean-reversion trigger point near support at 122.89; this setup is worth 87 basis points in timing versus BOTZ's 65, a structural advantage when both charts are broken. The 3.5% relative strength versus category median, paired with volume at 1.50x the 20W average, suggests that despite a -20.1% 13-week decline, some accumulation is occurring at support rather than pure liquidation. However, the momentum confirmation score of 0.0 reflects the brutal reality: no positive 4W or 13W returns, MACD bearish/weakening, and SPY relative strength of -9.3% mean this entire category is fighting gravity and macro headwinds. The gap versus BOTZ is negligible; both are equally broken, and the winner's title is more academic than actionable.
AI received 0% allocation this week, ranked 9th or 10th, because the category's 24.2 final score reflects a collapsing technical environment layered over a macro regime that has actively turned hostile. Liquidity expansion provides a modest +10 basis point boost, but broad market bear (-8), dollar pressure (-4), and risk appetite broken (-7 via BOTZ weighting) create a -9 basis point net macro drag that overwhelms any technical setup argument. The technical evidence score across the three-ETF basket is catastrophic: momentum confirmation is effectively zero across SMH, BOTZ, and AIQ; persistence is in the 6-7 range; and volume-price confirmation is barely above 12. For AI to earn allocation, the category would require either a complete reversal of the broad market bear descriptor or sustained positive momentum confirmation across multiple weekly closes—neither is visible on the macro calendar or in the current price action. This is defensive exclusion, not an opportunity being reserved; the risk asymmetry favors staying out entirely.
Emerging Markets — INDA
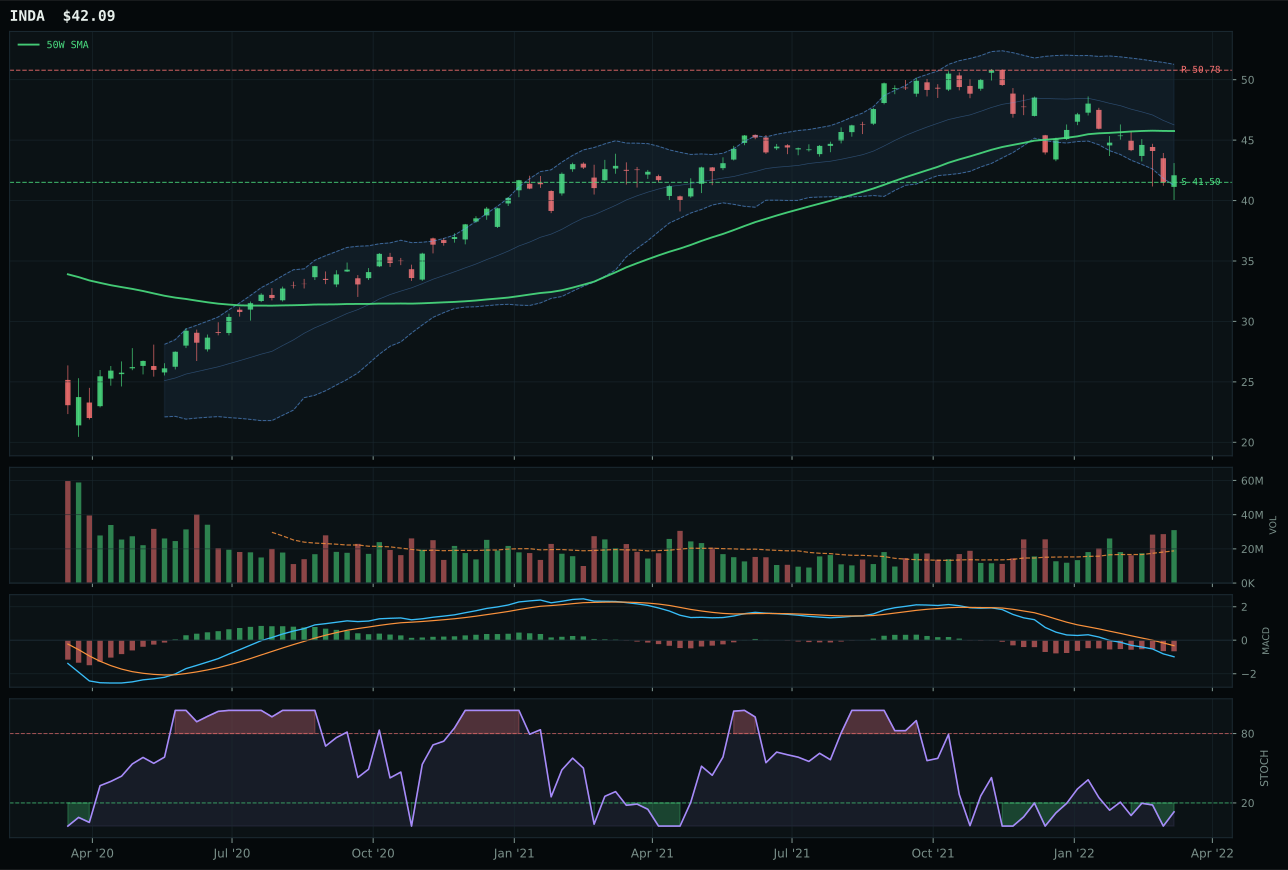
INDA has a pullback into support profile with -2.5% 13-week relative strength versus SPY.
A failed hold above support would weaken the setup.
Actionable but governed by invalidation levels.
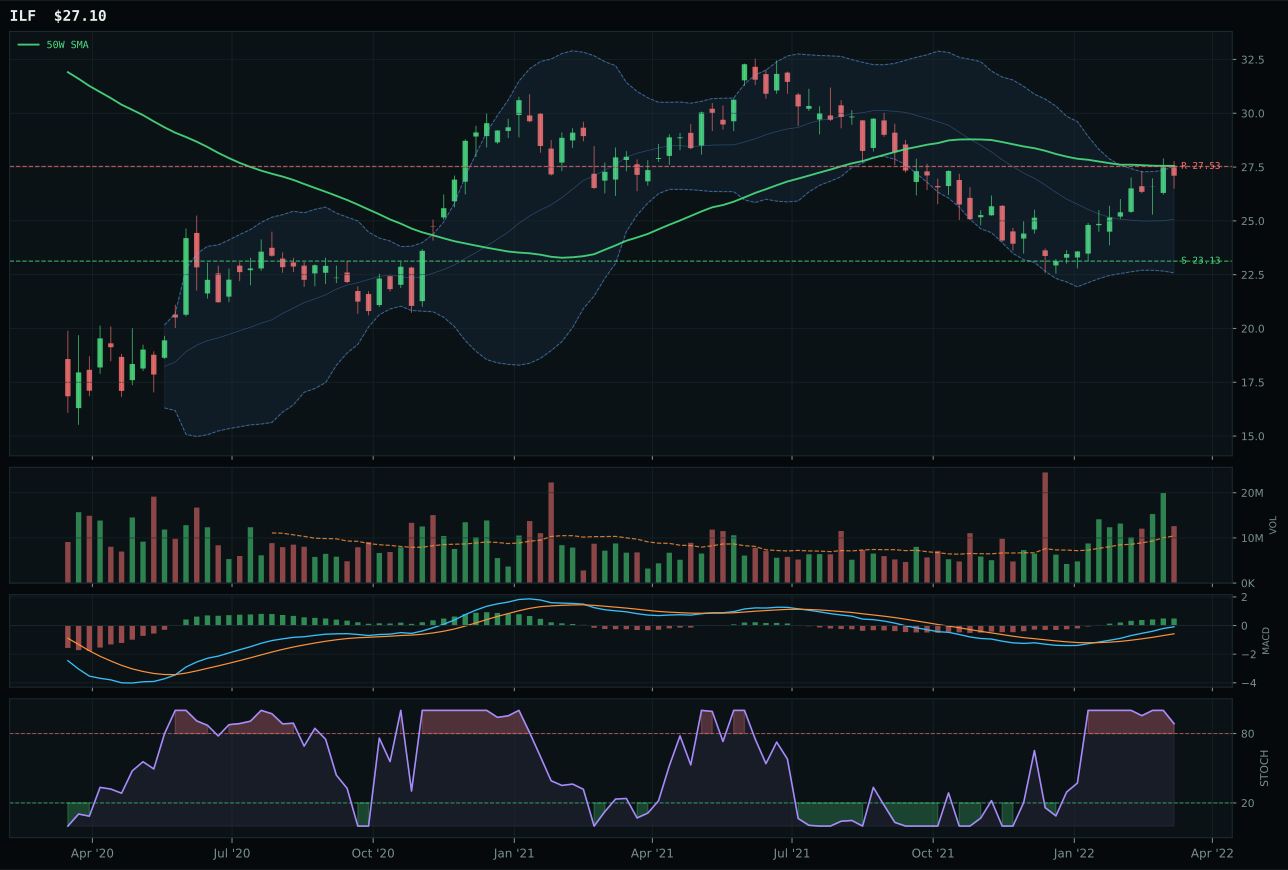
ILF has a compression near 50W profile with 18.5% 13-week relative strength versus SPY.
Extension and support failure are the main tactical risks.
Tracked, but not top-2 eligible because: structurally broken.
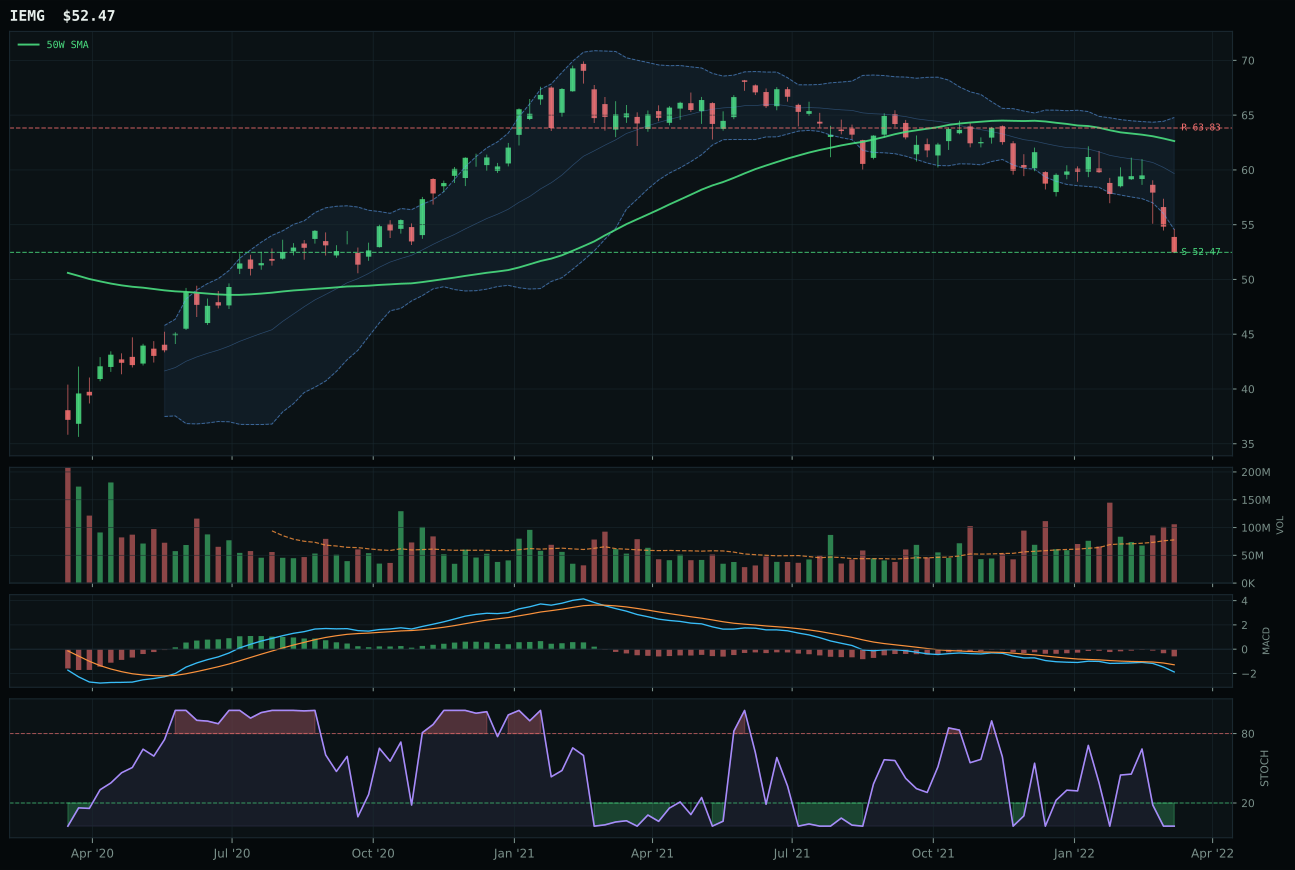
IEMG has a pullback into support profile with -4.1% 13-week relative strength versus SPY.
A failed hold above support would weaken the setup.
Actionable but governed by invalidation levels.
INDA wins Emerging Markets by default as the least-damaged chart in a systematically broken category, securing the representative position with 40.6 reasoned score but only 11.0 final category score—a dramatic discount reflecting broad-category ineligibility. The setup is pullback into support at 41.50 with stochastic RSI oversold at 0.12 and MACD bearish/weakening, creating a textbook mean-reversion coil that scores 87 basis points in timing. Risk/reward is exceptional at 100 basis points (upside to resistance -17.1%, downside to support only 1.4%), offering the portfolio's cleanest asymmetric opportunity. However, momentum confirmation plummets to 19.4 because the -13.3% 13-week return, -2.5% RS versus SPY, and zero category-relative strength expose that INDA is not accumulating—it is stabilizing after capitulation. ILF, the runner-up at 42.0 reasoned score, carries bullish MACD and 18.5% RS versus SPY but is penalized by hard filter 'structurally broken' and volume failing to confirm the compression at the 50W. Neither chart is worth the allocation.
Emerging Markets received 0% allocation this week, ranked outside the top-8, because the 11.0 final category score reflects macro conditions that are actively hostile to EM exposure and technical evidence too weak to overcome the headwind. Dollar pressure is active at -14 basis points, broad market bear is active at -9, and liquidity expansion offers only +8, creating a 35.0 macro fit score that is the lowest among all ten categories. The technical evidence across INDA, ILF, and IEMG averages to approximately 41.8 weighted score, well below allocation threshold; persistence is weak (36.5 for INDA), momentum confirmation is effectively zero (19.4 for INDA), and the 3/2/1 weighted ETF basket scored only 36.6 before category-reasoner adjustments that lowered it further to 11.0. INDA's support level at 41.50 is a tactical opportunity for traders willing to risk the macro regime, but portfolio capital allocated to EM would sit idle for weeks awaiting confirmation that either dollar weakness stabilizes or growth fears reset. Exclusion is structural, not punitive. EM would require either dollar-weakness reversal or a de-escalation of broad market bear conditions—neither is embedded in the current Transition / Mixed regime or the active macro descriptor checklist.