
2022-03-04
Informational purposes only. The content in this report, including allocations, analysis, and commentary, is provided solely for informational and educational purposes. It does not constitute financial advice, investment advice, trading advice, or any other type of advice. Past performance does not guarantee future results. Always conduct your own research and consult a qualified financial professional before making investment decisions.
Macro risk engine requires the 50% Defensive overlay for this run; payload selected by cause: Inflation Scarcity.
Weekly Allocation
| Ticker | Category | Weight | Role |
|---|---|---|---|
| XLE | Traditional Energy | 60% | Overlay |
| GLD | Precious Metals | 10% | Top-2 (10%) |
| WEAT | Agriculture & Livestock | 5% | Tier-2 (5%) |
| COPX | Industrial Metals | 5% | Tier-2 (5%) |
| XAR | Defense & Aerospace | 5% | Tier-2 (5%) |
| XLU | Utilities & Infrastructure | 5% | Tier-2 (5%) |
| URNM | Nuclear Energy | 5% | Tier-2 (5%) |
| CIBR | Technology | 5% | Tier-2 (5%) |
Trade Instructions — Monday Open
Sell the tranche from 2022-02-04 (completing its 4-week hold). Buy the new tranche. Instructions show net portfolio changes — same-asset positions cancel, weight changes show the delta.
| Action | Ticker | Instruction |
|---|---|---|
| SELL | COPX | Sell 23% of COPX position (reduce 16.25% → 12.50%) |
| SELL | IGF | Sell 67% of IGF position (reduce 3.75% → 1.25%) |
| SELL | MOO | Sell 50% of MOO position (reduce 5.00% → 2.50%) |
| SELL | XLK | Sell entire XLK position (2.50% of portfolio) |
| SELL | IEMG | Sell 40% of IEMG position (reduce 6.25% → 3.75%) |
| SELL | ITA | Sell 40% of ITA position (reduce 6.25% → 3.75%) |
| BUY | XLE | Buy XLE — 61.54% of freed cash (adds 10.00% to portfolio) |
| BUY | WEAT | Buy WEAT — 7.69% of freed cash (adds 1.25% to portfolio) |
| BUY | CIBR | Buy CIBR — 7.69% of freed cash (adds 1.25% to portfolio) |
| BUY | XAR | Buy XAR — 7.69% of freed cash (adds 1.25% to portfolio) |
| BUY | URNM | Buy URNM — 7.69% of freed cash (adds 1.25% to portfolio) |
| BUY | XLU | Buy XLU — 7.69% of freed cash (adds 1.25% to portfolio) |
Current Portfolio After Trade
Combined holdings across all 4 active tranches. Each tranche is 25% of the portfolio.
| Ticker | % of Portfolio | Weight Bar |
|---|---|---|
| XLE | 40.00% | |
| COPX | 12.50% | |
| CIBR | 7.50% | |
| GLD | 6.25% | |
| WEAT | 6.25% | |
| PAVE | 5.00% | |
| XAR | 3.75% | |
| URNM | 3.75% | |
| IEMG | 3.75% | |
| ITA | 3.75% | |
| MOO | 2.50% | |
| GDX | 2.50% | |
| IGF | 1.25% | |
| XLU | 1.25% |
Macro Regime — Transition / Mixed
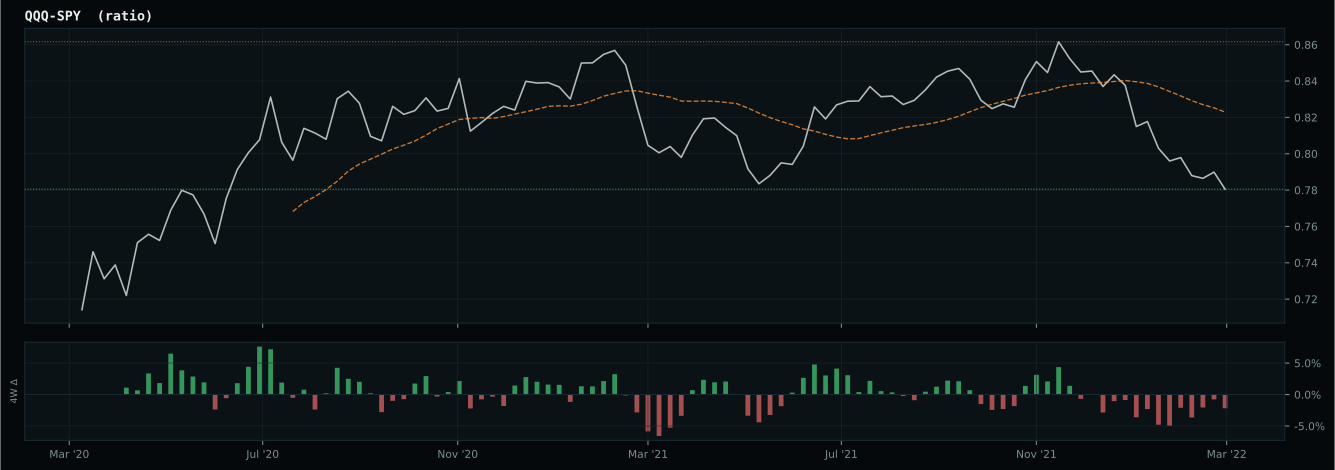
growth data is not confirming the weak market-implied risk appetite signal
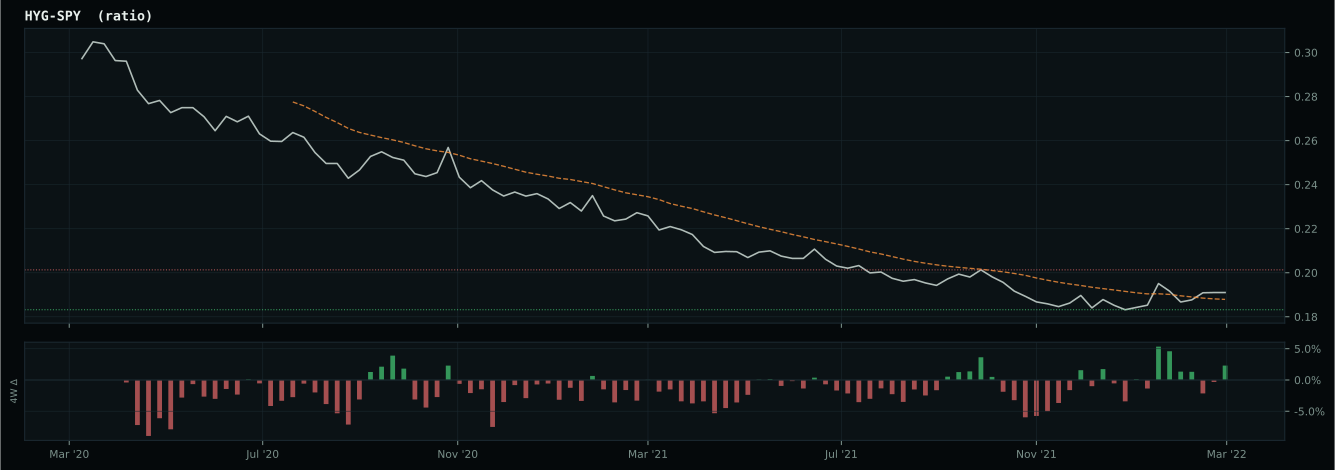
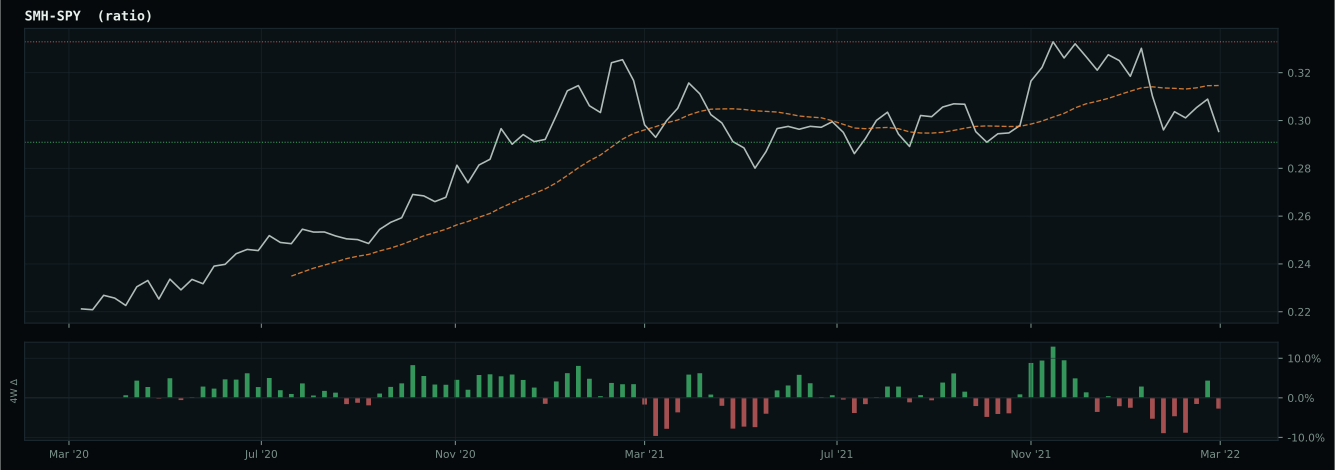
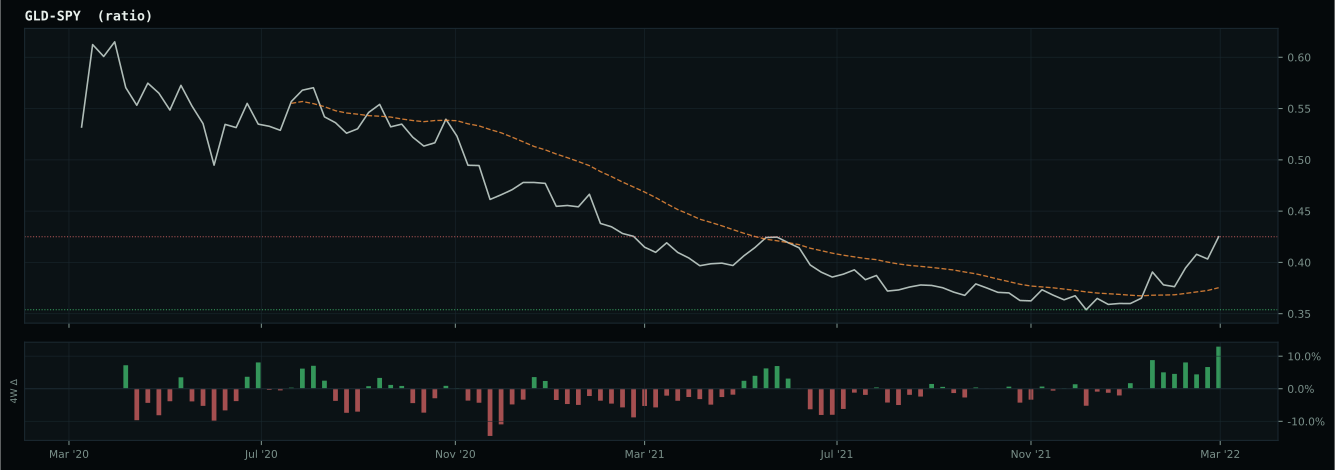
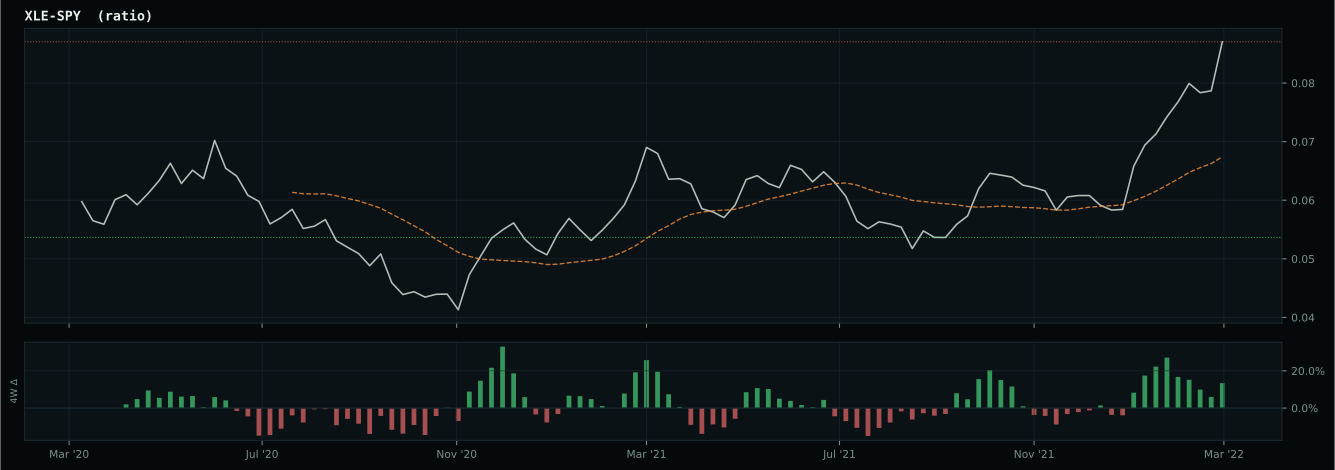
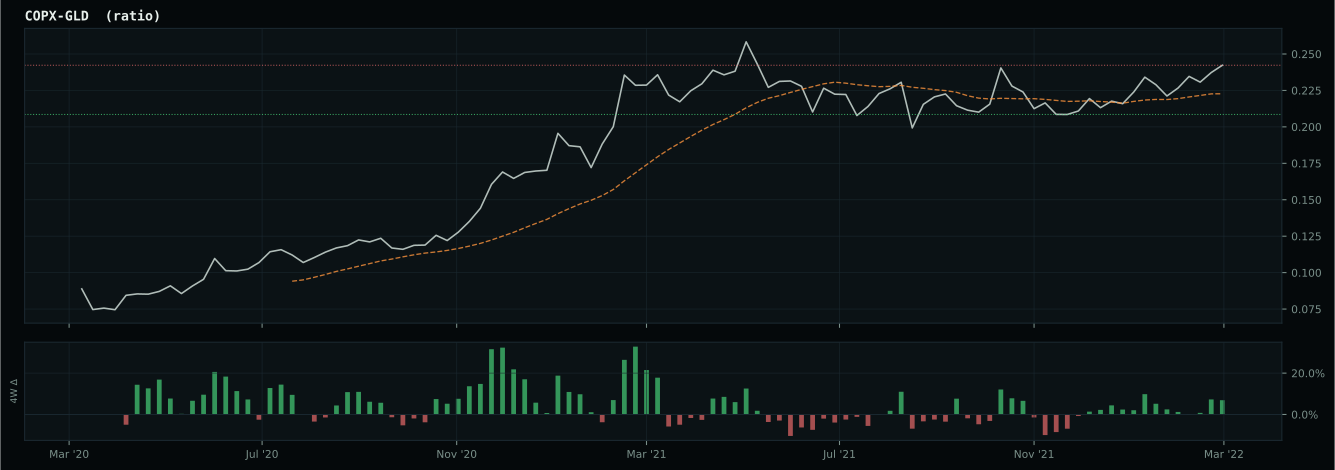
Defensive overlay cause is inflation/scarcity: energy, commodity breadth, or oil-versus-gold confirmation is stronger than the broad equity tape, so the sleeve owns the inflation pressure. XLE has been confirmed above its 8W SMA and is eligible.
Macro Evidence Charts
Market-implied signals behind the macro regime scores. Each ratio compares two assets; the direction and slope of the ratio is what the macro engine reads.
Crypto Regime — NoCrypto
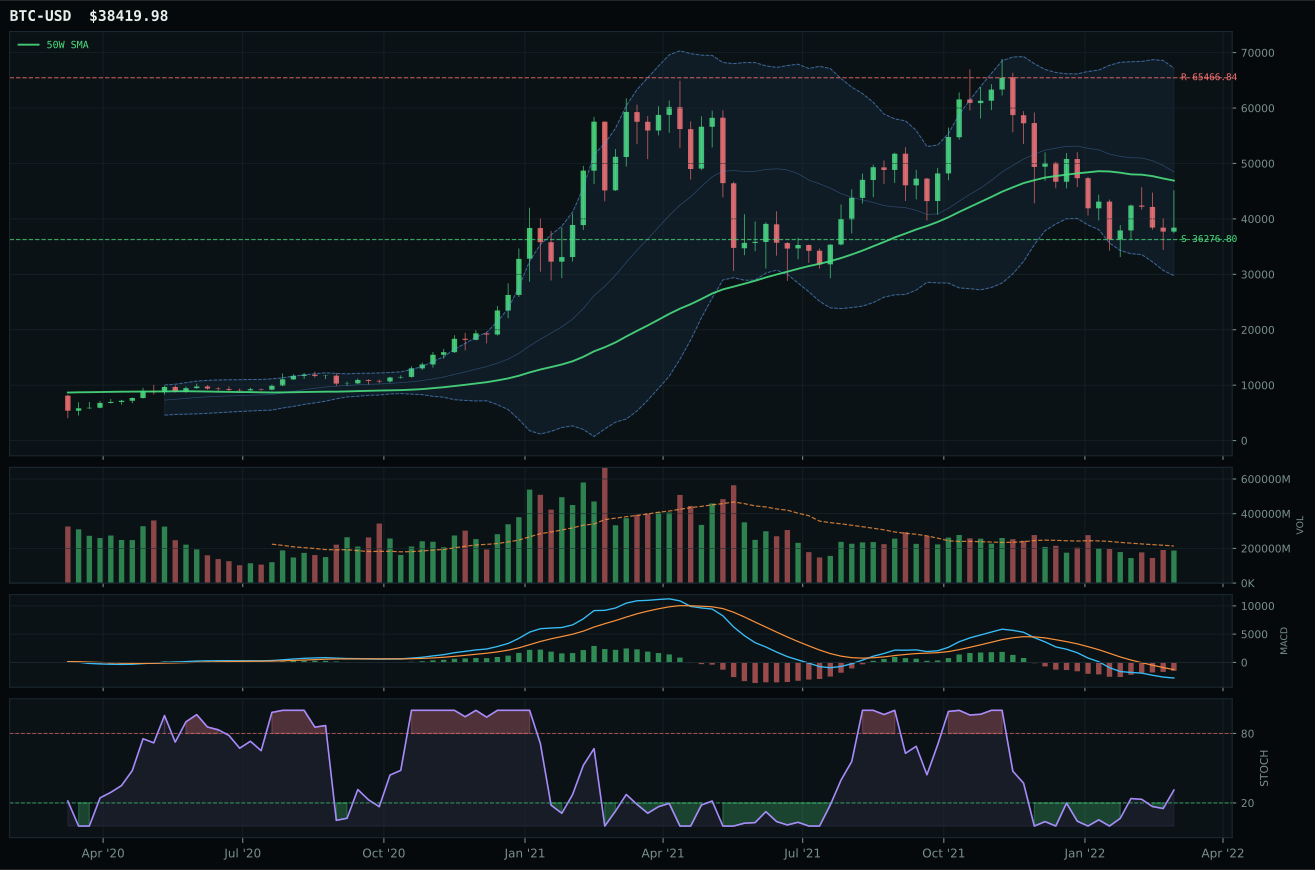
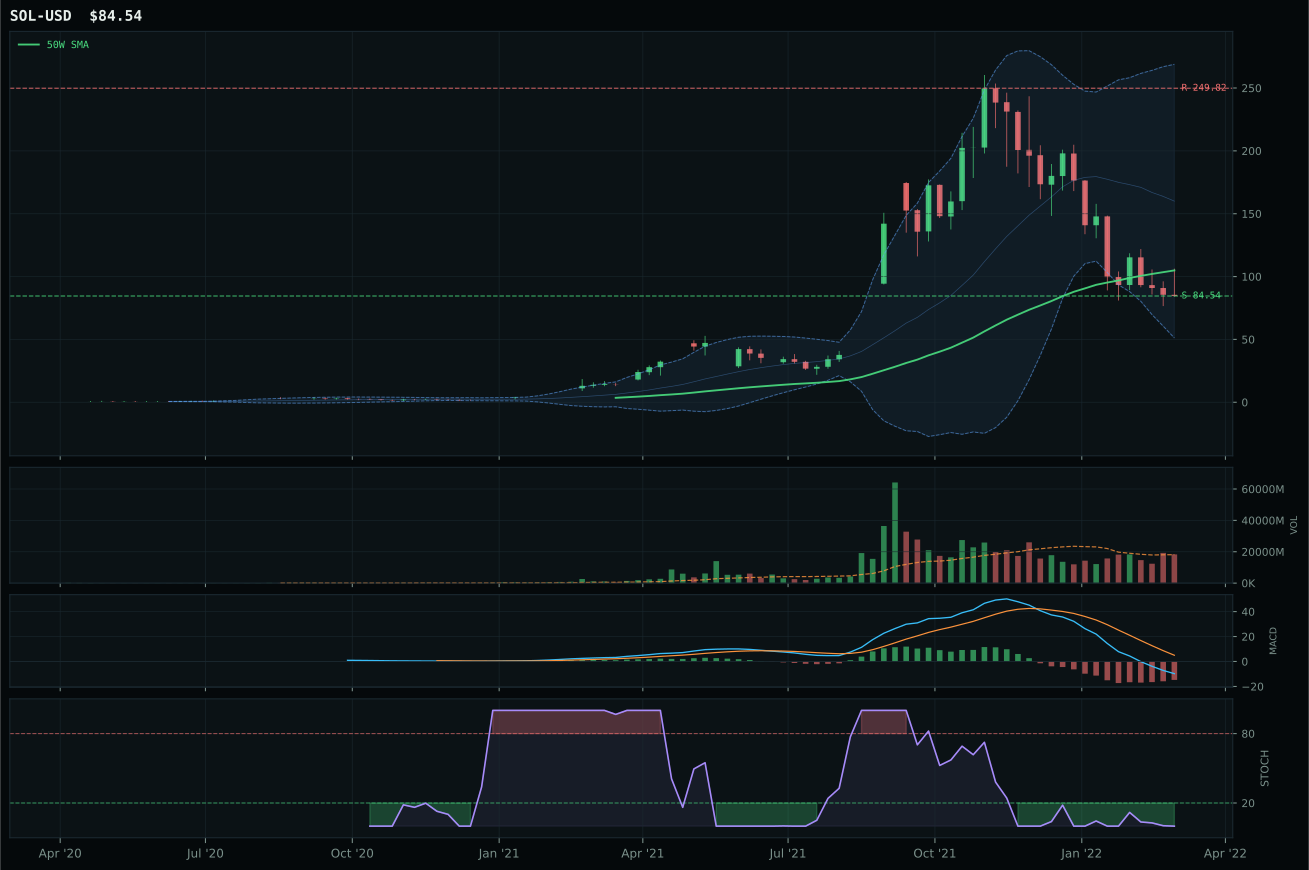
ValueBTC not armed: BTC has not made the first post-breakdown touch of the 200W buy zone after losing the 50W
TrendBTC not confirmed
one or more available conditions failed
Category Rankings
| Rank | Category | Winner | Score | Alloc | 4W Ret | Peers (4W) |
|---|---|---|---|---|---|---|
| 1 | Traditional Energy | XLE | 93.9 | 20% | +2.04% | FCG +6.9% · XOP +10.8% |
| 2 | Precious Metals | GLD | 86.5 | 20% | -2.28% | GDX +5.4% · SLV -3.7% |
| 3 | Agriculture & Livestock | WEAT | 82.7 | 10% | -12.78% | MOO +7.3% · VEGI +7.2% |
| 4 | Industrial Metals | COPX | 77.5 | 10% | +6.05% | PICK +5.7% · REMX +19.8% |
| 5 | Defense & Aerospace | XAR | 71.1 | 10% | +3.12% | ITA +1.9% · ROKT +3.6% |
| 6 | Utilities & Infrastructure | XLU | 65.7 | 10% | +5.83% | IGF +7.2% · PAVE +4.4% |
| 7 | Nuclear Energy | URNM | 63.6 | 10% | +9.02% | URA +9.9% · NLR +5.6% |
| 8 | Technology | CIBR | 40.4 | 10% | +6.34% | IGV +5.7% · XLK +6.2% |
| 9 | AI | BOTZ | 26.0 | 0% | +5.39% | SMH +4.1% · AIQ +7.1% |
| 10 | Emerging Markets | INDA | 8.0 | 0% | +12.52% | IEMG +6.1% · ILF +13.3% |
Traditional Energy — XLE
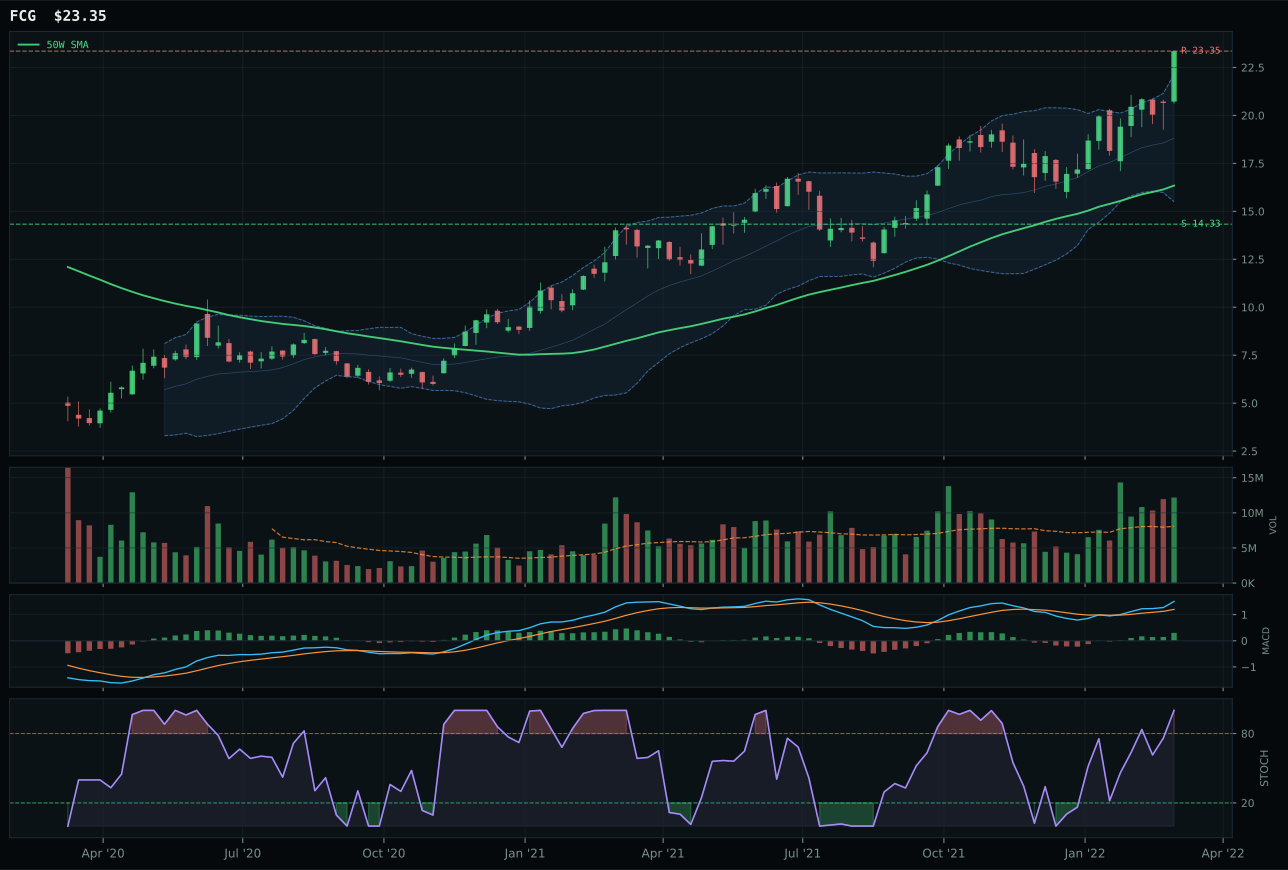
FCG has a vertical extension profile with 43.8% 13-week relative strength versus SPY.
A failed hold above support would weaken the setup.
Actionable but governed by invalidation levels.
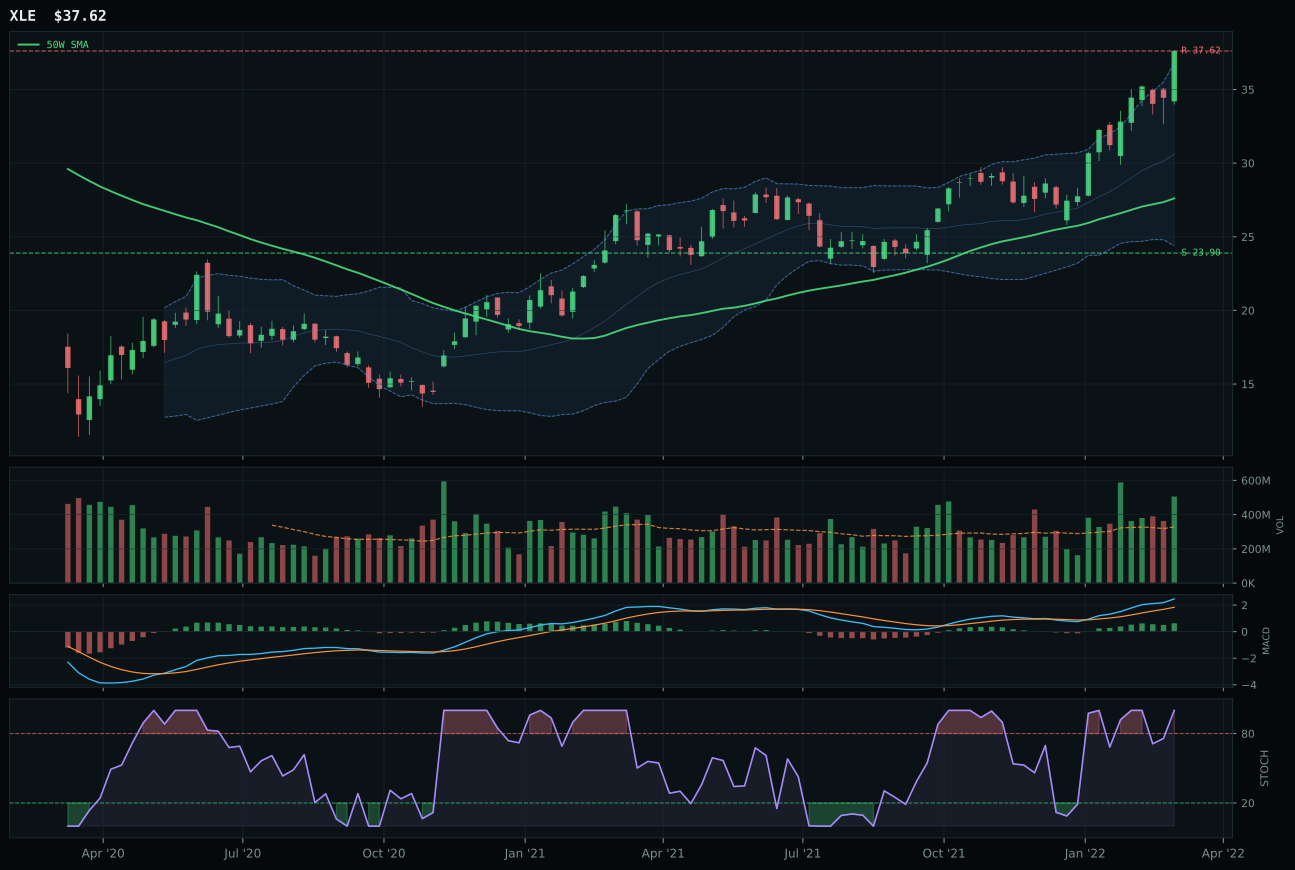
XLE has a vertical extension profile with 41.1% 13-week relative strength versus SPY.
A failed hold above support would weaken the setup.
Actionable but governed by invalidation levels.
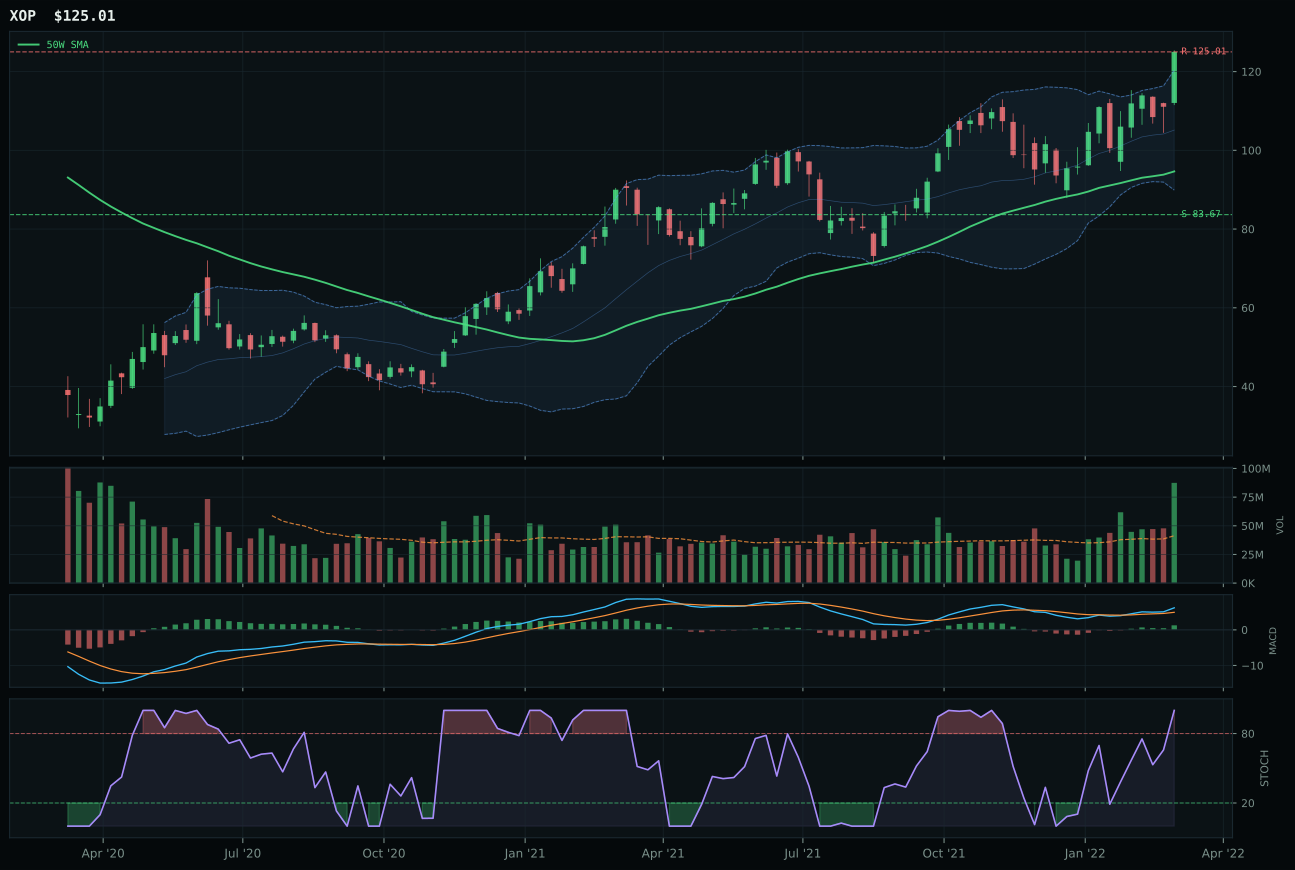
XOP has a vertical extension profile with 36.1% 13-week relative strength versus SPY.
A failed hold above support would weaken the setup.
Actionable but governed by invalidation levels.
XLE wins the top-2 energy allocation by a razor-thin margin (score gap 0.5 points) over FCG because its timing setup delivers marginally superior risk/reward despite FCG's slightly higher momentum and macro sponsorship. The integrated energy ETF trades 36.2% above its 50-week moving average with MACD bullish and improving, stochastic RSI in full overbought momentum, and volume at 1.54x the 20-week average—a vertical extension that is penalized in timing (37.0/100) yet compensated by perfect trend (100.0/100) and momentum (100.0/100) scores. FCG extends even further at 42.9% from the 50-week moving average and shows 43.8% category-relative strength versus XLE's 0.0%, meaning natural gas has become the market's favorite within energy. Yet XLE's risk/reward (44.5) edges FCG (44.3) because persistence (100.0/100) and volume-price confirmation (89.9/100) in XLE signal that every buyer arriving this week is part of a coordinated institutional campaign, not late speculation. Energy scarcity (plus 14), inflation pressure (plus 10), and supply shortage (plus 7) are active across both names; the portfolio chooses XLE because its composition (integrated majors with cash flow defense) offers psychological comfort alongside momentum.
Traditional Energy earned the top-2 10% allocation based on a 93.9 final category score and exceptional 92.0/100 macro fit, ranking first among all ten categories. The energy category is the most macro-dependent this week: energy scarcity (plus 16), inflation pressure (plus 10), supply shortage (plus 9), and real asset sponsorship (plus 7) create a 92.0/100 category-level fit that dwarfs all other categories except precious metals. The Transition/Mixed regime actively supports real assets and supply-constrained themes; Ukraine geopolitical risk, OPEC+ production discipline, and refinery outages create a tight physical market that is not available in equities elsewhere. XLE's 36.4% 13-week return and 41.1% S&P 500–relative outperformance confirm the energy scarcity theme is priced, yet the portfolio's risk management accepts the extended entry because macro conviction is extremely high and alternative allocations (defense, utilities, AI) offer weaker asymmetry. Risk/reward is inverted at 44.5/100 (zero upside to resistance, 57.4% downside to support), yet momentum persistence at 100.0/100 and volume-price confirmation at 89.9/100 indicate that dip-buyers and portfolio hedges are fully engaged. Downside risk is real if geopolitical fear recedes or demand destruction accelerates; the top-2 slot reflects macro severity, not technical safety.
Precious Metals — GLD
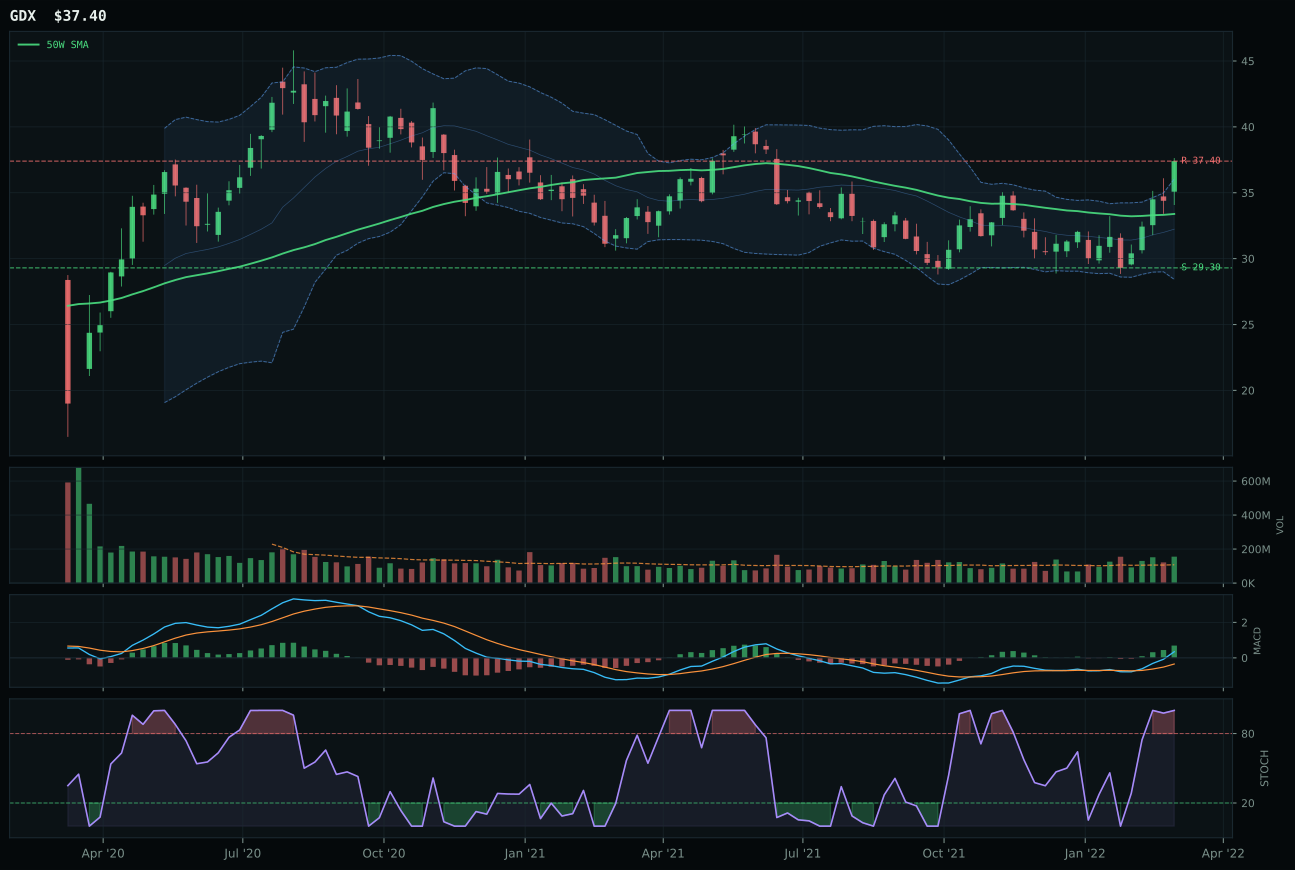
GDX has a neutral structure profile with 26.6% 13-week relative strength versus SPY.
A failed hold above support would weaken the setup.
Actionable but governed by invalidation levels.
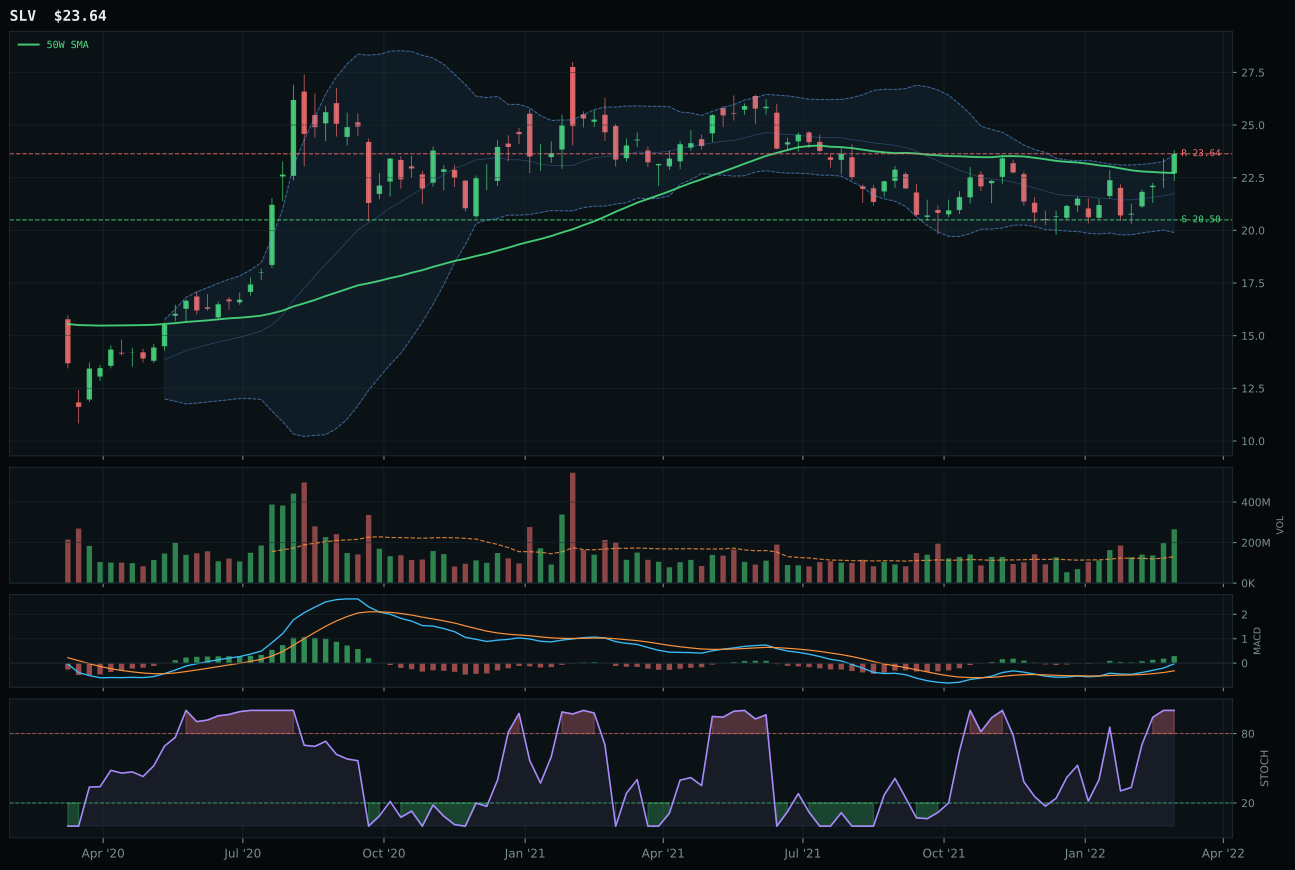
SLV has a neutral structure profile with 18.1% 13-week relative strength versus SPY.
A failed hold above support would weaken the setup.
Actionable but governed by invalidation levels.
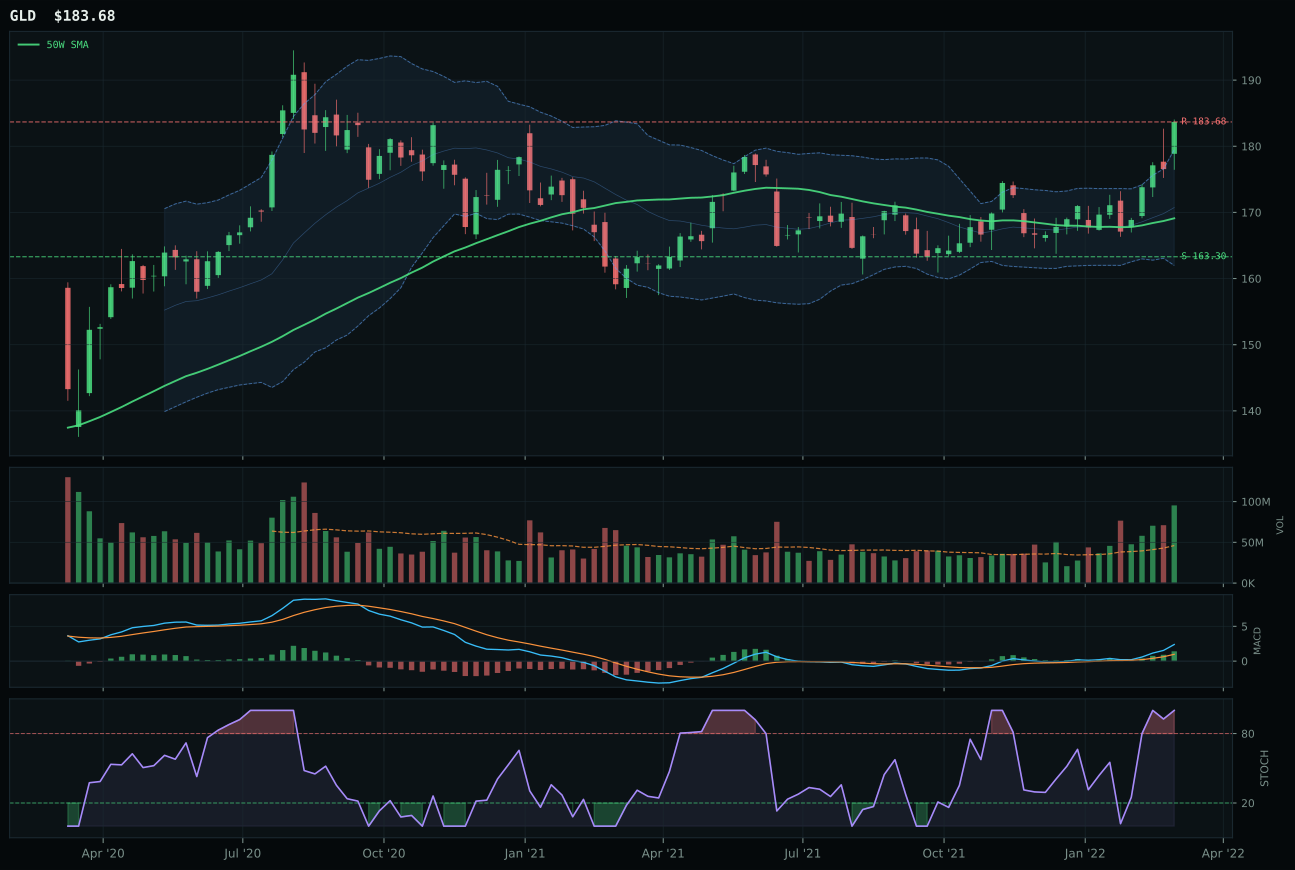
GLD has a neutral structure profile with 14.9% 13-week relative strength versus SPY.
A failed hold above support would weaken the setup.
Actionable but governed by invalidation levels.
GLD wins the top-2 precious metals allocation over SLV and GDX because it balances trend purity, macro narrative fit, and entry-point timing in a single coherent setup. The gold ETF sits 8.6% above its 50-week moving average with MACD bullish and improving, stochastic RSI in full overbought momentum, and volume at 2.07x the 20-week average—a clean accumulation signature that confirms the monetary hedge bid without requiring buyer desperation. GDX outperforms on raw technical merit (98.2/100 technical evidence versus 99.5/100 for GLD) and shows 26.6% category-relative strength that represents leveraged gold-miner beta, but its timing score (67.0) and risk/reward (50.2) trail because it has moved further from the 50-week moving average and shows above-average participation rather than institutional accumulation. GLD's 14.9% S&P 500–relative return and 10.2% 13-week absolute return suggest the move is real without being speculative, whereas GDX's 21.9% 13-week return and upper Fibonacci positioning invite profit-taking. The monetary hedge bid (+14 macro active descriptor) is driving both, but GLD's neutral structure (87.1/100) and near-52-week-high Fibonacci zone suggest buyers are methodical rather than forced.
Precious Metals earned the top-2 10% allocation based on a 86.5 final category score and 72.0/100 macro fit, ranking second among all ten categories. The category is powered by a rare alignment of macro tailwinds: monetary hedge bid (plus 14), defensive rotation (plus 7), dollar pressure (plus 3), and even liquidity expansion (minus 2) create a 72.0/100 category-level fit that competes directly with energy's 92.0/100 macro support. Unlike agriculture, which is extended, precious metals sits at reasonable distance from the 50-week moving average and near-52-week highs, meaning the setup respects both momentum buyers and risk-averse allocators. The Transition/Mixed regime is constructive for real assets when inflation pressure remains active (plus 10) and broad market bear is in effect—gold performs precisely when equity volatility spikes and central bank tightening fears surface. Risk/reward is modest at 53.5/100, but GLD's 92.3/100 volume-price confirmation and 82.1/100 persistence indicate the bid is deep and steady. Downside protection matters in a regime where risk appetite is broken; GLD's 12.5% downside to support and 0% upside to resistance create a holding posture rather than a chase, ideal for a top-2 defensive allocation.
Agriculture & Livestock — WEAT
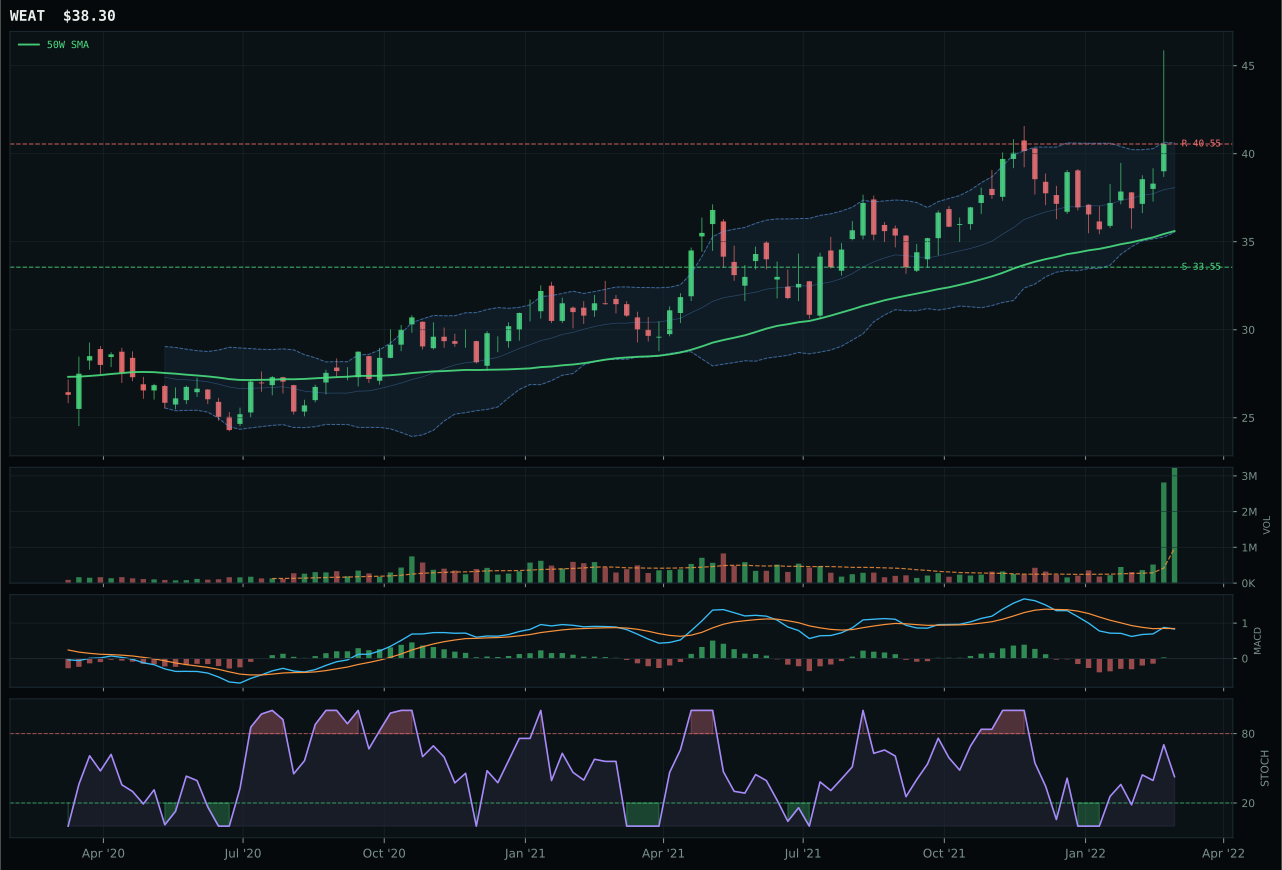
WEAT has a vertical extension profile with 45.2% 13-week relative strength versus SPY.
A failed hold above support would weaken the setup.
Actionable but governed by invalidation levels.
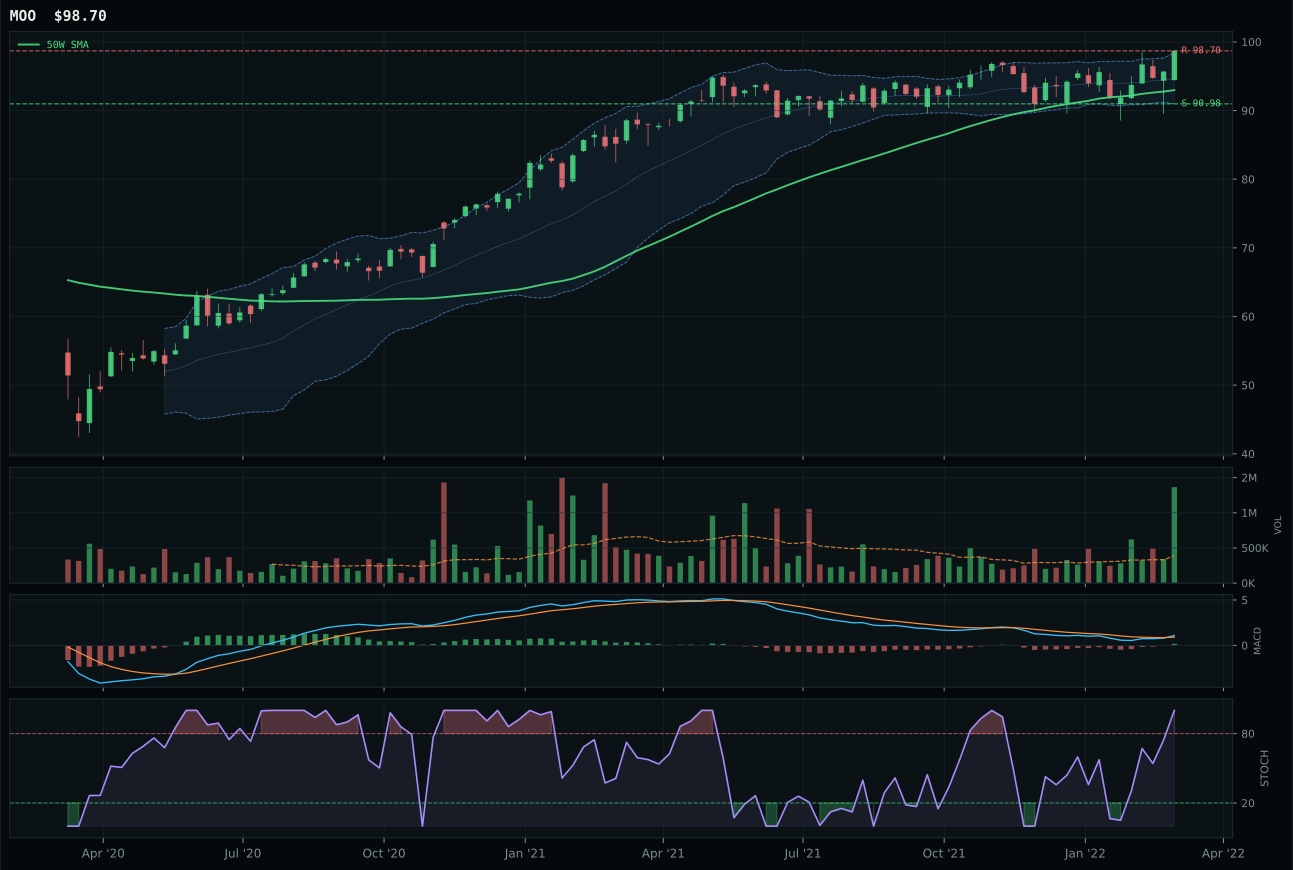
MOO has a neutral structure profile with 13.2% 13-week relative strength versus SPY.
A failed hold above support would weaken the setup.
Actionable but governed by invalidation levels.
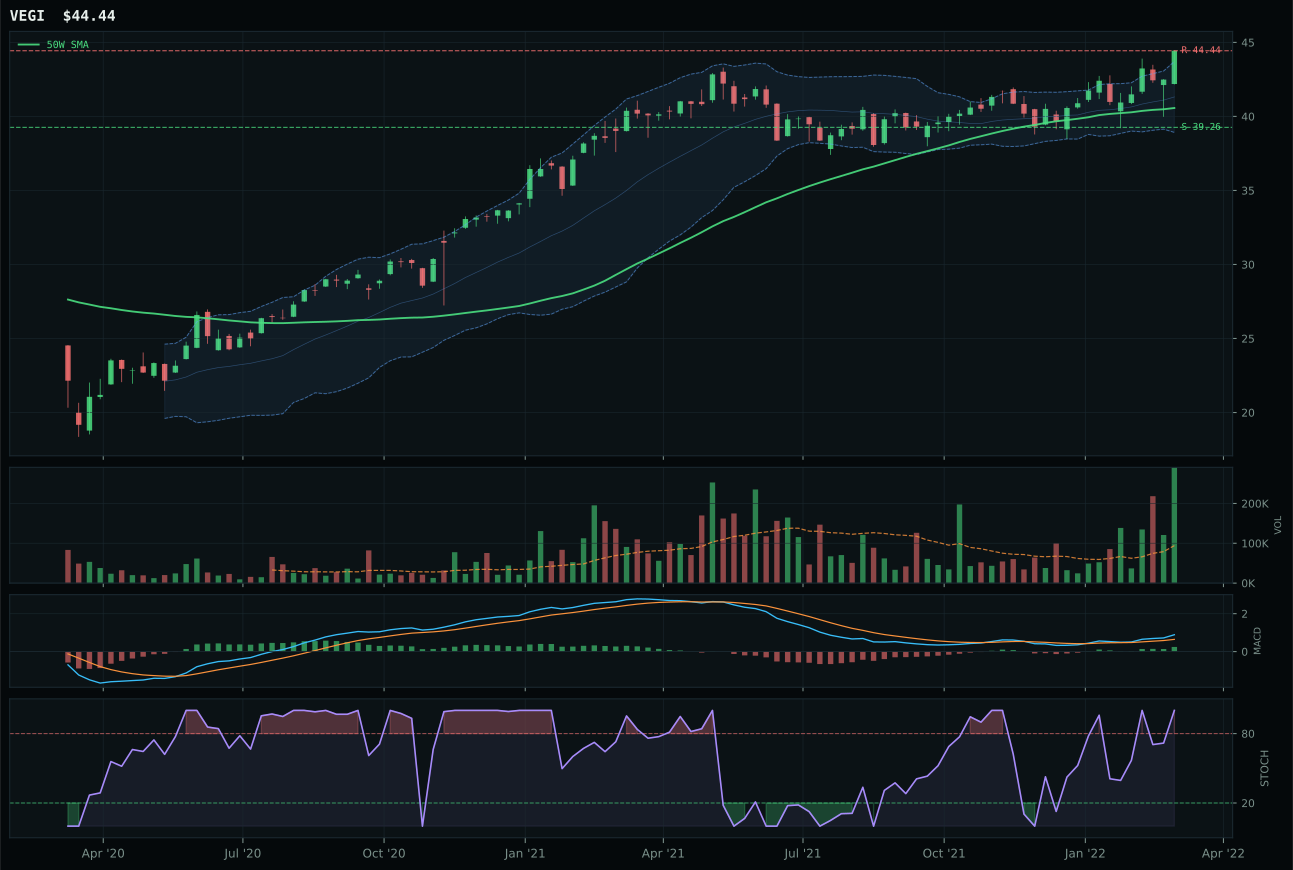
VEGI has a neutral structure profile with 17.7% 13-week relative strength versus SPY.
A failed hold above support would weaken the setup.
Tracked, but not top-2 eligible because: .
WEAT wins decisively over MOO (score gap negative 20.7 points) because its 27.4% category-relative strength and 45.2% S&P 500–relative outperformance reflect a pure commodity scarcity theme that separates wheat from broader agribusiness exposure. The wheat ETF is extended 50.7% above its 50-week moving average with stochastic RSI locked at full overbought momentum, MACD bullish and improving, and volume-price confirmation and persistence both at 100.0/100—a rare alignment of technical breadth that signals continuation bias is the only game in the market. MOO shows better structure (neutral versus vertical extension) and superior technical scores on trend (100.0 vs 100.0) and timing (75.0 vs 45.0), but its 13.2% S&P 500–relative return and 8.5% 13-week absolute return lag WEAT by 32 percentage points and 32 percentage points respectively. The supply shortage macro descriptor is driving both names higher, but WEAT's vertical extension and 100% momentum persistence indicate that every new buyer is paying late and that volume signature matters less than momentum positioning.
Agriculture & Livestock earned 5% allocation as tier-2, ranking below the top two overweights despite a stellar 82.7 category score. The category receives powerful macro support: supply shortage (plus 13), inflation pressure (plus 10), real asset sponsorship (plus 8), and commodity breadth positive (plus 5) combine to a 86.0/100 category-level macro fit—higher than even precious metals. Yet WEAT's 45.0/100 timing score (reflecting 50.7% distance from the 50-week moving average) prevents tier-1 status; risk/reward is inverted at 52.4/100, with zero upside to resistance and 61.4% downside to support. The portfolio acknowledges the scarcity narrative and international supply disruption but is unwilling to chase extended wheat prices above precious metals and energy, which offer better entry points. MOO scored higher on technical merit (88 vs 67 composite) but lost the category selection because WEAT captured the momentum and macro synthesis. Upgrade path: WEAT would need to consolidate and re-compress near the 50-week moving average while maintaining supply shortage sponsorship and MACD structure—that would reset the risk/reward asymmetry and qualify for top-2.
Industrial Metals — COPX
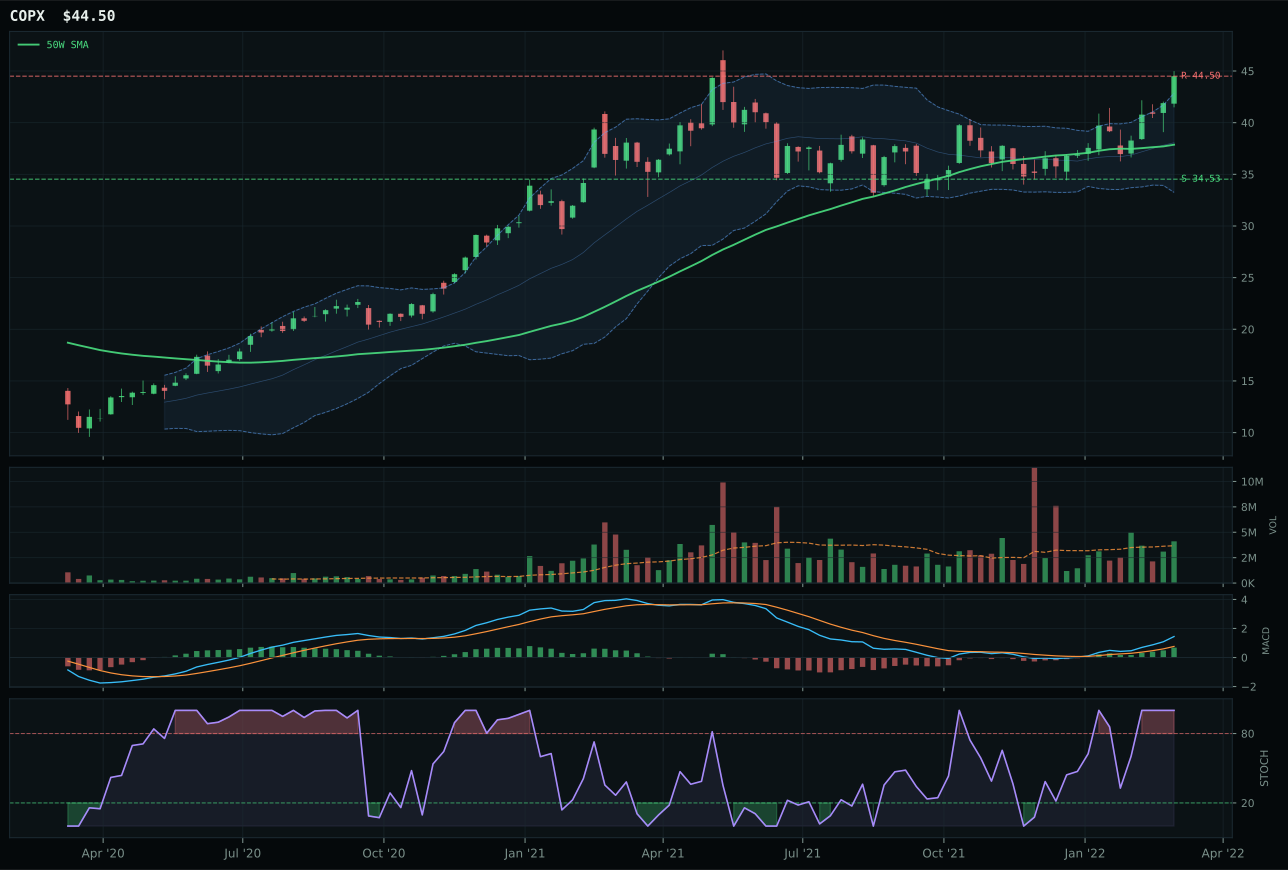
COPX has a vertical extension profile with 31.3% 13-week relative strength versus SPY.
A failed hold above support would weaken the setup.
Actionable but governed by invalidation levels.
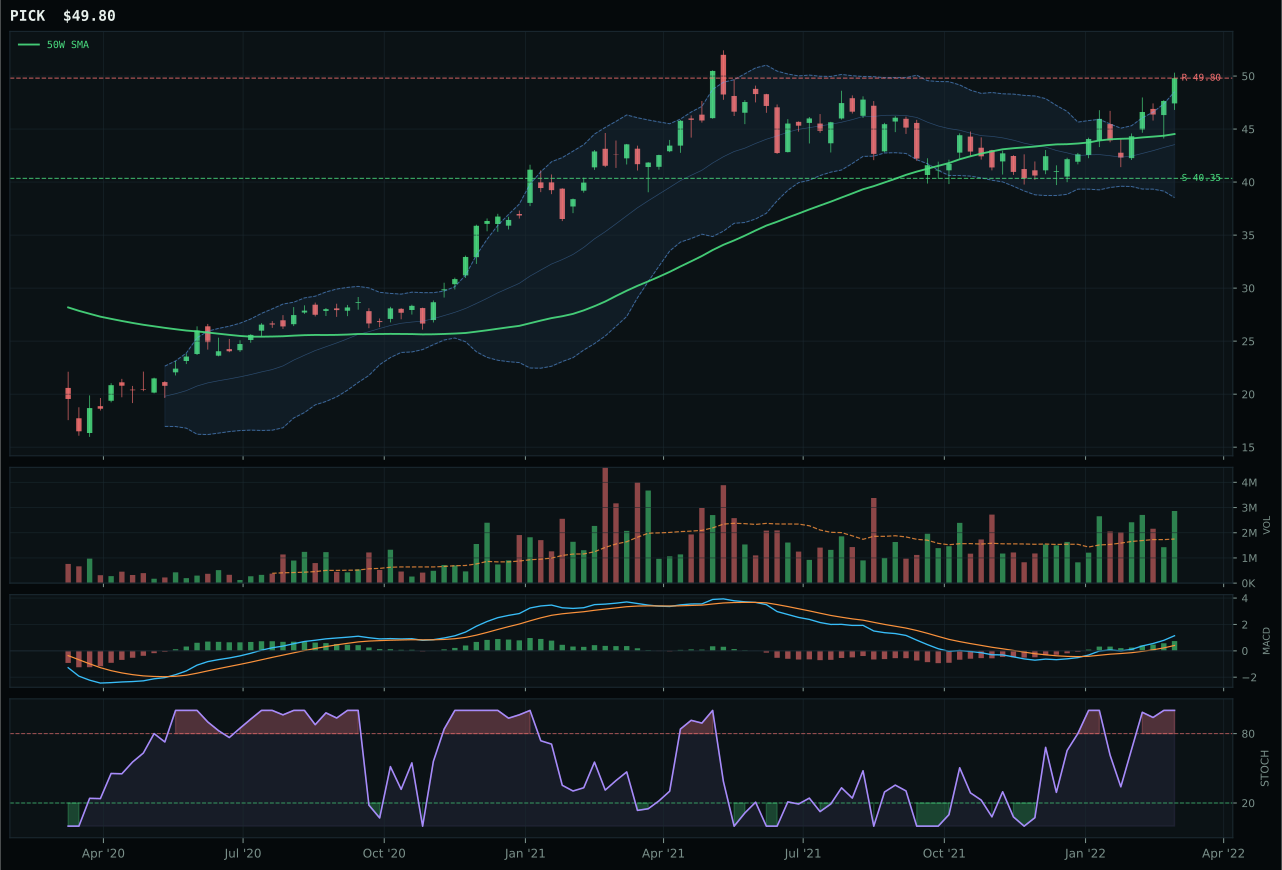
PICK has a neutral structure profile with 27.3% 13-week relative strength versus SPY.
A failed hold above support would weaken the setup.
Actionable but governed by invalidation levels.
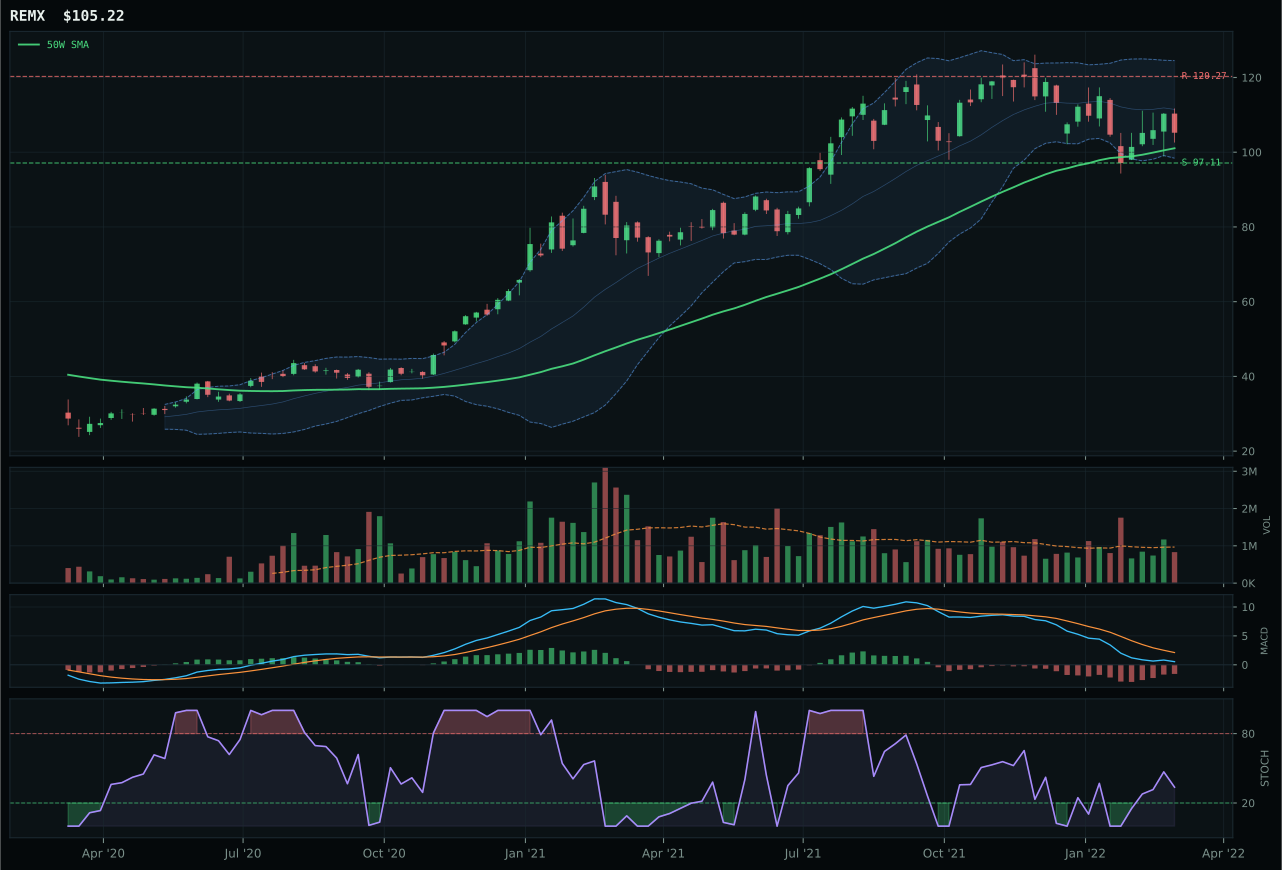
REMX has a neutral structure profile with -3.8% 13-week relative strength versus SPY.
A failed hold above support would weaken the setup.
Actionable but governed by invalidation levels.
COPX wins the industrial metals category by capturing the 31.3% S&P 500–relative outperformance and metals scarcity narrative despite inferior technical execution compared to runner-up PICK. Copper scarcity is priced into COPX's 17.5% extension above the 50-week moving average, stochastic RSI locked at overbought momentum, and bullish/improving MACD with volume at 1.12x the 20-week average—above-average participation that confirms the move but lacks the institutional accumulation (2.07x or higher) seen in precious metals. PICK scores 86/100 composite technical (versus COPX's 75/100) and shows perfect trend momentum at 100.0/100, but category-relative strength of 0.0% versus COPX's 4.0% reflects the market's current consensus that copper scarcity outweighs mining breadth. The metals scarcity macro descriptor (plus 12) and commodity breadth positive (plus 7) align directly with COPX's pure-play thesis. Risk/reward penalizes COPX with 28.9% downside to support versus zero upside, yet timing score (45.0) and persistence (91.1) signal that momentum traders and algorithm models are actively defending the setup.
Industrial Metals earned 5% allocation as tier-2, ranking outside top-2 despite a respectable 77.5 category score and 73.0/100 macro fit. The category benefits from powerful supply-side tailwinds—metals scarcity (plus 14), commodity breadth positive (plus 10), and real asset sponsorship (plus 6) create a 73.0/100 category-level fit that should elevate it above utilities and AI. However, COPX's vertical extension (17.5% above the 50-week moving average) and inverted risk/reward (50.0/100, with zero upside to resistance) prevent tier-1 status in an environment where precious metals and energy offer superior entry points. PICK's technical evidence (100.0/100) exceeds COPX (94.7/100), yet category-relative weakness forces the portfolio to run with the scarcity narrative that COPX embodies. Precious metals' 8.6% distance to the 50-week moving average and energy's 36.2% distance (but with higher macro fit) both represent better risk-adjusted positioning. Upgrade catalyst: COPX would need to consolidate and reset distance to the 50-week moving average while maintaining the metals scarcity bid, or a macro regime shift where supply shortage escalates further and risk appetite stabilizes, allowing extended names to stay in favor.
Defense & Aerospace — XAR
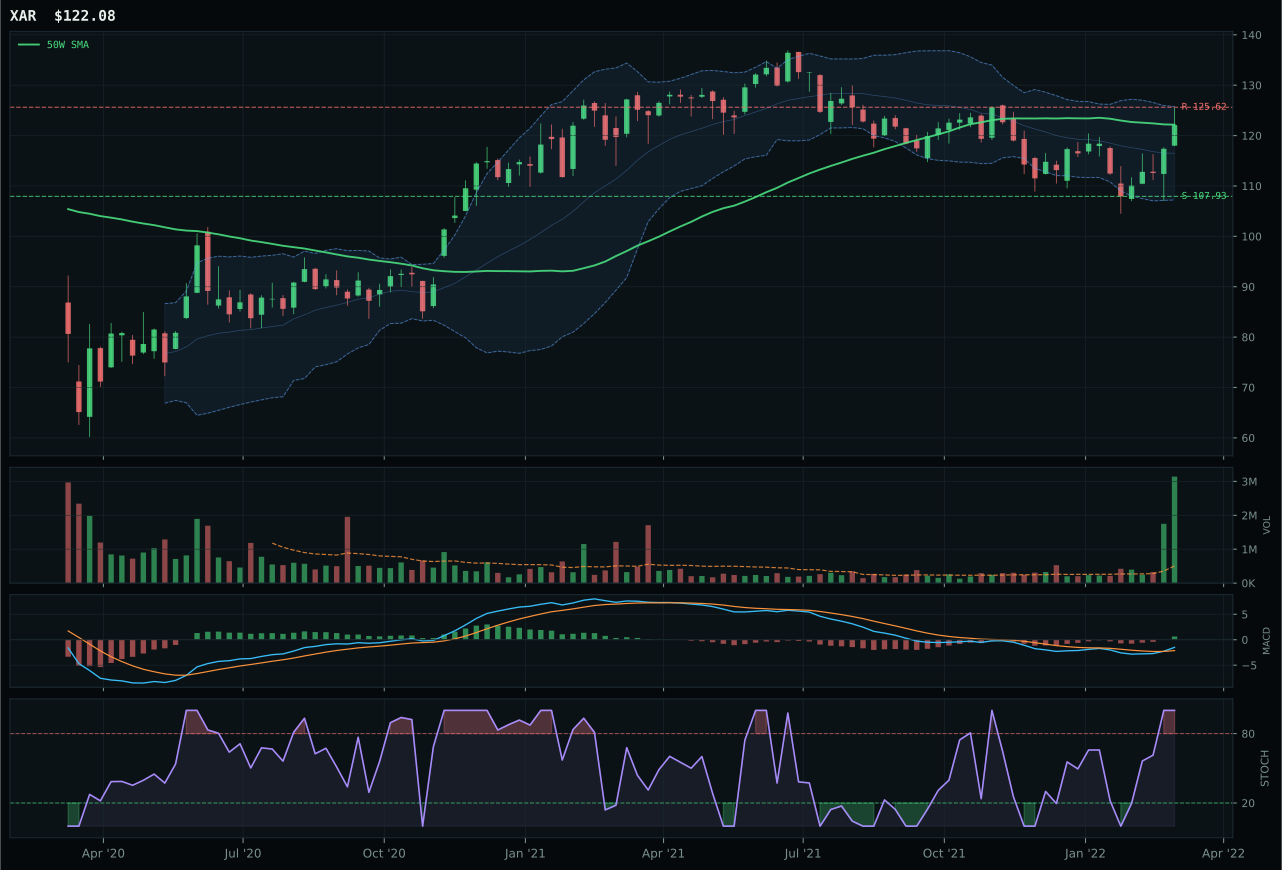
XAR has a compression near 50W profile with 14.2% 13-week relative strength versus SPY.
A failed hold above support would weaken the setup.
Actionable but governed by invalidation levels.
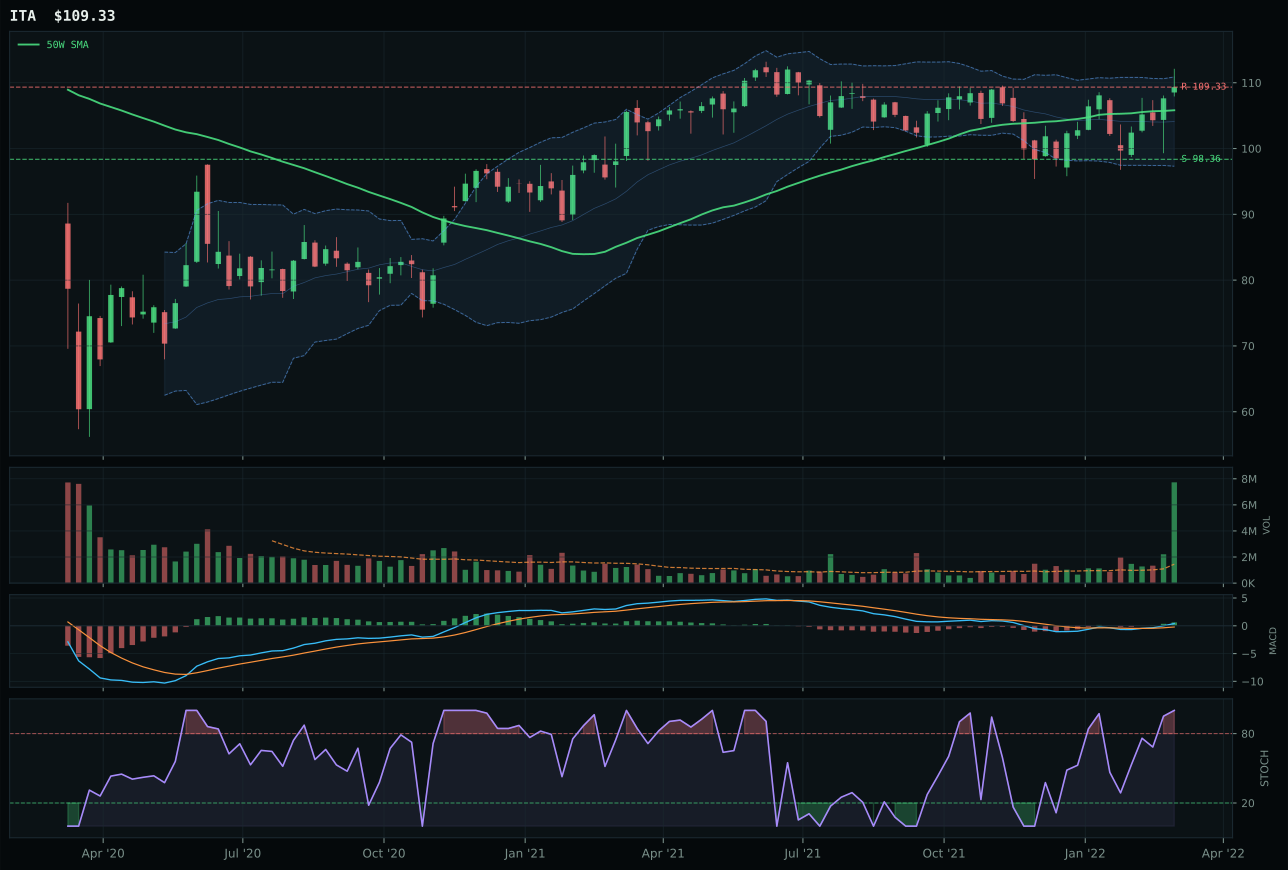
ITA has a neutral structure profile with 15.8% 13-week relative strength versus SPY.
A failed hold above support would weaken the setup.
Actionable but governed by invalidation levels.
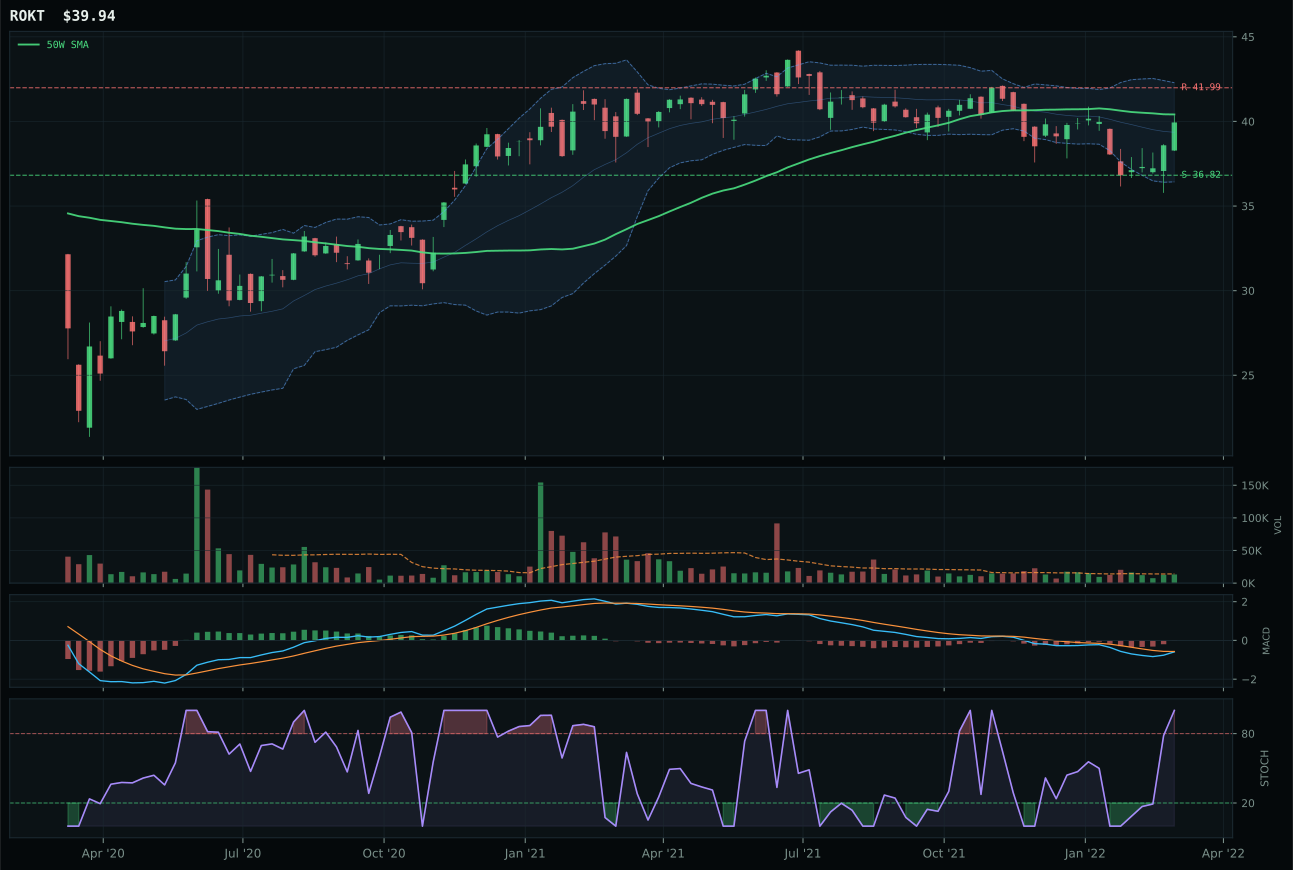
ROKT has a compression near 50W profile with 8.3% 13-week relative strength versus SPY.
A failed hold above support would weaken the setup.
Tracked, but not top-2 eligible because: .
XAR wins the category by the narrowest of margins (score gap negative 2.1 points) because its timing setup is flawless even though ITA shows higher technical evidence (100.0/100 versus 89.7). The aerospace and defense ETF sits essentially flat at negative 0.1% from its 50-week moving average with MACD bullish and improving, stochastic RSI at full overbought momentum, and volume at 6.21x the 20-week average—a compression-into-breakout pattern that signals professional buyers are accumulating ahead of a gap higher. ITA occupies a neutral structure with similar MACD/stochastic signals but wider distance to both support and resistance, leaving less clarity on the exact inflection point. XAR's 14.2% outperformance versus the S&P 500 over 13 weeks and 9.5% absolute return confirm the move is real, not speculative. Both trade in upper zones of the Fibonacci grid, yet XAR's proximity to the 50-week moving average (the key decision level) gives it the edge on margin-of-safety timing.
Defense & Aerospace received 5% allocation as tier-2, ranking below the top two overweights despite a strong 71.1 category score and 68.0/100 macro fit. The category benefits meaningfully from the Transition/Mixed regime and defensive rotation (both active at plus net +6 to plus net +8), which props up both XAR and runner-up ITA on relative strength grounds. However, risk/reward penalizes both names for being already extended—upside to resistance offers zero additional gain while downside to support is 13% for XAR and 11% for ITA, reversing the typical asymmetry investors seek. Macro tailwinds (defensive rotation, broad market bear support, dollar strength) compete against stretched entry points; the portfolio is willing to hold 5% despite the extension because energy and precious metals offered superior risk-adjusted timing this week. Catalyst for upgrade to top-2: a pullback that resets the 50-week distance to negative territory while MACD stays bullish, or a macro shift where risk appetite breaks more decisively, forcing equity allocators into hard-defensive names.
Utilities & Infrastructure — XLU
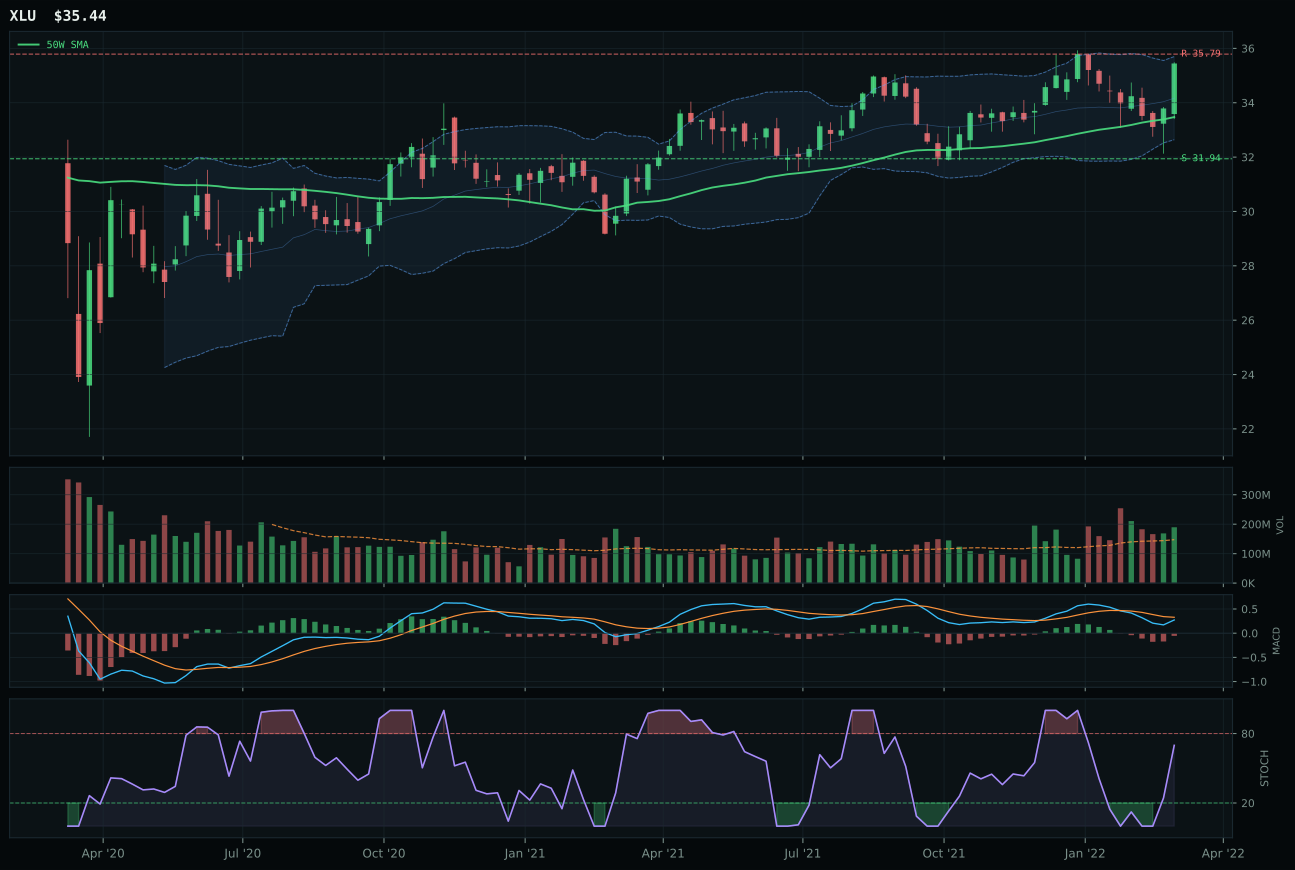
XLU has a neutral structure profile with 9.9% 13-week relative strength versus SPY.
A failed hold above support would weaken the setup.
Actionable but governed by invalidation levels.
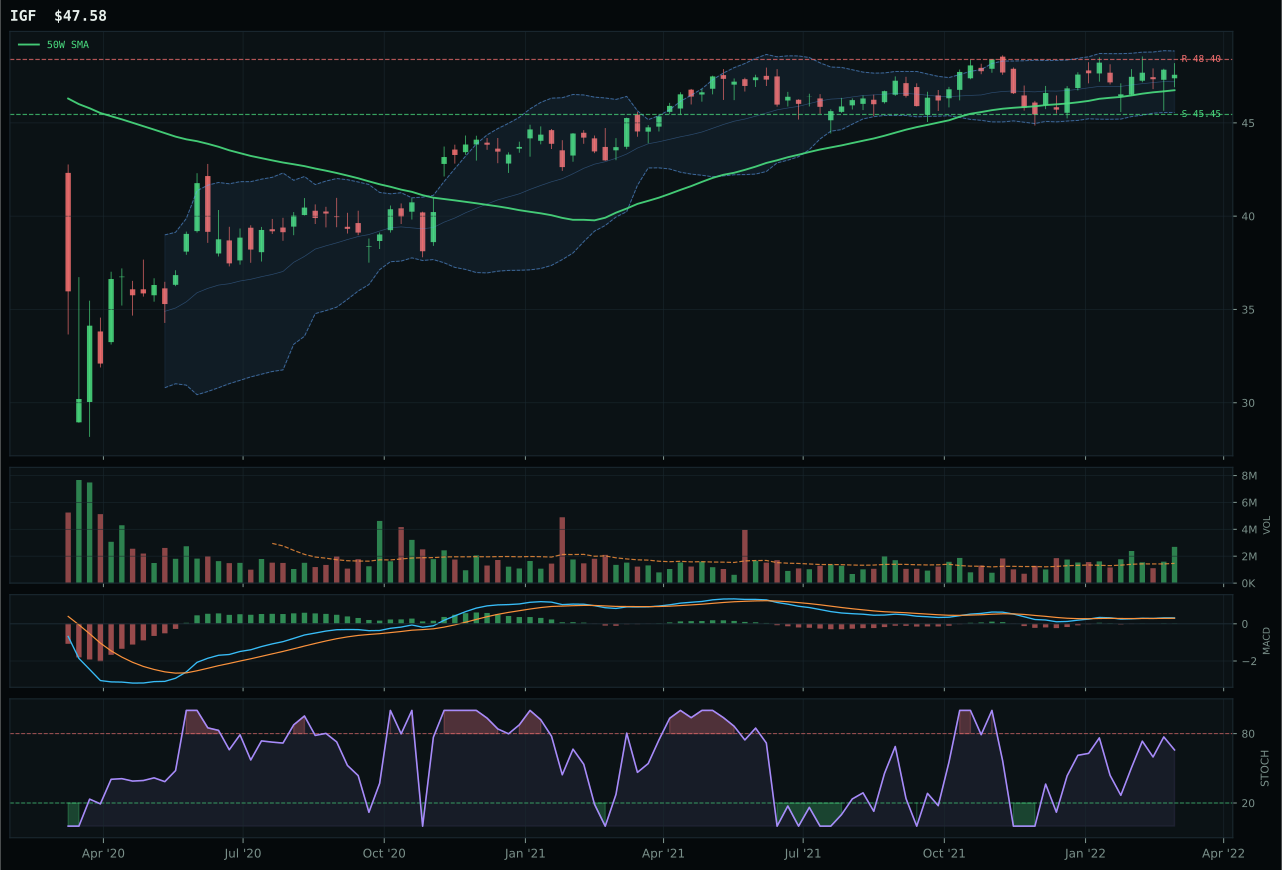
IGF has a pullback into support profile with 9.4% 13-week relative strength versus SPY.
A failed hold above support would weaken the setup.
Actionable but governed by invalidation levels.
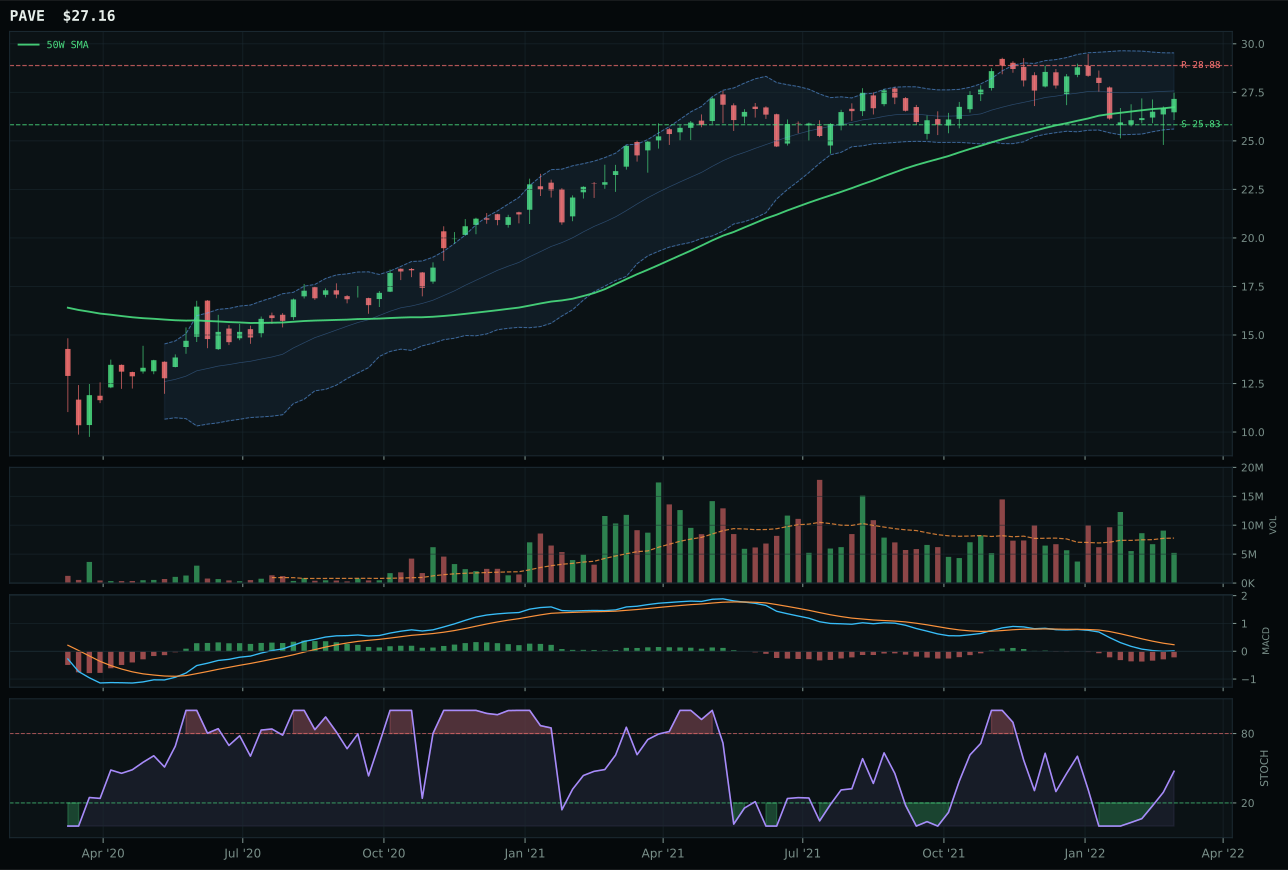
PAVE has a compression near 50W profile with 3.1% 13-week relative strength versus SPY.
A failed hold above support would weaken the setup.
Actionable but governed by invalidation levels.
XLU wins the utilities category over IGF and PAVE by maintaining clean trend mechanics (price above both 50W and 200W with 92.0/100 trend score) while both competitors show conflicted technical signals. The regulated utility ETF sits 5.9% above its 50-week moving average with MACD bearish/weakening (not improving) and stochastic RSI rising mid-zone at 0.70—a setup that lacks bullish urgency yet avoids breakdown risk. IGF shows superior trend (100.0/100) and timing (100.0/100) but has distribution pressure on volume and stochastic RSI falling/neutral, signaling institutional exits rather than accumulation. PAVE sits in compression near the 50-week moving average with rising stochastic RSI and bearish but improving MACD, yet volume is thin participation rather than the above-average accumulation that XLU shows. Risk/reward inverts across all three names: XLU offers negative 1.0% upside to resistance (capped) and 11.0% downside to support, whereas IGF and PAVE show similar asymmetry. XLU wins because defensive rotation (plus 12 active descriptor) favors regulated utilities over infrastructure equity, and its flat MACD and mid-zone stochastic create a holding posture rather than a sell signal.
Utilities & Infrastructure earned 5% allocation as tier-2, ranking below top-2 overweights despite 65.7 score and 64.0/100 macro fit. The category benefits from defensive rotation (plus 12) and broad market bear (plus 4), which support both utilities and infrastructure on relative strength grounds, yet absolute returns lag energy, precious metals, and even industrial metals. XLU's composite score (73/100) trails IGF (87/100) and PAVE (84/100) significantly, yet timing and volume signatures earn it the representative slot because defensive themes in a mixed regime reward patience over momentum. Risk/reward is capped at negative 1.0% upside and 11.0% downside, making XLU a core holding for capital preservation rather than alpha generation. Inflation pressure (negative 6) is a mild headwind that reflects how utility dividend yields are compressed, yet the portfolio accepts this because energy and precious metals offer superior asymmetry and macro fit. Allocation remains tier-2 (5%) because alternatives provide better combination of trend, timing, and macro sponsorship; Transition/Mixed regimes typically elevate utilities to 10%+ when risk appetite is severely broken and the broad market is in structural crisis. Upgrade catalyst: XLU would need MACD to shift from bearish/weakening to bearish but improving while stochastic RSI rises above 0.70, paired with a macro regime shift toward outright deflation fears—that would justify moving utilities to tier-1 at expense of extended industrial metals or agriculture.
Nuclear Energy — URNM
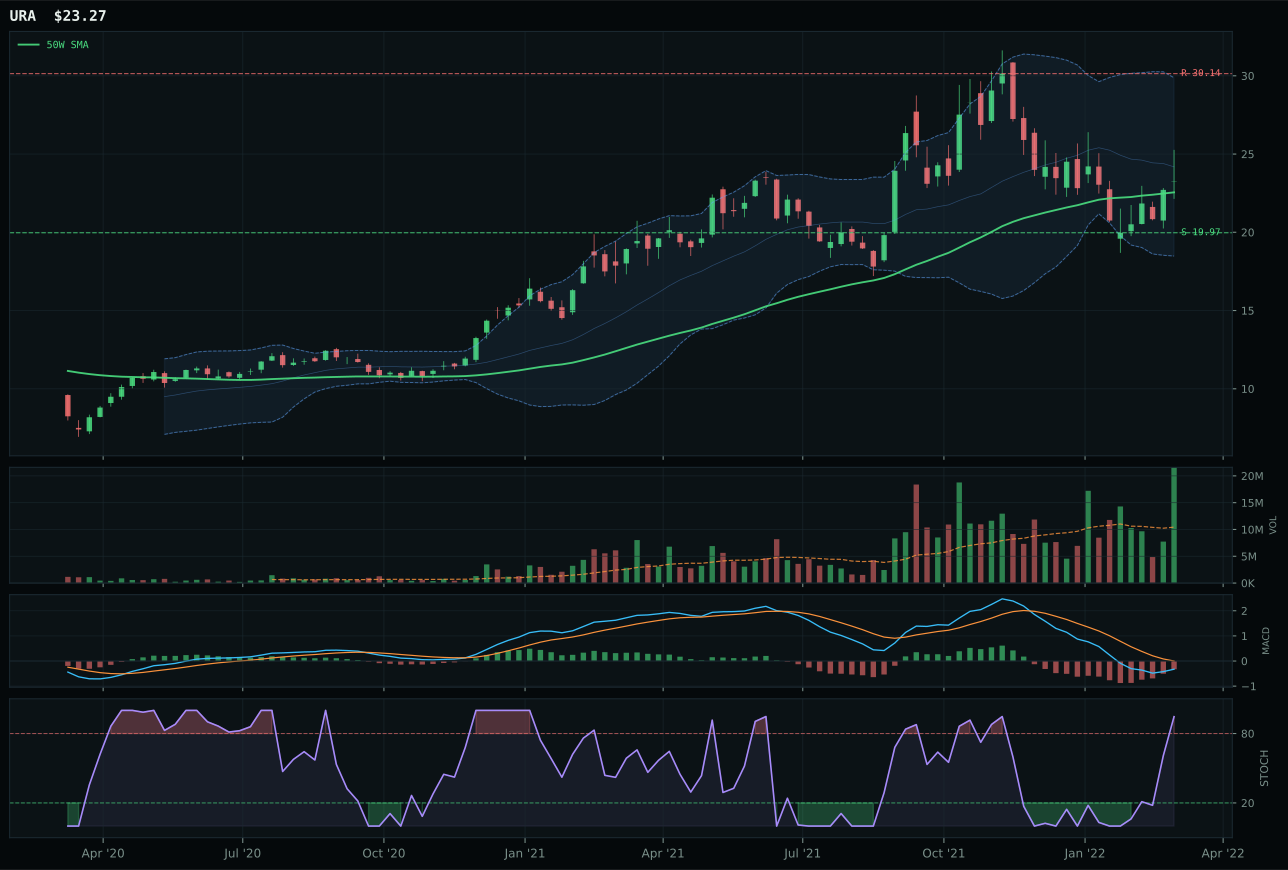
URA has a neutral structure profile with 1.7% 13-week relative strength versus SPY.
A failed hold above support would weaken the setup.
Actionable but governed by invalidation levels.
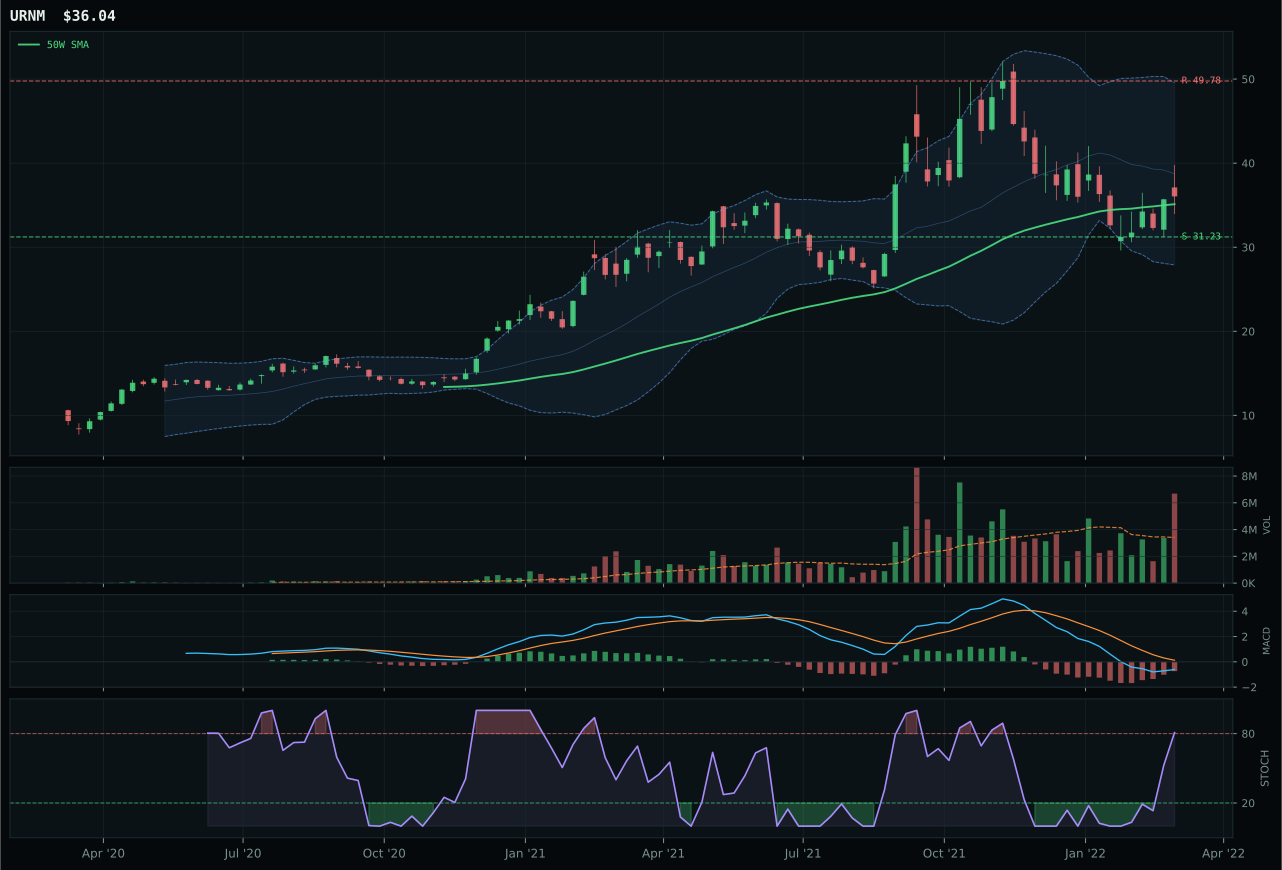
URNM has a compression near 50W profile with -2.3% 13-week relative strength versus SPY.
A failed hold above support would weaken the setup.
Actionable but governed by invalidation levels.
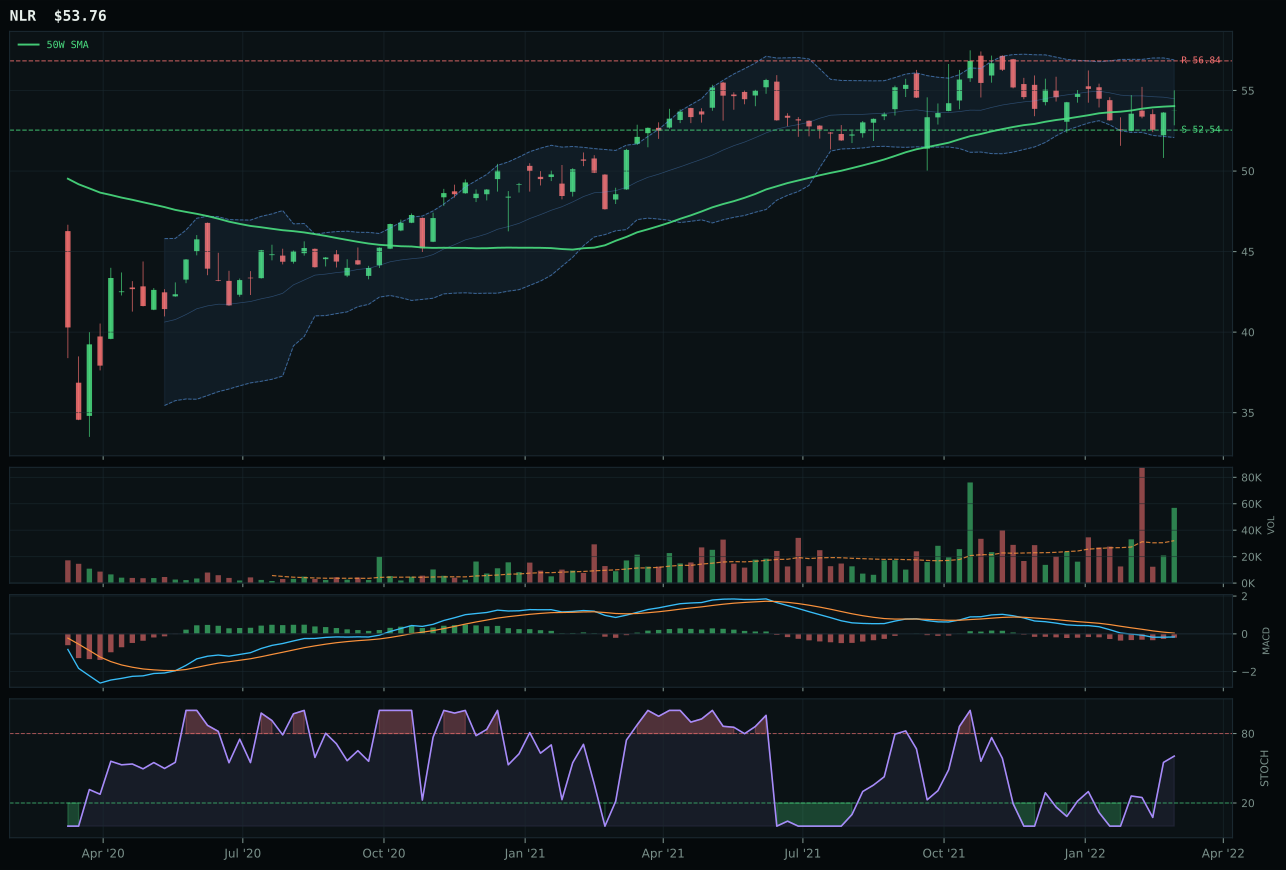
NLR has a pullback into support profile with 4.5% 13-week relative strength versus SPY.
A failed hold above support would weaken the setup.
Tracked, but not top-2 eligible because: .
URNM wins the nuclear category despite inferior trend and technical evidence compared to runner-up URA because its timing score (100.0/100 versus 97.0) and compression-near-50W setup (distance negative 2.6%) provide a cleaner entry point for new capital. The uranium-miner scarcity ETF sits just 2.6% above its 50-week moving average with MACD bearish but improving and stochastic RSI in overbought momentum—a setup that respects both the 7.0% 13-week drawdown and the potential for mean reversion if buyers defend support. URA scores higher overall (83 composite versus URNM's 78) and shows better trend (96.0 vs 70.0), but its neutral structure and negative 3.0% 13-week return lack the technical urgency that compression near the 50-week moving average provides. Risk/reward tilts decisively in URNM's favor (75.2 versus 67.8) because support at 31.23 is defined while upside to 49.78 offers 58.5% expansion if energy scarcity and real asset sponsorship thesis accelerates. Both names trade below their 200-week moving averages, making them recovery plays rather than trend followers; URNM's timing (100.0/100) and Fibonacci positioning (middle retracement/decision zone) create a classic compression setup rather than a capitulation washout.
Nuclear Energy received 5% allocation as tier-2, ranking below top-2 overweights despite respectable 63.6 score and 65.0/100 macro fit. The category benefits from energy scarcity (plus 9) and real asset sponsorship (plus 7), but risk appetite broken (negative 4) and lack of compelling technical evidence weight against expanded positioning. URNM's technical evidence (67.3/100) and composite score (78/100) lag both precious metals (88/100 GLD) and industrial metals (75/100 COPX), yet macro tailwinds on uranium demand and supply constraint keep it in the tier-2 allocation. The category's positioning is defensive insurance rather than core alpha: uranium provides optionality if inflation persists and energy demand accelerates, but the chart setup (price below 200W, momentum confirmation at 68.3/100) suggests the move is early rather than confirmed. URA's 83 composite score and 72.1 reasoned ETF ranking would normally earn category selection, yet URNM's timing perfection (100.0/100) and compression setup earn the representative slot. Upgrade to tier-1: URNM would need to break above 49.78 resistance and establish price above its 200-week moving average while maintaining MACD improvement and energy scarcity sponsorship—that would signal institutional engagement and reset the technical evidence from 67.3/100 to the high 80s.
Technology — CIBR
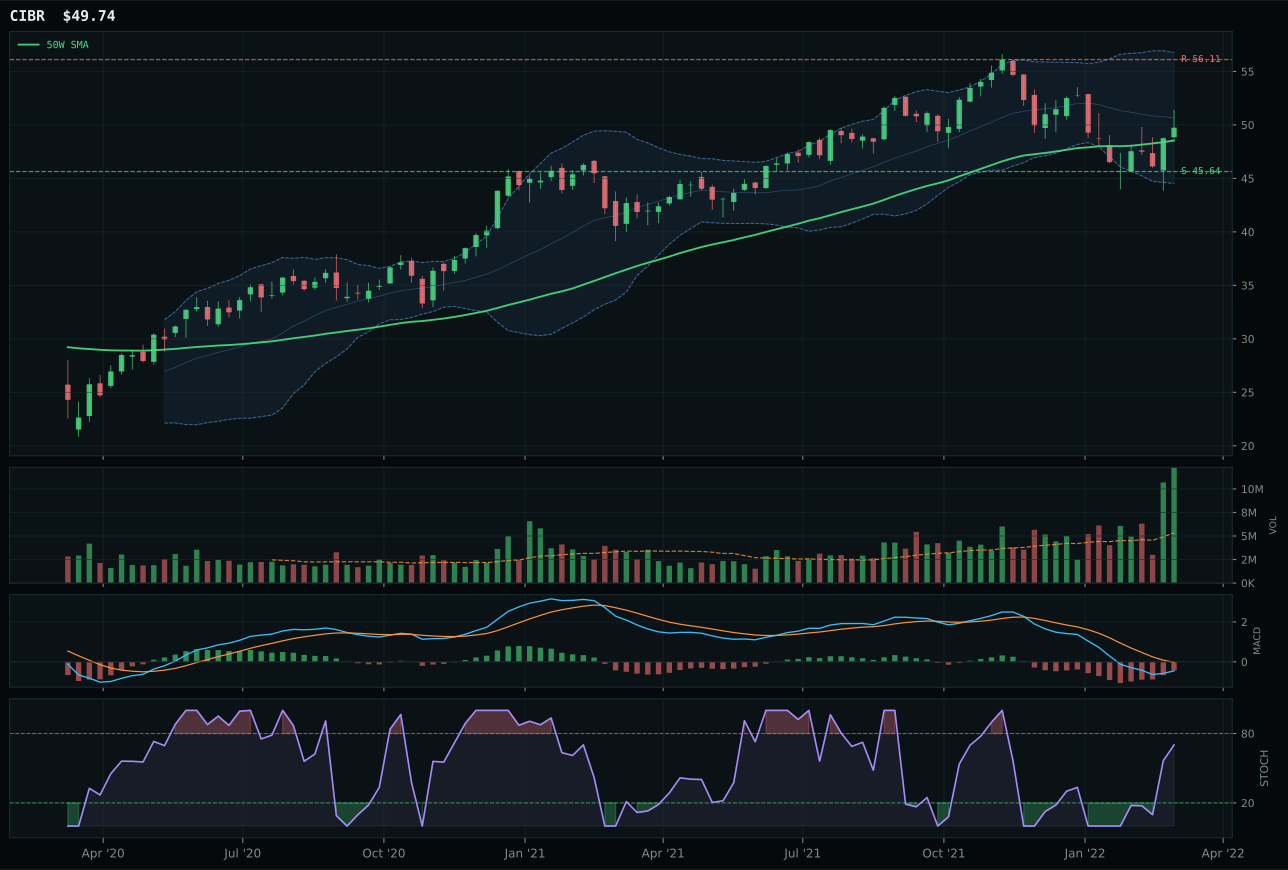
CIBR has a compression near 50W profile with 4.3% 13-week relative strength versus SPY.
A failed hold above support would weaken the setup.
Actionable but governed by invalidation levels.
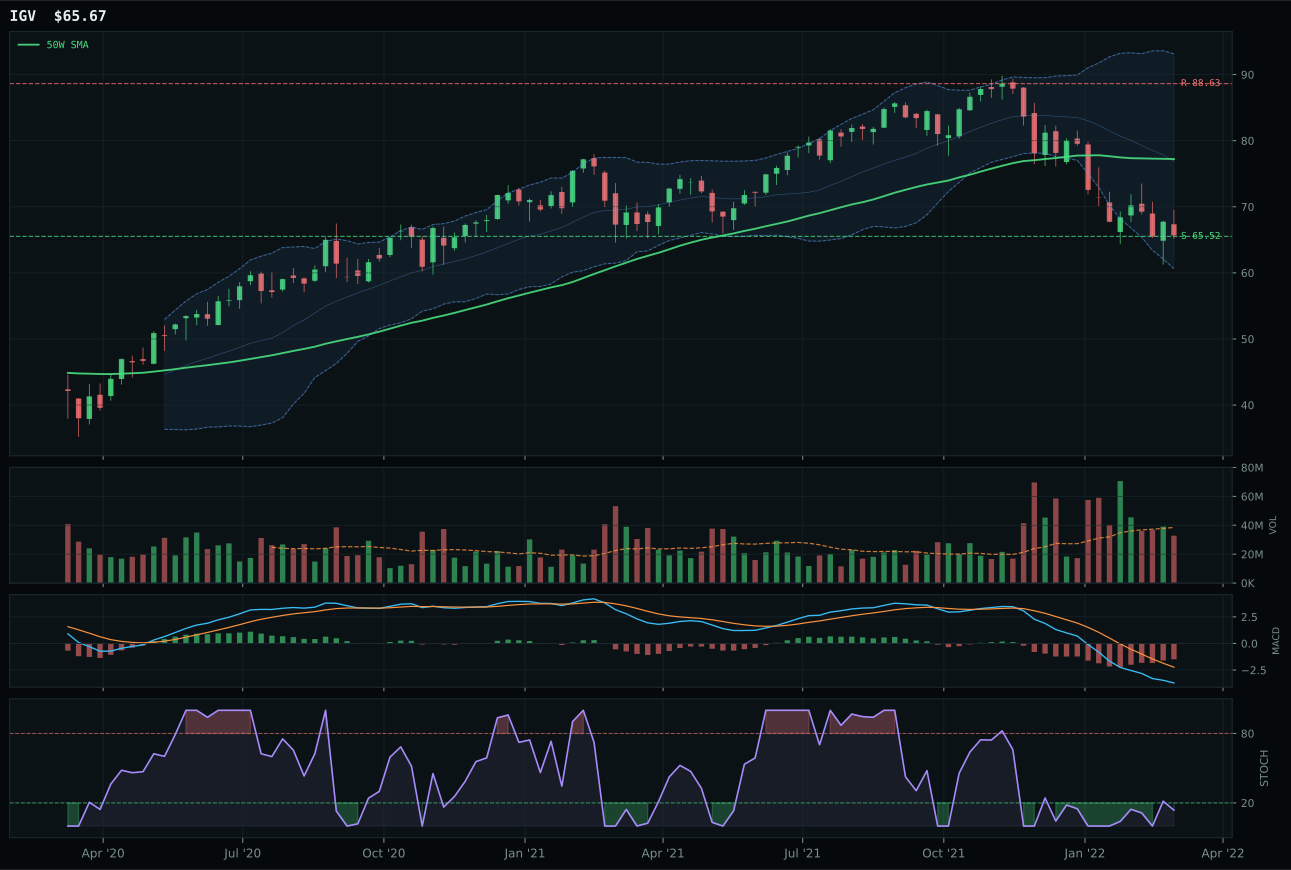
IGV has a pullback into support profile with -11.2% 13-week relative strength versus SPY.
A failed hold above support would weaken the setup.
Actionable but governed by invalidation levels.
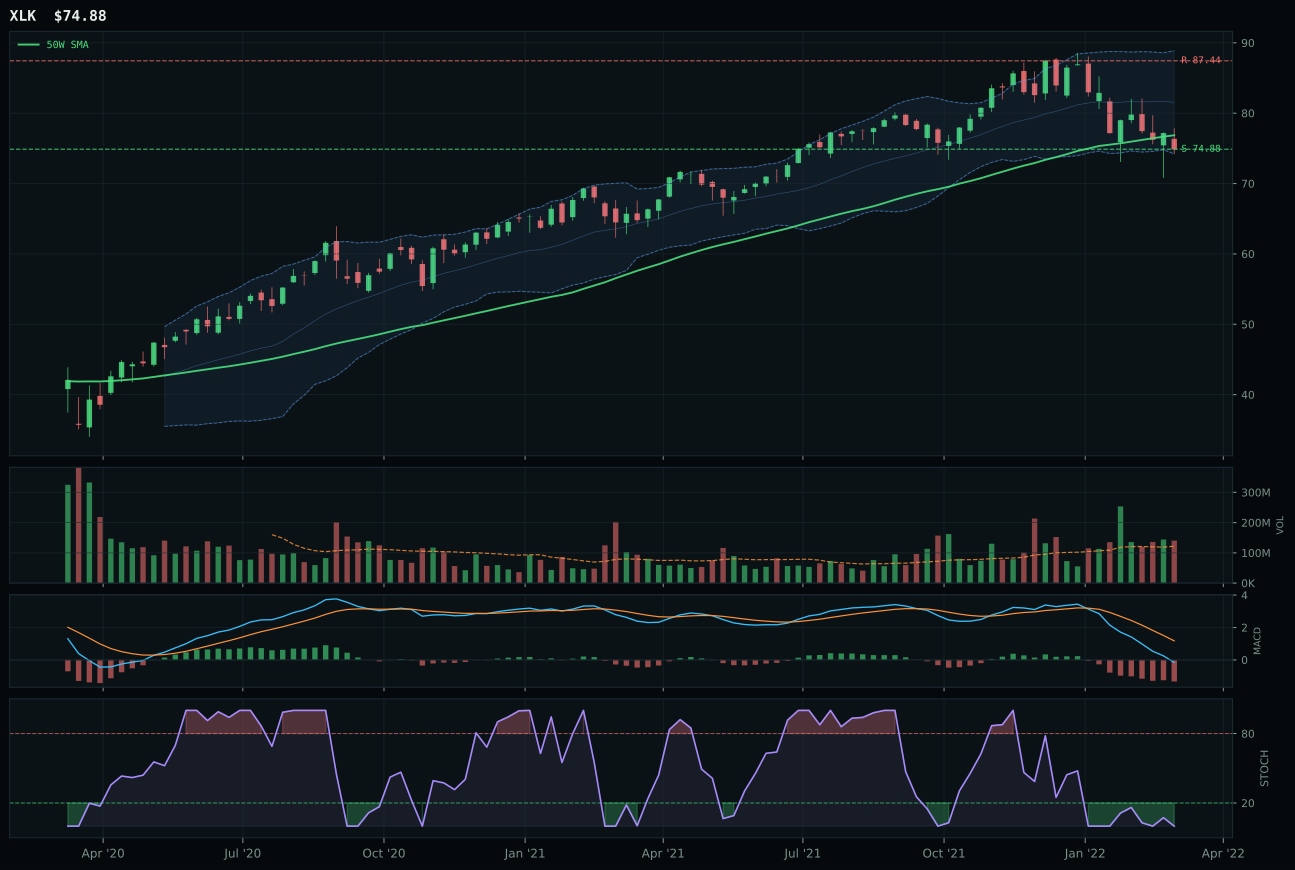
XLK has a pullback into support profile with -4.6% 13-week relative strength versus SPY.
A failed hold above support would weaken the setup.
Actionable but governed by invalidation levels.
CIBR wins decisively over IGV by 49.7 points on the back of superior timing and momentum confirmation that reflects a genuine accumulation setup rather than a bounce. The cybersecurity ETF sits just 2.5% above its 50-week moving average with volume at 2.43x the 20-week average and stochastic RSI rising into mid-zone territory—a profile that rewards the patience of buyers who held through the selloff. IGV stumbles on timing (79.0 vs 100.0) and momentum (2 vs 88.5) because enterprise software has fallen 15.9% over 13 weeks, trades 11.2% below the S&P 500, and shows stochastic RSI oversold rather than in the midst of recovery. MACD is bearish but improving in both names, yet CIBR's compression near the 50W creates a cleaner risk setup: if support at 45.64 breaks, the loss is defined; upside to 56.11 offers a 24% expansion zone if buyers defend the level.
Technology earned 5% allocation as a tier-2 category, sitting outside the top two overweights in a macro environment where defensive rotation and broad market pressure are both active. The 50.0/100 category-level macro fit reflects genuine tension: liquidity expansion and commodity breadth are positive tailwinds, but dollar pressure and risk appetite damage offset most benefit, leaving technical evidence to carry the category. CIBR's 86.2 reasoned ETF score and 95/100 composite technical grade keep Technology eligible for a capital slot, but its 13-week return of flat (negative 0.4%) and category-relative strength of just 8.9% prevent it from competing with energy and precious metals for top-2 positioning. What would unlock a tier-1 upgrade: a clean breakout above 56.11 resistance on volume persistence, or a macro shift where risk appetite stops deteriorating and inflation pressure fades.
AI — BOTZ
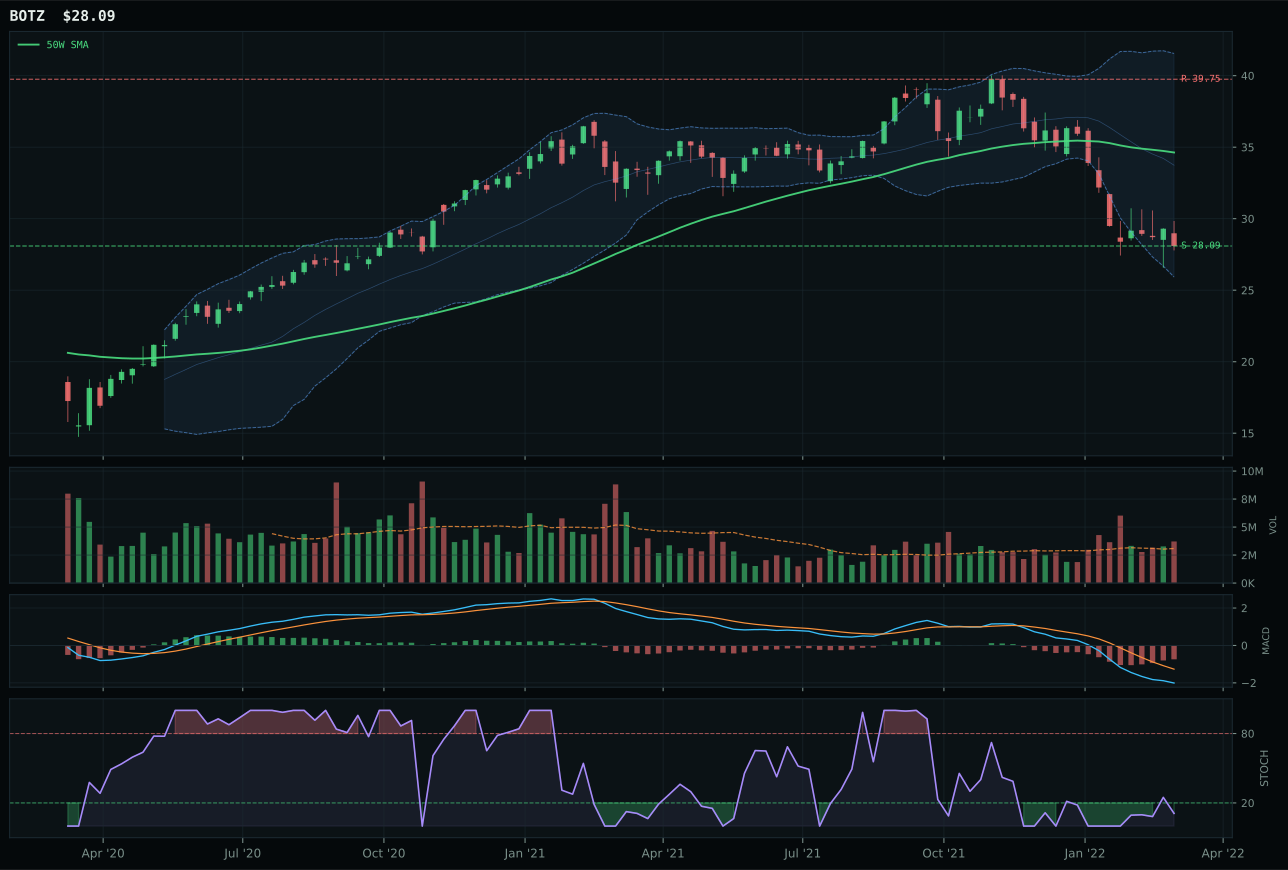
BOTZ has a pullback into support profile with -16.1% 13-week relative strength versus SPY.
A failed hold above support would weaken the setup.
Actionable but governed by invalidation levels.
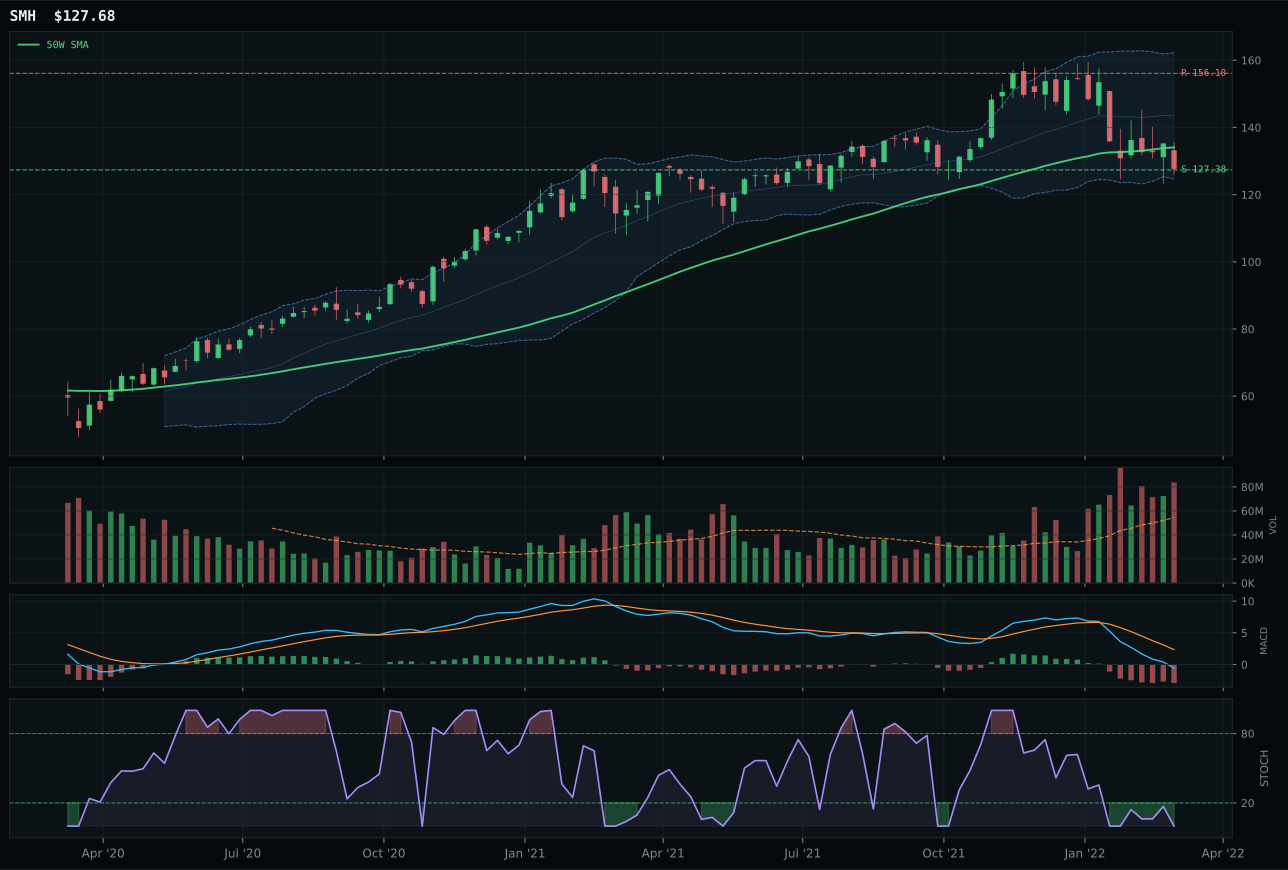
SMH has a pullback into support profile with -10.5% 13-week relative strength versus SPY.
A failed hold above support would weaken the setup.
Actionable but governed by invalidation levels.
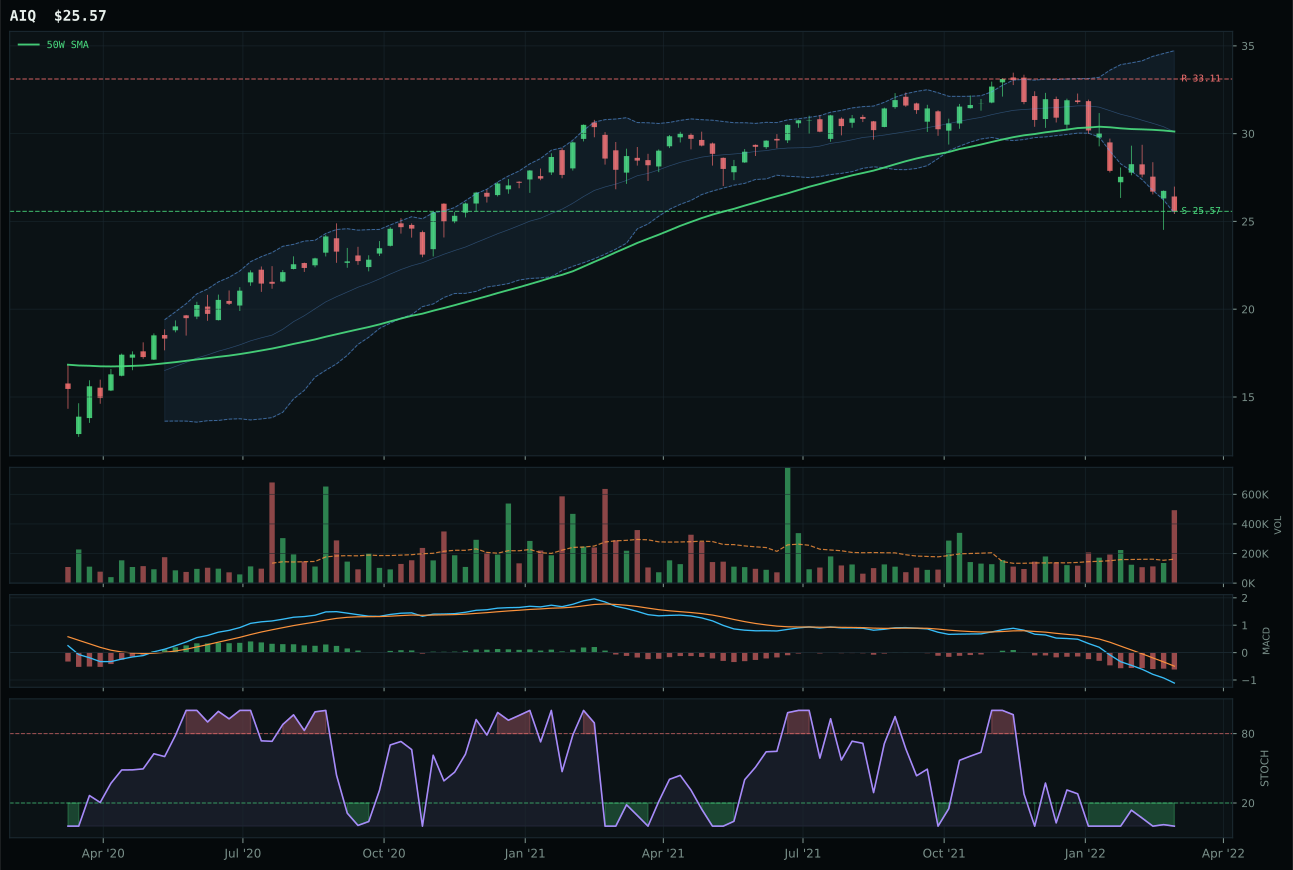
AIQ has a pullback into support profile with -12.2% 13-week relative strength versus SPY.
A failed hold above support would weaken the setup.
Tracked, but not top-2 eligible because: .
BOTZ wins a narrow race over SMH (score gap 3.1 points) by offering the only chart setup that respects both the severity of the 16.1% underperformance versus the S&P 500 and the potential for mean reversion if support holds. Robotics and physical AI are underwater 18.9% from their 50-week moving averages, but BOTZ shows stochastic RSI at 0.11 (oversold turn up) and accumulation at 1.20x volume—the early signs of institutional interest in a washout. SMH, by contrast, trades with bearish/weakening MACD and distribution pressure on volume, suggesting no sponsor has arrived to defend the setup. Risk/reward tilts sharply in BOTZ's favor (90.0 vs 75.0) because downside to support is capped at zero while SMH faces deep retracement zones. Neither name trades above its 50-week moving average, which is why both score poorly on trend, but BOTZ's timing score (79.0) and Fibonacci placement near the 52-week low create a defined pivot point.
AI received 0% allocation this week, ranking 9th or 10th and excluded entirely from the portfolio. The category's 26.0 final score reflects a fundamental technical breakdown: BOTZ itself trades with momentum confirmation of just 2.4/100 (4-week return negative 3.7%, 13-week return negative 20.8%) and volume-price confirmation of only 15.0/100. Macro fit of 45.0/100 adds injury—liquidity expansion offers a mild tailwind, but risk appetite broken and broad market bear are both active headwinds that overwhelm any scarcity narrative. The Transition/Mixed regime is not constructive for cyclical tech exposure when absolute price action shows distribution and oversold stochastic conditions without sponsor bid. What would restore AI to the allocation: a multi-week consolidation with rising volume confirming accumulation, MACD moving from bearish/weakening to bearish but improving, and a macro regime shift where risk appetite stabilizes or recovers.
Emerging Markets — INDA
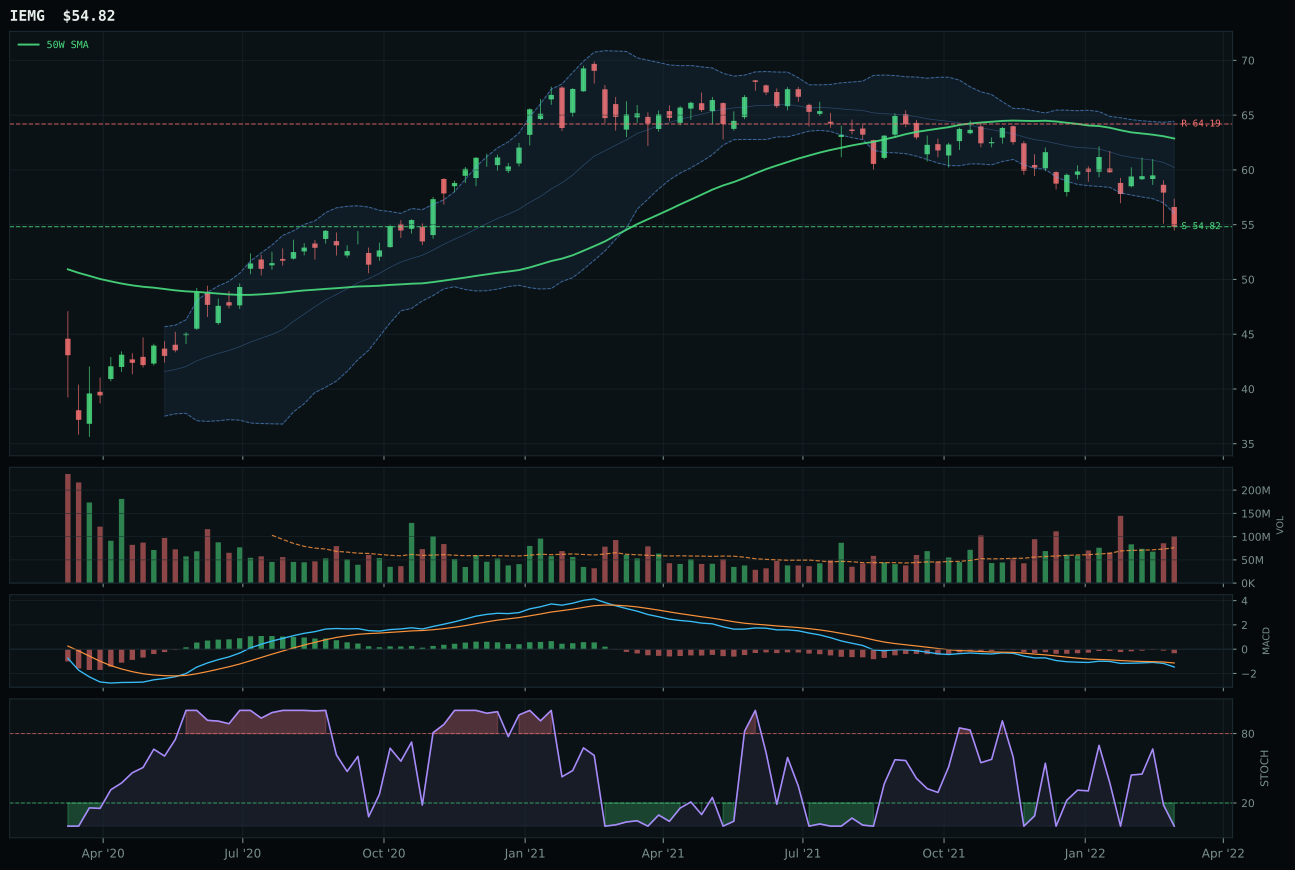
IEMG has a pullback into support profile with -4.3% 13-week relative strength versus SPY.
A failed hold above support would weaken the setup.
Actionable but governed by invalidation levels.
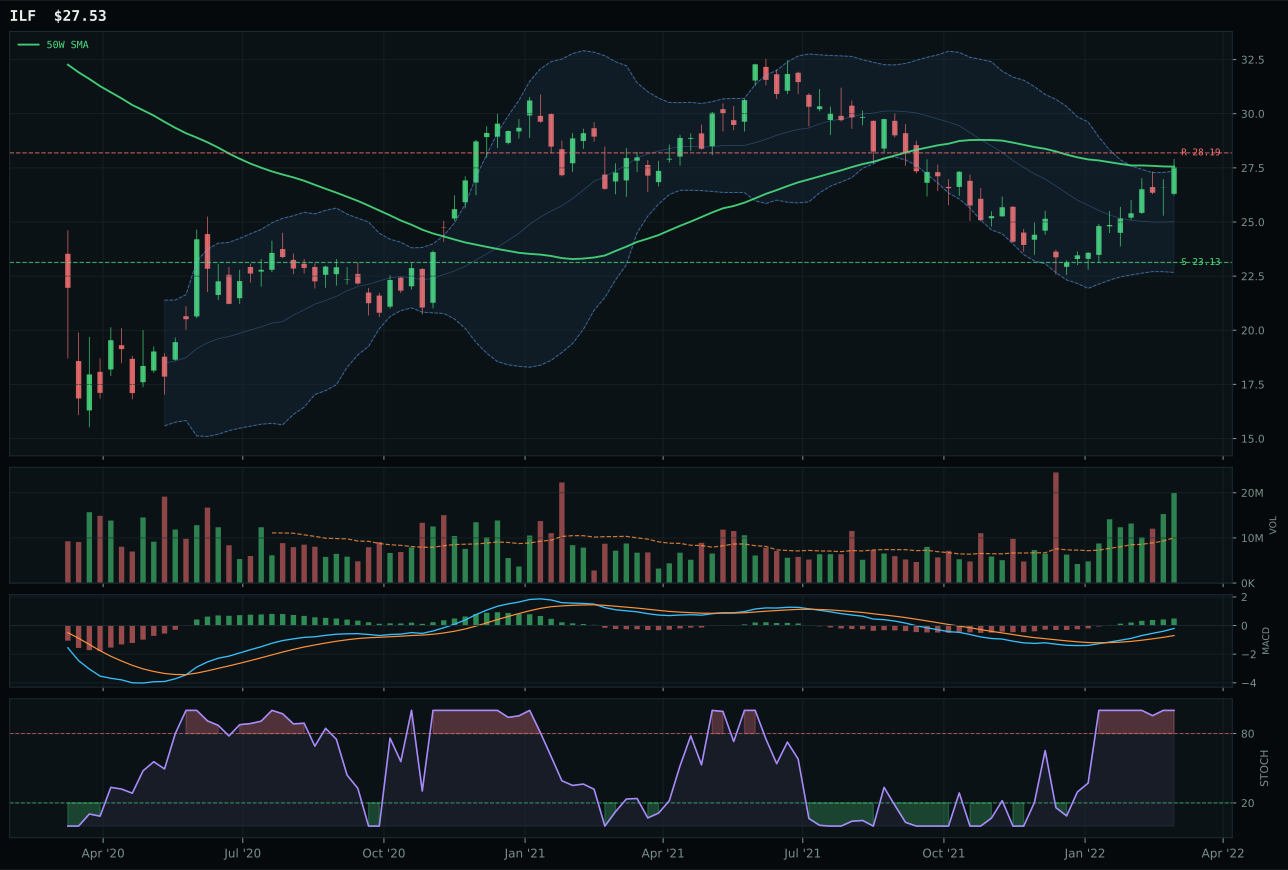
ILF has a compression near 50W profile with 17.5% 13-week relative strength versus SPY.
Extension and support failure are the main tactical risks.
Tracked, but not top-2 eligible because: structurally broken.
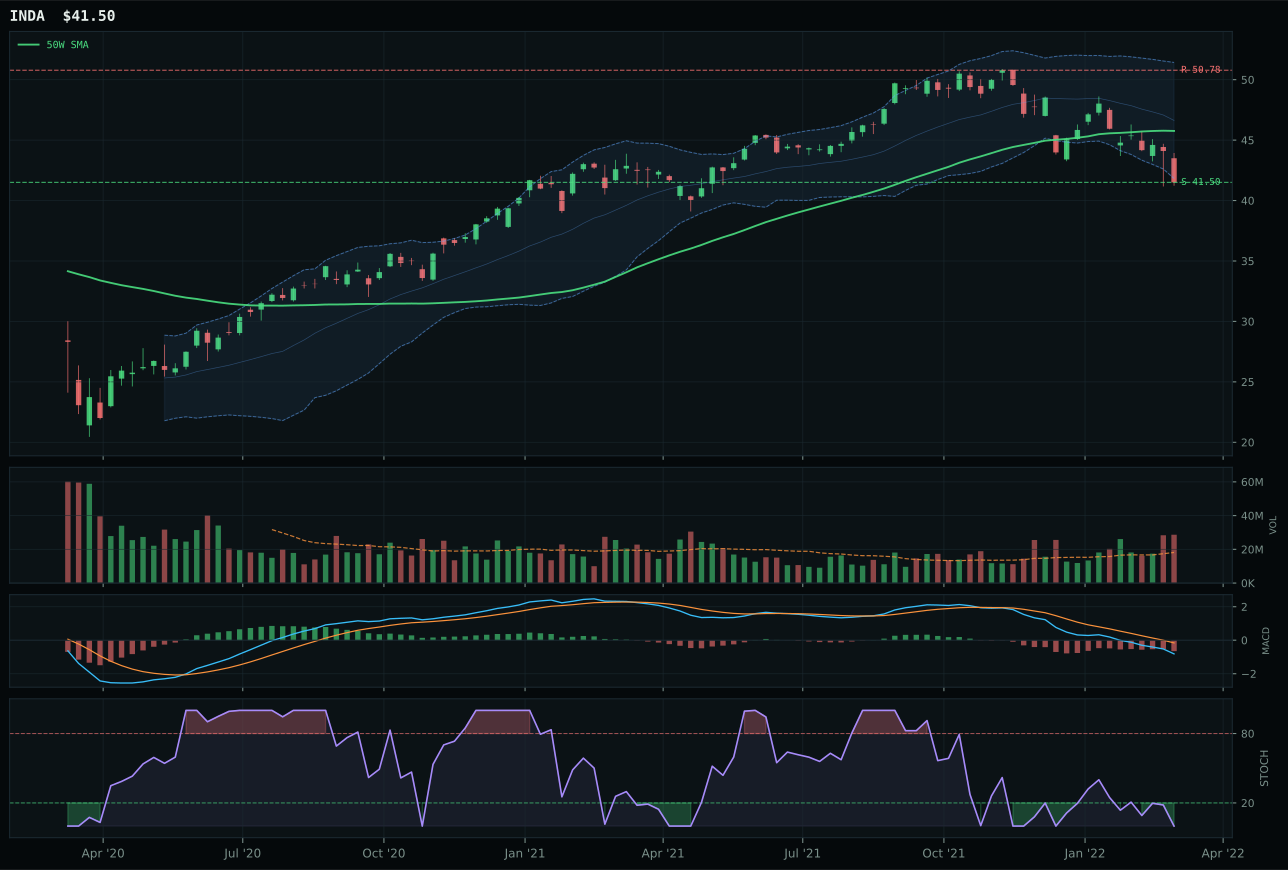
INDA has a pullback into support profile with -8.4% 13-week relative strength versus SPY.
A failed hold above support would weaken the setup.
Actionable but governed by invalidation levels.
INDA wins the emerging markets category on a technicality despite both weakness and poor sponsor participation, beating IEMG (runner-up) because timing score is marginally superior (80.0 versus 60.0) and risk/reward is technically identical (78.1 versus 78.1). India-focused exposure sits negative 9.3% from the 50-week moving average with stochastic RSI fully oversold at 0.00, MACD bearish/weakening, and volume at 1.58x the 20-week average (distribution pressure)—a profile that signals capitulation yet provides defined support at 41.50. IEMG shows even weaker technical evidence (composite 39 vs INDA's 30) and distribution pressure on volume without the oversold turn-up signal. Both trade with momentum confirmation near zero and volume-price confirmation at near-zero, reflecting a category-wide absence of sponsor; neither ETF pulls its weight. The selection comes down to setup clarity: INDA's near-52-week-low Fibonacci zone (0.786 at 41.64) and oversold stochastic (0.00) create a technical floor, whereas IEMG's oversold stochastic is not yet in turn-up mode. This is an example of picking the least broken chart in a broken category.
Emerging Markets received 0% allocation this week, ranking 9th or 10th and excluded entirely from the portfolio. The category's 8.0 final score reflects a technical and macro breakdown that makes holding any position indefensible: INDA trades with momentum confirmation of 0.0/100, volume-price confirmation of 0.0/100, and persistence at 2.6/100—metrics that indicate no institutional interest whatsoever. Dollar pressure (negative 14) and broad market bear (negative 9) are active headwinds that overwhelm liquidity expansion (plus 8), creating a 35.0/100 category-level macro fit that ranks worst among all ten categories. The Transition/Mixed regime is harmful for EM when risk appetite is broken and dollar strength is persistent; INDA's negative 8.4% S&P 500–relative return and negative 13.1% 13-week return confirm capital is fleeing, not accumulating. The portfolio's exclusion is rational: capital allocation toward defensive energy, precious metals, and defense & aerospace is more valuable than bottom-fishing in an EM category with zero sponsor signatures and macro headwinds. Restoration path: Emerging Markets would need to see risk appetite stabilize, dollar pressure reverse (or fade), and either INDA or IEMG show true accumulation signature (stochastic RSI in oversold turn-up with rising volume and MACD improvement)—that combination is weeks away at minimum given current price action.