
2022-02-25
Informational purposes only. The content in this report, including allocations, analysis, and commentary, is provided solely for informational and educational purposes. It does not constitute financial advice, investment advice, trading advice, or any other type of advice. Past performance does not guarantee future results. Always conduct your own research and consult a qualified financial professional before making investment decisions.
Weekly Allocation
| Ticker | Category | Weight | Role |
|---|---|---|---|
| XLE | Traditional Energy | 20% | Top-2 (20%) |
| COPX | Industrial Metals | 20% | Top-2 (20%) |
| WEAT | Agriculture & Livestock | 10% | Tier-2 (10%) |
| GDX | Precious Metals | 10% | Tier-2 (10%) |
| PAVE | Utilities & Infrastructure | 10% | Tier-2 (10%) |
| XAR | Defense & Aerospace | 10% | Tier-2 (10%) |
| URNM | Nuclear Energy | 10% | Tier-2 (10%) |
| CIBR | Technology | 10% | Tier-2 (10%) |
Trade Instructions — Monday Open
Sell the tranche from 2022-01-28 (completing its 4-week hold). Buy the new tranche. Instructions show net portfolio changes — same-asset positions cancel, weight changes show the delta.
| Action | Ticker | Instruction |
|---|---|---|
| SELL | XLE | Sell 25% of XLE position (reduce 40.00% → 30.00%) |
| SELL | GLD | Sell 17% of GLD position (reduce 7.50% → 6.25%) |
| SELL | IGF | Sell 25% of IGF position (reduce 5.00% → 3.75%) |
| SELL | XLK | Sell 33% of XLK position (reduce 3.75% → 2.50%) |
| SELL | ITA | Sell 17% of ITA position (reduce 7.50% → 6.25%) |
| SELL | MOO | Sell 20% of MOO position (reduce 6.25% → 5.00%) |
| SELL | URA | Sell entire URA position (1.25% of portfolio) |
| BUY | COPX | Buy COPX — 14.29% of freed cash (adds 2.50% to portfolio) |
| BUY | WEAT | Buy WEAT — 14.29% of freed cash (adds 2.50% to portfolio) |
| BUY | CIBR | Buy CIBR — 14.29% of freed cash (adds 2.50% to portfolio) |
| BUY | PAVE | Buy PAVE — 14.29% of freed cash (adds 2.50% to portfolio) |
| BUY | GDX | Buy GDX — 14.29% of freed cash (adds 2.50% to portfolio) |
| BUY | XAR | Buy XAR — 14.29% of freed cash (adds 2.50% to portfolio) |
| BUY | URNM | Buy URNM — 14.29% of freed cash (adds 2.50% to portfolio) |
Current Portfolio After Trade
Combined holdings across all 4 active tranches. Each tranche is 25% of the portfolio.
| Ticker | % of Portfolio | Weight Bar |
|---|---|---|
| XLE | 30.00% | |
| COPX | 16.25% | |
| GLD | 6.25% | |
| ITA | 6.25% | |
| IEMG | 6.25% | |
| CIBR | 6.25% | |
| MOO | 5.00% | |
| WEAT | 5.00% | |
| PAVE | 5.00% | |
| IGF | 3.75% | |
| XLK | 2.50% | |
| GDX | 2.50% | |
| XAR | 2.50% | |
| URNM | 2.50% |
Macro Regime — Transition / Mixed
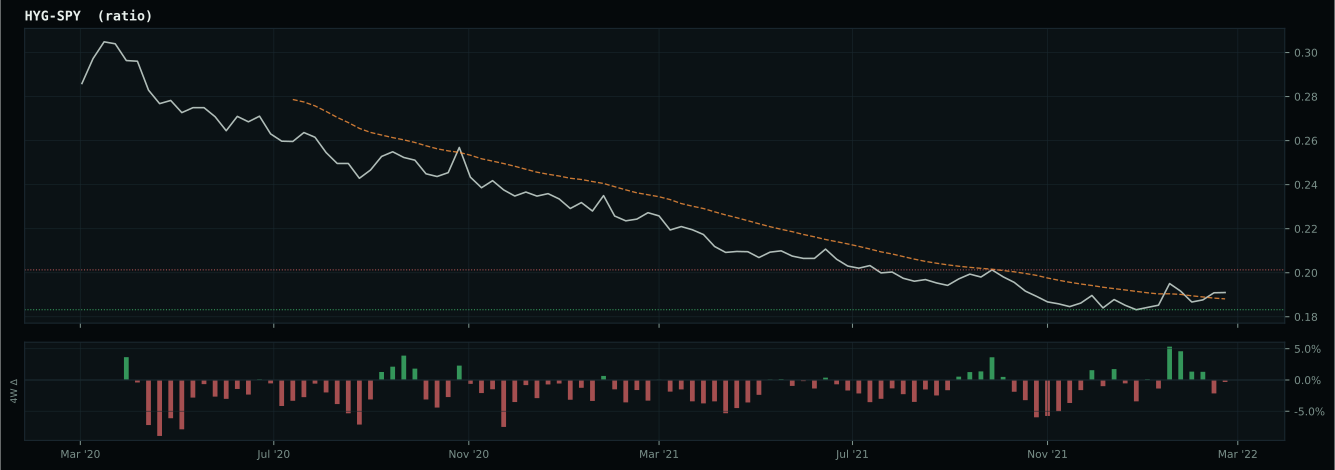
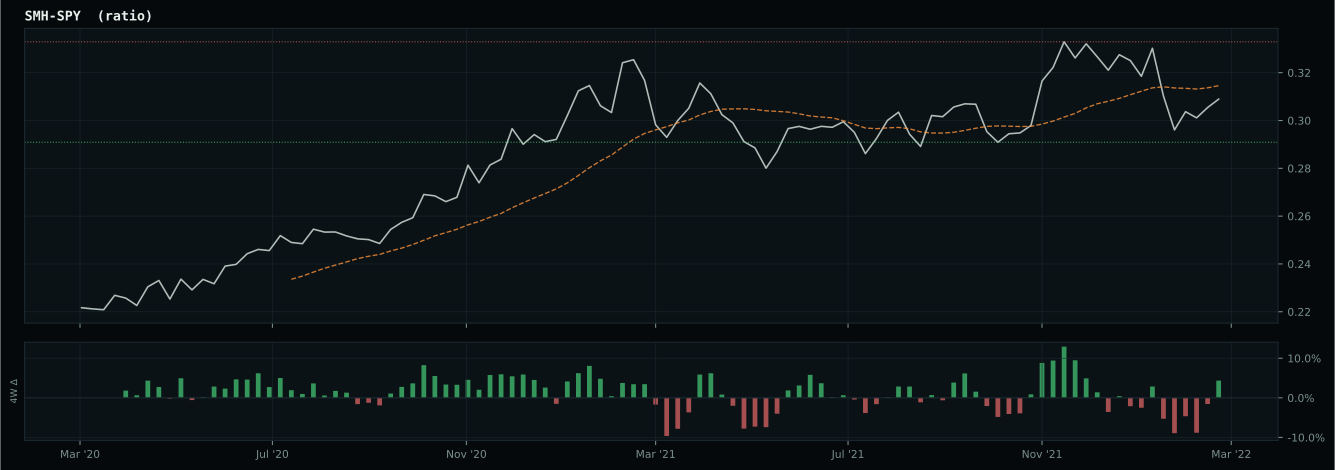
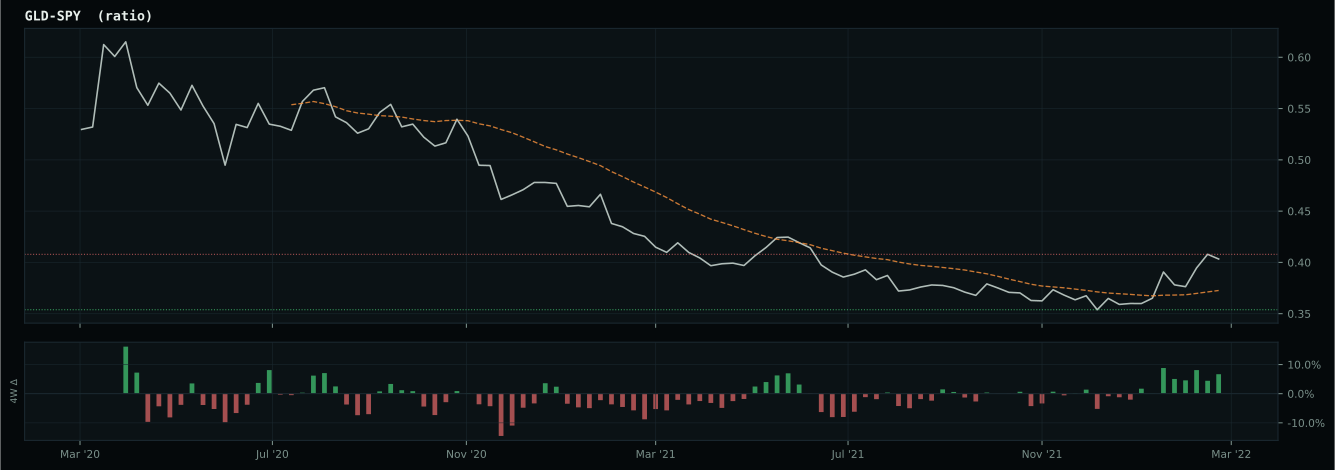
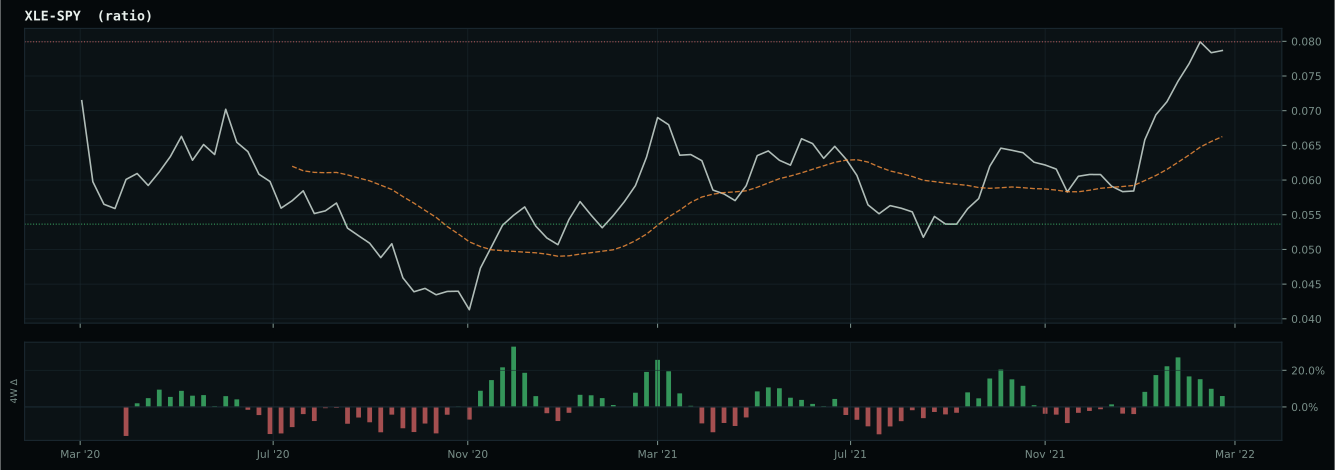
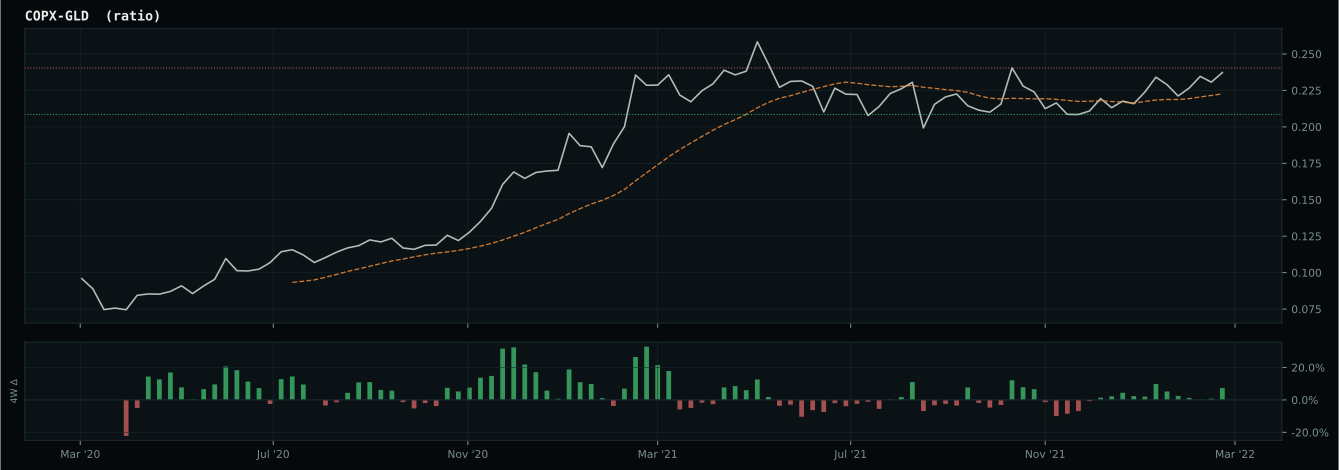
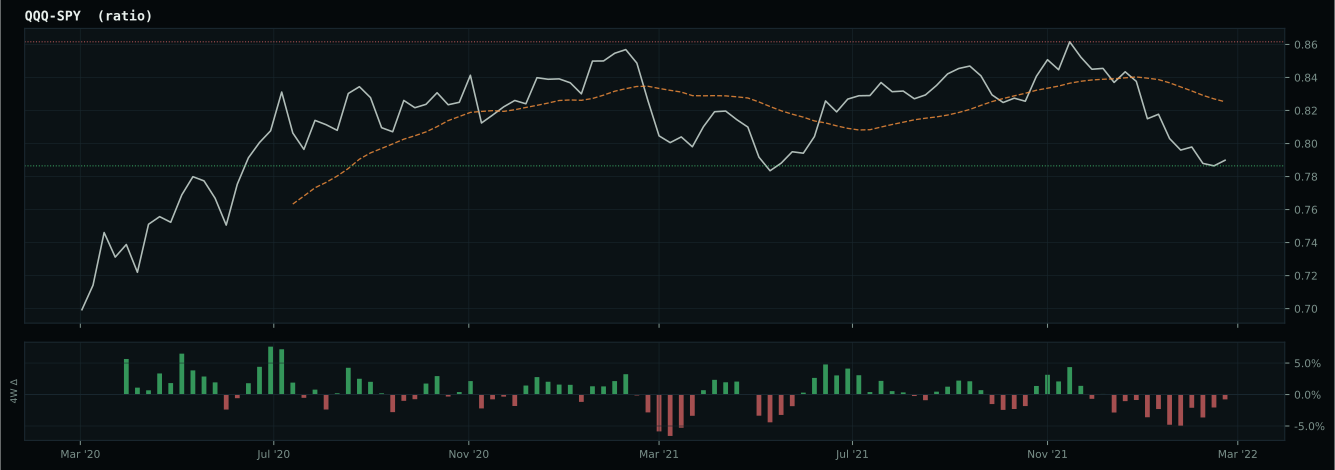
growth data is not confirming the weak market-implied risk appetite signal
Macro Evidence Charts
Market-implied signals behind the macro regime scores. Each ratio compares two assets; the direction and slope of the ratio is what the macro engine reads.
Crypto Regime — NoCrypto
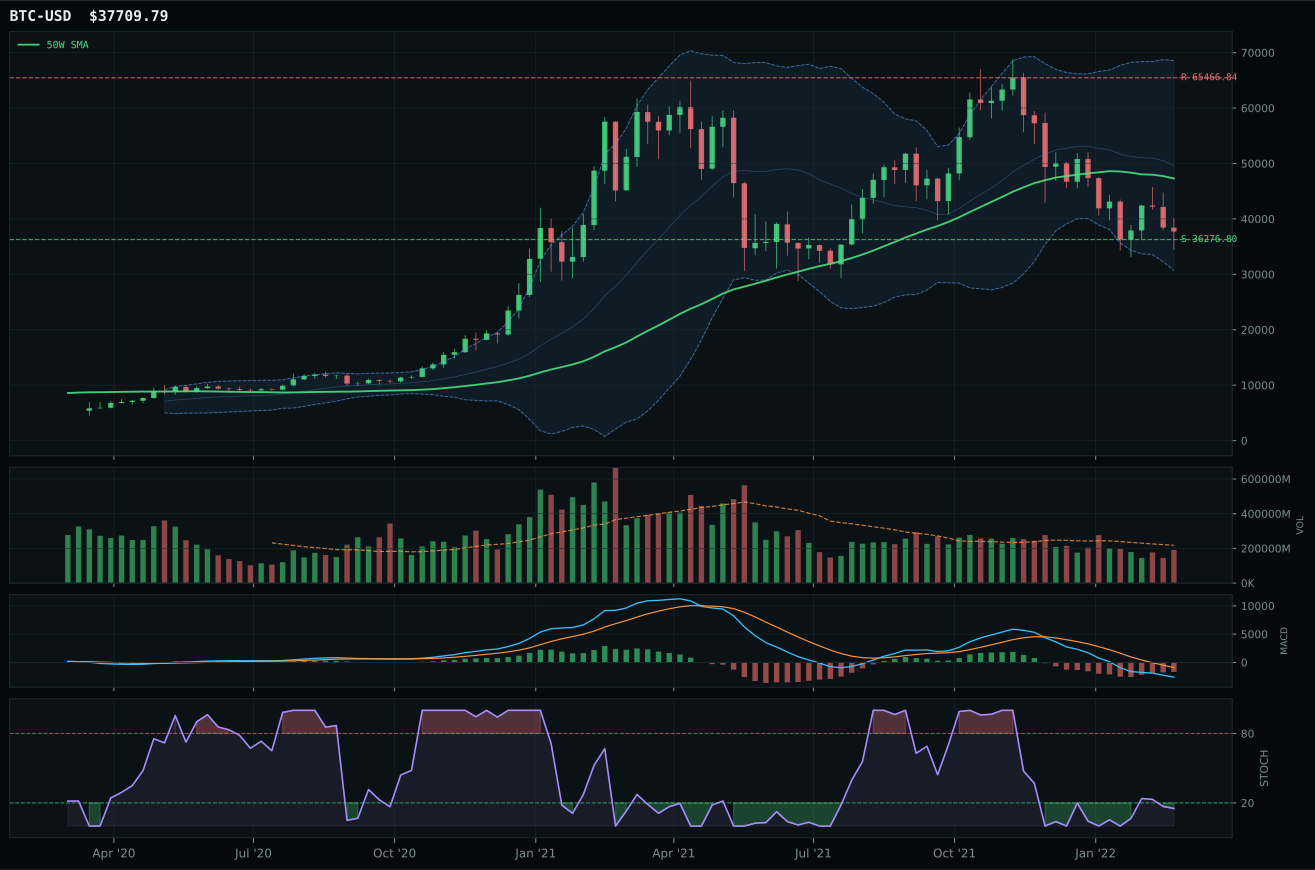
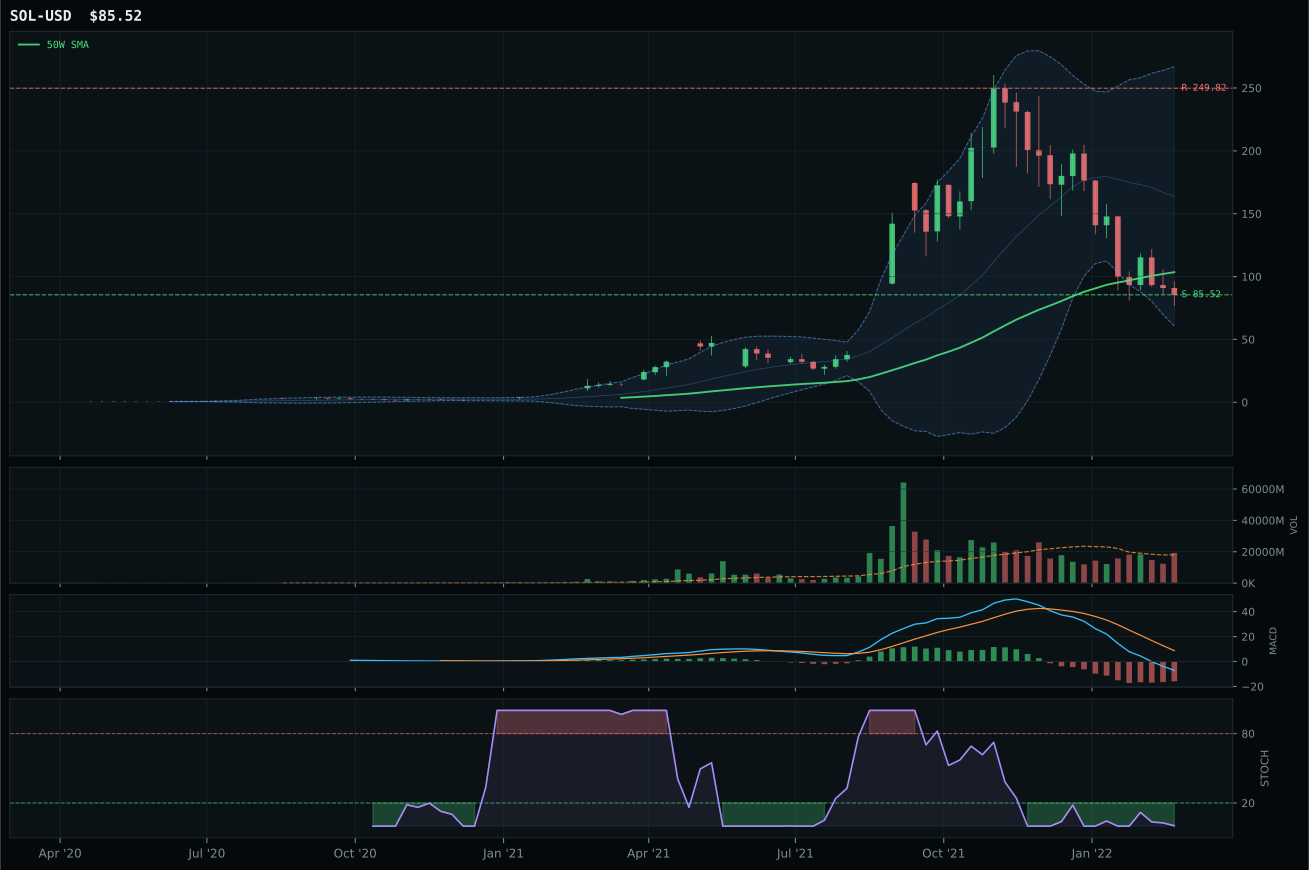
ValueBTC not armed: BTC has not made the first post-breakdown touch of the 200W buy zone after losing the 50W
TrendBTC not confirmed
one or more available conditions failed
Category Rankings
| Rank | Category | Winner | Score | Alloc | 4W Ret | Peers (4W) |
|---|---|---|---|---|---|---|
| 1 | Traditional Energy | XLE | 91.2 | 20% | +12.78% | FCG +20.1% · XOP +20.7% |
| 2 | Industrial Metals | COPX | 80.0 | 20% | +9.78% | PICK +8.1% · REMX +5.4% |
| 3 | Agriculture & Livestock | WEAT | 77.0 | 10% | +20.42% | MOO +13.2% · VEGI +16.4% |
| 4 | Precious Metals | GDX | 76.3 | 10% | +8.69% | SLV +1.8% · GLD +0.8% |
| 5 | Utilities & Infrastructure | PAVE | 70.6 | 10% | +8.24% | IGF +5.5% · XLU +8.5% |
| 6 | Defense & Aerospace | XAR | 68.4 | 10% | +7.32% | ITA +4.1% · ROKT +8.7% |
| 7 | Nuclear Energy | URNM | 47.1 | 10% | +11.90% | URA +11.4% · NLR +4.6% |
| 8 | Technology | CIBR | 45.3 | 10% | +7.84% | XLK +3.1% · IGV +0.5% |
| 9 | Emerging Markets | IEMG | 43.8 | 0% | -1.98% | ILF +13.6% · INDA +1.7% |
| 10 | AI | SMH | 35.9 | 0% | +2.57% | BOTZ -0.6% · AIQ +2.2% |
Traditional Energy — XLE
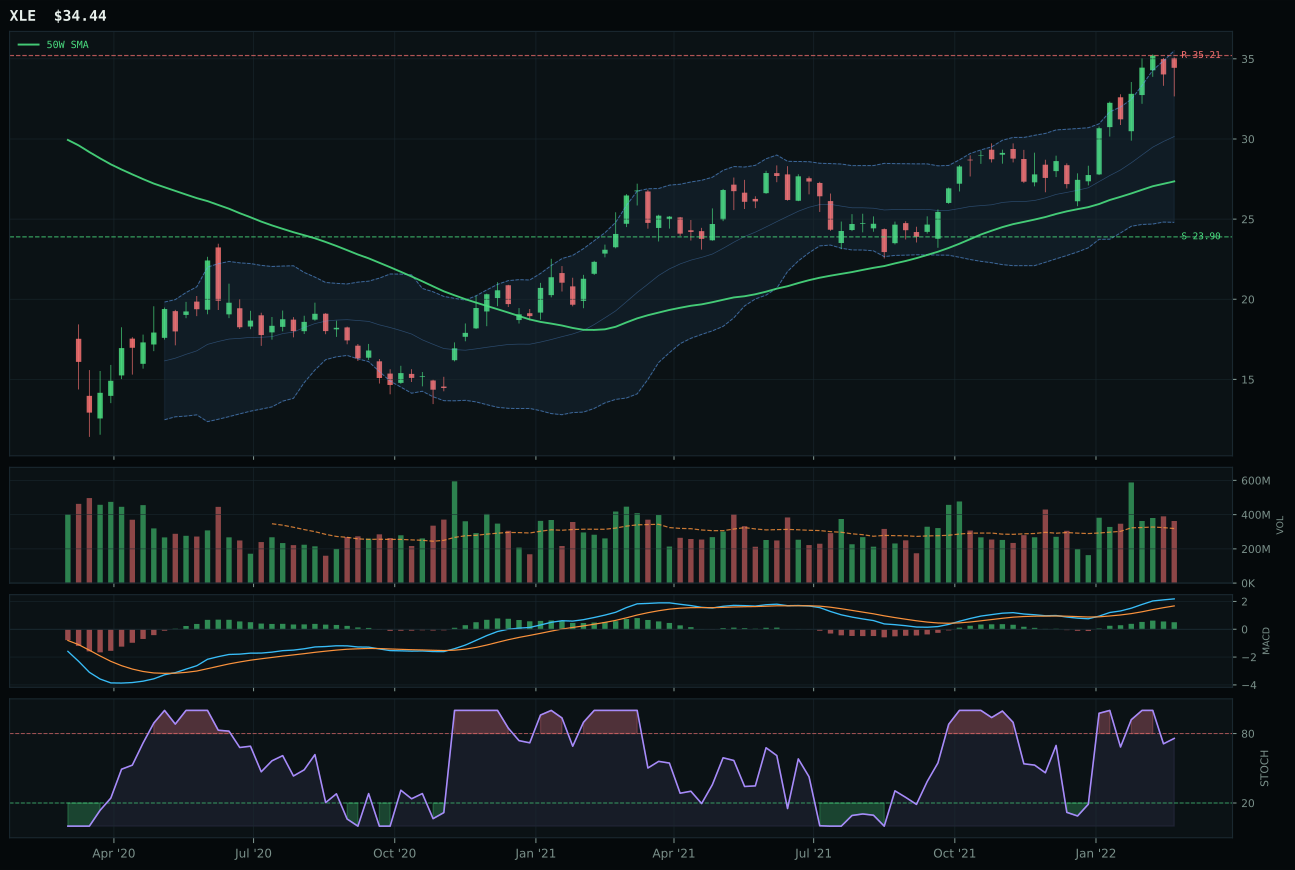
XLE has a vertical extension profile with 28.6% 13-week relative strength versus SPY.
A failed hold above support would weaken the setup.
Actionable but governed by invalidation levels.
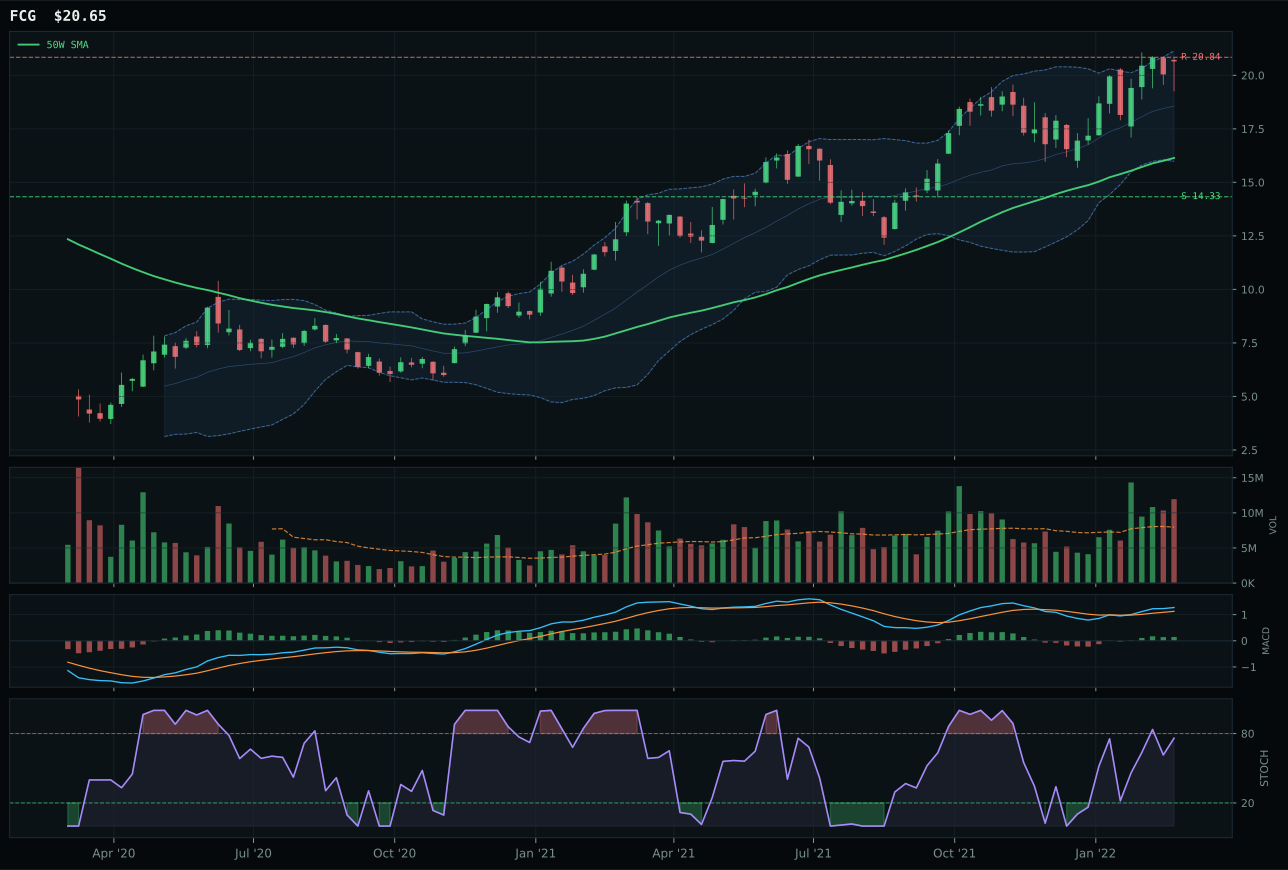
FCG has a vertical extension profile with 22.8% 13-week relative strength versus SPY.
A failed hold above support would weaken the setup.
Actionable but governed by invalidation levels.
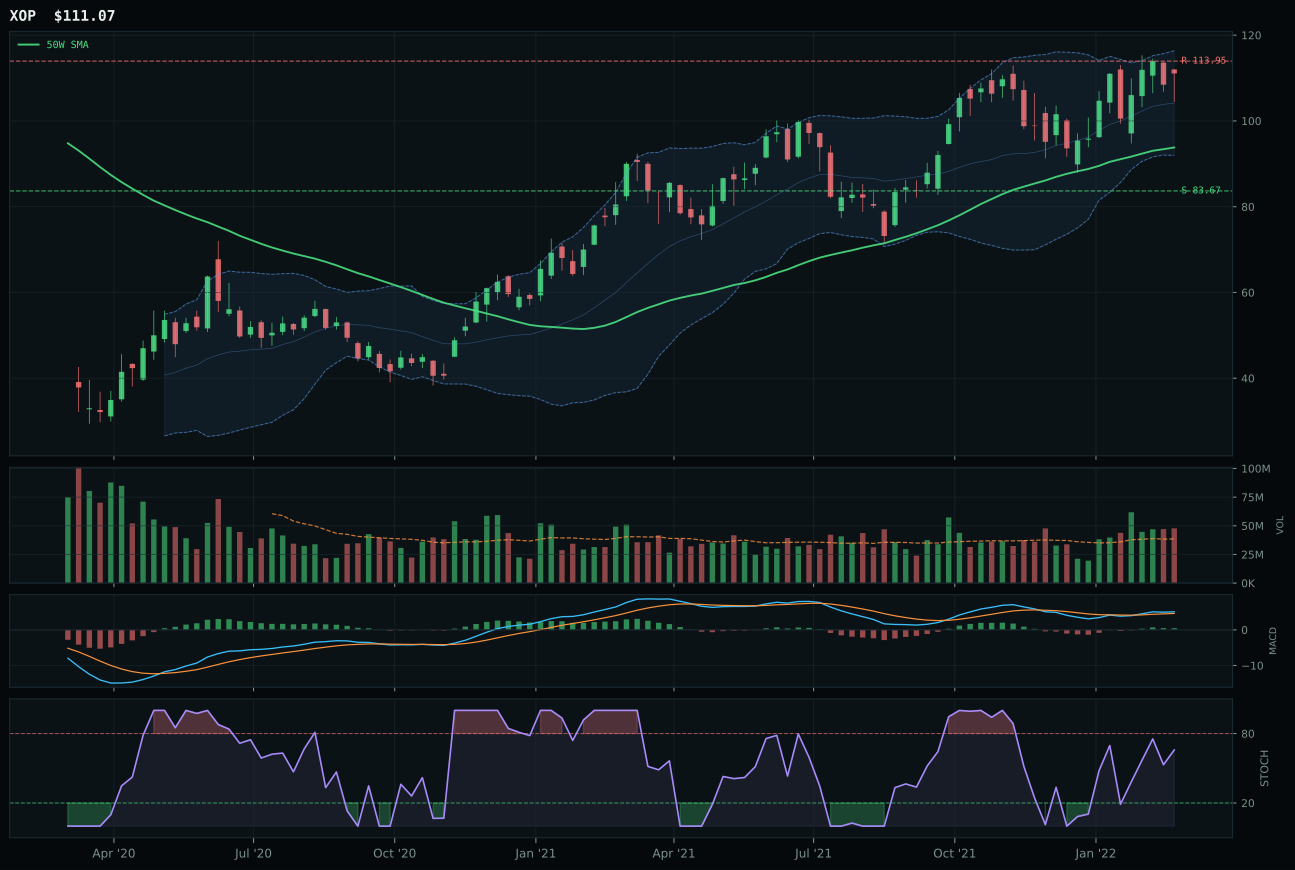
XOP has a vertical extension profile with 17.0% 13-week relative strength versus SPY.
A failed hold above support would weaken the setup.
Actionable but governed by invalidation levels.
XLE captured the Traditional Energy 20% slot as the highest-ranked category representative despite being the third-best technical performer in a 0.2-point decision race versus FCG. XLE stands 25.9% above its 50-week average—an extended position that normally would be penalized, yet the category rewarded persistence: XLE's 28.6% relative strength versus SPY and 23.9% 13-week return signal that this is sustained institutional buying, not a short-squeeze bounce. MACD is bullish and improving with stochastic RSI falling/neutral at 0.76, suggesting momentum is intact but not euphoric. FCG lost despite matching technical scores (100 trend) because its category-relative strength lagged at 0.0% and risk/reward was weaker (27.4 vs 37.9)—FCG is more leveraged (natural gas) while XLE is the integrated defensive play. FCG's vertical extension setup and rising stochastic at 0.69 showed fresher intraday momentum, but XLE's broader market acceptance (5.8% category-relative strength) made it the allocation choice.
Traditional Energy earned the top 20% allocation slot on exceptional technical evidence (82.4 for XLE) anchored to fortress macro fit (92.0/100 category level): energy scarcity (+16), inflation pressure (+10), supply shortage (+9), and real asset sponsorship (+7) deliver a four-driver macro thesis that is unmatched in this portfolio. The 91.2 category score is the highest on the board, reflecting both technical momentum and macro alignment. The allocation risk is execution timing: XLE is extended 25.9% above the 50W with 37.9 risk/reward (tight asymmetry), stochastic RSI at 0.76 is neutral not rising, and upside to resistance is only -2.2%. This is a momentum hold, not a new entry point for fresh capital. The category maintains top allocation because supply-side energy constraints (geopolitical, underinvestment, demand persistence) are macro structural, not cyclical bounces—but trader discipline on stops is essential, and mean-reversion pullbacks toward support near 23.90 would be the opportunity for averaging into strength rather than chasing extended momentum.
Industrial Metals — COPX
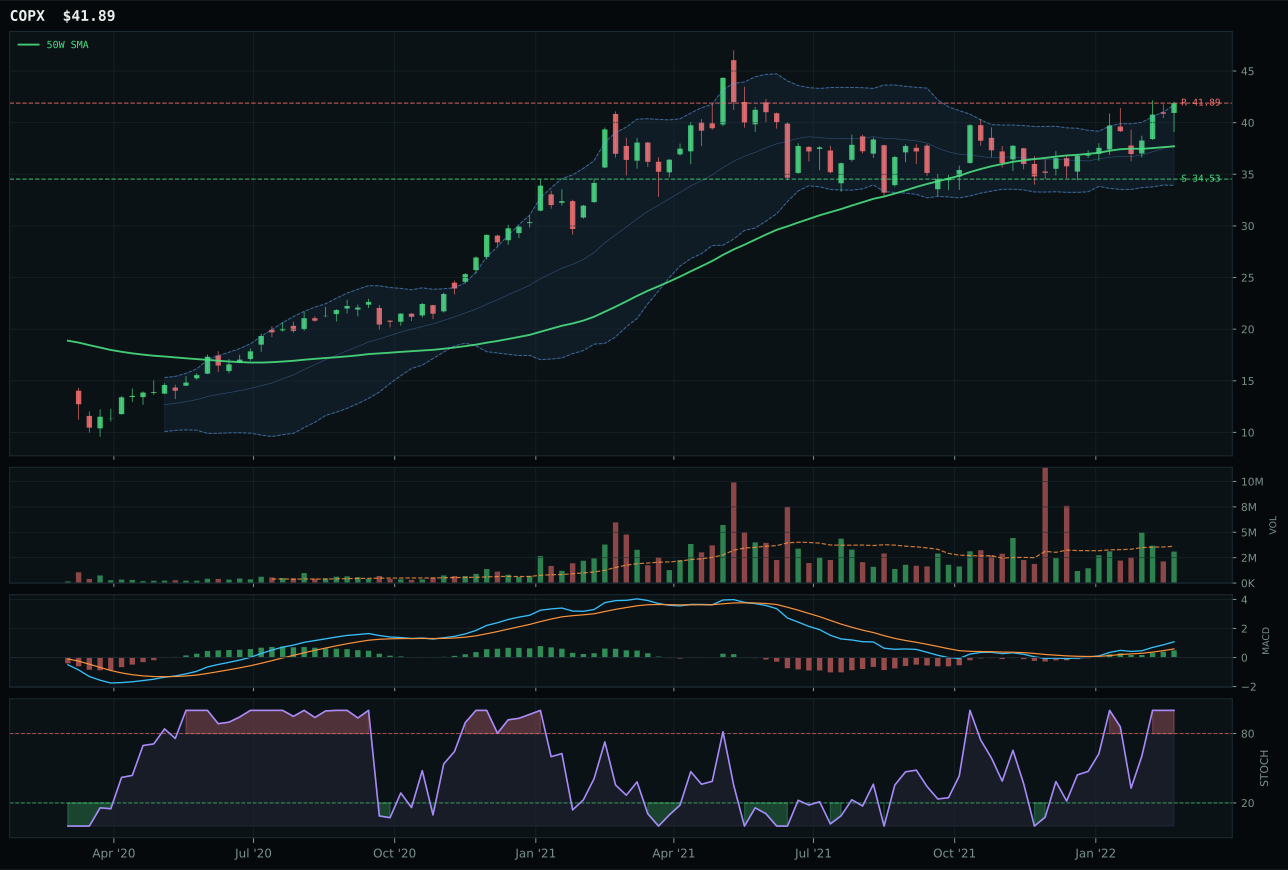
COPX has a neutral structure profile with 25.0% 13-week relative strength versus SPY.
A failed hold above support would weaken the setup.
Actionable but governed by invalidation levels.
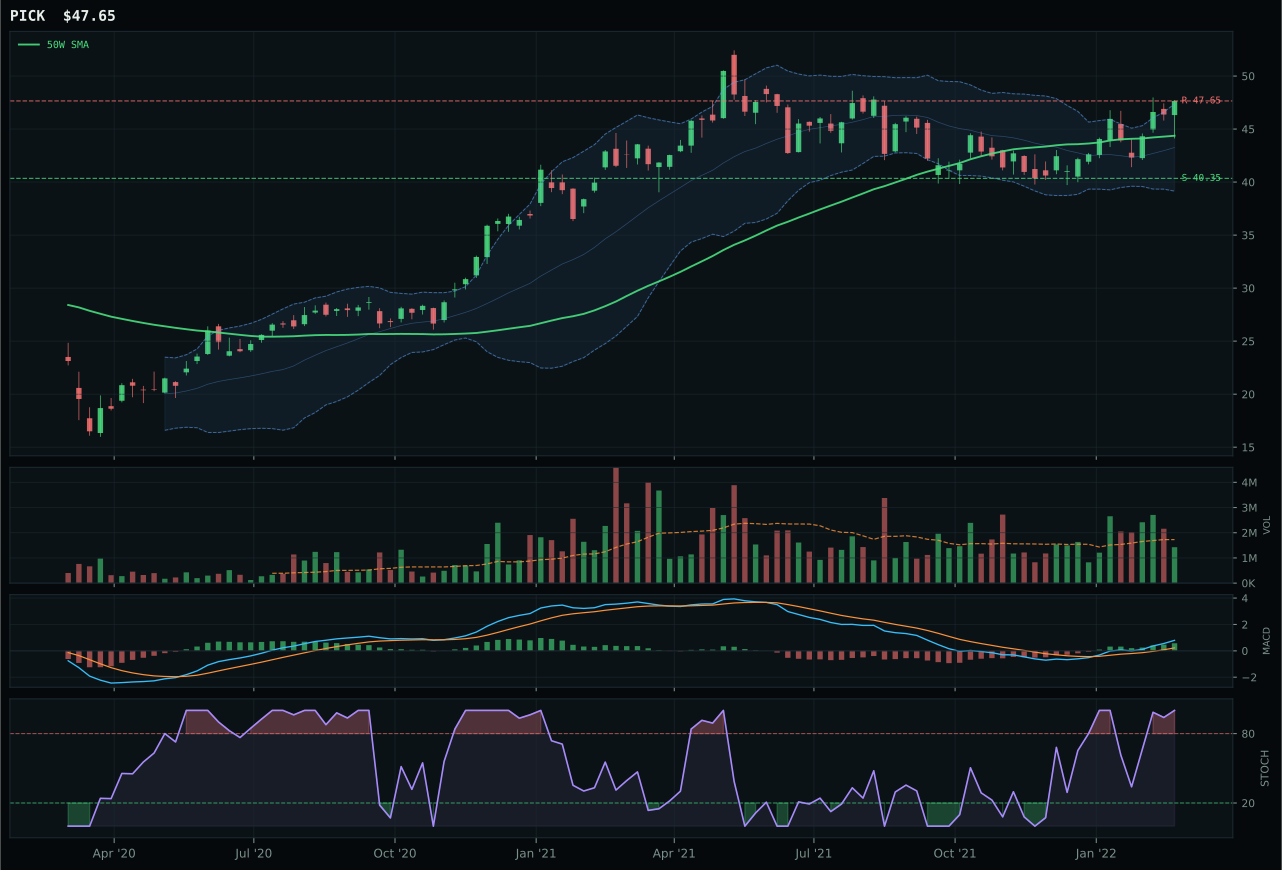
PICK has a neutral structure profile with 22.7% 13-week relative strength versus SPY.
A failed hold above support would weaken the setup.
Actionable but governed by invalidation levels.
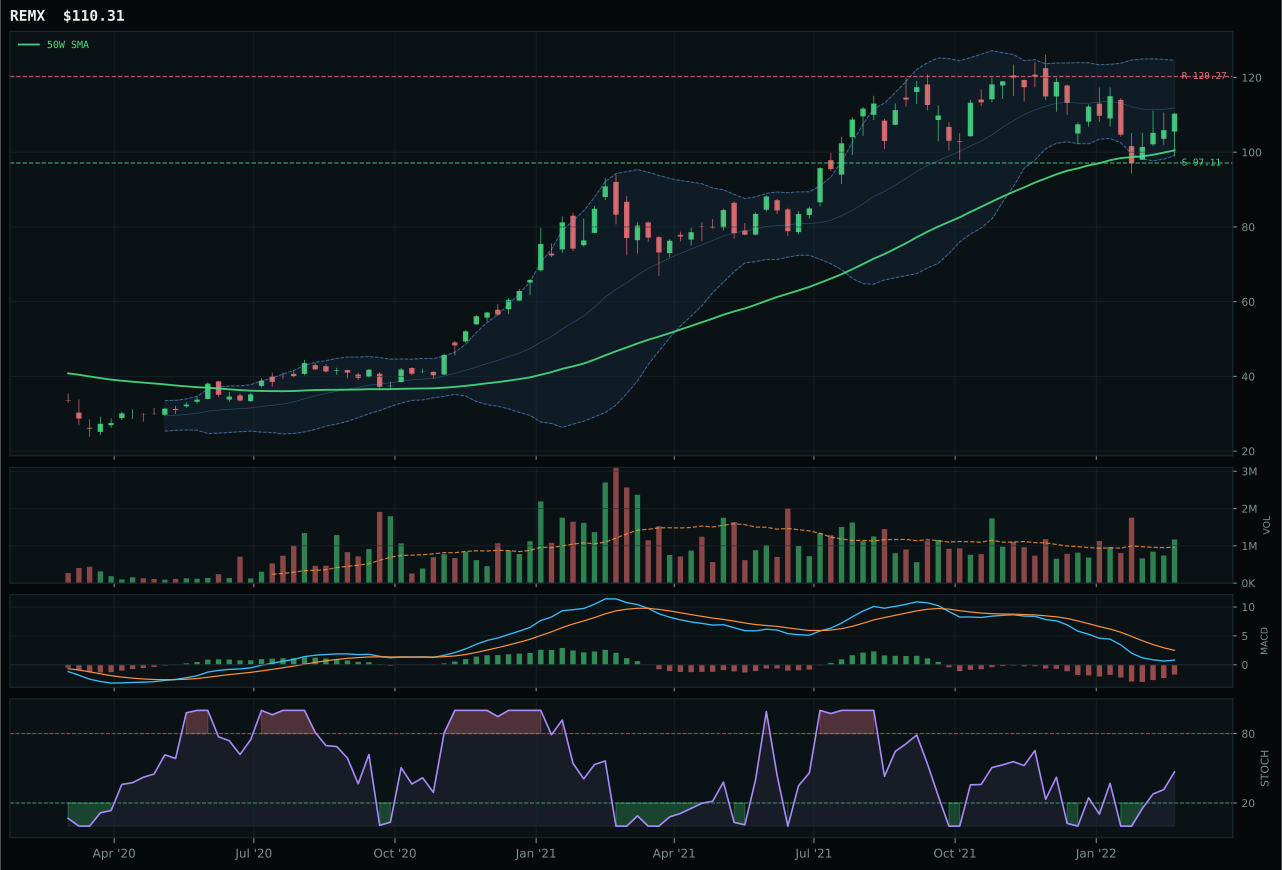
REMX has a neutral structure profile with -3.7% 13-week relative strength versus SPY.
A failed hold above support would weaken the setup.
Actionable but governed by invalidation levels.
COPX captured the Industrial Metals 20% allocation slot through superior category-relative strength (+2.3% vs +0.0% for PICK) and cleaner trend composition despite an extremely close technical race. Both COPX and PICK sit in neutral structure with overbought stochastic RSI at 1.00, both have 100.0 trend scores and bullish improving MACD, both show 13-week gains around 20%. The decisive margin: COPX's 25.0% relative strength versus SPY and 20.4% 13-week return slightly exceed PICK's 22.7% SPY relative strength and 18.1% 13-week return. COPX's structure is marginally cleaner (77.3 vs 75.3), and within a scarcity-driven category where all candidates show identical trend and momentum, category-relative strength becomes the tiebreaker. Volume is neutral for COPX (0.85x average) versus neutral for PICK—no sponsor advantage there, but the composition advantage sufficed. Both face the same timing penalty (67 and 75 respectively) from being extended 11-14% above the 50W in upper retracement zone.
Industrial Metals earned 20% as the second-highest-ranked category on technical excellence (90.2 for COPX) combined with fortress macro fit (80.0/100): metals scarcity (+14), commodity breadth positive (+10), and real asset sponsorship (+6) create a three-driver macro thesis for copper and diversified mining. The category score of 80.0 reflects both the technical strength of COPX and PICK (a 1-point gap is a coin-flip decision) and a macro environment where industrial metals are in supply shock. The tension: both leaders sit overbought with 51-53 risk/reward scores and zero upside room to resistance—this is a momentum-extended position, not a deep value setup. Allocation to 20% reflects conviction that supply shortage persists through price discovery, not a forecast of easy gains. The position should be monitored for technical deterioration (stochastic RSI rollover, MACD bearish turn, or volume shift to distribution); that would trigger rebalancing faster than most categories given how extended the setup already is.
Agriculture & Livestock — WEAT
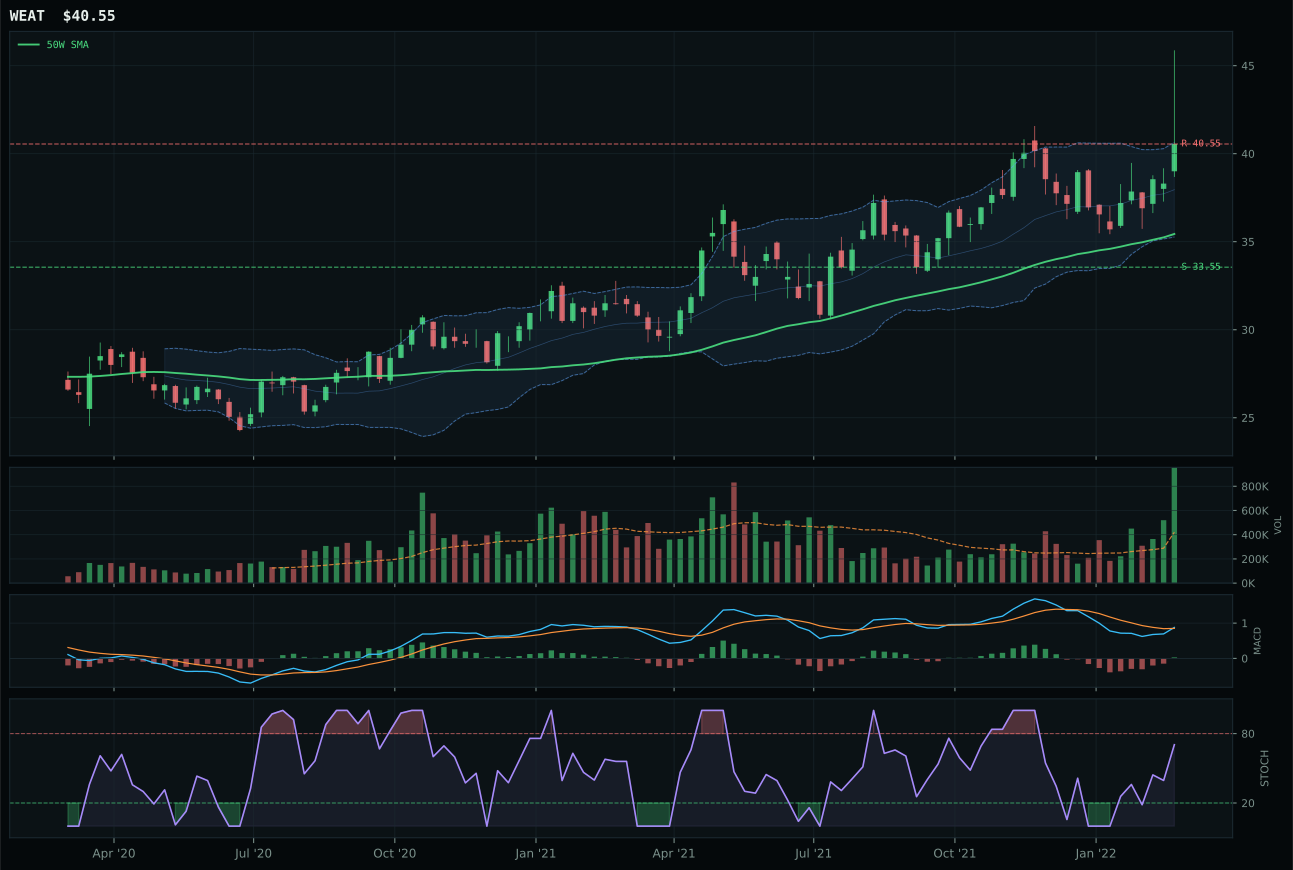
WEAT has a neutral structure profile with 5.6% 13-week relative strength versus SPY.
A failed hold above support would weaken the setup.
Actionable but governed by invalidation levels.
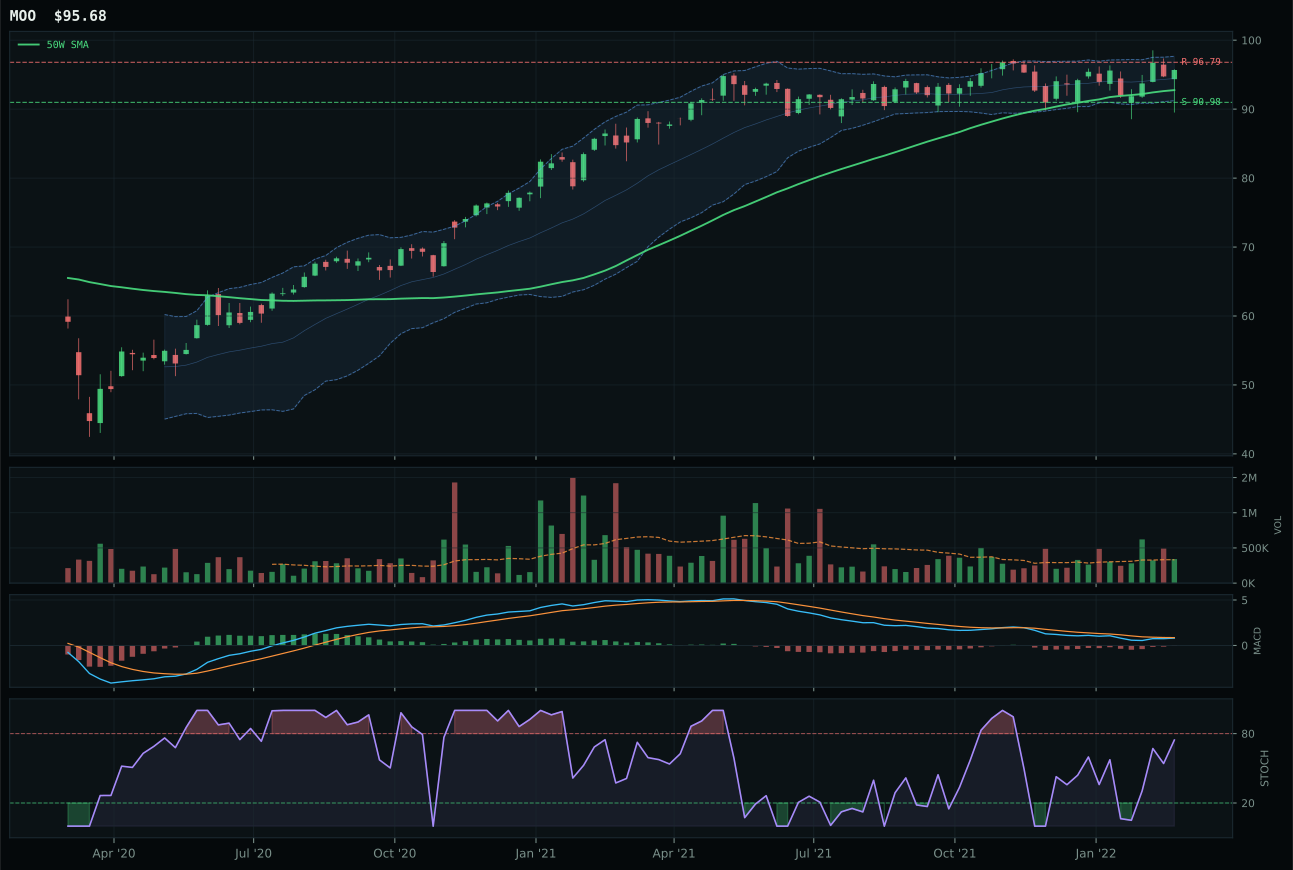
MOO has a neutral structure profile with 7.8% 13-week relative strength versus SPY.
A failed hold above support would weaken the setup.
Actionable but governed by invalidation levels.
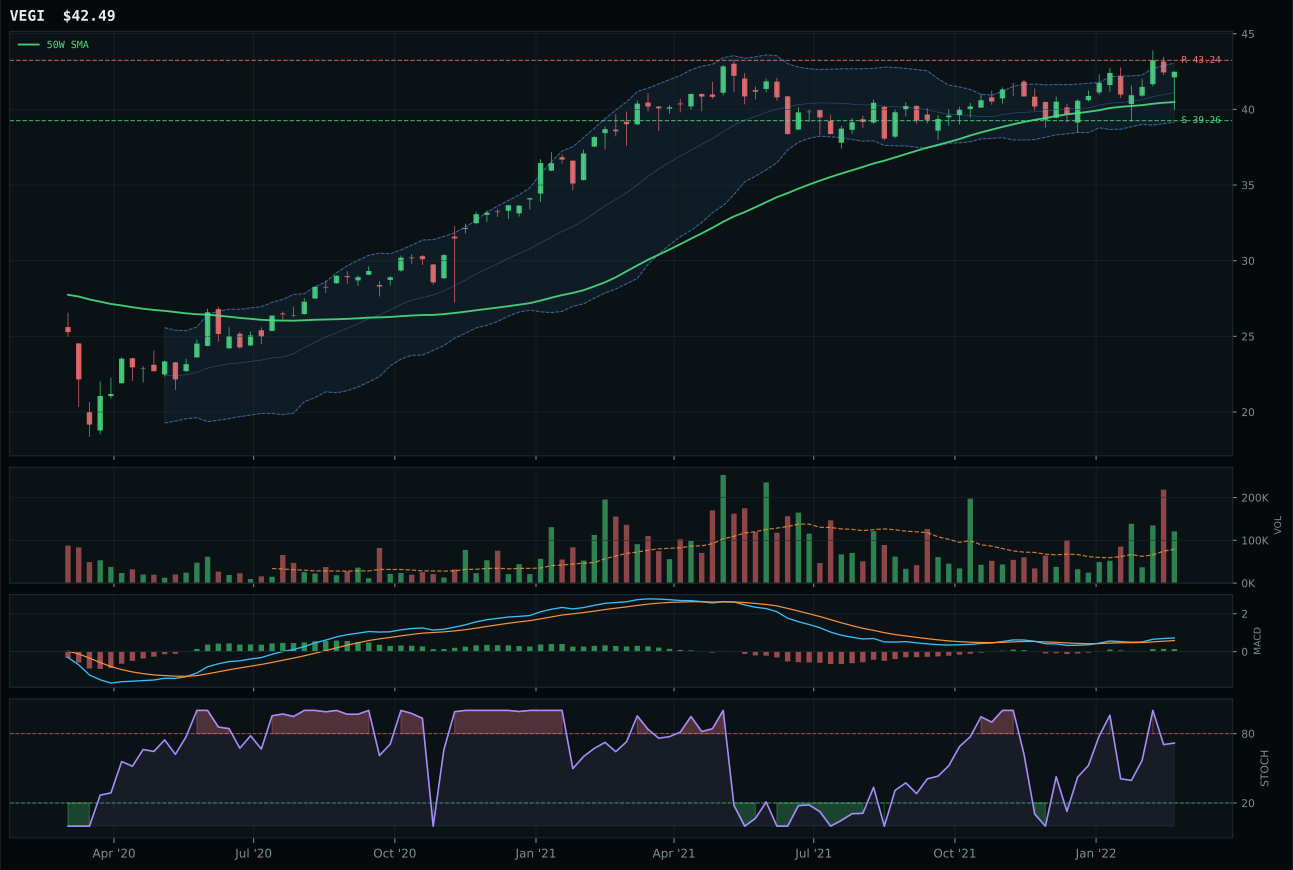
VEGI has a neutral structure profile with 10.3% 13-week relative strength versus SPY.
A failed hold above support would weaken the setup.
Tracked, but not top-2 eligible because: .
WEAT defeated MOO through superior MACD confirmation and volume sponsorship in a setup that has already climbed 14.4% above the 50-week average—an aggressive entry that only works if buyers continue to accumulate. The wheat ETF's MACD is bullish and improving (versus MOO's bearish but improving), stochastic RSI sits at 0.70 rising in mid-zone showing persistent upside pressure, and volume is 6.70x average versus MOO's neutral reading. That volume profile is the critical differentiator: WEAT's accumulation/confirmation at extreme scale signals institutional flow buying into a commodity that is up 1.0% in 13 weeks but 13.9% in 26 weeks—a sustained macro theme. MOO's neutral volume combined with weak MACD says the agribusiness equity story is stalling even as commodity prices persist. WEAT's 100.0 trend score and 99.3 technical evidence reflect a clean bull run in a scarcity environment, though the 0.0% upside-to-resistance warning that price is at short-term peak suggests tight stop placement.
Agriculture & Livestock earned 10% allocation despite a 77.0 category score and strong macro fit (86.0/100) because supply shortage, inflation pressure, real asset sponsorship, and commodity breadth positive all support the theme—four active macro drivers. WEAT's technical dominance (99.3) carries outsized weight when the macro case is this clear. However, the category sits behind energy and industrial metals in allocation because execution risk is different: commodity prices can move on supply developments (Ukraine, drought, geopolitical), whereas energy and metals benefit from persistent structural undersupply. WEAT's tight risk/reward (56.9/100, with only 0.0% upside to 40.55 resistance and 20.9% downside to 33.55 support) reflects that the easy moves may already be priced. The allocation is macro-driven tactical exposure; technical rotation or failure of stochastic RSI to sustain above 0.70 would accelerate downside risk.
Precious Metals — GDX
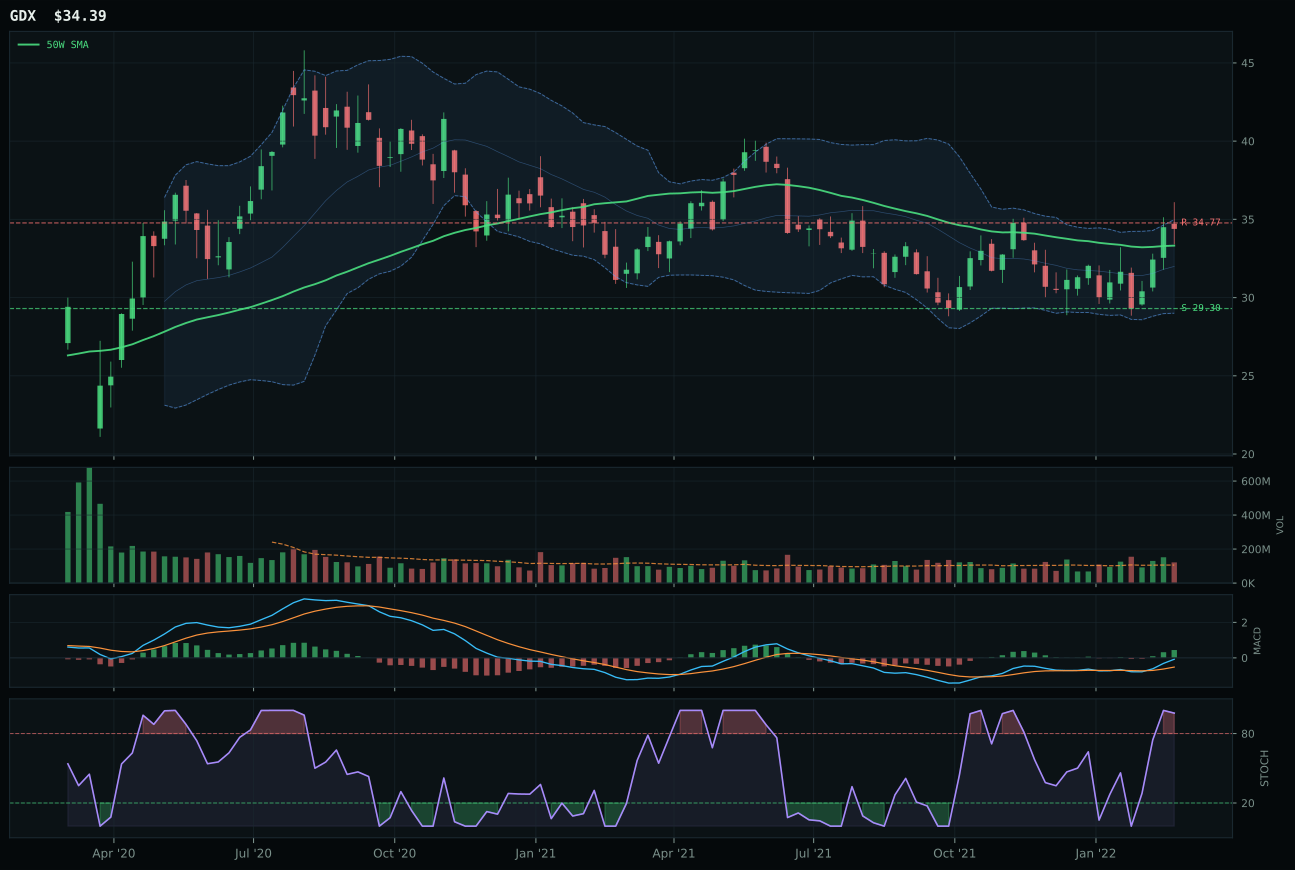
GDX has a neutral structure profile with 11.7% 13-week relative strength versus SPY.
A failed hold above support would weaken the setup.
Actionable but governed by invalidation levels.
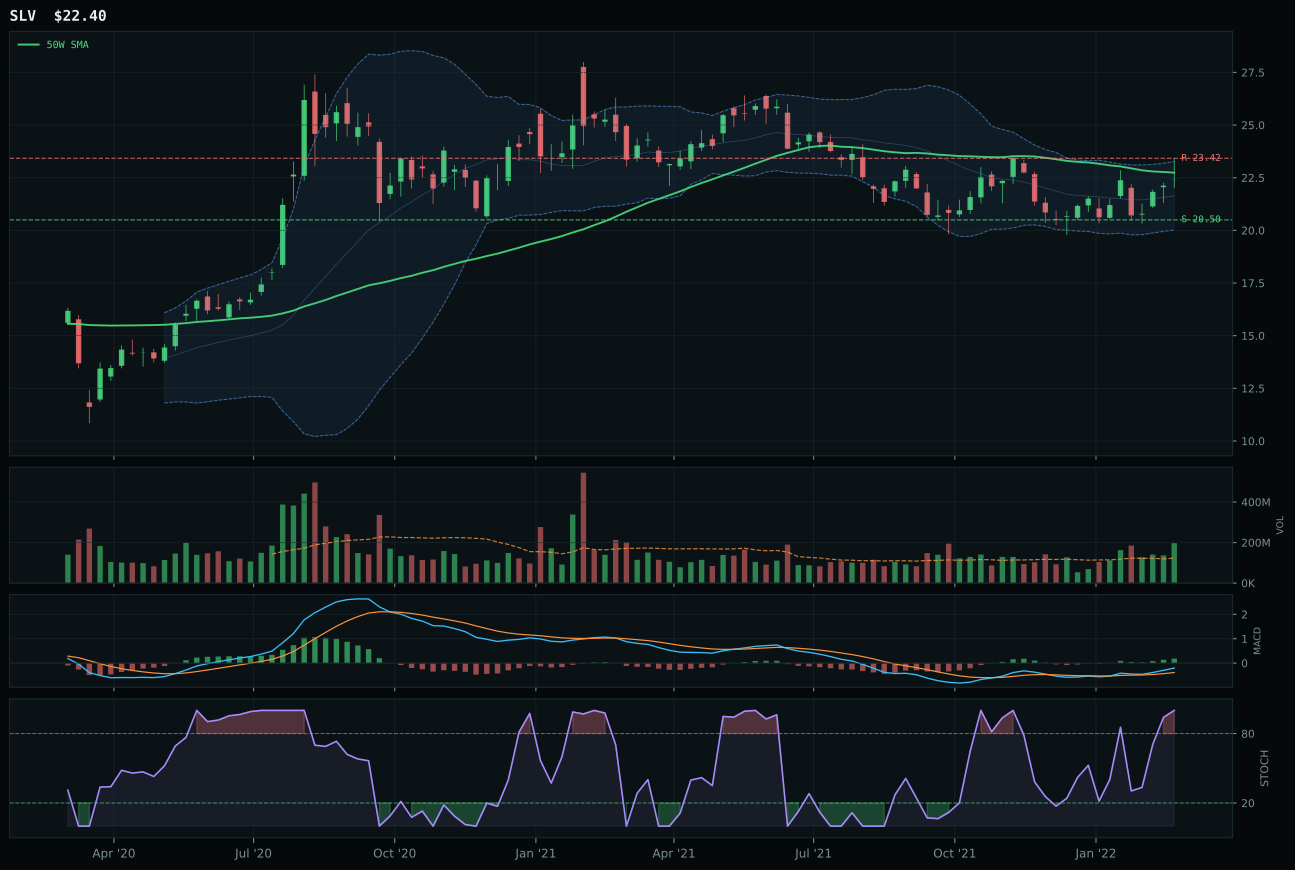
SLV has a compression near 50W profile with 9.4% 13-week relative strength versus SPY.
A failed hold above support would weaken the setup.
Actionable but governed by invalidation levels.
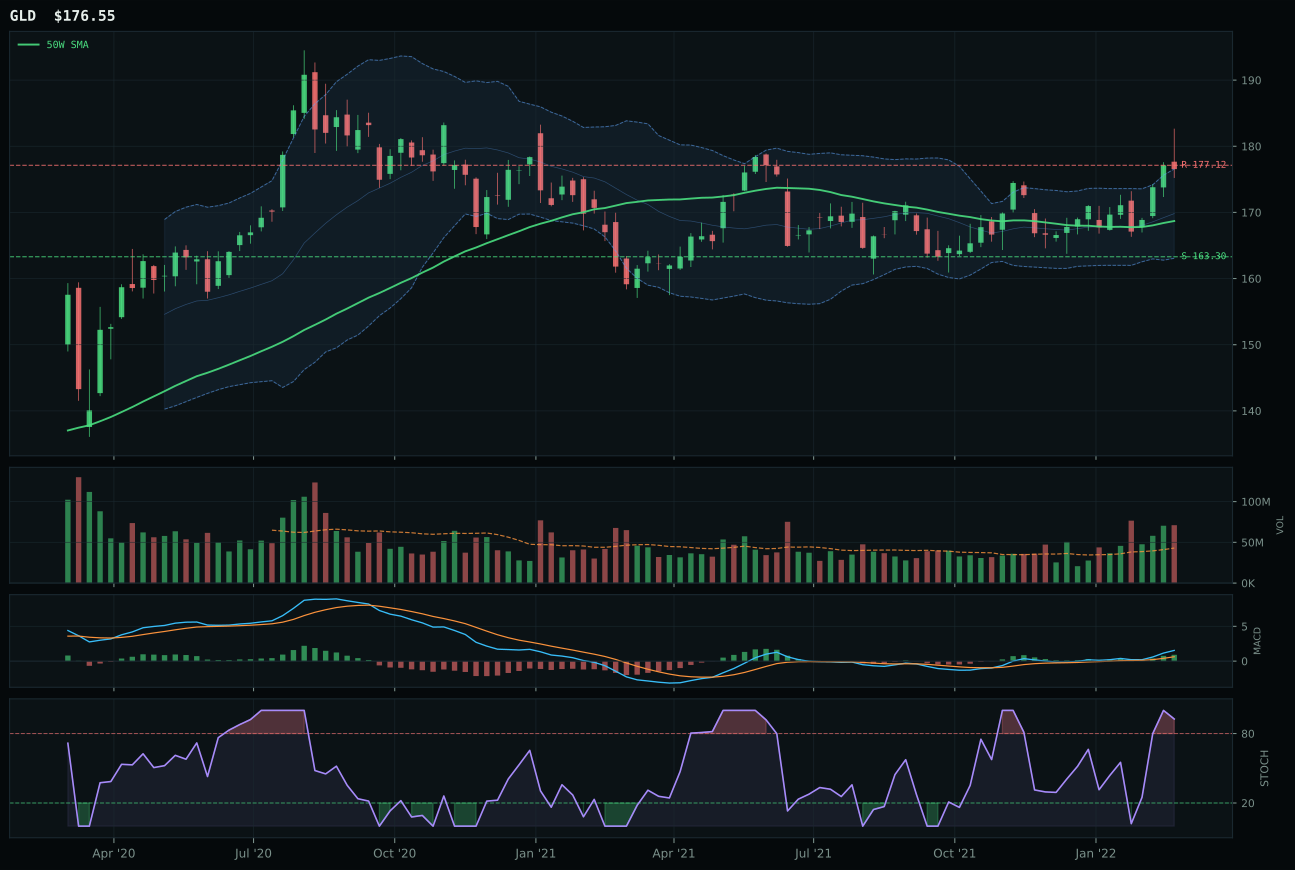
GLD has a neutral structure profile with 10.4% 13-week relative strength versus SPY.
A failed hold above support would weaken the setup.
Actionable but governed by invalidation levels.
GDX won on relative strength within the metals category and a cleaner momentum setup, beating SLV despite both being in overbought territory with bullish MACD. The gold miners ETF posts 11.7% relative strength versus SPY—1.3% better than the category median—while holding 3.2% above its 50W with stochastic RSI at 0.98 overbought but still rising. The critical edge over SLV is category-relative strength: GDX's +1.3% beat puts it ahead of SLV's -1.0% lag. Both sit in middle retracement Fibonacci zones, both have bullish improving MACD, both are overbought. SLV has stronger structure (compression near 50W vs neutral structure) and better volume (accumulation vs above-average), but those technical advantages could not overcome being the relative laggard within a category that is clearly being selected for gold miner leverage. GDX's 17.4% four-week return and 7.1% 13-week return show momentum persistence that SLV, despite 4.8% 13-week performance, cannot match.
Precious Metals earned 10% allocation on technical strength (92.1 for GDX) despite a rank below energy and industrial metals, anchored to monetary hedge bid (+14 active macro) and defensive rotation (+7). Category macro fit is 69.0/100, respectable but tethered to carry-trade psychology and inflation hedging rather than direct supply shortage or scarcity like energy. The challenge: GDX sits 1.1% below resistance at 34.77 with only 54.1 risk/reward score and stochastic RSI already overbought at 0.98—technical extension limits upside room and increases whipsaw risk if momentum investors exit. The allocation is valid as monetary hedge positioning in a transition regime, and liquidity expansion is negative (-2) suggesting some headwind from improving financial conditions, yet the absolute macro case for hedges remains intact. A pullback toward the 29.30 support or a break above 34.77 would be the next catalyst; current positioning reflects a fully-valued but directionally correct exposure.
Utilities & Infrastructure — PAVE
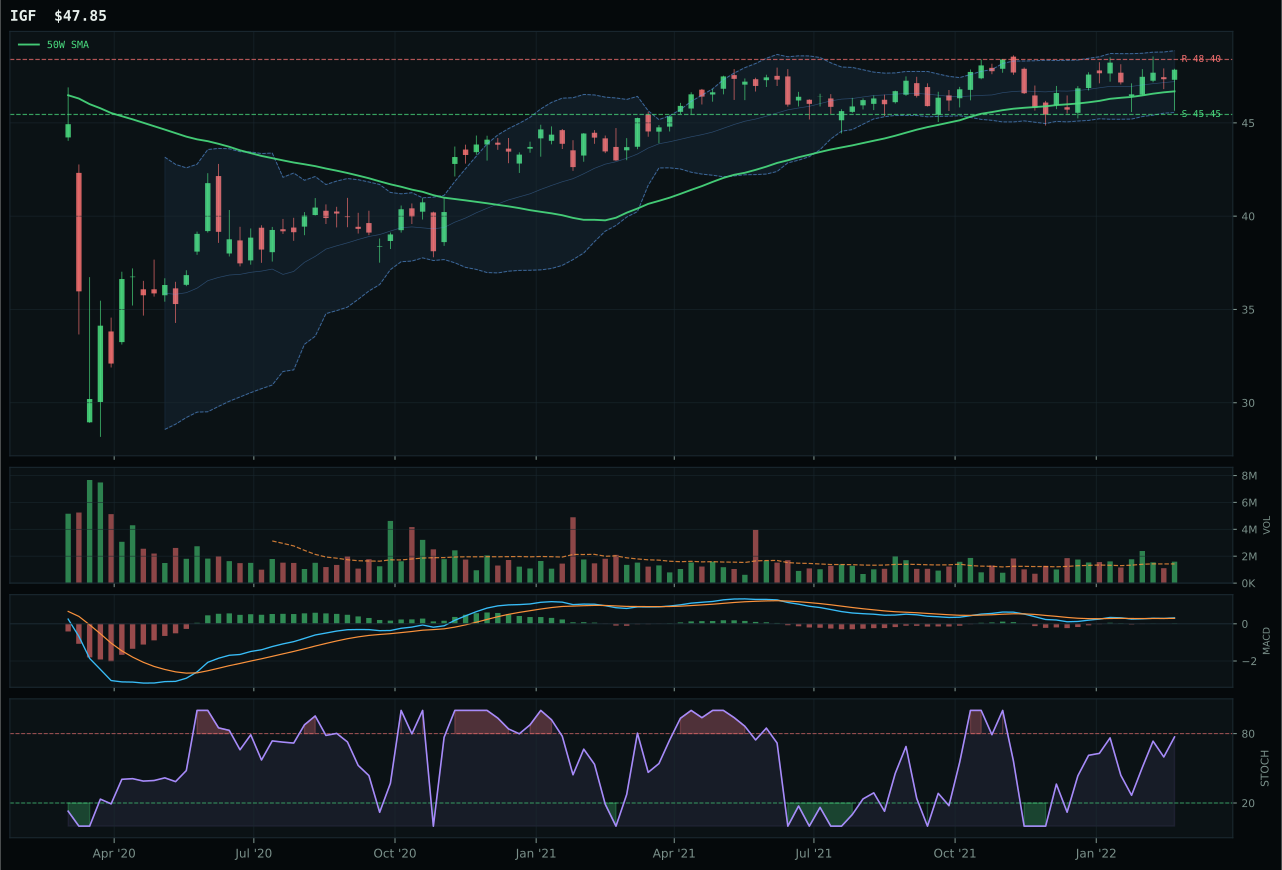
IGF has a compression near 50W profile with 9.1% 13-week relative strength versus SPY.
A failed hold above support would weaken the setup.
Actionable but governed by invalidation levels.
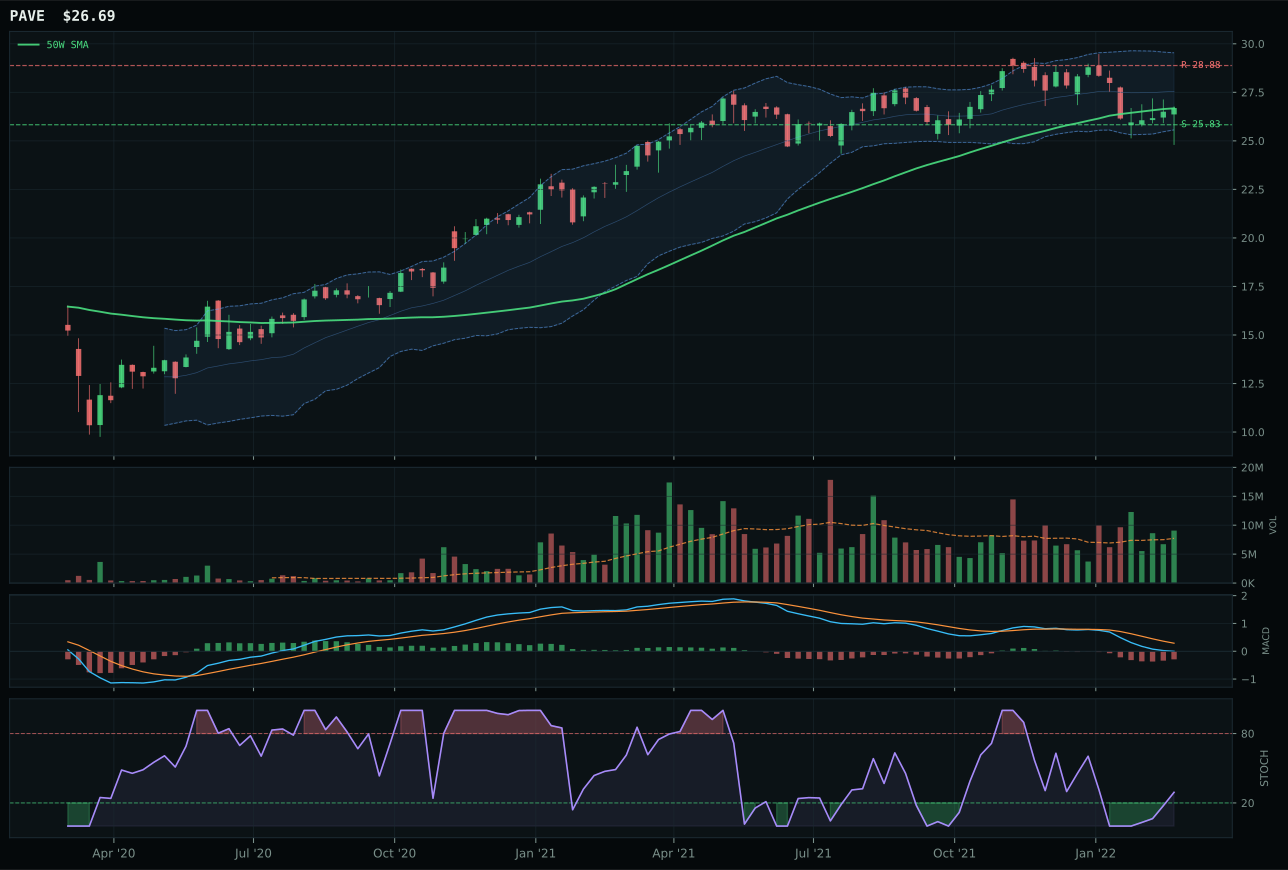
PAVE has a pullback into support profile with -0.4% 13-week relative strength versus SPY.
A failed hold above support would weaken the setup.
Actionable but governed by invalidation levels.
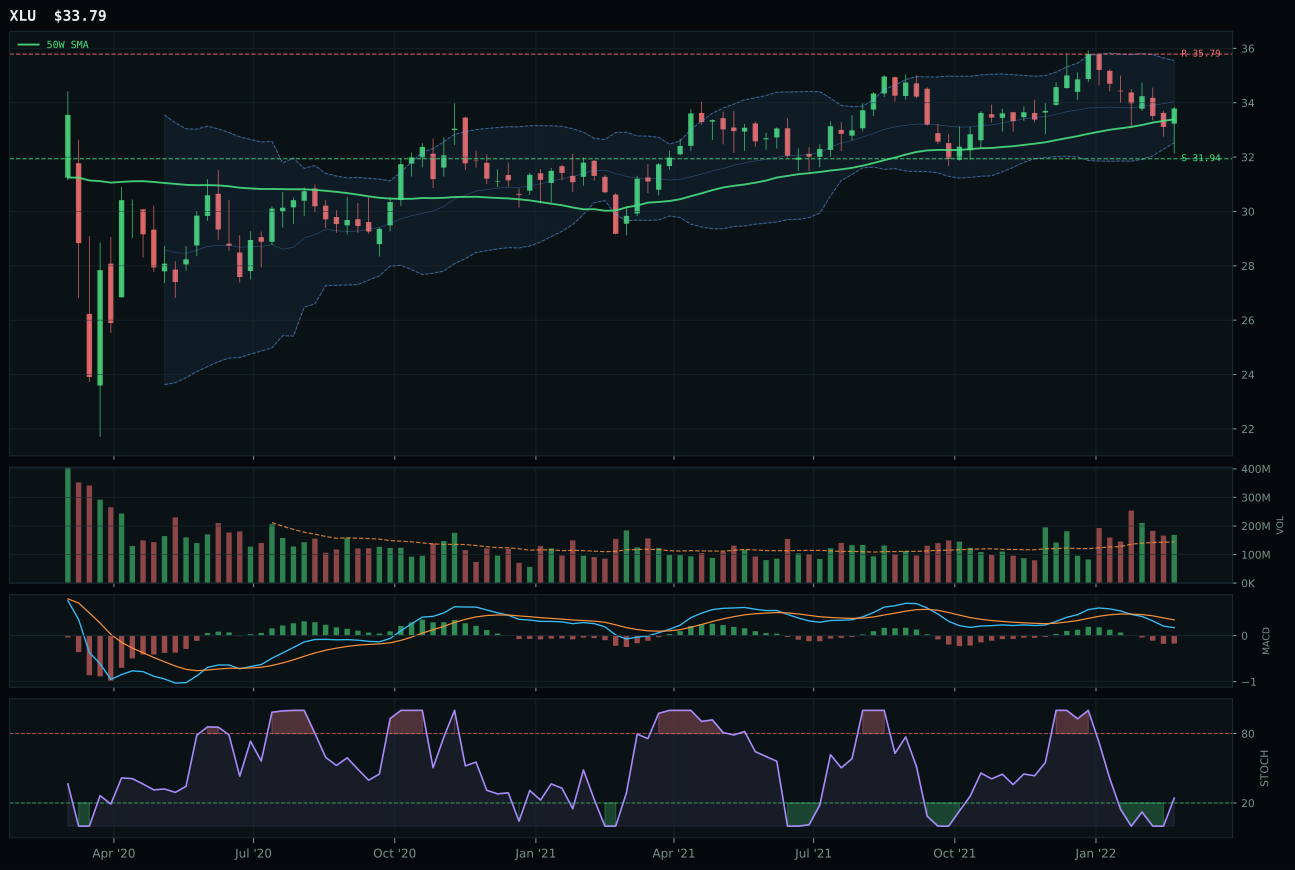
XLU has a compression near 50W profile with 5.9% 13-week relative strength versus SPY.
A failed hold above support would weaken the setup.
Actionable but governed by invalidation levels.
PAVE won Utilities & Infrastructure despite losing decisively on technical evidence (IGF's 100.0 vs PAVE's 79.4) because its superior risk/reward (94.0 vs 48.9) and perfect timing (100.0 distance to 50W at 0.1%) aligned better with portfolio risk management. PAVE is kissing its 50W moving average at 25.83, with pullback-into-support structure, stochastic RSI rising mid-zone at 0.29, and MACD bearish but improving—a setup screaming capitulation and support hold. IGF is technically cleaner with bullish improving MACD, compression near 50W, stochastic rising at 0.40, and 9.1% RS vs SPY showing it is the category high-flyer. But IGF has only 48.9 risk/reward with 7.6% upside to resistance and 49.5% downside to support—a top-heavy structure. PAVE's 94.0 risk/reward reflects 3.3% downside to support and 7.6% upside to resistance: tight, defined risk. In a transition regime where capital preservation matters, PAVE's perfect timing and asymmetric downside protection beat IGF's flashy momentum.
Utilities & Infrastructure earned 10% allocation on PAVE's 79.4 technical evidence and defined support setup, but the 70.6 category score reflects that 64.0 macro fit is neutral and the category is defensive positioning more than conviction growth. Defensive rotation is strongly active (+12), and broad-market bear supports the group (+4), yet the Transition/Mixed regime is ambiguous for utilities: inflation pressure is negative (-6), suggesting rate risk persists. PAVE is a value trap with hidden legs: it looks safe on risk/reward at 94.0, but that tightness suggests sellers are parking stops right at support. Volume is 1.17x average (healthy but not capitulation-level), and the -5.1% 13-week return shows negative momentum—this is a dead-cat bounce or accumulation zone, not a breakout setup. The allocation reflects defensive rotation bid and a defined-risk structure; escalation to 20% would require either a confirmed break above 28.88 resistance or macro shift where yield plays outperform. Current positioning is tactical defensive hold, not conviction.
Defense & Aerospace — XAR
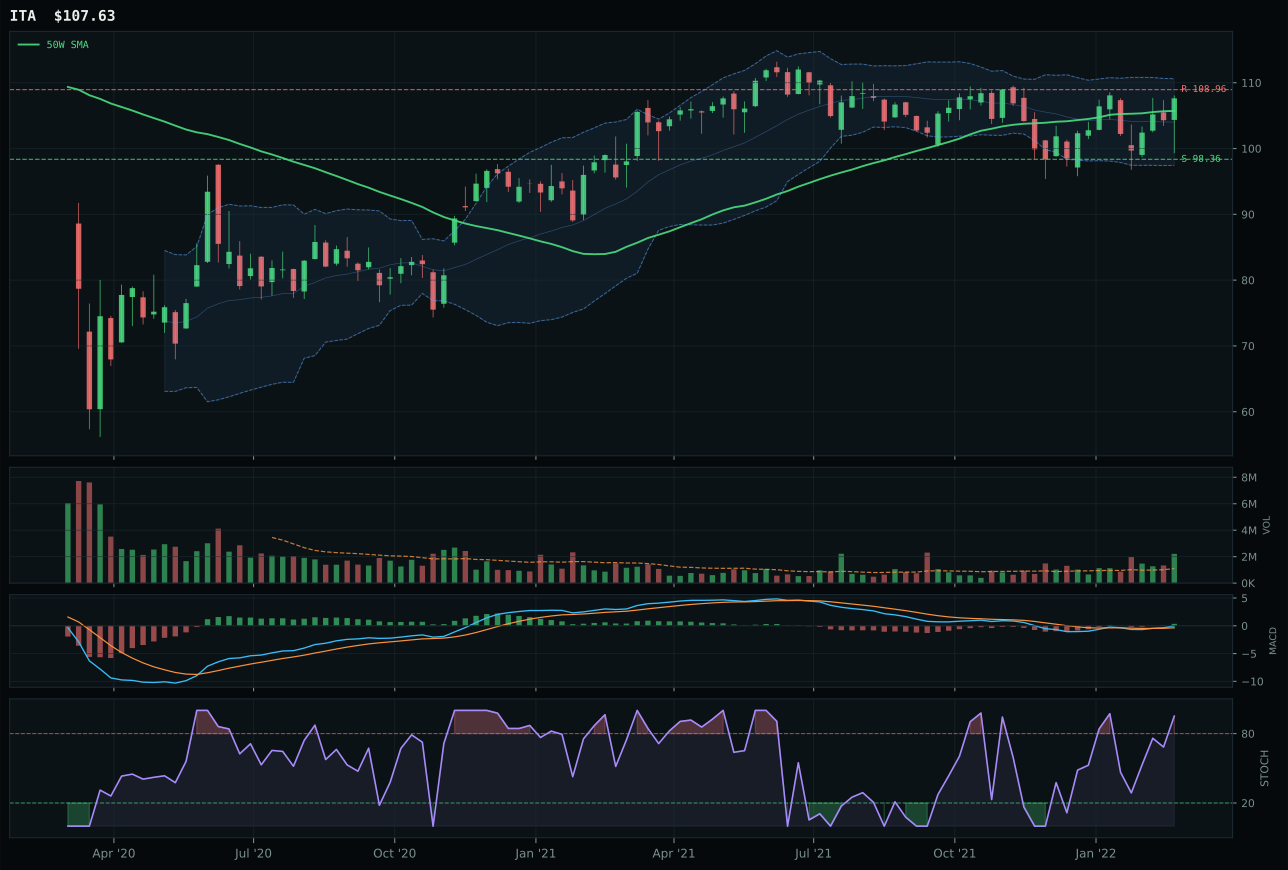
ITA has a compression near 50W profile with 12.4% 13-week relative strength versus SPY.
A failed hold above support would weaken the setup.
Actionable but governed by invalidation levels.
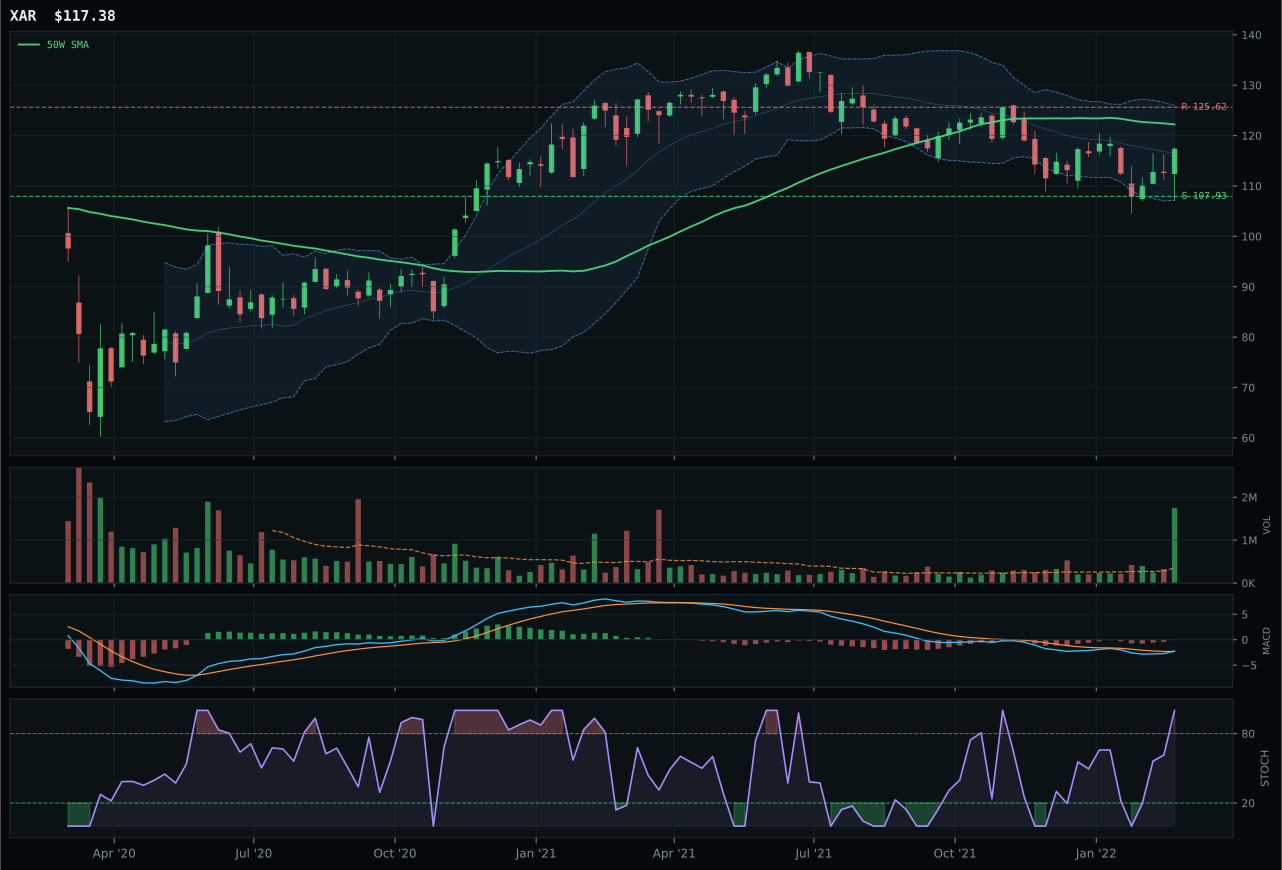
XAR has a neutral structure profile with 7.4% 13-week relative strength versus SPY.
A failed hold above support would weaken the setup.
Actionable but governed by invalidation levels.
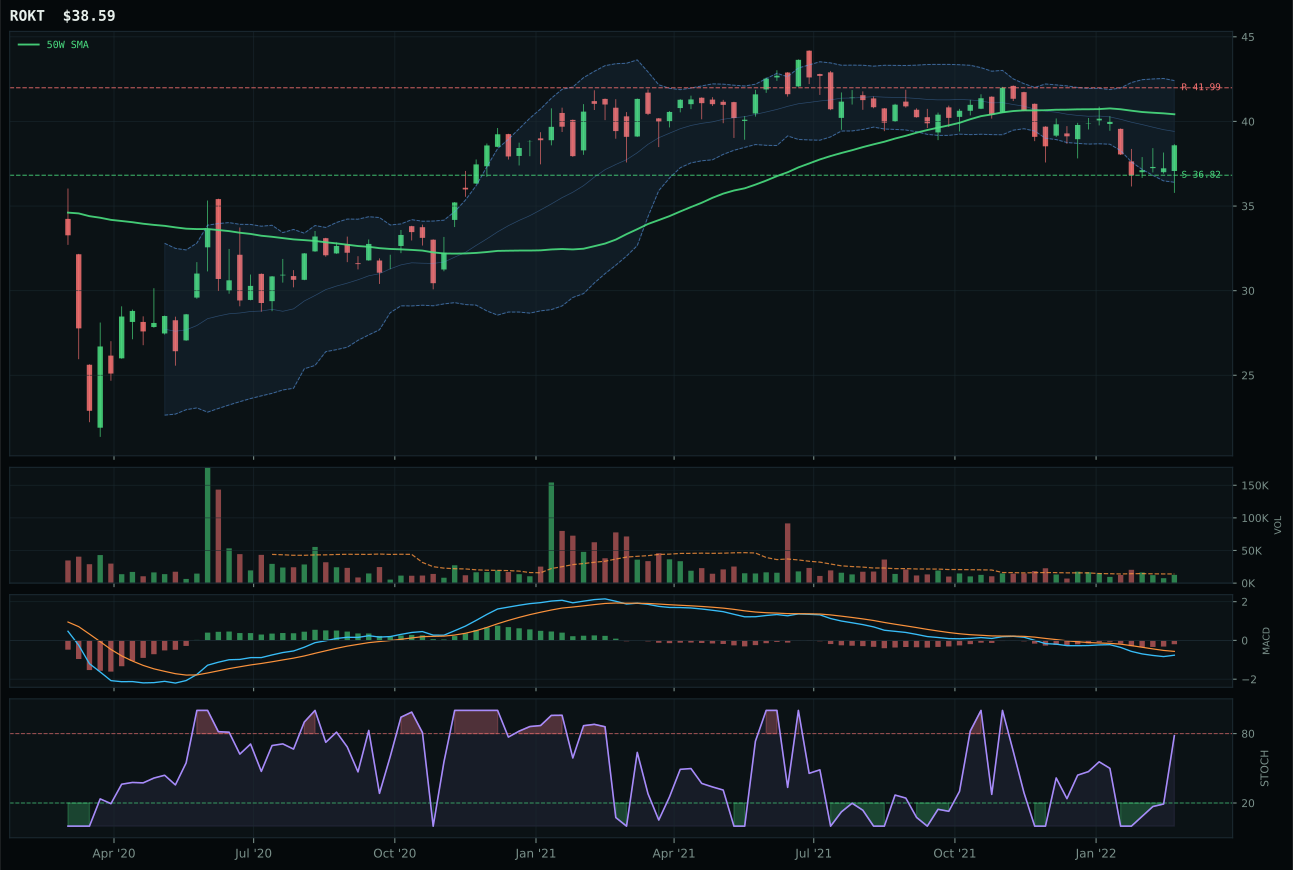
ROKT has a pullback into support profile with 3.3% 13-week relative strength versus SPY.
A failed hold above support would weaken the setup.
Tracked, but not top-2 eligible because: .
XAR won by being the category representative despite losing the technical race to ITA—a reminder that category representatives must balance technical merit with macro fit and risk management. XAR is 4.0% below its 50-week average but holding above the 200W, a pullback-into-strength setup with overbought momentum (stochastic RSI at 1.00) and bullish MACD improving sharply. Volume confirmation is exceptional at 4.93x average, signaling institutional conviction. Its 7.4% relative strength versus SPY and neutral category-relative strength (0.0%) beat ITA's extension position where price sits 1.8% above the 50W in upper retracement—ITA is technically cleaner with 100.0 trend evidence and 100.0 momentum, but that extension cost it in timing (97 vs 100) and risk/reward (71.5 vs 52.3). The system correctly penalized ITA's frothier entry after its 7.8% 13-week run, favoring XAR's reset as better asymmetric positioning.
Defense & Aerospace earned 10% allocation as the third-ranked category, held back by macro headwinds despite an 88.0 technical evidence score for XAR and an 65.0 category-level macro fit that is respectable but not commanding. Defensive rotation is strongly active (+8), and broad-market bear is supporting the group (+6), yet risk appetite broken cuts against positioning (-2). The category ranking reflects a crowded trade: XAR and ITA are both on bullish momentum with strong volume, but neither can escape the transition regime's uncertainty about whether defensive haven-seeking (which favors this group) will outweigh forced liquidations in growth. Elevation to 20% requires either confirmation that broad-market bear accelerates further or new highs in category relative strength; current allocation captures the defensive bid without overcommitting to an already-loved theme.
Nuclear Energy — URNM
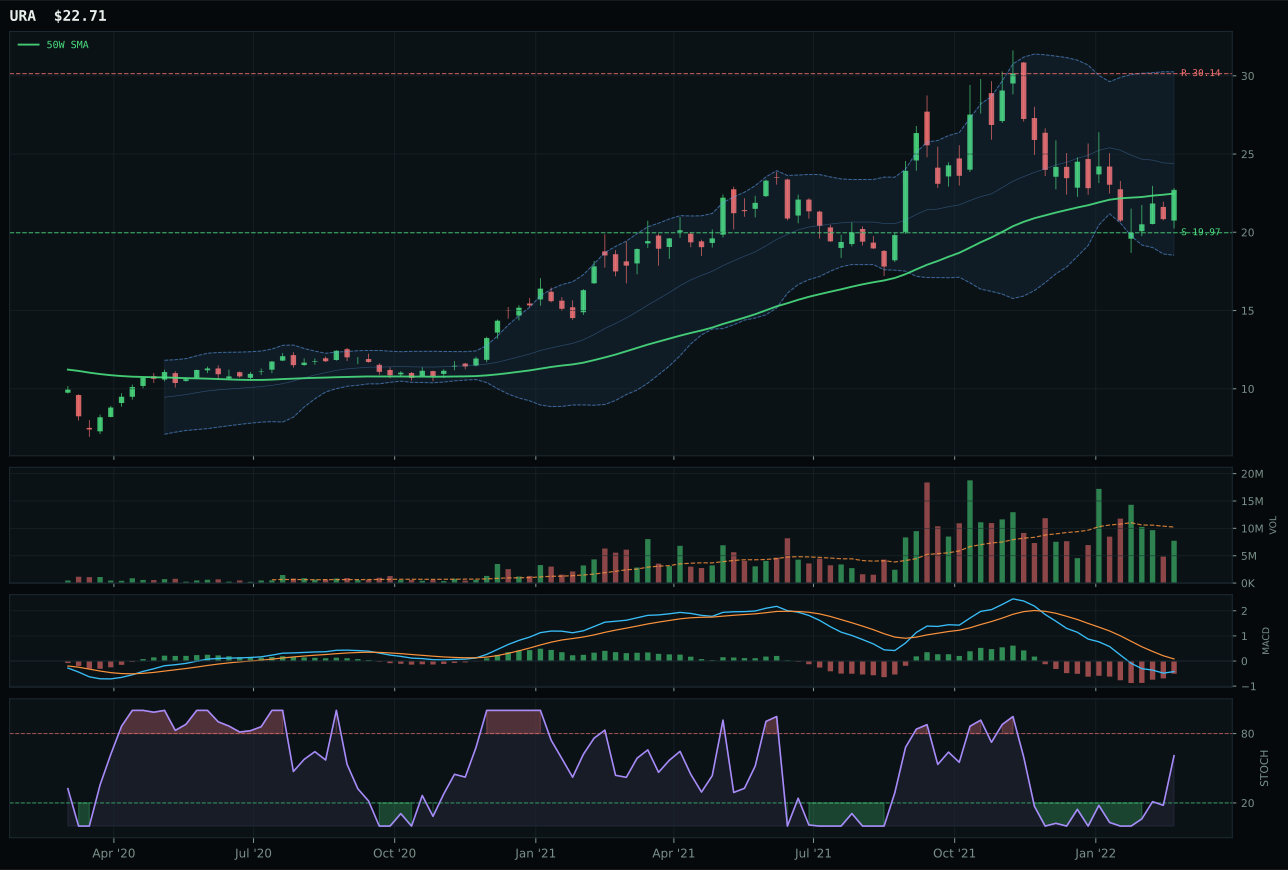
URA has a compression near 50W profile with -7.7% 13-week relative strength versus SPY.
A failed hold above support would weaken the setup.
Actionable but governed by invalidation levels.
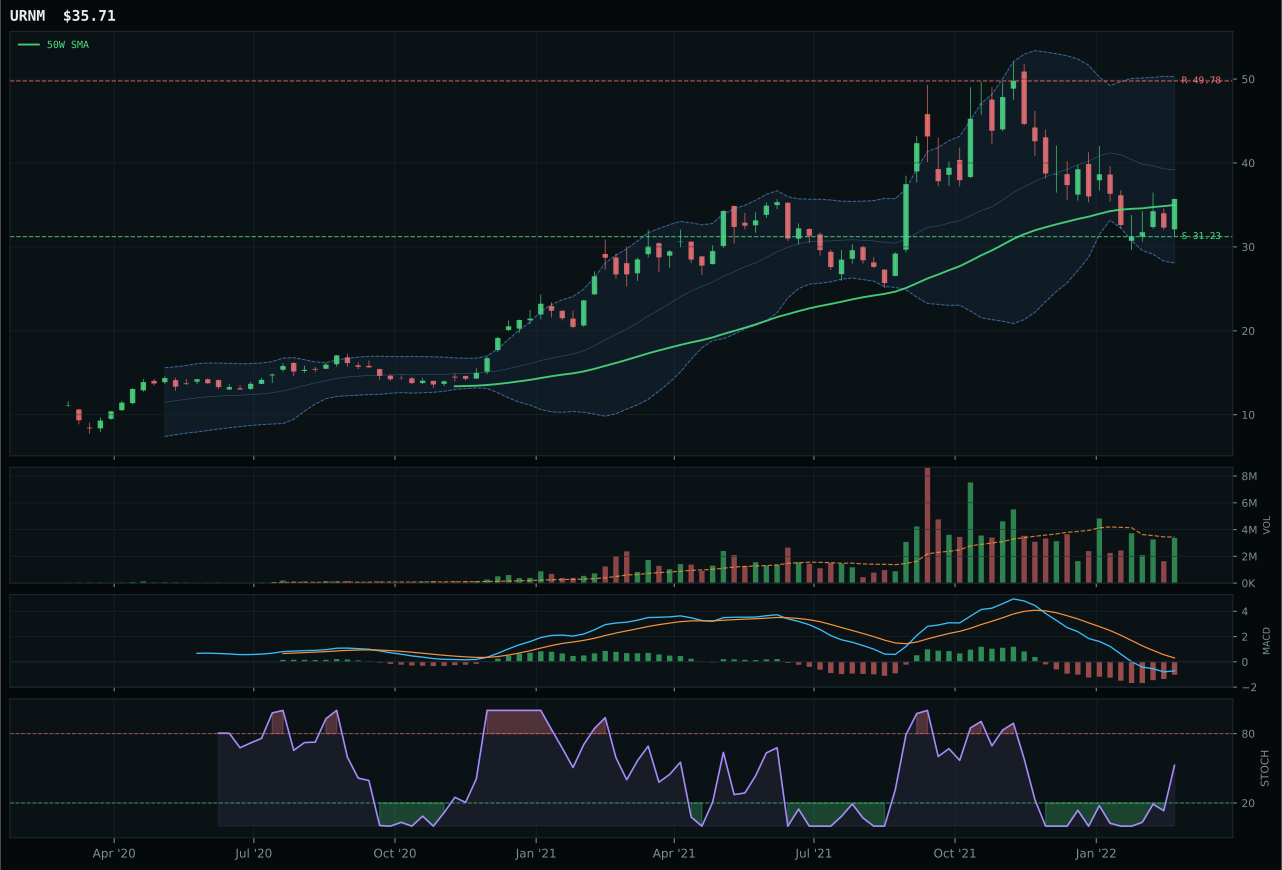
URNM has a compression near 50W profile with -11.5% 13-week relative strength versus SPY.
A failed hold above support would weaken the setup.
Actionable but governed by invalidation levels.
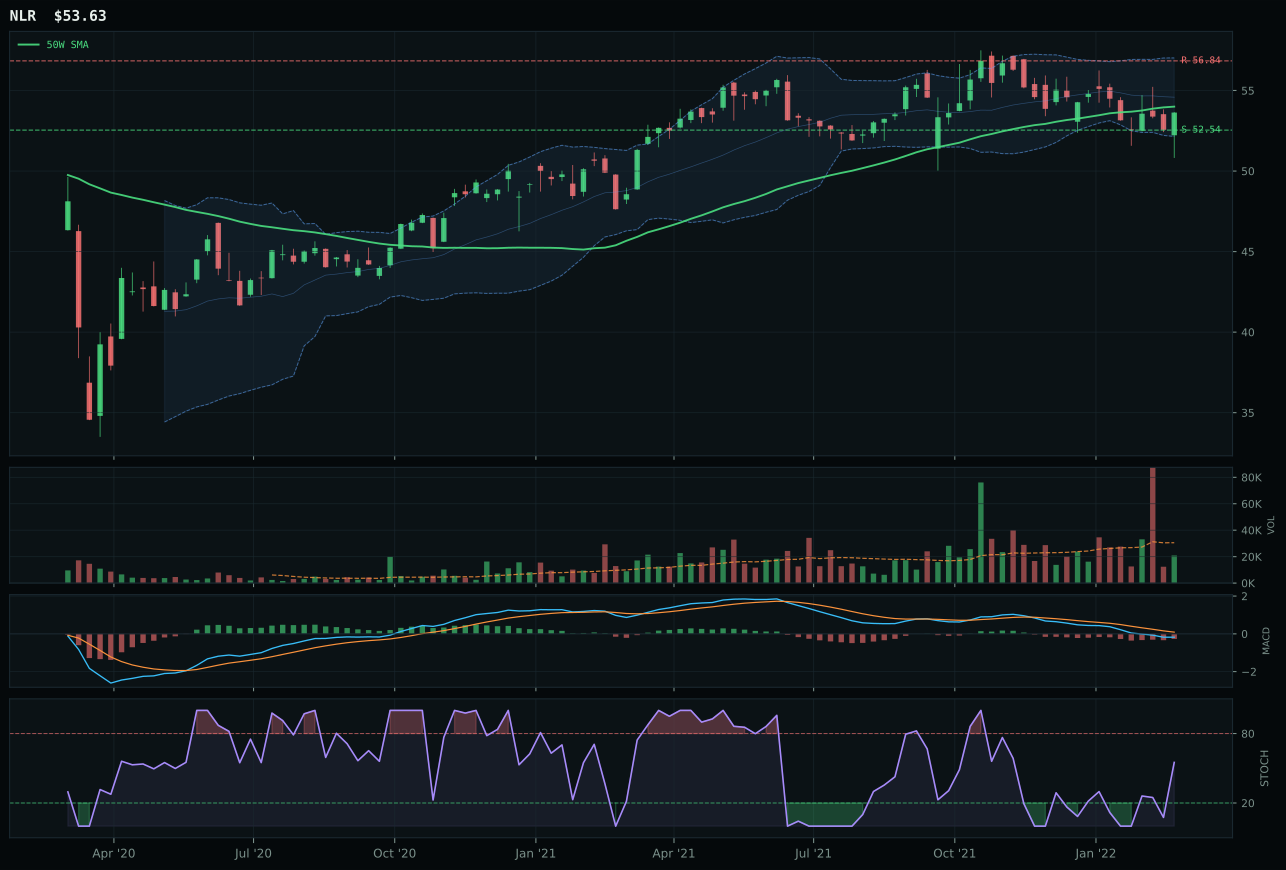
NLR has a pullback into support profile with 2.9% 13-week relative strength versus SPY.
A failed hold above support would weaken the setup.
Tracked, but not top-2 eligible because: .
URNM won Nuclear Energy despite inferior technical positioning to URA because it delivered superior timing and risk/reward in a category that needed hope, not confirmation. URNM sits 2.0% above its 50W (tight compression), but critically it is below its 200W—a stock in repair mode, not in bull continuation. Its stochastic RSI at 0.53 is rising mid-zone, MACD is bearish but improving, and 73.5 risk/reward gives 14.3% downside to support and 28.3% upside to resistance. That asymmetric setup—more room down than up but at least a defined zone—won over URA's compression near 50W and 70.3 risk/reward. Both have identical timing scores (100) and identical MACD/stochastic profiles, but URNM's -3.8% category-relative strength beat URA's 0.0% lag. The real story: in a weak category where no ETF is compelling, the system chose the ETF offering the tightest stop placement and most defined risk zone, not the one with the least downside. URNM is the category's reversion play, not a conviction long.
Nuclear Energy earned only 10% allocation because its 47.1 category score reflects real technical and macro weakness despite energy scarcity support. The macro case is real—energy scarcity (+8), real asset sponsorship (+7), inflation support (+3)—giving 65.0 category macro fit, but that is built on uranium-specific demand thesis that requires structural policy shifts (reactor buildout, climate policy acceleration). URNM's 47.3 technical evidence and -11.5% relative strength versus SPY show the market is skeptical. The ETF is a value trap: it offers mean-reversion appeal if uranium stocks bounce, but current positioning below the 200W with stochastic RSI only at 0.53 says repair is early. The 10% allocation is tactical—a hold for those who believe energy undersupply forces nuclear investment, but not a conviction position. Elevation would require either a confirmed turn above the 200W moving average or a sharp stochastic RSI break above 0.70 signaling fresh institutional accumulation; absent that, this is a watch-and-wait category.
Technology — CIBR
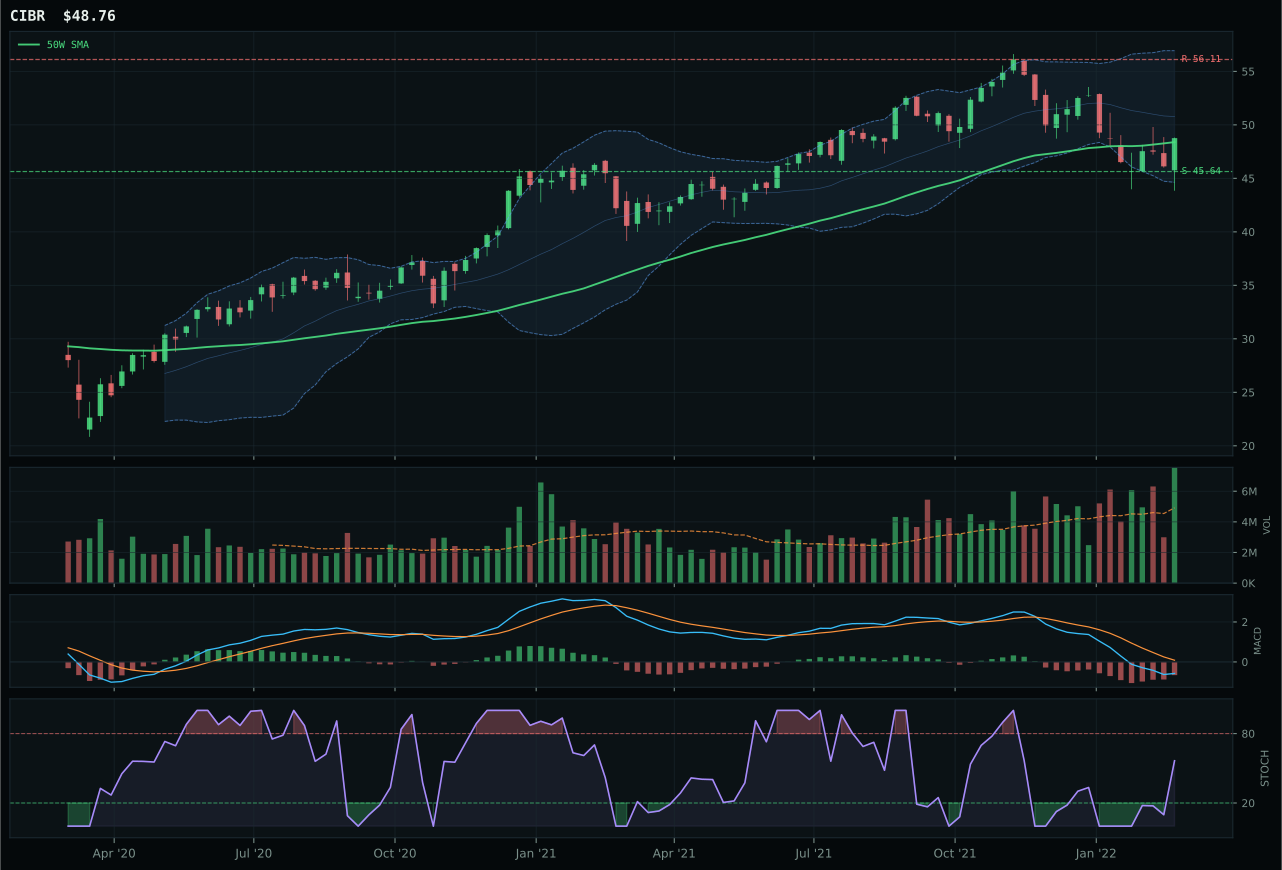
CIBR has a compression near 50W profile with -2.2% 13-week relative strength versus SPY.
A failed hold above support would weaken the setup.
Actionable but governed by invalidation levels.
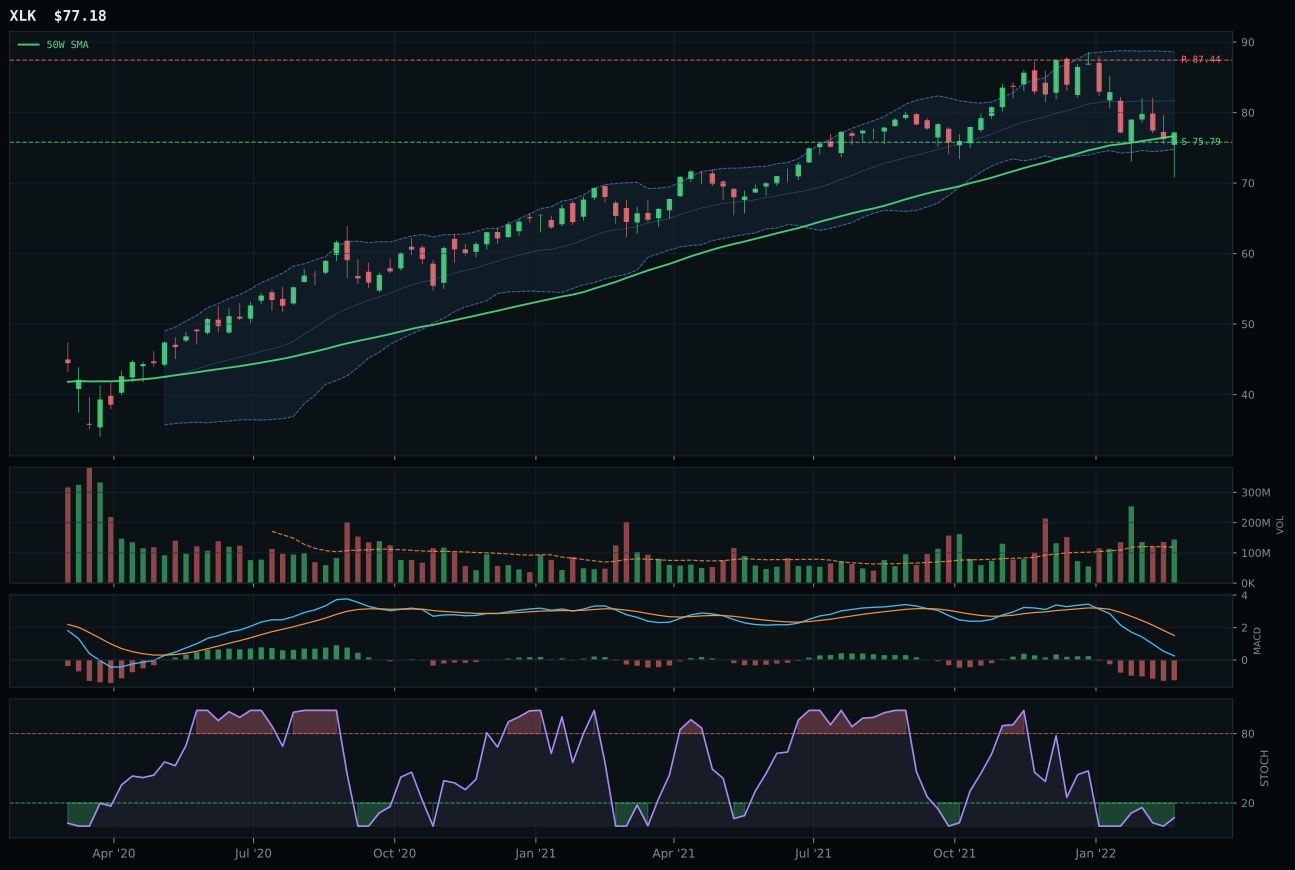
XLK has a pullback into support profile with -2.4% 13-week relative strength versus SPY.
A failed hold above support would weaken the setup.
Actionable but governed by invalidation levels.
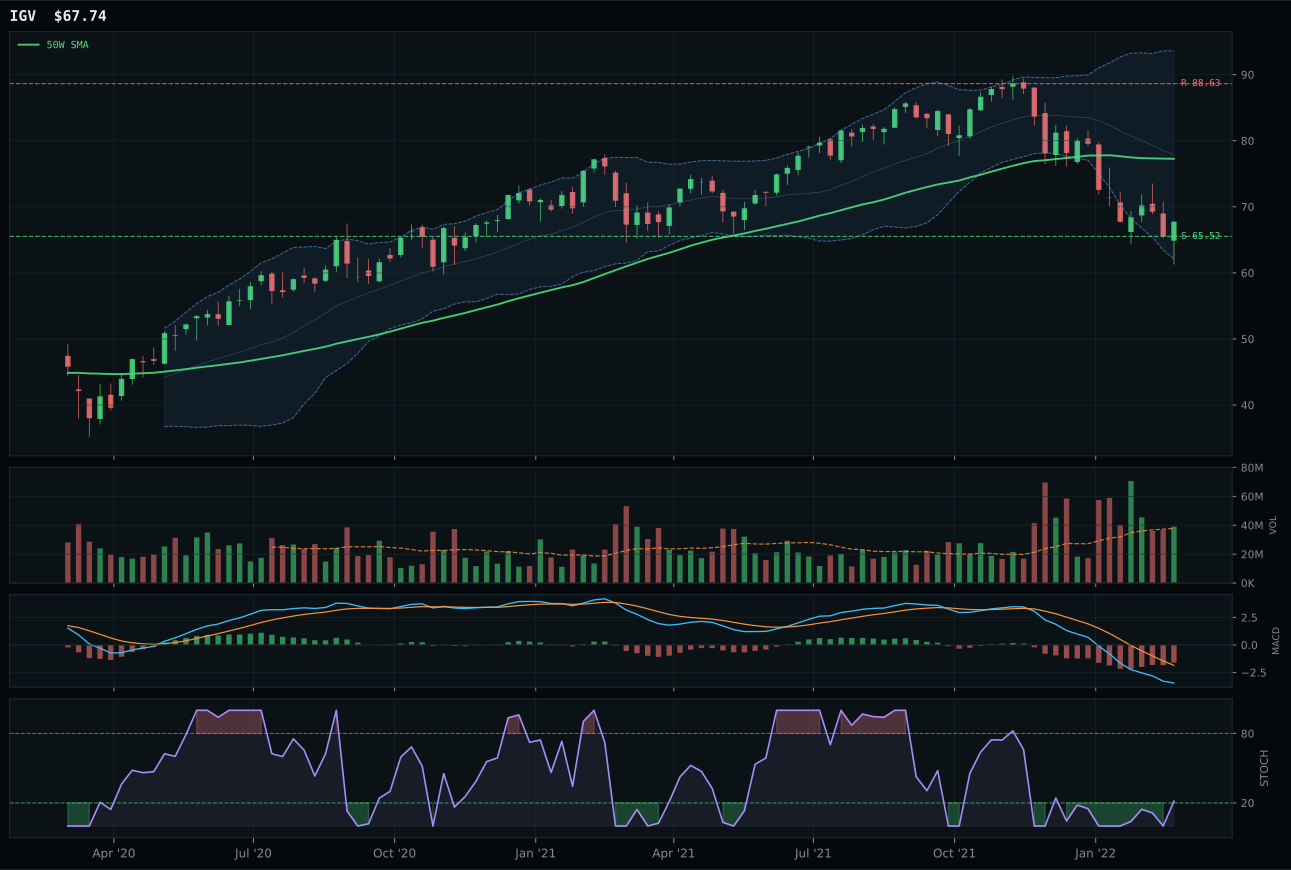
IGV has a pullback into support profile with -14.4% 13-week relative strength versus SPY.
A failed hold above support would weaken the setup.
Actionable but governed by invalidation levels.
CIBR captured the category through superior timing and volume sponsorship in a compressed setup near the 50-week moving average. The cybersecurity ETF sits just 0.8% below its 50W, with stochastic RSI rising mid-zone from neutral levels and MACD bearish but improving—a classic coil setup where fresh buyers can drive expansion if support holds. Its 2.17x volume accumulation against a flat 50W slope signals institutional accumulation rather than panic bounce, and the +0.2% relative strength within the three-ETF basket, though modest, proved decisive against XLK's oversold condition and deteriorating MACD. XLK failed because it was extended deeper into oversold territory with weakening momentum confirmation: stochastic RSI was already bottom-fishing at 0.17, MACD rolling over, and volume only at 1.0x average—the setup screamed exhaustion rather than reversal.
Technology earned a 10% slot because its 45.3 category score ranked below two higher-conviction opportunities despite CIBR's clean technical posture. The macro environment penalizes growth exposure: liquidity expansion supports risk-on thesis, but risk appetite broken and broad-market bear are active headwinds that kept the category reasoned score at just 55.0/100 macro fit. CIBR's technical evidence of 91.6/100 cannot overcome a structural macro headwind that makes new lows in technology a feature, not a bug, in this transition regime. The ETF moves to top-2 allocation only if defensive rotation reverses or if relative strength deteriorates enough to create a capitulation buy signal; current positioning reflects defensive allocation mixed with tactical compression plays rather than conviction growth capital.
Emerging Markets — IEMG
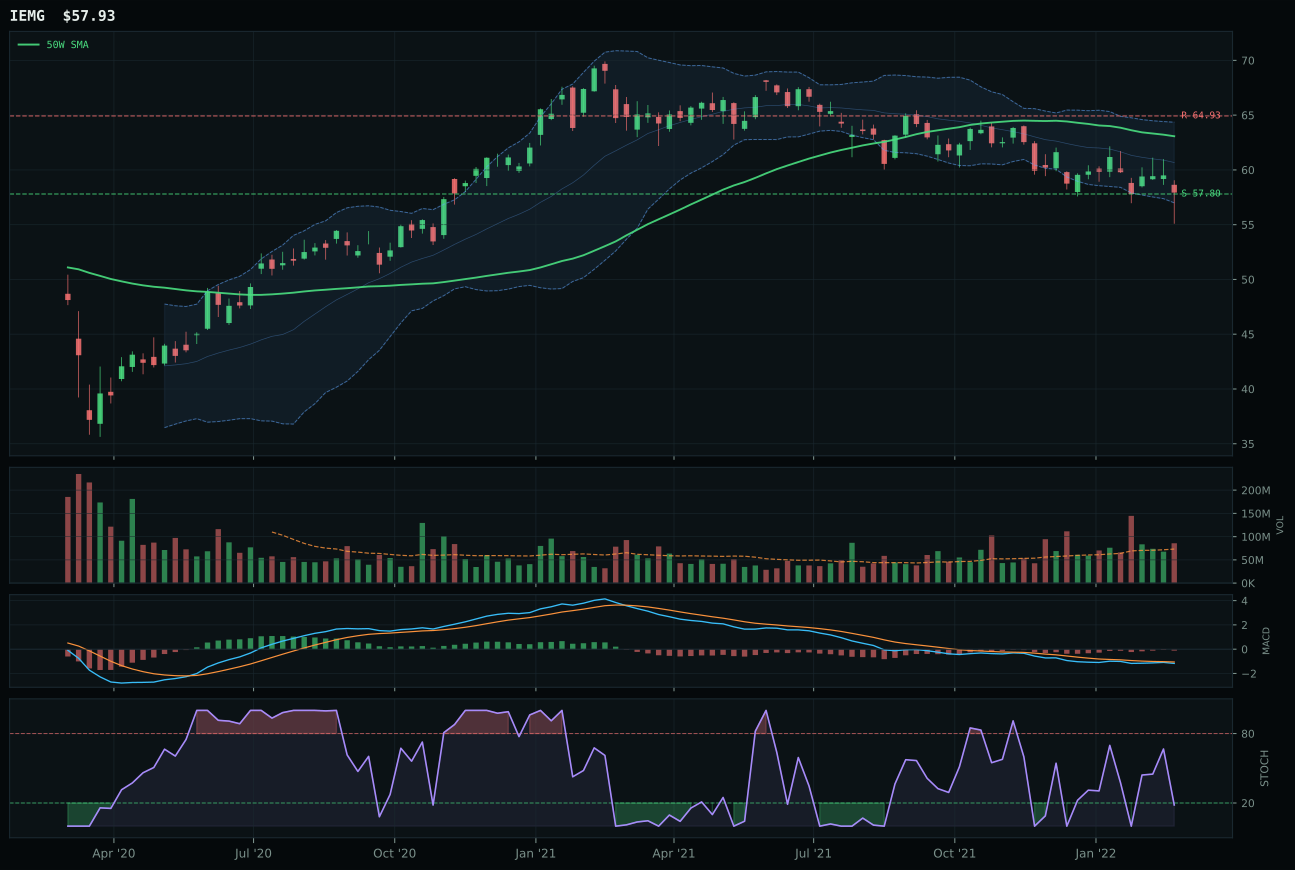
IEMG has a pullback into support profile with 1.3% 13-week relative strength versus SPY.
A failed hold above support would weaken the setup.
Actionable but governed by invalidation levels.
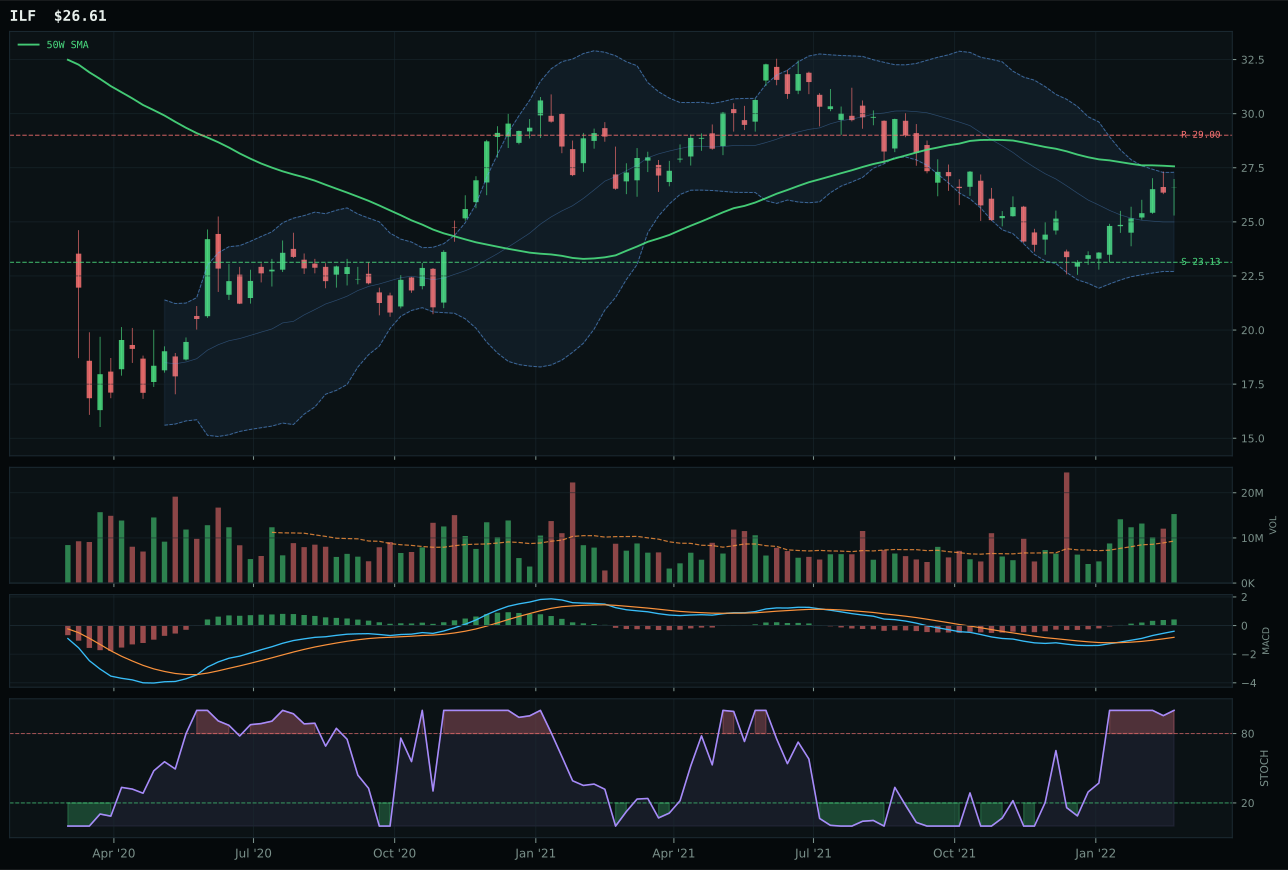
ILF has a neutral structure profile with 15.8% 13-week relative strength versus SPY.
Extension and support failure are the main tactical risks.
Tracked, but not top-2 eligible because: structurally broken.
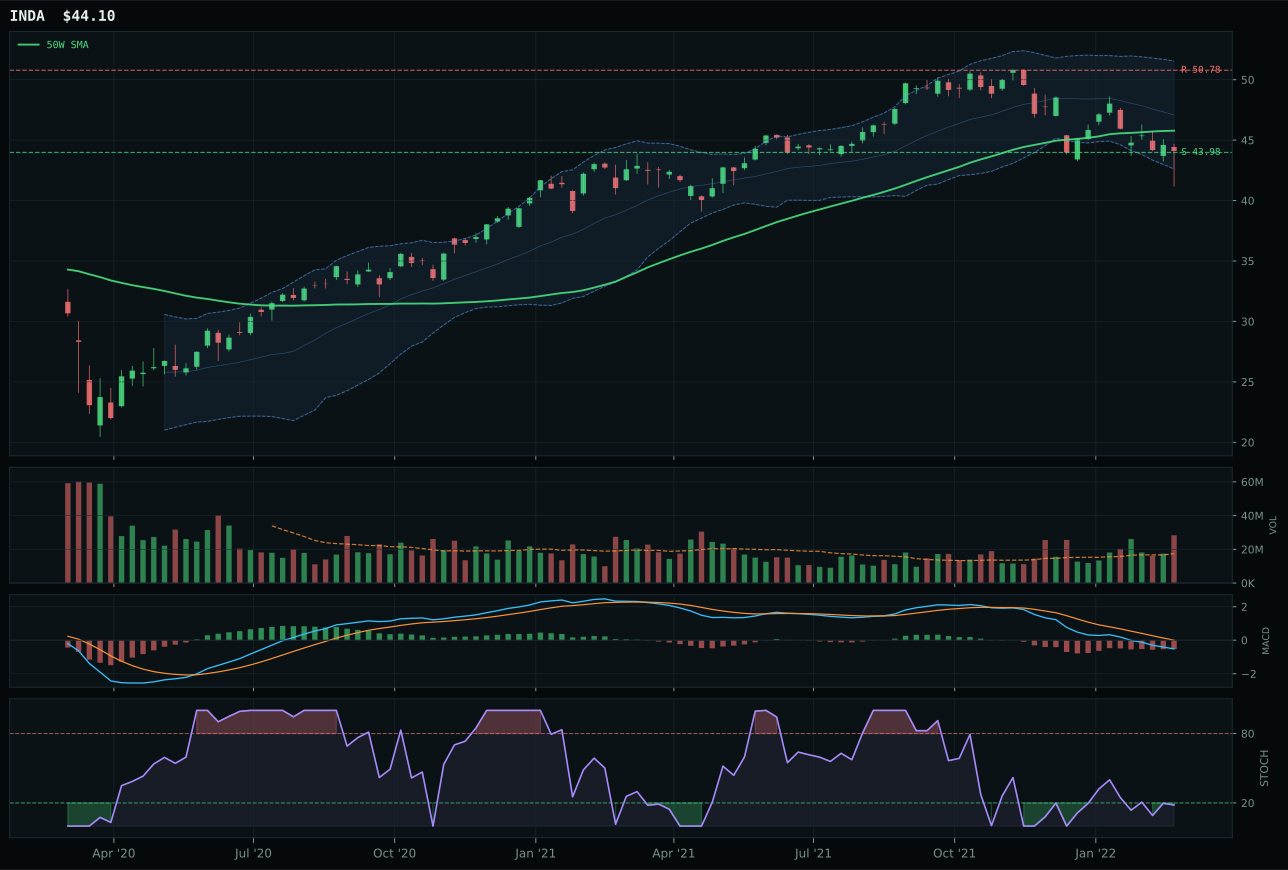
INDA has a pullback into support profile with -1.9% 13-week relative strength versus SPY.
A failed hold above support would weaken the setup.
Actionable but governed by invalidation levels.
IEMG captured Emerging Markets on superior risk/reward and a defined support setup that offers tight stop placement despite technical weakness. IEMG is 8.2% below its 50W, testing support at 57.80, with stochastic RSI oversold at 0.18 turning up—a textbook pullback-into-support structure. Its 90.0 risk/reward score (10.8% upside to 64.93 resistance, only 0.2% downside to support) is exceptional; the support zone is nearly perfect. MACD is bearish but improving. This beat ILF decisively because ILF sits in neutral structure extended upward with 100.0 momentum but only 67.9 risk/reward—ILF is extended, IEMG is backed against the wall with defined reversal risk. The score gap was 29.3 points, a blowout difference that reflects ILF's technical strength (15.8% RS vs SPY, 11.2% 13-week gain) cannot overcome its poor entry: overbought stochastic, compressed structure, and no upside room. IEMG is beaten up, tight-stopped, and offering value; ILF is extended and offering no margin of safety.
Emerging Markets receives zero allocation this week, ranked 9th or 10th among ten categories due to a 43.8 final score reflecting technical evidence of 61.8/100 competing against merely neutral macro fit of 69.0/100—a dangerous inversion where macro narrative (EM liquidity support +14 basis, liquidity expansion +8 basis) cannot overcome technical deterioration. The category's core problem is not IEMG's setup quality (it is genuinely the least-bad option), but rather that both IEMG and the category as a whole face broad-market bear headwinds (-9 basis) that macro tailwinds cannot offset. IEMG's pullback-into-support timing is worth monitoring for a future re-entry, but the current environment's risk-appetite broken regime penalizes EM exposure despite supply-shock tailwinds helping commodity-heavy emerging markets indirectly. The zero allocation frees capital for categories with dual technical and macro tailwinds; EM returns to the portfolio only when either technical evidence improves materially (IEMG breaks above its 50-week with confirmation) or when broad-market bear conditions ease. This is not permanent exclusion—the macro foundation exists—but rather timing discipline in a regime where real assets and energy lead while growth and EM lag.
AI — SMH
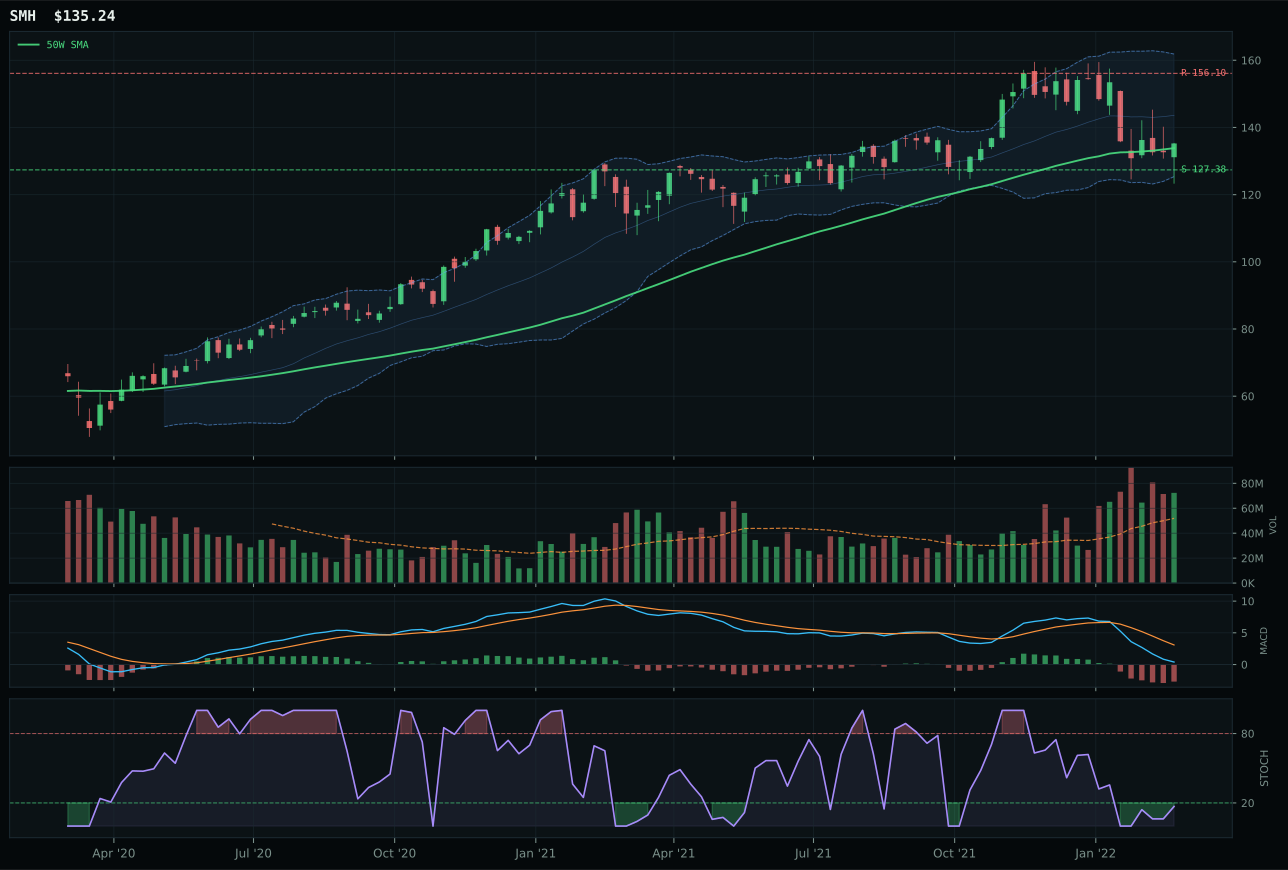
SMH has a compression near 50W profile with -5.0% 13-week relative strength versus SPY.
A failed hold above support would weaken the setup.
Actionable but governed by invalidation levels.
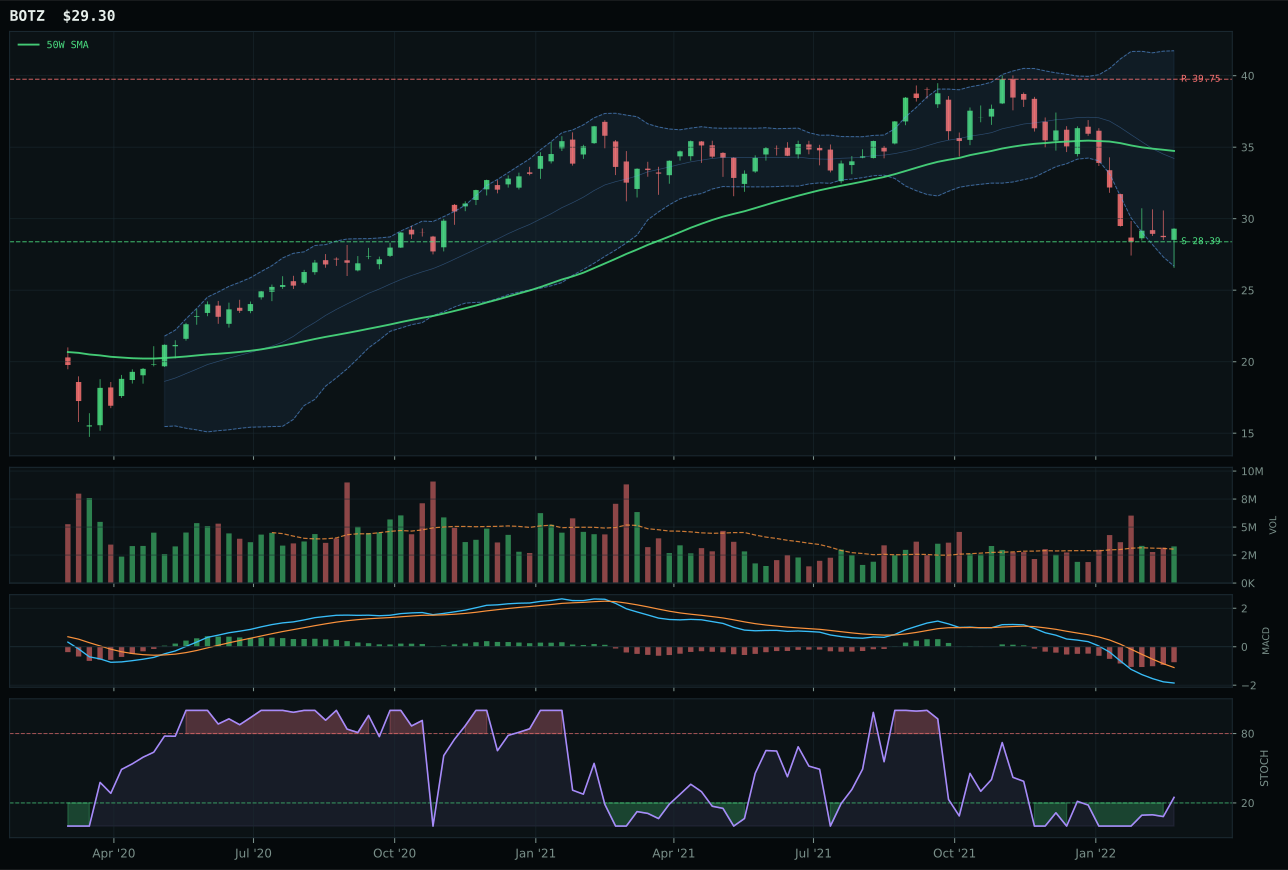
BOTZ has a pullback into support profile with -14.7% 13-week relative strength versus SPY.
A failed hold above support would weaken the setup.
Actionable but governed by invalidation levels.
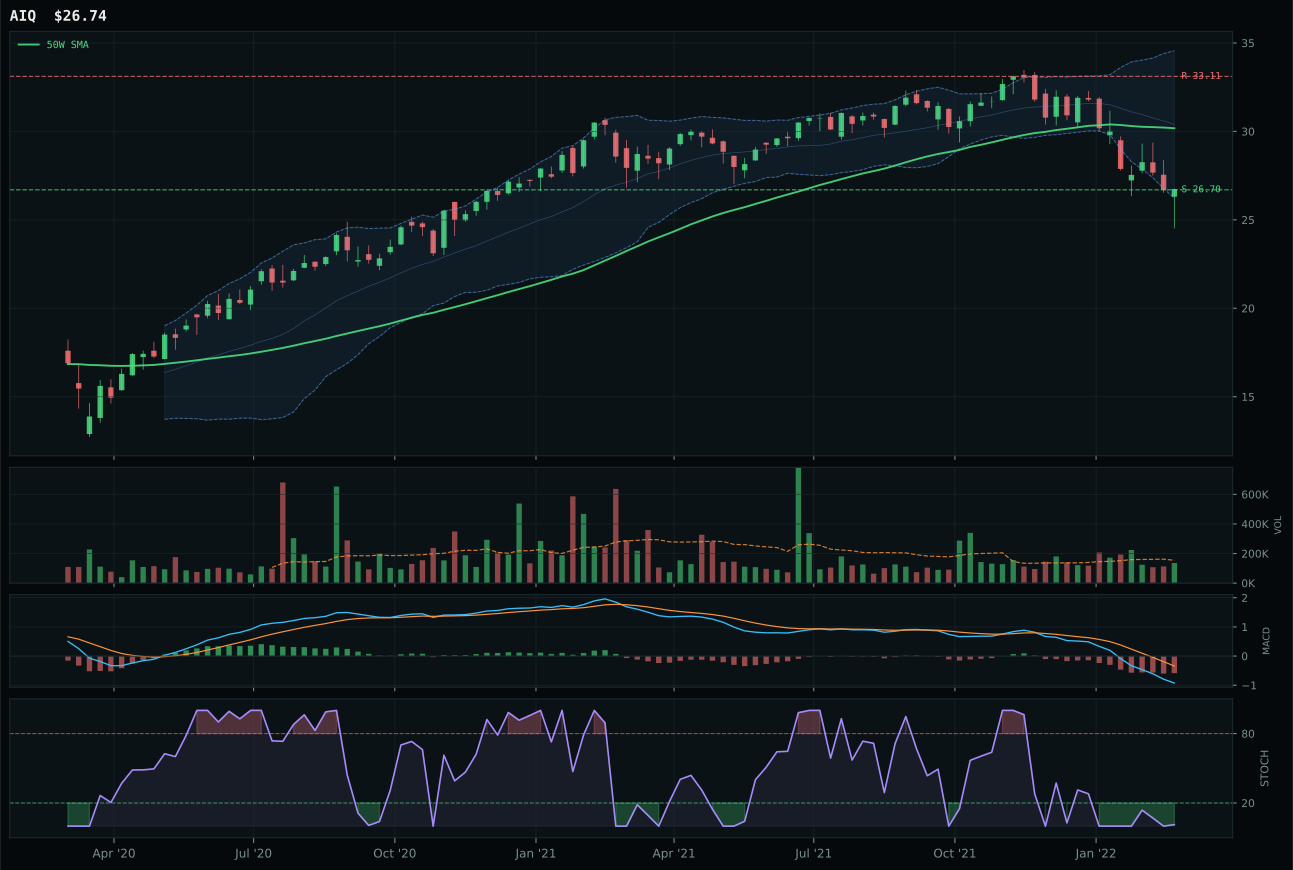
AIQ has a pullback into support profile with -11.3% 13-week relative strength versus SPY.
A failed hold above support would weaken the setup.
Tracked, but not top-2 eligible because: .
SMH won the artificial intelligence category on the strength of its superior timing profile and category-relative momentum despite both SMH and BOTZ facing sharp drawdowns. The semiconductor ETF sits 1.0% above its 50-week average with stochastic RSI turning up from oversold at 0.17, MACD still bearish but improving, and volume at 1.39x average—this is a defined support-hold setup with early reversal signals rather than a continued collapse. SMH's 13-week return of -9.7% against -14.7% for BOTZ shows it was the category's high-relative-strength name, gaining 6.3% on the median: buyers were choosing semiconductors and compute over robotics. BOTZ faltered because its setup was worse structured (62.8 vs 71.9), its stochastic was only rising mid-zone at 0.58 rather than turning up from oversold, and volume was neutral—robotics lacked the urgency and accumulation that semiconductor support showed.
AI receives zero allocation this week, ranked 9th or 10th among ten categories. The category's 35.9 final score reflects technical evidence of 57.7/100 competing against macro fit of 49.0/100, a dangerous imbalance in a Transition/Mixed regime where risk appetite is broken (-7 basis) and broad-market bear is active (-8 basis). Liquidity expansion (+10 basis) cannot offset the category's fundamental mismatch: SMH's compressed setup and improving stochastic timing are genuine, but they exist within a sector down 19.3% over thirteen weeks with SPY relative strength deeply negative. The category fails the persistence test—volume and relative strength confirmation average only 45-50 across the basket, meaning buyers lack conviction to sustain a rebound. Until either the macro regime shifts or AI names demonstrate category-relative outperformance with cleaner volume signatures, this allocation remains zero, freeing capital for categories with both technical and macro tailwinds.