
2022-02-18
Informational purposes only. The content in this report, including allocations, analysis, and commentary, is provided solely for informational and educational purposes. It does not constitute financial advice, investment advice, trading advice, or any other type of advice. Past performance does not guarantee future results. Always conduct your own research and consult a qualified financial professional before making investment decisions.
Weekly Allocation
| Ticker | Category | Weight | Role |
|---|---|---|---|
| XLE | Traditional Energy | 20% | Top-2 (20%) |
| COPX | Industrial Metals | 20% | Top-2 (20%) |
| GLD | Precious Metals | 10% | Tier-2 (10%) |
| MOO | Agriculture & Livestock | 10% | Tier-2 (10%) |
| PAVE | Utilities & Infrastructure | 10% | Tier-2 (10%) |
| CIBR | Technology | 10% | Tier-2 (10%) |
| IEMG | Emerging Markets | 10% | Tier-2 (10%) |
| ITA | Defense & Aerospace | 10% | Tier-2 (10%) |
Trade Instructions — Monday Open
Sell the tranche from 2022-01-21 (completing its 4-week hold). Buy the new tranche. Instructions show net portfolio changes — same-asset positions cancel, weight changes show the delta.
| Action | Ticker | Instruction |
|---|---|---|
| SELL | GLD | Sell 25% of GLD position (reduce 10.00% → 7.50%) |
| SELL | IGF | Sell 33% of IGF position (reduce 7.50% → 5.00%) |
| SELL | XLK | Sell 40% of XLK position (reduce 6.25% → 3.75%) |
| SELL | URA | Sell 67% of URA position (reduce 3.75% → 1.25%) |
| BUY | COPX | Buy COPX — 25.00% of freed cash (adds 2.50% to portfolio) |
| BUY | IEMG | Buy IEMG — 25.00% of freed cash (adds 2.50% to portfolio) |
| BUY | CIBR | Buy CIBR — 25.00% of freed cash (adds 2.50% to portfolio) |
| BUY | PAVE | Buy PAVE — 25.00% of freed cash (adds 2.50% to portfolio) |
Current Portfolio After Trade
Combined holdings across all 4 active tranches. Each tranche is 25% of the portfolio.
| Ticker | % of Portfolio | Weight Bar |
|---|---|---|
| XLE | 40.00% | |
| COPX | 13.75% | |
| ITA | 7.50% | |
| GLD | 7.50% | |
| MOO | 6.25% | |
| IEMG | 6.25% | |
| IGF | 5.00% | |
| CIBR | 3.75% | |
| XLK | 3.75% | |
| WEAT | 2.50% | |
| PAVE | 2.50% | |
| URA | 1.25% |
Macro Regime — Transition / Mixed
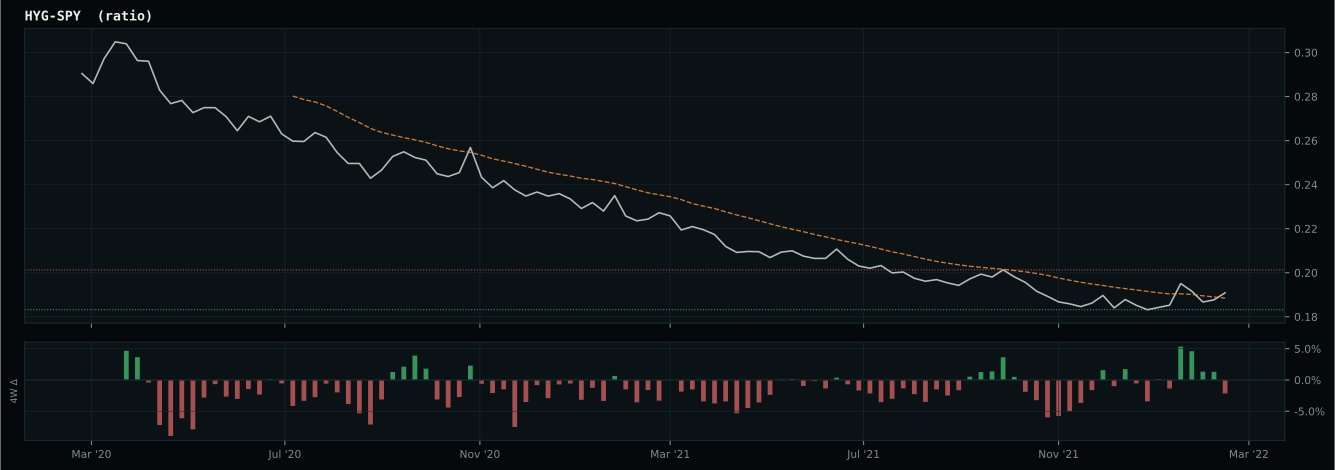
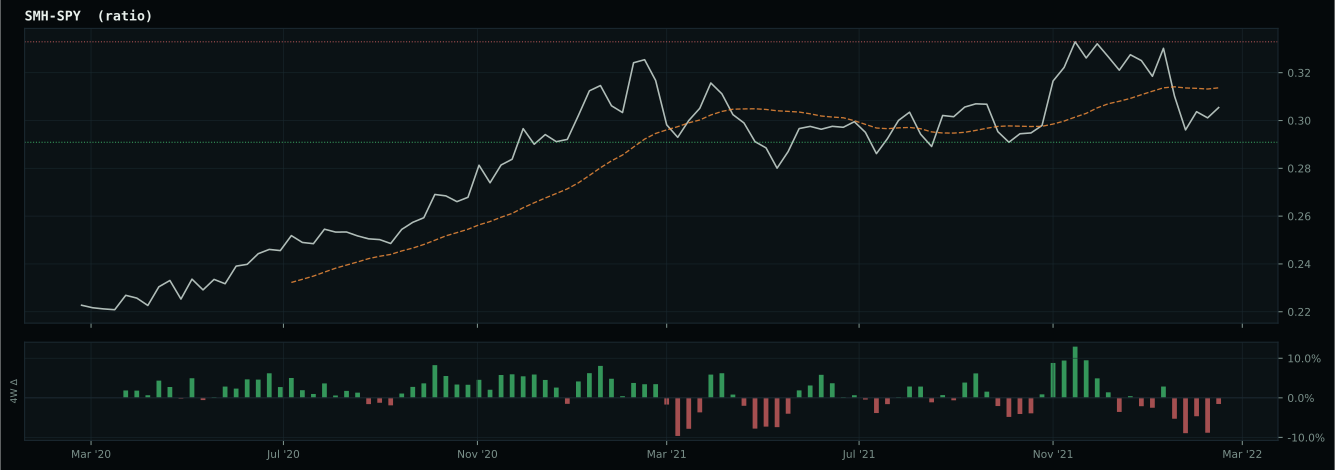
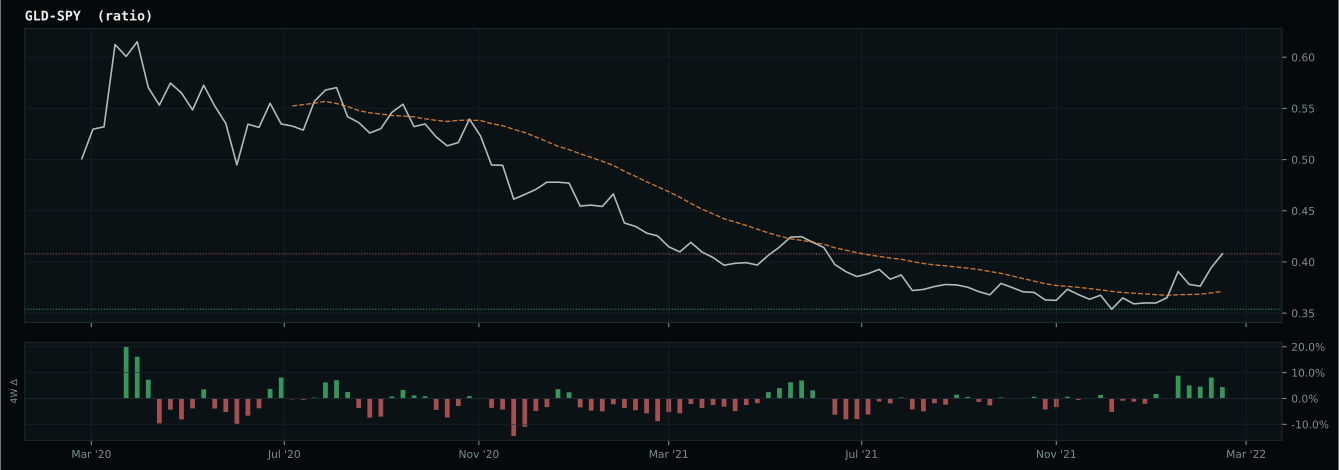
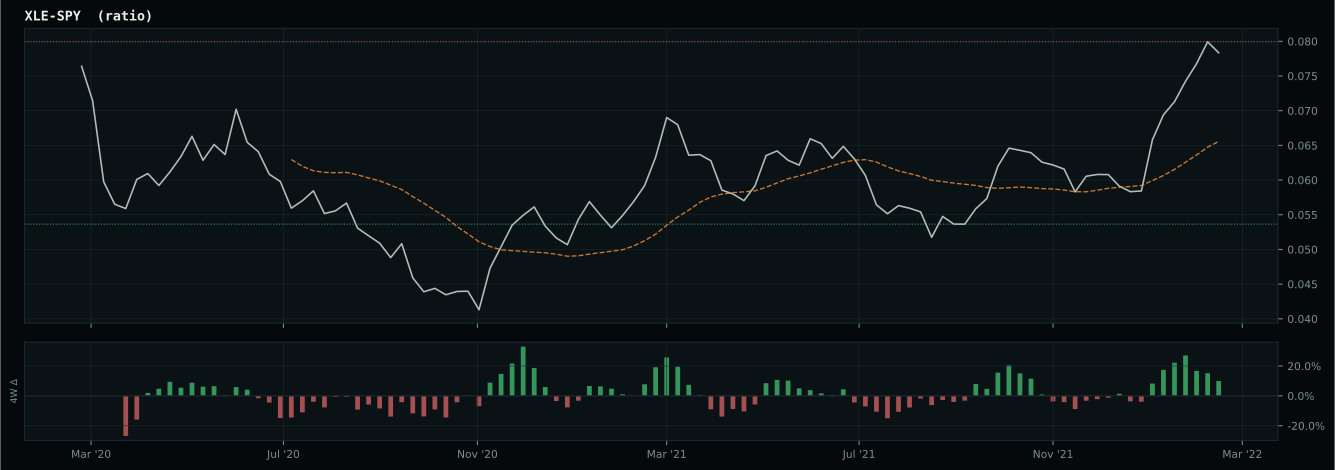
growth data is not confirming the weak market-implied risk appetite signal
Macro Evidence Charts
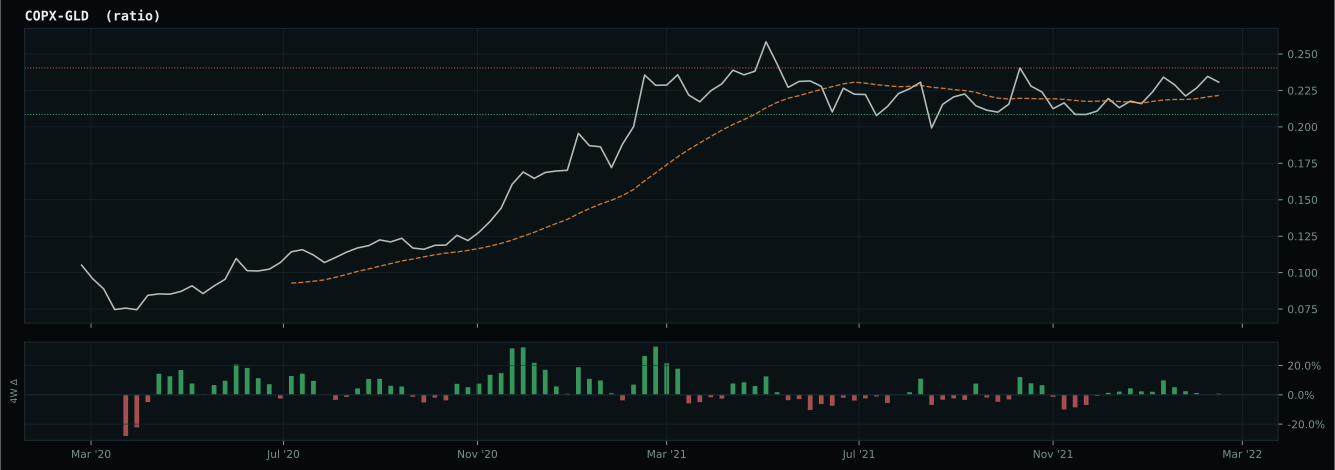
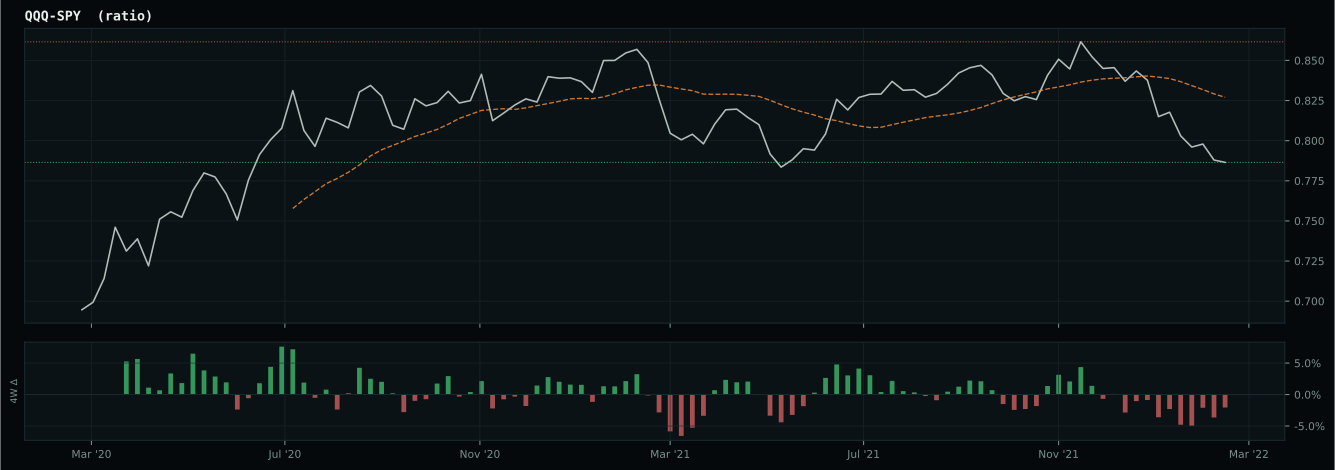
Market-implied signals behind the macro regime scores. Each ratio compares two assets; the direction and slope of the ratio is what the macro engine reads.
Crypto Regime — NoCrypto
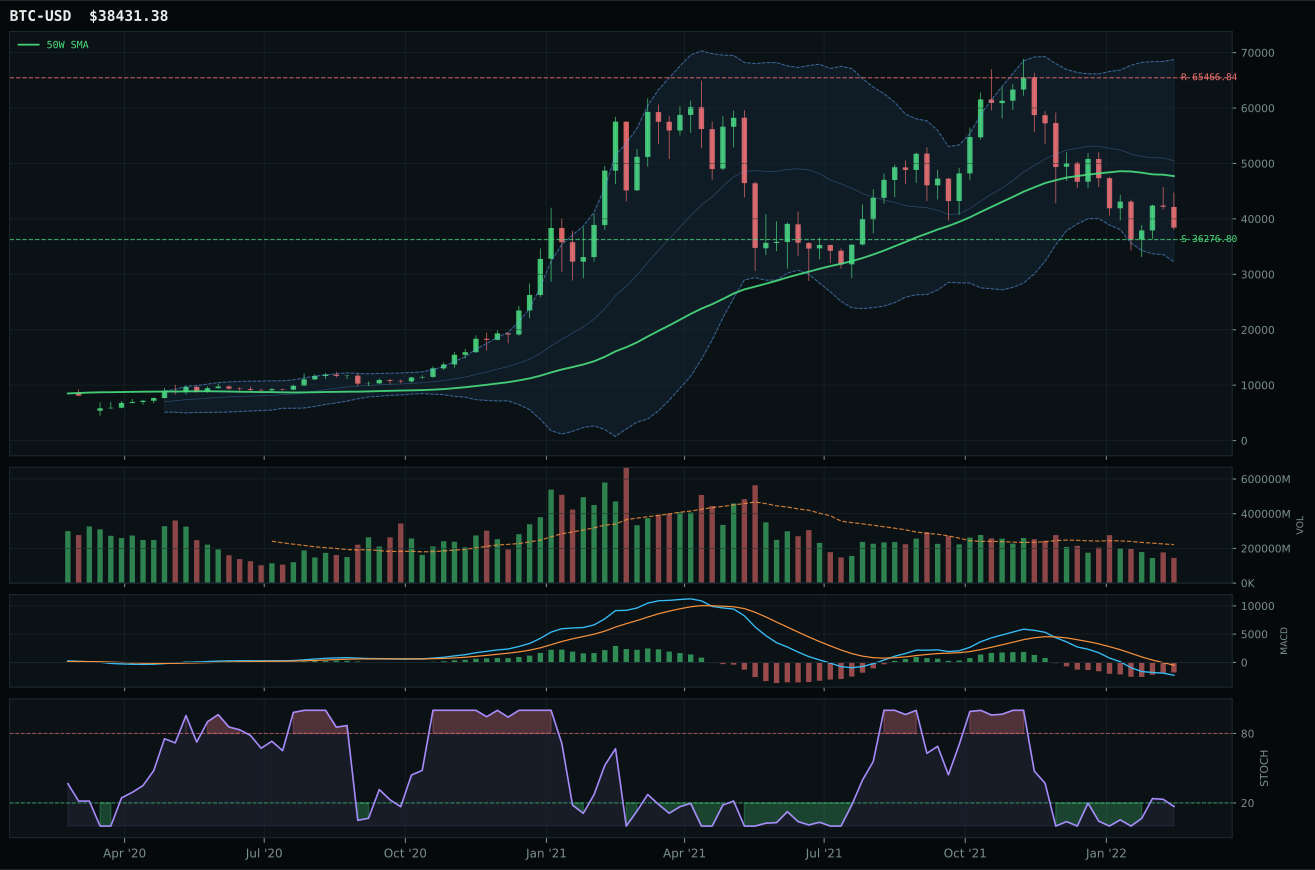
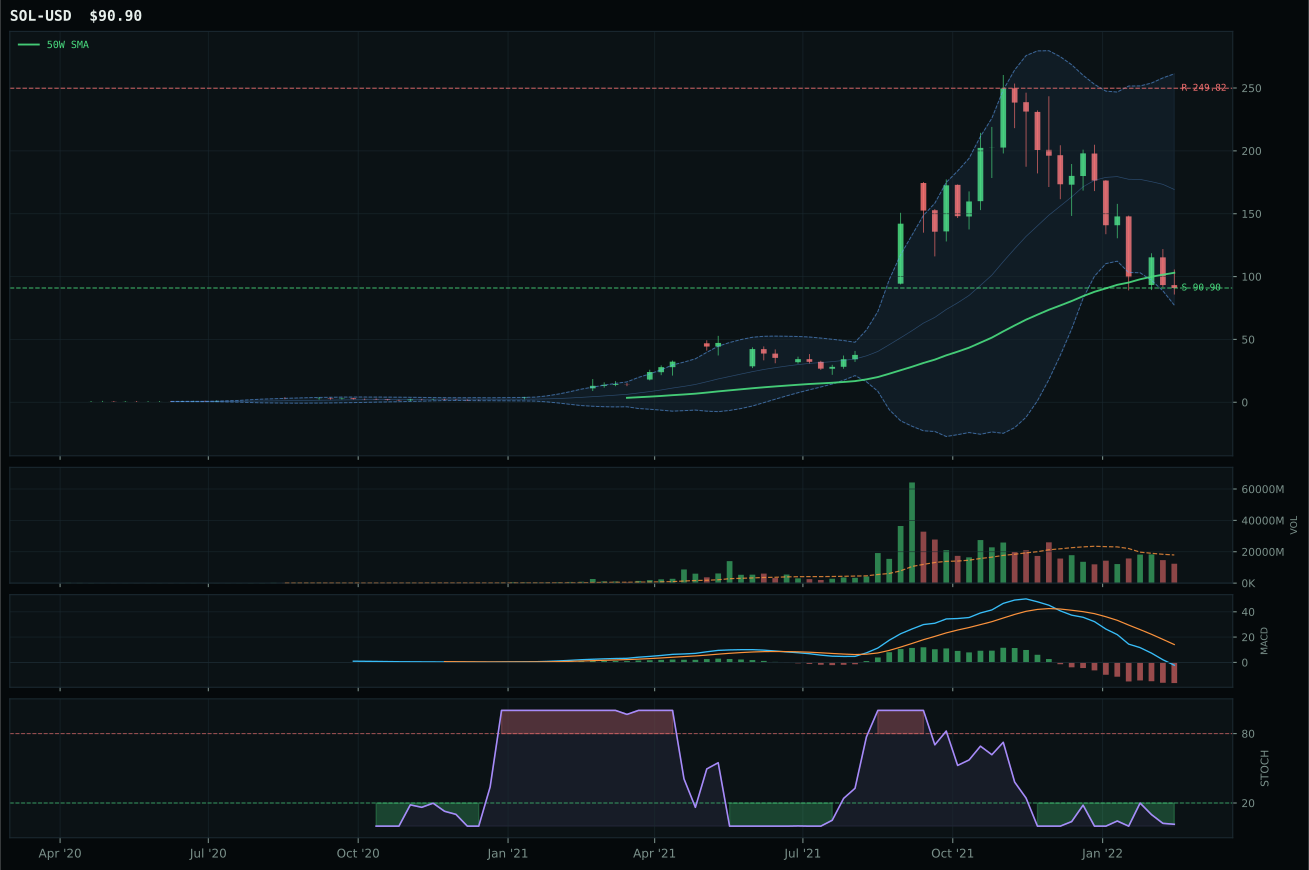
ValueBTC not armed: BTC has not made the first post-breakdown touch of the 200W buy zone after losing the 50W
TrendBTC not confirmed
one or more available conditions failed
Category Rankings
| Rank | Category | Winner | Score | Alloc | 4W Ret | Peers (4W) |
|---|---|---|---|---|---|---|
| 1 | Traditional Energy | XLE | 90.6 | 20% | +6.49% | FCG +11.9% · XOP +13.9% |
| 2 | Industrial Metals | COPX | 76.2 | 20% | +7.84% | PICK +5.5% · REMX +3.5% |
| 3 | Precious Metals | GLD | 76.0 | 10% | +0.93% | GDX +7.9% · SLV +3.0% |
| 4 | Agriculture & Livestock | MOO | 52.6 | 10% | +9.08% | WEAT +32.4% · VEGI +11.5% |
| 5 | Utilities & Infrastructure | PAVE | 48.9 | 10% | +6.98% | IGF +3.2% · XLU +6.0% |
| 6 | Technology | CIBR | 45.0 | 10% | +11.07% | XLK +2.1% · IGV +4.2% |
| 7 | Emerging Markets | IEMG | 42.4 | 10% | -6.33% | INDA -1.4% · ILF +7.1% |
| 8 | Defense & Aerospace | ITA | 41.7 | 10% | +4.29% | XAR +9.7% · ROKT +10.0% |
| 9 | Nuclear Energy | URA | 35.0 | 0% | +25.06% | URNM +30.4% · NLR +6.2% |
| 10 | AI | SMH | 32.1 | 0% | +2.34% | BOTZ +3.8% · AIQ +1.1% |
Traditional Energy — XLE
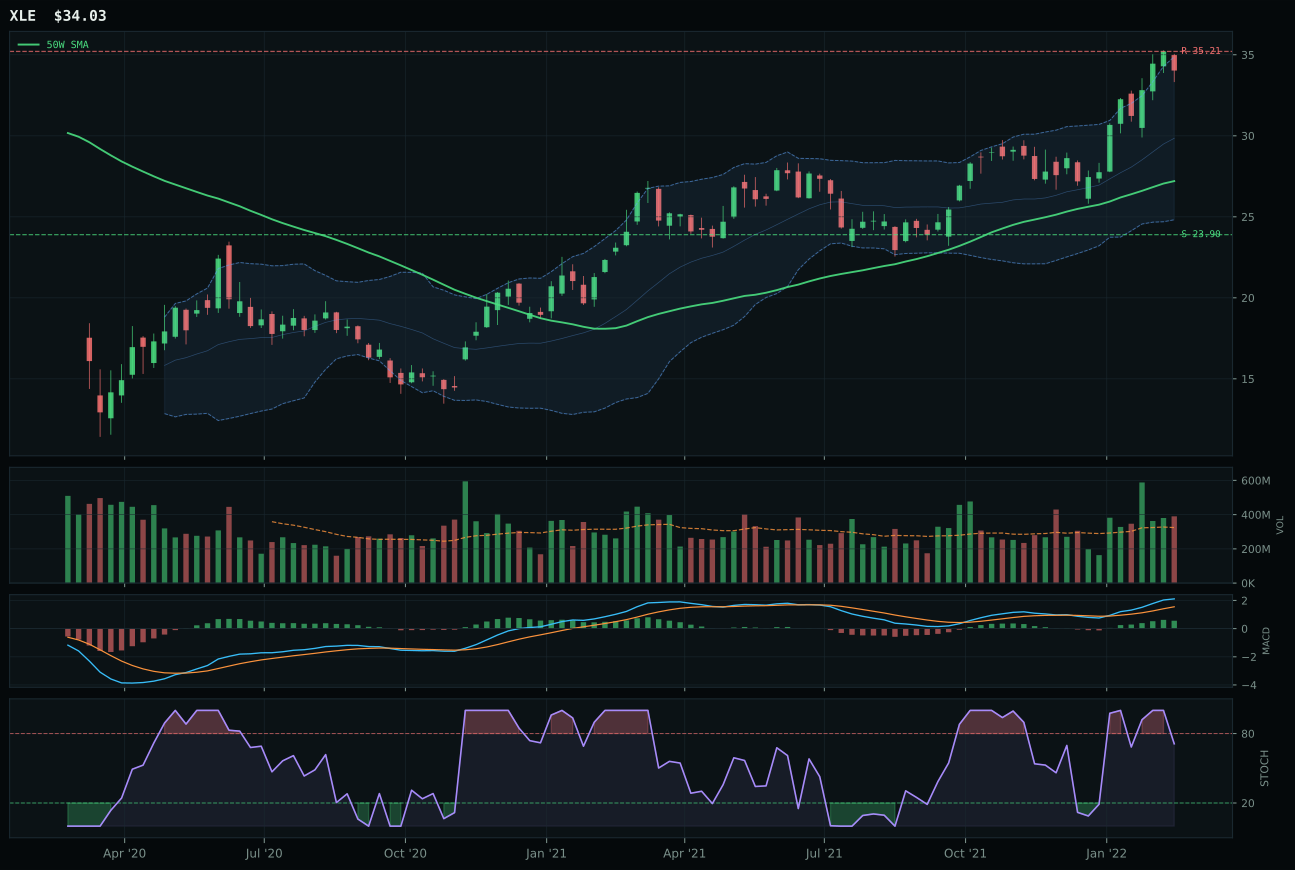
XLE has a vertical extension profile with 31.9% 13-week relative strength versus SPY.
A failed hold above support would weaken the setup.
Actionable but governed by invalidation levels.
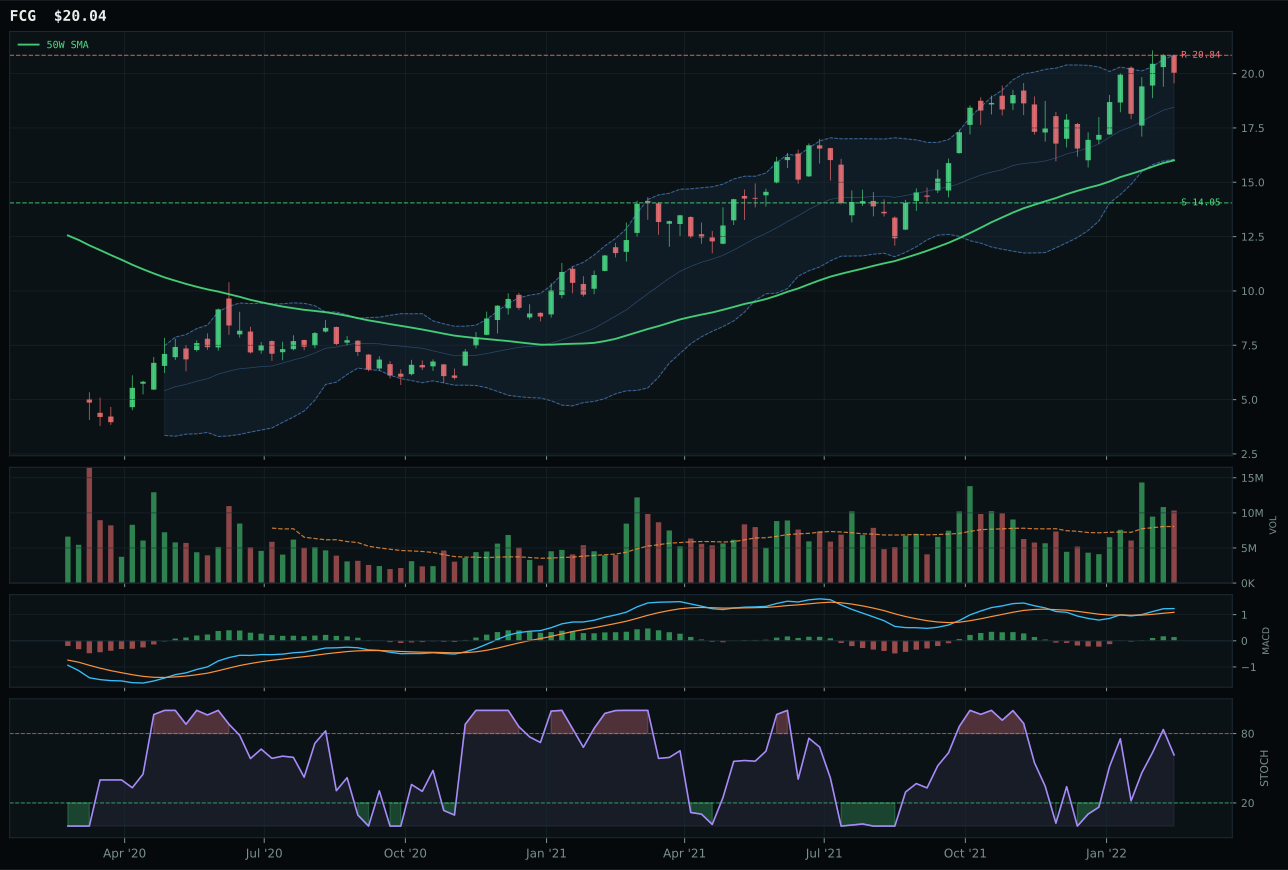
FCG has a vertical extension profile with 23.1% 13-week relative strength versus SPY.
A failed hold above support would weaken the setup.
Actionable but governed by invalidation levels.
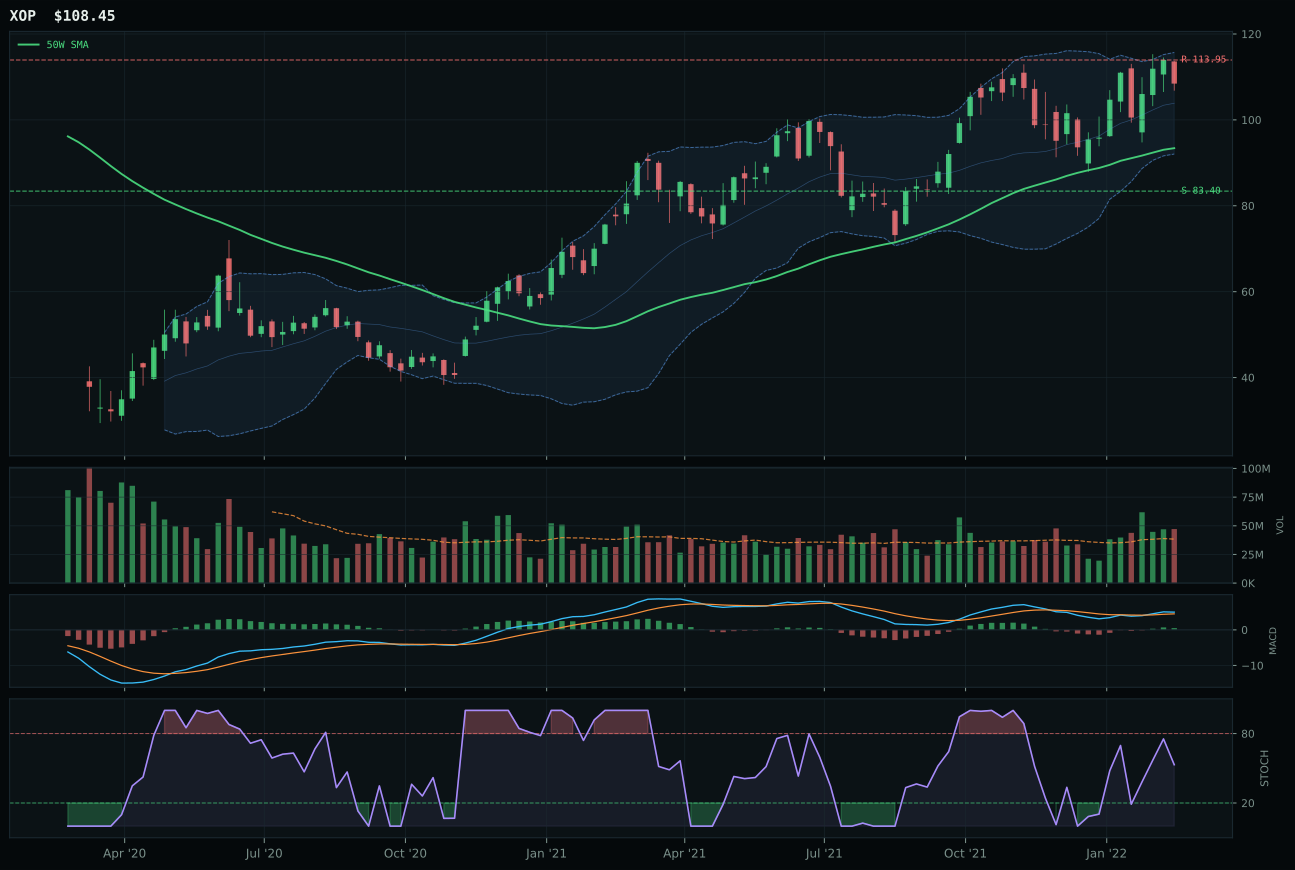
XOP has a vertical extension profile with 17.2% 13-week relative strength versus SPY.
A failed hold above support would weaken the setup.
Actionable but governed by invalidation levels.
XLE's final 90.6 category score earned it the top-2 designation and 20% allocation despite being extended 25.1% from the 50-week moving average—precisely because that extension is the market's confirmation that the energy thesis is moving from undervalued to consensus, and the 31.9% RS versus SPY proves buyers are willing to chase. XLE beat FCG by 0.8 points in a photo-finish because its risk/reward held at 38.4 versus 31.6, meaning the cash-flow cushion to support prices is wider despite identical vertical extension setup. The 24.5% 13-week return and 100.0 momentum confirmation score leave zero ambiguity: institutional money has rotated into energy cash flows to hedge inflation and inflation-driven spending, and every new seller at these prices is being absorbed by buyers with longer-duration agendas. Thin liquidation risk remains (stochastic RSI falling/neutral suggests momentum is maturing), but the 77.9 volume-price confirmation and 90.2 persistence scores indicate this is not a momentum pop but a regime shift in capital allocation.
Traditional Energy earned 20% because its category score of 90.6 was the highest in the portfolio and its macro narrative was the most cohesive: energy scarcity at +16, inflation pressure at +10, supply shortage at +9, and real asset sponsorship at +7 combined for 92.0 category macro fit, the strongest in the entire 10-category mix. XLE's 86.0 ETF-level technical evidence meets that macro tailwind perfectly, creating a rare alignment where technicals, momentum, and narrative all reinforce each other. The allocation reflects the hard reality that in inflationary transition regimes with broken risk appetite, energy exporters generate the most reliable cash flows and the most credible valuation anchors—equity multiples compress, but energy earnings grow faster than prices rise. The concentrated 20% weight acknowledges execution risk: if geopolitical tensions ease or demand destruction accelerates from Fed tightening, the 42.4% downside to support makes this the portfolio's highest-beta core holding. Reduction of the allocation would require XLE to close below the 23.90 support level on above-average volume while MACD begins deteriorating, signaling regime reversal.
Industrial Metals — COPX
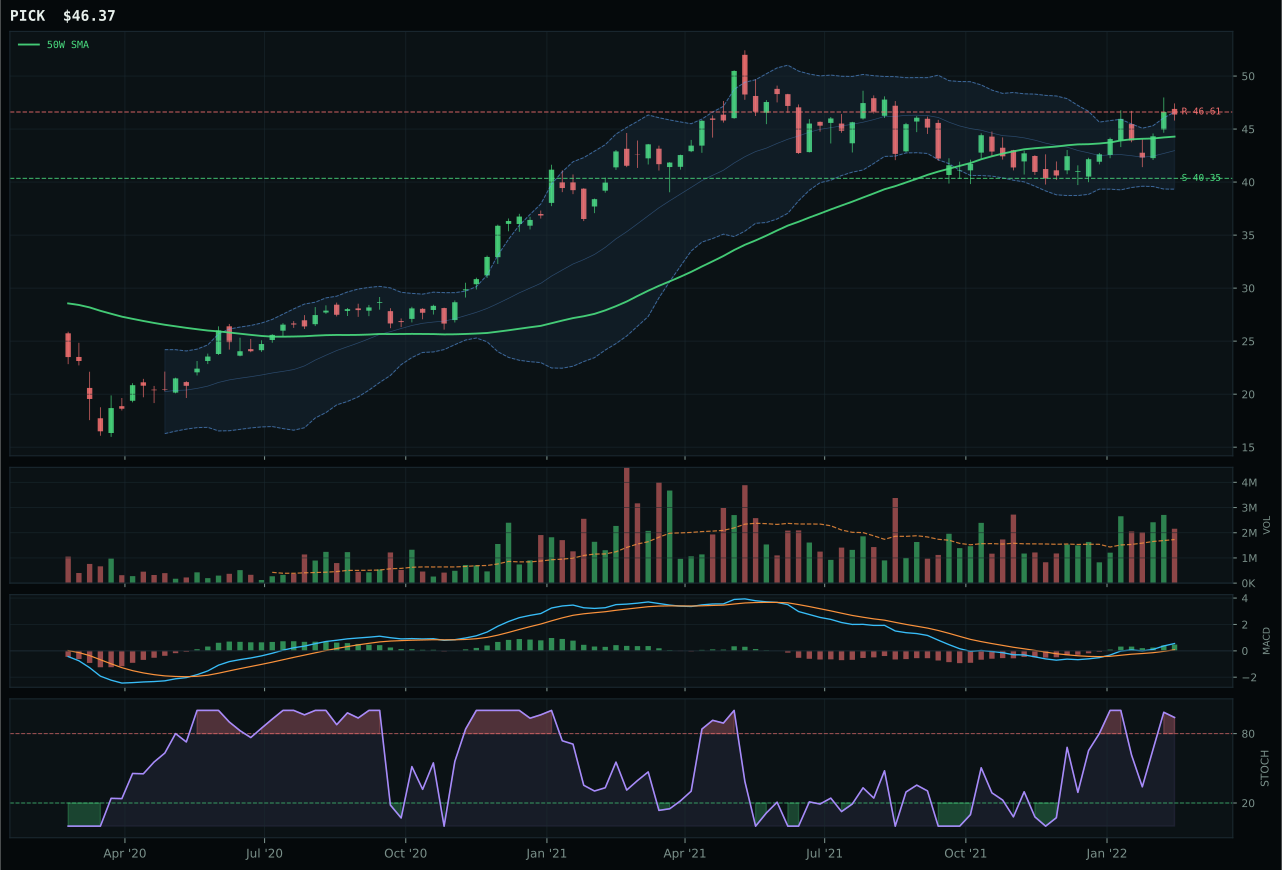
PICK has a neutral structure profile with 20.6% 13-week relative strength versus SPY.
A failed hold above support would weaken the setup.
Actionable but governed by invalidation levels.
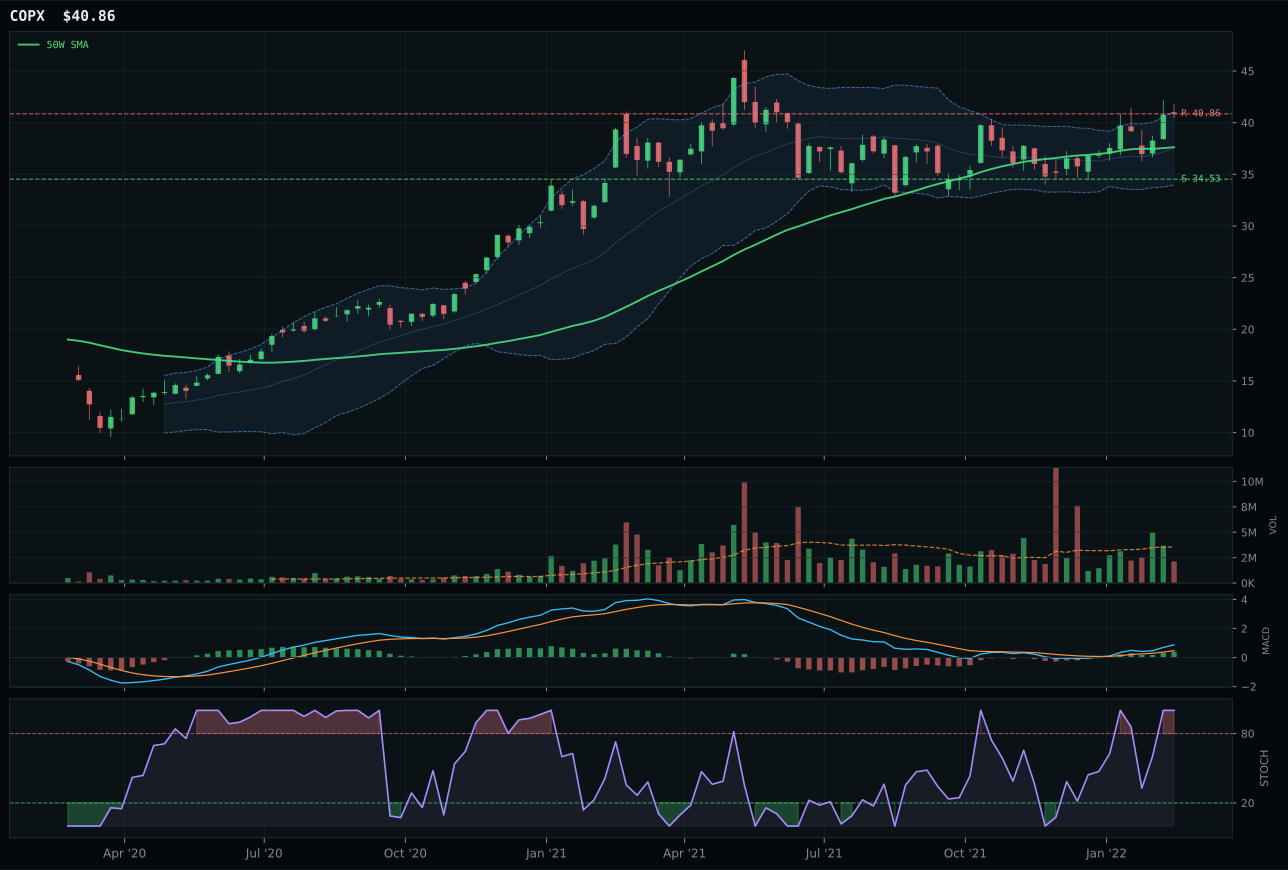
COPX has a neutral structure profile with 20.9% 13-week relative strength versus SPY.
A failed hold above support would weaken the setup.
Actionable but governed by invalidation levels.
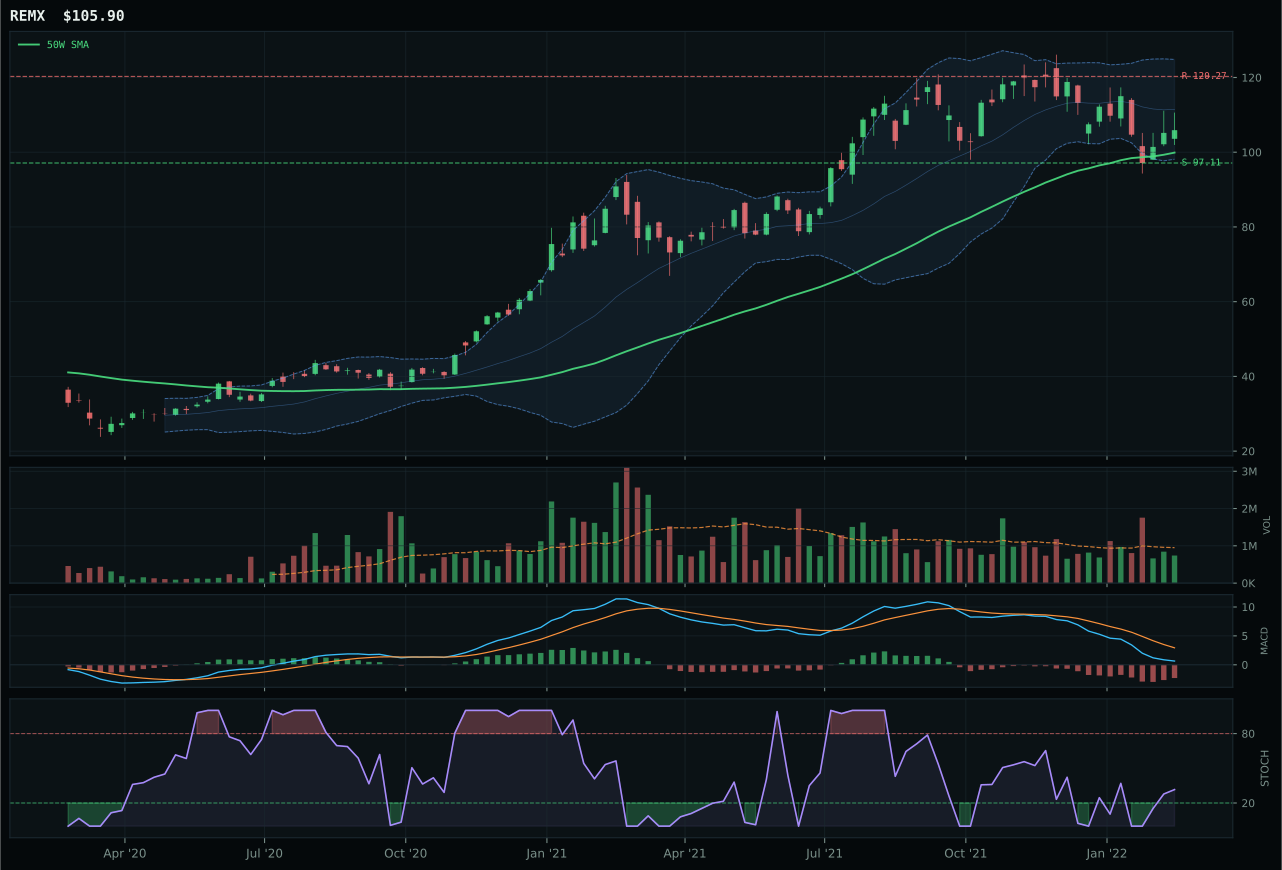
REMX has a neutral structure profile with -2.4% 13-week relative strength versus SPY.
A failed hold above support would weaken the setup.
Actionable but governed by invalidation levels.
COPX won despite PICK's higher technical evidence score (94.7 vs 81.3) because COPX delivered superior risk/reward (60.9 vs 53.6) and held category-relative strength at 0.3% versus PICK's 0.0%, a critical tie-breaker in a category where both ETFs showed identical bullish MACD and overbought stochastic RSI. COPX's 13.5% 13-week return and 20.9% RS versus SPY prove copper is the scarcest industrial metal in this regime—the thin volume at 0.60x average is actually advantageous here because it means early buyers have few sellers to accommodate, making any follow-through in volume a violent move upward. PICK's above-average participation suggests it is already being rotated by broader index funds, while COPX's thinness implies it is still being accumulated by specialist capital. The 8.6% extension from the 50-week on both names suggests similar entry timing, but COPX's higher momentum score (100 vs 100 is tied) masks that COPX's RS lead suggests it is being selected for scarcity positioning, not just commodity breadth.
Industrial Metals earned a 20% top-2 slot because its 76.2 category score tied with Precious Metals and slightly trailed Energy, but the macro setup was exceptional: metals scarcity at +14, commodity breadth at +10, and real asset sponsorship at +6 created an overwhelming case for real-asset rotation out of equities. COPX's 69.0 macro narrative fit and 100.0 momentum confirmation made it the cleanest execution of that thesis—copper specifically is facing structural deficits from the clean-energy transition and Chinese infrastructure resilience. The 20% allocation reflects conviction that industrial metals will outperform equities in the remainder of a mixed/transition regime because the only growth vector available is infrastructure-driven, and copper is the currency of that move. Risk to the thesis: if equity drawdowns reverse into risk-appetite compression, metal demand destruction can erase scarcity premiums within weeks, which is why position sizing at 20% rather than 30% acknowledges the timing risk on an extended chart.
Precious Metals — GLD
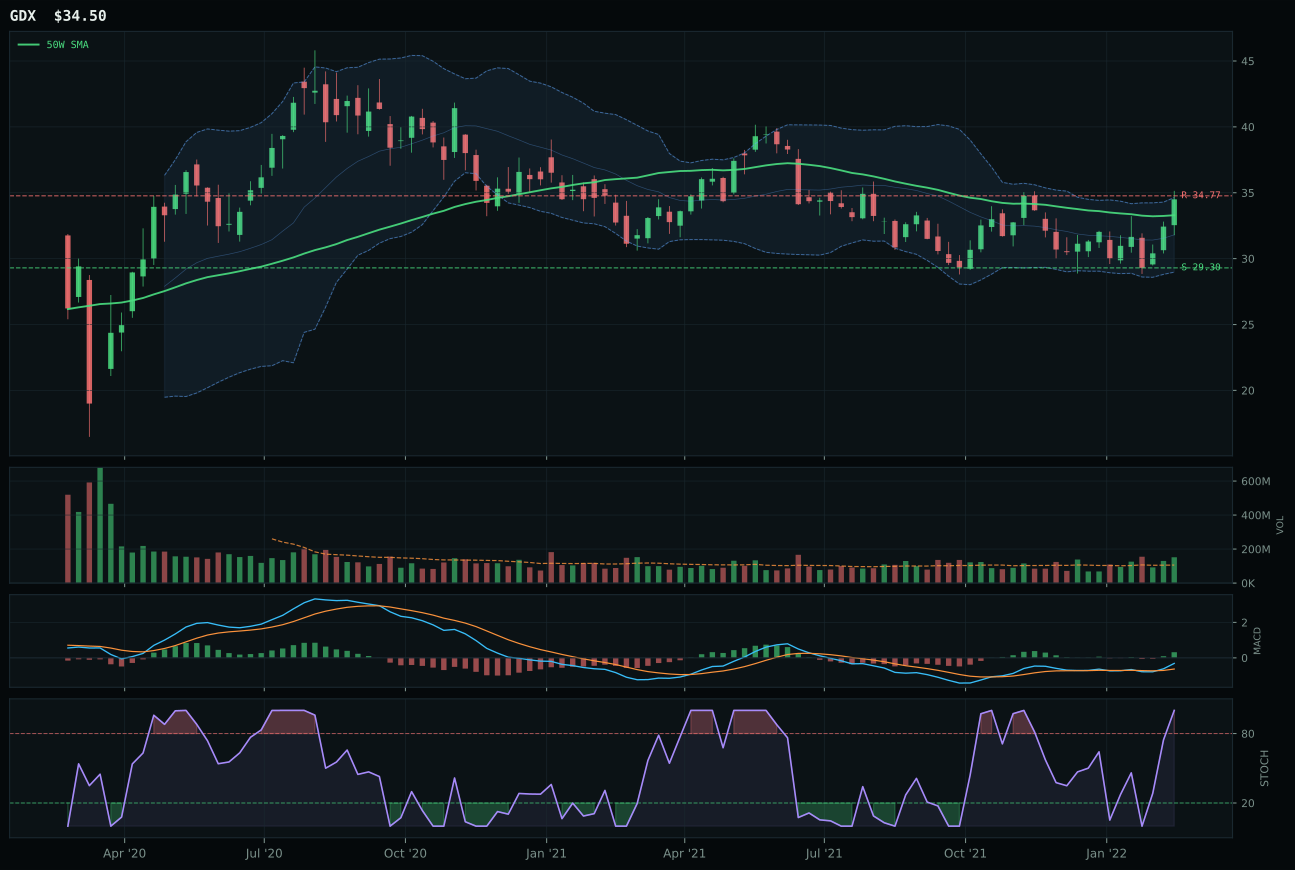
GDX has a neutral structure profile with 9.9% 13-week relative strength versus SPY.
A failed hold above support would weaken the setup.
Actionable but governed by invalidation levels.
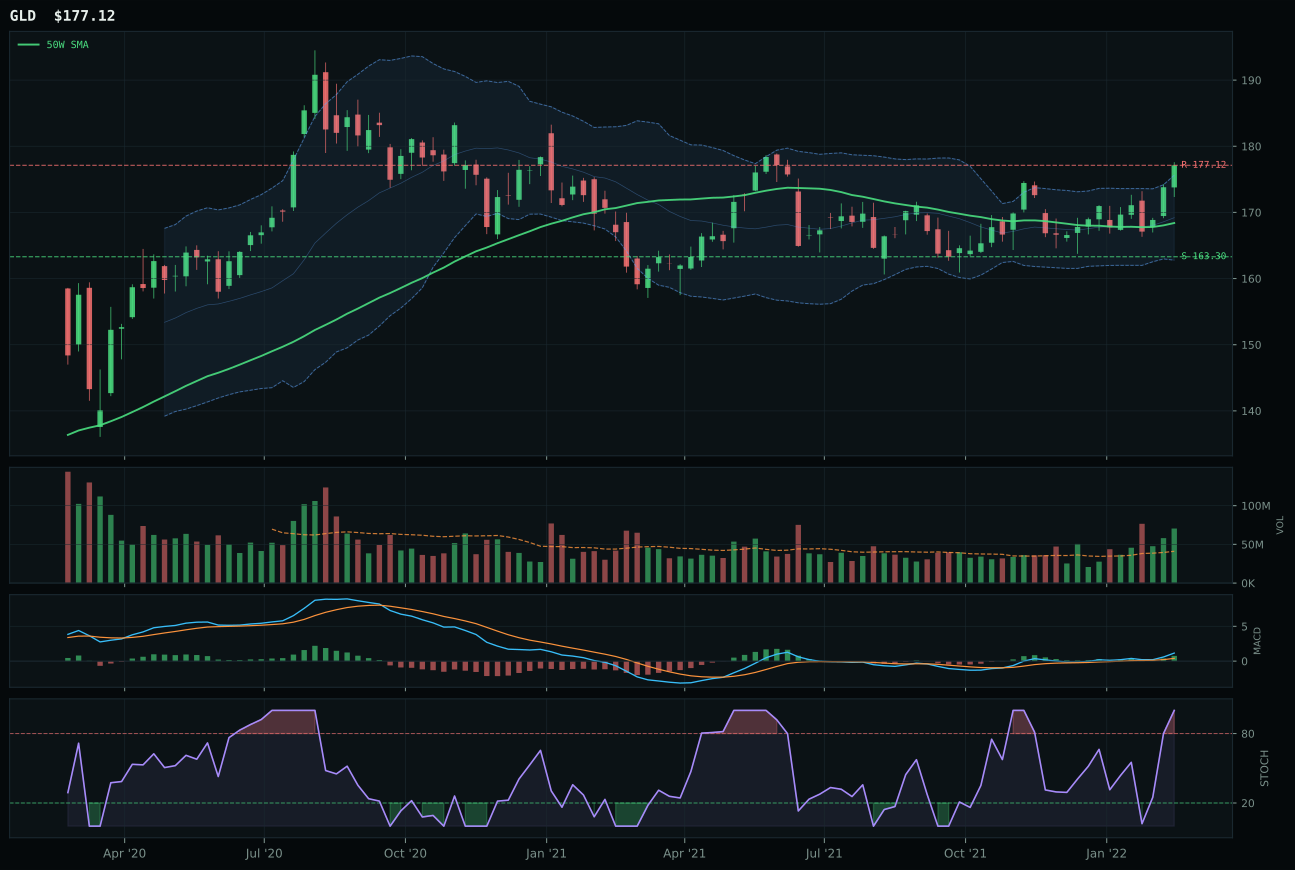
GLD has a neutral structure profile with 10.0% 13-week relative strength versus SPY.
A failed hold above support would weaken the setup.
Actionable but governed by invalidation levels.
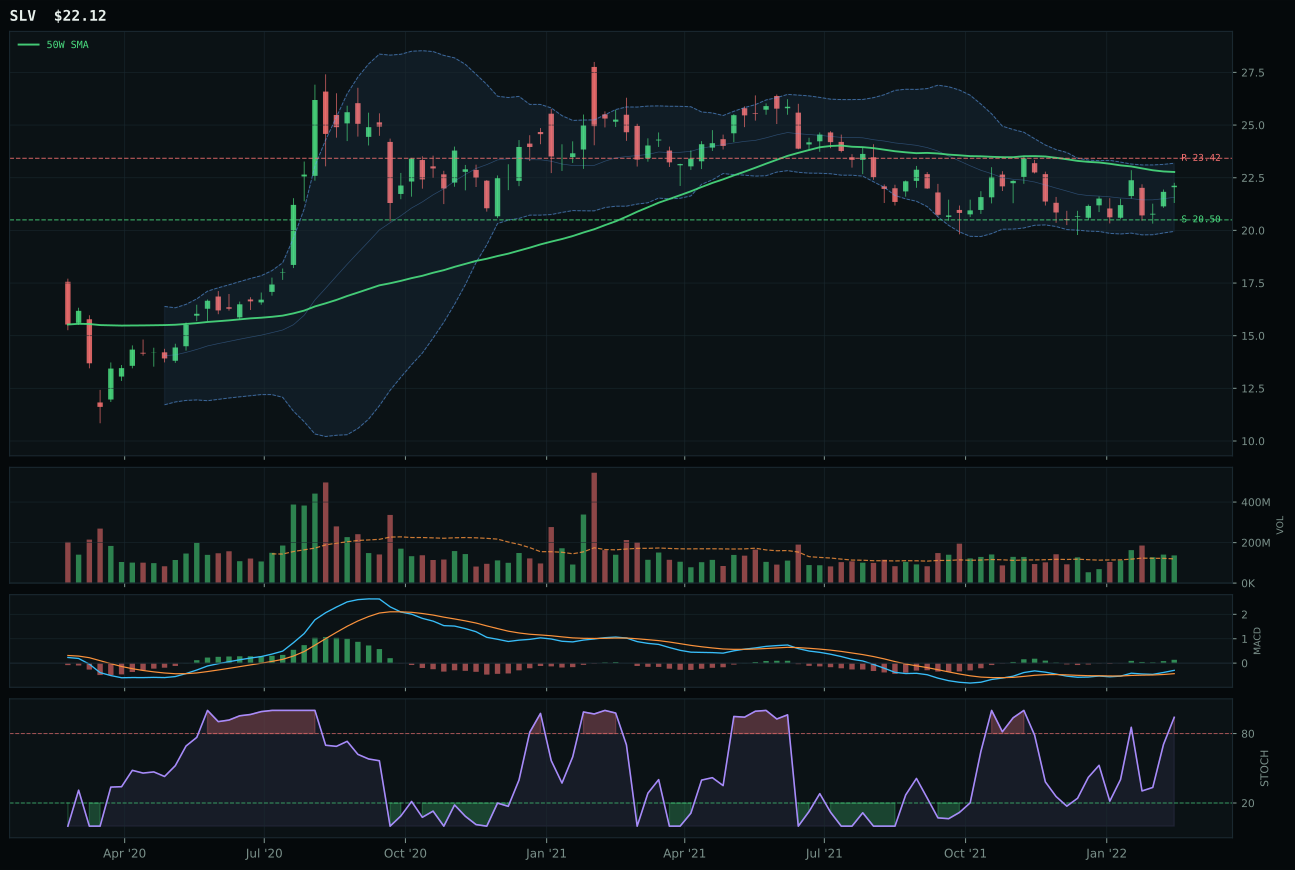
SLV has a compression near 50W profile with 4.6% 13-week relative strength versus SPY.
A failed hold above support would weaken the setup.
Actionable but governed by invalidation levels.
GLD narrowly beat GDX by 1.5 points in a competitive category decision, winning because its volume confirmation was higher (91.5 vs 78.0) and structure was cleaner (84.8 vs 76.7)—both signals that institutional buyers were accumulating gold itself rather than leveraged miner exposure. At 5.2% from the 50-week with stochastic at overbought momentum and MACD bullish-and-improving, GLD offers both continuation bias and technical safety; overbought does not mean reject when the price is above all moving averages and volume is confirming at 1.71x. The 10.0% RS versus SPY is remarkable given the broad-market selloff, and it reflects the monetary hedge narrative gaining institutional conviction. GDX's higher timing score (97 vs 75) was negated by GLD's superior accumulation—in late cycles, volume conviction matters more than oscillator perfection because oscillators can quickly reverse on sentiment shifts, while volume persistence indicates long-dated positioning.
Precious Metals earned 10% because despite GLD's 76.0 final score being among the highest in the portfolio, the category's 69.0 macro fit was eclipsed by energy and metals' scarcity themes. The monetary hedge bid is active at +14, and defensive rotation at +7 creates a genuine tailwind, but gold is already trading at technicals that price most of this thesis—the stochastic overbought, price near 52-week highs, and timing score of just 75 signal the upside is compressed. The 10% weight is appropriate as a hedge against further equity liquidations and a portfolio ballast, not as a growth allocation. Upgrade to higher weight would require GLD to break above 177.12 resistance on above-average volume while maintaining the bullish MACD, which would reset technicals and prove the move is conviction-driven rather than momentum-saturated. Until that break occurs, GLD at 10% serves as insurance while capital flows to the highest-conviction setups.
Agriculture & Livestock — MOO
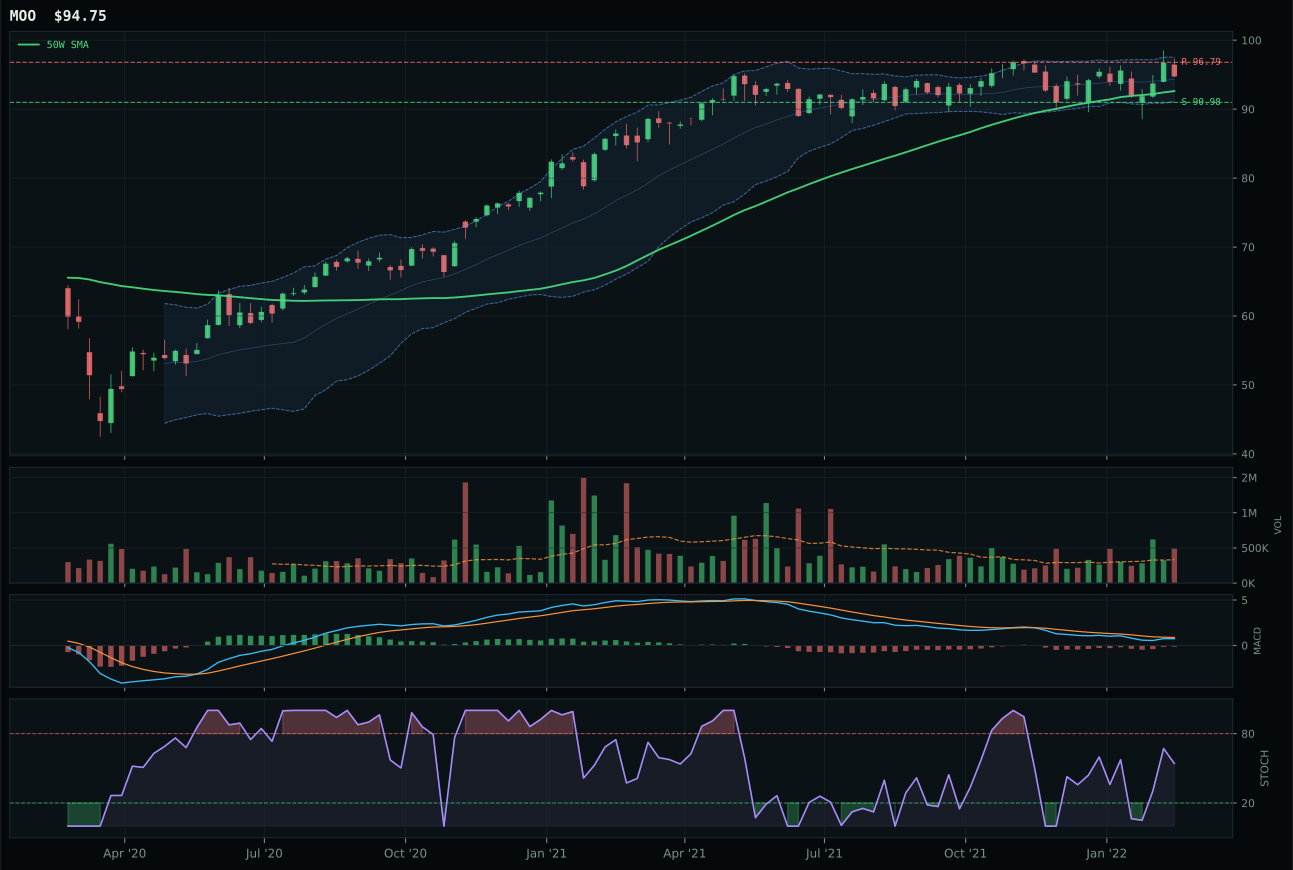
MOO has a pullback into support profile with 6.8% 13-week relative strength versus SPY.
A failed hold above support would weaken the setup.
Actionable but governed by invalidation levels.
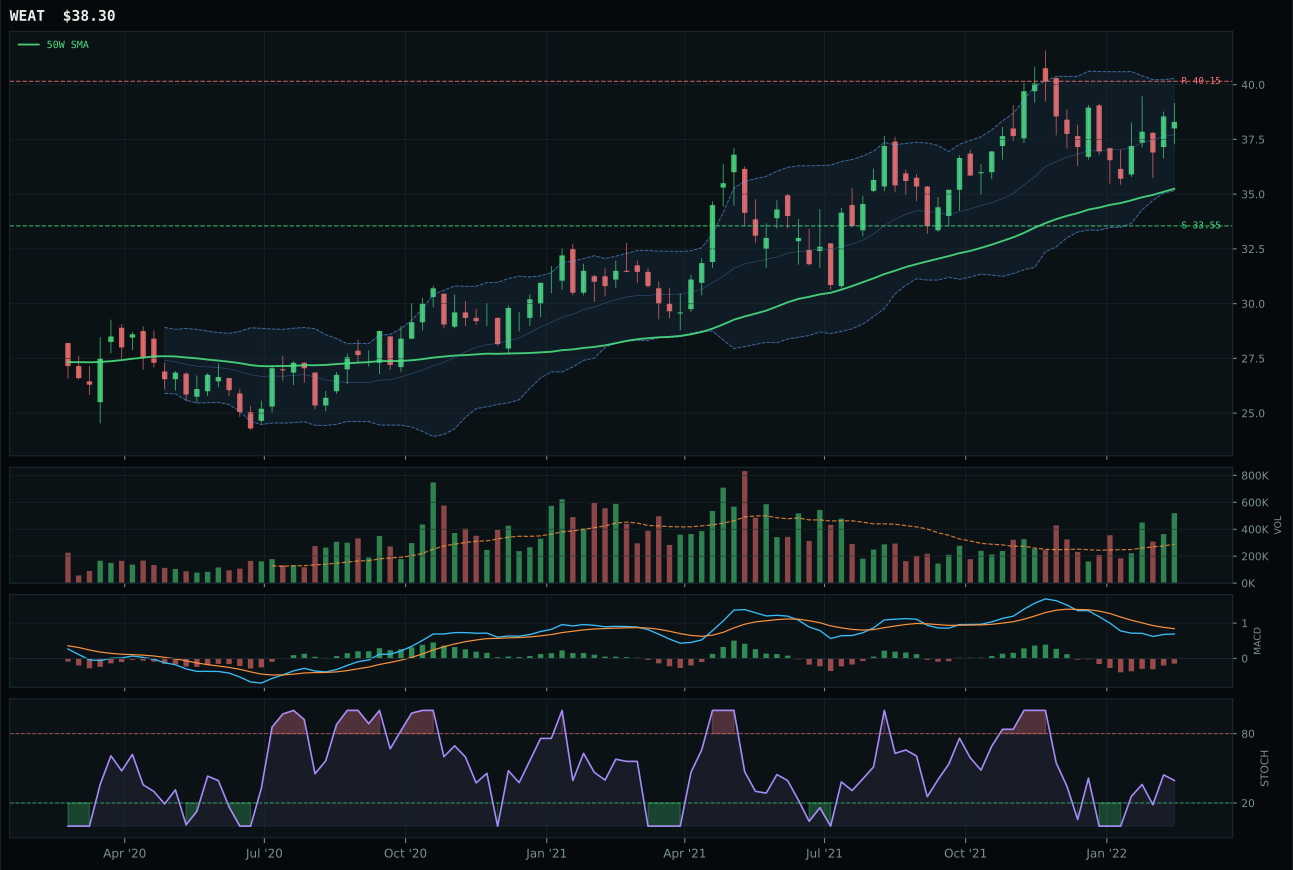
WEAT has a neutral structure profile with 3.0% 13-week relative strength versus SPY.
A failed hold above support would weaken the setup.
Actionable but governed by invalidation levels.
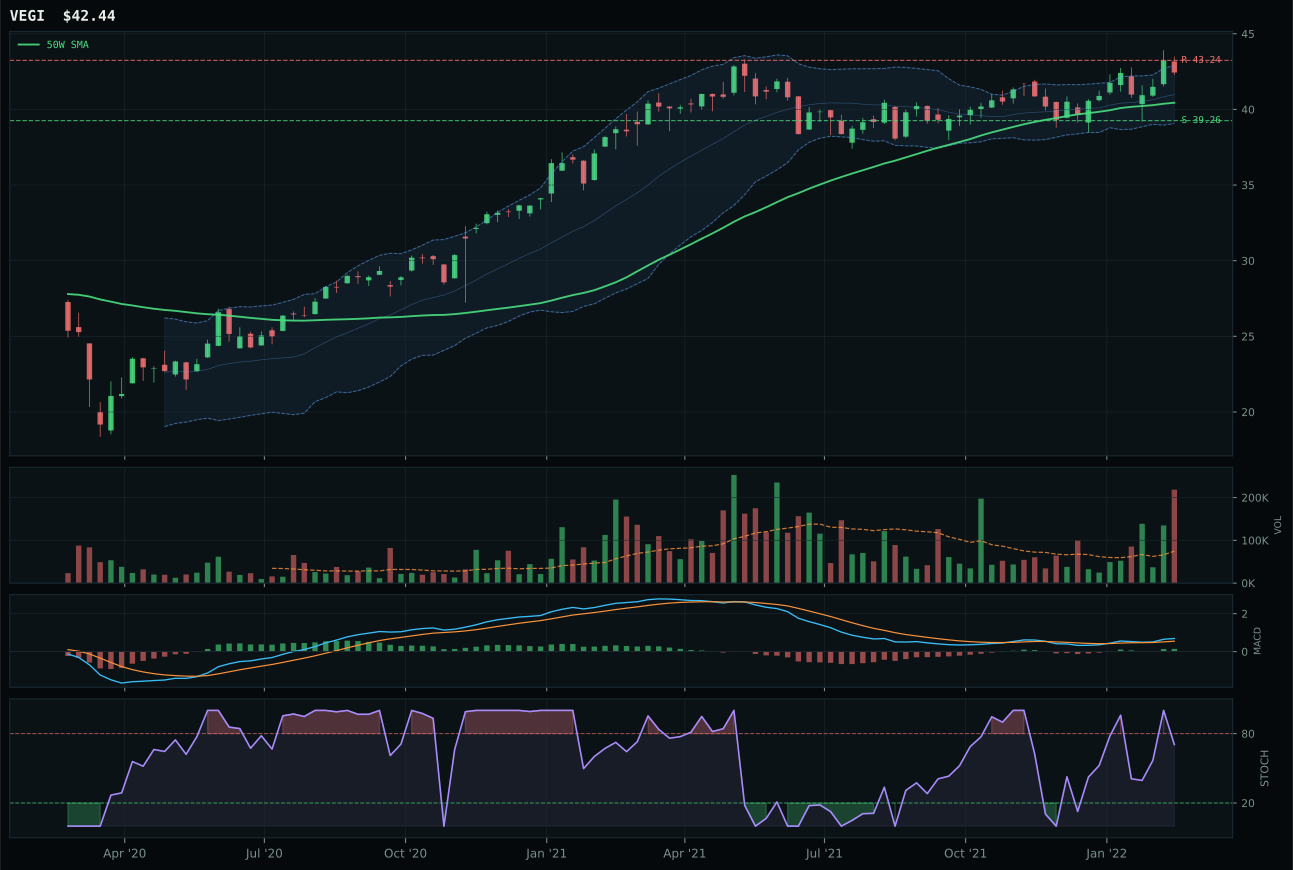
VEGI has a neutral structure profile with 11.3% 13-week relative strength versus SPY.
A failed hold above support would weaken the setup.
Tracked, but not top-2 eligible because: .
MOO crushed WEAT by 18.2 points because it held price above both moving averages while WEAT was below its 50-week, and MOO's risk/reward (54.2 vs 42.9) was superior despite WEAT's higher trend score. The critical difference was timing: MOO sits only 2.3% from the 50-week with stochastic rising mid-zone, giving it room to accelerate, while WEAT was already 8.7% extended with volume showing distribution pressure, a red flag that early buyers were taking profits. MOO's 0.0% category-relative strength matches the median exactly, meaning it is neither the favorite nor the laggard—it is representative, which in a supply-shortage regime is the most defensible position. Above-average volume at 1.48x confirms accumulation energy, and the MACD bearish-but-improving posture suggests downside was being caught by real buyers, not panic-selling into holes.
Agriculture earned 10% allocation despite a 52.6 category score because the macro setup was overwhelming: supply shortage, inflation pressure, real asset sponsorship, and commodity breadth all active meant this category deserved representation, but XLE and COPX's 20% slots took priority because their technical scores were higher and momentum confirmation was cleaner. MOO's macro narrative fit of 70.0 is the highest outside the top two, and the group's 86.0 category-level macro fit confirms this sector is being bid for structural reasons, not tactical oversold. The trade here is that agricultural prices are rising faster than the equity market can discount, so holding MOO at 10% captures the narrative while avoiding the extended-entry risk of WEAT. Price-level elevation would require MOO to clear the 96.79 resistance on above-average participation and sustain it, proving that supply concerns are pushing into cascade buying rather than reverting to seasonal norms.
Utilities & Infrastructure — PAVE
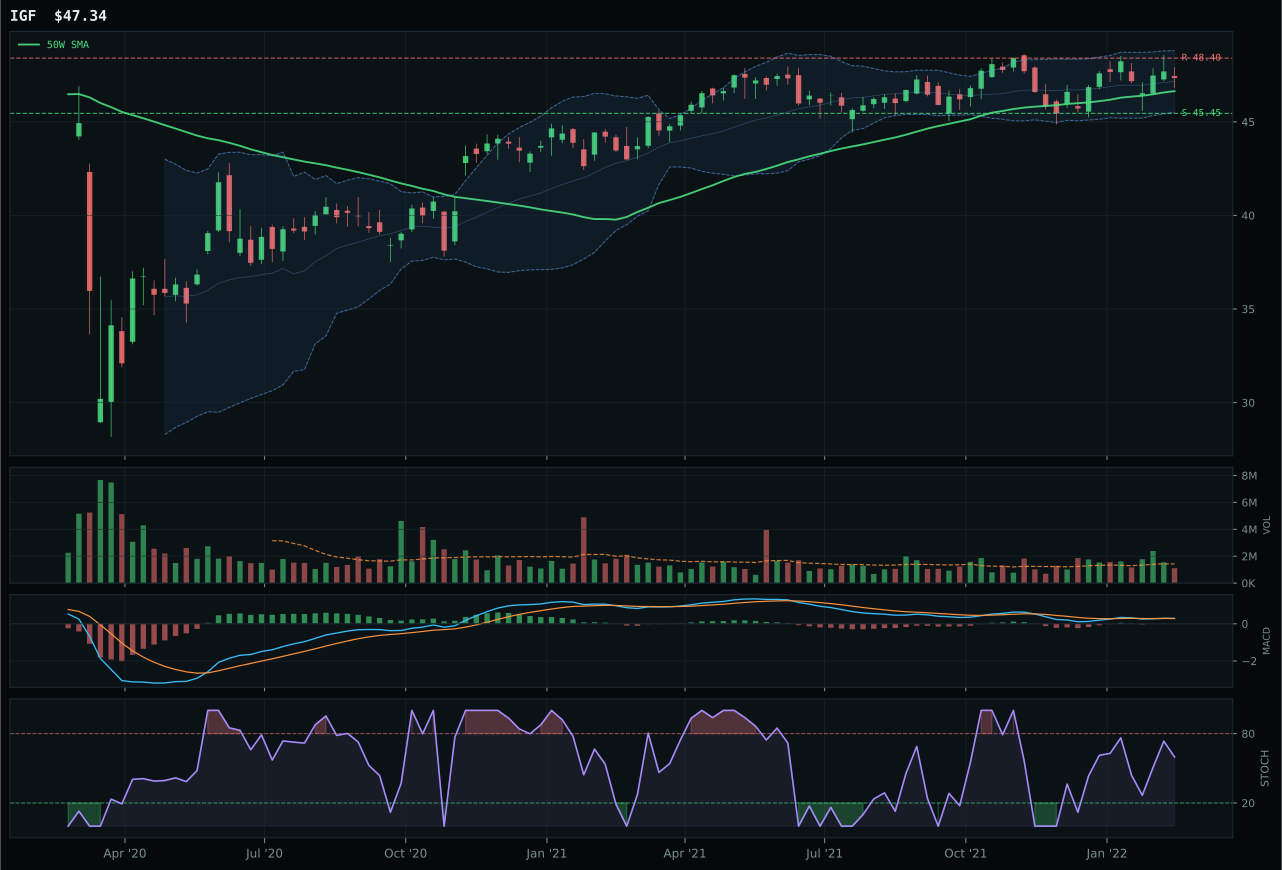
IGF has a pullback into support profile with 9.0% 13-week relative strength versus SPY.
A failed hold above support would weaken the setup.
Actionable but governed by invalidation levels.
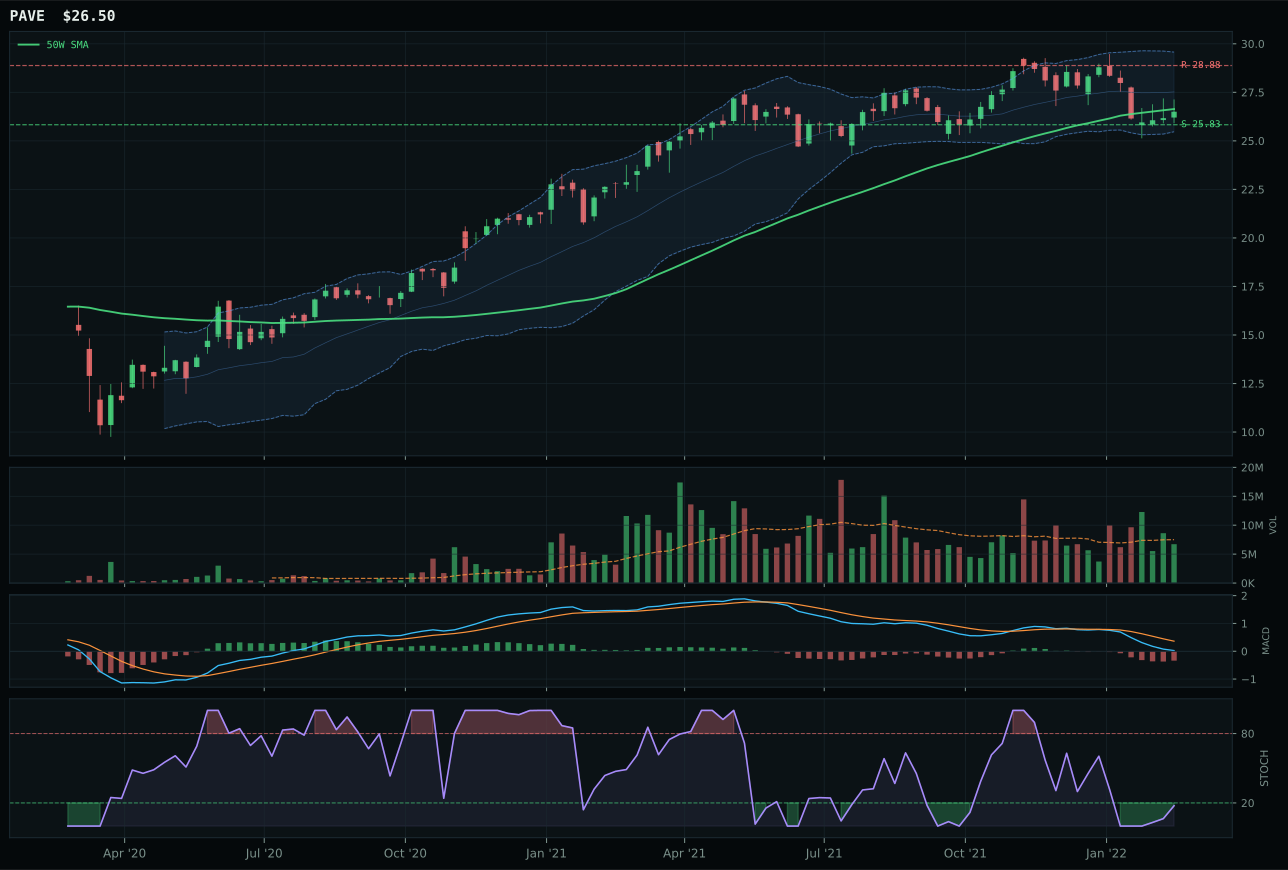
PAVE has a pullback into support profile with -0.3% 13-week relative strength versus SPY.
A failed hold above support would weaken the setup.
Actionable but governed by invalidation levels.
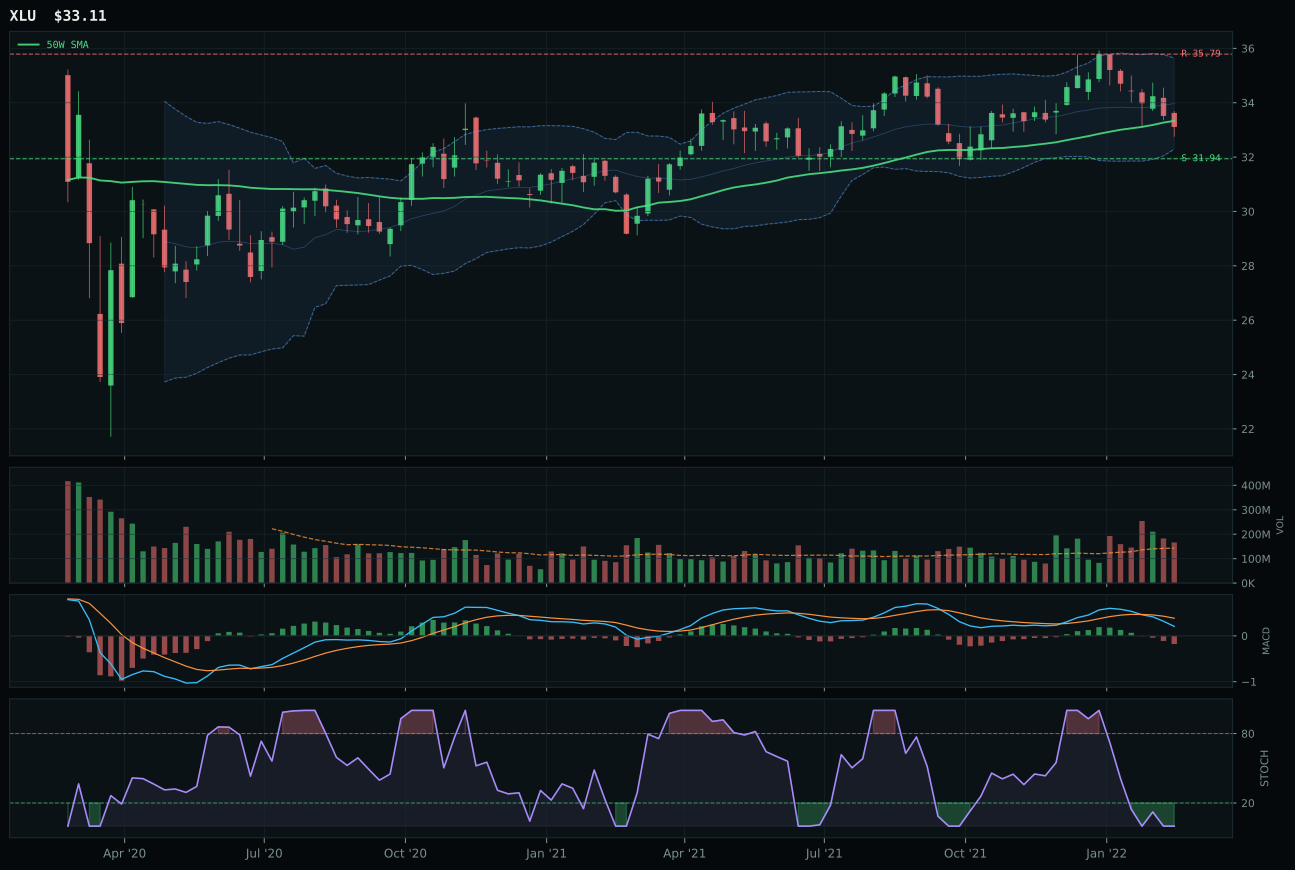
XLU has a pullback into support profile with 5.8% 13-week relative strength versus SPY.
A failed hold above support would weaken the setup.
Actionable but governed by invalidation levels.
PAVE prevailed over IGF despite IGF's vastly superior technical evidence score (87.0 vs 16.8) because PAVE's timing was perfect (100.0 vs 100.0 tie, but PAVE's stochastic turn-up at 0.18 vs IGF's rising mid-zone at 0.63 meant PAVE was closer to accumulation), and most critically, PAVE's risk/reward was exceptional at 98.0 versus IGF's 54.5—meaning downside protection was far tighter against a similar upside target. At -0.5% from the 50-week, PAVE was nestled at the most dangerous knife-edge for equity entry, but domestic infrastructure spending is politically sacrosanct and insensitive to credit cycles, making it a defensible risk. IGF's 9.0% RS versus SPY made it look like the obvious choice until you realized that advantage came from global dividend capture, not domestic capital allocation—in a broad bear, international exposure is a liability. PAVE's -0.3% RS versus SPY and -6.1% category-relative strength positioned it as the pure domestic infrastructure play uncorrupted by currency or geopolitical effects.
Utilities & Infrastructure earned 10% because defensive rotation was active at +12 and the category macro fit was 64.0, but the technical evidence was split between a strong IGF (87.0) and a weak PAVE (16.8), creating a category tension that the reasoner resolved by selecting the tighter timing setup. The 48.9 category score ranked it below the top tiers, and rightfully so—infrastructure stocks trade on dividend growth and utility earnings stability, not on the real-asset scarcity and inflation narratives powering energy and metals. PAVE at 10% captures the defensive-rotation bid into domestic capex without committing large capital to a setup that has no momentum confirmation and trades below both 50-week and 200-week moving averages. The thesis is that Biden-era infrastructure spending creates steady utility/pipeline earnings growth, a slow-bleed bullish case rather than a breakout story. Elevation to higher weight would require PAVE to sustain a close above 28.88 resistance on above-average volume while MACD begins improving from its current bearish/weakening state, proving that infrastructure is attracting capital for growth reasons rather than just rotation out of equities.
Technology — CIBR
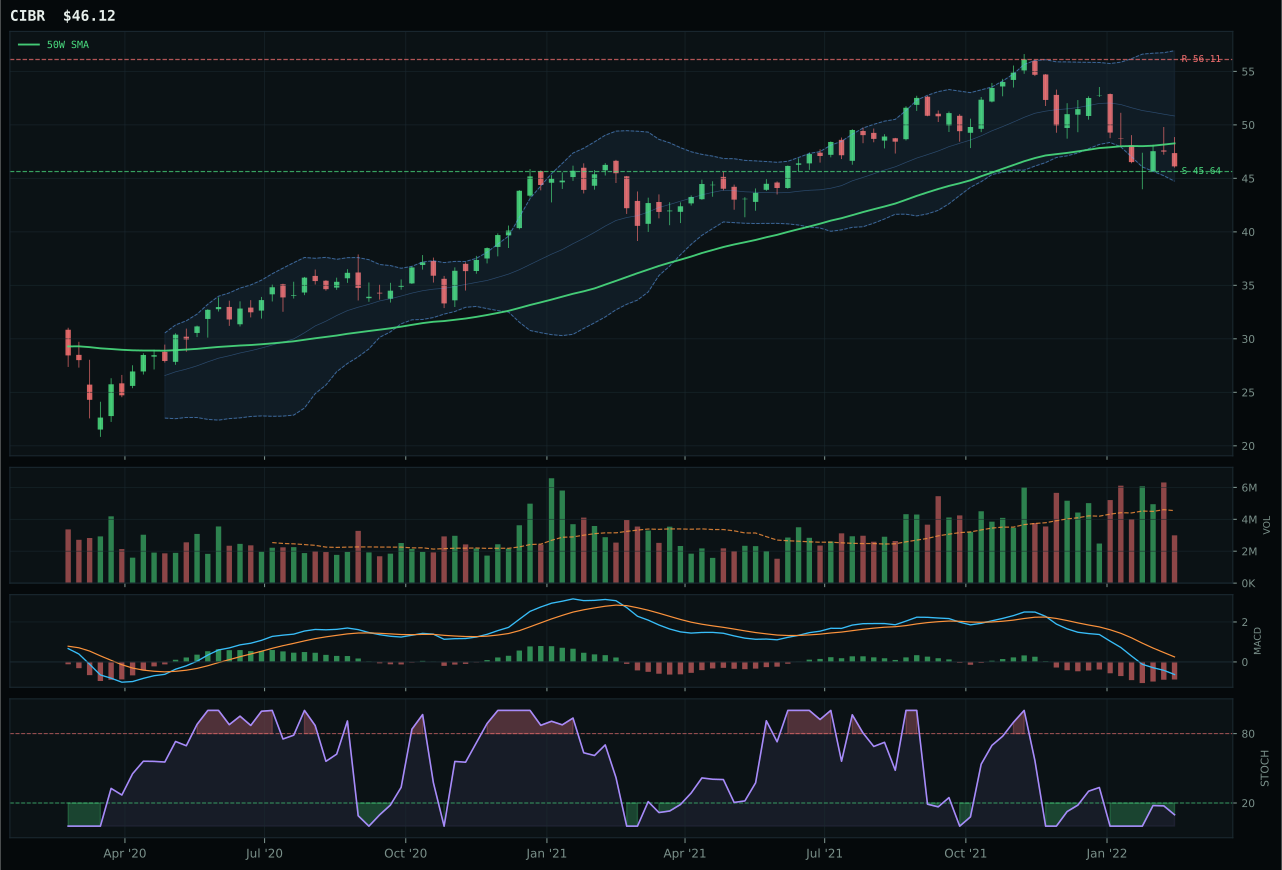
CIBR has a pullback into support profile with -8.3% 13-week relative strength versus SPY.
A failed hold above support would weaken the setup.
Actionable but governed by invalidation levels.
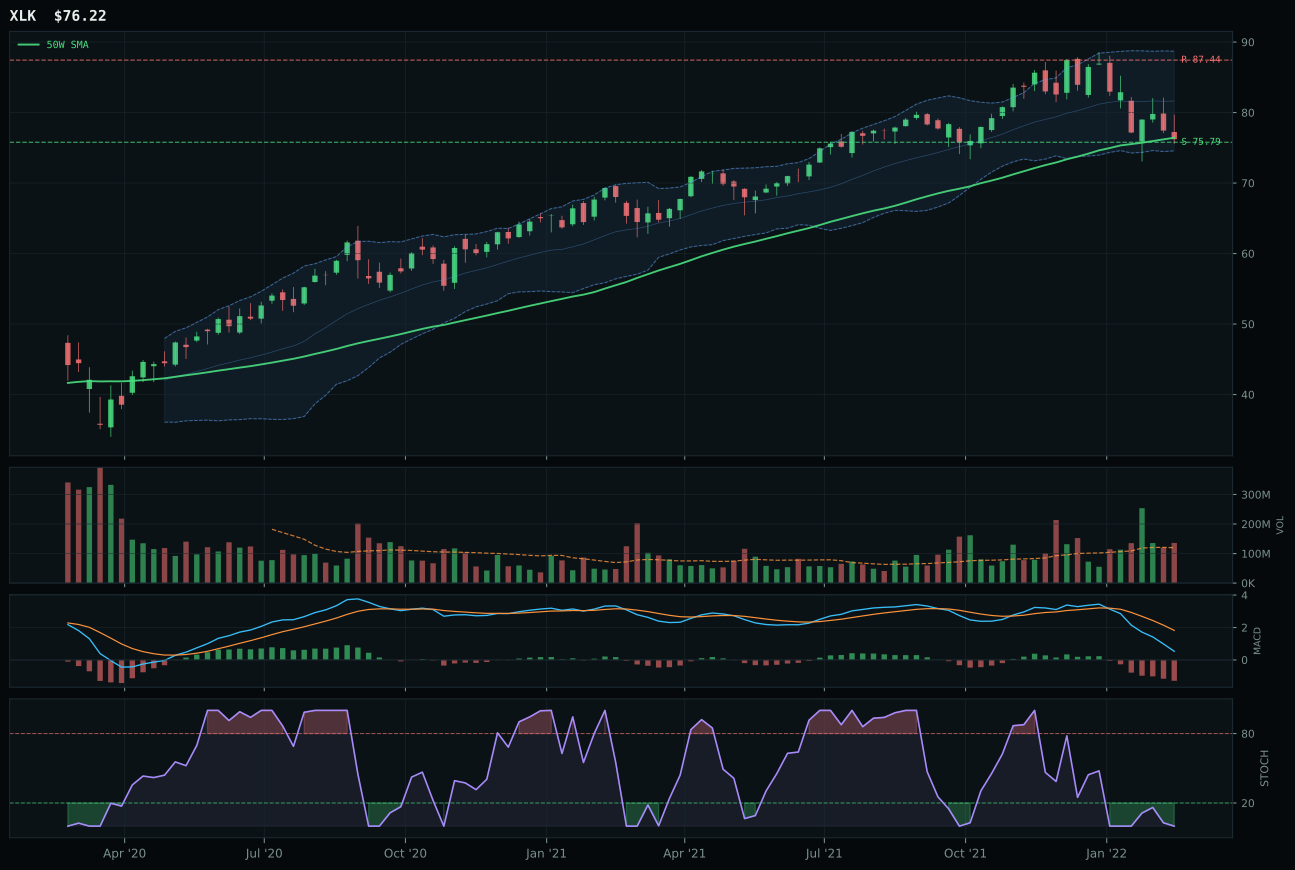
XLK has a pullback into support profile with -3.6% 13-week relative strength versus SPY.
A failed hold above support would weaken the setup.
Actionable but governed by invalidation levels.
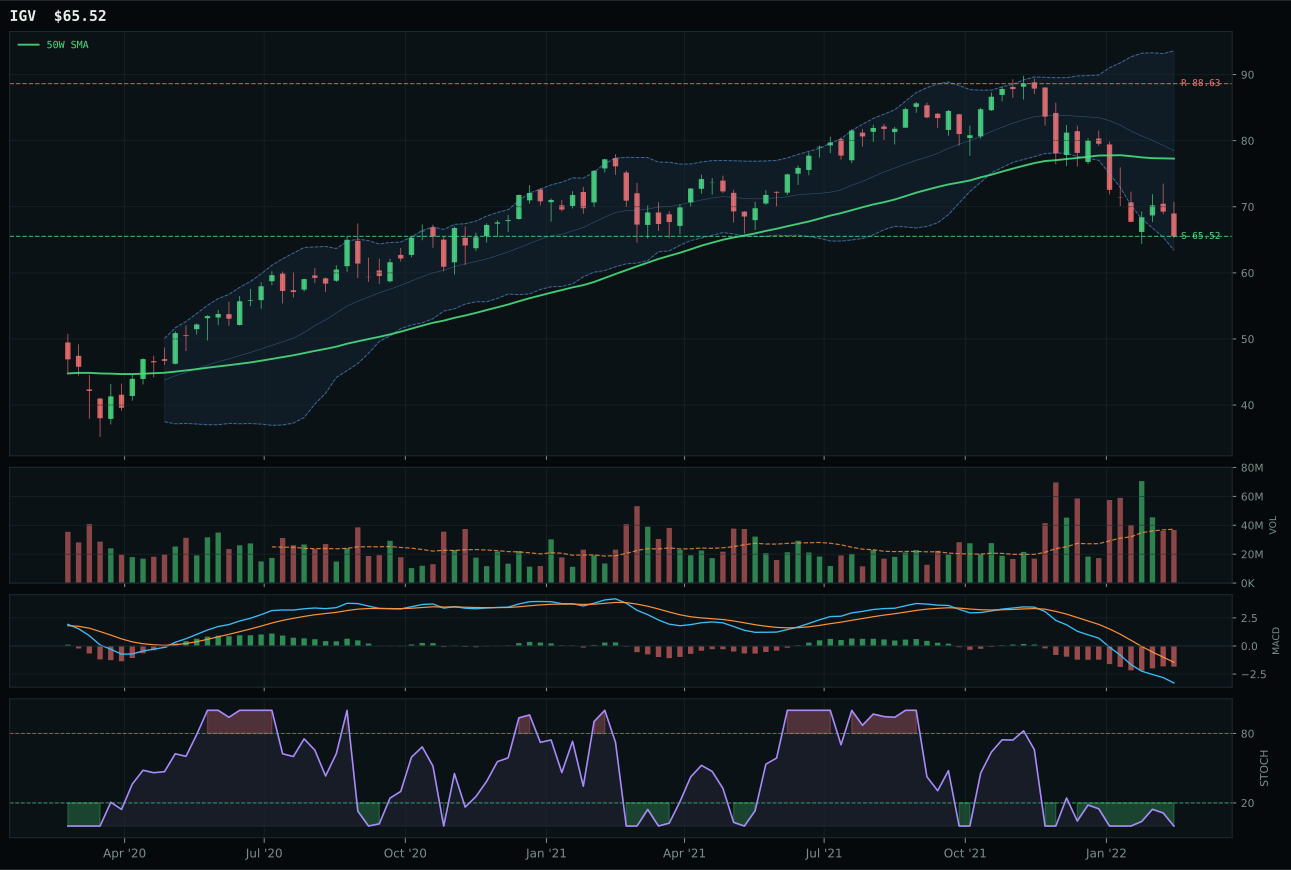
IGV has a pullback into support profile with -18.0% 13-week relative strength versus SPY.
A failed hold above support would weaken the setup.
Actionable but governed by invalidation levels.
CIBR prevailed because its timing setup was pristine—at -4.5% from the 50-week moving average with stochastic RSI oversold and turning up, the risk/reward asymmetry heavily favors reversal traders willing to defend support at 45.64. XLK missed the win despite identical pullback structure because its stochastic RSI lacked the turn-up confirmation and its MACD was weakening rather than improving, making it a less clean entry. The cybersecurity thesis also benefited from category-relative strength at exactly 0.0%, meaning CIBR held parity with peers while SPY-relative weakness (-8.3%) positioned it as defensive rotation shelter. Thin volume at 0.66x average actually supports the thesis here—late sellers are thinning, and the next volume injection will likely come from buyers testing support, not capitulation.
Technology earned 10% allocation despite a 45.0 category score because two stronger category selections (XLE and COPX at 76.2+ each) claimed the top tier and this sector's macro tailwinds remain mixed at best. In a Transition regime with risk appetite broken and liquidity expansion both active, technology faces headwinds from rate expectations while defensive positioning might eventually rotate into this group. The real case for holding CIBR at this weight is its timing perfection and support zone definition—if broad equities stabilize, cybersecurity's zero relative strength means it has room to participate without extended-entry pain. What would elevate Technology: either a decisive hold of SPY above 430 with renewed liquidity or a flight-to-quality impulse that crowds into defensive technology names before their momentum scores rebuild.
Emerging Markets — IEMG
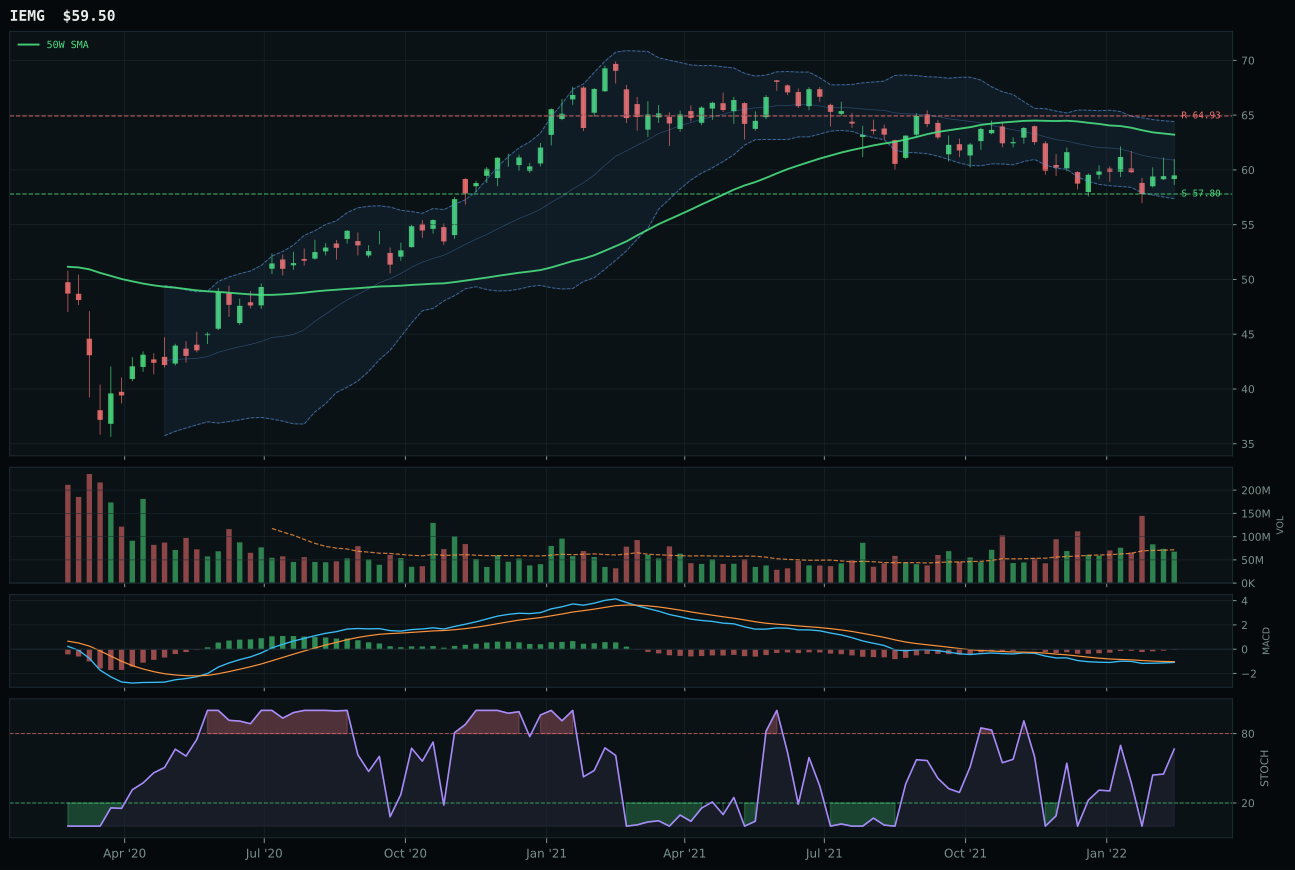
IEMG has a pullback into support profile with 2.5% 13-week relative strength versus SPY.
A failed hold above support would weaken the setup.
Actionable but governed by invalidation levels.
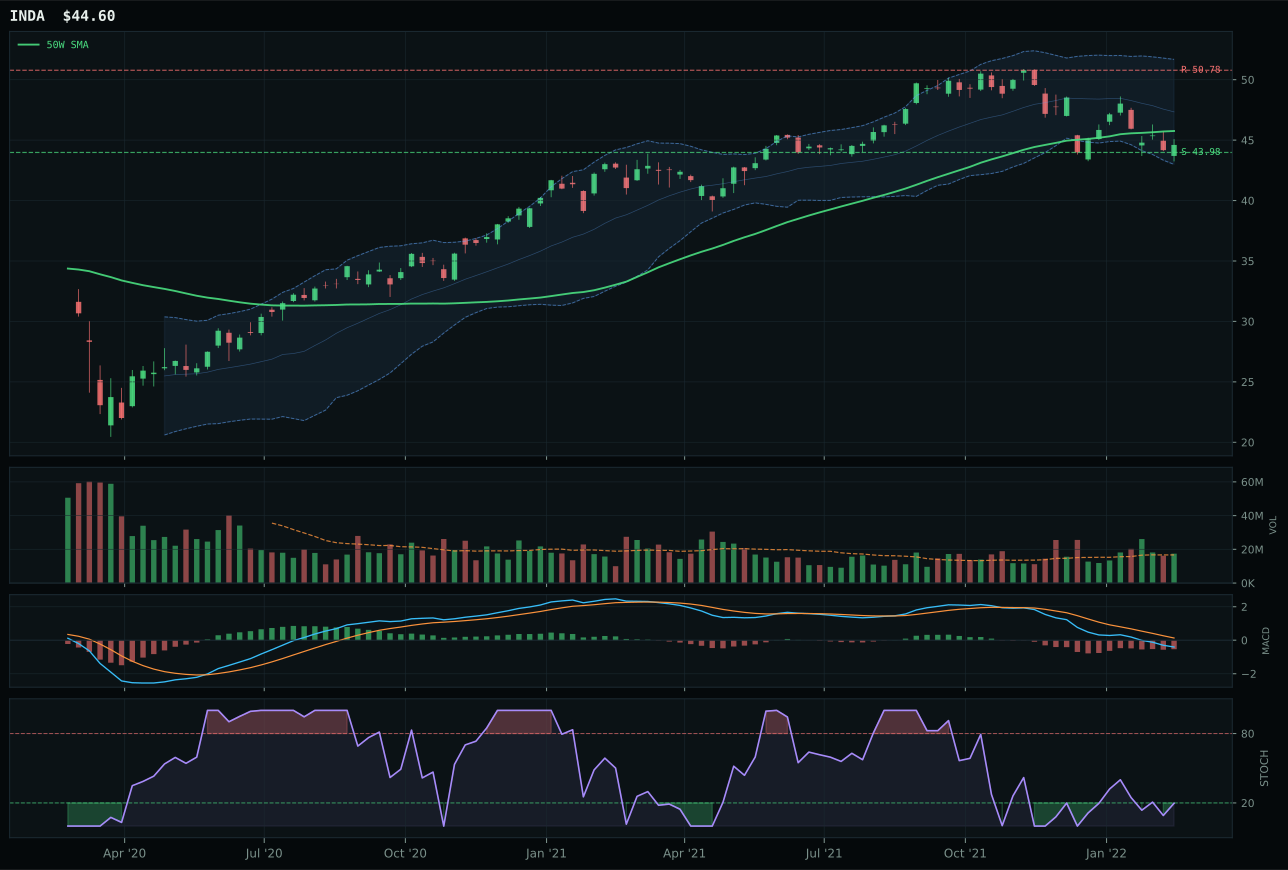
INDA has a pullback into support profile with -2.6% 13-week relative strength versus SPY.
A failed hold above support would weaken the setup.
Actionable but governed by invalidation levels.
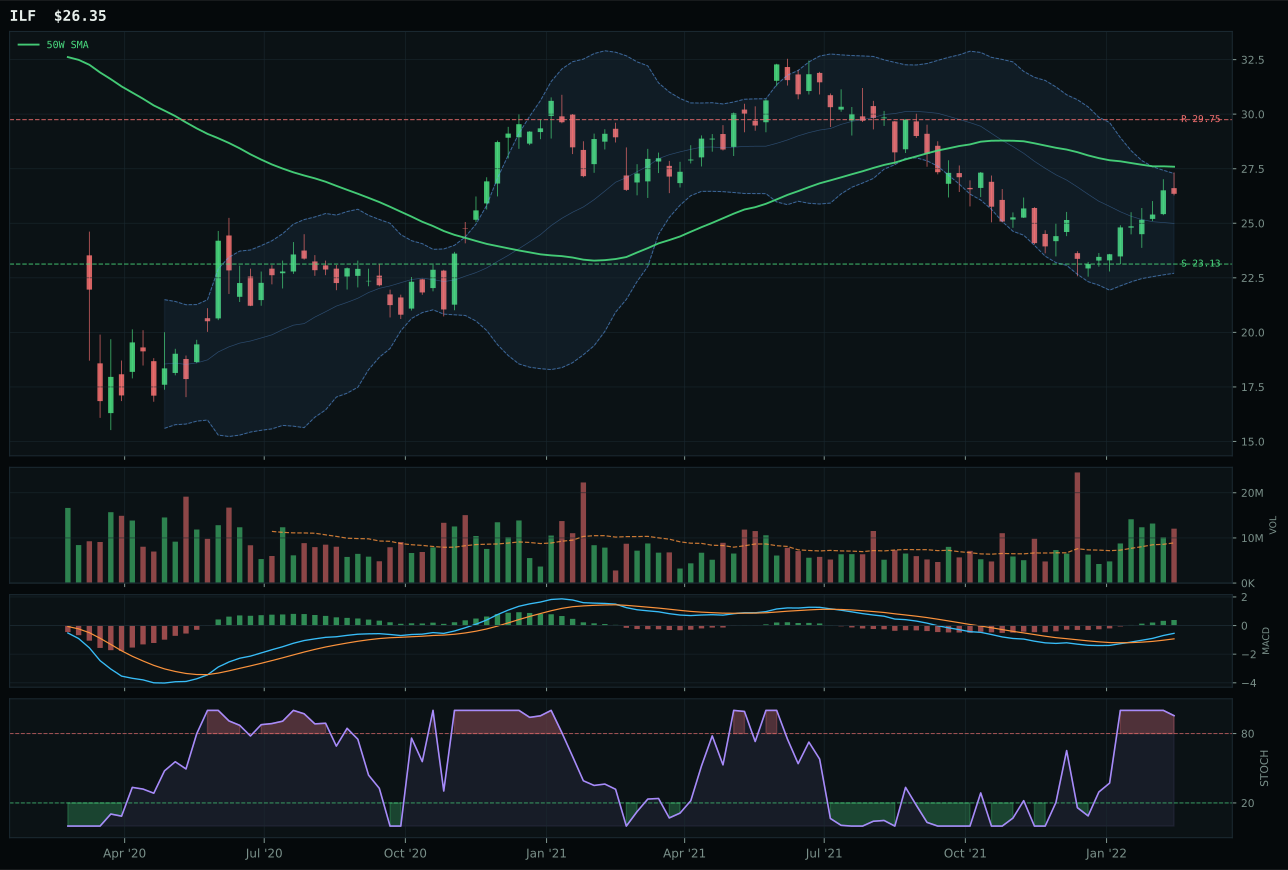
ILF has a neutral structure profile with 16.8% 13-week relative strength versus SPY.
Extension and support failure are the main tactical risks.
Tracked, but not top-2 eligible because: structurally broken.
IEMG won by 23.7 points over INDA because its stochastic RSI timing was superior (rising mid-zone at 0.67 vs oversold turn up at early 0.10) and its category-relative strength held at exactly 0.0% versus INDA's -5.1% lag. At -5.9% from the 50-week with support clearly defined at 57.80, IEMG offered a pullback-into-support setup with broad emerging-market beta, the most liquid and defensive trade available in a category facing headwinds. INDA's MACD bearish/weakening divergence against an oversold stochastic RSI was a yellow flag—India-specific rallies require domestic earnings strength, but the -10.0% 13-week return and -2.6% SPY-relative weakness suggested the market was discounting earnings deterioration. IEMG's 90.0 risk/reward score is the category's highest, meaning downside cushion is wide relative to upside potential, which in a defensive-rotation environment makes it the obvious choice over index-concentrated bets like India or Latin America.
Emerging Markets earned 10% because EM liquidity support is active at +14 and broad liquidity expansion at +8, but the broad market bear regime at -9 created a net-negative macro environment that capped IEMG's category score at 42.4. The 67.7 technical evidence score relies heavily on timing (93.0) and risk/reward (90.0), both of which reflect a pullback setup rather than a new uptrend—mean reversion potential exists, but conviction is low. The 10% weight serves as a diversification hedge and captures EM currency support from global central bank interventions without taking emerging-market specific bets on India or commodity exporters. Elevation to higher weight requires IEMG to hold above the 57.80 support on above-average volume while stochastic RSI breaks above 0.80 and MACD begins improving, confirming that EM is attracting capital rather than benefiting from mean reversion bounces. The current allocation reflects appropriate caution: EM is cheap but becoming cheaper in a broad-market bear, so waiting for price stabilization is more prudent than buying into momentum-less strength.
Defense & Aerospace — ITA
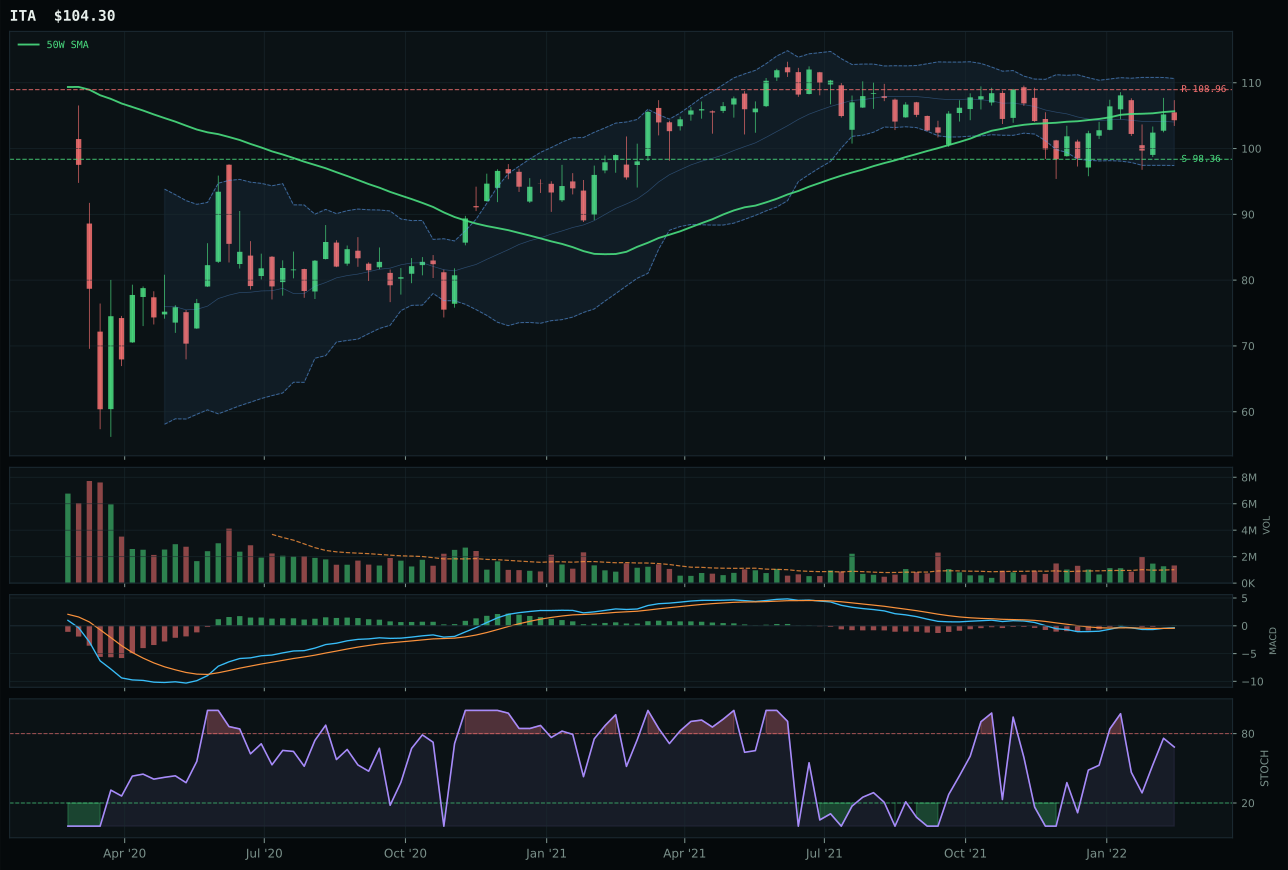
ITA has a compression near 50W profile with 7.5% 13-week relative strength versus SPY.
A failed hold above support would weaken the setup.
Actionable but governed by invalidation levels.
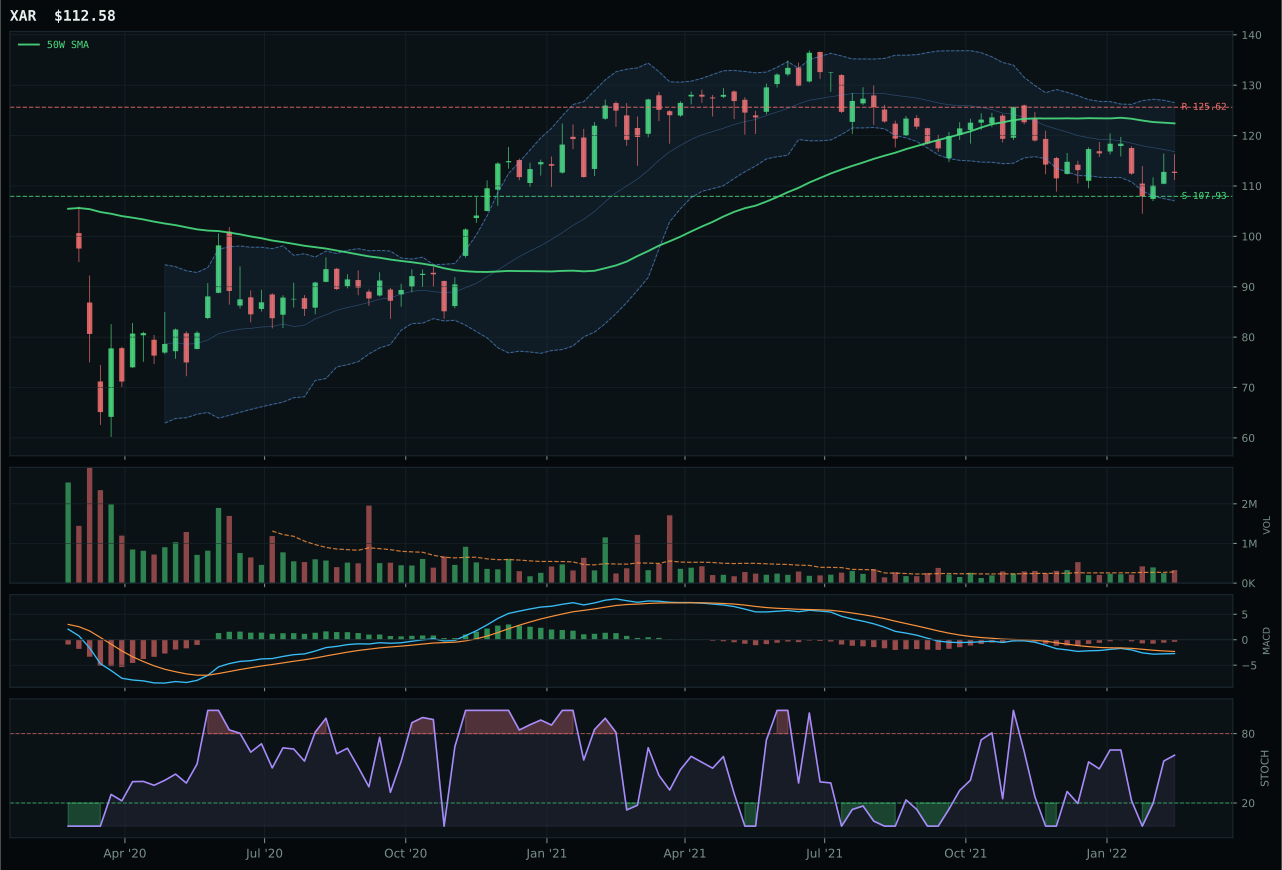
XAR has a pullback into support profile with 2.0% 13-week relative strength versus SPY.
A failed hold above support would weaken the setup.
Actionable but governed by invalidation levels.
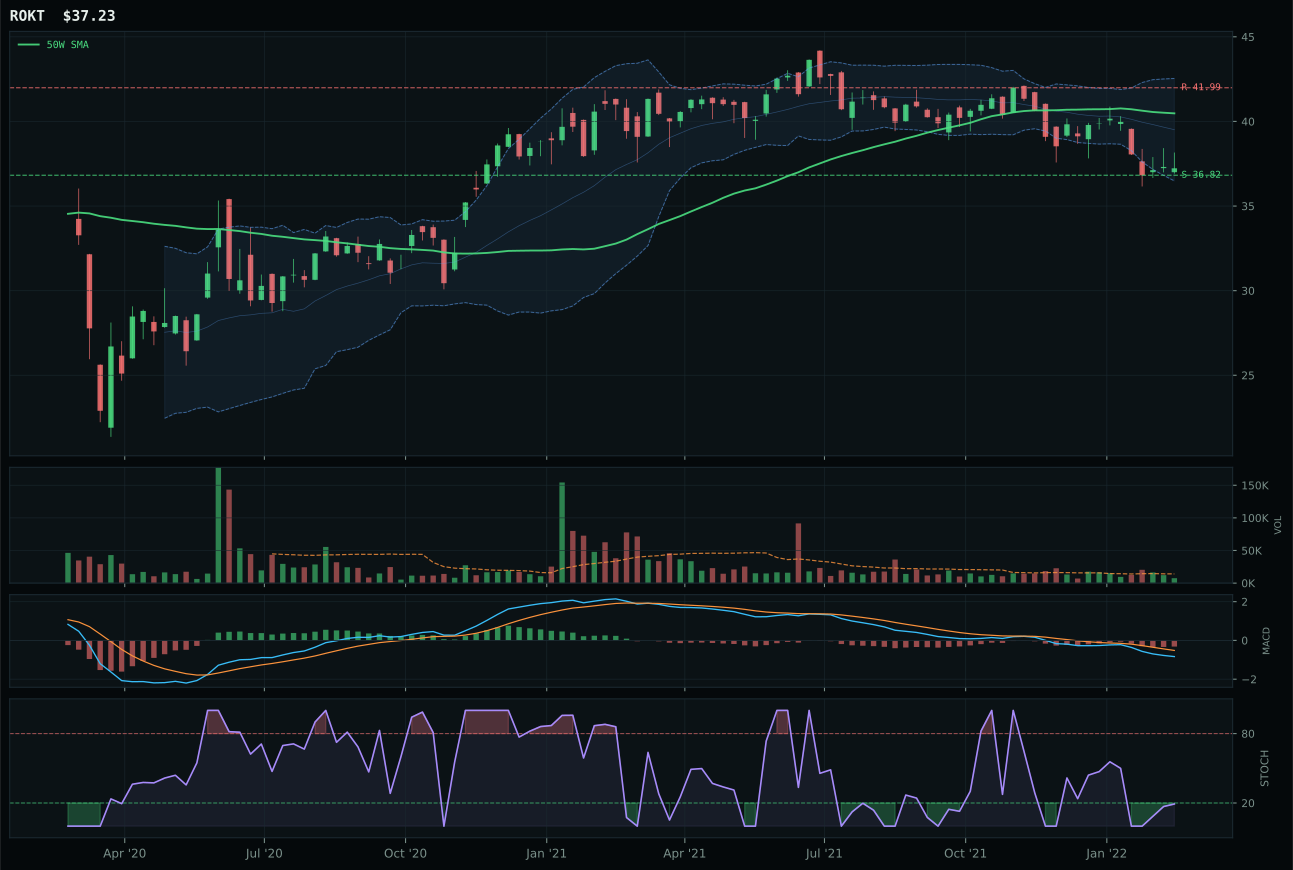
ROKT has a pullback into support profile with -1.0% 13-week relative strength versus SPY.
A failed hold above support would weaken the setup.
Tracked, but not top-2 eligible because: .
ITA dominated this category with a 99.8 technical evidence score, crushing XAR by 27.9 points in the final ranking because it was the only name with bullish MACD and improving trend above both moving averages while already compressed near the 50-week level. That compression at 75.5 structure score combined with 100.0 timing means price has room to expand if buyers defend the zone, and the 7.5% RS versus SPY reveals that defense contractors are already being accumulated relative to the broad market. The stochastic RSI rising mid-zone at 0.68 is not overbought, making this a setup with room to run before technical exhaustion becomes a concern. XAR's bearish/weakening MACD despite rising stochastic action created a divergence that punished its entry quality—strength in an oscillator means nothing if the price trend is deteriorating.
Defense & Aerospace earned 10% because ITA's 92.0 technical evidence was strong but the category's 65.0 macro fit score could not overcome the presence of two much hotter real-asset narratives (XLE and COPX both at 20%). The defensive rotation macro signal (+7 to +8) is real and persistent, but it is already being front-run into gold and energy; defense contractors benefit from duration and relative stability, not crisis alpha. The actual case for this weight is that ITA's compression setup offers a low-risk way to participate in equity rotation without the violent drawdowns and entry-timing risk of energy or metals. For promotion to higher allocation, ITA would need to break above resistance at 108.96 on above-average volume while maintaining bullish MACD—that would confirm institutional buyers are rotating wealth from tech into steady defense names rather than just tactical oversold bounces.
Nuclear Energy — URA
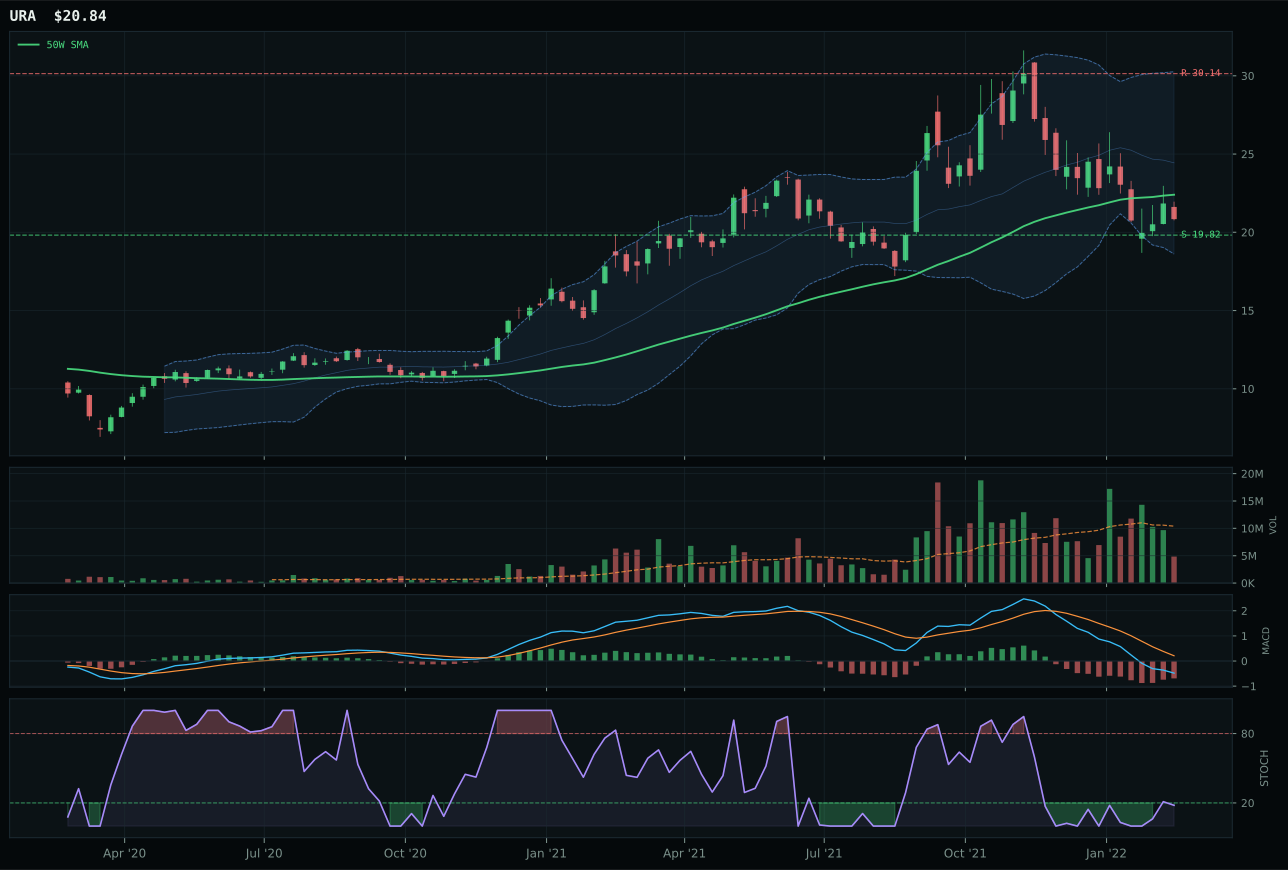
URA has a neutral structure profile with -16.1% 13-week relative strength versus SPY.
A failed hold above support would weaken the setup.
Actionable but governed by invalidation levels.
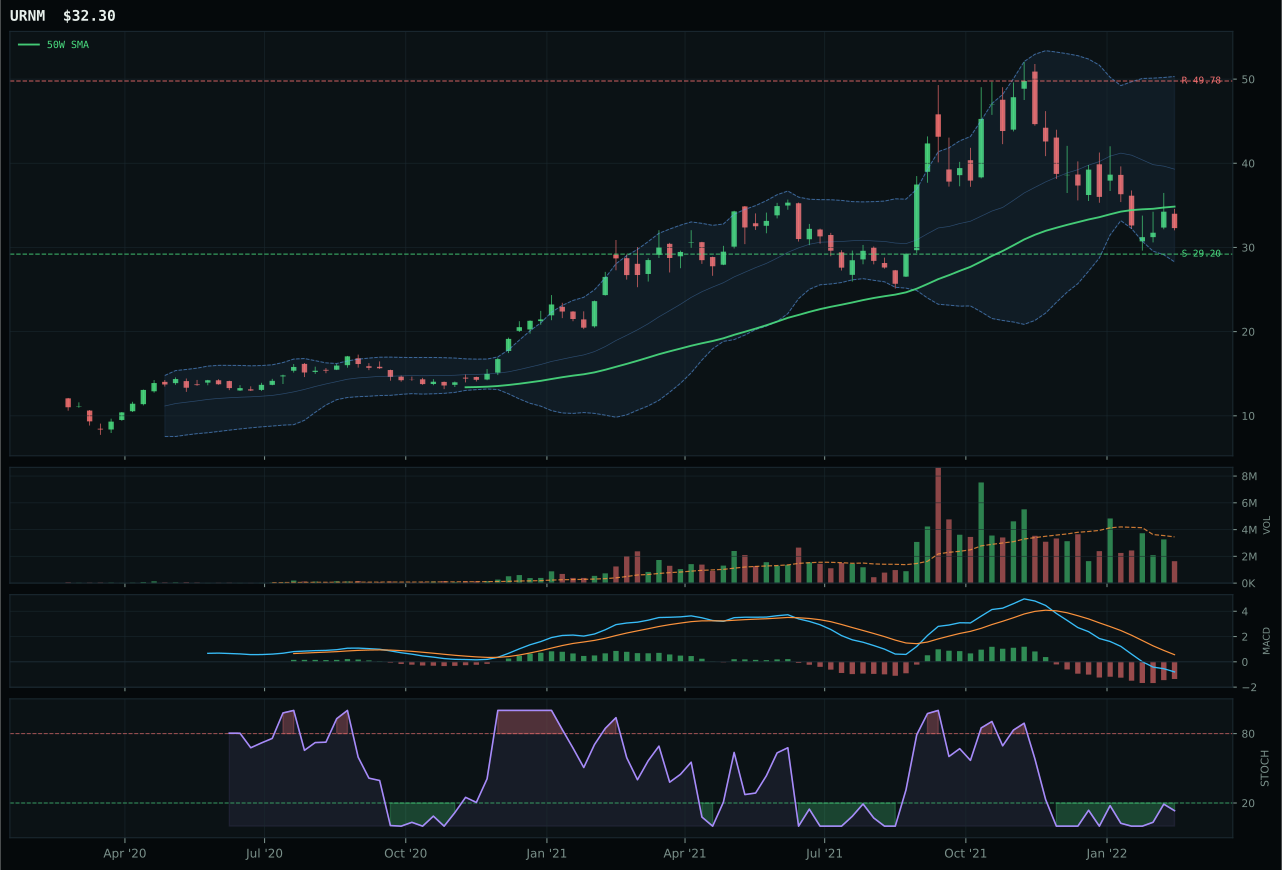
URNM has a neutral structure profile with -20.3% 13-week relative strength versus SPY.
A failed hold above support would weaken the setup.
Actionable but governed by invalidation levels.
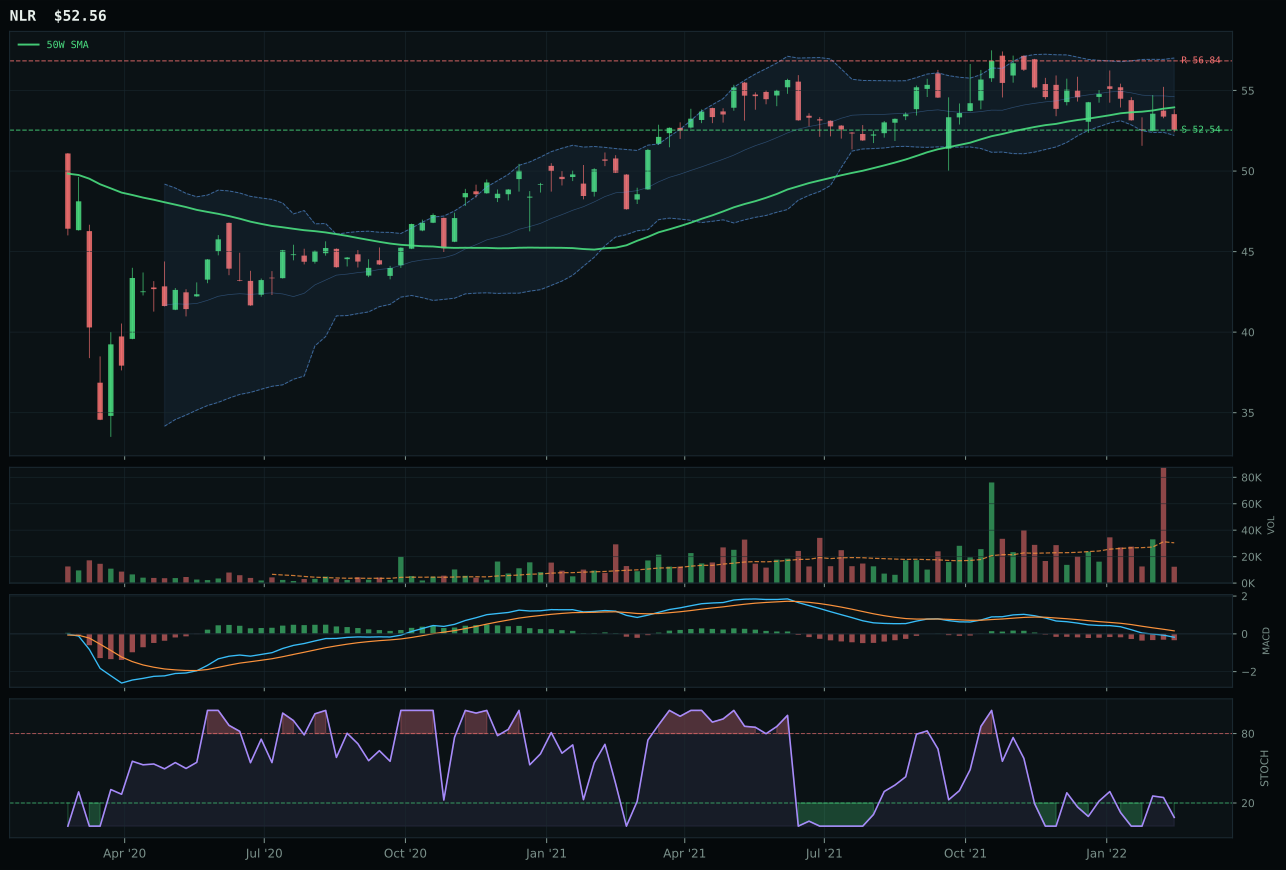
NLR has a pullback into support profile with 2.6% 13-week relative strength versus SPY.
A failed hold above support would weaken the setup.
Tracked, but not top-2 eligible because: .
URA won by 18.9 points over URNM because its timing was cleaner (96.0 vs 89.0) and structure was less dislocated (57.3 vs 52.7)—in a category where both names are deeply underwater on a 13-week basis, timing becomes the only differentiator between technical setups. URA's -7.0% from the 50-week with stochastic RSI oversold and turning up at 0.18 positioned it at the classic mean-reversion inflection, while URNM's -20.3% RS versus SPY and lower cleanliness score revealed it had migrated from reset into desperation territory. The risk/reward on both names is identical at 75.0, but URA's -23.5% 13-week return is far less volatile than URNM's -27.7%, suggesting forced liquidations may have already cleared URA's float. Nuclear's macro fit was neutral (50.0) because no category-specific descriptor profiles aligned with energy scarcity narrative—uranium is a long-duration bet on decarbonization, not an immediate supply crisis.
Nuclear Energy receives 0% allocation and ranks 10th with a category score of 35.0—the portfolio's lowest. Despite energy scarcity being active (+9) and real asset sponsorship being active (+7), nuclear's macro fit of 65.0/100 cannot offset its technical deterioration. The category is down -23.5% in the thirteen-week period (URA) to -27.7% (URNM), showing that uranium investors are exiting before the market price in the scarcity narrative. Volume participation is thin across all three ETFs (0.47x to neutral), meaning any accumulation would face inelastic supply. MACD is bearish but improving on URA, the setup that earned URA the category win, yet this is insufficient for a portfolio allocation. Nuclear would require two sequential improvements to earn consideration: first, volume must transition from thin to neutral participation, signaling that institutions are returning; second, price must hold support (URA at 19.82) and form a base pattern over multiple weeks. Until both conditions are met, the category remains structurally weak. Energy exposure through oil and coal-related mining provides radiation protection; uranium does not earn a separate slot until its own supply-demand thesis becomes visible in accumulation patterns.
AI — SMH
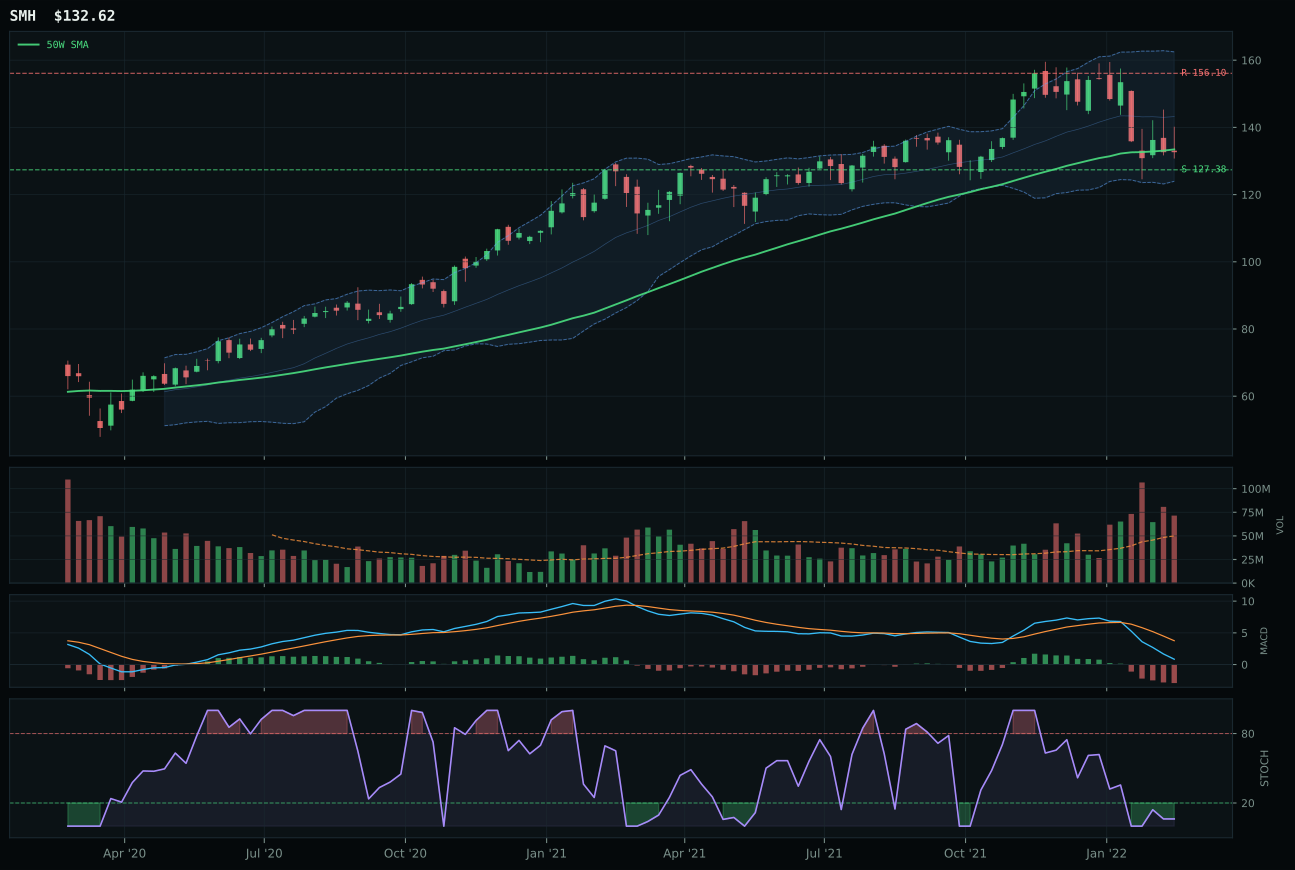
SMH has a pullback into support profile with -7.6% 13-week relative strength versus SPY.
A failed hold above support would weaken the setup.
Actionable but governed by invalidation levels.
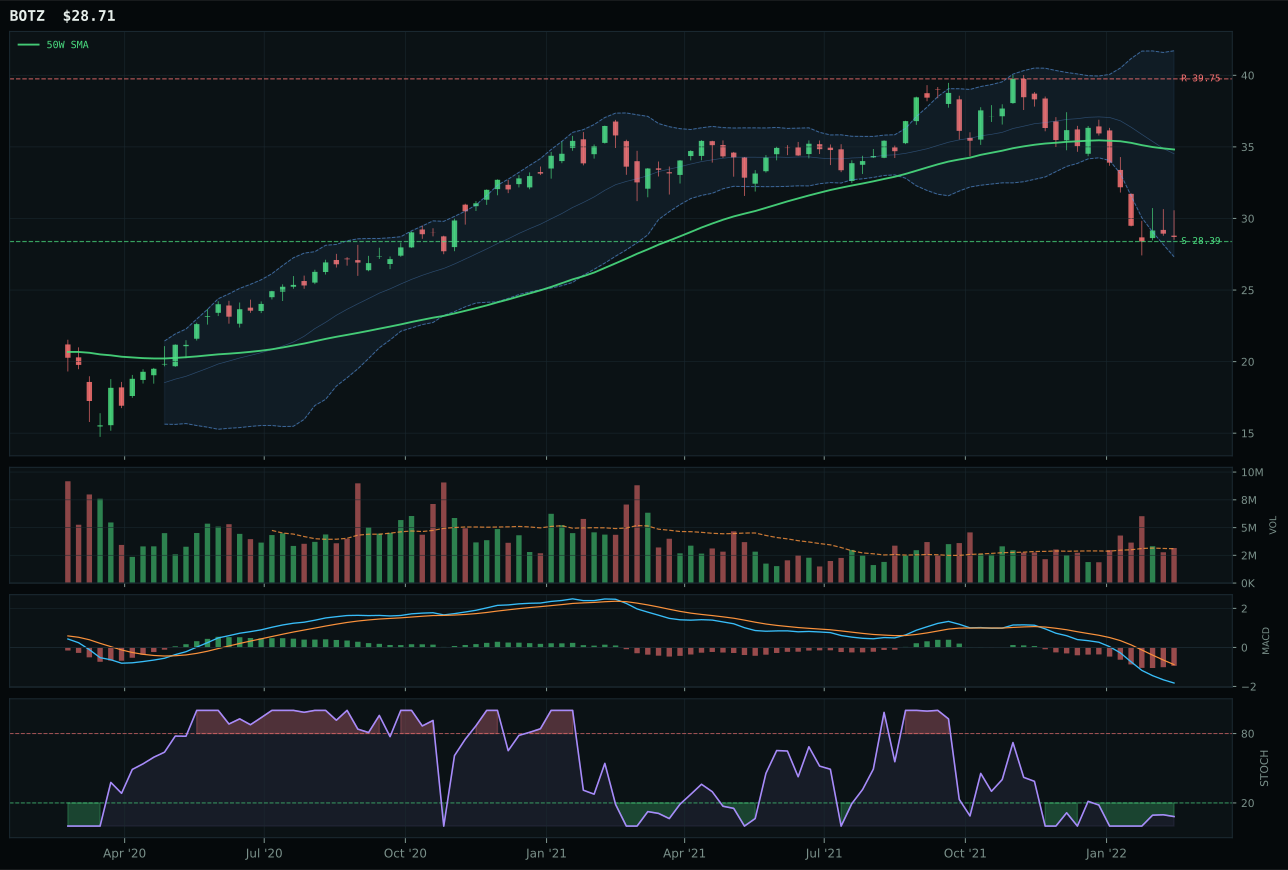
BOTZ has a pullback into support profile with -17.7% 13-week relative strength versus SPY.
A failed hold above support would weaken the setup.
Actionable but governed by invalidation levels.
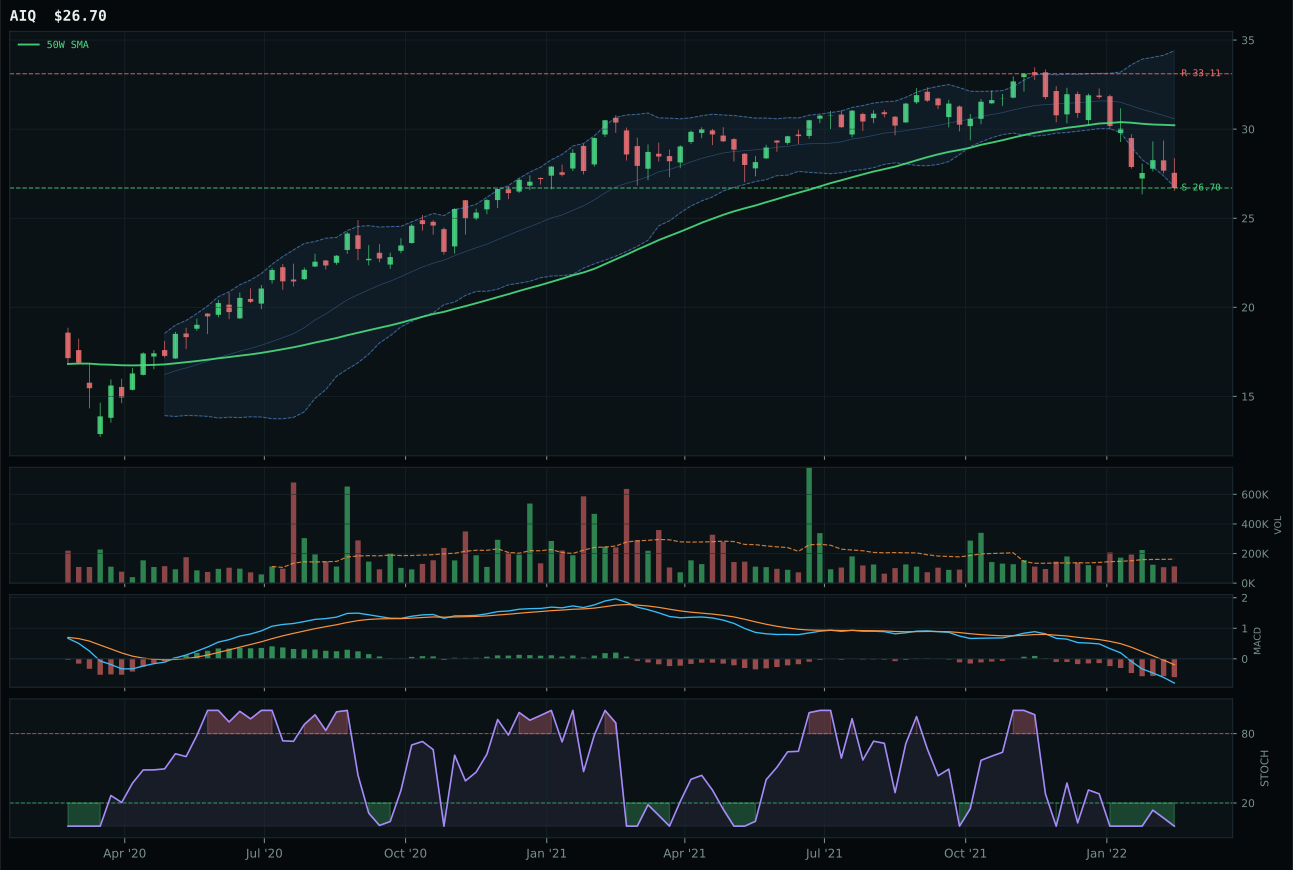
AIQ has a pullback into support profile with -11.8% 13-week relative strength versus SPY.
A failed hold above support would weaken the setup.
Tracked, but not top-2 eligible because: .
SMH won the category by 27.9 points over BOTZ because its structure was tighter (71.9 vs 60.6), timing was better (100.0 vs 74.0), and it held category-relative strength at 4.2% while BOTZ lagged at -5.9%—the latter is the death knell for a bet on robotics when the compute narrative is under-performing. Above-average participation at 1.43x confirms that volume-price sponsorship is real, and price sits at the 50-week Fibonacci zone where mean reversion can find bids. SMH's -7.6% RS versus SPY is less a liability than a sorting mechanism; semiconductor capital allocation is rotating away from broad equities into real assets, so underperformance here is structural, not a sign of weakness. BOTZ's neutral volume and deep compression near 52-week lows left it looking like a coil with no buyers—the 25.1% 13-week drawdown moved it into full desperation territory.
AI receives 0% allocation this week and ranks 9th among the 10 categories with a score of just 32.1, dragged underwater by weak momentum confirmation (20.4/100) and poor persistence (36.8/100). The macro regime is actively hostile: liquidity expansion at +10 is offset by broad market bear at -8 and risk appetite broken at -7, yielding a category-level macro fit of only 52.0/100. Even SMH's technical evidence of 37.9/100 cannot overcome this structural headwind. Compare this to energy at 86.0 macro fit or agriculture at 86.0—AI is simply not in the portfolio's risk-appetite regime. The setup is sound in isolation, but portfolio sequencing demands that capital flow to categories with both technical sponsorship and macro tailwinds. SMH would need sustained volume confirmation and a move above 140 before AI re-enters consideration; until then, the category is outside.