
2022-02-11
Informational purposes only. The content in this report, including allocations, analysis, and commentary, is provided solely for informational and educational purposes. It does not constitute financial advice, investment advice, trading advice, or any other type of advice. Past performance does not guarantee future results. Always conduct your own research and consult a qualified financial professional before making investment decisions.
Macro risk engine requires the 50% Defensive overlay for this run; payload selected by cause: Inflation Scarcity.
Weekly Allocation
| Ticker | Category | Weight | Role |
|---|---|---|---|
| XLE | Traditional Energy | 60% | Overlay |
| WEAT | Agriculture & Livestock | 10% | Top-2 (10%) |
| COPX | Industrial Metals | 5% | Tier-2 (5%) |
| GLD | Precious Metals | 5% | Tier-2 (5%) |
| IGF | Utilities & Infrastructure | 5% | Tier-2 (5%) |
| CIBR | Technology | 5% | Tier-2 (5%) |
| ITA | Defense & Aerospace | 5% | Tier-2 (5%) |
| IEMG | Emerging Markets | 5% | Tier-2 (5%) |
Trade Instructions — Monday Open
Sell the tranche from 2022-01-14 (completing its 4-week hold). Buy the new tranche. Instructions show net portfolio changes — same-asset positions cancel, weight changes show the delta.
| Action | Ticker | Instruction |
|---|---|---|
| SELL | COPX | Sell 25% of COPX position (reduce 15.00% → 11.25%) |
| SELL | IGF | Sell 14% of IGF position (reduce 8.75% → 7.50%) |
| SELL | MOO | Sell 29% of MOO position (reduce 8.75% → 6.25%) |
| SELL | INDA | Sell entire INDA position (2.50% of portfolio) |
| SELL | GLD | Sell 11% of GLD position (reduce 11.25% → 10.00%) |
| SELL | ITA | Sell 14% of ITA position (reduce 8.75% → 7.50%) |
| SELL | XLK | Sell 29% of XLK position (reduce 8.75% → 6.25%) |
| BUY | XLE | Buy XLE — 66.67% of freed cash (adds 10.00% to portfolio) |
| BUY | IEMG | Buy IEMG — 8.33% of freed cash (adds 1.25% to portfolio) |
| BUY | WEAT | Buy WEAT — 16.67% of freed cash (adds 2.50% to portfolio) |
| BUY | CIBR | Buy CIBR — 8.33% of freed cash (adds 1.25% to portfolio) |
Current Portfolio After Trade
Combined holdings across all 4 active tranches. Each tranche is 25% of the portfolio.
| Ticker | % of Portfolio | Weight Bar |
|---|---|---|
| XLE | 40.00% | |
| COPX | 11.25% | |
| GLD | 10.00% | |
| IGF | 7.50% | |
| ITA | 7.50% | |
| MOO | 6.25% | |
| XLK | 6.25% | |
| URA | 3.75% | |
| IEMG | 3.75% | |
| WEAT | 2.50% | |
| CIBR | 1.25% |
Macro Regime — Transition / Mixed
growth data is not confirming the weak market-implied risk appetite signal
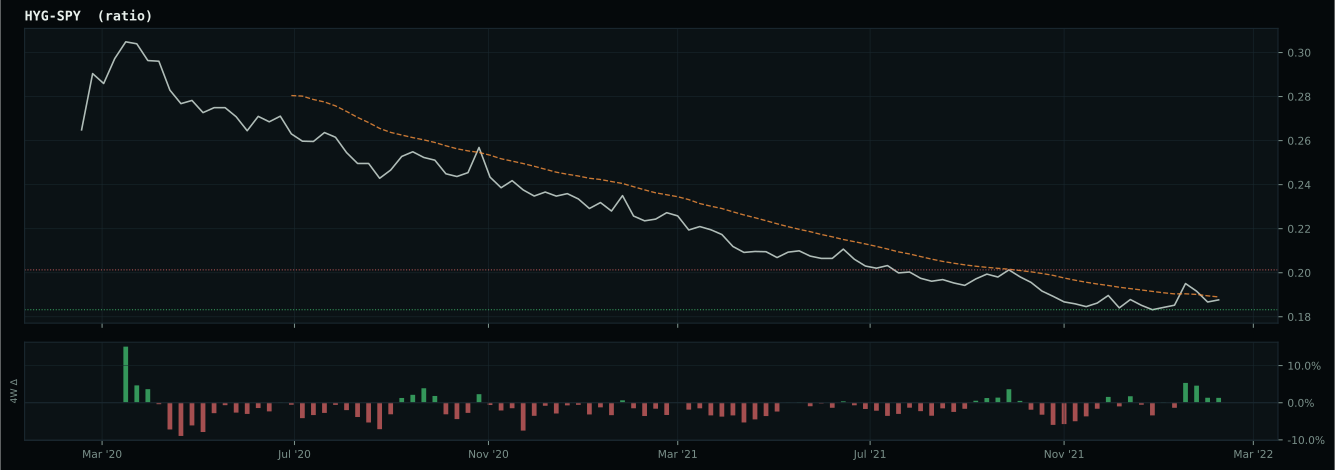
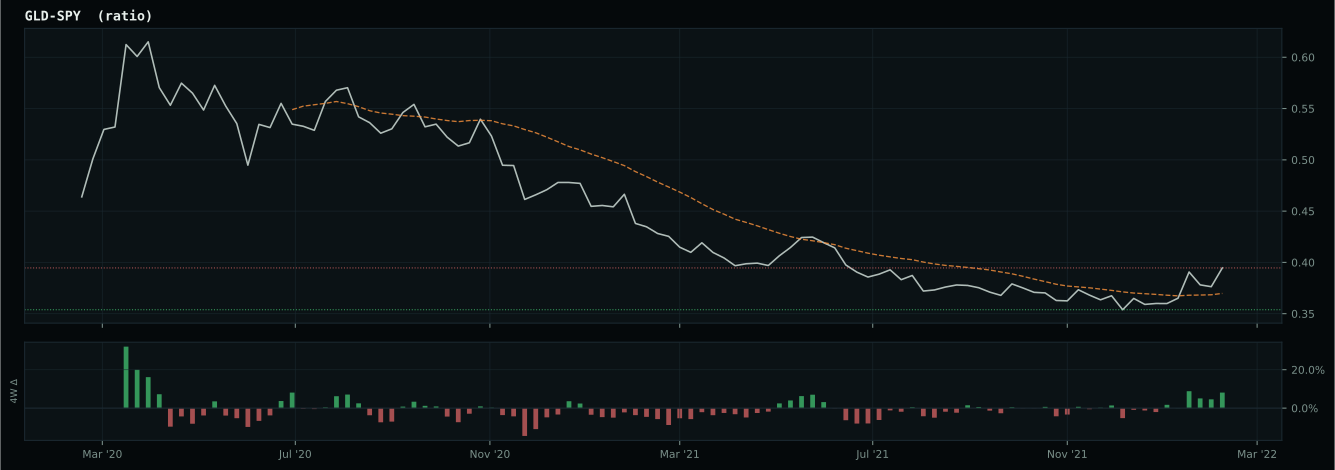
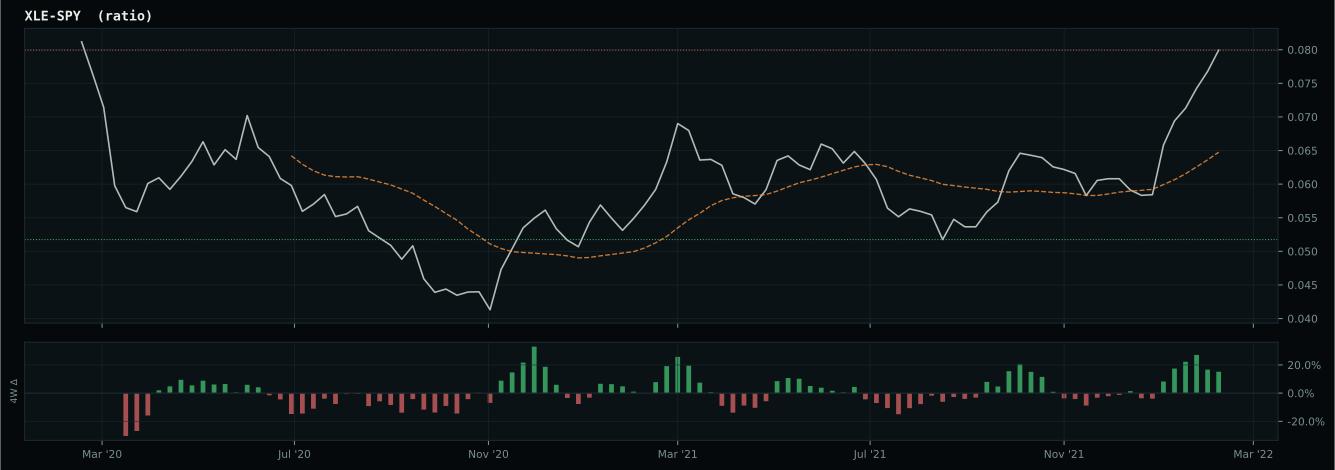
Defensive overlay cause is inflation/scarcity: energy, commodity breadth, or oil-versus-gold confirmation is stronger than the broad equity tape, so the sleeve owns the inflation pressure. XLE has been confirmed above its 8W SMA and is eligible.
Macro Evidence Charts
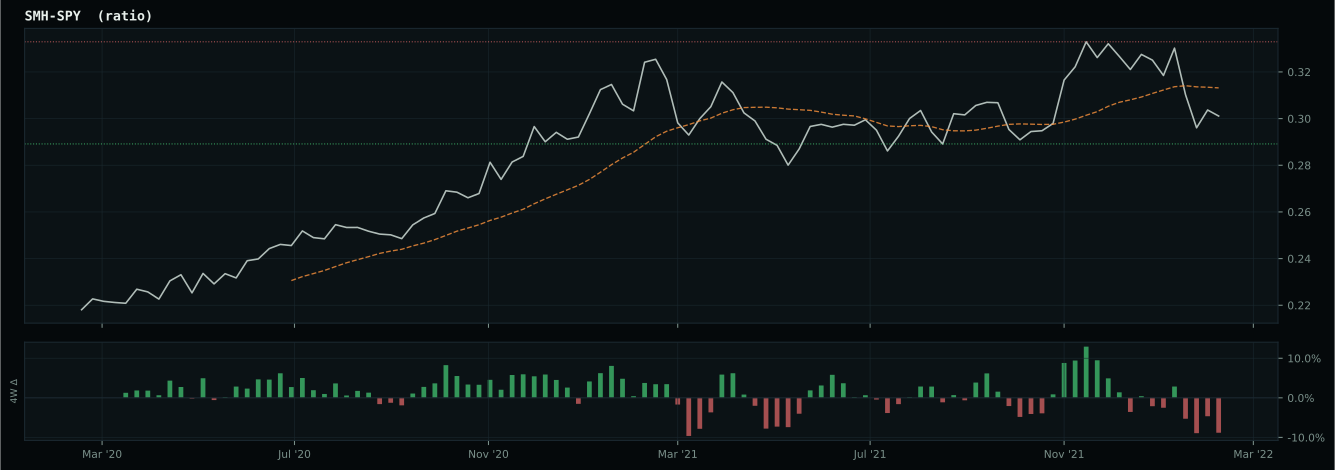
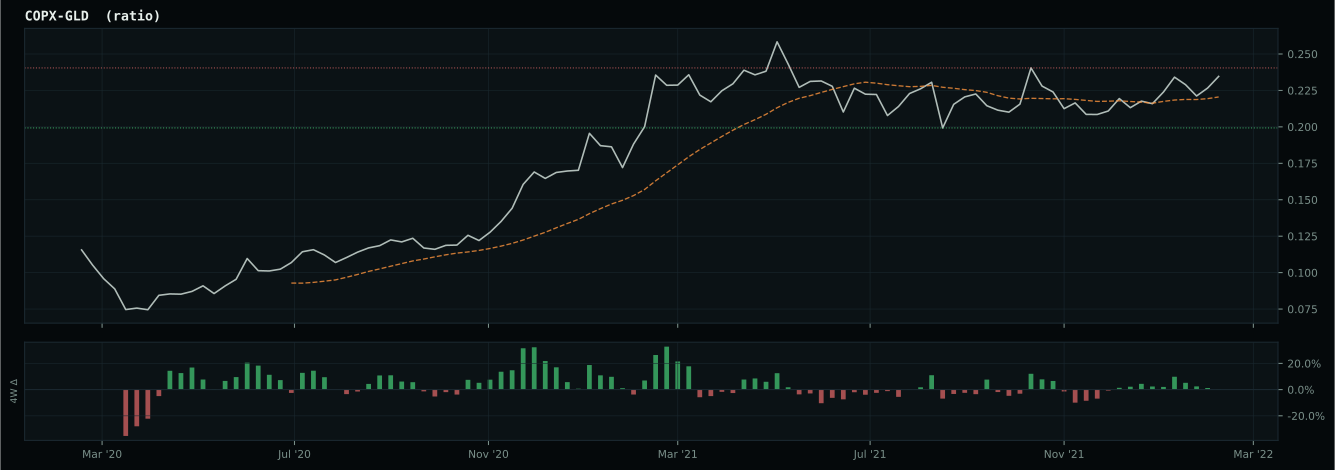
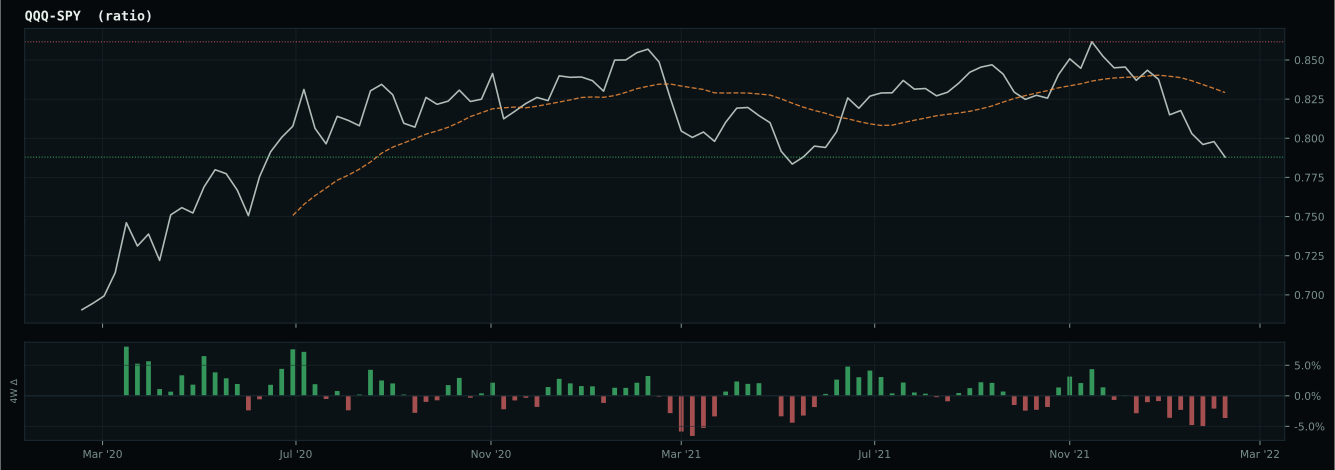
Market-implied signals behind the macro regime scores. Each ratio compares two assets; the direction and slope of the ratio is what the macro engine reads.
Crypto Regime — NoCrypto
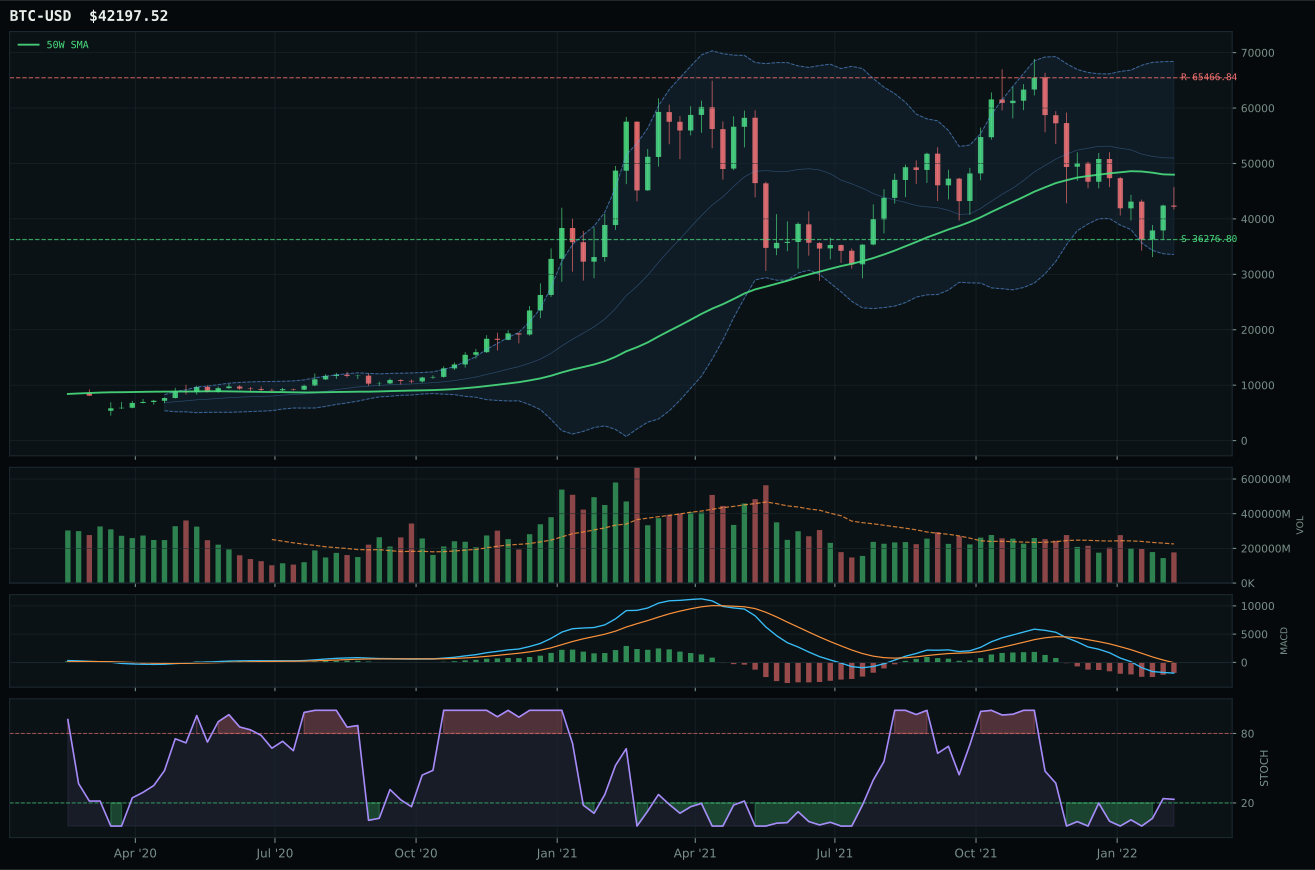
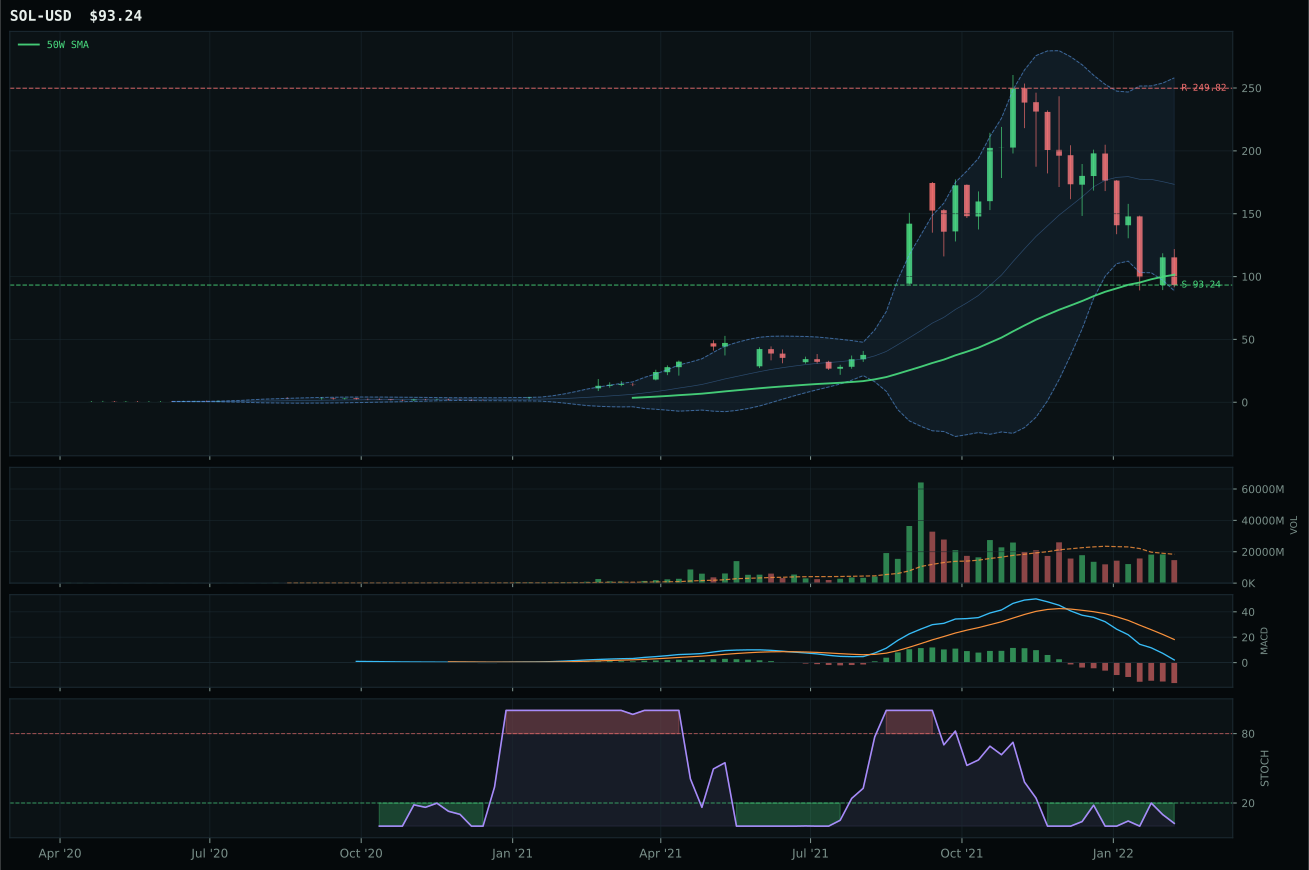
ValueBTC not armed: BTC has not made the first post-breakdown touch of the 200W buy zone after losing the 50W
TrendBTC not confirmed
one or more available conditions failed
Category Rankings
| Rank | Category | Winner | Score | Alloc | 4W Ret | Peers (4W) |
|---|---|---|---|---|---|---|
| 1 | Traditional Energy | XLE | 85.3 | 20% | +7.47% | XOP +9.1% · FCG +7.6% |
| 2 | Agriculture & Livestock | WEAT | 73.5 | 20% | +33.95% | MOO +2.6% · VEGI +4.6% |
| 3 | Industrial Metals | COPX | 73.3 | 10% | +3.17% | PICK +1.6% · REMX -2.7% |
| 4 | Precious Metals | GLD | 72.4 | 10% | +5.32% | GDX +14.9% · SLV +6.0% |
| 5 | Utilities & Infrastructure | IGF | 49.0 | 10% | -0.08% | XLU +5.4% · PAVE +2.8% |
| 6 | Technology | CIBR | 40.8 | 10% | +1.41% | XLK -7.2% · IGV -10.0% |
| 7 | Defense & Aerospace | ITA | 40.2 | 10% | +1.24% | XAR +5.5% · ROKT +6.4% |
| 8 | Emerging Markets | IEMG | 34.5 | 10% | -12.22% | ILF +2.0% · INDA -1.9% |
| 9 | Nuclear Energy | URA | 28.3 | 0% | +17.02% | URNM +20.2% · NLR +2.2% |
| 10 | AI | SMH | 21.3 | 0% | -7.74% | AIQ -12.0% · BOTZ -7.7% |
Traditional Energy — XLE
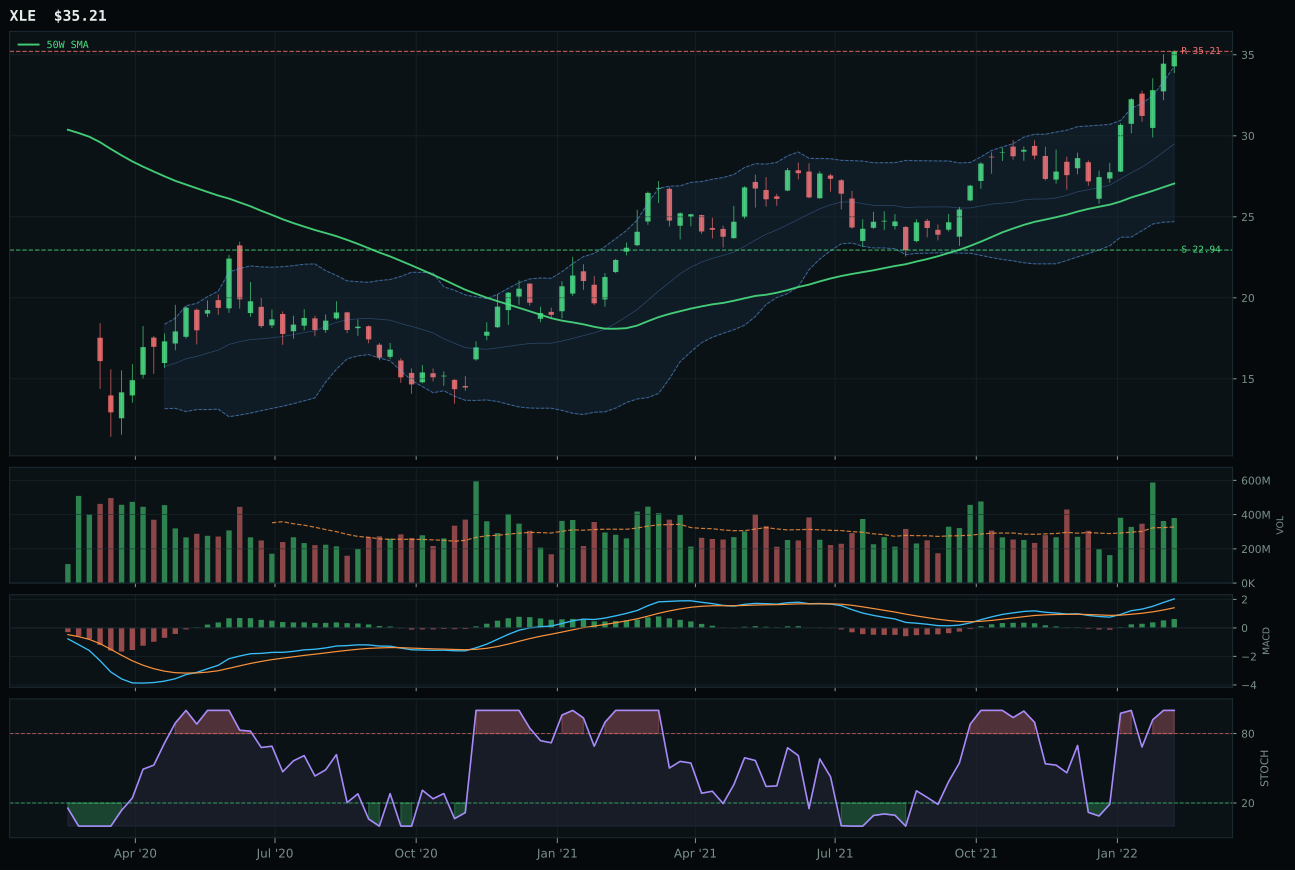
XLE has a vertical extension profile with 28.1% 13-week relative strength versus SPY.
A failed hold above support would weaken the setup.
Actionable but governed by invalidation levels.
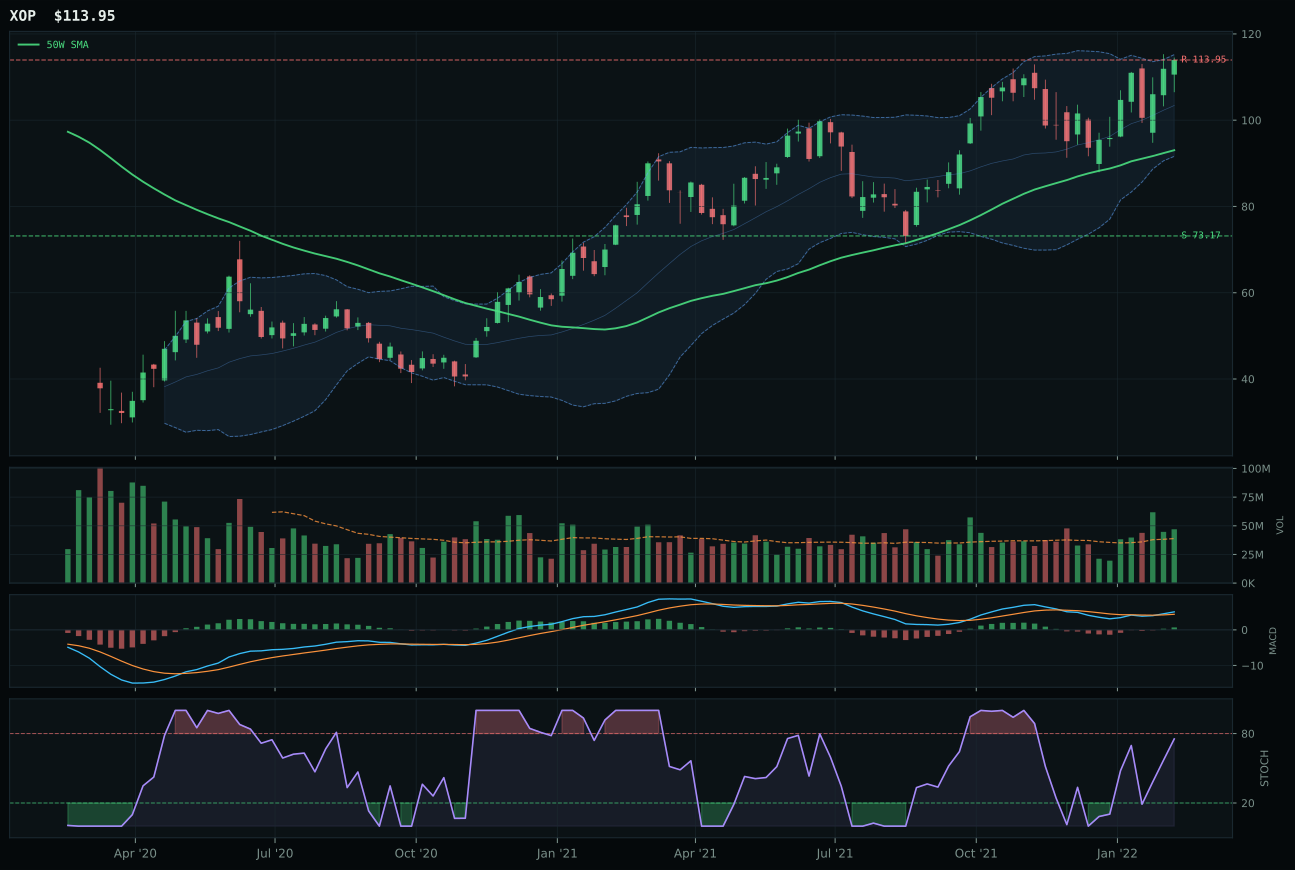
XOP has a vertical extension profile with 11.8% 13-week relative strength versus SPY.
A failed hold above support would weaken the setup.
Actionable but governed by invalidation levels.
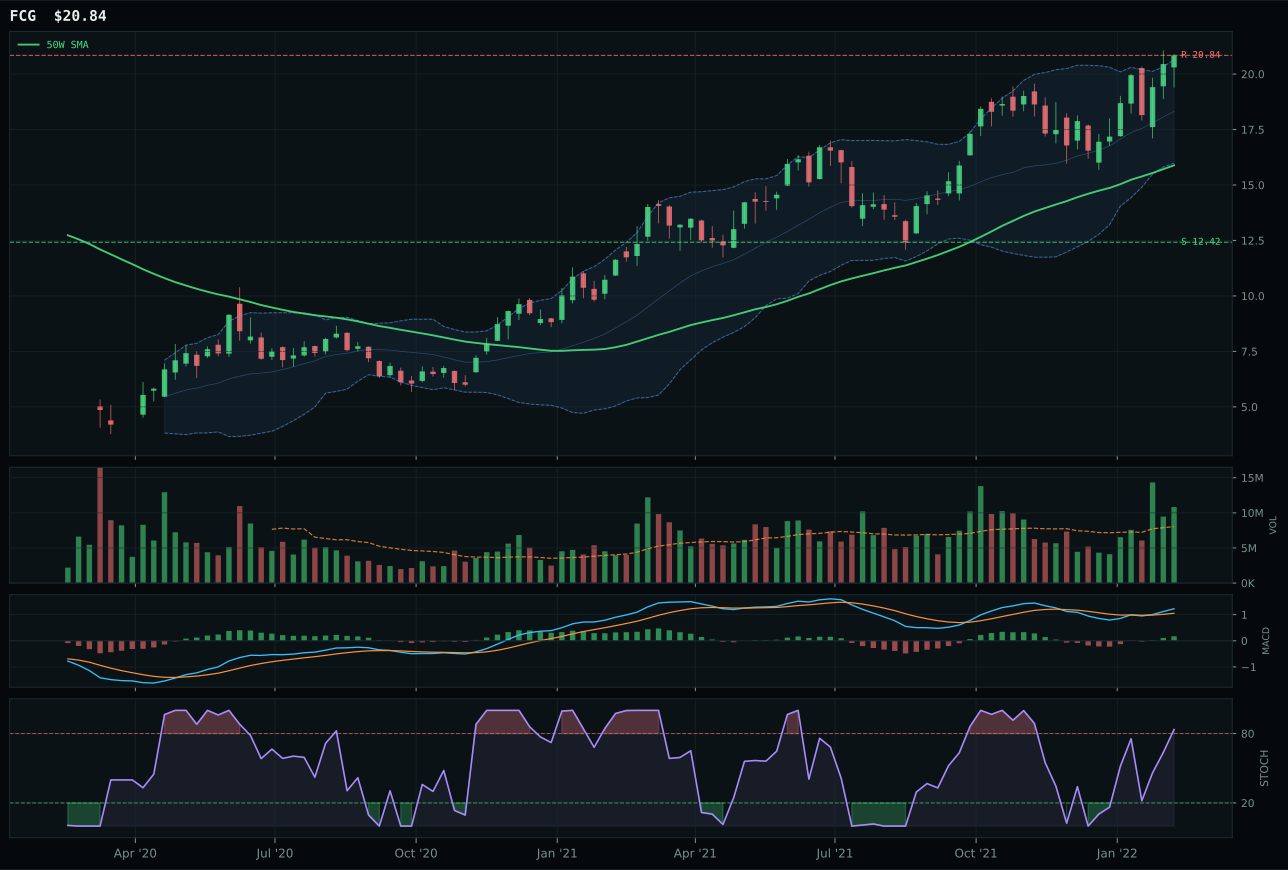
FCG has a vertical extension profile with 17.6% 13-week relative strength versus SPY.
A failed hold above support would weaken the setup.
Actionable but governed by invalidation levels.
XLE claims the 10% allocation—the portfolio's largest position—on the back of a 100.0 trend score, 28.1% SPY-relative strength, and 22.3% 13-week return that prove energy scarcity is the defining macro narrative of this regime. The 30.1% extension above the 50-week moving average creates timing risk (37.0 score), but 100.0 momentum confirmation and 88.1 persistence overwhelm valuation concerns; this is genuine supply-driven outperformance, not speculative positioning. Volume at 1.16x the 20-week average is measured—not distribution—and MACD bullish-and-improving with stochastic RSI overbought (1.00) shows sponsorship without euphoria. XOP's loss stems from weaker category-relative strength (-5.8% versus 10.5%) and inferior risk-reward (24.6 versus 39.7), revealing that integrated-cash-flow durability (XLE) beats exploration-beta volatility when macro is already baked into prices.
Traditional Energy's 10% allocation and top-2 ranking are anchored to the 85.0 category-level macro score: energy scarcity (+16), inflation pressure (+10), supply shortage (+9), and real asset sponsorship (+7) form a consensus macro case that dominates all other categories. The 85.3 category score is the highest among ten positioning choices, justifying a portfolio anchor that would have been unthinkable in risk-asset years. Timing risk is real—XLE is extended, not coiled—and any shock to demand or surprise supply announcement would truncate gains sharply. The 60% sizing assumes macro regime persistence; rotations would trigger rapid downsizing if supply data surprise to the upside or if recession signals accelerate credit stress dynamics faster than current positioning accounts for.
Agriculture & Livestock — WEAT
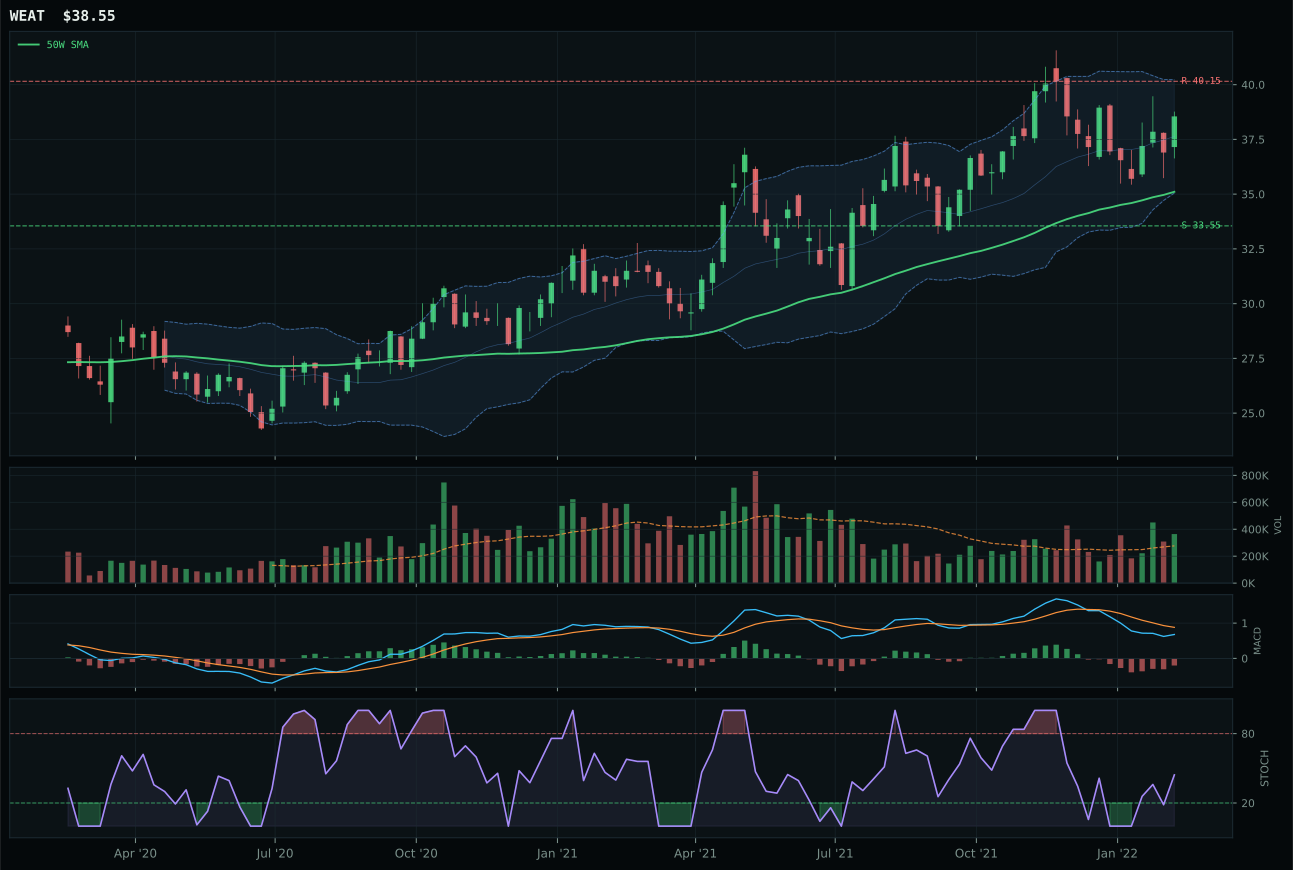
WEAT has a neutral structure profile with 2.8% 13-week relative strength versus SPY.
A failed hold above support would weaken the setup.
Actionable but governed by invalidation levels.
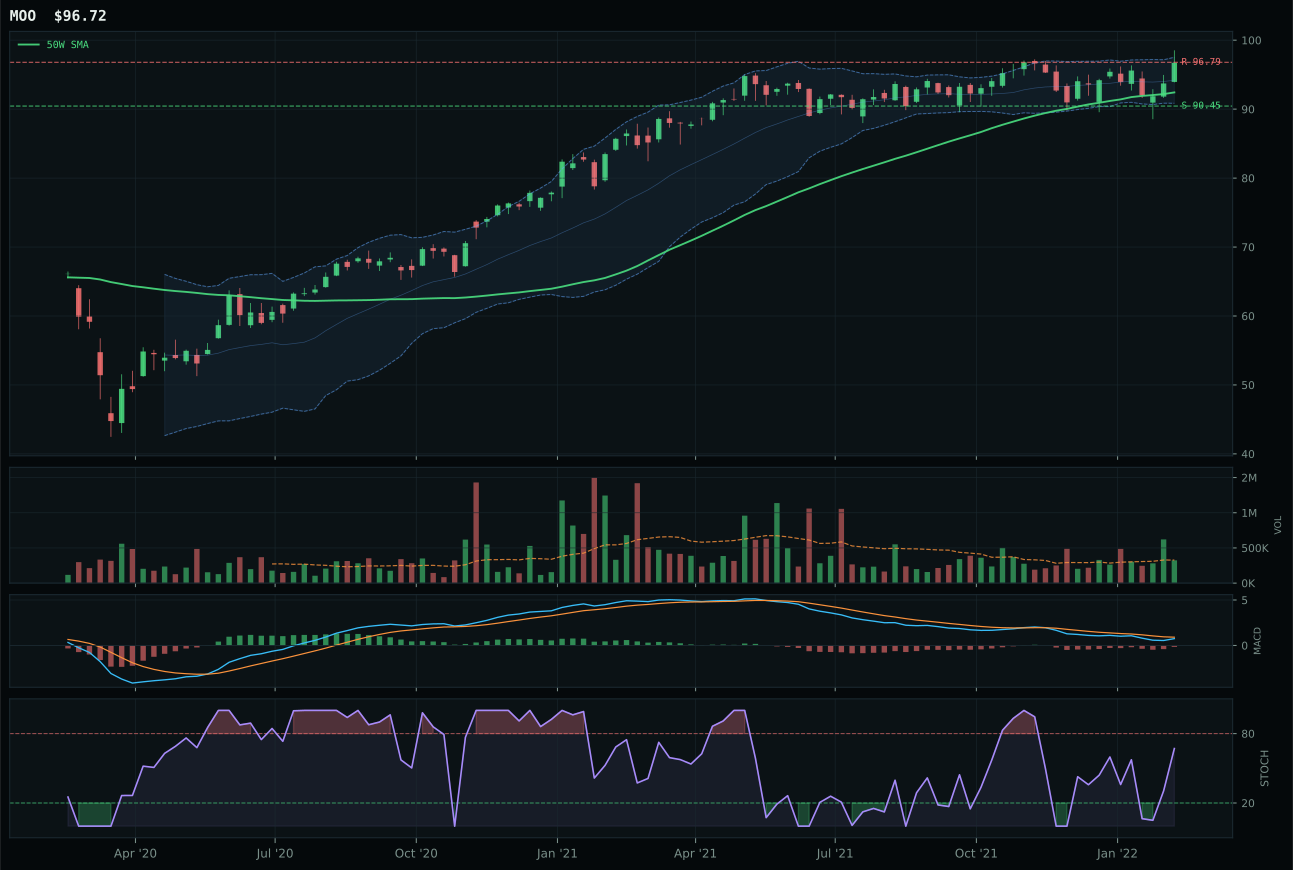
MOO has a neutral structure profile with 5.8% 13-week relative strength versus SPY.
A failed hold above support would weaken the setup.
Actionable but governed by invalidation levels.
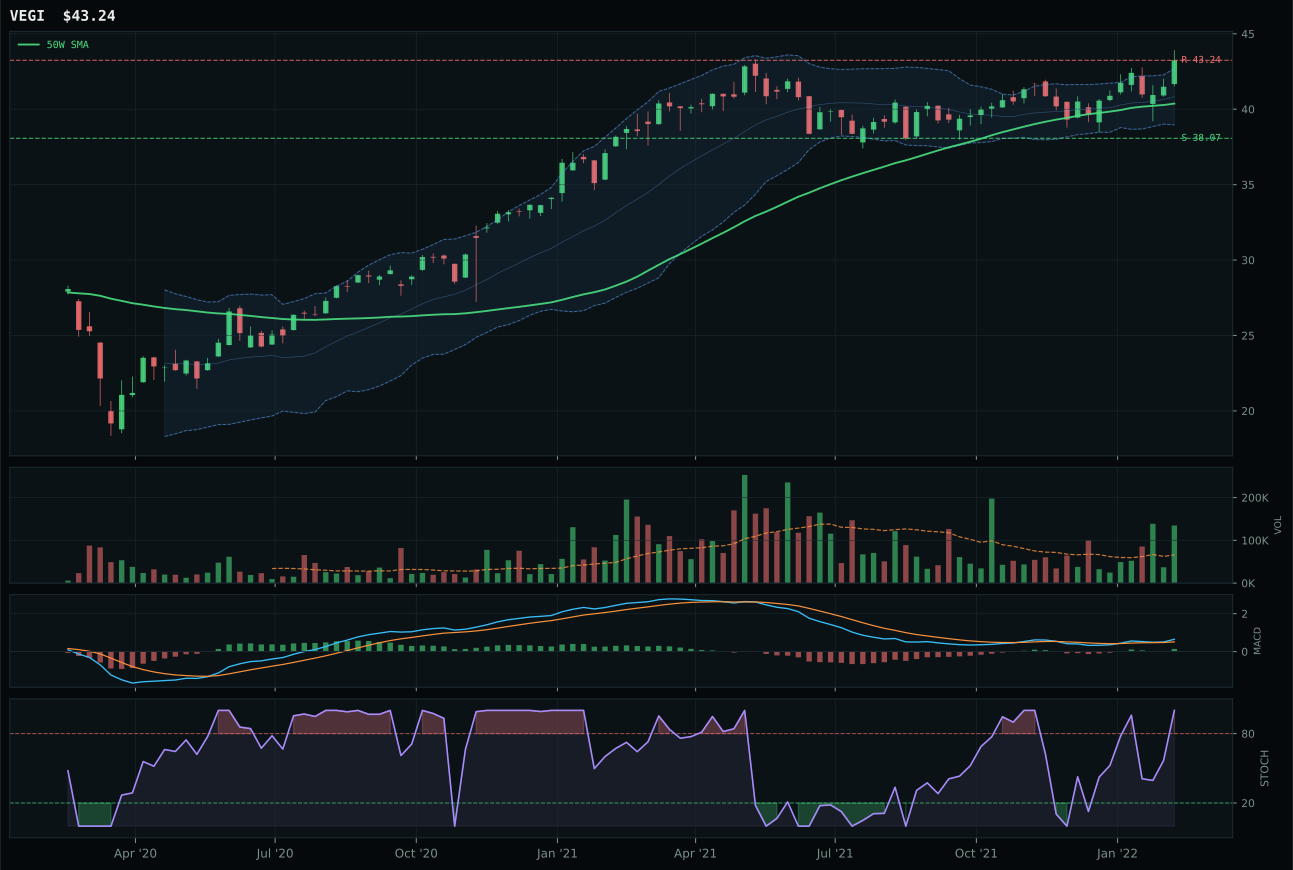
VEGI has a neutral structure profile with 9.4% 13-week relative strength versus SPY.
A failed hold above support would weaken the setup.
Tracked, but not top-2 eligible because: .
WEAT claims the top-2 allocation slot by narrowly outmaneuvering MOO despite a -3.0% category-relative strength disadvantage, proving that structure and volume confirmation override pure momentum breadth. The 9.8% extension above the 50-week moving average sits at Fib 0.236, positioning WEAT in the upper retracement zone where momentum can still extend without fully extended valuation. Above-average participation at 1.32x the 20-week average contrasts with MOO's neutral volume, a critical detail when both charts show identical MACD bearish-but-improving and stochastic RSI rising mid-zone conditions. MOO's superior 13-week return (0.1% versus WEAT's -2.9%) is negated by the liquidity thesis: WEAT's volume sponsorship suggests active accumulation where MOO shows static holding.
Agriculture & Livestock's 20% top-2 allocation reflects macro alignment at its strongest: supply shortage (+13 points), inflation pressure (+10), real asset sponsorship (+8), and commodity breadth positive (+5) combine to create a 73.5 category score, the second-highest across all positions. WEAT's trend score of 97.3 paired with breadth macro support generates a risk-adjusted case that outweighs timing concerns (83.0 score is pedestrian). This is the category most likely to benefit if inflation persists and dollar strength moderates; conversely, recession signals or grain supply normalization would require swift rotation to VEGI's overbought momentum characteristics.
Industrial Metals — COPX
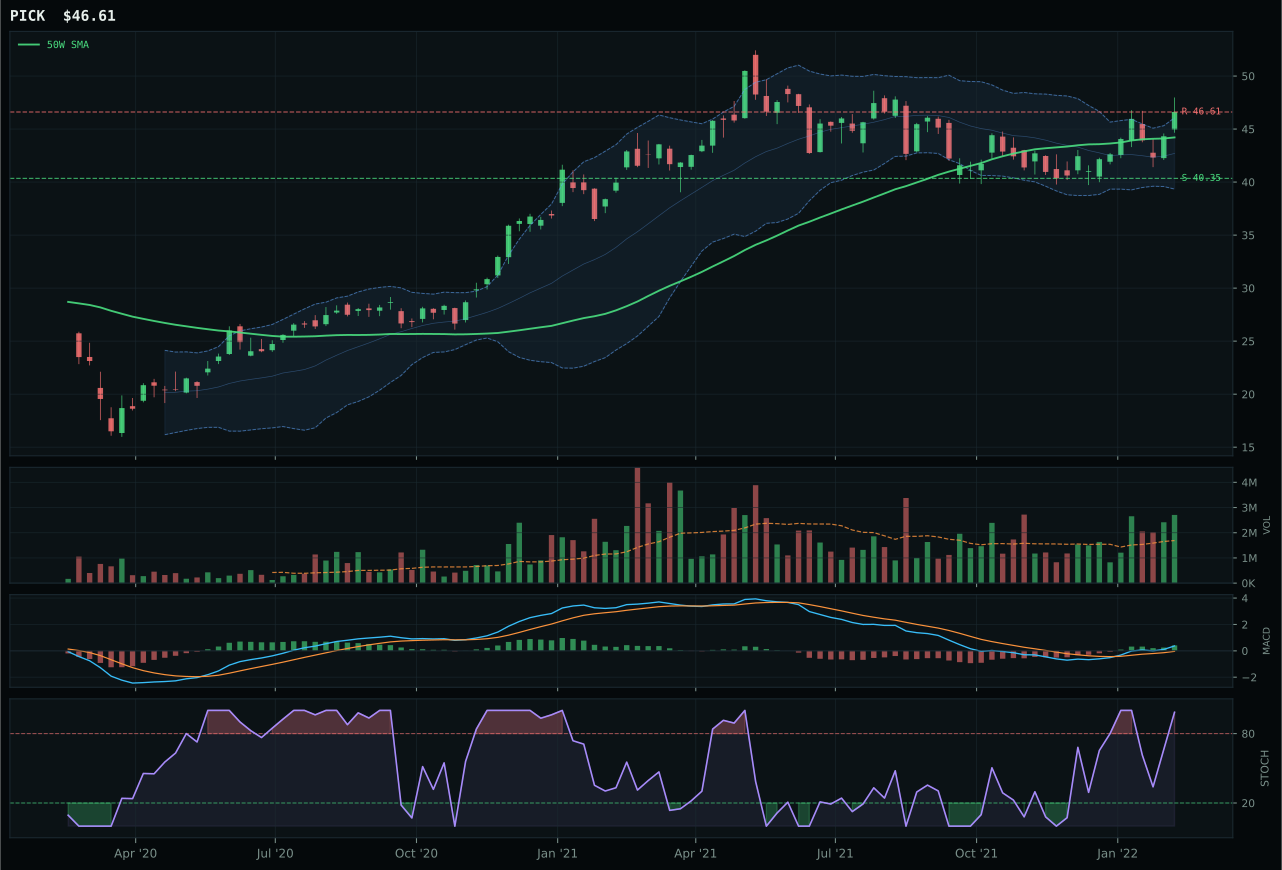
PICK has a neutral structure profile with 14.9% 13-week relative strength versus SPY.
A failed hold above support would weaken the setup.
Actionable but governed by invalidation levels.
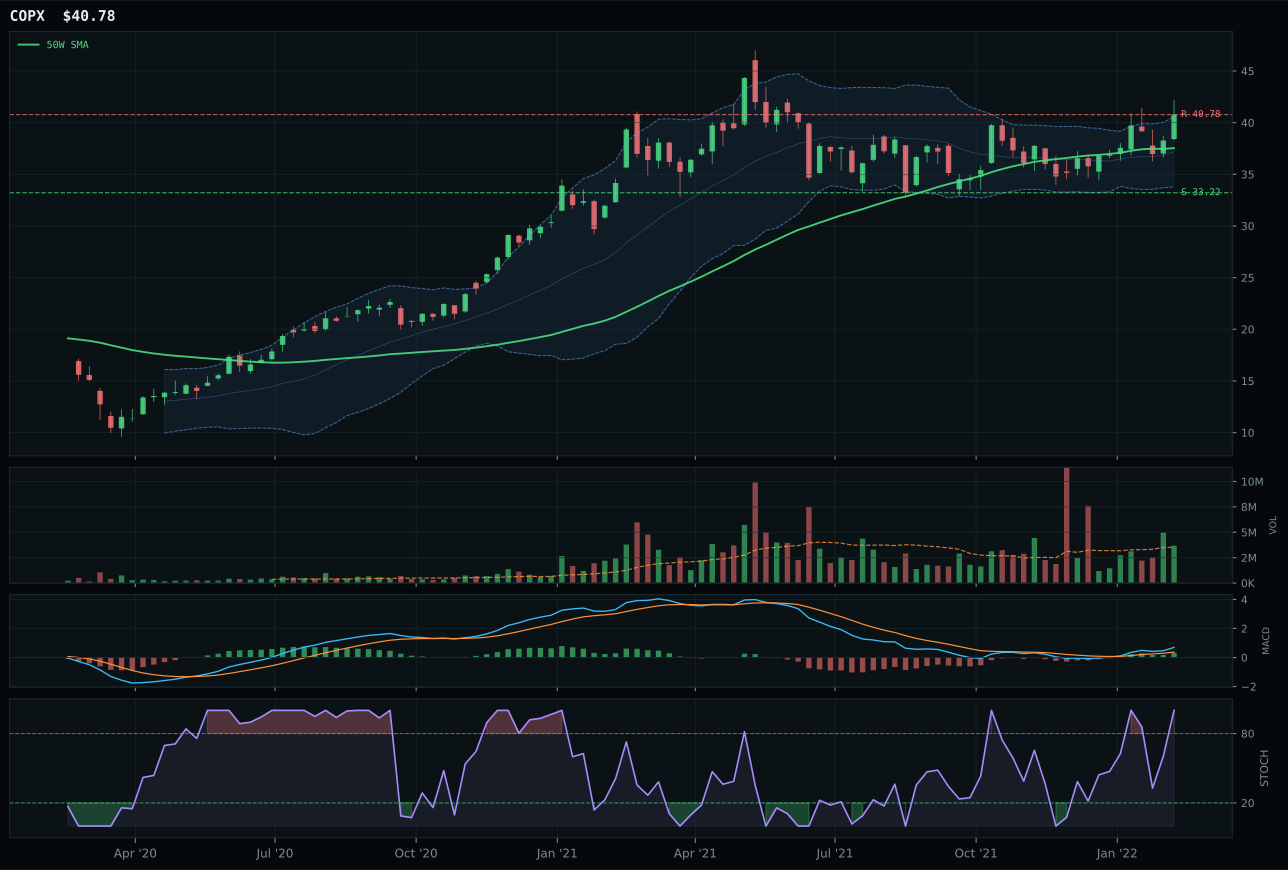
COPX has a neutral structure profile with 13.7% 13-week relative strength versus SPY.
A failed hold above support would weaken the setup.
Actionable but governed by invalidation levels.
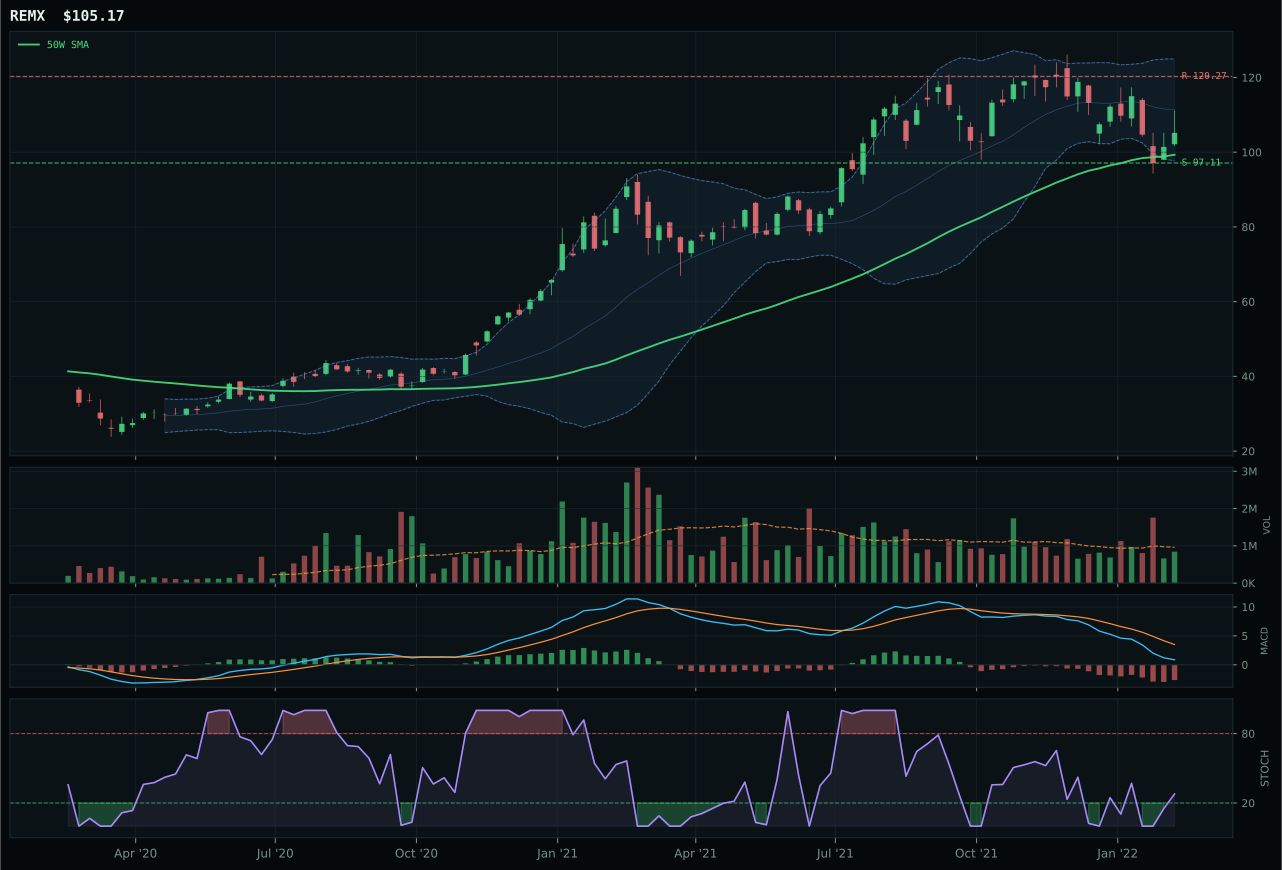
REMX has a neutral structure profile with -6.5% 13-week relative strength versus SPY.
A failed hold above support would weaken the setup.
Actionable but governed by invalidation levels.
COPX edges PICK despite the latter's superior 100.0 technical evidence score, illustrating how macro narrative and category-relative strength can override pure technical superiority when both setups are clean. COPX's 13.7% SPY-relative strength and 8.0% 13-week return power a 100.0 trend score; the structure is neutral with identical bullish MACD and overbought stochastic readings as PICK. The deciding factor: neutral volume (1.04x) versus PICK's accumulation-confirmation volume, paired with category-relative strength at the median (0.0%) versus PICK's slight edge (1.1%). In extended moves, volume neutrality becomes a filter for reduced crowding risk.
Industrial Metals' 5% allocation reflects a 73.3 category score that ranks fourth overall, leveraging metals scarcity (+14 macro) and commodity breadth positive (+10) without committing to peak valuation. COPX's overbought stochastic reading and zero upside to resistance (0.0% away from 40.78 peak) signal that this is a tactical hold, not a new commitment. The 22.8% downside to support at 33.22 provides defined risk, making this suitable for a five-point position. Macro support is genuine, but execution is at the mercy of energy-dominated commodity cycles; any weakness in energy breadth would accelerate a sector rotation away from metals.
Precious Metals — GLD
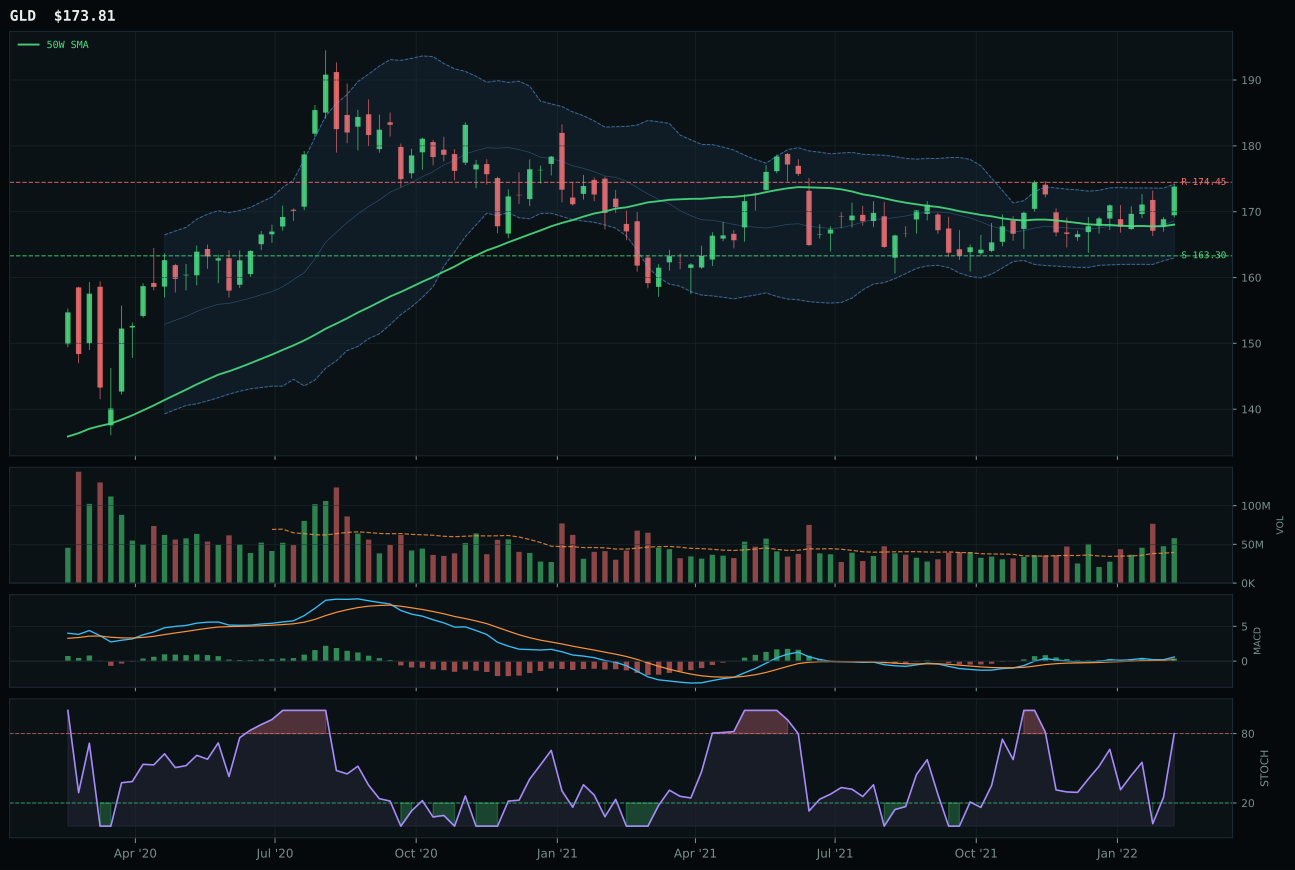
GLD has a neutral structure profile with 5.4% 13-week relative strength versus SPY.
A failed hold above support would weaken the setup.
Actionable but governed by invalidation levels.
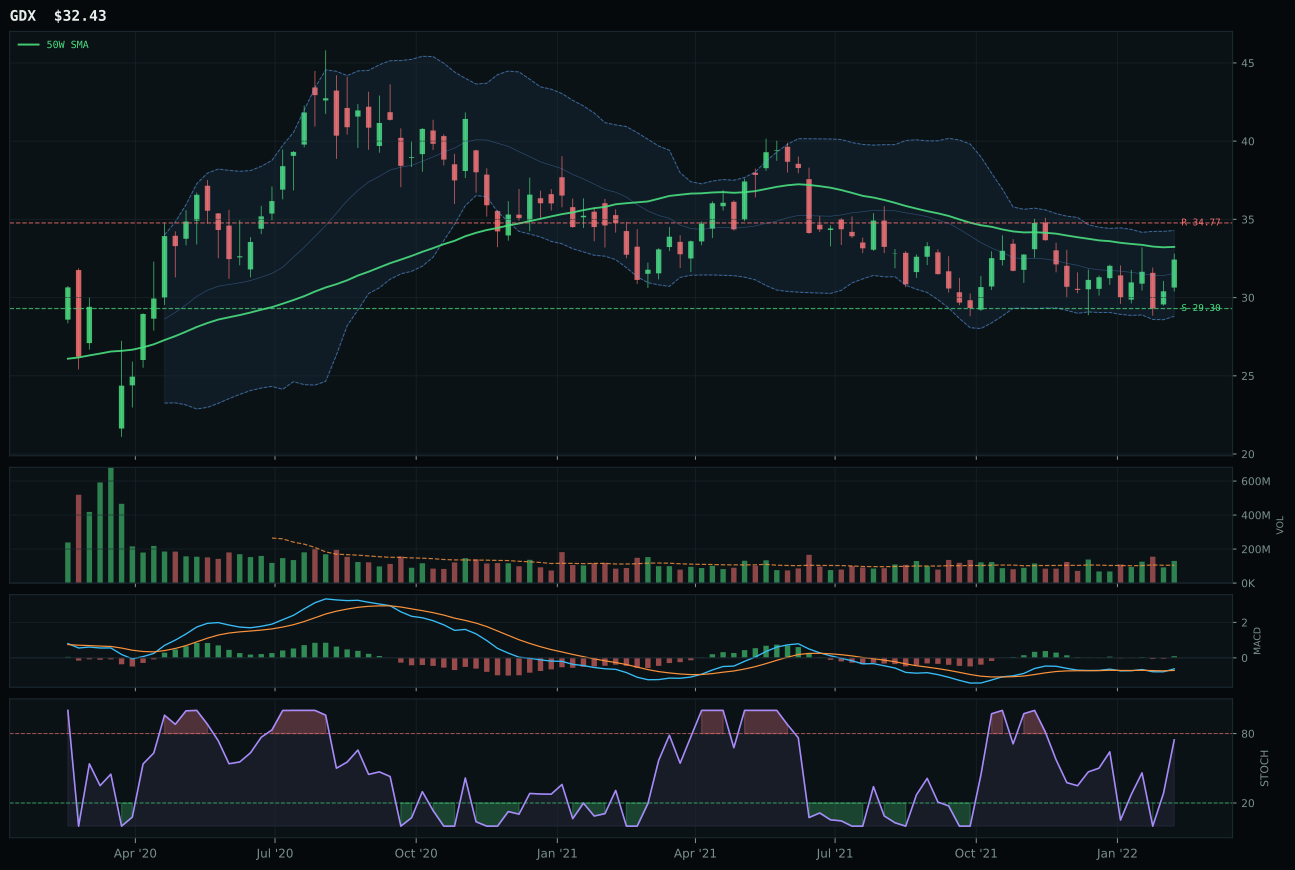
GDX has a compression near 50W profile with -1.0% 13-week relative strength versus SPY.
A failed hold above support would weaken the setup.
Actionable but governed by invalidation levels.
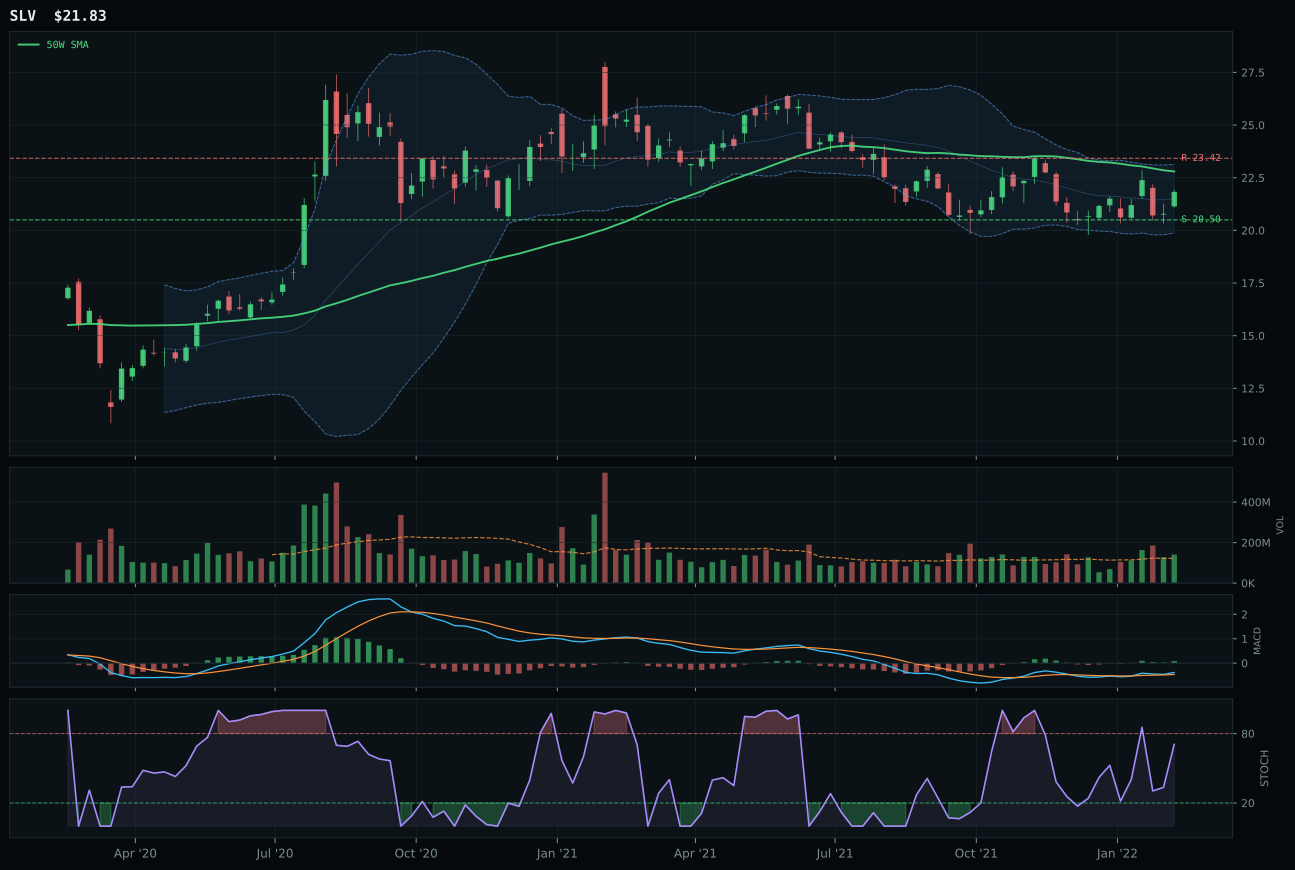
SLV has a neutral structure profile with -1.1% 13-week relative strength versus SPY.
A failed hold above support would weaken the setup.
Actionable but governed by invalidation levels.
GLD captures the category through perfect combination of trend dominance and relative strength leadership, with a 100.0 trend score powered by 5.4% SPY-relative outperformance and a non-deteriorating 50-week slope. The structure is clean—neutral with 88.5 compression—and the timing is textbook: 3.4% from the 50-week moving average, bullish MACD improving, stochastic RSI overbought at 0.80 but holding support. Volume at 1.47x the 20-week average provides fresh accumulation confirmation. GDX's 4.7-point deficit stems from lower category-relative strength (0.0% versus 6.4%) and less-clean structure (74.0 versus 78.7), despite its deep-discount Fibonacci location that traditionally signals value accumulation.
Precious Metals' 5% allocation is justified by GLD's bullish technical setup and the monetary hedge bid (+14 macro points) driving strength in a credit-stress environment. The 72.4 category score ranks third among eight positioned categories, delivering solid risk-reward without top-tier macro alignment. GLD's overbought stochastic reading creates near-term vulnerability—break below the 50-week moving average at 163.30 would invalidate the trend—but as long as real rates remain negative and defensive rotation persists, this is core portfolio ballast. Risk asymmetry favors staying long rather than rotating unless credit markets show concrete stabilization.
Utilities & Infrastructure — IGF
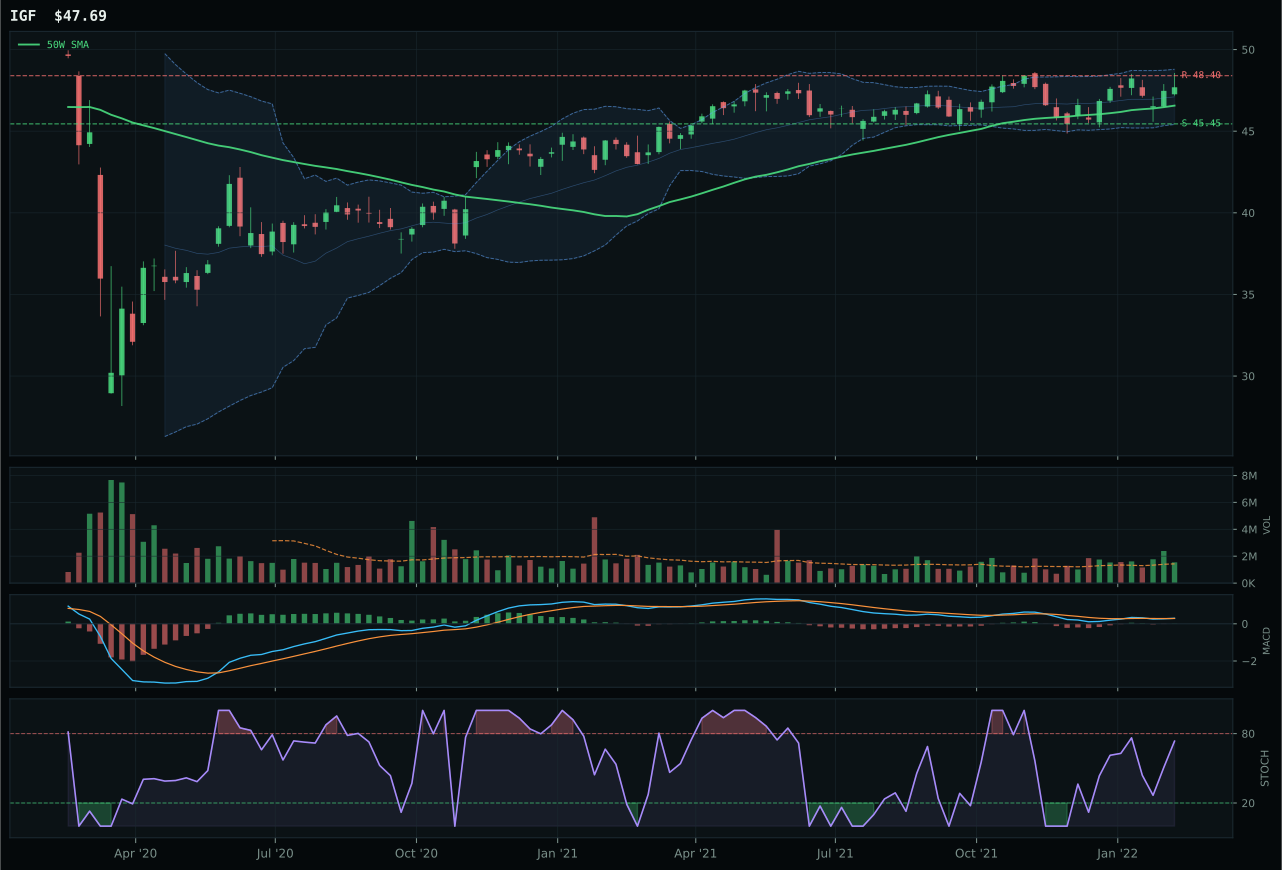
IGF has a pullback into support profile with 5.7% 13-week relative strength versus SPY.
A failed hold above support would weaken the setup.
Actionable but governed by invalidation levels.
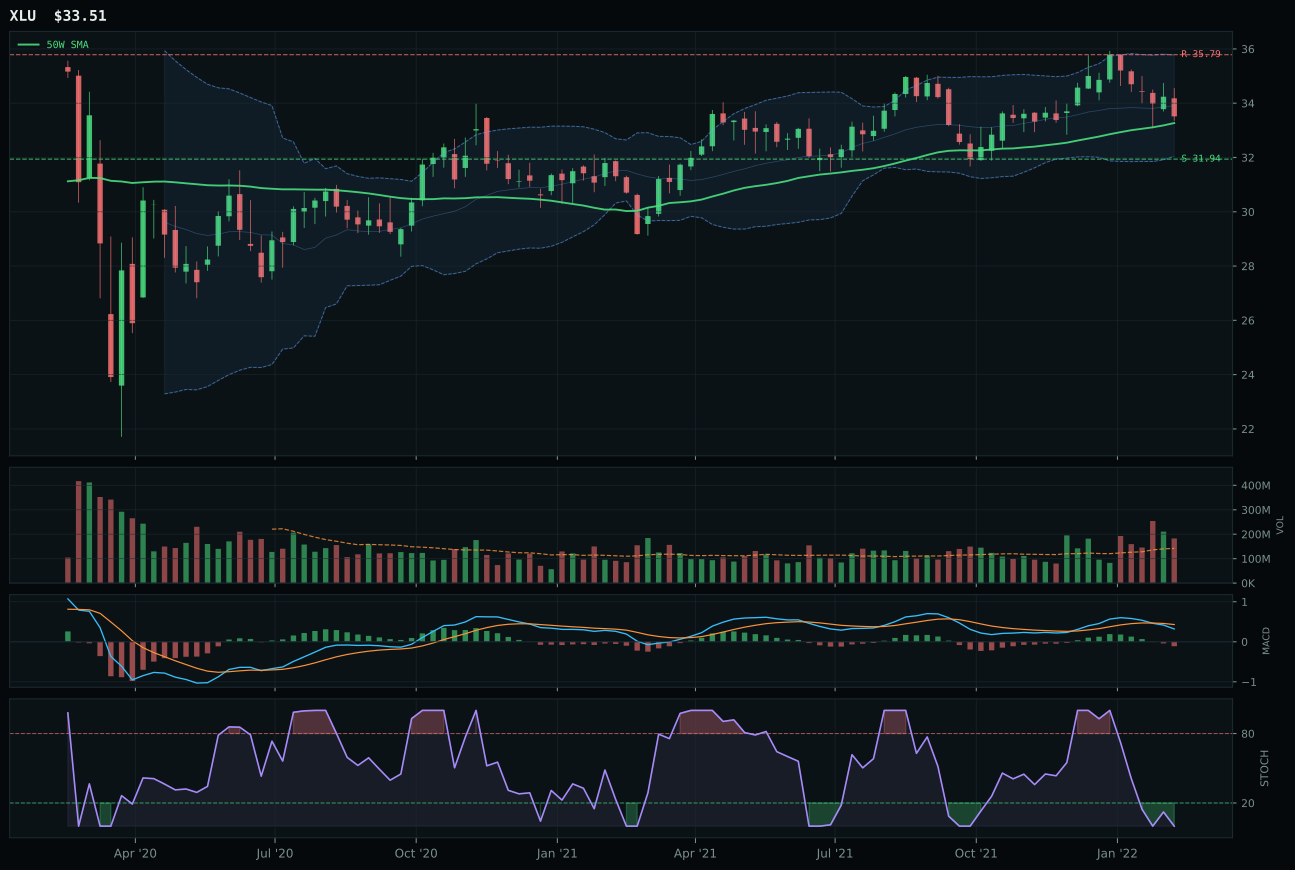
XLU has a pullback into support profile with 6.3% 13-week relative strength versus SPY.
A failed hold above support would weaken the setup.
Actionable but governed by invalidation levels.
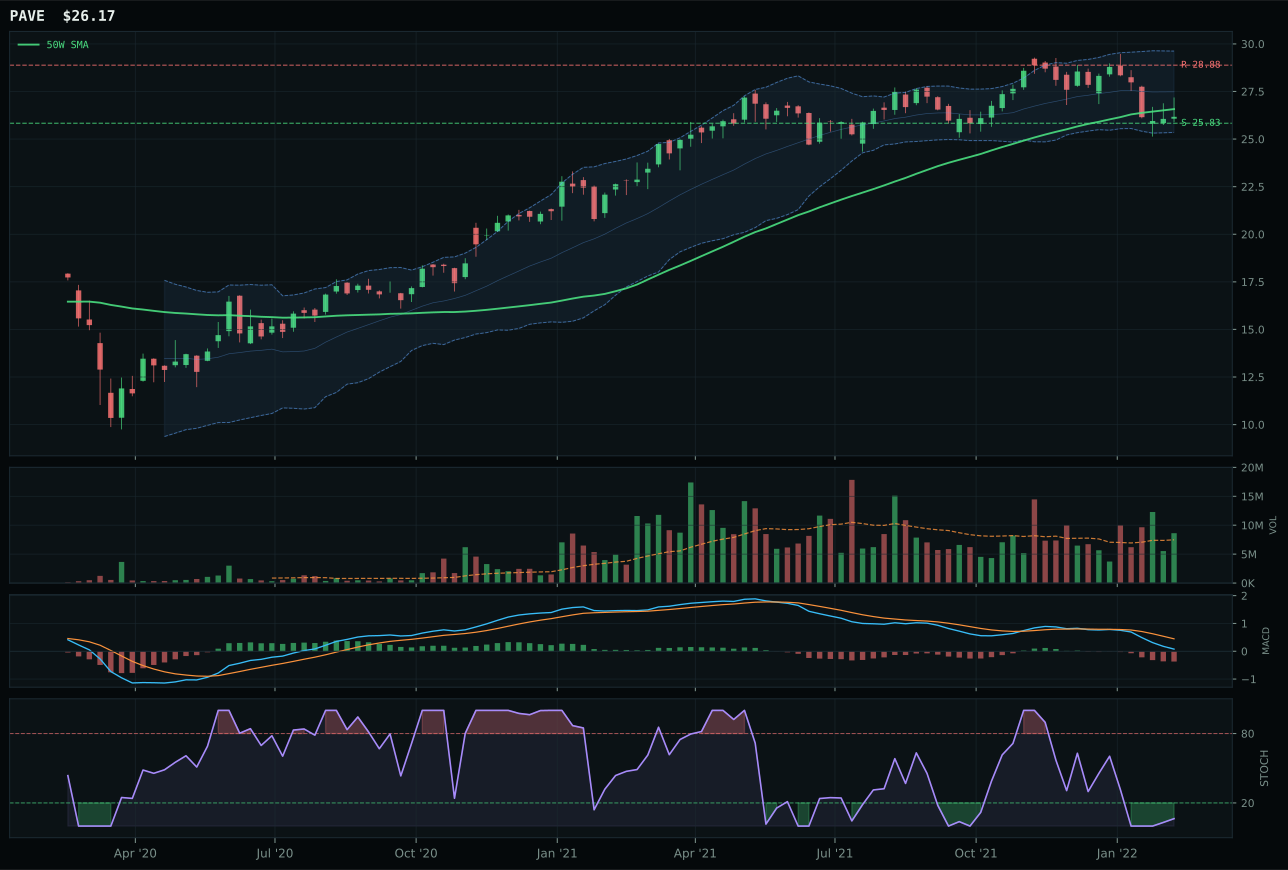
PAVE has a pullback into support profile with -3.6% 13-week relative strength versus SPY.
A failed hold above support would weaken the setup.
Actionable but governed by invalidation levels.
IGF secures selection through superior timing and bullish MACD confirmation in a pullback setup that rewards patient entry mechanics. Sitting just 2.4% above the 50-week moving average with 100.0 timing score and MACD bullish-but-flattening, IGF provides the earliest signal of potential recovery in a defensive-rotation environment. Above-average structure at 75.5 combines with 66.1 volume-price confirmation to suggest institutional accumulation despite neutral volume participation. XLU's loss (6-point margin) reflects bearish MACD, oversold stochastic RSI without inflection, and weaker timing (95.0 versus 100.0)—subtle differences that matter profoundly when both are defensive plays with similar macro tailwinds.
Utilities & Infrastructure's 5% allocation is a defensive complement to the energy anchor, leveraging defensive rotation (+12 macro) and transition-regime stability (+4) without exposing the portfolio to credit sensitivity that pure utilities (XLU) carries. IGF's 49.0 category score ranks seventh of eight positioned categories, justifying modest sizing as portfolio ballast rather than conviction. The bullish-but-flattening MACD and rising stochastic RSI provide upside entry mechanics if defensive rotation sustains, but 1.5% upside to resistance at 48.40 creates near-term ceiling risk. This position profits from extended portfolio duration; any shock to credit spreads or rate expectations would require swift exit.
Technology — CIBR
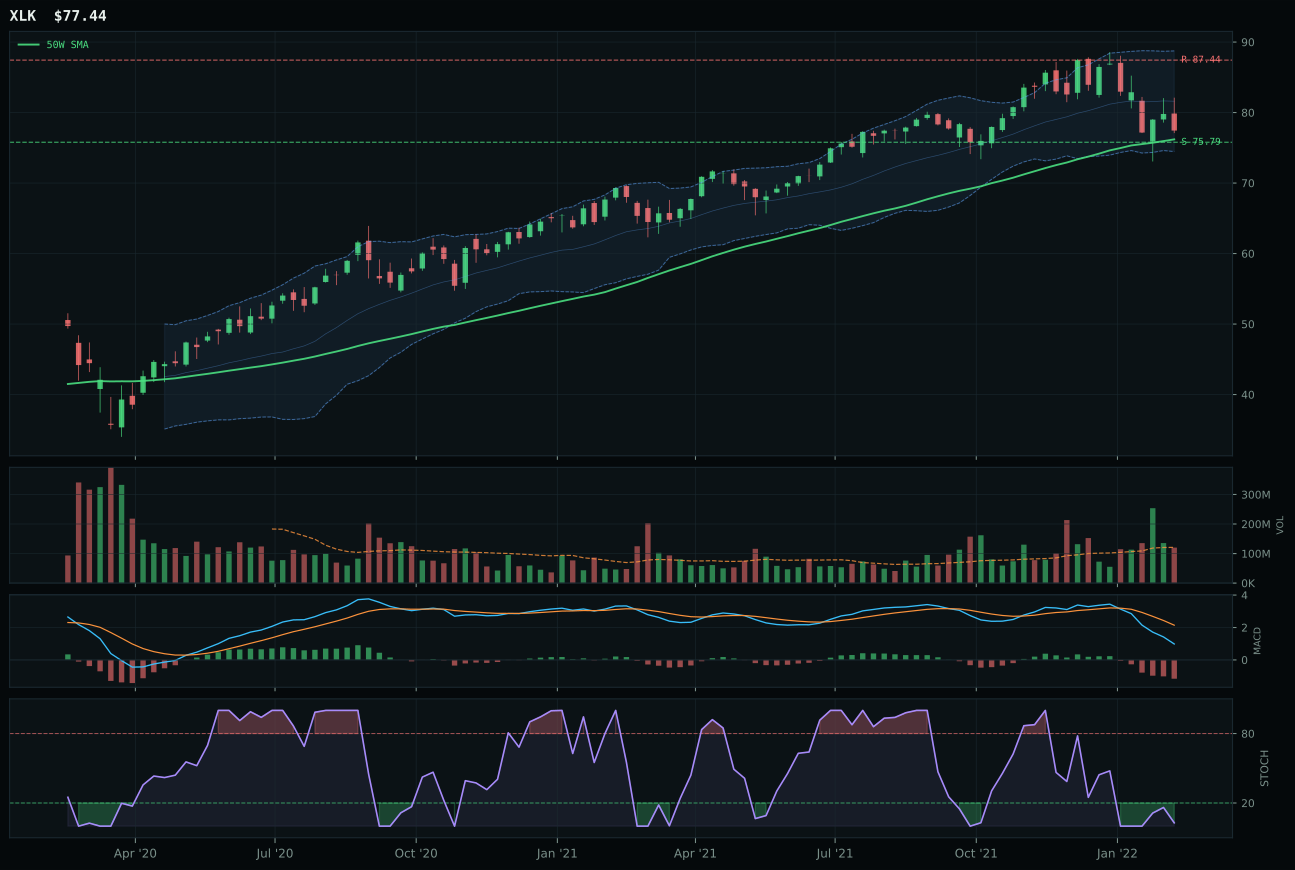
XLK has a pullback into support profile with -1.7% 13-week relative strength versus SPY.
A failed hold above support would weaken the setup.
Actionable but governed by invalidation levels.
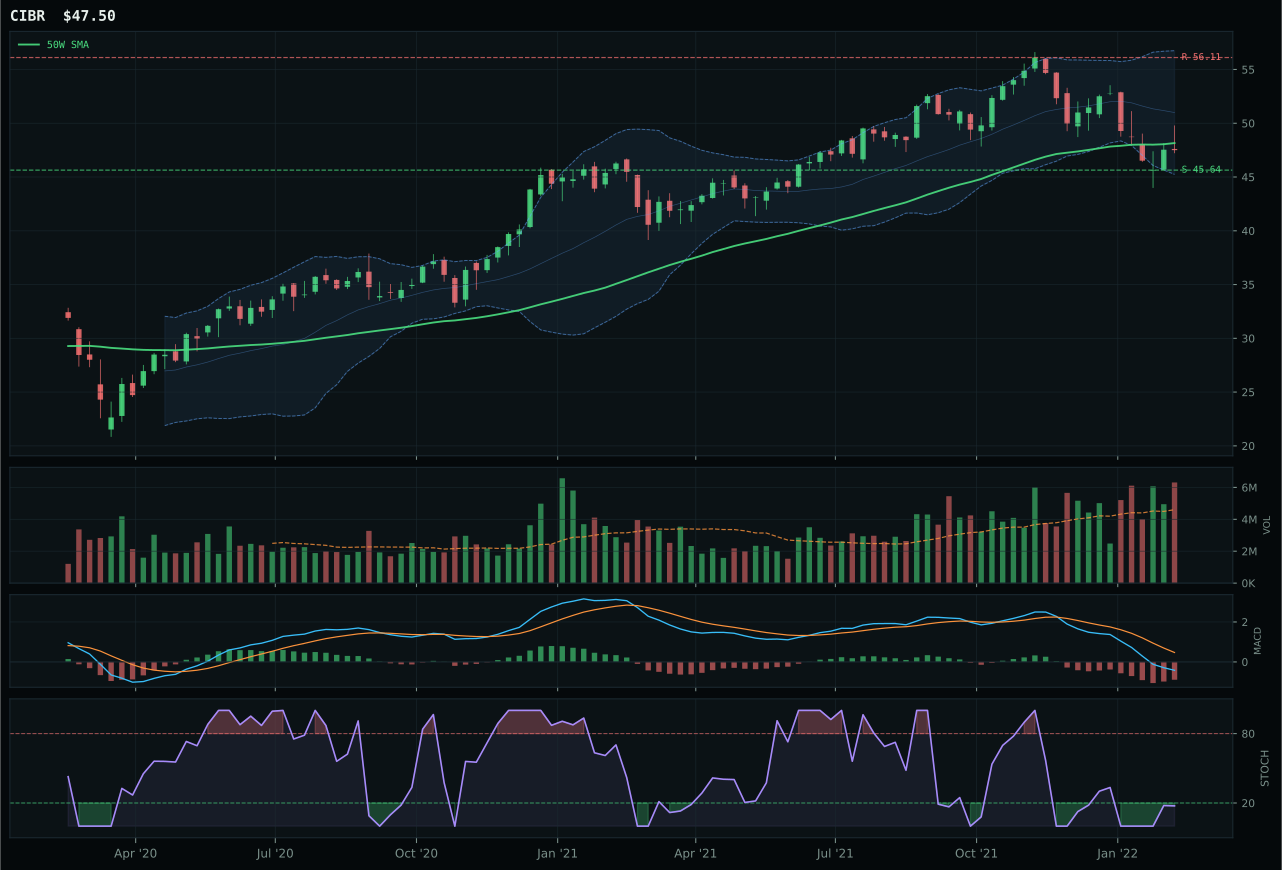
CIBR has a pullback into support profile with -9.6% 13-week relative strength versus SPY.
A failed hold above support would weaken the setup.
Actionable but governed by invalidation levels.
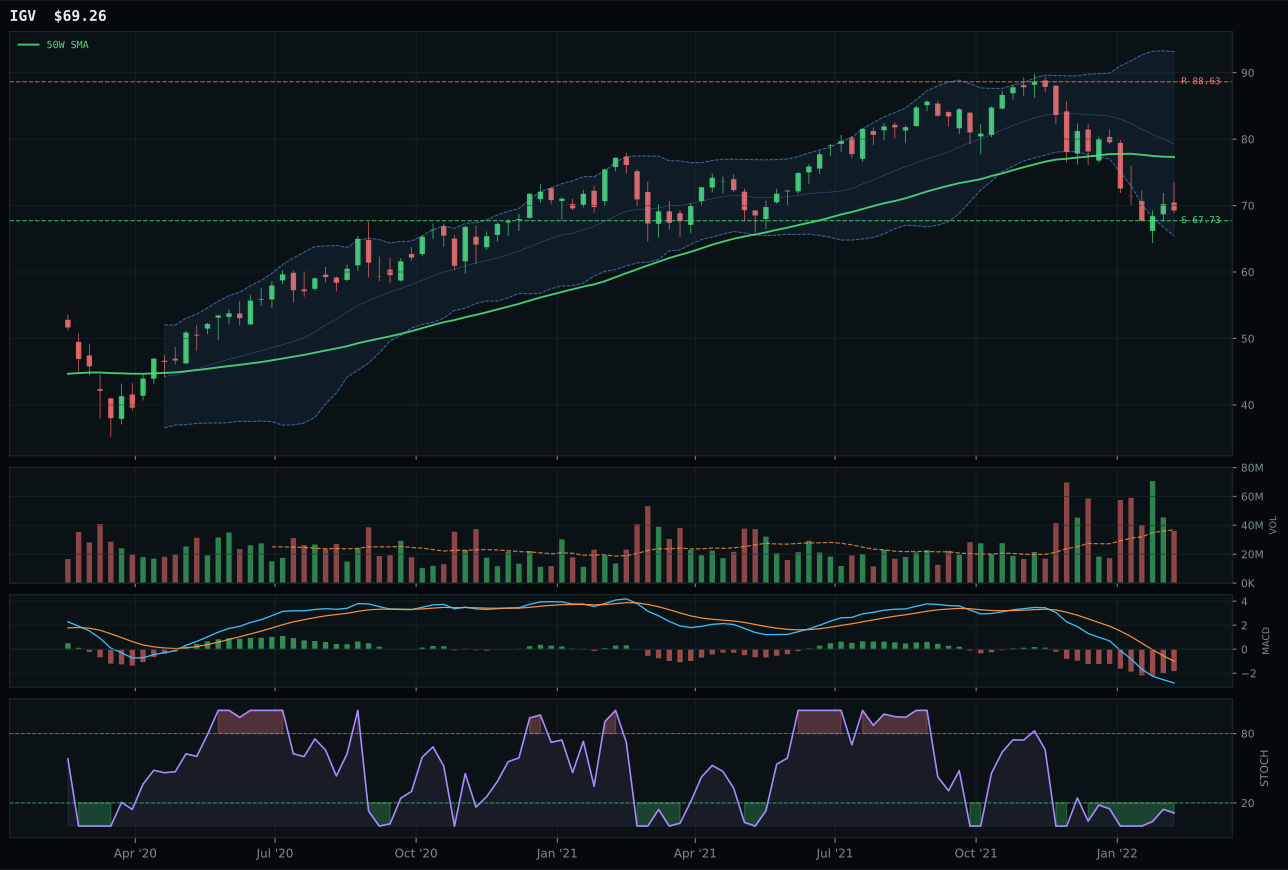
IGV has a pullback into support profile with -16.1% 13-week relative strength versus SPY.
A failed hold above support would weaken the setup.
Actionable but governed by invalidation levels.
CIBR prevails through superior timing and volume sponsorship in a pullback setup that rewards patience over chase. Sitting just 1.4% below the 50-week moving average with stochastic RSI turning oversold at 0.18, the structure offers defined risk to support at 45.64 and an asymmetric edge for accumulation. XLK's loss stems from neutral volume confirmation versus CIBR's above-average participation at 1.37x the 20-week average—a material difference when both charts show identical MACD weakness and oversold conditions. The category-relative strength gap (0.0% for CIBR versus 7.9% for XLK) reflects market skepticism toward broad tech leadership, making the cybersecurity thesis the cleaner expression of the technical setup.
Technology's 5% allocation reflects its ranking outside the top-2 categories and persistent headwinds from credit stress and risk-appetite erosion. The sector trades in a defensive regime where liquidity expansion provides modest uplift, but macro weight (-7 points) outpaces technical strength, leaving this as a holding rather than a commitment. CIBR's pullback into support offers an asymmetric entry point if the market shifts toward growth rotation, but timing would need to improve dramatically—stronger volume confirmation, MACD inflection, and stochastic RSI sustained above the 0.30 level would be prerequisites to justify upgrading this category into higher allocation.
Defense & Aerospace — ITA
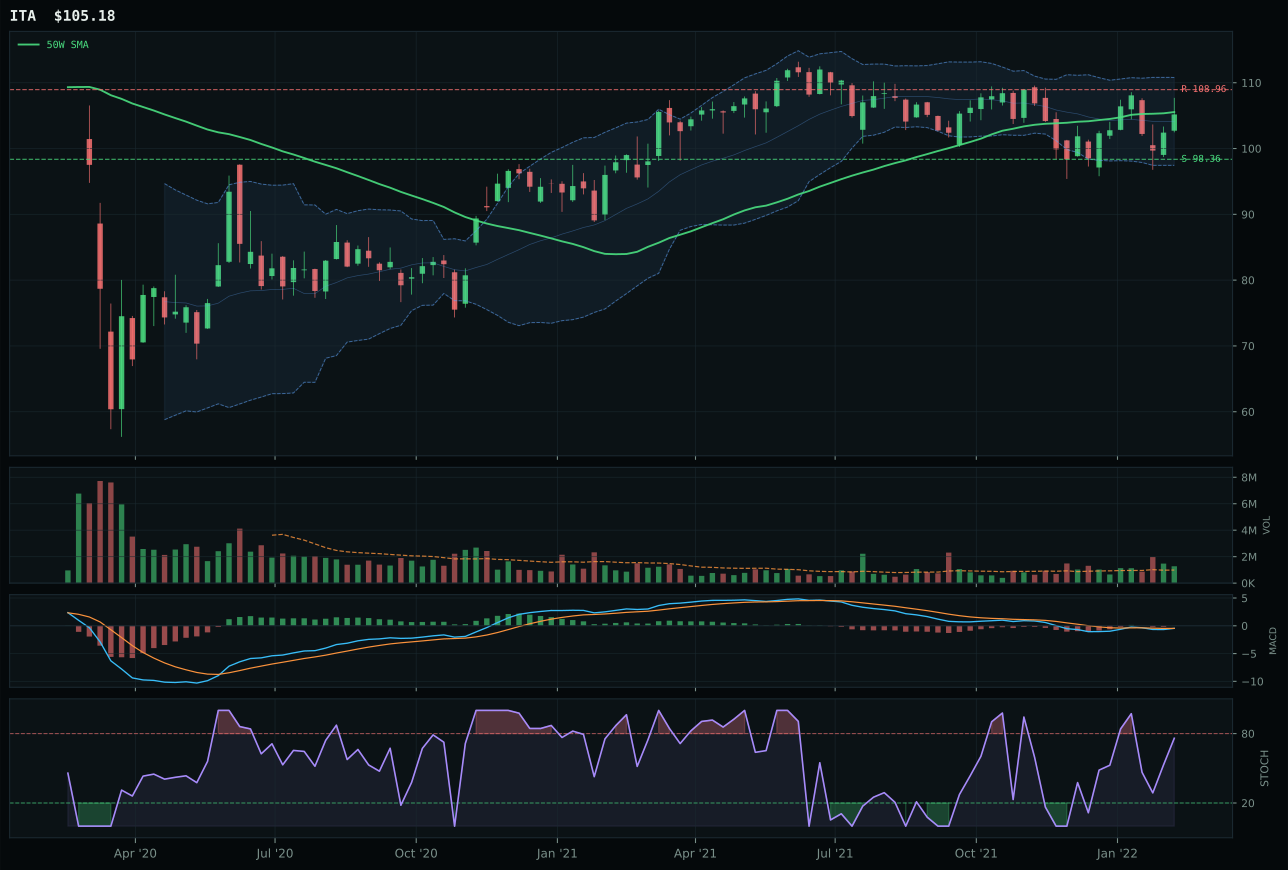
ITA has a compression near 50W profile with 4.2% 13-week relative strength versus SPY.
A failed hold above support would weaken the setup.
Actionable but governed by invalidation levels.
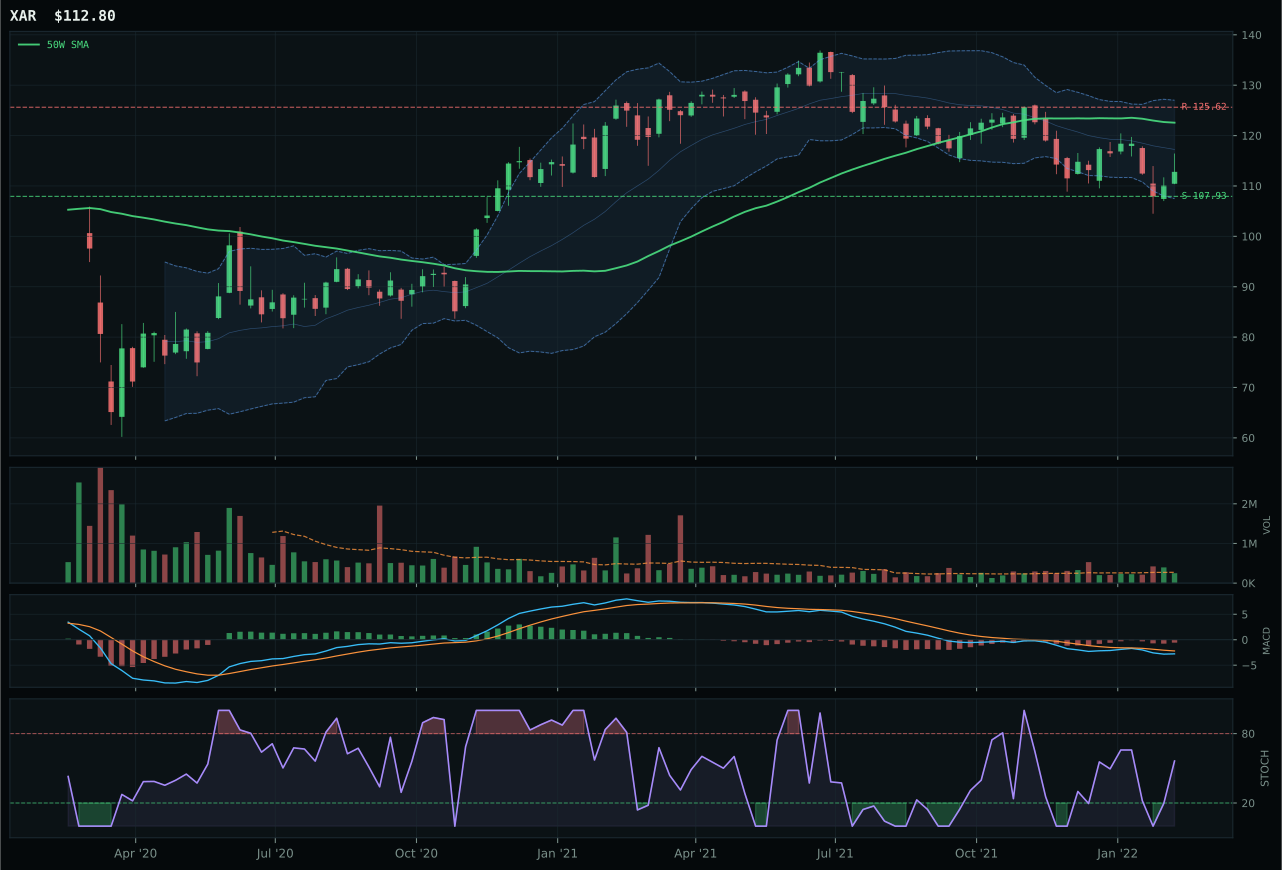
XAR has a pullback into support profile with -2.3% 13-week relative strength versus SPY.
A failed hold above support would weaken the setup.
Actionable but governed by invalidation levels.
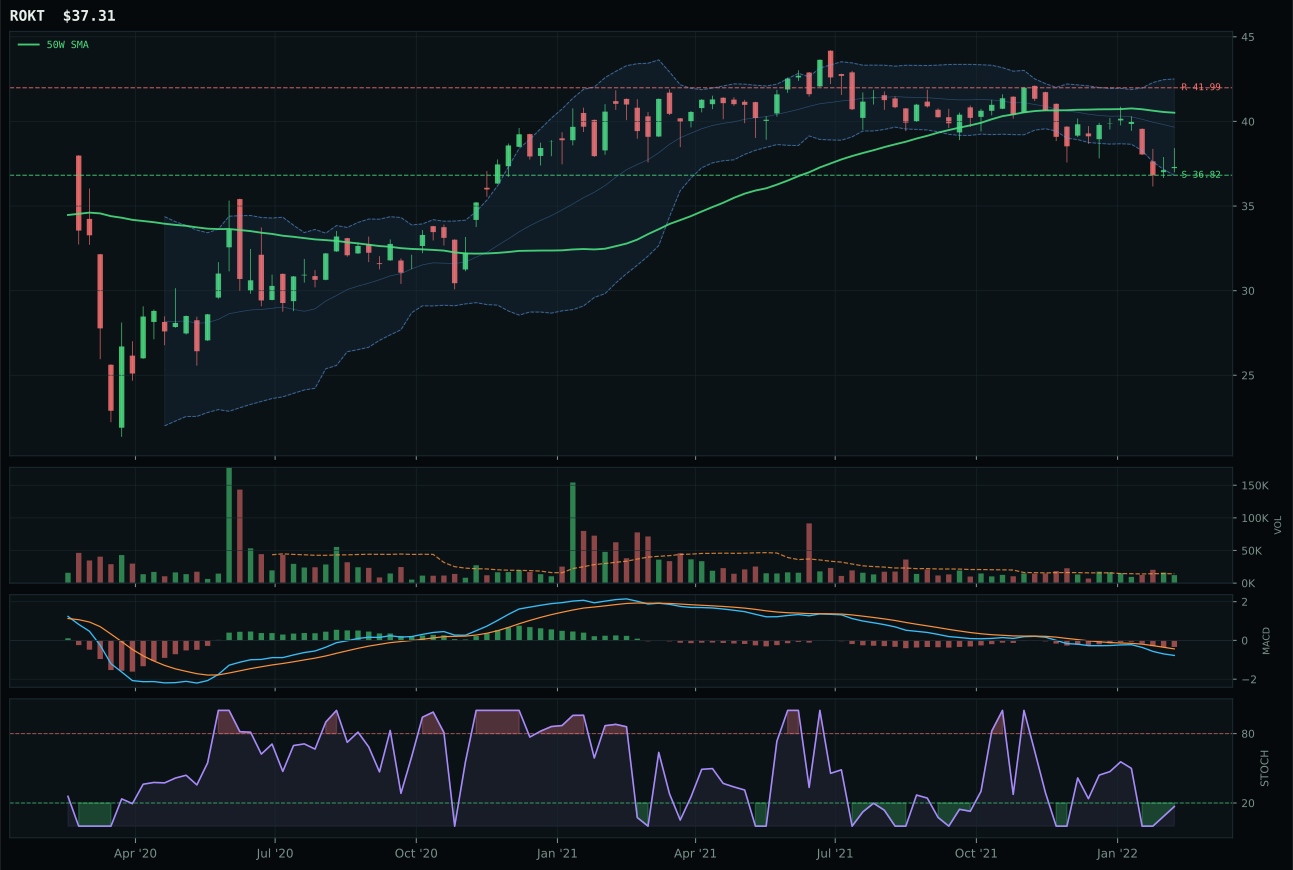
ROKT has a pullback into support profile with -4.0% 13-week relative strength versus SPY.
A failed hold above support would weaken the setup.
Tracked, but not top-2 eligible because: .
ITA emerges as the cleanest compression setup in a defensive-rotation environment, with price hugging the 50-week moving average at just 0.3% distance while MACD shows bullish inflection rather than weakness seen in XAR. The 87.2 trend score reflects SPY-relative strength of 4.2% and positive 13-week return of 1.6%—rare resilience in a bear market context. Above-average volume participation at 1.29x the 20-week average provides sponsorship for potential 50-week expansion, while XAR's neutral volume and bearish MACD reveal retail, not institutional, interest. ITA's 6.5% category-relative strength versus XAR's flat performance underscores which chart has attracted the marginal buyer.
Defense & Aerospace earns 5% as a complementary hedge to energy, leveraging defensive rotation (+8 macro points) and broad market bear conditions (+6 points) without crowding into expensive positions. The category's 40.2 score trails agriculture and energy but leads all non-real-asset categories, making it a rational allocation in transition macro when certainty is scarce. ITA's bullish-but-flattening MACD and rising stochastic RSI provide technical scaffolding for a position that will outperform if geopolitical volatility remains elevated or if growth rotation stalls; any sustained break above the 50-week moving average would justify modest upsize.
Emerging Markets — IEMG
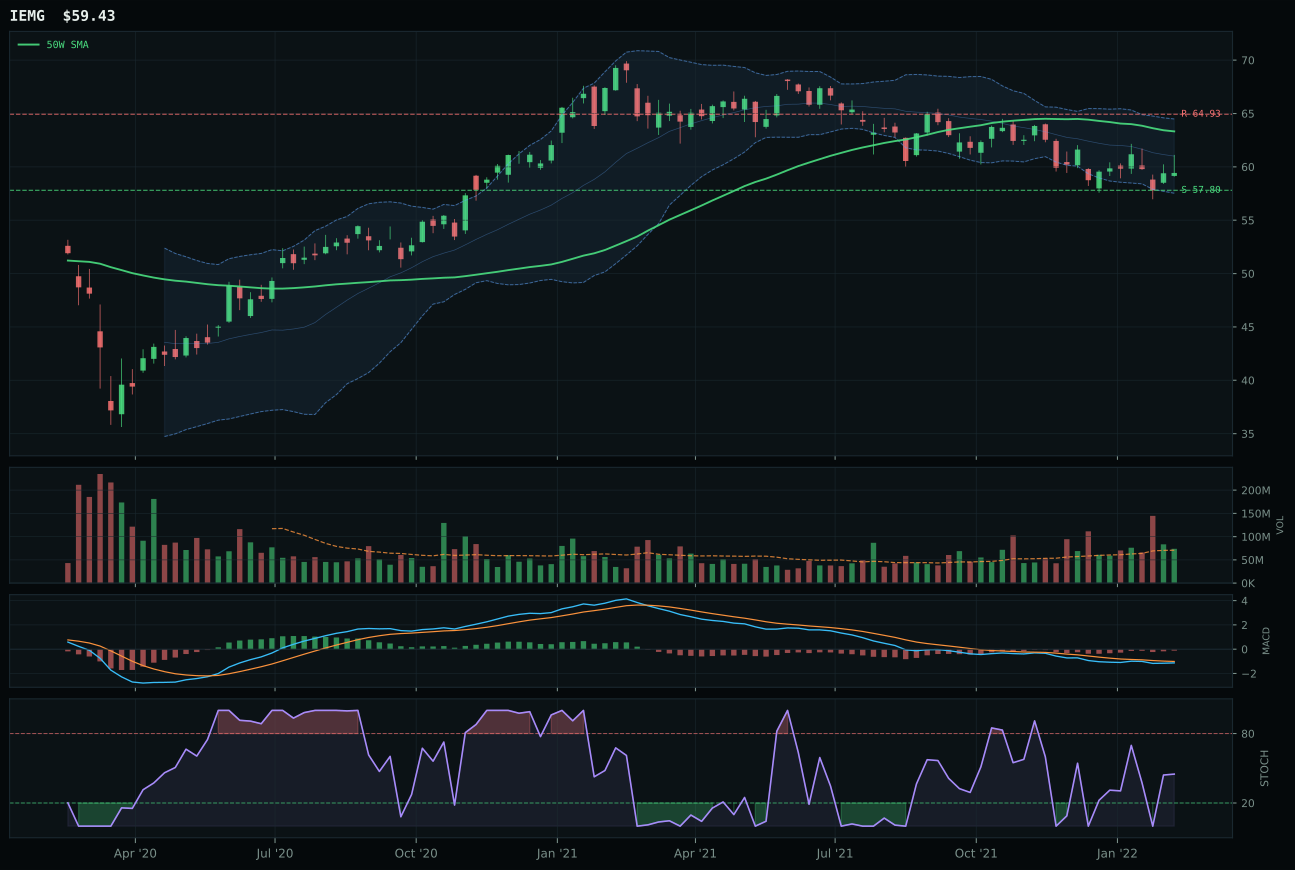
IEMG has a pullback into support profile with -1.2% 13-week relative strength versus SPY.
A failed hold above support would weaken the setup.
Actionable but governed by invalidation levels.
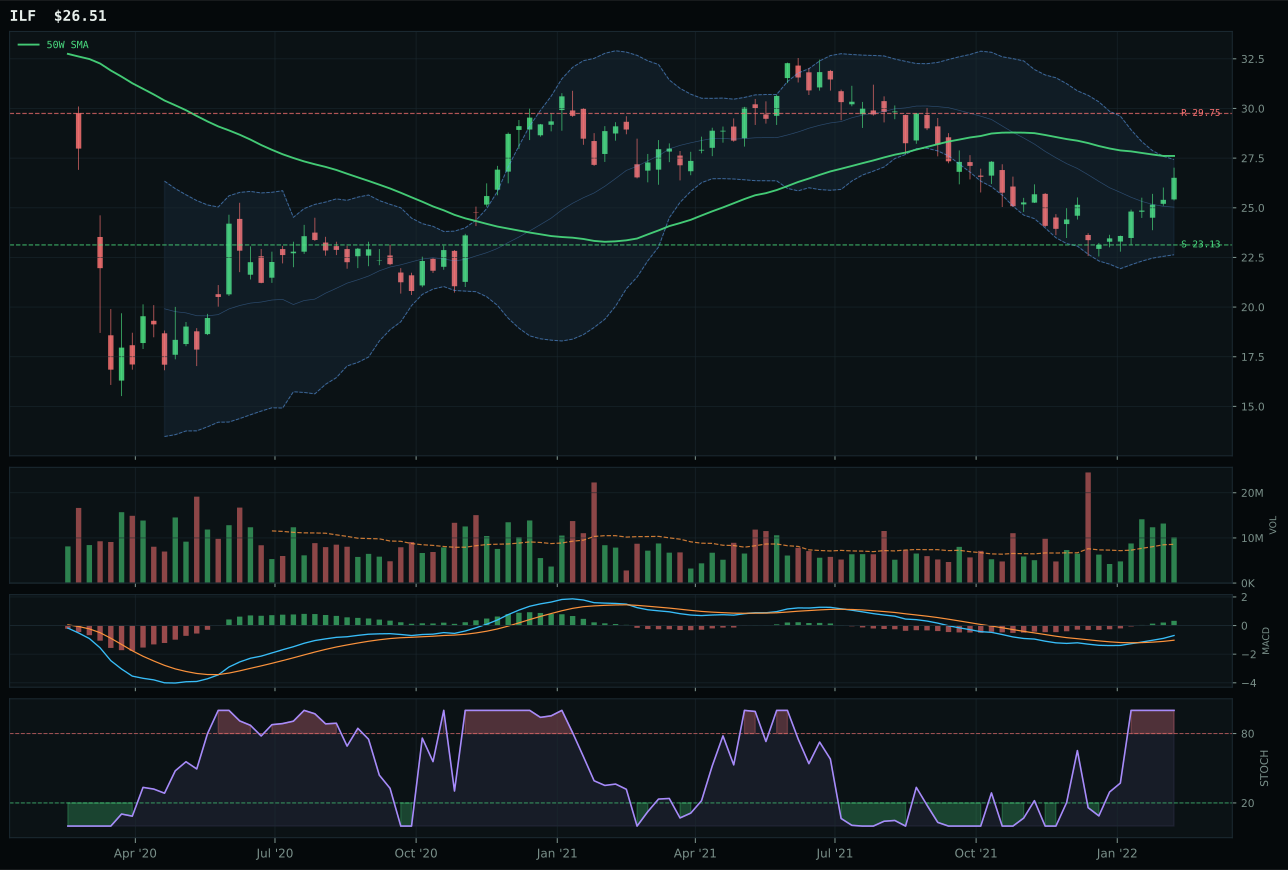
ILF has a neutral structure profile with 9.0% 13-week relative strength versus SPY.
Extension and support failure are the main tactical risks.
Tracked, but not top-2 eligible because: structurally broken.
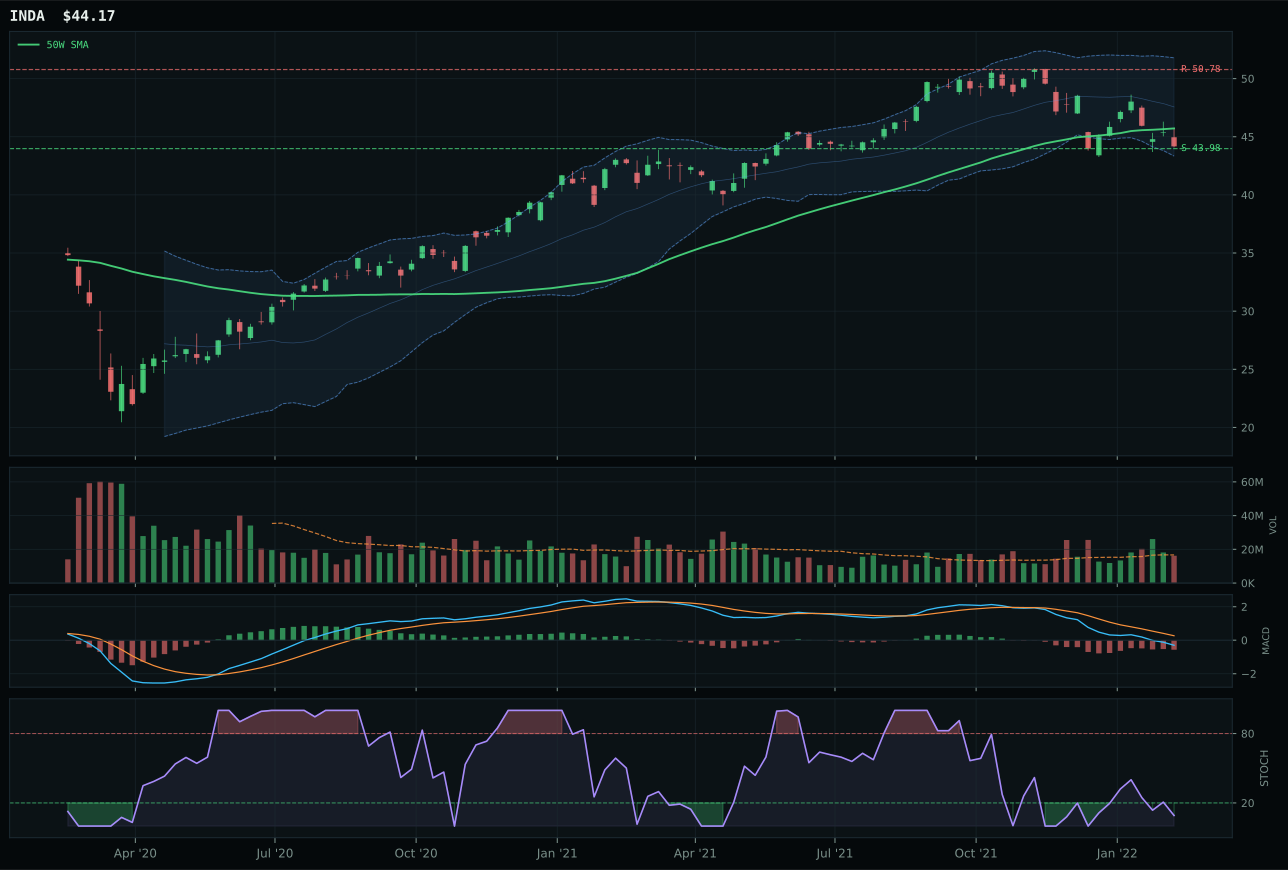
INDA has a pullback into support profile with -7.3% 13-week relative strength versus SPY.
A failed hold above support would weaken the setup.
Actionable but governed by invalidation levels.
IEMG prevails through superior risk-reward setup despite ILF's stronger momentum, exploiting the pullback-into-support structure that defines favorable entry geometry in bear markets. Sitting 6.2% below the 50-week moving average with 90.0 risk-reward score (upside 8.5% to resistance, downside 2.8% to support), IEMG offers 3:1 asymmetry that ILF cannot match at its overbought positioning. MACD bearish-but-improving paired with stochastic RSI rising mid-zone (0.45) shows early-stage rebound energy without the euphoria of ILF's overbought reading. ILF's 9.0% SPY-relative and 3.2% 13-week returns reflect commodity and value beta strength, but neutral structure and 66.4 risk-reward reveal limited margin for error if the macro regime shifts toward structural growth concerns.
Emerging Markets' 5% allocation reflects IEMG's defensive positioning within a weak category, earning space through superior risk-reward rather than momentum conviction. The 34.5 category score is second-lowest overall, sustained only by EM liquidity support (+14 macro) offsetting credit stress (-10) and broad market bear conditions (-9). IEMG's 93.0 timing score and 90.0 risk-reward provide technical scaffolding for a position that will benefit from any stabilization in dollar weakness or credit stress reduction, but current setup is survival-oriented. If emerging market currency strength accelerates or Chinese stimulus narratives re-accelerate, IEMG would be an early beneficiary; absent macro pivot, this is a tactical hold designed to rebalance rather than drive portfolio returns.
Nuclear Energy — URA
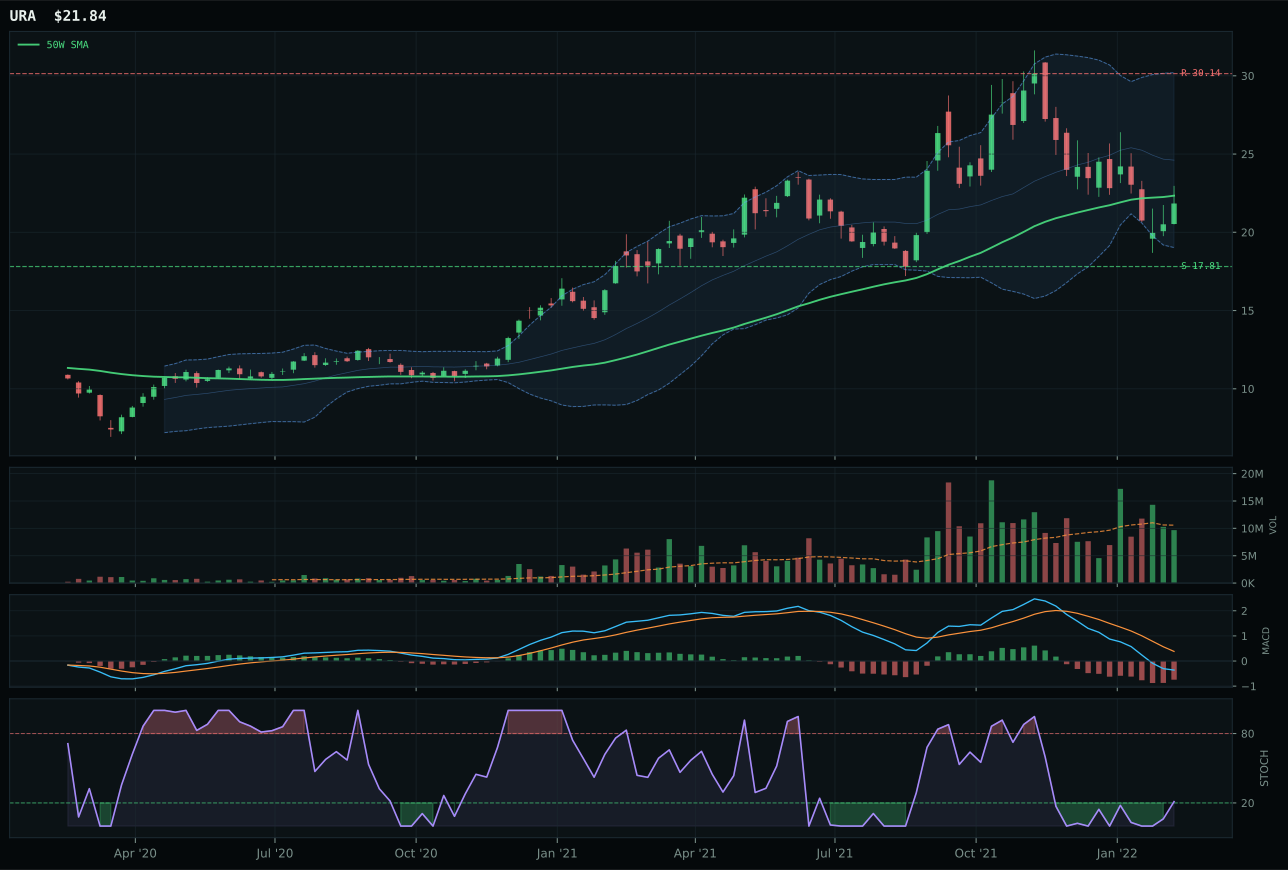
URA has a compression near 50W profile with -21.8% 13-week relative strength versus SPY.
A failed hold above support would weaken the setup.
Actionable but governed by invalidation levels.
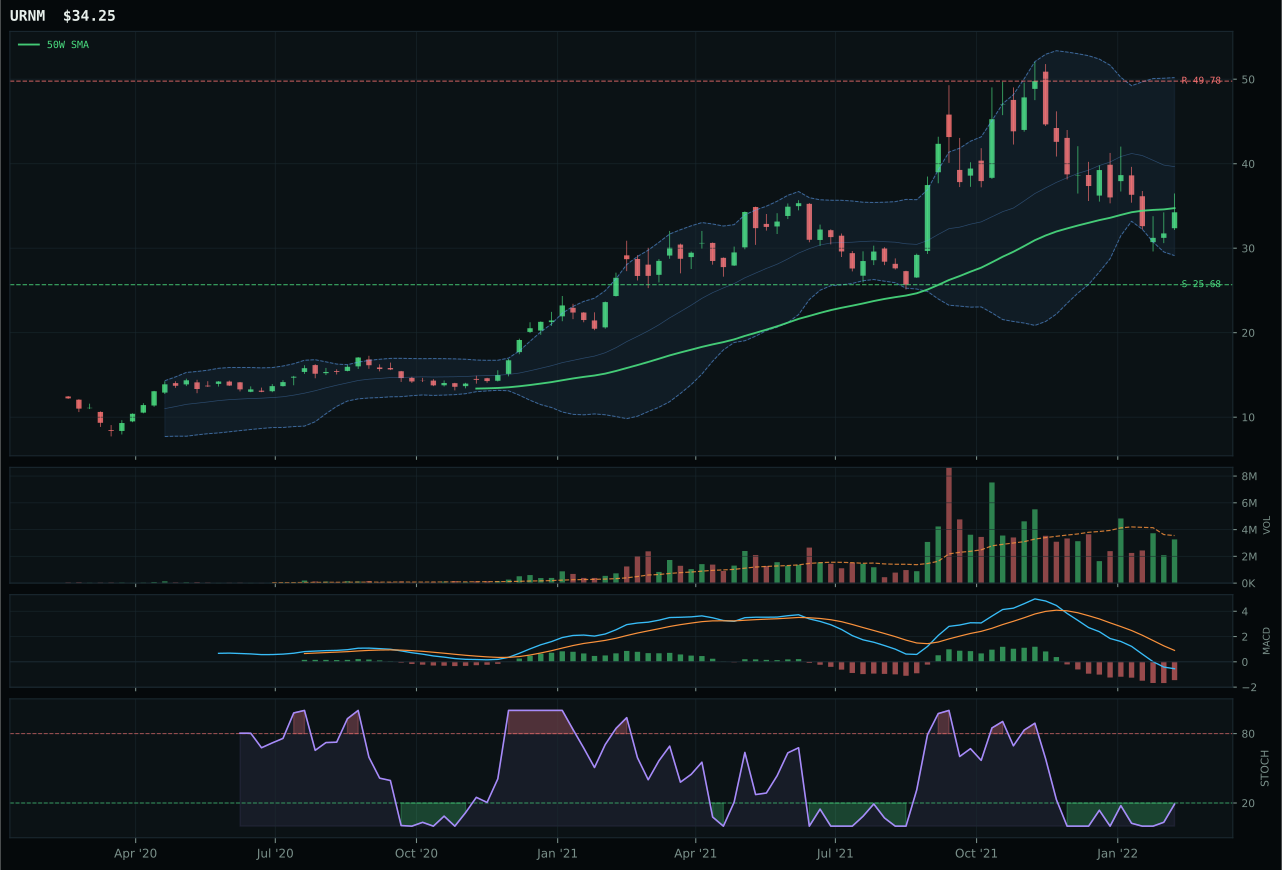
URNM has a compression near 50W profile with -25.5% 13-week relative strength versus SPY.
A failed hold above support would weaken the setup.
Actionable but governed by invalidation levels.
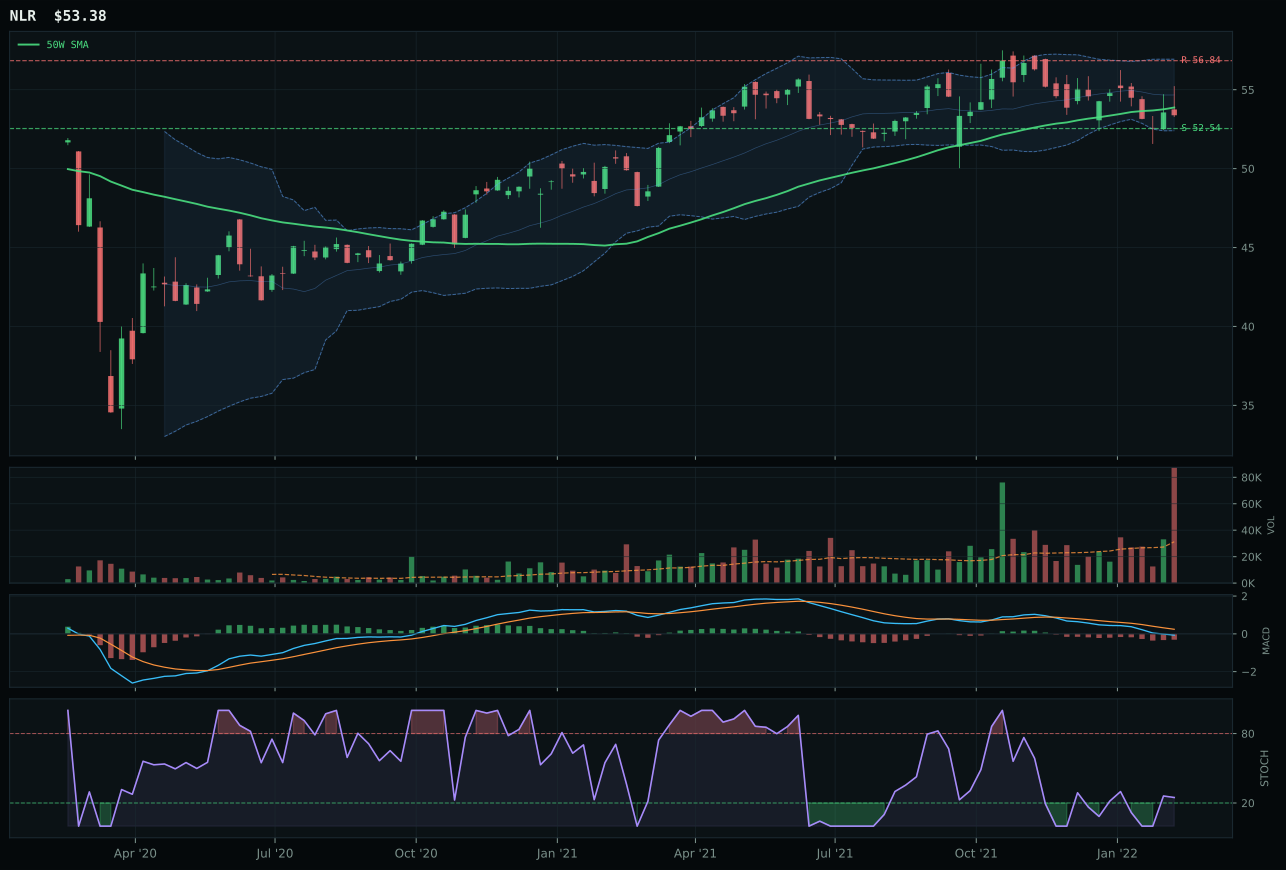
NLR has a pullback into support profile with 0.6% 13-week relative strength versus SPY.
A failed hold above support would weaken the setup.
Tracked, but not top-2 eligible because: .
URA wins a weak category by defaulting to better pullback structure and less severe relative weakness, though this is survival more than victory. The chart sits just 2.2% below the 50-week moving average with compression structure and deep-value Fibonacci location (0.618 at 22.43), offering a defined risk area with stochastic RSI rising mid-zone at 0.21. The 100.0 timing score reflects the setup mechanics, not momentum strength—13-week returns are catastrophic at -27.5%, and SPY-relative strength of -21.8% shows the sector has been abandoned. URNM's loss is steeper: -31.2% 13-week return, -25.5% SPY-relative, and worse structure (55.0 versus 59.2), making URA the least-bad option in a structurally broken category.
Nuclear Energy receives zero allocation because the category scores 28.3, ranking 9th or 10th with no viable path to a position at current macro regime. While energy scarcity (+9) and real asset sponsorship (+7) offer modest support, URA's -27.5% 13-week return and -21.8% SPY underperformance signal that uranium-related flows are caught in the broad market bear (-8) and credit stress headwinds. The macro fit of 60.0 is insufficient when combined with technical evidence of 20.8 from trend weakness, zero momentum, and distribution-pressure volume. URA's perfect timing setup and defined support are meaningless when the category itself is broken. For Nuclear Energy to earn even a 5% allocation, energy prices would need to strengthen, credit stress would need to ease, and uranium-miner volume would need to shift from panic-selling to intelligent accumulation. None of these conditions are currently active.
AI — SMH
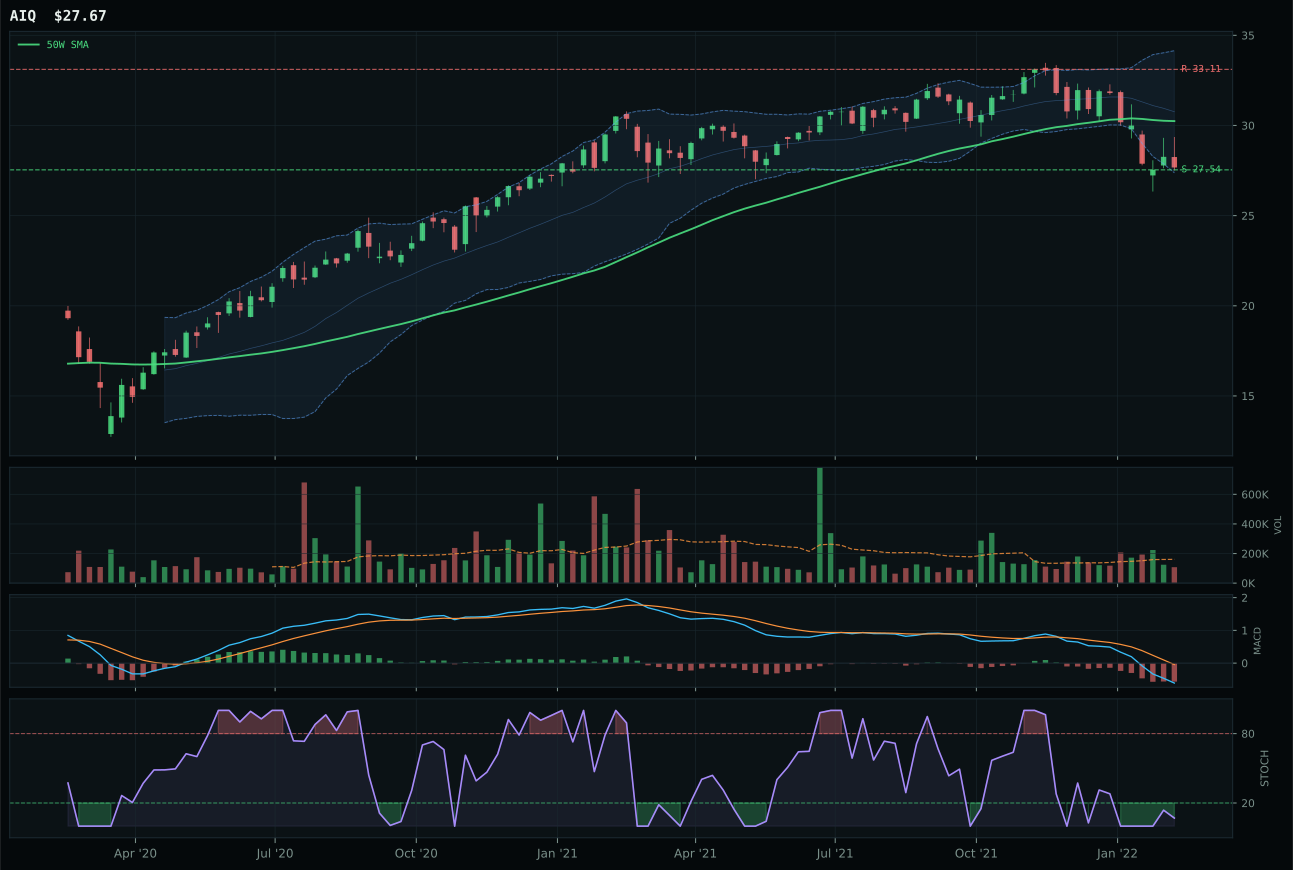
AIQ has a pullback into support profile with -10.7% 13-week relative strength versus SPY.
A failed hold above support would weaken the setup.
Tracked, but not top-2 eligible because: .
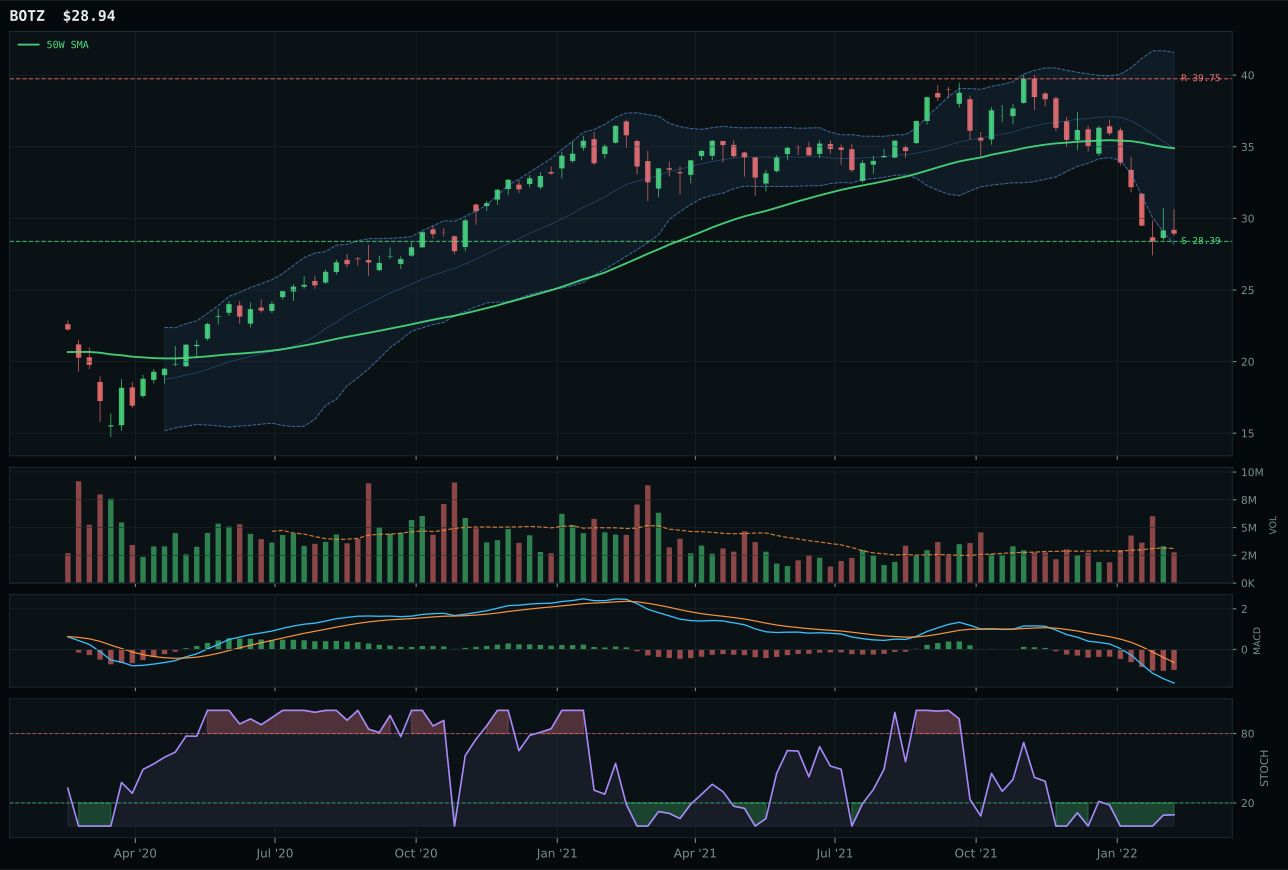
BOTZ has a pullback into support profile with -19.0% 13-week relative strength versus SPY.
A failed hold above support would weaken the setup.
Actionable but governed by invalidation levels.
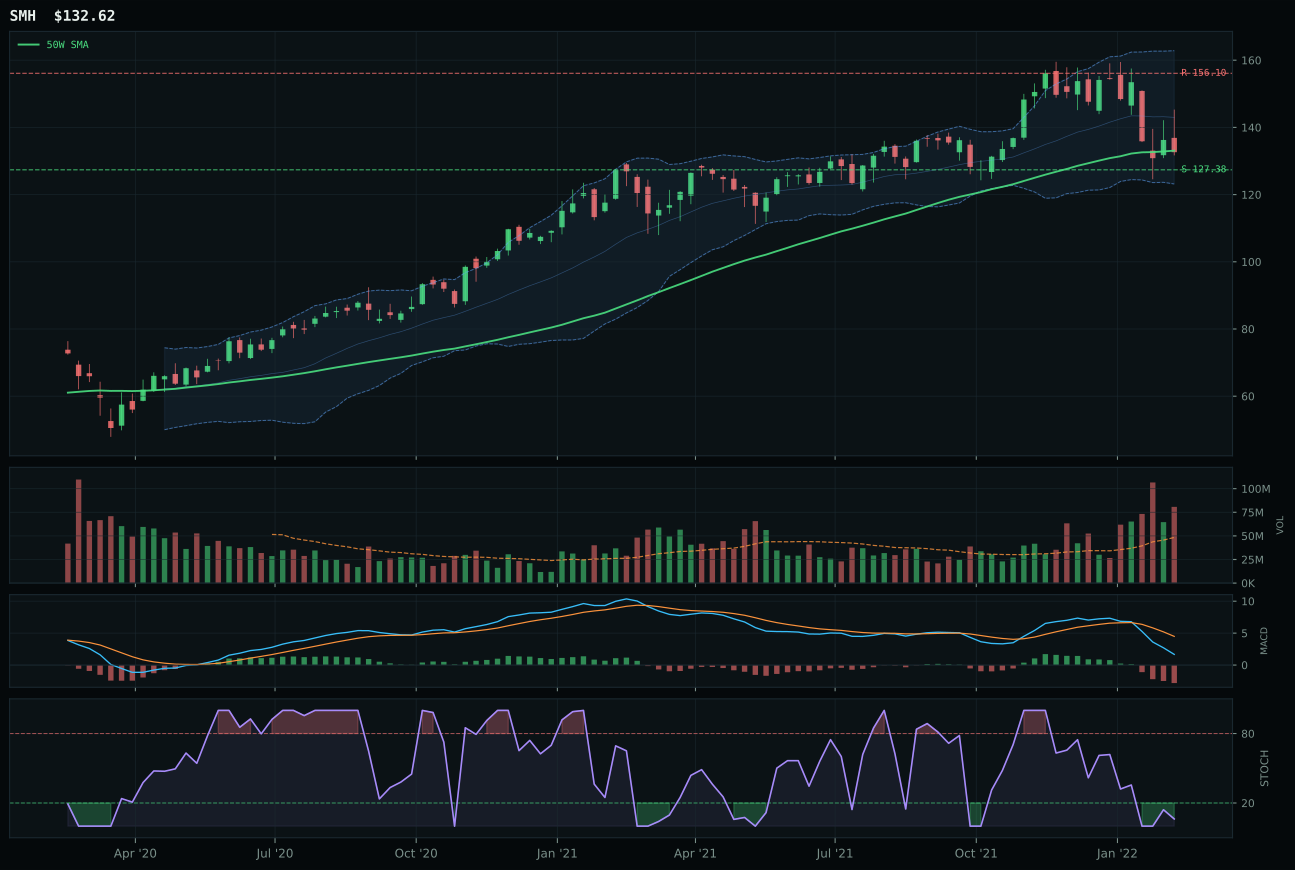
SMH has a pullback into support profile with -6.2% 13-week relative strength versus SPY.
A failed hold above support would weaken the setup.
Actionable but governed by invalidation levels.
SMH wins through relative outperformance within a category defined by distribution pressure and lack of conviction. The chart sits at the 50-week average with just 0.3% distance, pairing clean timing (100.0 score) against negative 13-week returns of 11.9%—an honest picture of recent momentum rejection. Category-relative strength of 4.5% separates SMH from the median, and 1.67x volume distribution suggests accumulation despite the weakness. AIQ's 33-point deficit versus SMH comes from weaker timing (94.0 versus 100.0) and cleaner structure in SMH's compression pattern, though both face the fundamental problem of a -43 basis point macro environment where credit stress and broken risk appetite are active headwinds.
AI receives zero allocation this week, ranked 9th or 10th among the ten categories with a final score of 21.3 that reflects structural damage across the entire category. Credit stress (-8) and broad market bear (-8) signals are crushing semiconductor and AI-focused equity flows, and no amount of timing perfection can overcome -21.8% to -25.5% SPY underperformance in the three-ETF basket. SMH's distribution pressure actually signals capitulation-style selling rather than smart-money accumulation, and the category's 44.0 macro fit is the second-lowest on the board after Nuclear Energy. For AI to earn even a 5% position, timing would need to shift from oversold bounce setup to actual volume-price confirmation of a reversal, paired with at least one macro descriptor moving from active-negative to neutral. That threshold is not yet met.