
2022-02-04
Informational purposes only. The content in this report, including allocations, analysis, and commentary, is provided solely for informational and educational purposes. It does not constitute financial advice, investment advice, trading advice, or any other type of advice. Past performance does not guarantee future results. Always conduct your own research and consult a qualified financial professional before making investment decisions.
Weekly Allocation
| Ticker | Category | Weight | Role |
|---|---|---|---|
| XLE | Traditional Energy | 20% | Top-2 (20%) |
| COPX | Industrial Metals | 20% | Top-2 (20%) |
| IGF | Utilities & Infrastructure | 10% | Tier-2 (10%) |
| MOO | Agriculture & Livestock | 10% | Tier-2 (10%) |
| GLD | Precious Metals | 10% | Tier-2 (10%) |
| XLK | Technology | 10% | Tier-2 (10%) |
| IEMG | Emerging Markets | 10% | Tier-2 (10%) |
| ITA | Defense & Aerospace | 10% | Tier-2 (10%) |
Trade Instructions — Monday Open
Sell the tranche from 2022-01-07 (completing its 4-week hold). Buy the new tranche. Instructions show net portfolio changes — same-asset positions cancel, weight changes show the delta.
| Action | Ticker | Instruction |
|---|---|---|
| SELL | IGF | Sell 22% of IGF position (reduce 11.25% → 8.75%) |
| SELL | URA | Sell 40% of URA position (reduce 6.25% → 3.75%) |
| SELL | CIBR | Sell entire CIBR position (2.50% of portfolio) |
| BUY | XLE | Buy XLE — 33.33% of freed cash (adds 2.50% to portfolio) |
| BUY | XLK | Buy XLK — 33.33% of freed cash (adds 2.50% to portfolio) |
| BUY | IEMG | Buy IEMG — 33.33% of freed cash (adds 2.50% to portfolio) |
Current Portfolio After Trade
Combined holdings across all 4 active tranches. Each tranche is 25% of the portfolio.
| Ticker | % of Portfolio | Weight Bar |
|---|---|---|
| XLE | 30.00% | |
| COPX | 15.00% | |
| GLD | 11.25% | |
| IGF | 8.75% | |
| MOO | 8.75% | |
| ITA | 8.75% | |
| XLK | 8.75% | |
| URA | 3.75% | |
| INDA | 2.50% | |
| IEMG | 2.50% |
Macro Regime — Transition / Mixed
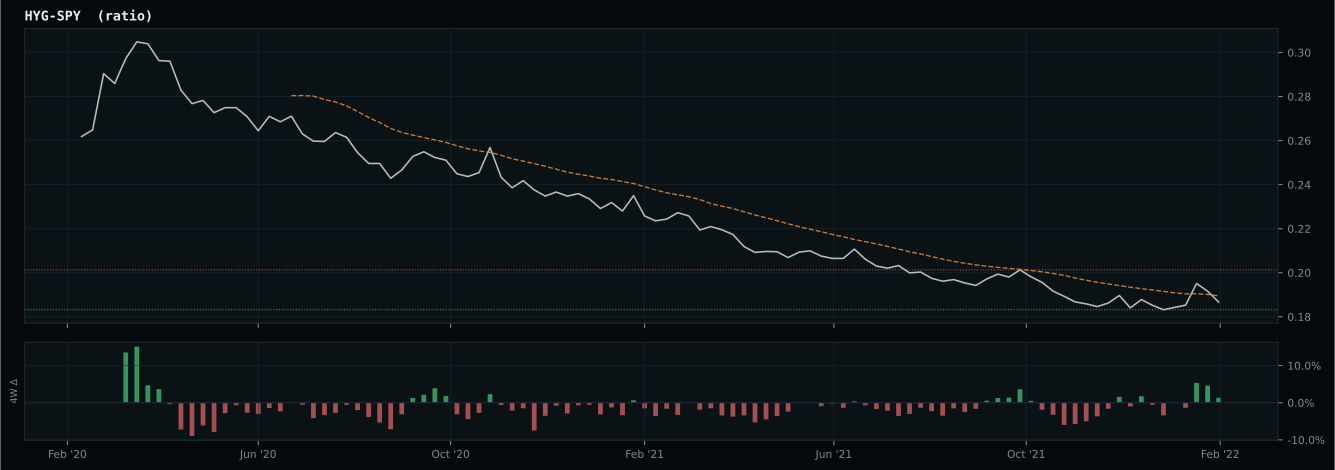
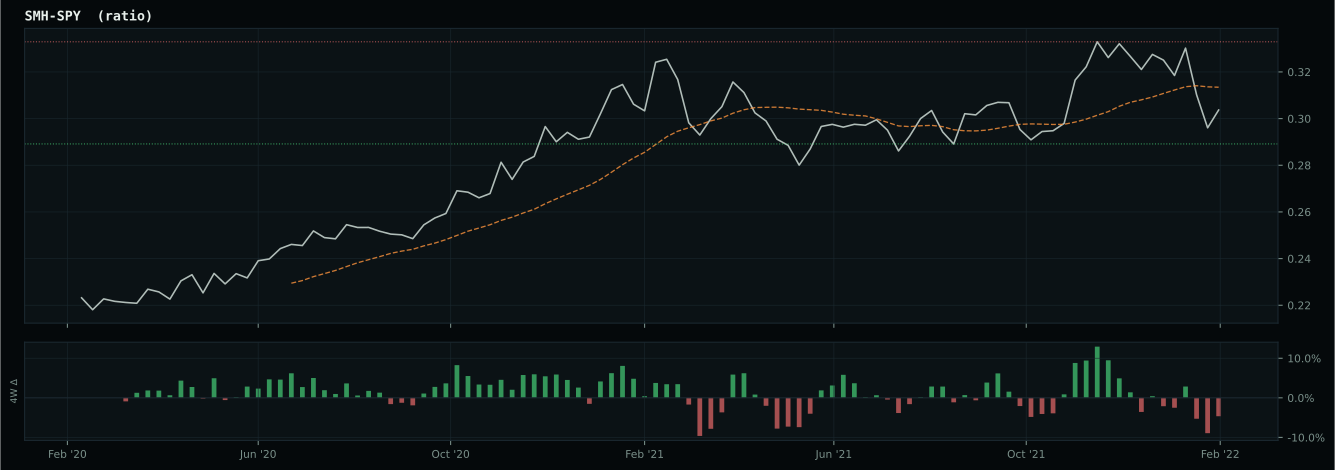
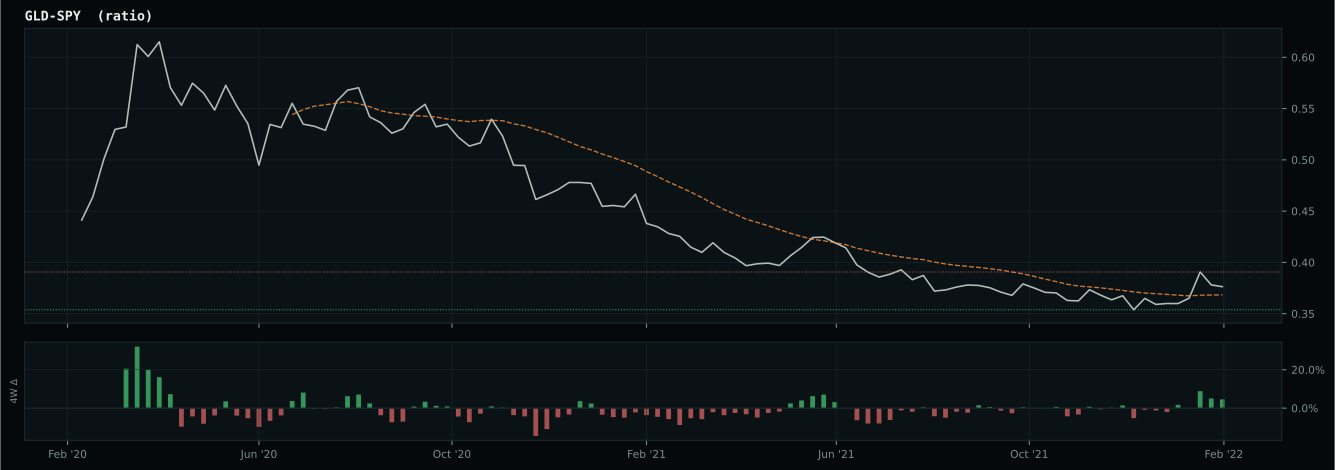
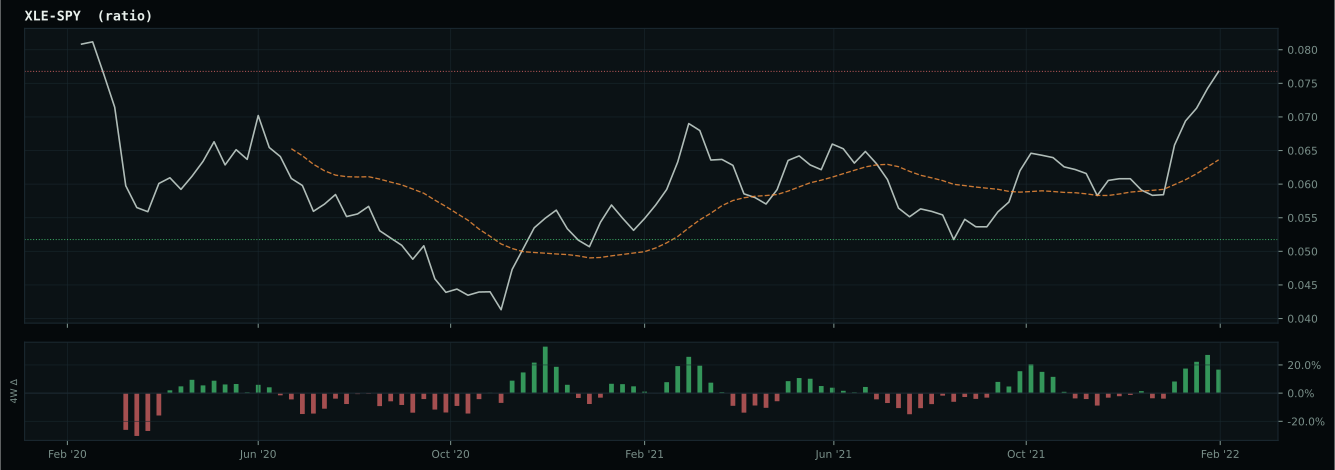
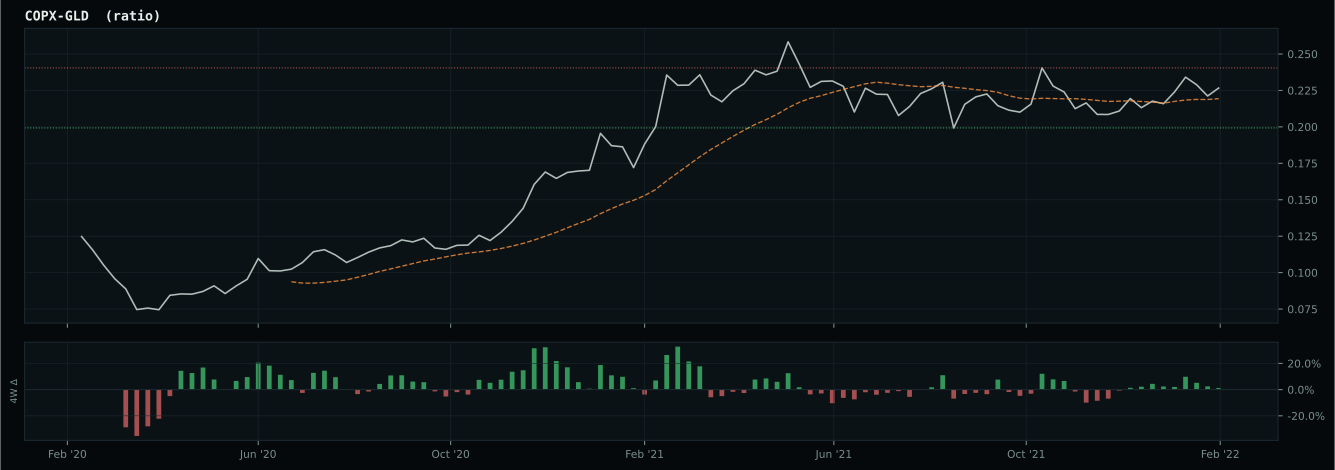
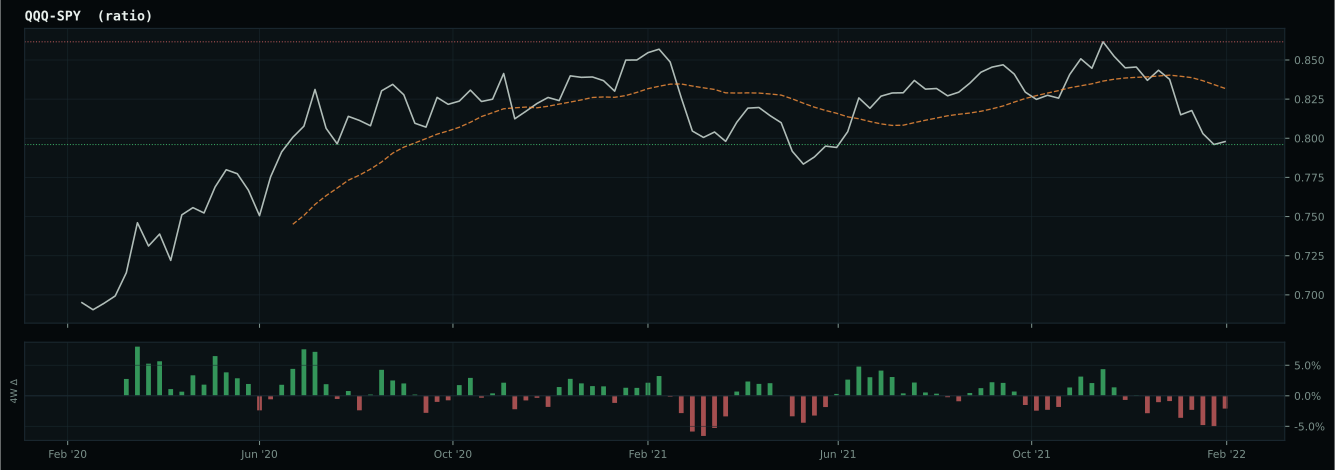
growth data is not confirming the weak market-implied risk appetite signal
Macro Evidence Charts
Market-implied signals behind the macro regime scores. Each ratio compares two assets; the direction and slope of the ratio is what the macro engine reads.
Crypto Regime — NoCrypto
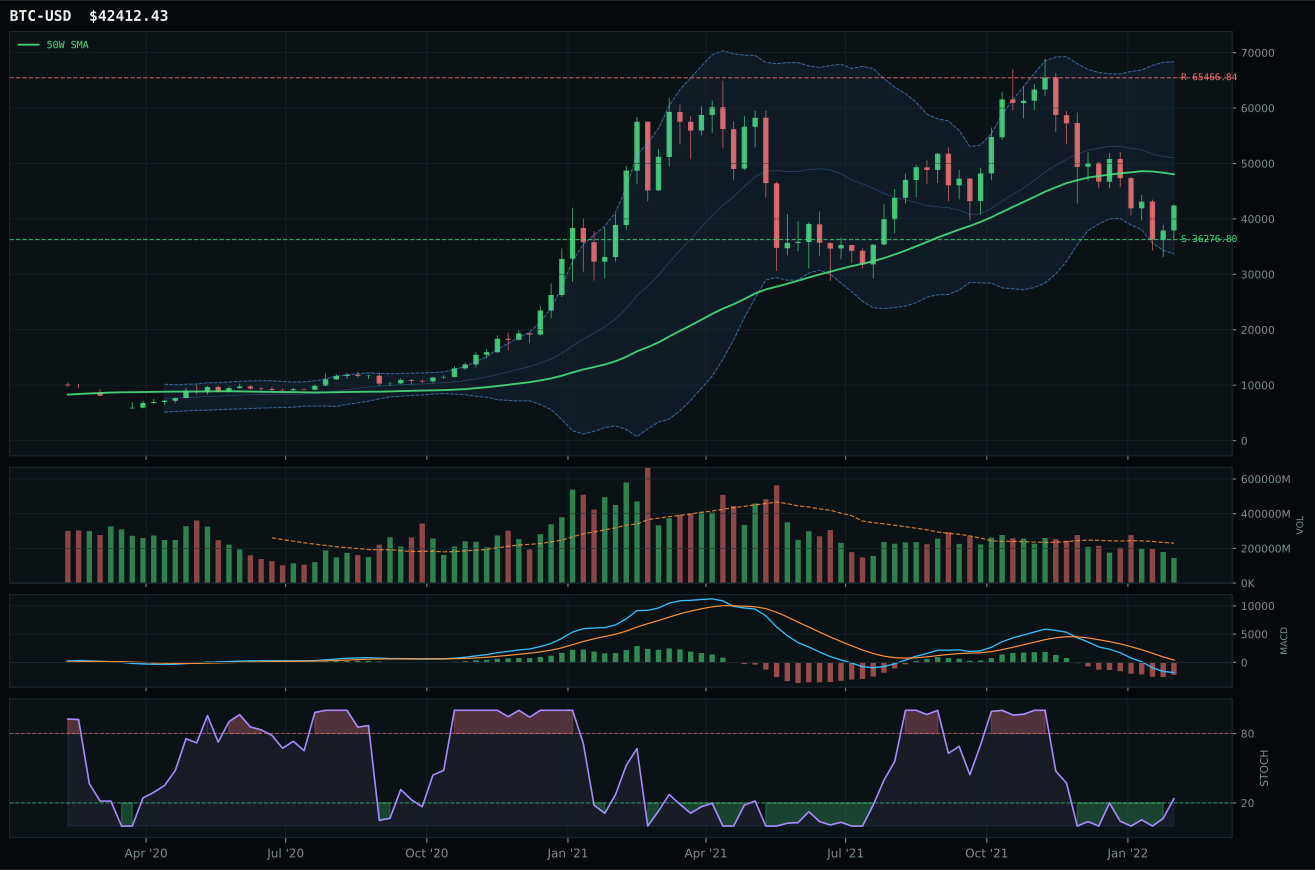
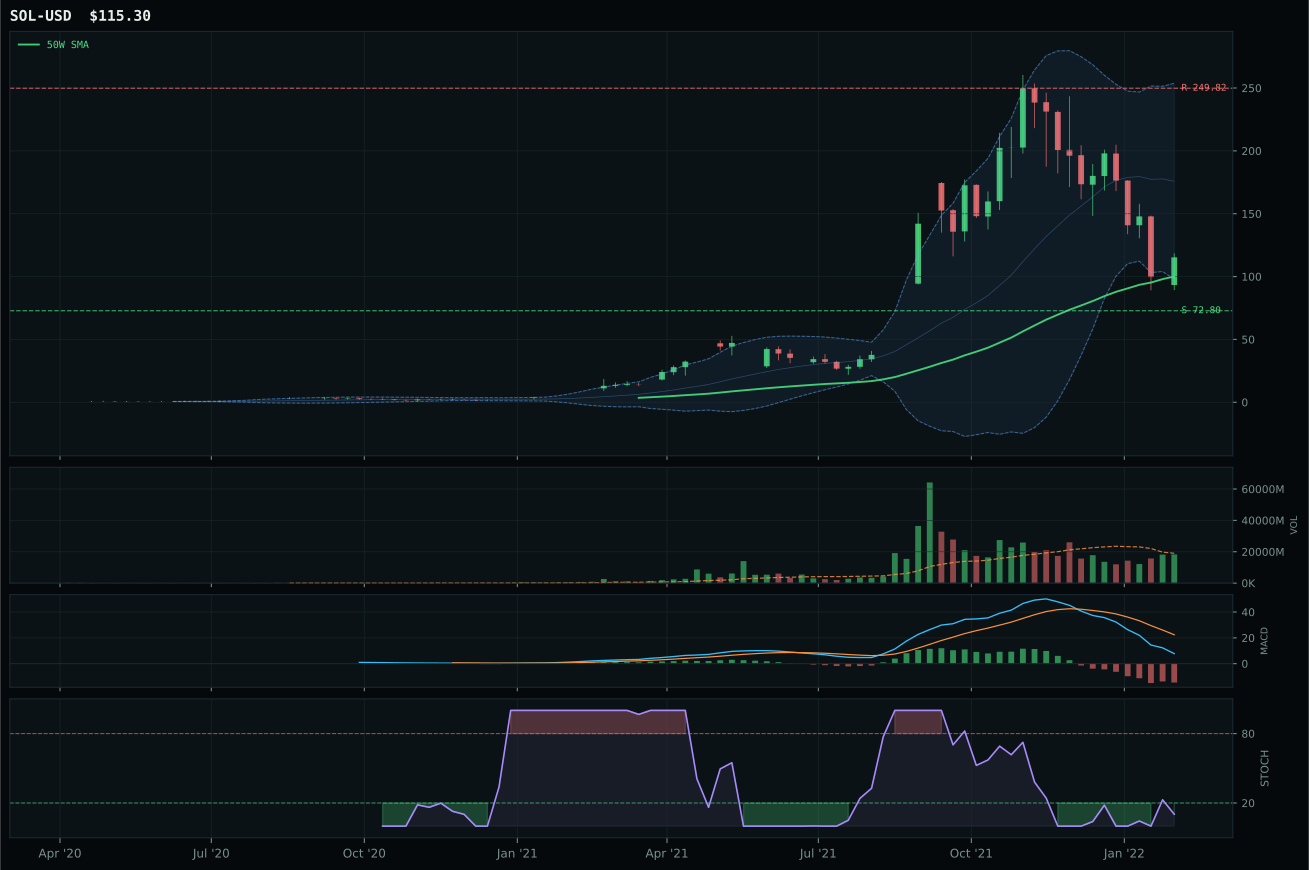
ValueBTC not armed: BTC has not made the first post-breakdown touch of the 200W buy zone after losing the 50W
TrendBTC not confirmed
one or more available conditions failed
Category Rankings
| Rank | Category | Winner | Score | Alloc | 4W Ret | Peers (4W) |
|---|---|---|---|---|---|---|
| 1 | Traditional Energy | XLE | 83.5 | 20% | +10.85% | XOP +14.7% · FCG +17.1% |
| 2 | Industrial Metals | COPX | 71.5 | 20% | +15.67% | PICK +11.5% · REMX +2.2% |
| 3 | Utilities & Infrastructure | IGF | 60.9 | 10% | +0.63% | XLU +3.9% · PAVE +3.9% |
| 4 | Agriculture & Livestock | MOO | 57.3 | 10% | +5.12% | WEAT +52.8% · VEGI +8.1% |
| 5 | Precious Metals | GLD | 56.2 | 10% | +8.85% | SLV +11.4% · GDX +23.0% |
| 6 | Technology | XLK | 39.1 | 10% | -6.32% | CIBR +5.0% · IGV -7.0% |
| 7 | Emerging Markets | IEMG | 37.9 | 10% | -8.91% | INDA -8.5% · ILF +8.4% |
| 8 | Defense & Aerospace | ITA | 34.4 | 10% | +6.94% | XAR +11.2% · ROKT +8.0% |
| 9 | AI | SMH | 30.4 | 0% | -6.60% | AIQ -9.8% · BOTZ -5.4% |
| 10 | Nuclear Energy | URA | 27.9 | 0% | +16.51% | NLR +1.7% · URNM +16.6% |
Traditional Energy — XLE
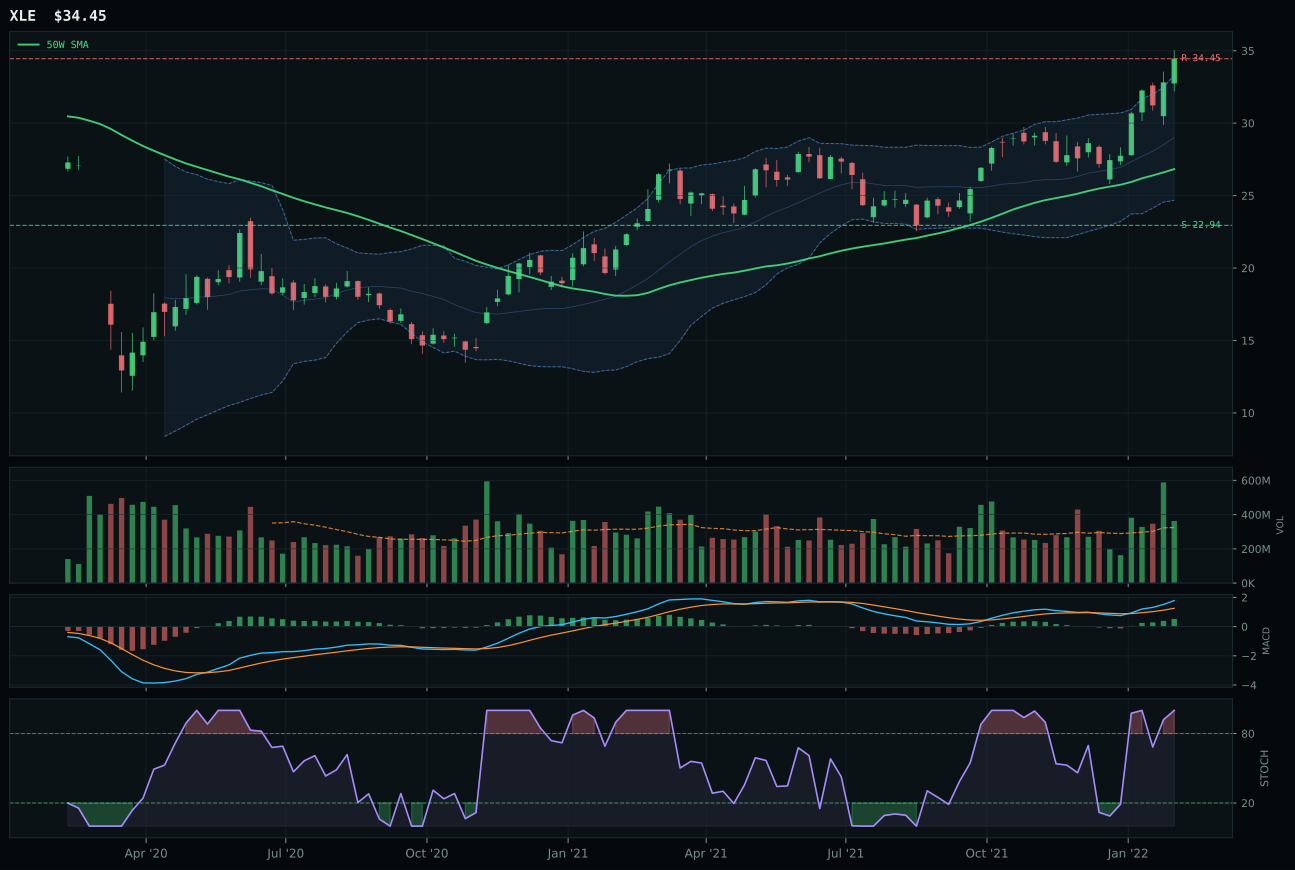
XLE has a vertical extension profile with 22.5% 13-week relative strength versus SPY.
A failed hold above support would weaken the setup.
Actionable but governed by invalidation levels.
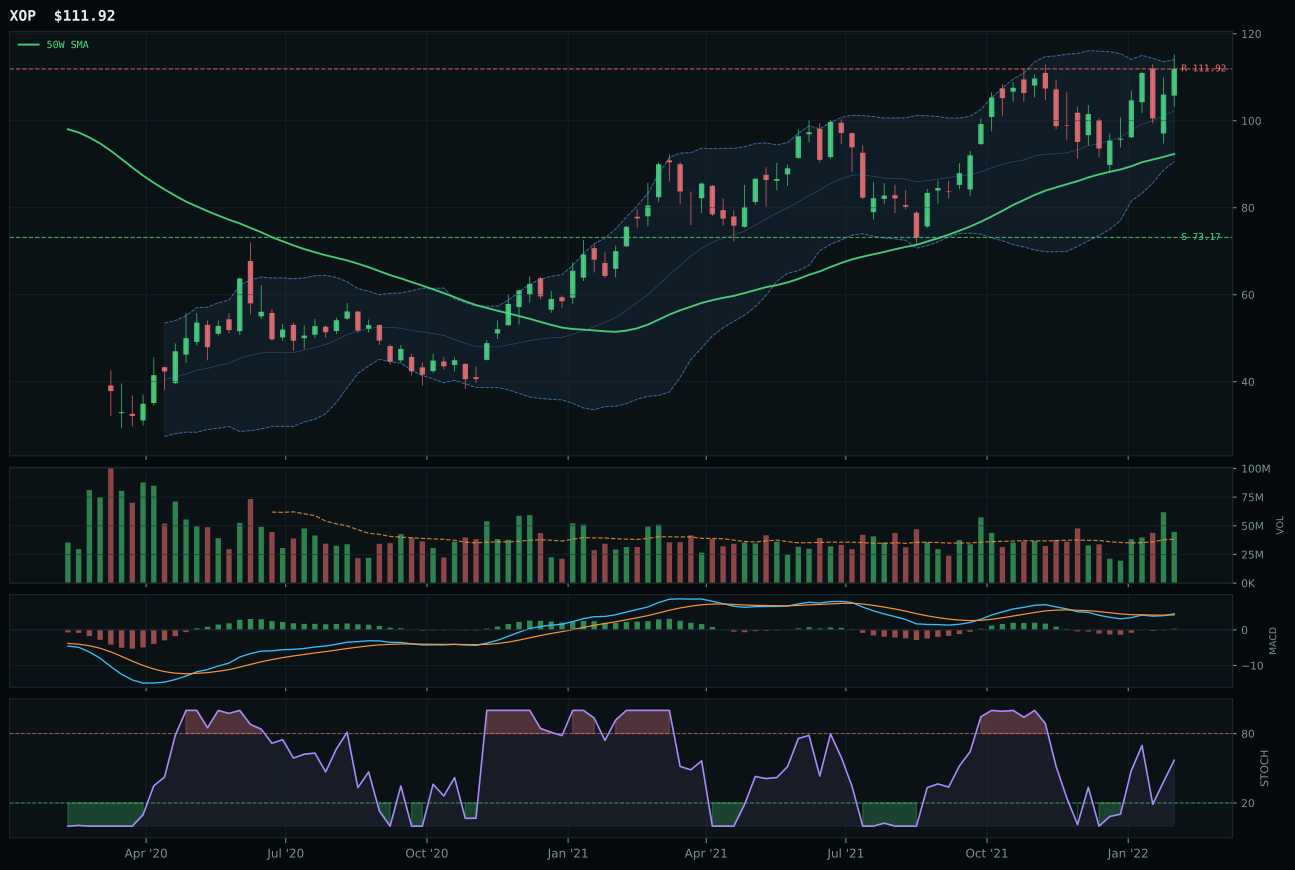
XOP has a vertical extension profile with 6.2% 13-week relative strength versus SPY.
A failed hold above support would weaken the setup.
Actionable but governed by invalidation levels.
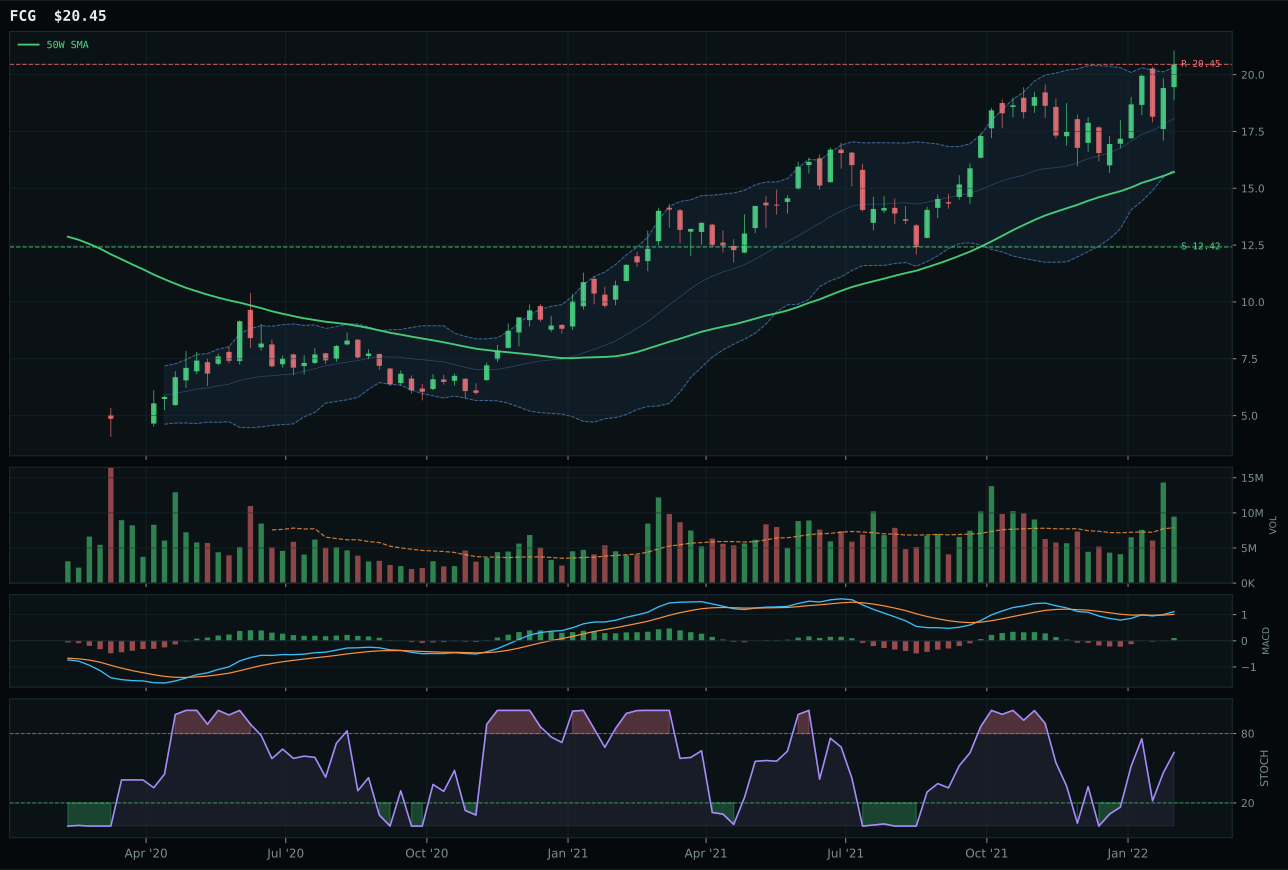
FCG has a vertical extension profile with 11.8% 13-week relative strength versus SPY.
A failed hold above support would weaken the setup.
Actionable but governed by invalidation levels.
XLE wins at 83.5/100, the portfolio's highest category score, earning the full 20% allocation, because it delivers perfect 100.0 trend confirmation paired with flawless 100.0 momentum confirmation despite terrible 37.0/100 timing (price extended 28.4% above the 50-week moving average). The reason this extreme extension is acceptable: the 22.5% relative strength to SPY and +18.3% 13-week momentum are so dominant that every buyer matters more than entry timing. Volume at 1.12x the 20-week average confirms this is liquid accumulation, not thin speculative buying. MACD is bullish-improving and stochastic RSI is overbought-momentum at 1.00, a rare condition indicating strong conviction purchases at any level. The persistence score of 85.3/100 is the highest in the portfolio, showing this is a regime-level rotation into energy scarcity, not a mean-reversion bounce. XOP's 75.0/100 macro conviction and stronger 84.7/100 technical evidence cannot overcome XLE's peer leadership inside the category—XOP's -5.6% category-relative strength and weaker +6.2% SPY RS confirm it's a lagging participation play, not the driver.
Traditional Energy commands 20% because at 83.5, it is the single highest-conviction category in the portfolio, and the macro alignment is unprecedented. Energy scarcity (+16 points), supply shortage (+9 points), and inflation pressure (+10 points) combine with real asset sponsorship (+7 points) to create a +42-point macro advantage offset only by -7 from credit stress. This is the portfolio's clearest macro-to-market translation: oil prices are physically constrained, monetary conditions are accommodative for hard assets, and every Fed rate hike increases real asset value. The timing penalty of 37.0/100 is real—XLE at 28.4% extension above the 50-week moving average means every new buyer is late, and the risk/reward at 39.9/100 (zero upside to resistance, -50.1% downside to support) is the worst in the portfolio. However, persistence of 85.3/100 and momentum confirmation of 100.0/100 override timing risk because the regime shift is structural, not tactical. Accept the poor entry risk as the price of capturing the portfolio's strongest conviction theme. Position size at 20% reflects that this allocation must be managed for rotation risk once supply normalizes or geopolitical tensions ease.
Industrial Metals — COPX
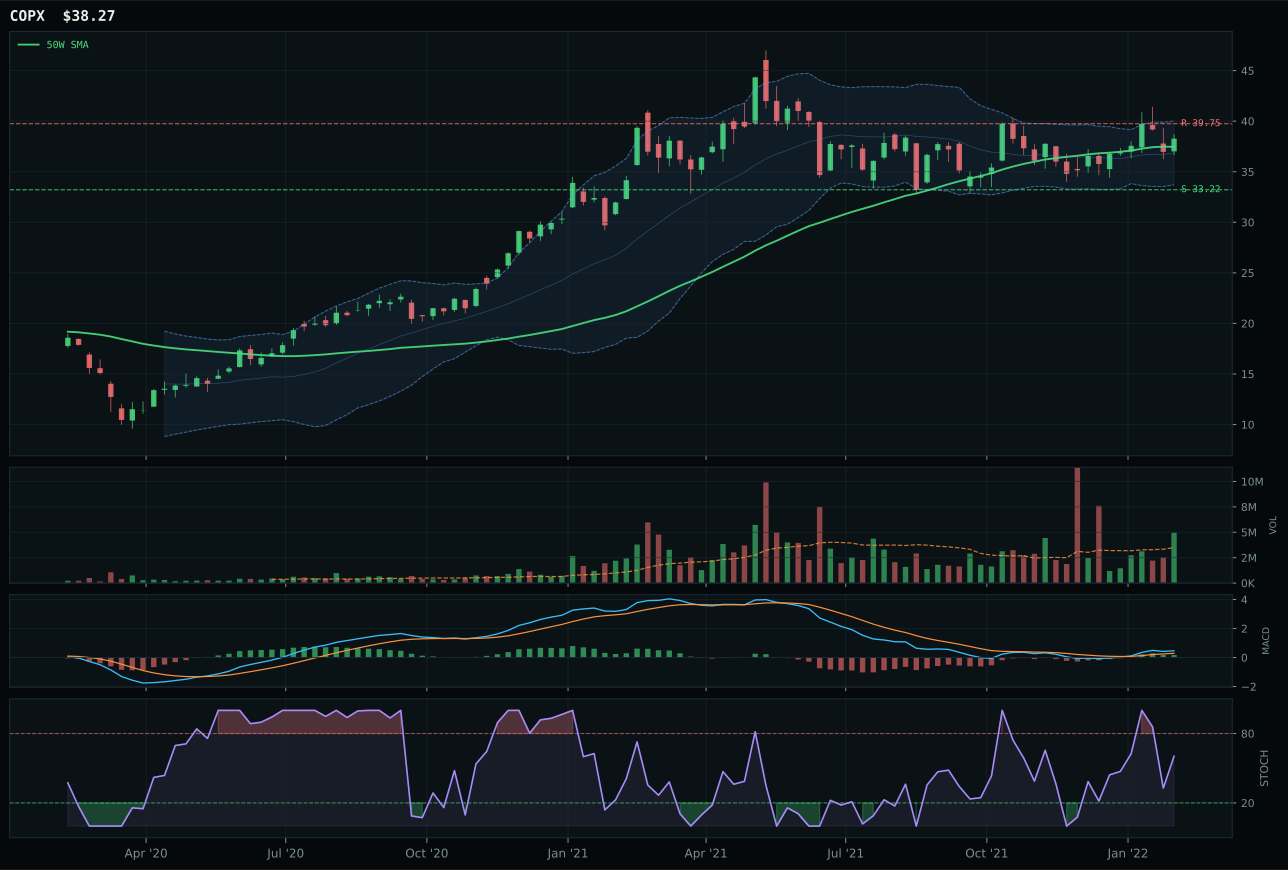
COPX has a compression near 50W profile with 10.3% 13-week relative strength versus SPY.
A failed hold above support would weaken the setup.
Actionable but governed by invalidation levels.
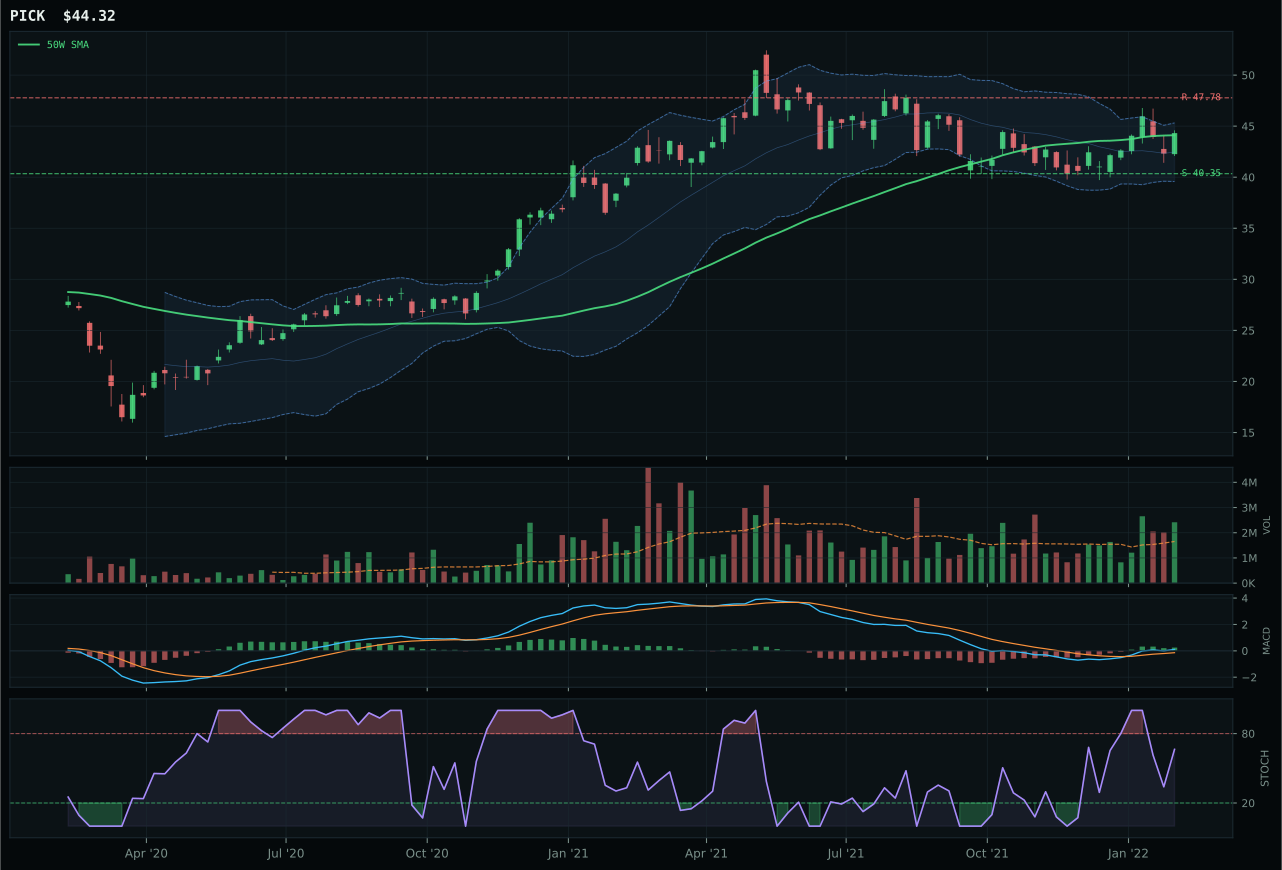
PICK has a compression near 50W profile with 11.3% 13-week relative strength versus SPY.
A failed hold above support would weaken the setup.
Actionable but governed by invalidation levels.
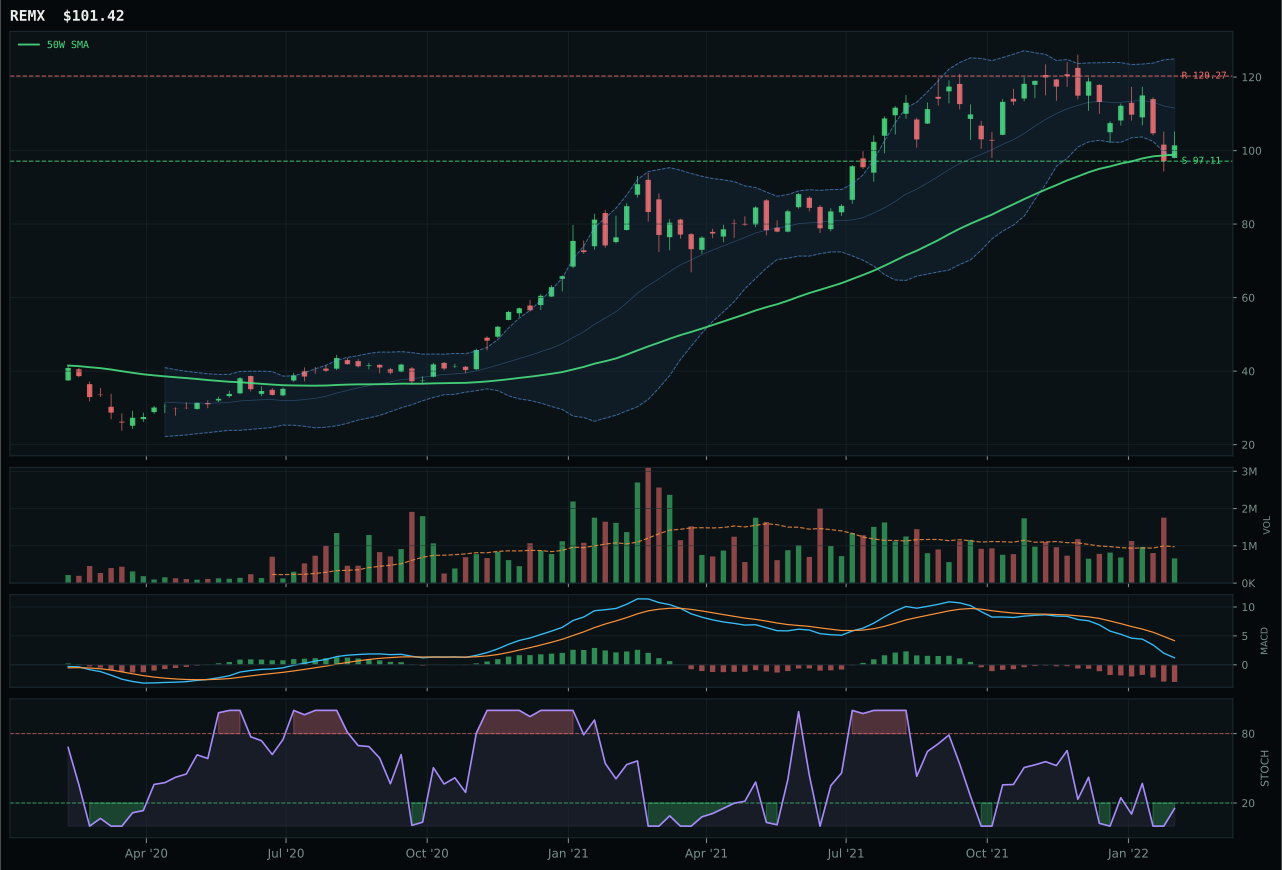
REMX has a pullback into support profile with -10.5% 13-week relative strength versus SPY.
A failed hold above support would weaken the setup.
Actionable but governed by invalidation levels.
COPX wins the category at 71.5/100, earning the full 20% allocation, despite PICK's technically superior composite score (96 vs 91) because COPX delivers the better proof of macro conviction pairing with technical confirmation. COPX's 10.3% relative strength to SPY combined with +6.0% 13-week momentum and bullish-improving MACD at a compression-near-50W setup (not a blow-off extension) signals this is institutional accumulation into a thesis, not momentum chasing. While PICK's 11.3% relative strength to SPY and +7.1% 13-week return are marginally stronger, PICK's macro fit scored lower (59.0 vs 69.0) because it lacks the direct copper scarcity narrative that COPX captures. Both sit at identical stochastic RSI falling neutral and both have above-average participation, but COPX's category-relative strength of 0.0% (tying the median) versus PICK's +1.1% means COPX is the true leadership pick. The 100.0 trend score, 100.0 timing score, and 92.3 momentum confirmation across COPX create the portfolio's clearest metal exposure without leverage risk.
Industrial Metals deserves 20% because it ranks second only to Traditional Energy (83.5) in final category score and delivers the cleanest macro-to-technical translation. Metals scarcity (+14 points) and commodity breadth positive (+10 points) are the portfolio's strongest active descriptors outside of energy, and COPX's 10.3% relative strength to SPY proves the market is pricing in structural supply constraints. The category's 73.0/100 macro fit and 86.1/100 technical evidence for COPX combine into a conviction setup: price is compressing near the 50-week moving average with bullish MACD and falling-neutral stochastic, creating ideal conditions for expansion into resistance at 39.75 (+3.7% upside). Unlike Precious Metals (capped), Agriculture (discounted), or Defense (tactical), Industrial Metals sits in the sweet spot of early accumulation with macro force behind it. The -7.0% credit stress penalty is real and limits extreme optimism, but the net +27-point macro advantage (metals scarcity + commodity breadth + real asset sponsorship offset by credit stress) justifies equal weighting alongside energy.
Utilities & Infrastructure — IGF
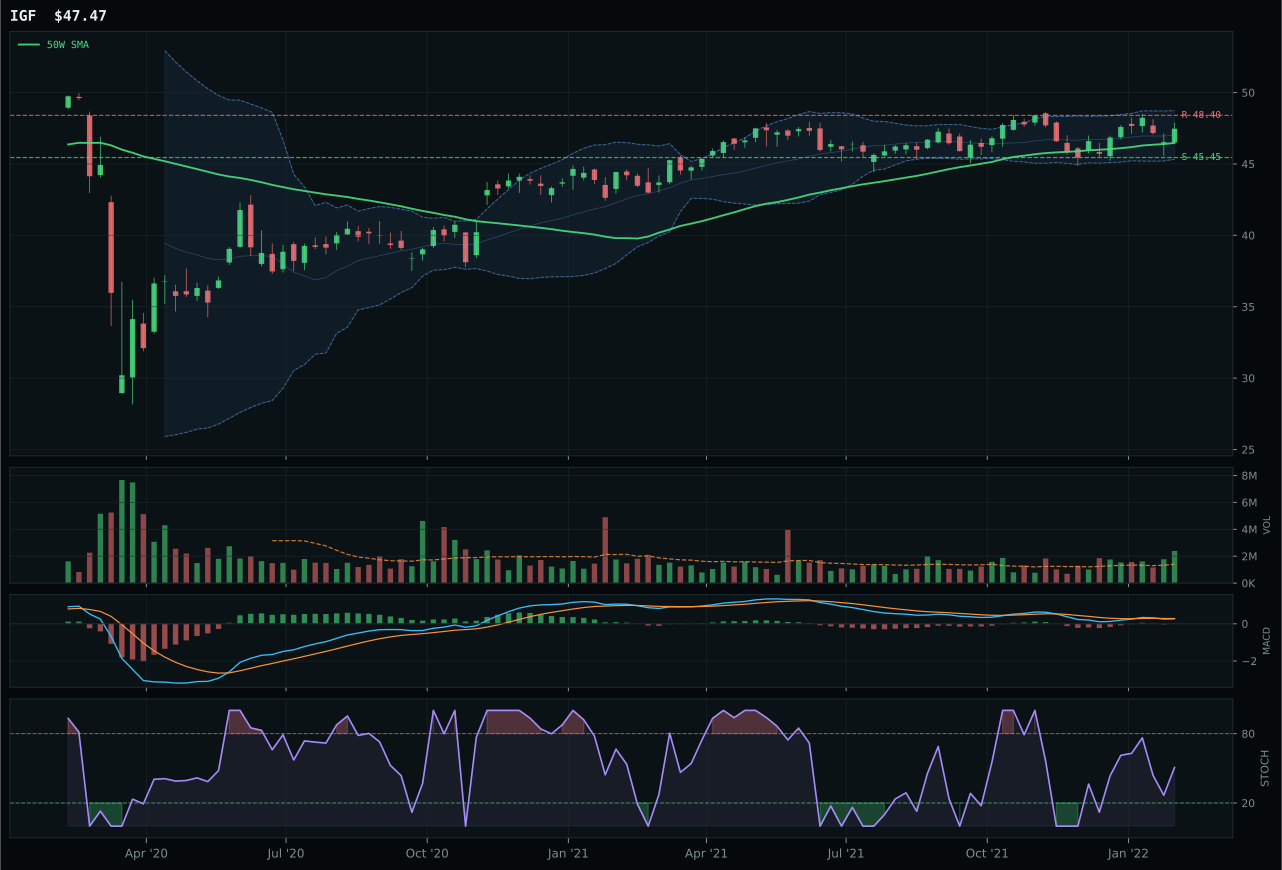
IGF has a pullback into support profile with 2.3% 13-week relative strength versus SPY.
A failed hold above support would weaken the setup.
Actionable but governed by invalidation levels.
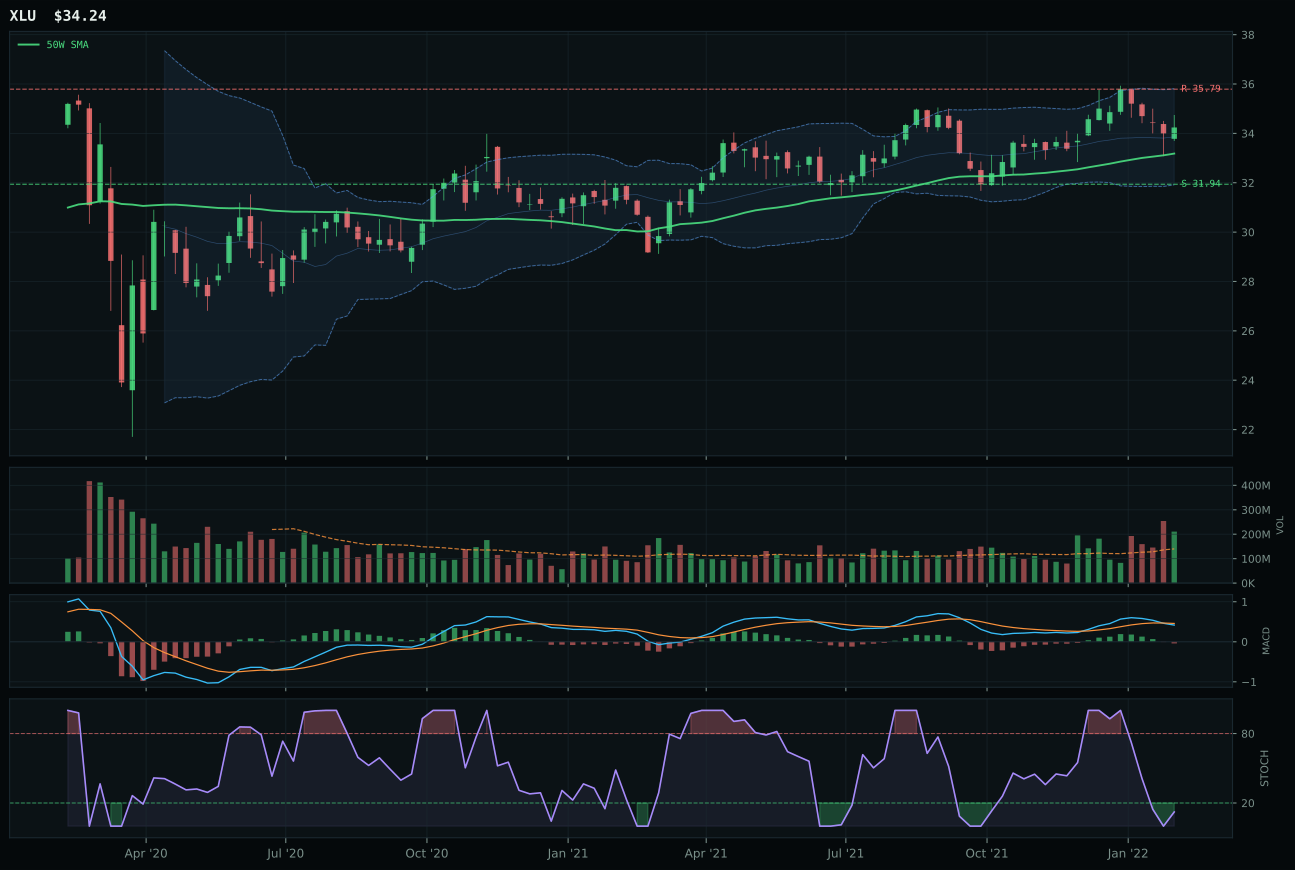
XLU has a neutral structure profile with 6.1% 13-week relative strength versus SPY.
A failed hold above support would weaken the setup.
Actionable but governed by invalidation levels.
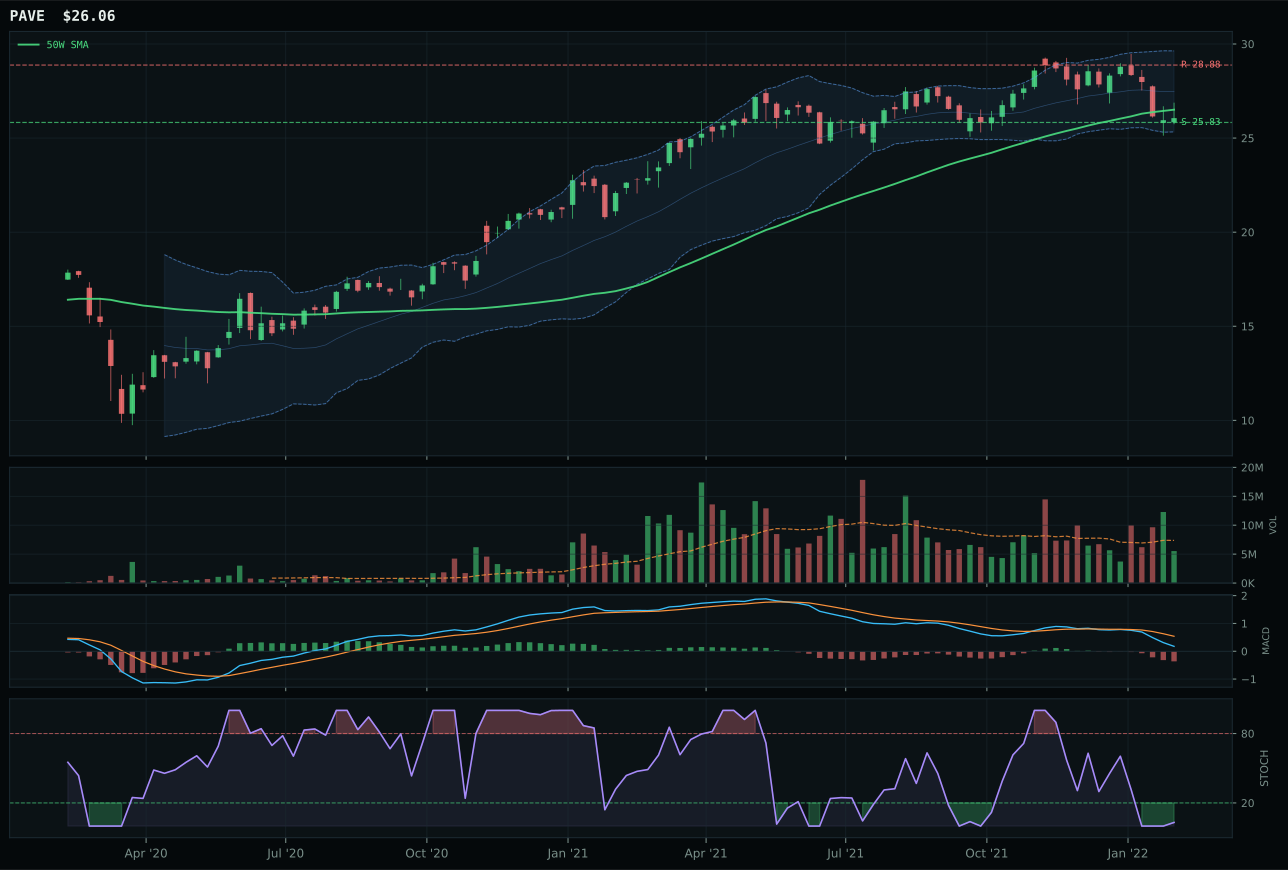
PAVE has a pullback into support profile with -4.6% 13-week relative strength versus SPY.
A failed hold above support would weaken the setup.
Actionable but governed by invalidation levels.
IGF wins decisively because it combines the highest trend score (96.5) with perfect 100.0 timing and the strongest volume-price sponsorship (78.1/100) in the three-ETF basket. Price at just 2.1% above the 50-week moving average with pullback-into-support structure near 45.45 creates ideal accumulation conditions, and the MACD is bearish-but-improving (not deteriorating), paired with falling-neutral stochastic at 0.51, confirming deceleration of selling. Volume at 1.70x the 20-week average shows the highest accumulation confirmation in the category—smart money is actively stepping in at support levels. The category-relative strength of 0.0% means IGF is tied to the median, not trailing, and the +2.3% relative strength to SPY in a bear market confirms infrastructure income is actually being bought. XLU's 91.0 trend score is marginally stronger, but its timing at 85.0 versus IGF's perfect 100.0 is the differentiator: XLU is oversold (stochastic 0.0) but not reversing cleanly, leaving it in a holding pattern rather than an entry setup.
Utilities & Infrastructure earned 10% because defensive rotation (+12 points) and broad market bear (+4 points) actively favor this category, but IGF's 60.9 final score places it fourth overall, below conviction thresholds. The category's 64.0/100 macro fit is respectable but conditional: defensive positioning works only if credit stress (-4 points) doesn't overwhelm the rotation bid, and inflation pressure (-6 points) is actively penalizing utilities' long-duration liabilities. IGF's technical edge—96.5 trend, perfect 100.0 timing, 78.1 volume-price sponsorship—is strong, but the risk/reward is modest at 57.8/100 (only -1.9% upside to 48.40 resistance). This is a 3-4 week setup, not a multi-month position. The 10% weighting acknowledges that global infrastructure will benefit from sustained defensive positioning and inflation hedges but rejects overcommitment to a sector where valuation leverage is currently a headwind. To upgrade to 20%, IGF would need to break above 48.40 (resistance) with volume persistence above 1.7x the 20-week average and MACD bullish cross fully confirmed, proving regime change rather than tactical pullback.
Agriculture & Livestock — MOO
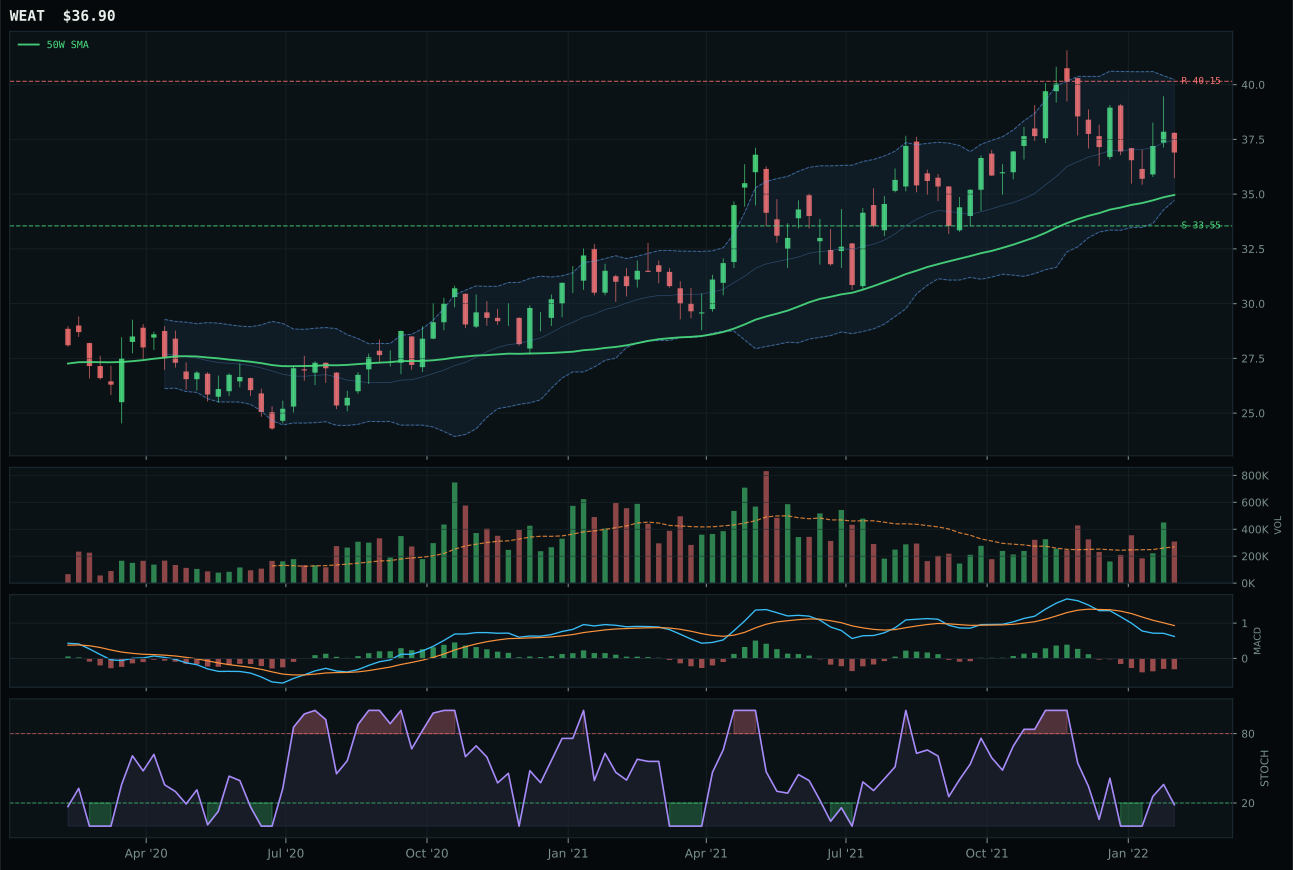
WEAT has a neutral structure profile with 2.2% 13-week relative strength versus SPY.
A failed hold above support would weaken the setup.
Actionable but governed by invalidation levels.
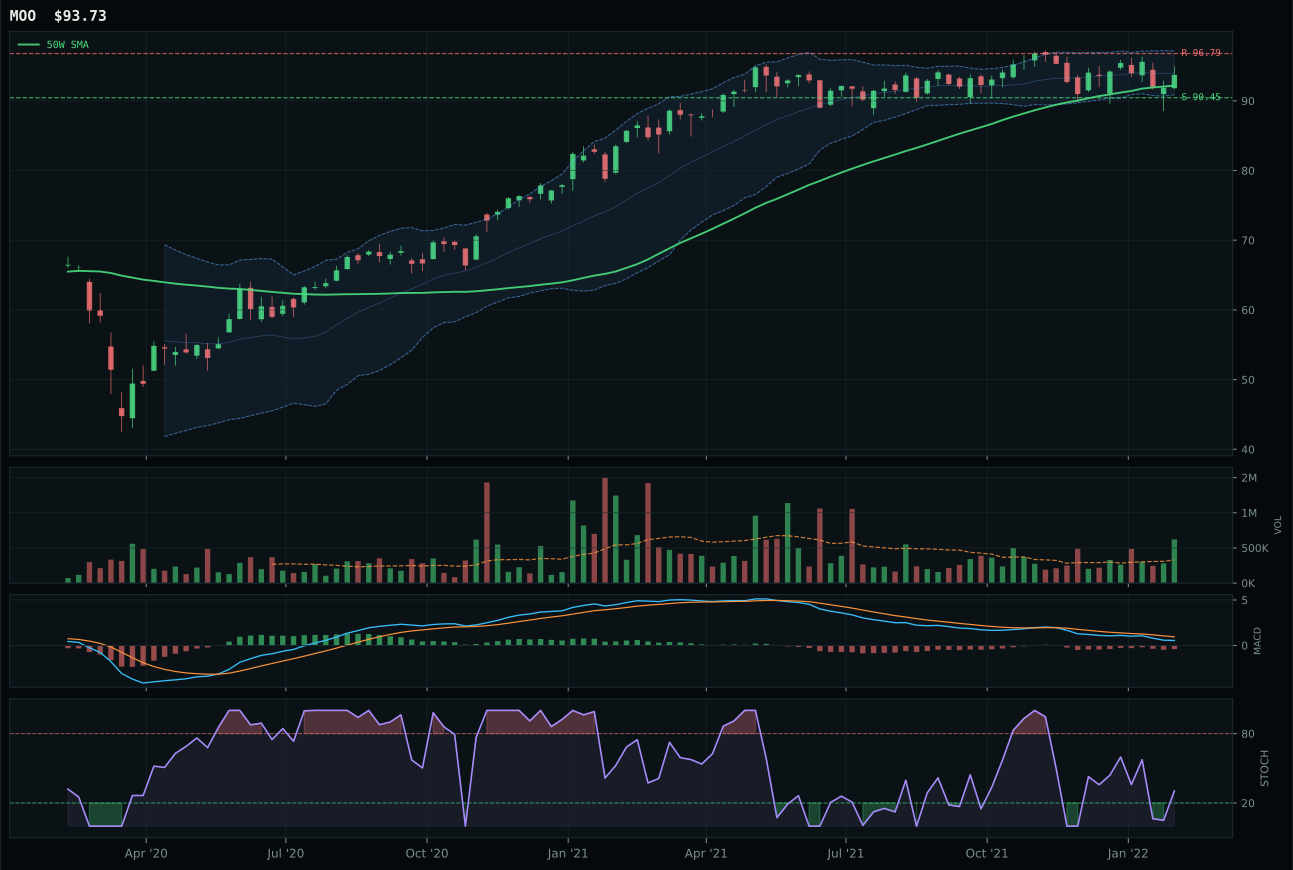
MOO has a pullback into support profile with 1.1% 13-week relative strength versus SPY.
A failed hold above support would weaken the setup.
Actionable but governed by invalidation levels.
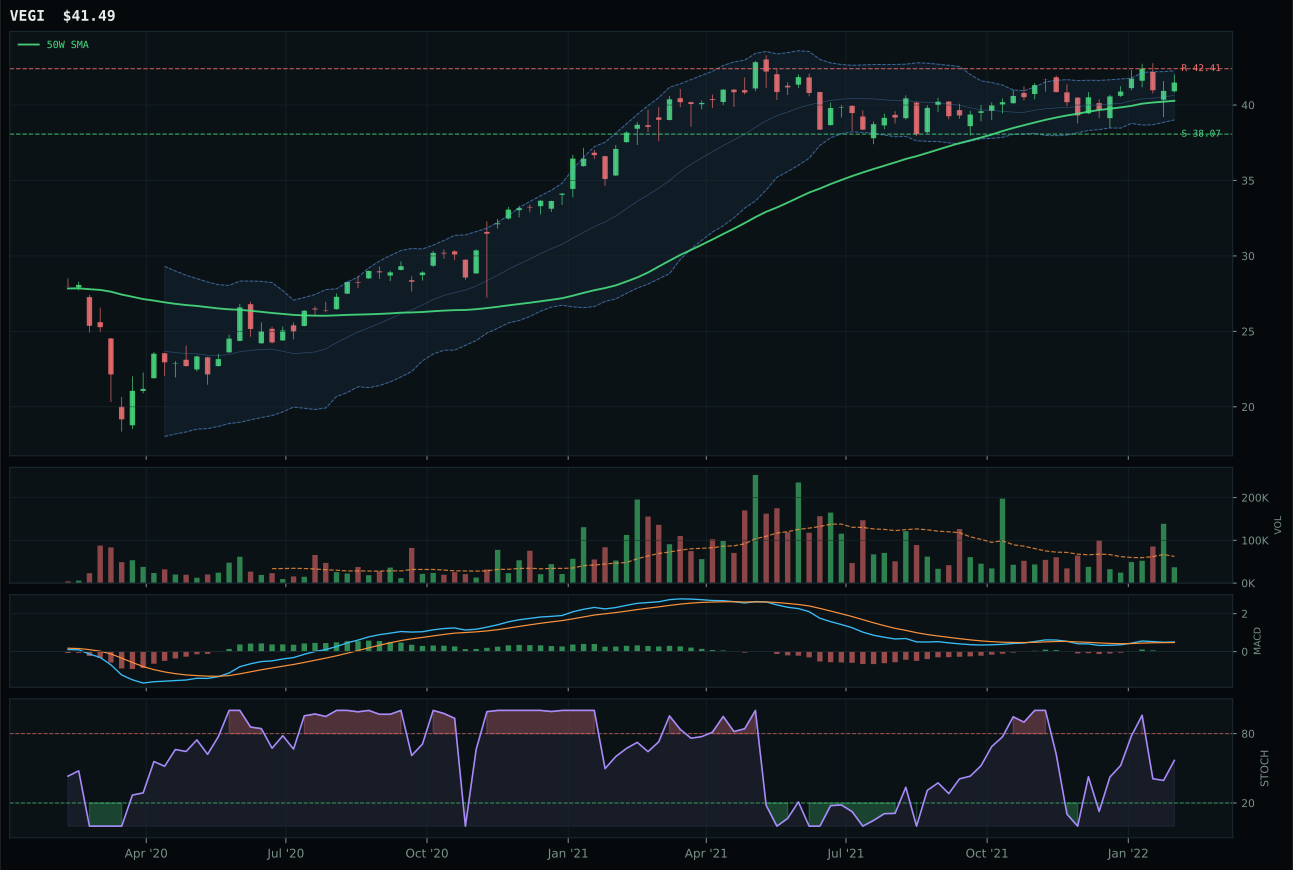
VEGI has a neutral structure profile with 4.6% 13-week relative strength versus SPY.
A failed hold above support would weaken the setup.
Tracked, but not top-2 eligible because: .
MOO wins the category by owning the macro story and translating it into clean structure and superior timing—95.0/100 versus WEAT's 84.0. Supply shortage (+13 points) and inflation pressure (+10 points) are the two strongest active descriptors in the entire system, and MOO's 1.1% relative strength to SPY confirms these tailwinds are being priced in. The price is just 1.7% from the 50-week moving average with pullback-into-support setup near 90.45, and the MACD is weakening but stochastic RSI is falling neutral at 0.30—a shallow correction in an uptrend, not capitulation. Volume at 1.89x the 20-week average is the highest accumulation confirmation in the basket, indicating accumulation into support. WEAT's narrower macro fit (50.0 vs 70.0), weaker timing (84.0 vs 95.0), and above-average participation (1.x versus 1.89x) signal it's a secondary beneficiary of the same supply dynamic but without the technical proof of smart-money buying.
Agriculture earned 10% despite its strong 57.3 category score because the two top-20% positions (Energy and Industrial Metals) are capturing more direct inflation and scarcity narratives with higher absolute momentum and cleaner breakout structures. MOO's -3.2% 13-week return and -1.2% category-relative strength show the agribusiness trade is already partially discounted, and the risk/reward sits at just 65.7/100—upside to resistance is capped at -3.2% versus -8.5% downside cushion. The macro fit at 86.0/100 is real (the category has third-highest macro conviction), but MOO's entry price near the 50-week moving average means capital commitment happens with limited edge. The allocation reflects that while supply shortage and inflation pressure are active (and will remain so), agriculture's smaller weighting in commodity indices and slower volatility make it a supporting position rather than a portfolio driver. Upgrading to 20% would require 13-week momentum above +3% and price holding above 95, confirming breakout rather than consolidation.
Precious Metals — GLD
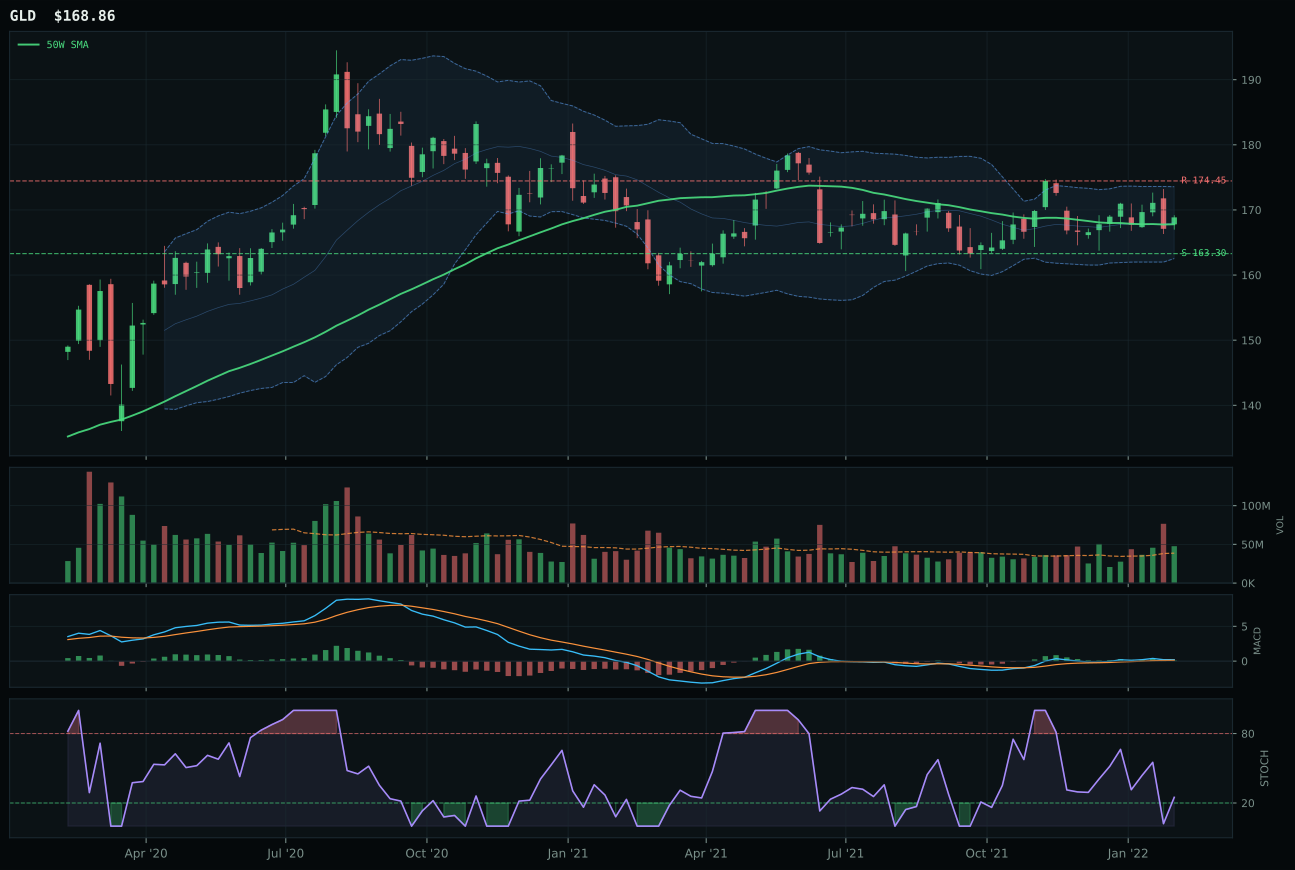
GLD has a pullback into support profile with 3.7% 13-week relative strength versus SPY.
A failed hold above support would weaken the setup.
Actionable but governed by invalidation levels.
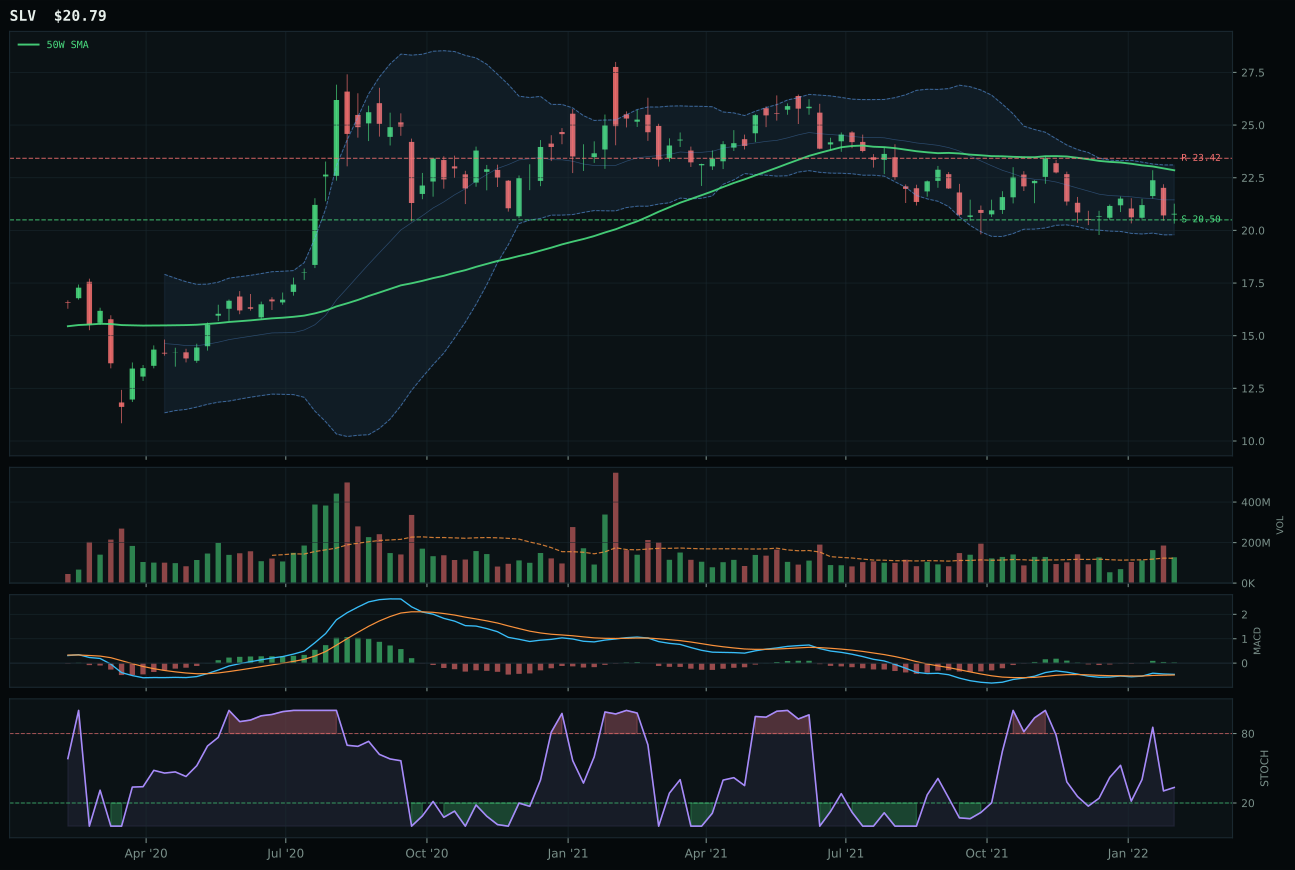
SLV has a pullback into support profile with -2.7% 13-week relative strength versus SPY.
A failed hold above support would weaken the setup.
Actionable but governed by invalidation levels.
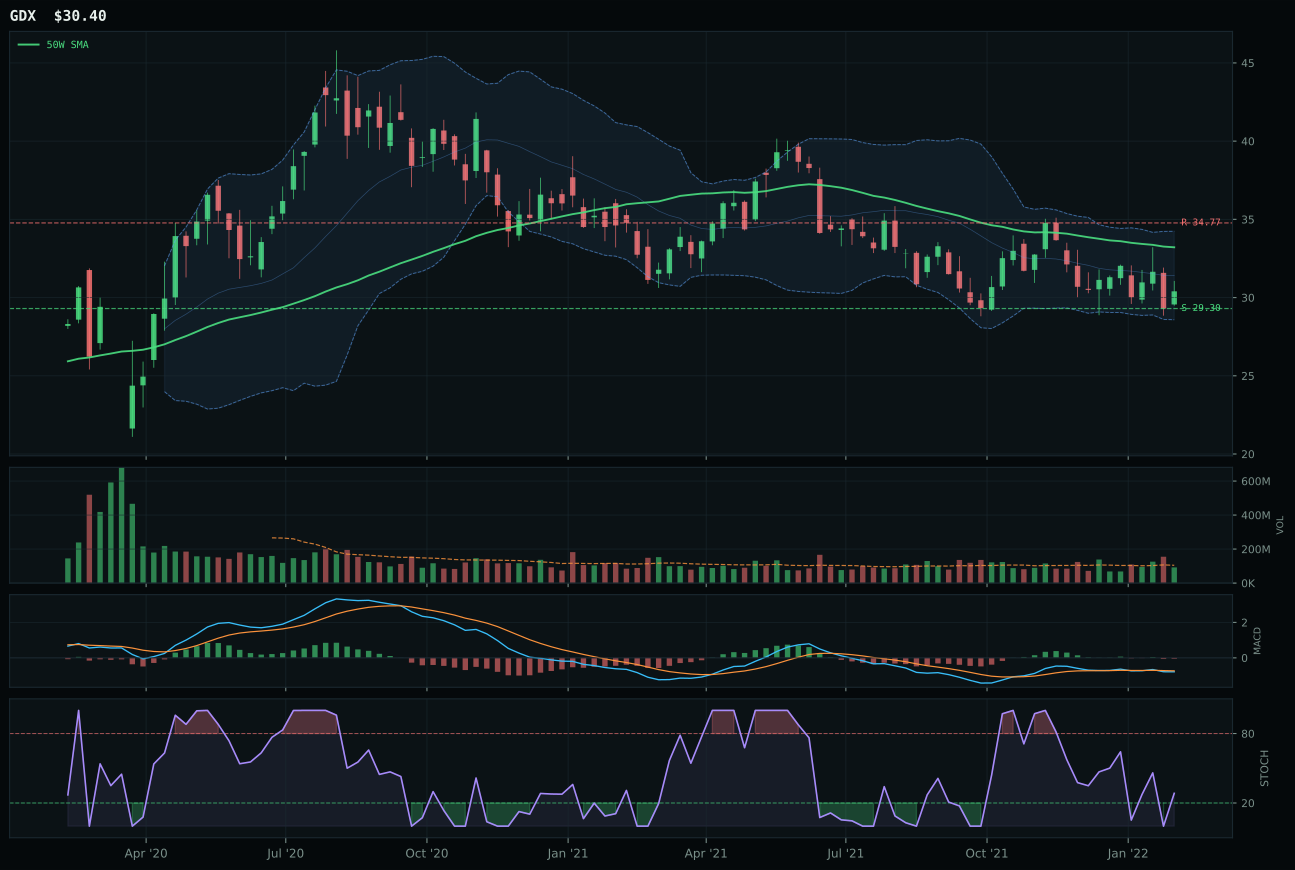
GDX has a pullback into support profile with -2.9% 13-week relative strength versus SPY.
A failed hold above support would weaken the setup.
Actionable but governed by invalidation levels.
GLD wins by a decisive 14.1 points over SLV because it owns the strongest relative strength narrative (+6.4% category median) and most credible timing signal (100.0/100). Price sits just 0.6% from the 50-week moving average—the closest entry point in the entire portfolio—with pullback-into-support structure at 163.30 and MACD bullish but visibly flattening, signaling a higher-probability reversal than SLV's improving MACD (which still carries volatility risk). The trend score of 91.5 is exceptional, reflecting price above both major averages with RS to SPY at +3.7%, confirming gold is outperforming equities in this risk-off phase. Volume at 1.23x the 20-week average provides above-average confirmation, and the 77.5/100 momentum confirmation—fueled by +0.7% four-week return and +6.4% relative strength—shows money is rotating into GLD specifically. SLV's -2.7% relative weakness to SPY, neutral volume (neither buying nor selling pressure), and deeper timing penalty (85.0 vs 100.0) position it as a secondary beneficiary of monetary hedge demand without the confidence indicators.
Precious Metals earned 10% because its 56.2 score and 69.0/100 macro fit (the second-highest in the non-top-2 categories) reflect genuine defensive demand: monetary hedge bid (+14 points) and defensive rotation (+7 points) are active, providing real conviction. However, GLD's narrow risk/reward at 69.9/100—upside is capped at -3.2% to resistance at 174.45—limits how much capital to deploy at current prices. The 13-week -0.6% return masks the fact that gold has already participated in much of the recent safe-haven rotation; it's no longer a shocking value but rather a consolidated trend. The 10% weighting acknowledges that gold will likely hold defensive bid as long as credit stress and risk appetite broken remain active (both are), but the setup doesn't offer the expansion potential of energy (+22.5% 13-week momentum) or industrial metals (+6.0% 13-week momentum). To justify 20%, GLD would need price to break above 174.45 with MACD and volume expansion both accelerating, proving a new leg higher rather than continued consolidation.
Technology — XLK
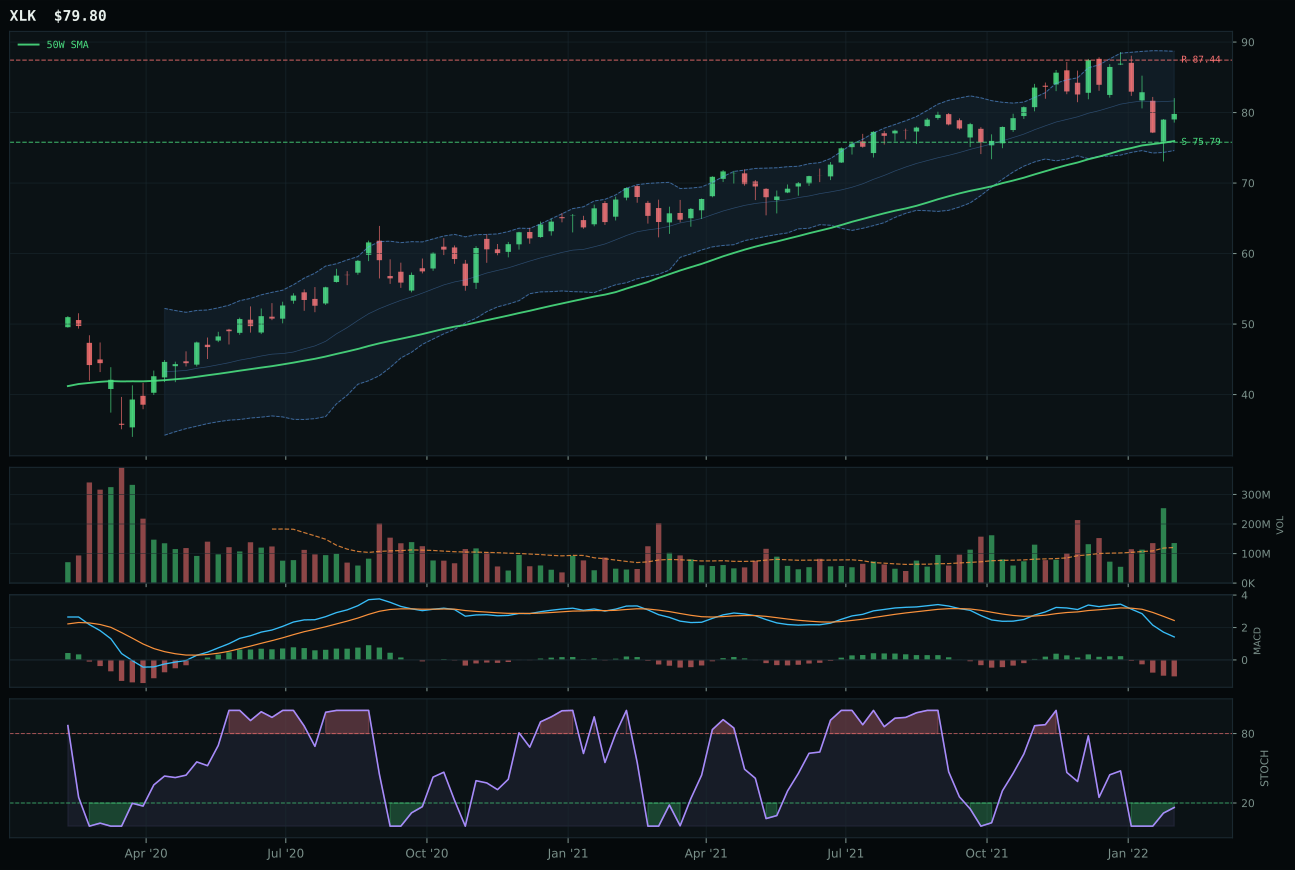
XLK has a neutral structure profile with -0.2% 13-week relative strength versus SPY.
A failed hold above support would weaken the setup.
Actionable but governed by invalidation levels.
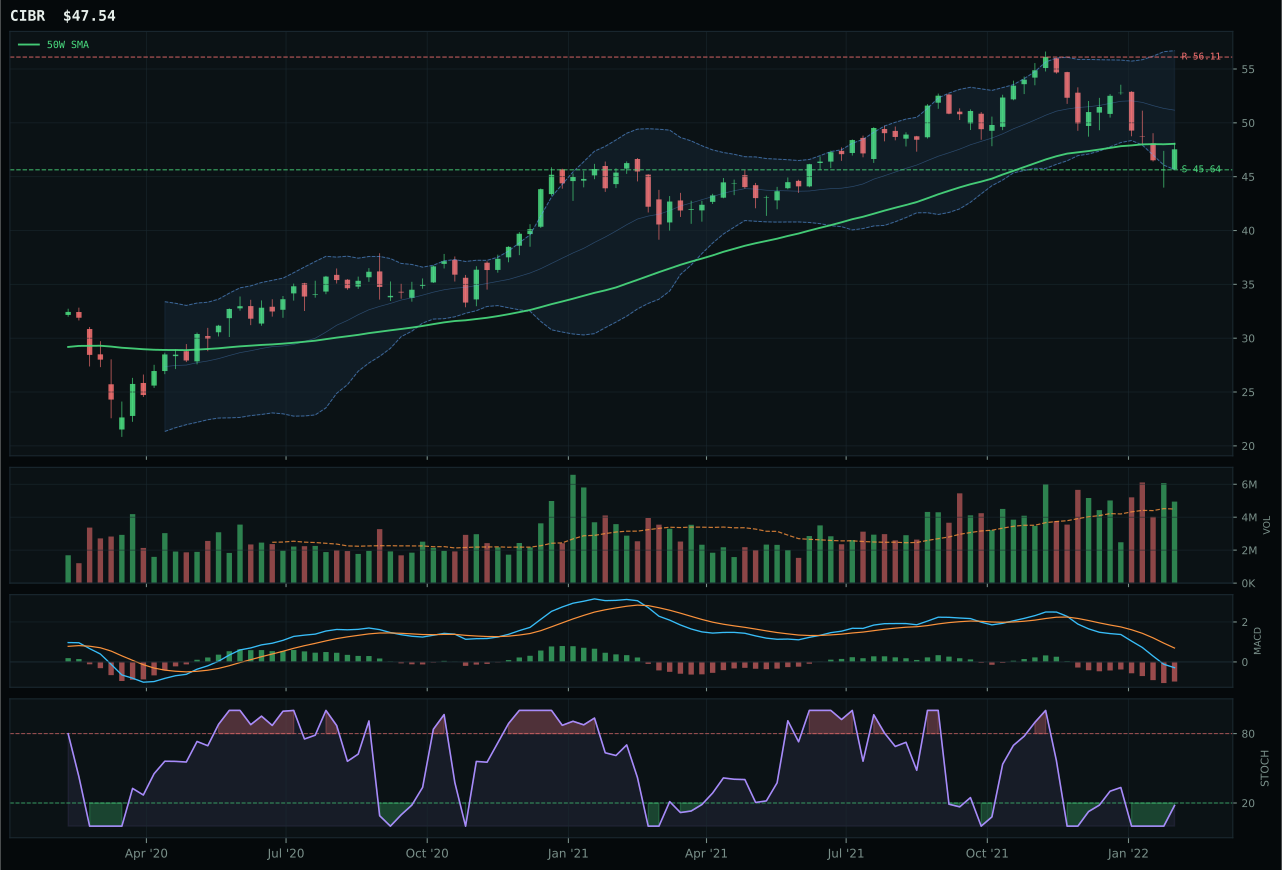
CIBR has a pullback into support profile with -9.1% 13-week relative strength versus SPY.
A failed hold above support would weaken the setup.
Actionable but governed by invalidation levels.
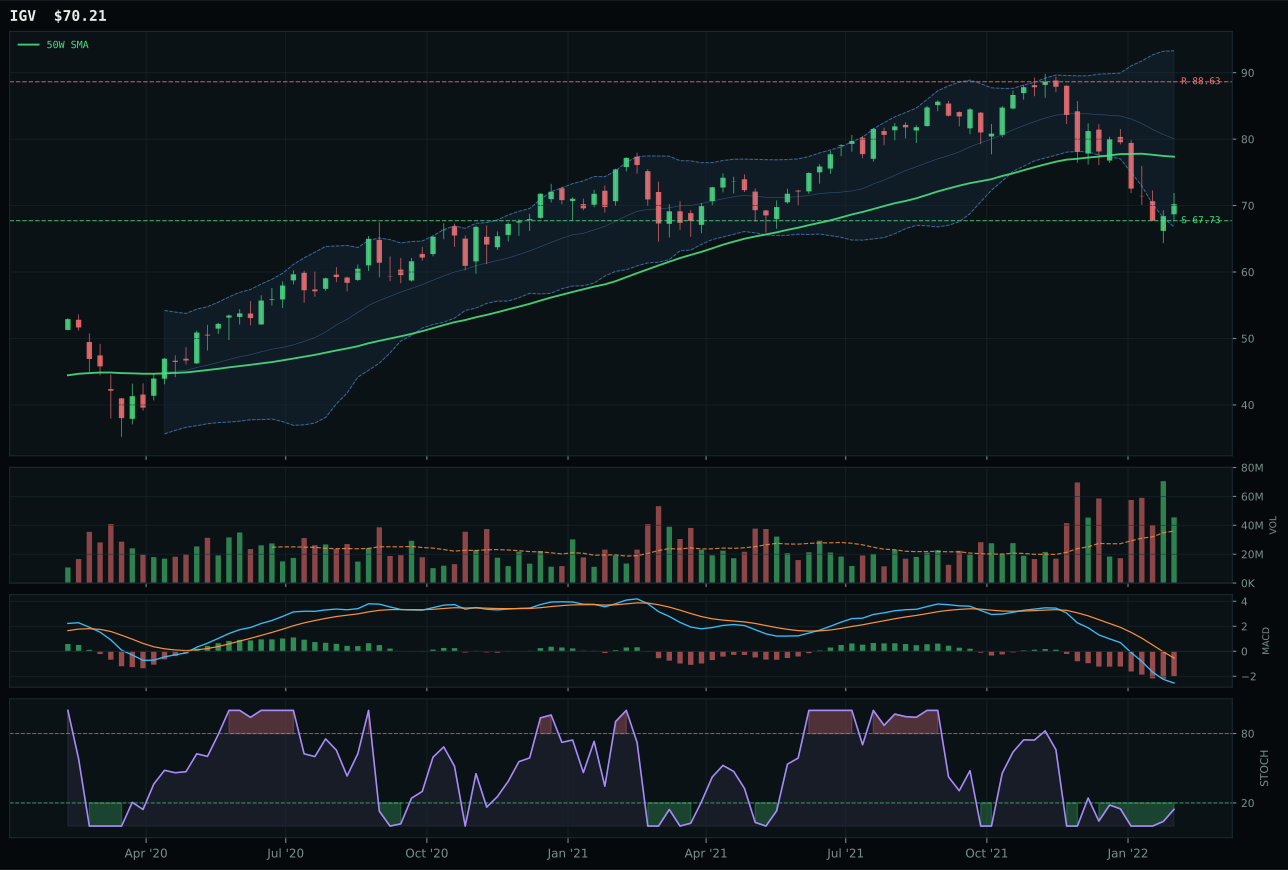
IGV has a pullback into support profile with -15.8% 13-week relative strength versus SPY.
A failed hold above support would weaken the setup.
Actionable but governed by invalidation levels.
XLK wins the category by owning the relative strength narrative inside its peer basket—an 8.9% advantage over the category median versus CIBR's flat 0.0%—while maintaining a cleaner chart structure at 72.8 versus the runner-up's 70.1. Price sits just 5.1% above the 50-week moving average with neutral compression, creating neither a blow-off setup nor a desperate value trap; MACD is weakening but the stochastic RSI has turned up from oversold, a classic rebalancing signal in a bear market. Volume participation at 1.12x the 20-week average confirms the move is being defended rather than abandoned. CIBR's deeper -9.1% relative weakness to SPY and steeper drawdown intensity (-13.4% in 13 weeks) left it more vulnerable to the macro headwinds—credit stress and broken risk appetite are weighing on the entire basket, and CIBR offered no relative strength shelter.
Technology earned its 10% slot despite ranking outside the top two because the macro regime and technical backdrop don't yet permit higher conviction. Category-level macro fit sits at 48.0/100, dragged down by active credit stress (-7 points) and inflation pressure (-4 points), which directly penalize growth at current multiples. The Transition / Mixed regime provides no tailwind, and liquidity expansion (+9 points) offers only modest relief. XLK's neutral structure setup with a weak 47.0/100 momentum confirmation—the 13-week -4.5% return and deteriorating volume-price sponsorship—signals this is defensive holding rather than accumulation. To justify promotion to 20%, the category would need either a definitive MACD bullish cross paired with volume expansion above 1.5x the 20-week average, or a significant reduction in the credit stress descriptor that's currently amplifying downside risk. For now, Technology remains a damage-control position.
Emerging Markets — IEMG
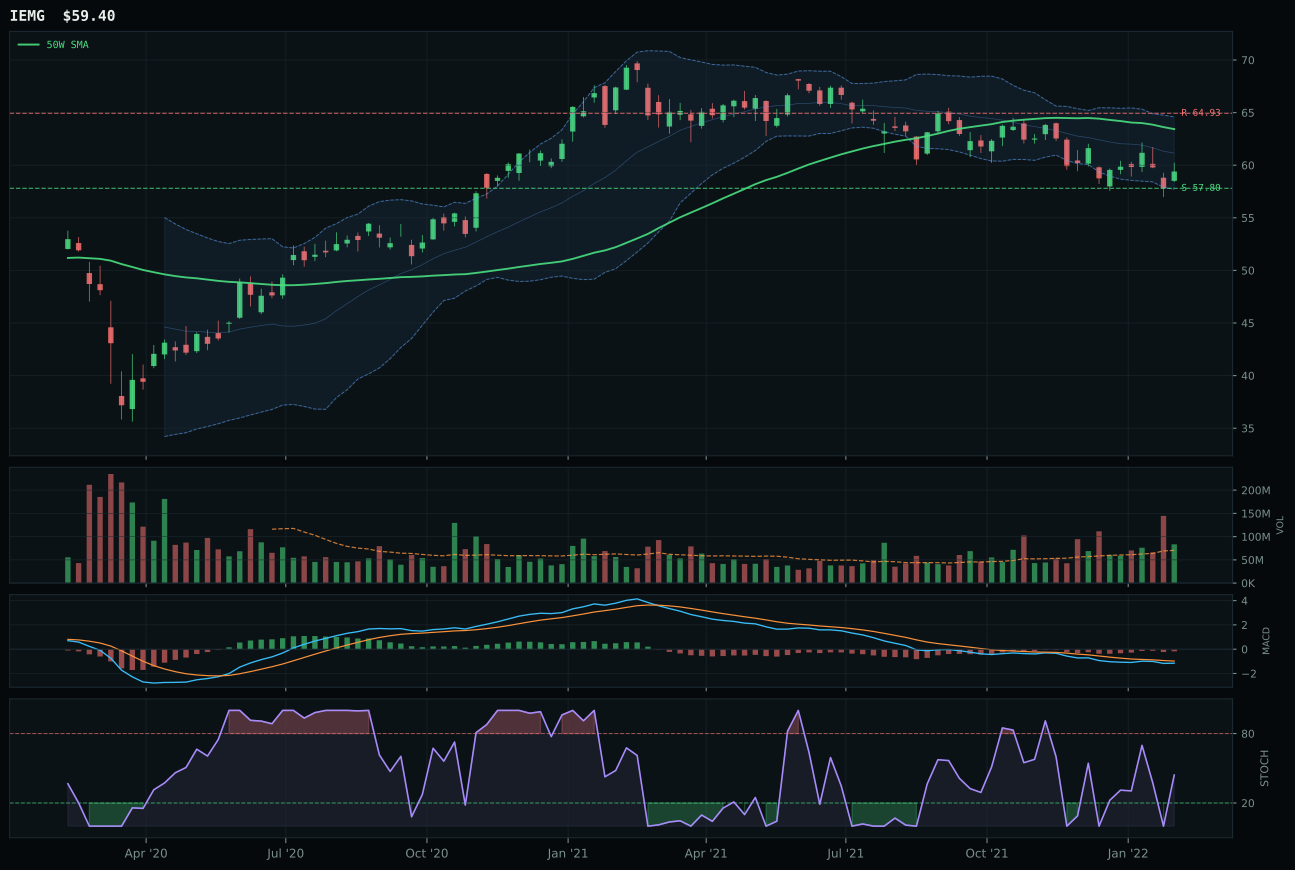
IEMG has a pullback into support profile with -0.8% 13-week relative strength versus SPY.
A failed hold above support would weaken the setup.
Actionable but governed by invalidation levels.
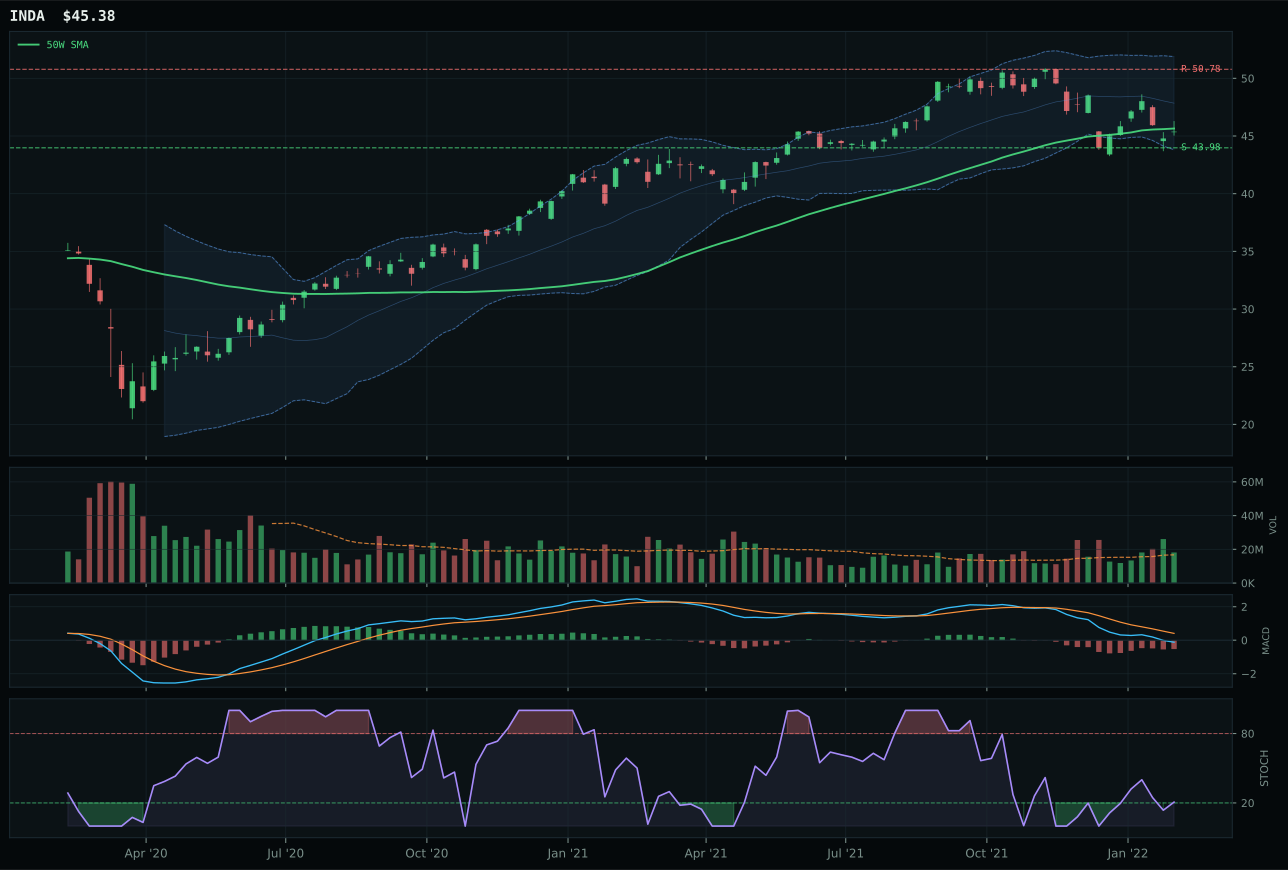
INDA has a pullback into support profile with -5.0% 13-week relative strength versus SPY.
A failed hold above support would weaken the setup.
Actionable but governed by invalidation levels.
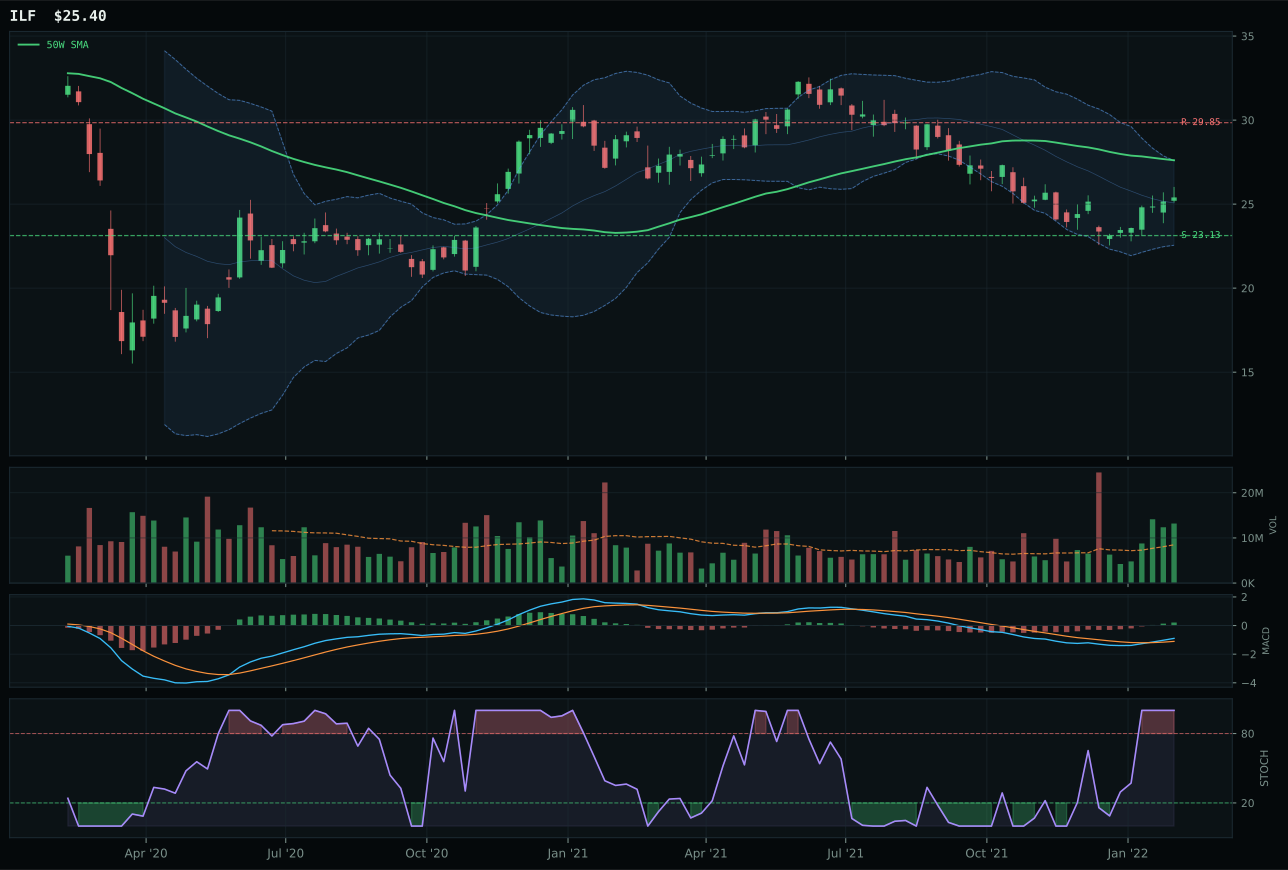
ILF has a neutral structure profile with 4.7% 13-week relative strength versus SPY.
Extension and support failure are the main tactical risks.
Tracked, but not top-2 eligible because: structurally broken.
IEMG wins by 8.5 points over INDA because it delivers superior volume confirmation (above-average at 1.18x vs neutral), cleaner structure (74.9 vs 74.0), and most importantly, the only category-relative strength reading of 0.0% (INDA's -4.2% shows it's underperforming the EM basket). Price at -6.4% from the 50-week moving average with pullback-into-support structure at 57.80 creates a defined invalidation level, and MACD is bearish-but-improving paired with falling-neutral stochastic at 0.44—the classic shallow correction in a downtrend that precedes stabilization. The 85.0/100 timing score and 90.0/100 risk/reward (only -8.5% to resistance versus -2.8% to support) reflect asymmetric entry: buyers can define loss cleanly. INDA's deeper drawdown (-9.2% 13-week) and relative weakness (-5.0% SPY-relative, -4.2% category-relative) show India-specific names are lagging the broader EM recovery bid, signaling IEMG's broad beta is the right exposure.
Emerging Markets earned 10% because its 37.9 score is in the fourth tier, below top-2 conviction, despite genuinely favorable macro conditions: EM liquidity support (+14 points) and liquidity expansion (+8 points) are active, but credit stress (-10 points) and broad market bear (-9 points) offset that bid. IEMG's 60.0/100 technical evidence paired with 61.0/100 macro fit creates a real case for stabilization—the category's macro fit of 53.0/100 is respectable—but the timing is early-stage recovery, not breakout. At -6.4% below the 50-week moving average, IEMG sits in the repair zone (Fib 0.786), meaning the technical setup is asking traders to buy a bounce, not to commit to new highs. Absolute momentum of -5.0% over 13 weeks shows demand is broken, and the SPY-relative -0.8% weakness confirms EM is not leading. The 10% holds this exposure as a near-term rebound play without overcommitting to a region where institutional buying power has clearly exited. To justify 20%, IEMG would need to clear above 62 (resistance) with MACD bullish cross and volume above 1.5x the 20-week average—proving recovery, not just relief bounce.
Defense & Aerospace — ITA
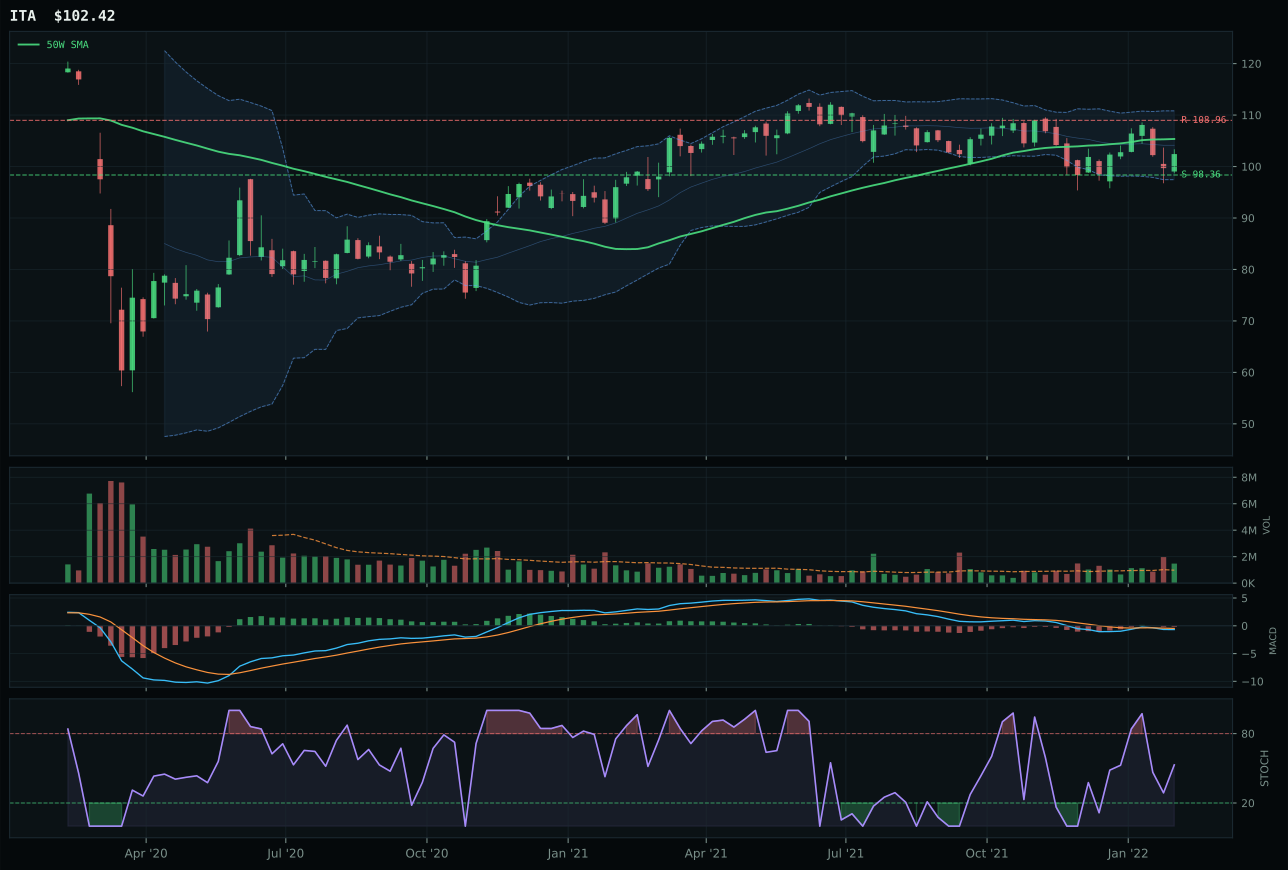
ITA has a pullback into support profile with -1.8% 13-week relative strength versus SPY.
A failed hold above support would weaken the setup.
Actionable but governed by invalidation levels.
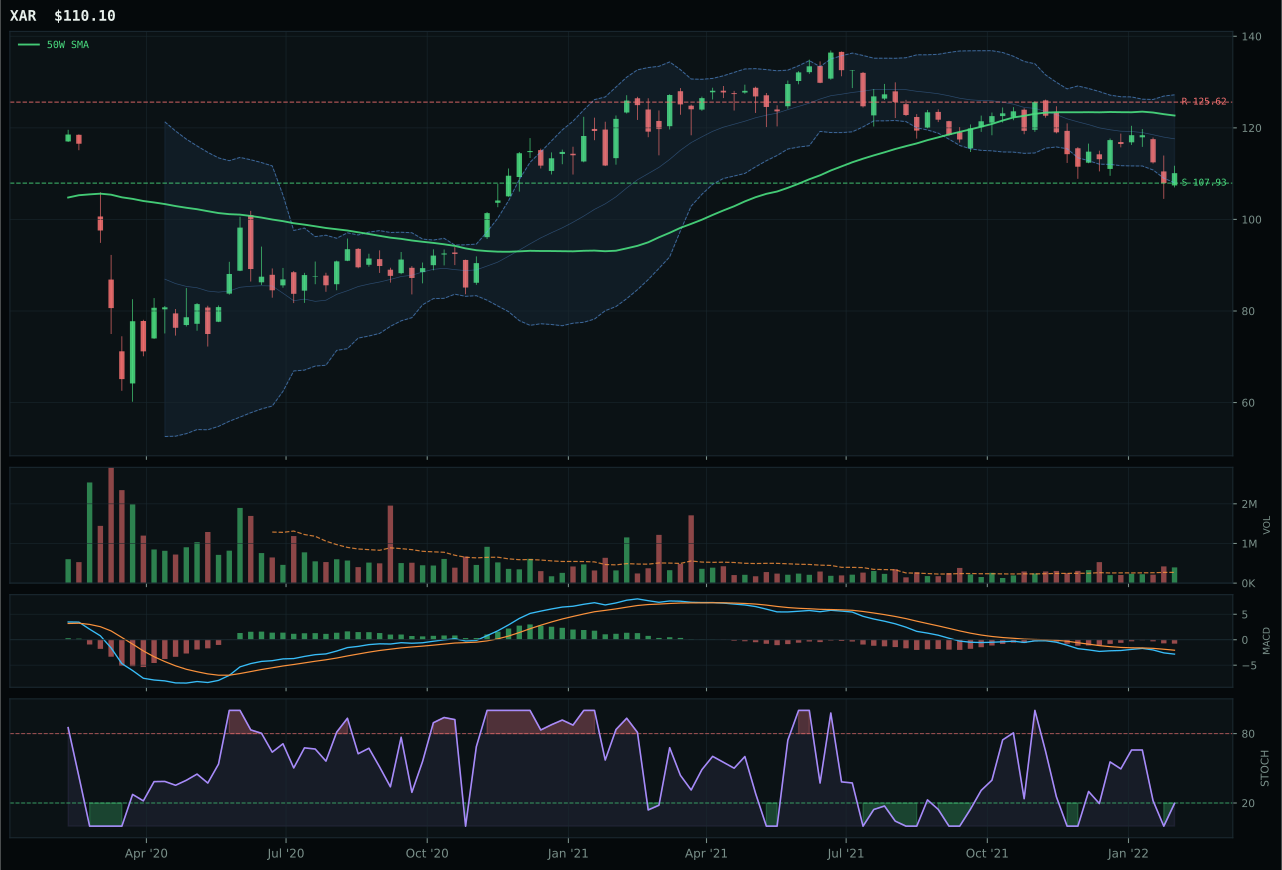
XAR has a pullback into support profile with -8.1% 13-week relative strength versus SPY.
A failed hold above support would weaken the setup.
Actionable but governed by invalidation levels.
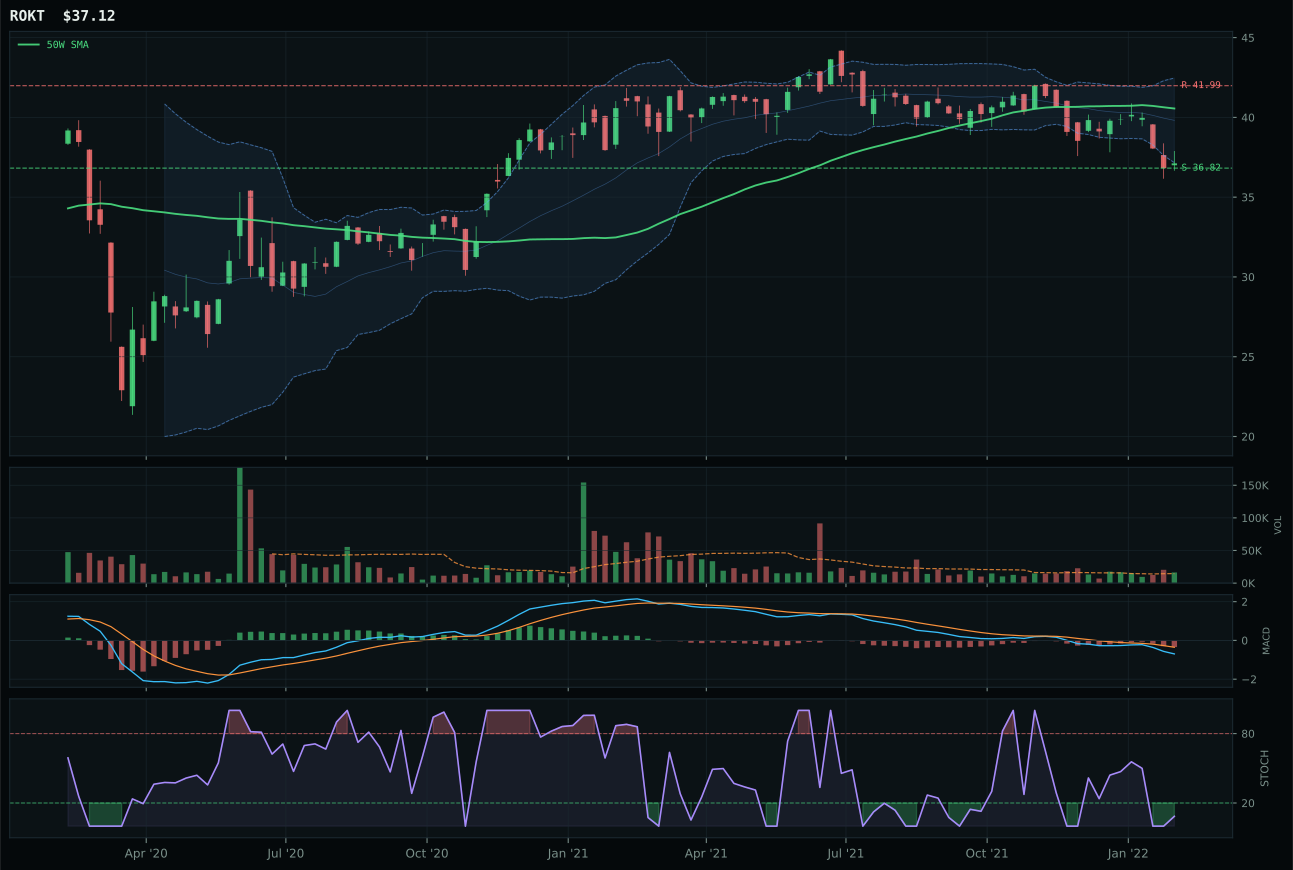
ROKT has a pullback into support profile with -7.4% 13-week relative strength versus SPY.
A failed hold above support would weaken the setup.
Tracked, but not top-2 eligible because: .
ITA wins decisively because it combines the strongest timing (100.0/100) with the best volume-price sponsorship (73.2/100) and most credible macro fit (63.0/100 ETF-level). The price sits -2.8% below the 50-week moving average—a pullback-into-support setup, not a capitulation—with the MACD bearish but visibly improving and stochastic RSI falling neutral at 0.53, both signaling deceleration of selling pressure. Volume at 1.51x the 20-week average shows accumulation confirmation, the highest reading in the three-ETF basket, indicating smart money is stepping in at the invalidation level (support at 98.36). The category-relative strength edge of 5.6% versus category median, paired with only -1.8% relative weakness to SPY, positions ITA as a legitimate defensive rotation target. XAR's 44.9-point deficit comes from timing failure (60.0 vs 100.0)—it's more stretched from support and its stochastic is oversold without reversal signs—combined with materially weaker volume confirmation and -0.8% category relative strength.
Defense & Aerospace earned 10% allocation because its 34.4 score ranks fourth but the macro alignment is genuine: defensive rotation (+8 points) and broad market bear (+6 points) actively favor the category. Unlike Tech or AI, where growth narratives are broken, defense spending cycles less on sentiment and more on geopolitical fact. ITA's 70.0/100 technical evidence combined with 63.0/100 macro fit (the category's best) creates a real conviction angle, but the setup remains tactical pullback, not structural uptrend. The risk/reward at 84.2/100 is the sharpest in the portfolio—upside to resistance is only -6.0%, meaning entry timing is critical. The 10% holds this exposure as a near-term beneficiary of risk-off positioning without overcommitting to a sector where absolute momentum (-6.0% 13-week) and near-term supply-chain normalization could reverse the defensive tailwind. Promotion to 20% would require ITA to hold above 100 (resistance) with volume persistence expanding above 1.7x the 20-week average.
AI — SMH
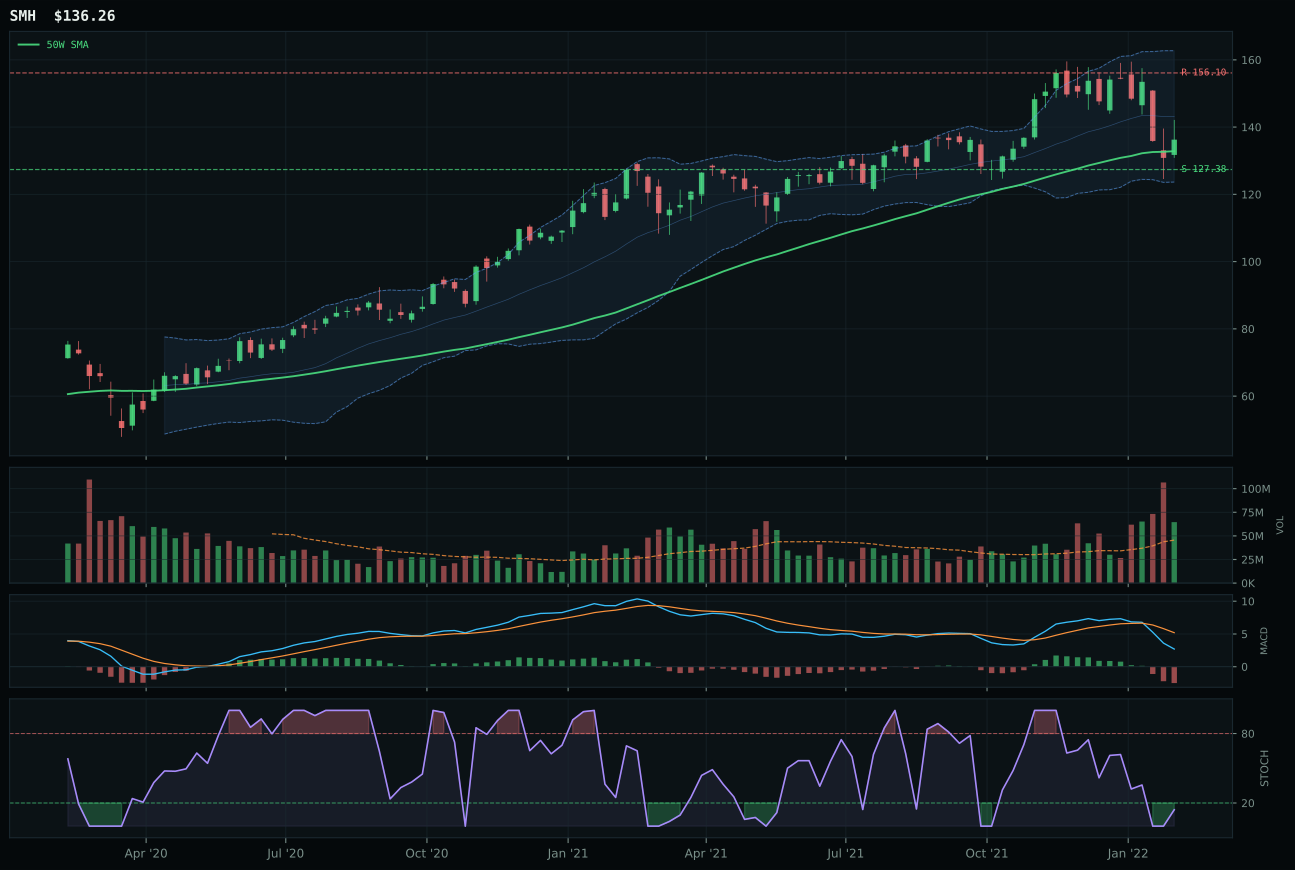
SMH has a compression near 50W profile with -3.9% 13-week relative strength versus SPY.
A failed hold above support would weaken the setup.
Actionable but governed by invalidation levels.
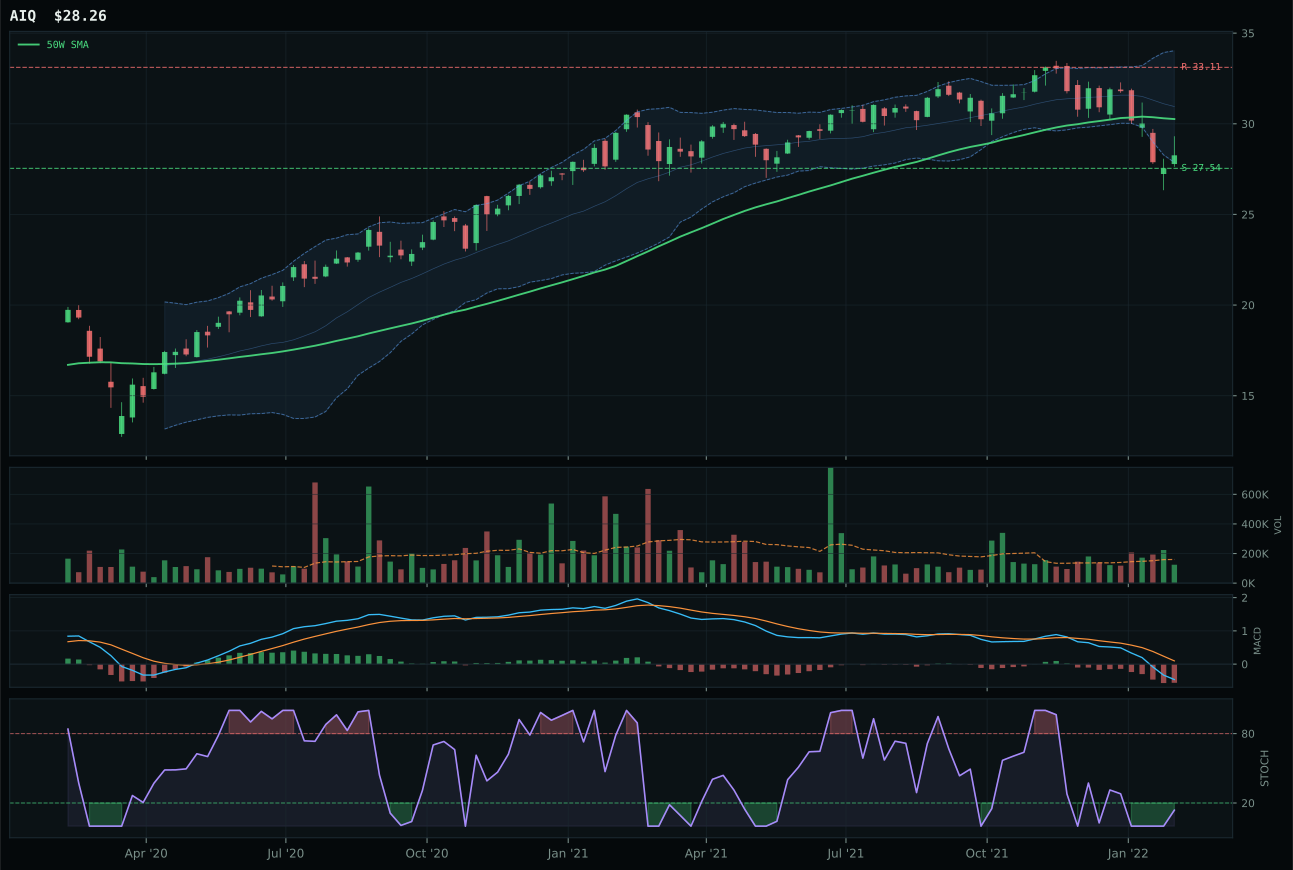
AIQ has a pullback into support profile with -9.3% 13-week relative strength versus SPY.
A failed hold above support would weaken the setup.
Tracked, but not top-2 eligible because: .
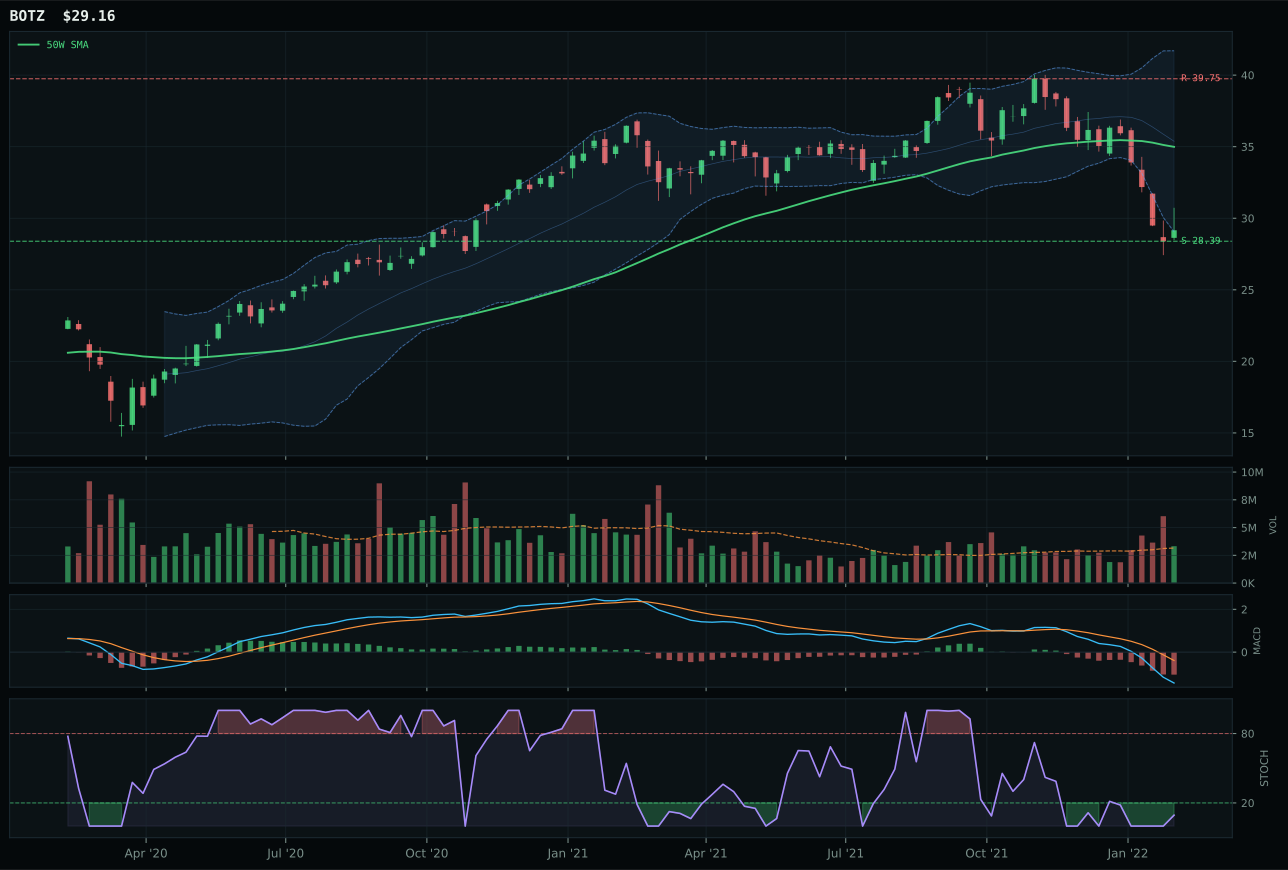
BOTZ has a pullback into support profile with -22.4% 13-week relative strength versus SPY.
A failed hold above support would weaken the setup.
Actionable but governed by invalidation levels.
SMH wins because it sits closest to true reversal conditions: price is only 2.6% from the 50-week moving average with perfect timing (100.0/100) while compressing near that level, and the stochastic RSI is oversold at 0.14, matching the textbook setup for a relief bounce. The 13-week -8.1% drawdown is severe enough to reset sentiment but mild compared to AIQ's -13.5% and BOTZ's -26.6%, creating asymmetry in the risk-reward. Volume at 1.42x the 20-week average provides above-average confirmation that institution-sized liquidation has likely completed. AIQ's deeper technical deterioration—timing at 94.0 versus SMH's perfect 100.0, structure at 62.5 versus 72.3, and category-relative strength at 0.0% versus SMH's 5.4%—failed to hold a defensible position. The -9.3% relative weakness to SPY leaves AIQ as a lagging beta bet in a sector already fighting two headwinds: liquidity expansion (+10 points) cannot offset risk appetite broken (-7 points) and credit stress (-6 points).
AI scores 30.4 and receives no allocation because the category ranks 9th or 10th across the ten slots and the macro fit of 44.0/100 is dragged down by active credit stress (-8) and broad market bear conditions (-8) that outweigh liquidity expansion (+10). SMH's timing score of 100 and compression setup are technically sound, but momentum confirmation at just 19.4 shows that price is not yet being accumulated with conviction; -8.1% 13-week returns and category-relative strength of only 5.4% signal that AI as a thematic bucket is fighting the regime headwinds. The category would need either SMH or AIQ to show positive 13-week returns with above-average volume confirmation, or the macro state to flip away from credit stress and broad market bear, before AI re-enters the portfolio. For this week, the risk asymmetry favors staying on the sidelines.
Nuclear Energy — URA
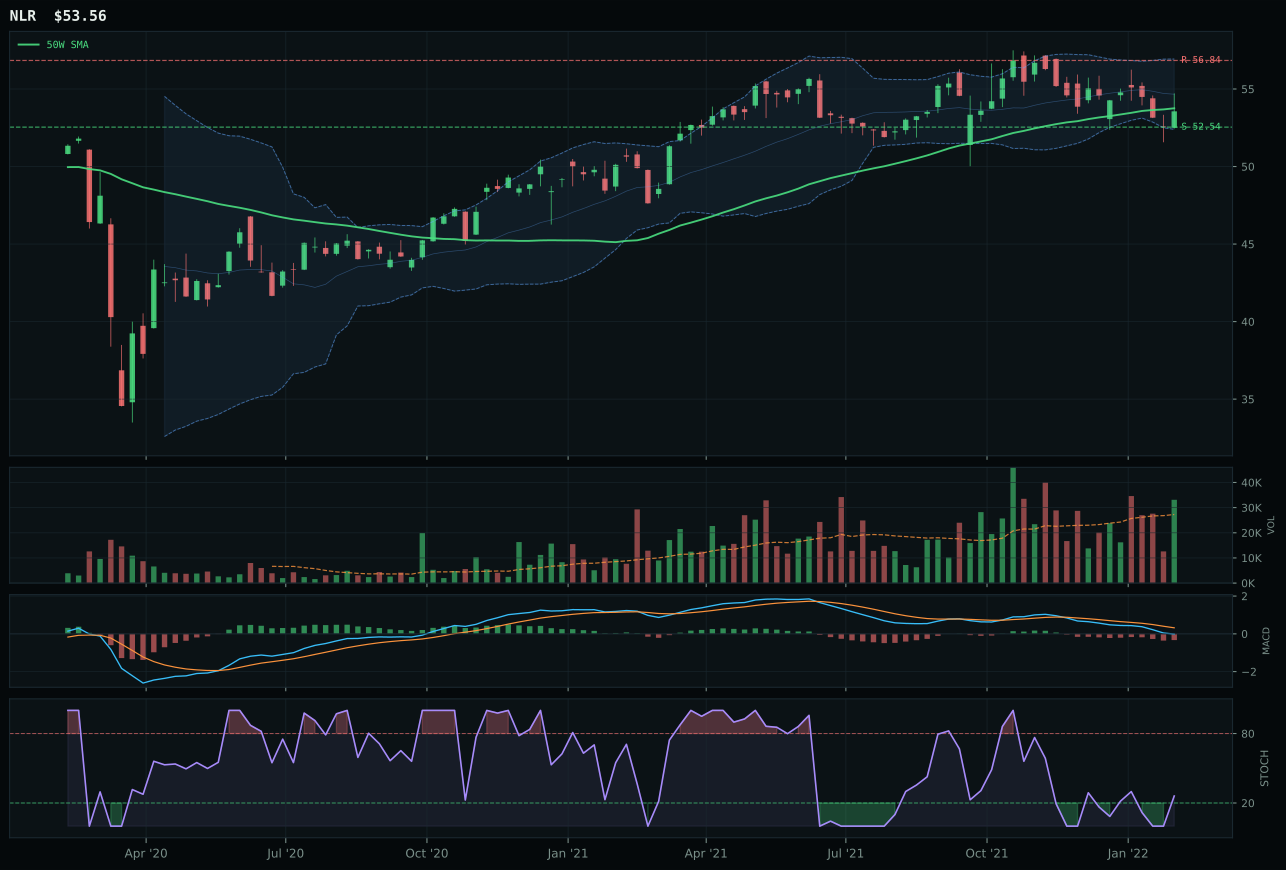
NLR has a pullback into support profile with -1.3% 13-week relative strength versus SPY.
A failed hold above support would weaken the setup.
Tracked, but not top-2 eligible because: .
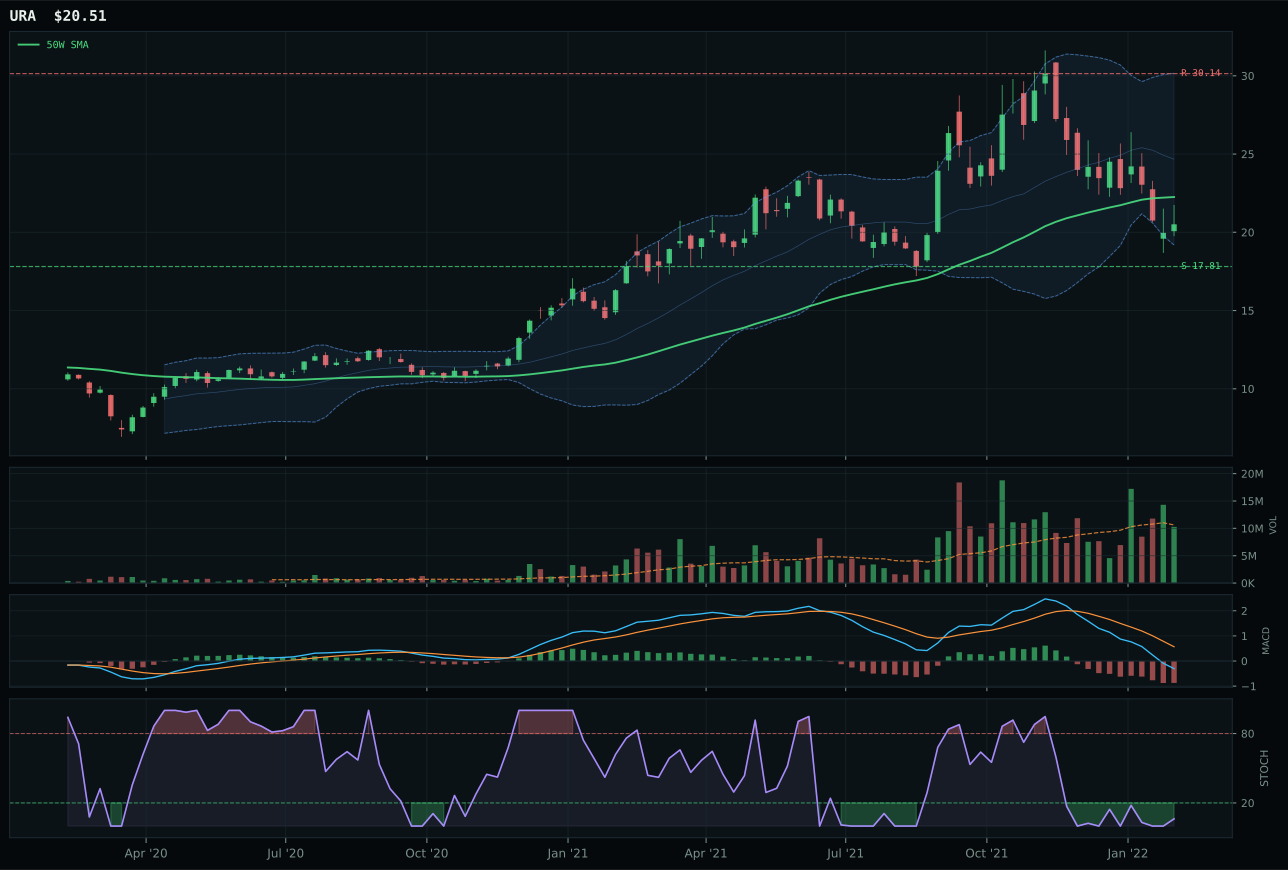
URA has a neutral structure profile with -25.2% 13-week relative strength versus SPY.
A failed hold above support would weaken the setup.
Actionable but governed by invalidation levels.
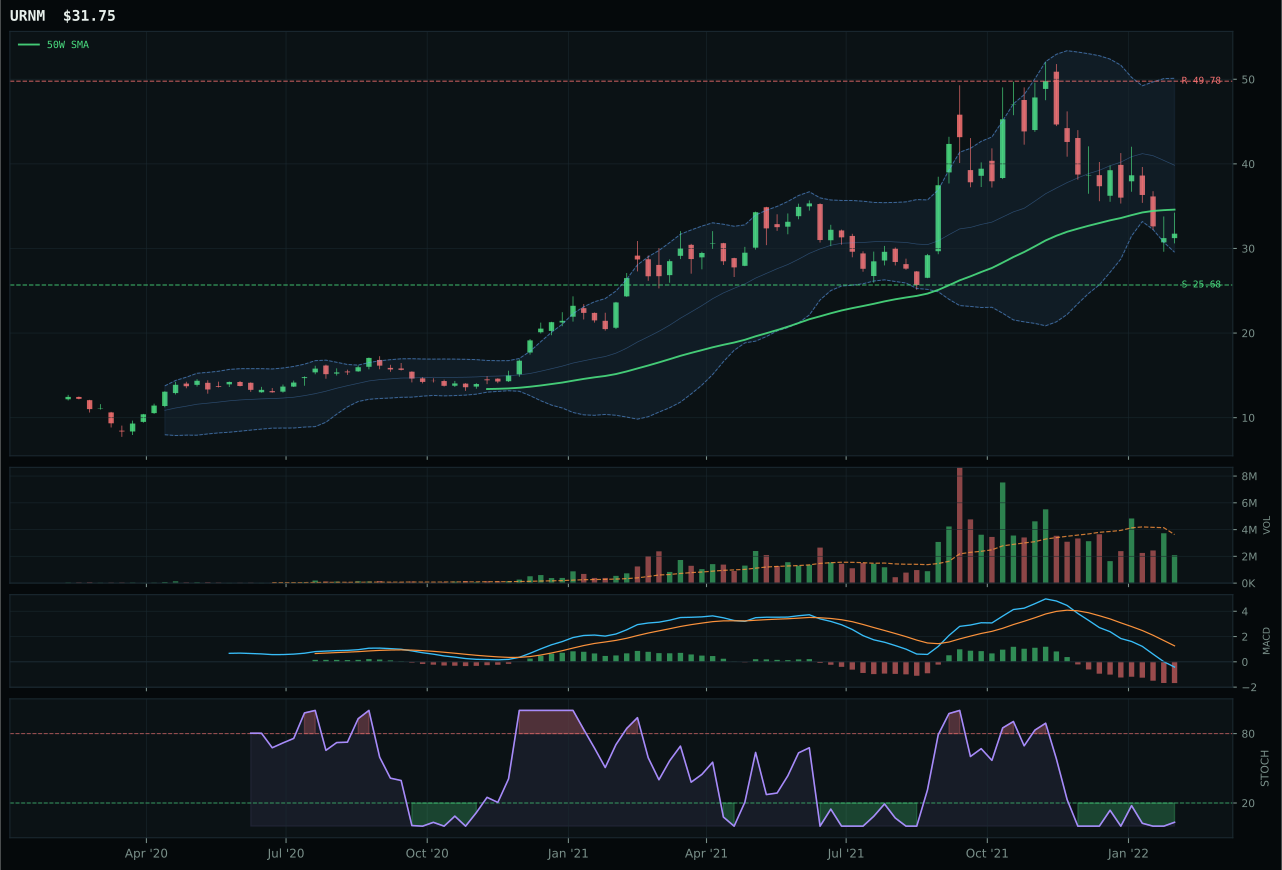
URNM has a neutral structure profile with -29.4% 13-week relative strength versus SPY.
A failed hold above support would weaken the setup.
Actionable but governed by invalidation levels.
URA wins the category at 27.9/100, the portfolio's lowest score, because despite terrible -29.4% 13-week momentum and -25.2% relative weakness to SPY, the stochastic RSI at 0.06 (deep oversold) combined with perfect 91.0/100 timing score and deep value zone positioning (Fib 0.786) creates the cleanest mean-reversion setup. NLR's runner-up position at 22.6 points higher reflects a cleaner trend (65 vs 52) and better macro fit (65.0 vs 50.0), but NLR's stochastic RSI is only rising mid-zone (not oversold turn-up), making it a defensive hold rather than a reversible wreck. URA's neutral structure with defined support at 17.81 provides binary clarity: either nuclear demand narrative survives the current bear and URA bounces 15%+, or it doesn't and capital is lost below support. Volume is neutral (not actively selling), and the 75.9/100 risk/reward confirms -32.0% upside extension (to 30.14 resistance) versus -15.2% downside (to support). This is pure asymmetry: maximum -15% loss against maximum +32% gain.
Nuclear Energy receives zero allocation because it scores 27.9 and ranks outside the portfolio—likely 9th or 10th—despite URA's textbook oversold reversal setup. The category-level macro fit of 60.0/100 is dragged down by active credit stress (-5) and risk appetite broken (-4) that offset energy scarcity support (+9), and URA's technical evidence at just 15.9/100 is one of the lowest in the portfolio. The real problem is that nuclear lacks momentum confirmation: URA's zero 13-week momentum and category-relative strength mean this is not an alpha opportunity but a value trap forming in real time. If credit stress eases sharply or fear of energy shortages intensifies, nuclear reverts to an allocation candidate, but this week the category is simply not competitive against agriculture, metals, and energy for capital. URA's -29.4% drawdown will eventually reverse, but that could take months; the portfolio cannot afford to park 10% in capitulation while stronger setups exist elsewhere.