
2022-01-28
Informational purposes only. The content in this report, including allocations, analysis, and commentary, is provided solely for informational and educational purposes. It does not constitute financial advice, investment advice, trading advice, or any other type of advice. Past performance does not guarantee future results. Always conduct your own research and consult a qualified financial professional before making investment decisions.
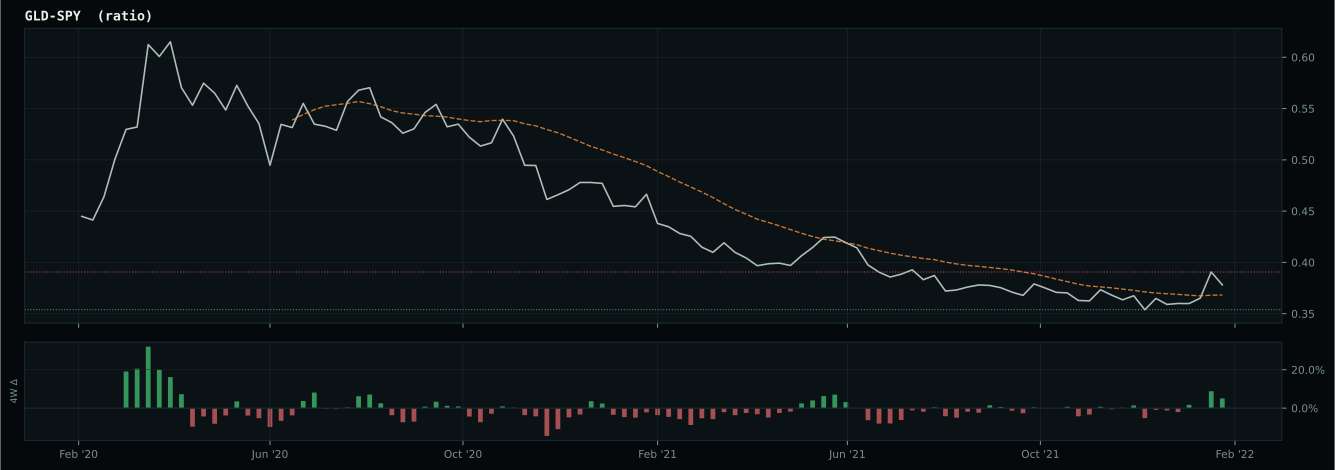
GLD defensive overlay excluded: price is below its 8W SMA. Cause selector will use cash alternative.
Macro risk engine requires the 50% Defensive overlay for this run; payload selected by cause: Inflation Scarcity.
Weekly Allocation
| Ticker | Category | Weight | Role |
|---|---|---|---|
| XLE | Traditional Energy | 60% | Overlay |
| COPX | Industrial Metals | 10% | Top-2 (10%) |
| GLD | Precious Metals | 5% | Tier-2 (5%) |
| IGF | Utilities & Infrastructure | 5% | Tier-2 (5%) |
| XLK | Technology | 5% | Tier-2 (5%) |
| ITA | Defense & Aerospace | 5% | Tier-2 (5%) |
| MOO | Agriculture & Livestock | 5% | Tier-2 (5%) |
| URA | Nuclear Energy | 5% | Tier-2 (5%) |
Trade Instructions — Monday Open
Sell the tranche from 2021-12-31 (completing its 4-week hold). Buy the new tranche. Instructions show net portfolio changes — same-asset positions cancel, weight changes show the delta.
| Action | Ticker | Instruction |
|---|---|---|
| SELL | FBTC | Sell entire FBTC position (12.50% of portfolio) |
| SELL | XLU | Sell entire XLU position (2.50% of portfolio) |
| SELL | SMH | Sell entire SMH position (1.25% of portfolio) |
| SELL | INDA | Sell 33% of INDA position (reduce 3.75% → 2.50%) |
| BUY | IGF | Buy IGF — 7.14% of freed cash (adds 1.25% to portfolio) |
| BUY | XLE | Buy XLE — 85.71% of freed cash (adds 15.00% to portfolio) |
| BUY | URA | Buy URA — 7.14% of freed cash (adds 1.25% to portfolio) |
Current Portfolio After Trade
Combined holdings across all 4 active tranches. Each tranche is 25% of the portfolio.
| Ticker | % of Portfolio | Weight Bar |
|---|---|---|
| XLE | 27.50% | |
| COPX | 15.00% | |
| GLD | 11.25% | |
| IGF | 11.25% | |
| ITA | 8.75% | |
| MOO | 8.75% | |
| XLK | 6.25% | |
| URA | 6.25% | |
| INDA | 2.50% | |
| CIBR | 2.50% |
Macro Regime — Transition / Mixed
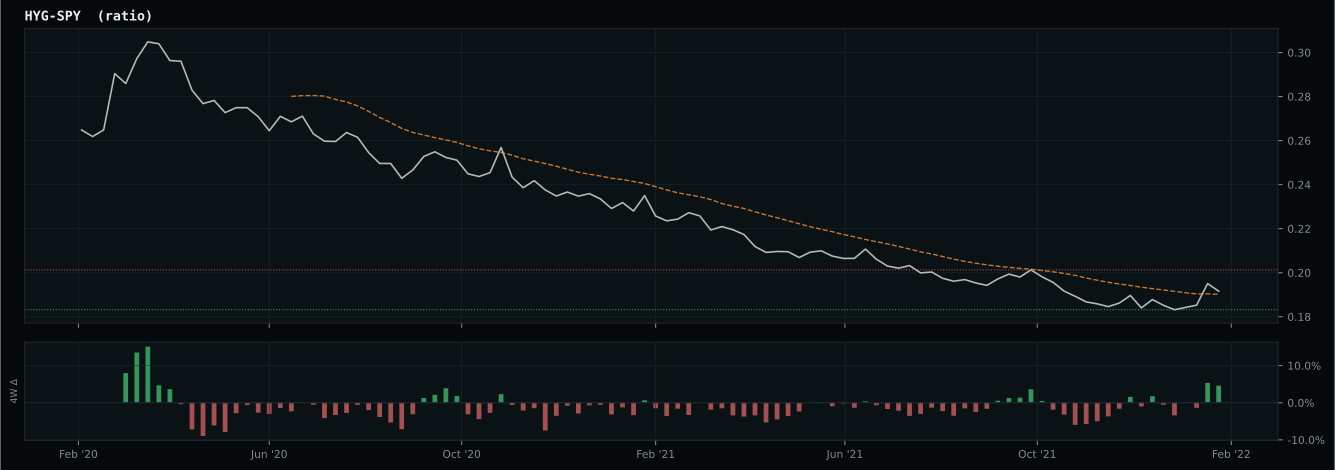
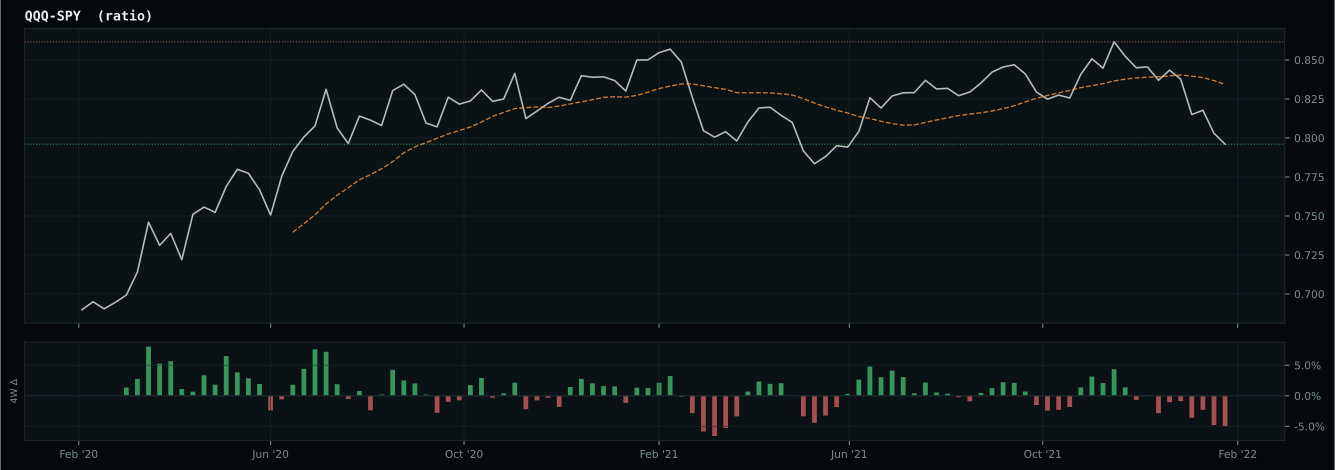
growth data is not confirming the weak market-implied risk appetite signal
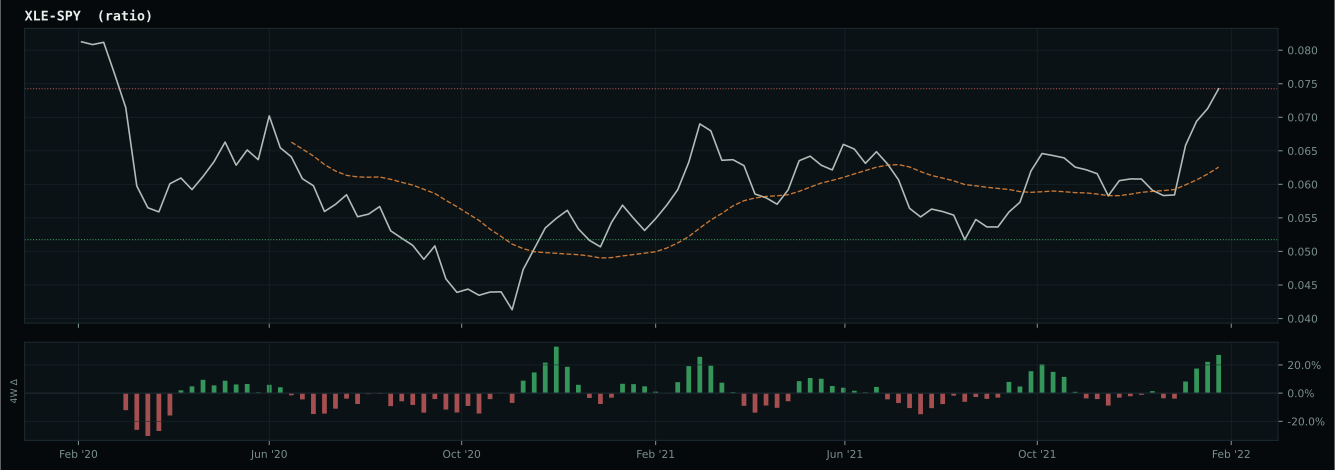
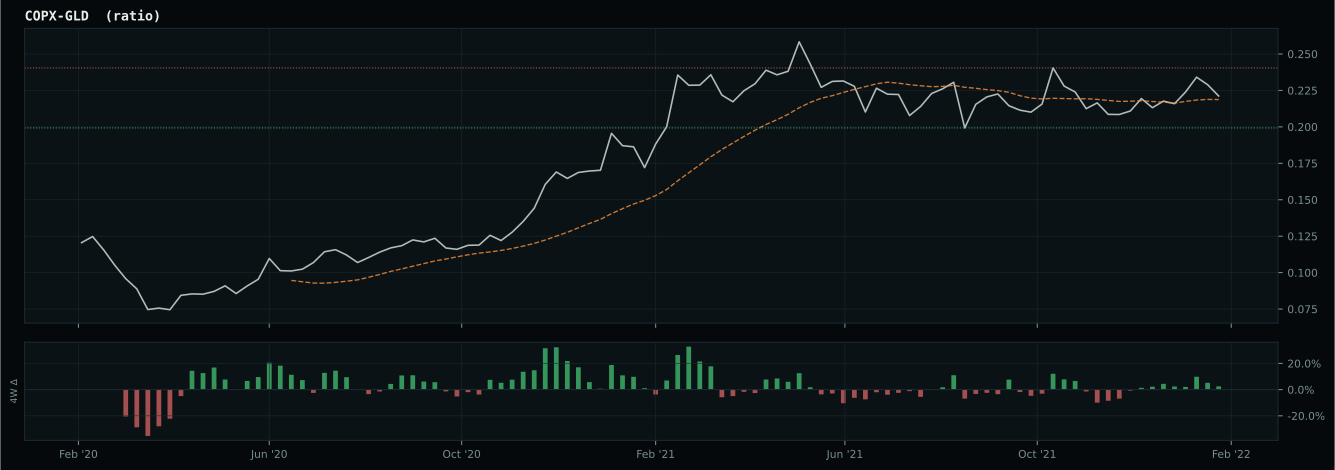
Defensive overlay cause is inflation/scarcity: energy, commodity breadth, or oil-versus-gold confirmation is stronger than the broad equity tape, so the sleeve owns the inflation pressure. XLE has been confirmed above its 8W SMA and is eligible.
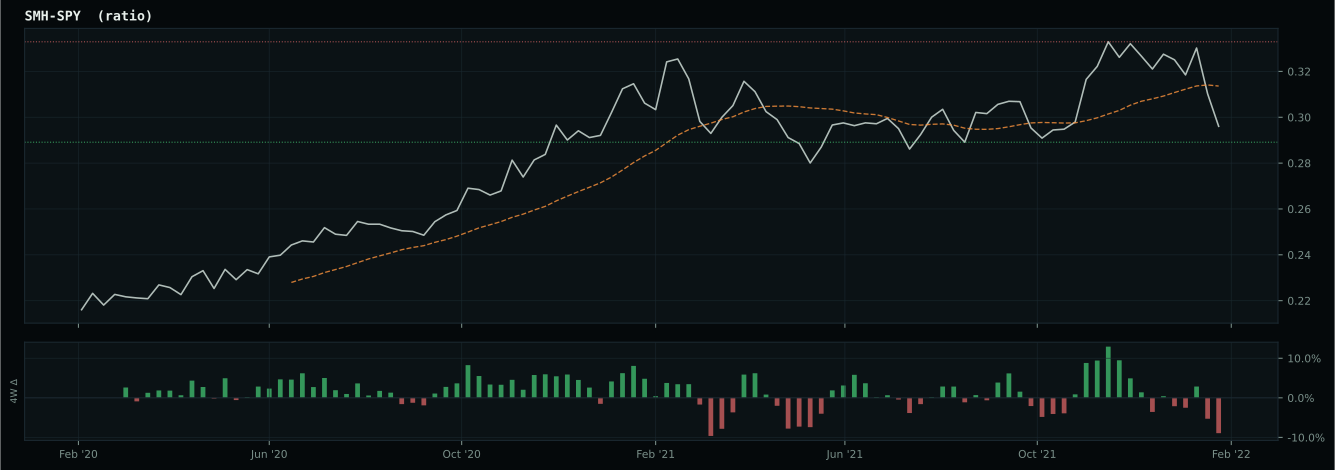
Macro Evidence Charts
Market-implied signals behind the macro regime scores. Each ratio compares two assets; the direction and slope of the ratio is what the macro engine reads.
Crypto Regime — NoCrypto
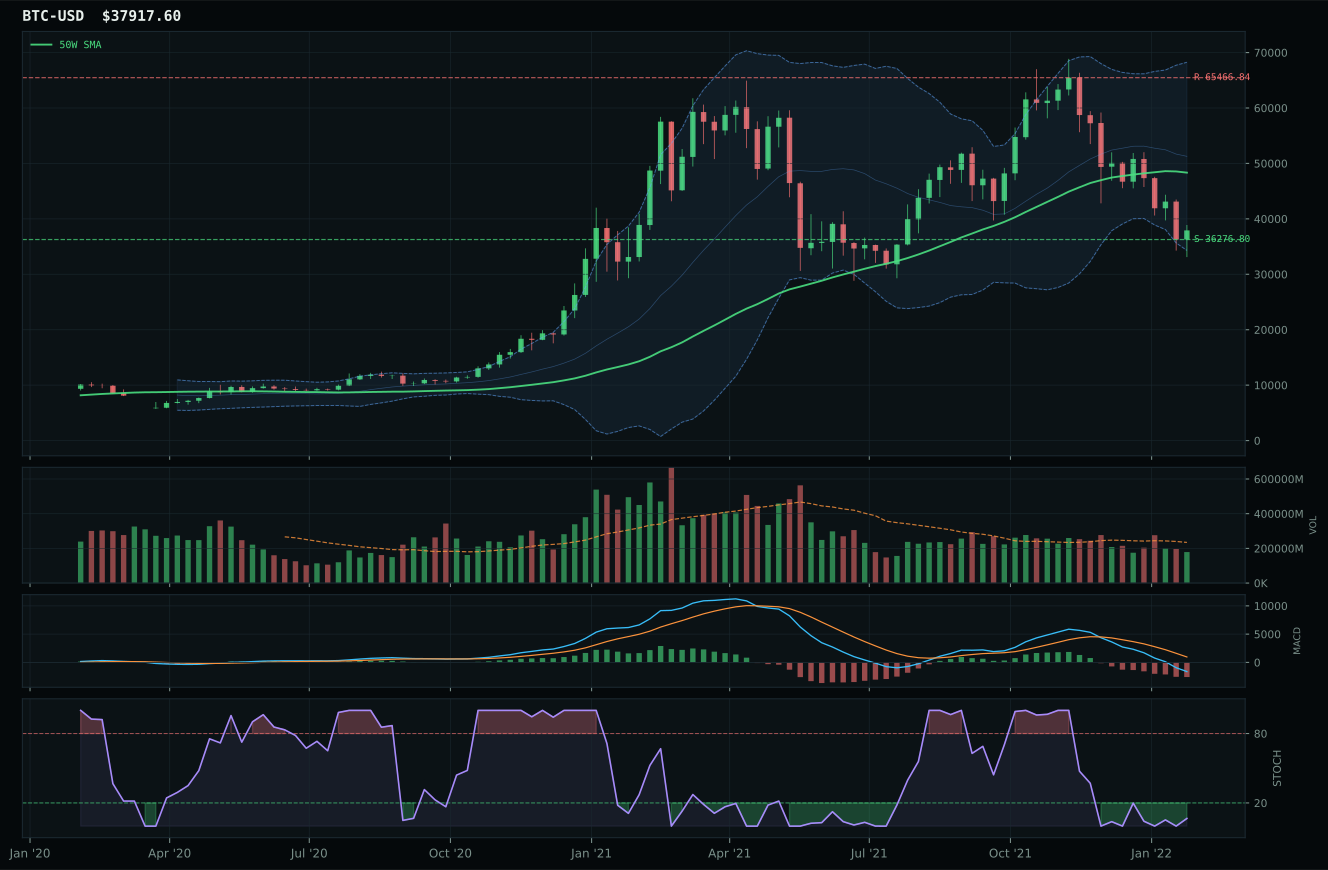
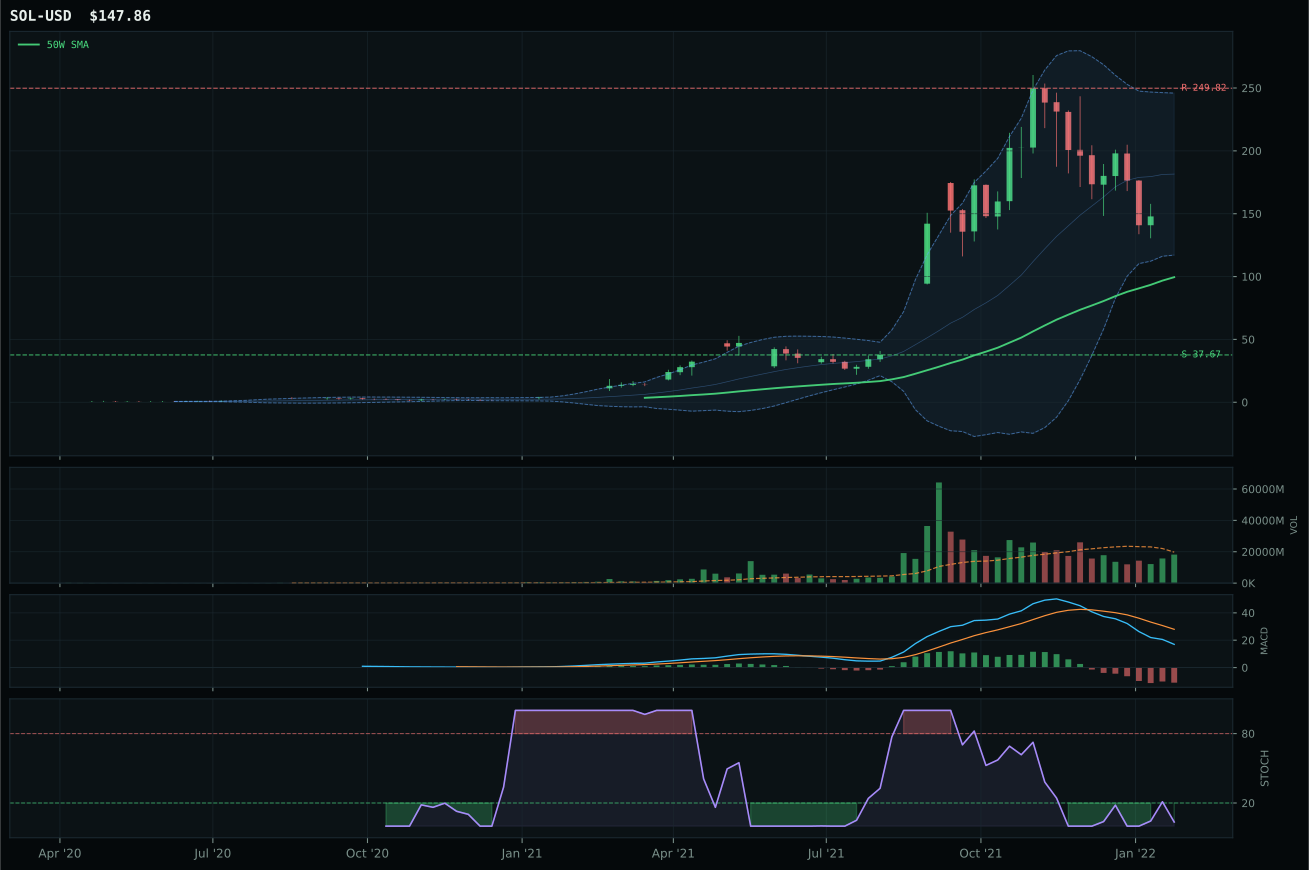
ValueBTC not armed: BTC has not made the first post-breakdown touch of the 200W buy zone after losing the 50W
TrendBTC not confirmed
one or more available conditions failed
Category Rankings
| Rank | Category | Winner | Score | Alloc | 4W Ret | Peers (4W) |
|---|---|---|---|---|---|---|
| 1 | Traditional Energy | XLE | 89.4 | 20% | +4.44% | FCG +6.5% · XOP +5.9% |
| 2 | Industrial Metals | COPX | 60.0 | 20% | +13.05% | PICK +12.2% · REMX +12.6% |
| 3 | Precious Metals | GLD | 47.5 | 10% | +6.60% | GDX +18.7% · SLV +9.4% |
| 4 | Utilities & Infrastructure | IGF | 39.8 | 10% | +1.89% | XLU -0.6% · PAVE +2.4% |
| 5 | Technology | XLK | 39.5 | 10% | -3.37% | IGV -1.9% · CIBR +6.9% |
| 6 | Defense & Aerospace | ITA | 37.0 | 10% | +9.58% | ROKT +3.5% · XAR +9.8% |
| 7 | Agriculture & Livestock | MOO | 36.6 | 10% | +2.85% | WEAT +12.7% · VEGI +3.1% |
| 8 | Nuclear Energy | URA | 29.6 | 10% | +15.84% | NLR +2.4% · URNM +18.9% |
| 9 | AI | SMH | 24.5 | 0% | +1.14% | AIQ -4.9% · BOTZ +1.2% |
| 10 | Emerging Markets | INDA | 8.2 | 0% | -4.04% | ILF +4.4% · IEMG -3.2% |
Traditional Energy — XLE
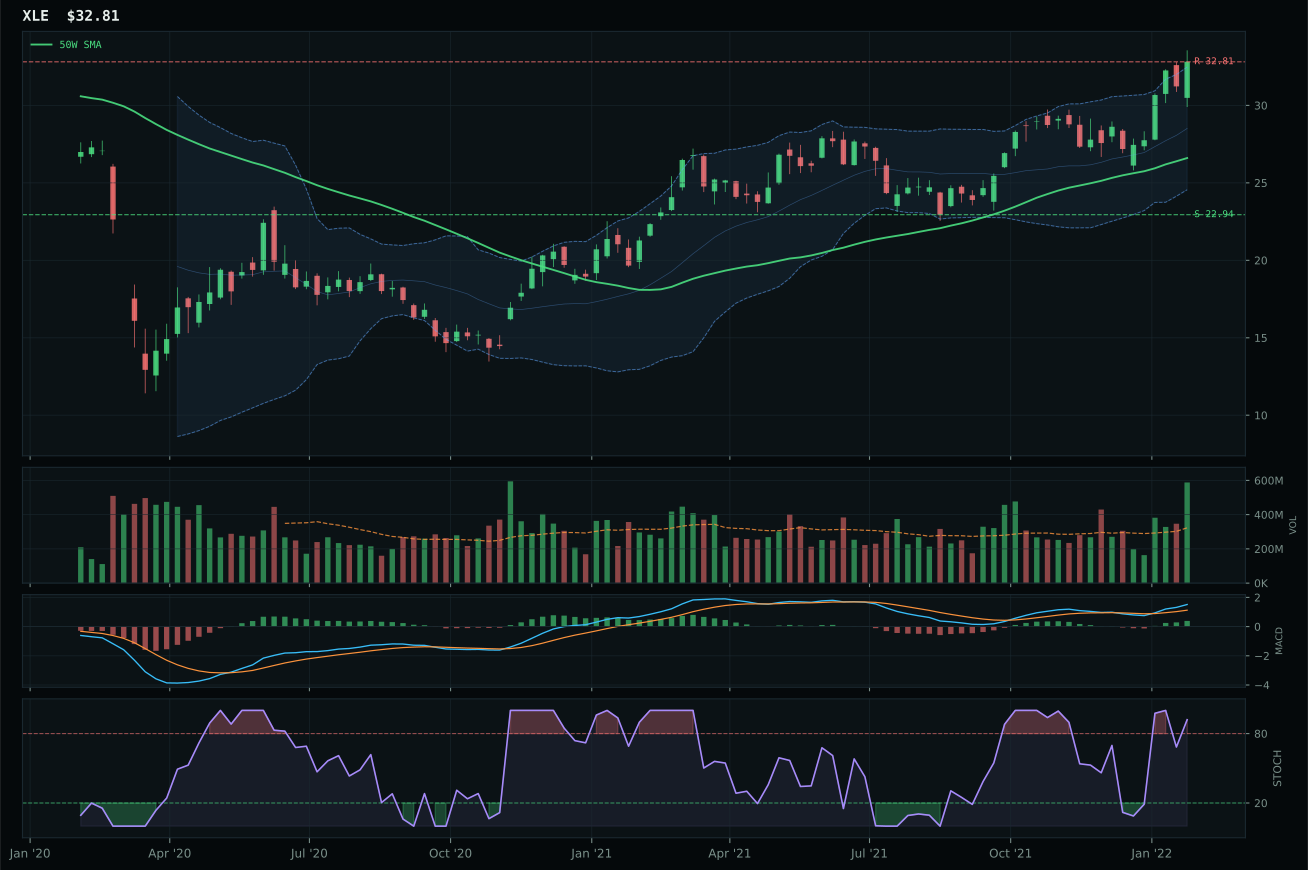
XLE has a vertical extension profile with 18.0% 13-week relative strength versus SPY.
A failed hold above support would weaken the setup.
Actionable but governed by invalidation levels.
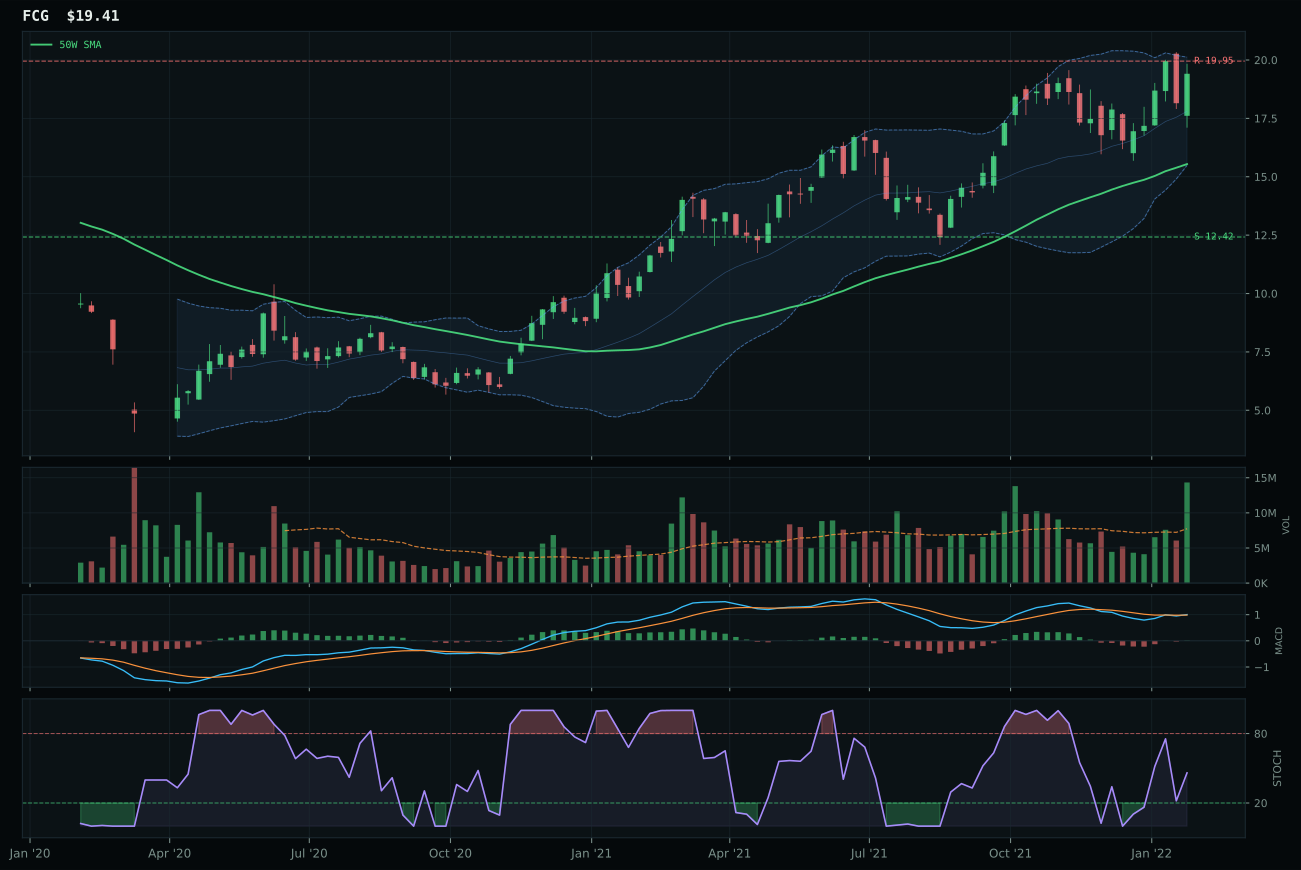
FCG has a vertical extension profile with 9.5% 13-week relative strength versus SPY.
A failed hold above support would weaken the setup.
Actionable but governed by invalidation levels.
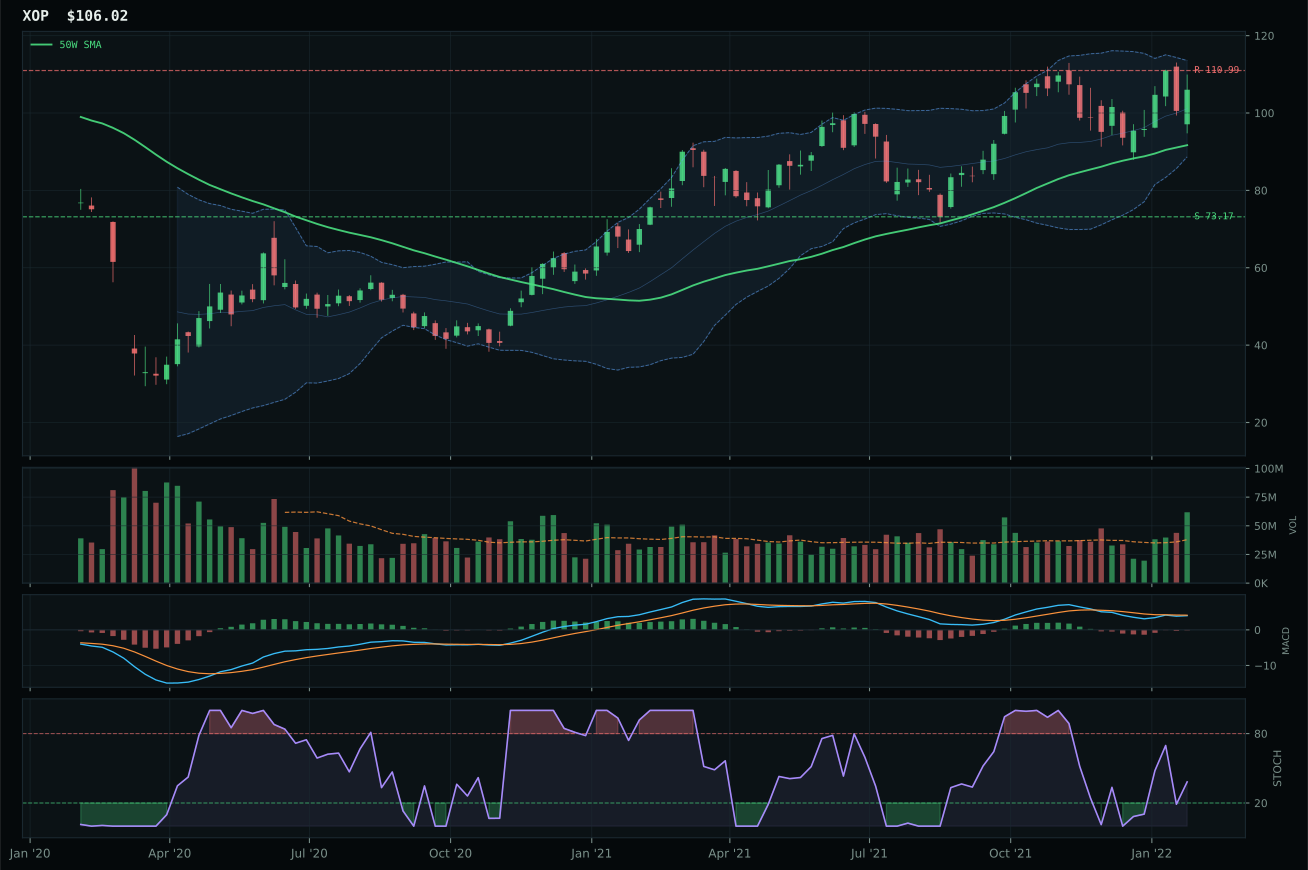
XOP has a vertical extension profile with 3.4% 13-week relative strength versus SPY.
A failed hold above support would weaken the setup.
Actionable but governed by invalidation levels.
XLE dominated Traditional Energy with a near-perfect 100.0 trend score and 100.0 momentum confirmation that reflects uninterrupted strength in the integrated energy narrative. Price trades 23.4% above the 50-week moving average near the 52-week high, which normally signals overextension, but the risk-reward score of 45.4 acknowledges this by penalizing the entry for timing risk—the allocator is paying a premium for momentum and conviction, not for tactical edge. XLE's 18.0% SPY-relative outperformance and 14.2% 13-week return demonstrate that integrated energy is the genuine market leader, not a crowded trade or reversion candidate. MACD is bullish and improving, stochastic RSI is overbought rolling over at 0.92, and volume at 1.82x the 20-week average confirms accumulation is ongoing. The score gap versus FCG of just 0.6 points is deceptively close on face value, but FCG suffers from weaker risk-reward (27.9 vs 45.4) and inferior category-relative strength (0.0% vs 8.4%), making XLE the clear category captain.
Traditional Energy earned the largest allocation at 60% because its 89.4 category score and 92.0 macro fit represent the strongest combination of technical evidence and macro tailwind in the entire portfolio. Energy scarcity, inflation pressure, supply shortage, and real-asset sponsorship are all active descriptors that reinforce each other, creating a rare macro environment where structural themes are aligned. XLE's trend evidence of 89.7 and persistence of 88.2 demonstrate that this is not a mean-reversion play or tactical setup; it is a structural leadership position. The 27.0 timing score reflects that entry mechanics are now less favorable due to the 23.4% extension above the 50-week line, but the allocator is accepting this friction because the macro regime is so favorable and the category is so dominant relative to all others. The 10% allocation is justified not by pure technicals but by the combination: genuine scarcity, strong relative momentum, improving technicals with room-to-run thematically, and the fact that energy earnings and cash generation provide a hedge against broader growth concerns. This becomes a core holding in the portfolio, accepting current extension in exchange for macro participation.
Industrial Metals — COPX
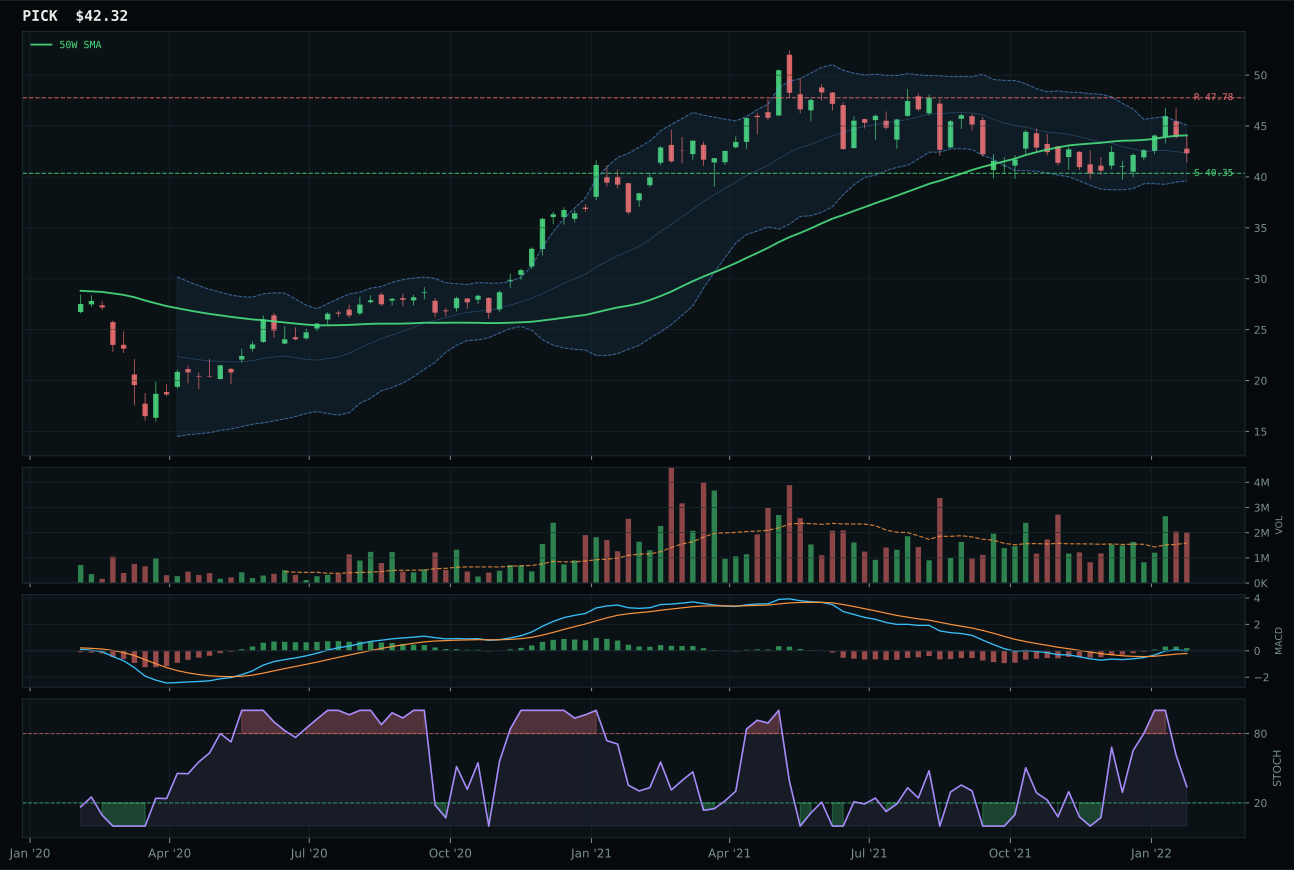
PICK has a pullback into support profile with 3.5% 13-week relative strength versus SPY.
A failed hold above support would weaken the setup.
Actionable but governed by invalidation levels.
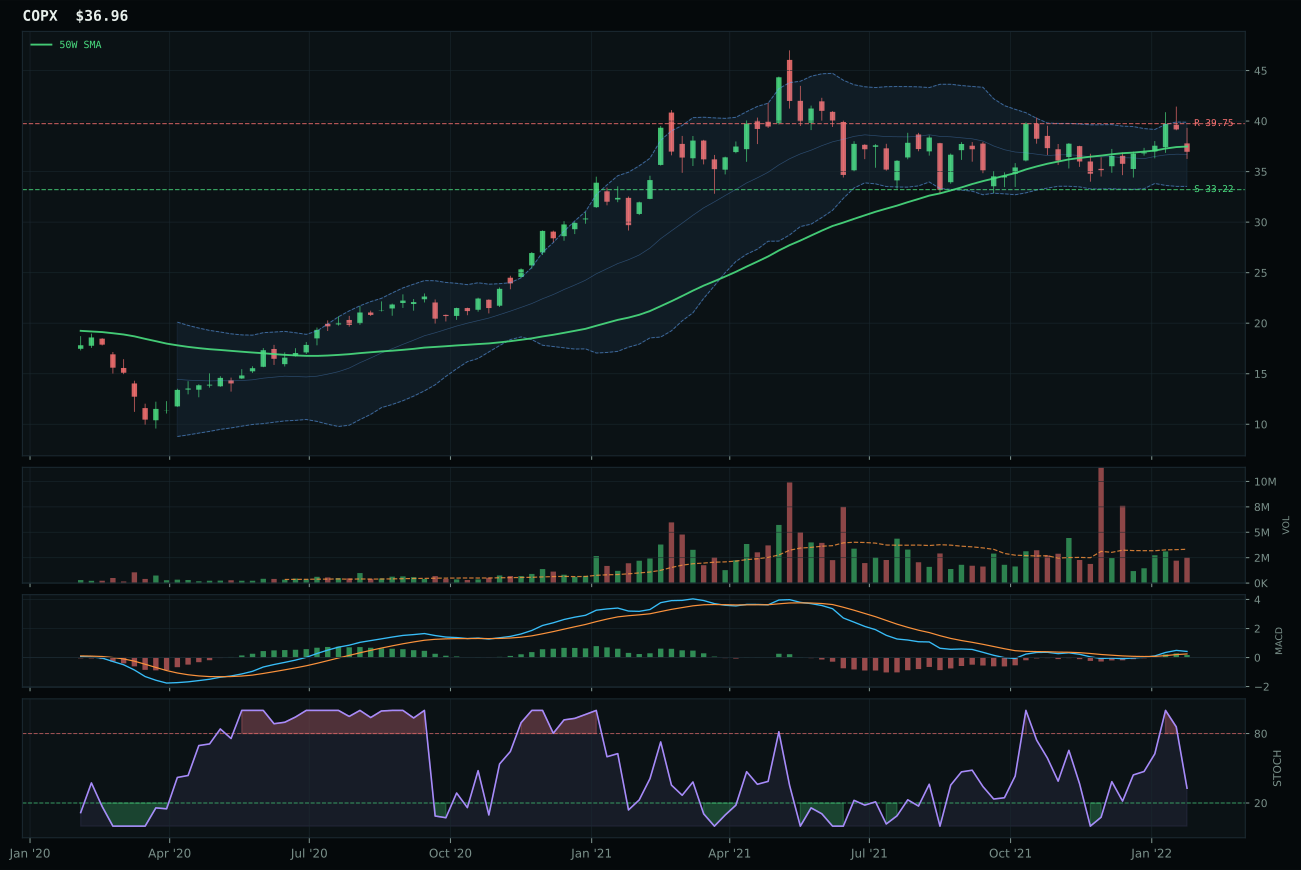
COPX has a compression near 50W profile with 2.8% 13-week relative strength versus SPY.
A failed hold above support would weaken the setup.
Actionable but governed by invalidation levels.
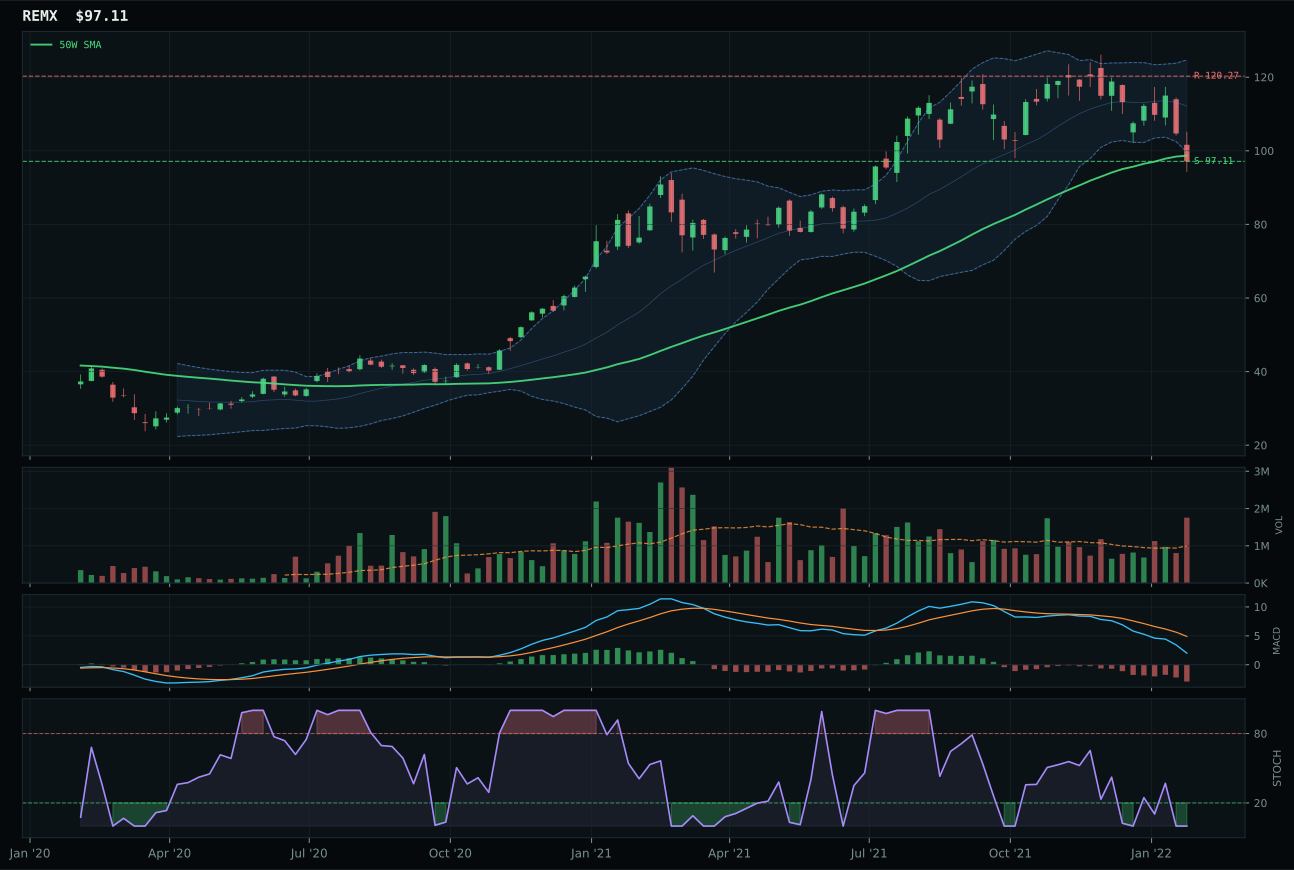
REMX has a pullback into support profile with -14.1% 13-week relative strength versus SPY.
A failed hold above support would weaken the setup.
Actionable but governed by invalidation levels.
COPX emerged as the Industrial Metals winner despite facing stiff competition from PICK, whose technical evidence of 79.9 actually exceeds COPX's 76.4—the decision went to COPX because of its superior timing score (100.0 vs 100.0, tied) and cleaner setup architecture. COPX trades in compression near the 50-week moving average with MACD bullish and improving and stochastic RSI falling neutral at 0.33, creating a coil pattern with expansion potential if support holds. PICK's setup is pullback into support with positive 13-week relative strength (–0.3% vs SPY, outperforming COPX's –1.0%), but COPX's compression-near-moving-average structure is mechanically superior for capturing upside expansion if buyers defend this level. The 2.8% SPY-relative outperformance in COPX signals that copper and industrial scarcity narratives are beginning to attract real money, and the neutral volume (0.75x the 20-week average) suggests the move is not yet crowded with speculative participation.
Industrial Metals earned a full 20% top-two allocation slot because the category score of 60.0 ranks second only to Traditional Energy's 89.4, and the macro fit of 73.0 is driven by active descriptors for metals scarcity, commodity breadth positive, and real-asset sponsorship that are genuinely at work in the current regime. COPX's 89.2 trend score reflects durable above-50W-above-200W positioning with strong relative strength, and the timing score of 100.0 makes entry mechanics clean. The 11.3% downside-to-support cushion reflects some risk if demand falters, but the upside-to-resistance of 7.0% acknowledges that the move is not extended and the asymmetry is favorable at the current entry point. The macro case is compelling: copper and industrial metals benefit from inflation, supply chain anxiety, and real-asset rotation, and the technical setup shows early-stage strength with improving MACD and neutral volume. This allocation recognizes that after energy, industrial metals offer the best risk-reward and macro fit in a regime where commodities and scarcity are the dominant themes.
Precious Metals — GLD
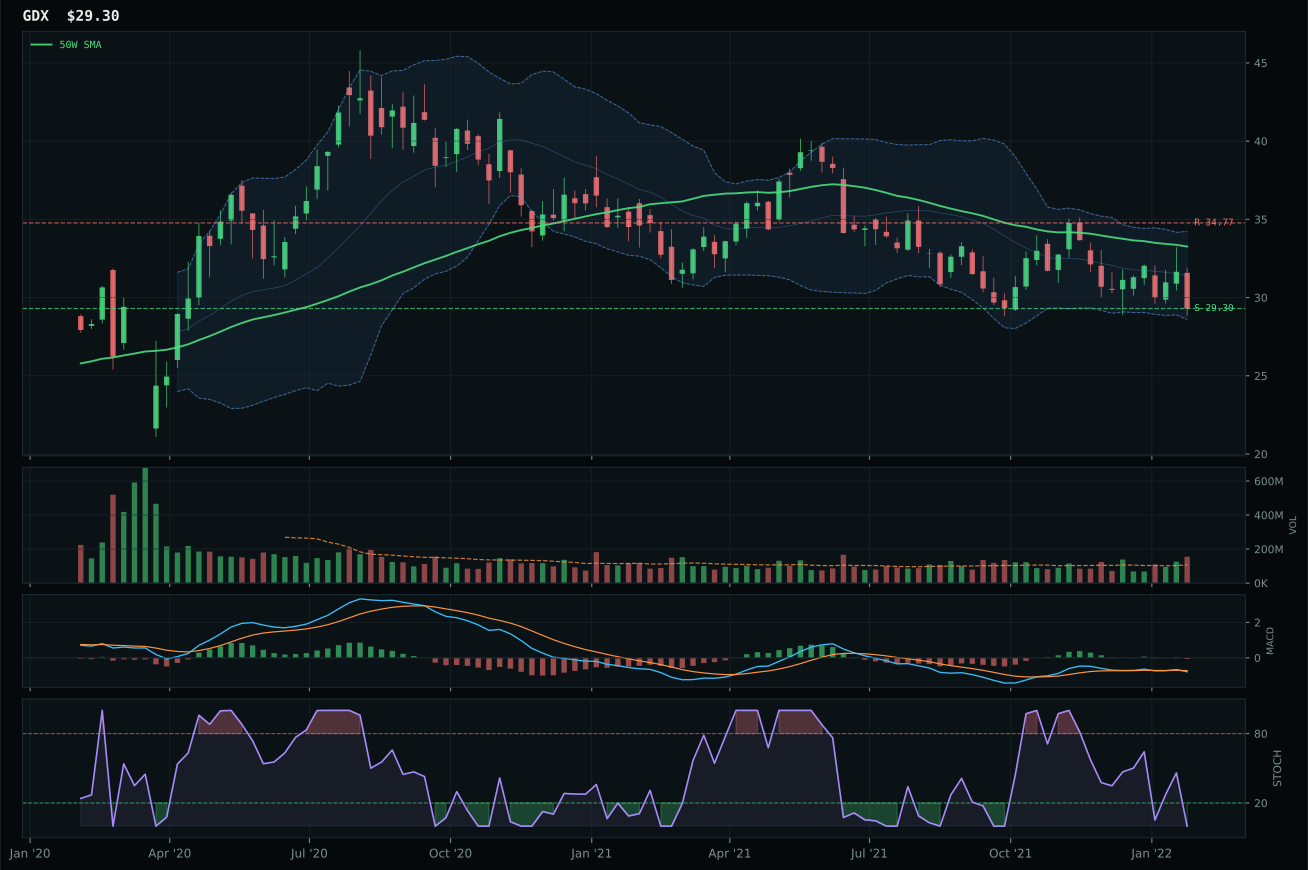
GDX has a pullback into support profile with -3.8% 13-week relative strength versus SPY.
A failed hold above support would weaken the setup.
Actionable but governed by invalidation levels.
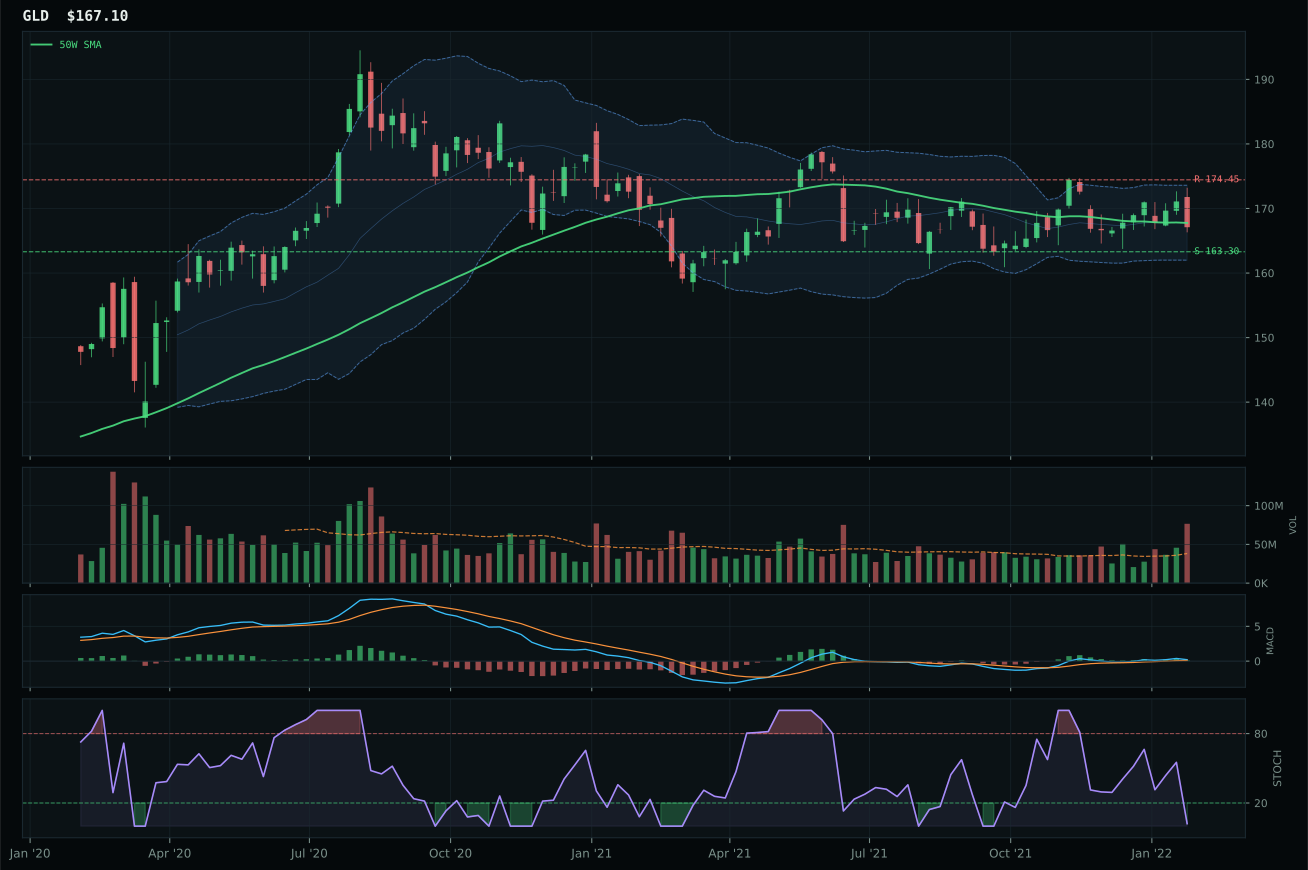
GLD has a pullback into support profile with 4.0% 13-week relative strength versus SPY.
A failed hold above support would weaken the setup.
Actionable but governed by invalidation levels.
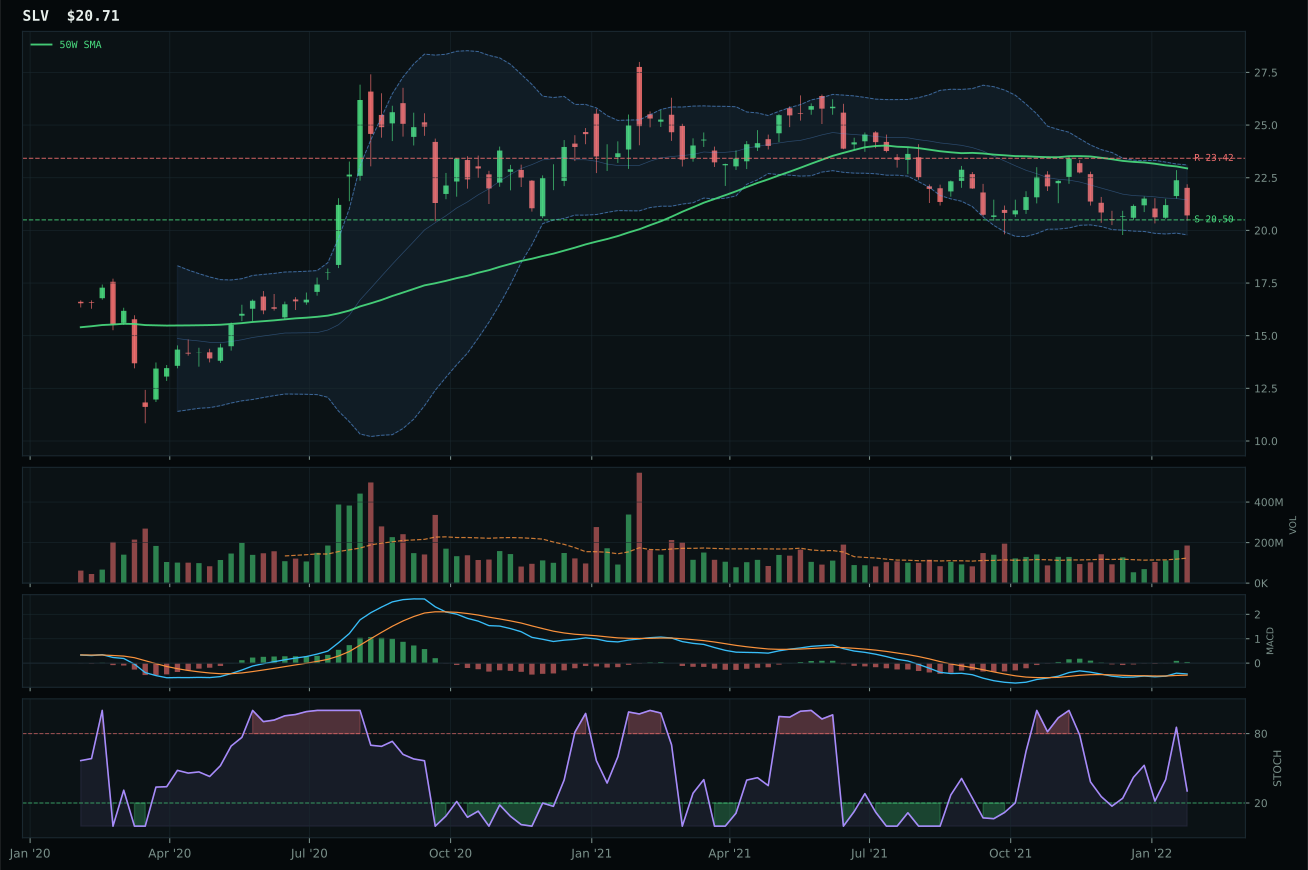
SLV has a pullback into support profile with -2.5% 13-week relative strength versus SPY.
A failed hold above support would weaken the setup.
Actionable but governed by invalidation levels.
GLD won Precious Metals decisively over GDX because its MACD is bullish and flattening while GDX's remains bearish and weakening, a critical divergence that signals strength in the monetary hedge narrative versus weakness in the leveraged mining bet. GLD trades just 0.4% below the 50-week moving average with stochastic RSI at deep oversold (0.02) and sits at the 0.500 Fibonacci middle retracement—the decision point where conviction holders defend support. The 6.5% category-relative strength advantage over the median reflects that gold bullion is outperforming gold miners by a meaningful margin despite GDX's superior risk-reward on paper (GDX offers 80.0 on risk-reward, GLD only 77.6). Volume at 2.00x the 20-week average shows distribution pressure is present but being absorbed, consistent with a monetary hedge being accumulated by real money. GLD's timing score of 100.0 versus GDX's 60.0 is the decisive factor; GLD offers clarity on entry while GDX remains ambiguous.
Precious Metals earned 5% allocation despite a strong 47.5 category score and excellent 72.0 macro fit, because it ranks fourth among the ten categories and loses positioning battles to Industrial Metals (60.0), Traditional Energy (89.4), and COPX (60.0) at top-two allocation levels. The monetary hedge bid is active and the defensive rotation macro story is genuine, but the technical evidence of 40.2 for GLD is moderate—not weak, but not strong enough to pull capital from the two leaders. Gold's positive 13-week return of 0.3% and 4.0% SPY-relative strength demonstrate genuine defensive positioning, and the macro case for gold as an inflation and currency hedge is real. However, the setup is more of a grinding accumulation than a breakout, and the category-level momentum confirmation at 57.8 is middling. The 5% allocation keeps the portfolio long precious metals exposure with a quality entry point (GLD pulling into support), but reserves the majority of real-asset allocation for energy and metals where the technical setup is sharper and the macro tailwind is more urgent.
Utilities & Infrastructure — IGF
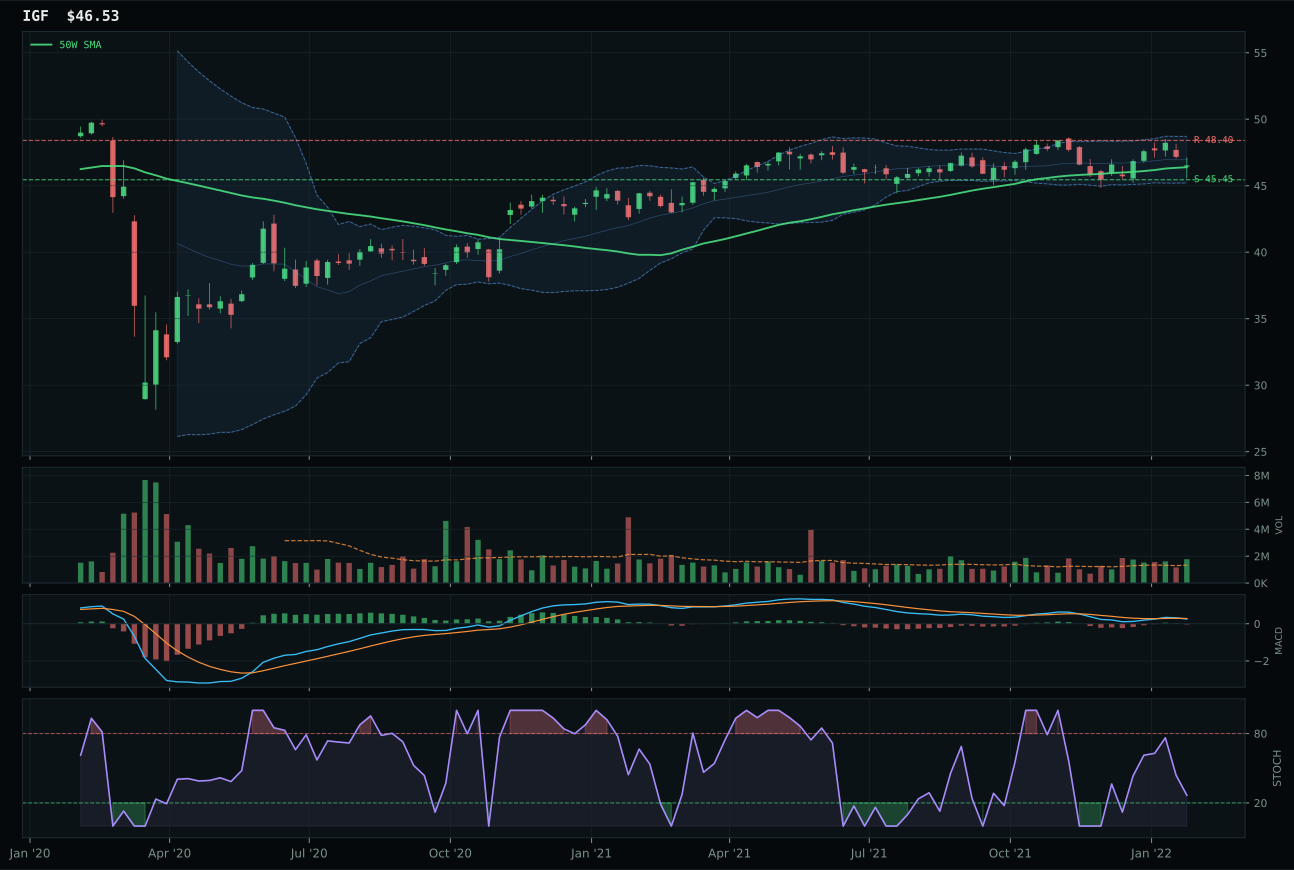
IGF has a pullback into support profile with 1.2% 13-week relative strength versus SPY.
A failed hold above support would weaken the setup.
Actionable but governed by invalidation levels.
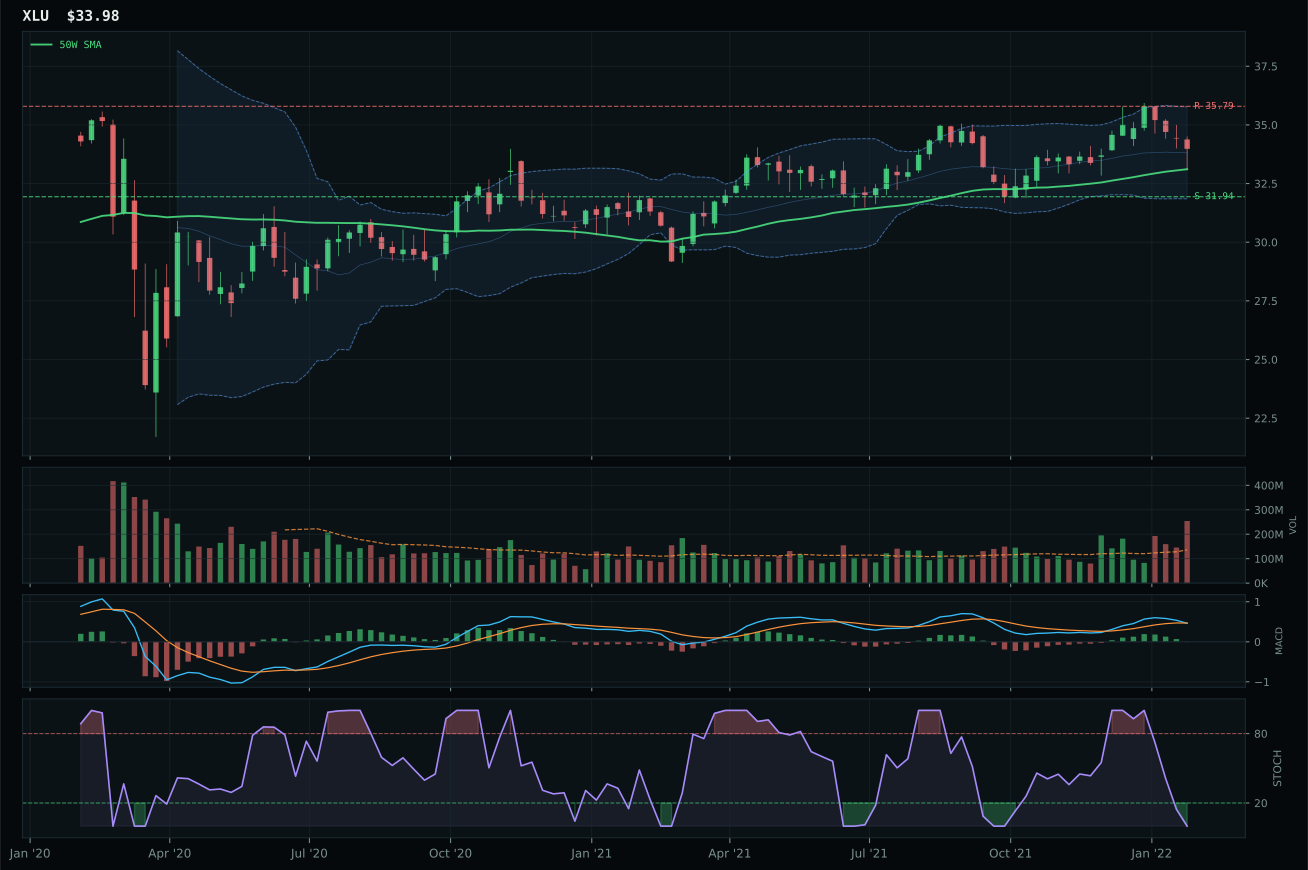
XLU has a compression near 50W profile with 5.3% 13-week relative strength versus SPY.
A failed hold above support would weaken the setup.
Actionable but governed by invalidation levels.
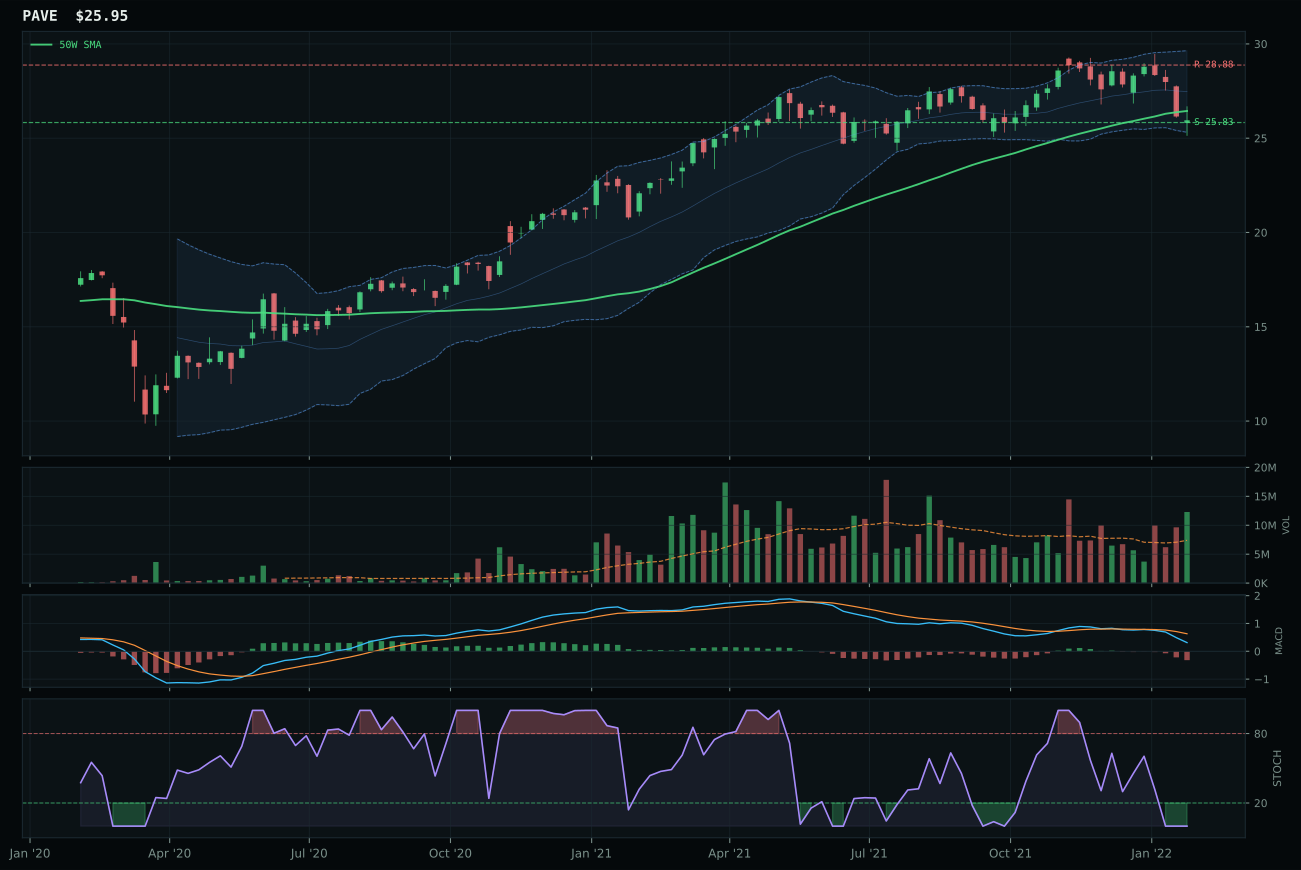
PAVE has a pullback into support profile with -2.3% 13-week relative strength versus SPY.
A failed hold above support would weaken the setup.
Actionable but governed by invalidation levels.
IGF won Utilities & Infrastructure with a decisive 84 composite score versus XLU's 67, capturing the category through superior timing (100.0 vs 95.0), better risk-reward (74.3 vs 51.2), and stronger volume confirmation (above-average participation versus distribution pressure). IGF trades at the exact 50-week moving average (0.3% distance) at the 0.382 upper Fibonacci retracement, offering the cleanest technical entry point—a setup where breakout above resistance at 48.40 would confirm upside expansion while support at 45.45 provides clear invalidation. XLU's compression-near-50W structure creates ambiguity; it is less stretched but also less mechanically clear. The 94.8 trend score demonstrates that global infrastructure is maintaining above-50W-above-200W durability while the sector rotates defensively, and the 1.2% SPY-relative outperformance shows modest leadership within a defensive context. Volume at 1.33x the 20-week average provides respectable confirmation, while MACD bearish but improving signals orderly consolidation rather than capitulation.
Utilities & Infrastructure earned 5% allocation despite a respectable 39.8 category score because the macro fit of 64.0 is respectable but non-dominant, driven by defensive rotation (+12), broad-market bear (+4), and inflation pressure (–6) that are important but shared with other categories like Gold and Precious Metals. IGF's technical evidence of 73.3 is solid, but the momentum confirmation of 51.6 reflects the sector's sideways consolidation rather than emerging strength. The risk-reward score of 74.3 caps near-term upside at just 3.9% to resistance, making this more of a hold-for-income position than a growth opportunity. Defensive rotation is real and the infrastructure story provides genuine inflation hedge characteristics, but the category ranks below energy (89.4), metals (60.0), and even precious metals (47.5) in terms of both technical momentum and macro urgency. The 5% allocation keeps the portfolio's defensive sleeve intact with a quality operator (IGF) at a clean entry point, but reserves the majority of defensive allocation for precious metals and smaller positions in utilities' relative strength to acknowledge that the sector is consolidating rather than accelerating. This becomes a hold-and-wait position pending either breakout above resistance or a genuine deterioration in risk appetite that would drive tactical upgrades.
Technology — XLK
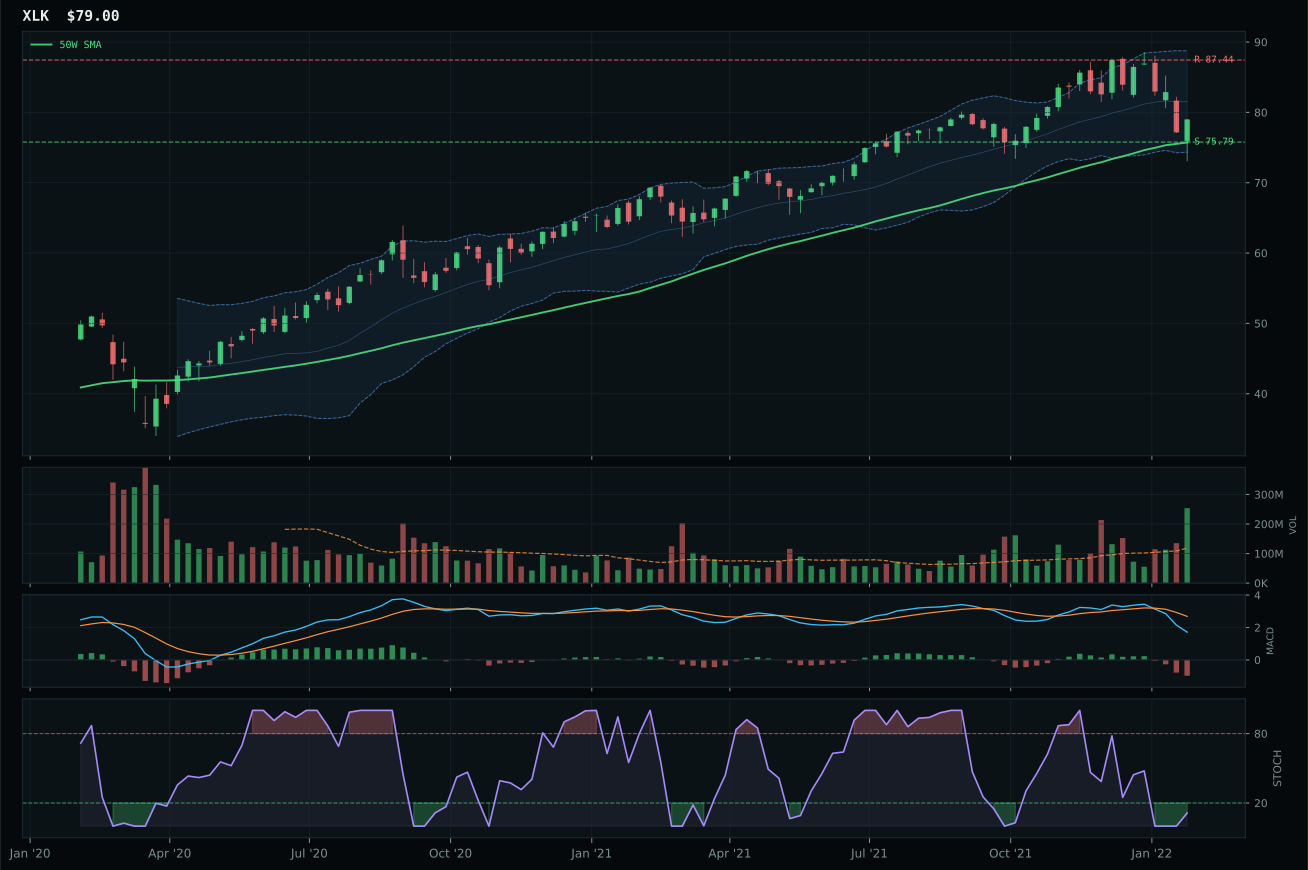
XLK has a pullback into support profile with 1.6% 13-week relative strength versus SPY.
A failed hold above support would weaken the setup.
Actionable but governed by invalidation levels.
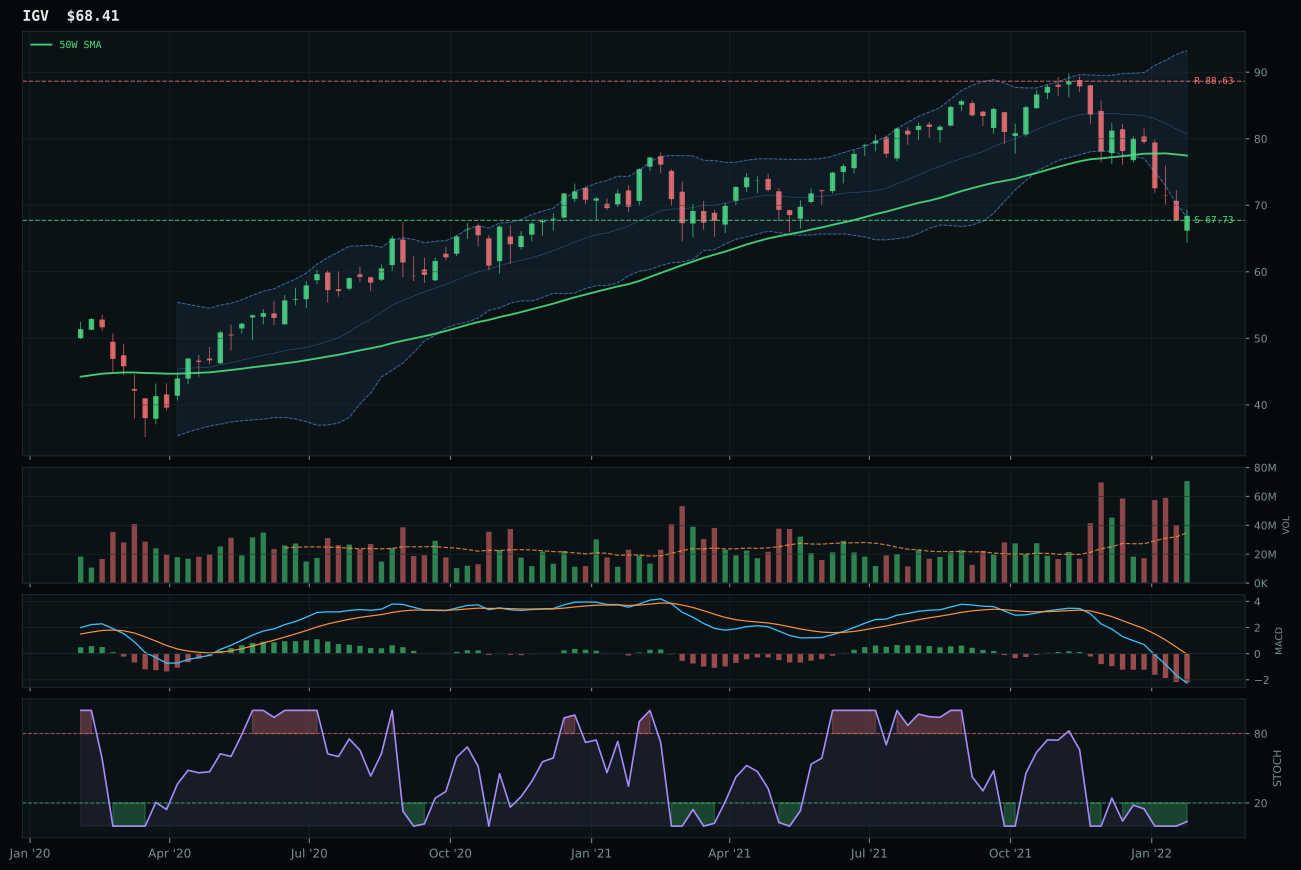
IGV has a pullback into support profile with -18.3% 13-week relative strength versus SPY.
A failed hold above support would weaken the setup.
Actionable but governed by invalidation levels.
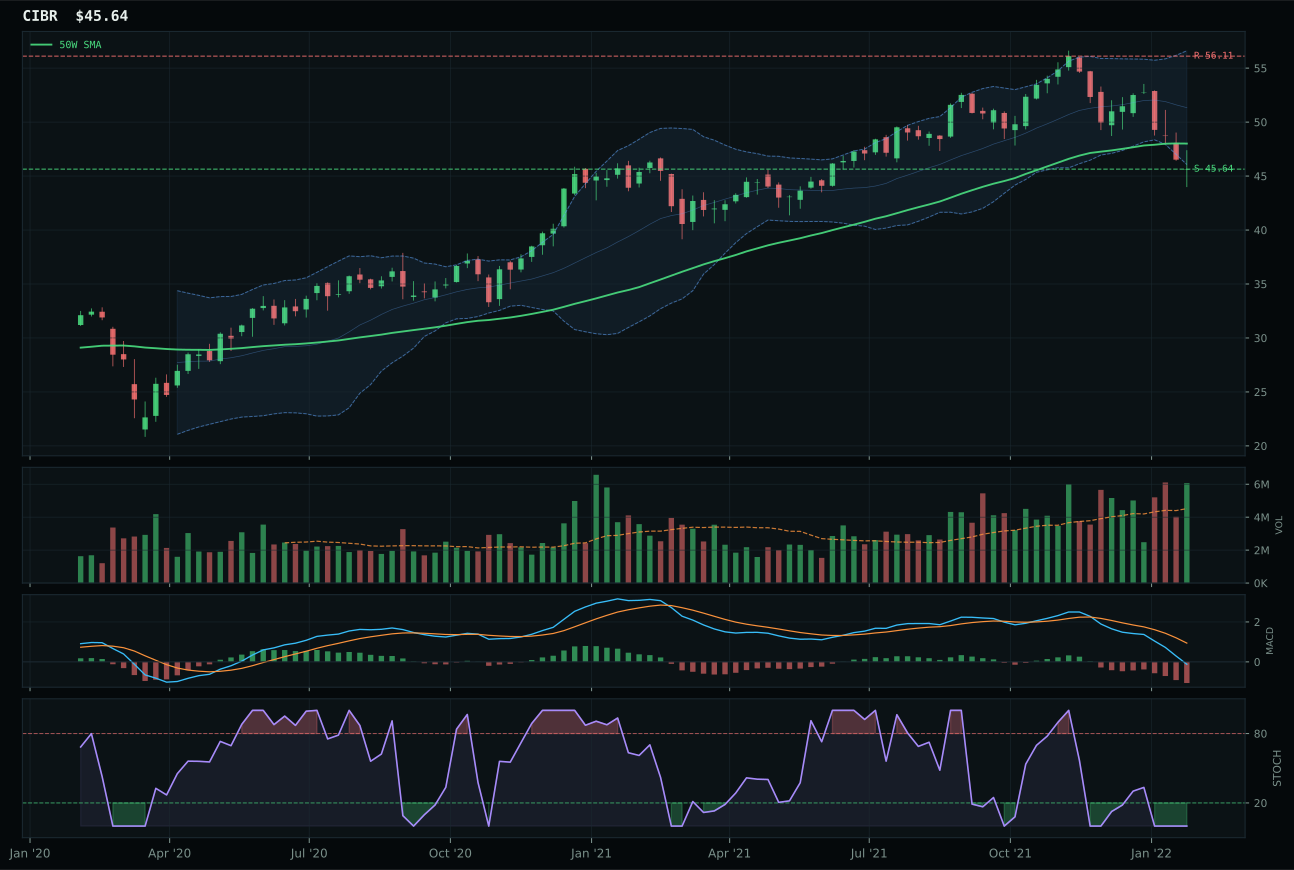
CIBR has a pullback into support profile with -11.7% 13-week relative strength versus SPY.
A failed hold above support would weaken the setup.
Actionable but governed by invalidation levels.
XLK captured the Technology category with a clean pullback-into-support setup that offered defined risk and meaningful accumulation underneath. The 13.3% category-relative strength and 1.6% SPY-relative outperformance demonstrate that growth equity rotation is selecting profitable technology over the distressed software cohort, where IGV has collapsed 18.3% relative to the broad market over 13 weeks. XLK's timing score of 100.0 reflects its position just 4.3% from the 50-week moving average with stochastic RSI turning up from oversold and MACD weakening but in a controlled manner—a classic mean-reversion entry rather than a chase. Volume at 2.14x the 20-week average confirms accumulation is sponsoring the bounce, and the risk-reward setup offers 4.2% downside to the defined support level against 9.7% of remaining upside to the 87.44 resistance, making this a three-to-one opportunity cost in favor of the bear.
Technology earned only a 5% allocation slot because its category score of 39.5 ranks among the weaker half of the portfolio—macro fit is merely neutral at 50.0 and technical evidence scores only 62.4 out of 100. The active descriptor set (liquidity expansion helping, inflation pressure and dollar weakness hurting) does not provide the asymmetric tailwind necessary to justify top-two positioning in a transition regime. XLK's extended pullback and negative 13-week returns signal that the sector rotation away from growth is structural, not cyclical, and the allocation acknowledges the setup without betting the portfolio on a reversal that could reverse itself. This category remains eligible and technically sound, but its macro fit and peer category rankings make it subordinate to energy, metals, and other real-asset exposures where scarcity and inflation are driving persistent outflows from liquidity-dependent growth.
Defense & Aerospace — ITA
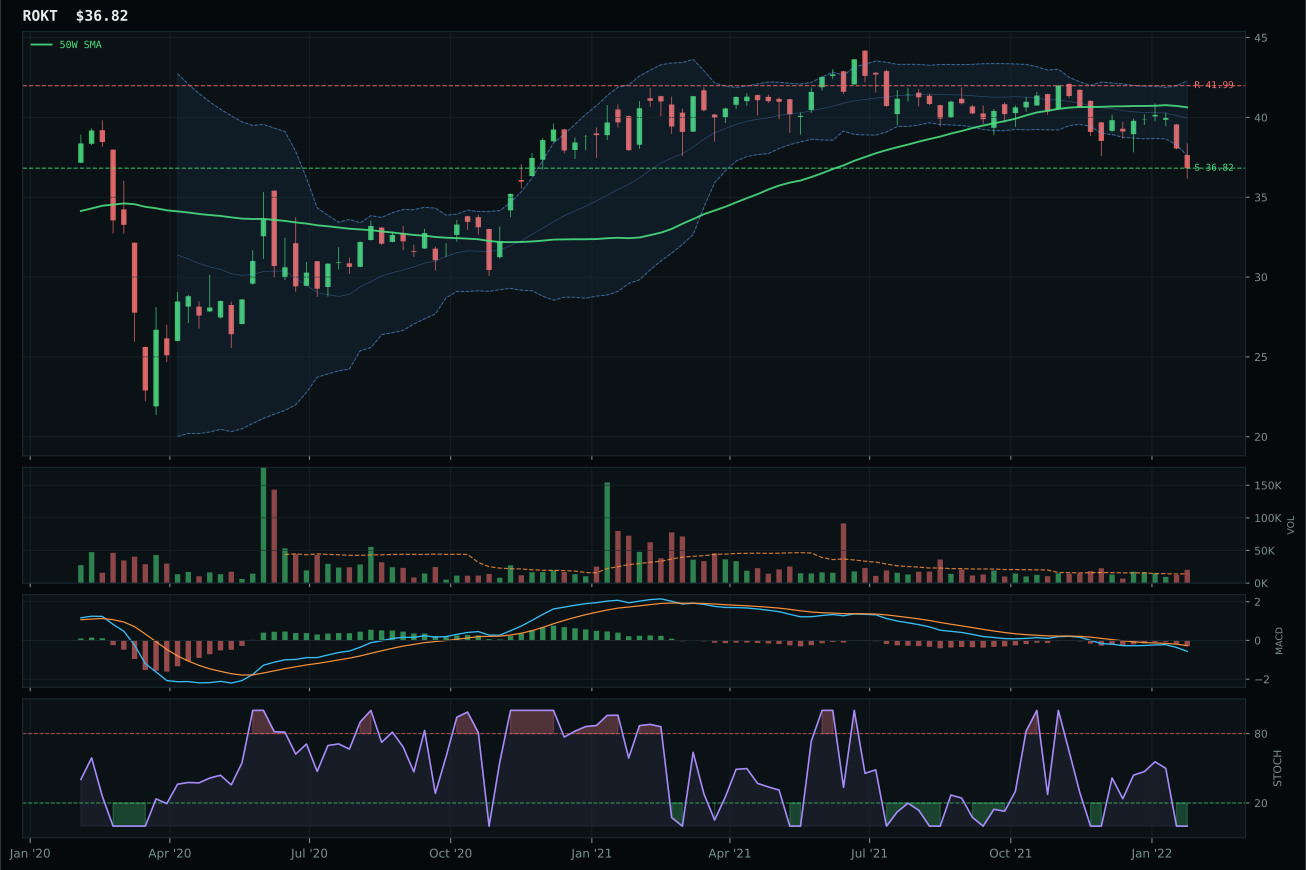
ROKT has a pullback into support profile with -5.0% 13-week relative strength versus SPY.
A failed hold above support would weaken the setup.
Tracked, but not top-2 eligible because: .
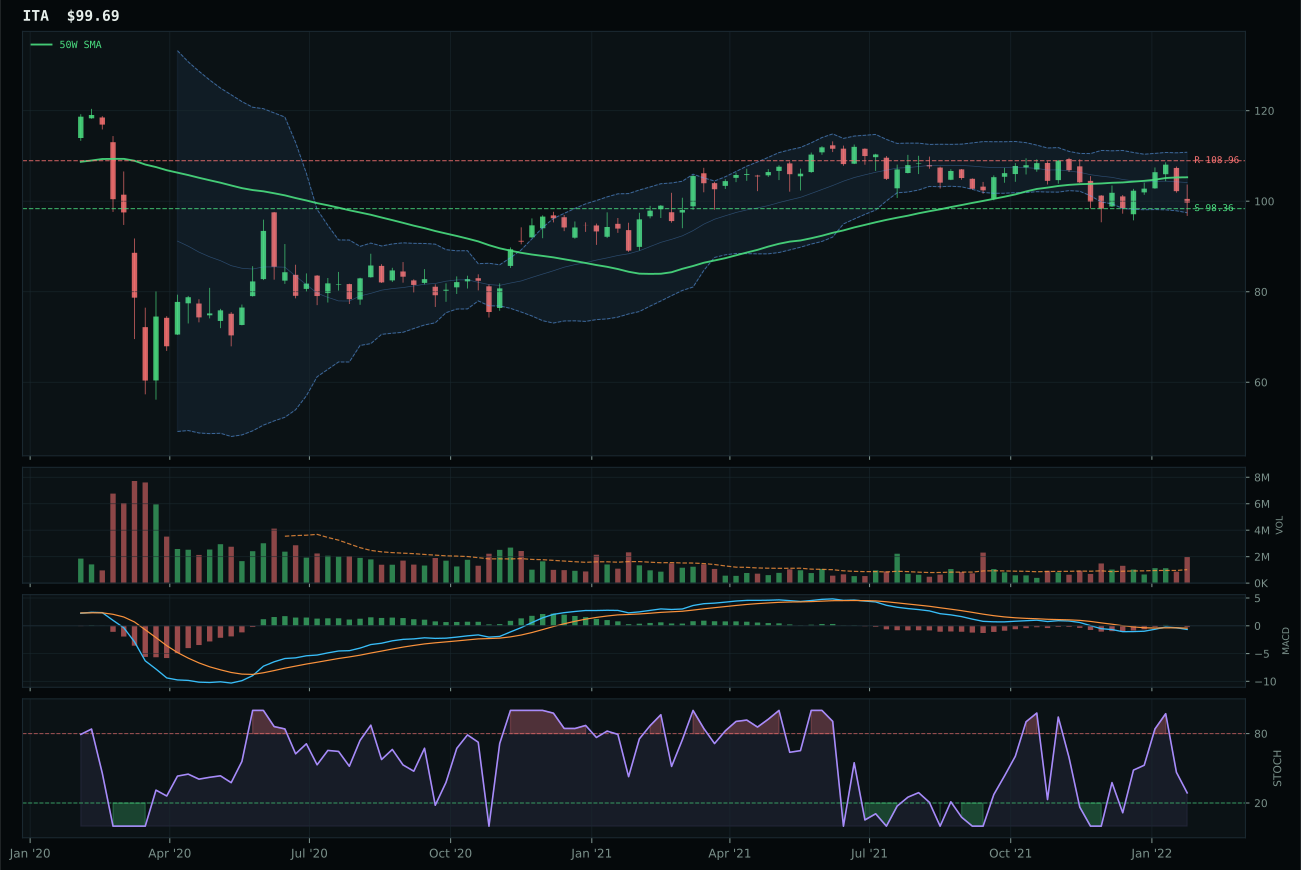
ITA has a pullback into support profile with -0.8% 13-week relative strength versus SPY.
A failed hold above support would weaken the setup.
Actionable but governed by invalidation levels.
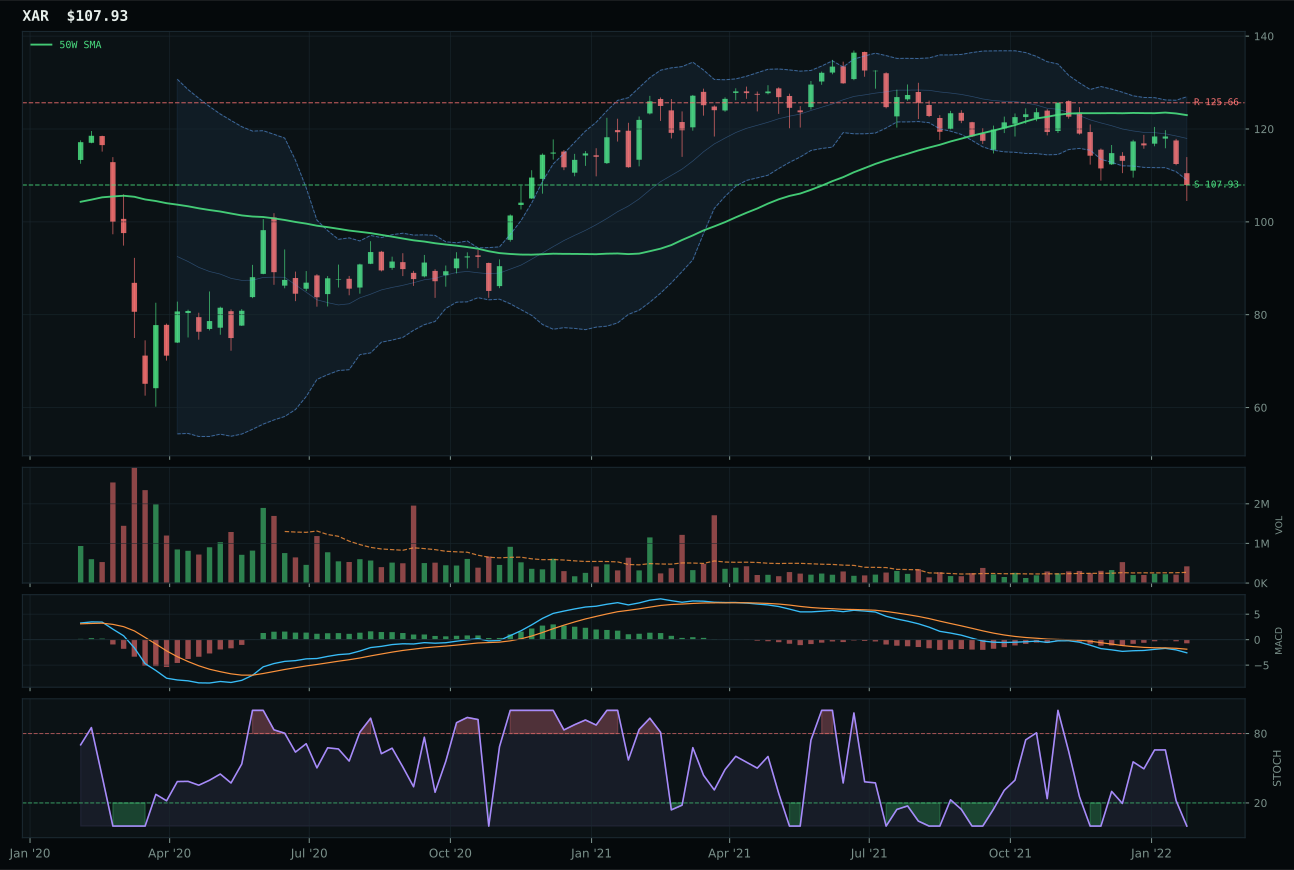
XAR has a pullback into support profile with -5.8% 13-week relative strength versus SPY.
A failed hold above support would weaken the setup.
Actionable but governed by invalidation levels.
ITA wins Defense & Aerospace with a 76.8 trend score and 92.0 timing score that reflects both structural durability and tactical entry precision. Price sits 5.3% below the 50-week moving average at the 0.618 Fibonacci retracement level with MACD bearish but improving and stochastic RSI in neutral territory—a setup that does not signal desperation but rather orderly consolidation. ITA's 4.2% category-relative strength lead over ROKT demonstrates that defense primes are outperforming space and aerospace growth, a critical distinction in a regime where cash flow and earnings visibility matter more than upside optionality. The risk-reward score of 90.0 is built on 1.4% downside to defined support at 98.36 against 8.5% upside to resistance at 108.96, while volume at 1.93x the 20-week average confirms the dislocation is being absorbed rather than rejected. The 4.6% gap between ITA's composite 76 score and ROKT's 23 reflects a decisive category victory.
Defense & Aerospace earned only 5% despite a category score of 37.0 because the macro tailwinds are conditional rather than structural. The category-level macro fit of 68.0 is respectable, driven by active descriptors for defensive rotation, broad-market bear, and dollar pressure—all genuine supports for this group. However, these macro supports are shared with Precious Metals (72.0) and Utilities (64.0), which offer better timing mechanics and less stretched valuations. ITA's technical evidence of 33.9 out of 100 is solid for a downtrending sector, but it lags the leaders in overall category strength. The sector holds because geopolitical risk and supply constraints provide genuine fundamental support, and ITA's setup offers reasonable risk-reward for tactical entry, but the allocation stays modest because ITA itself trades near fair value rather than distress, and competing defensive exposures (utilities, gold, staples) offer better macro fit and cheaper entry mechanics in the same market environment.
Agriculture & Livestock — MOO
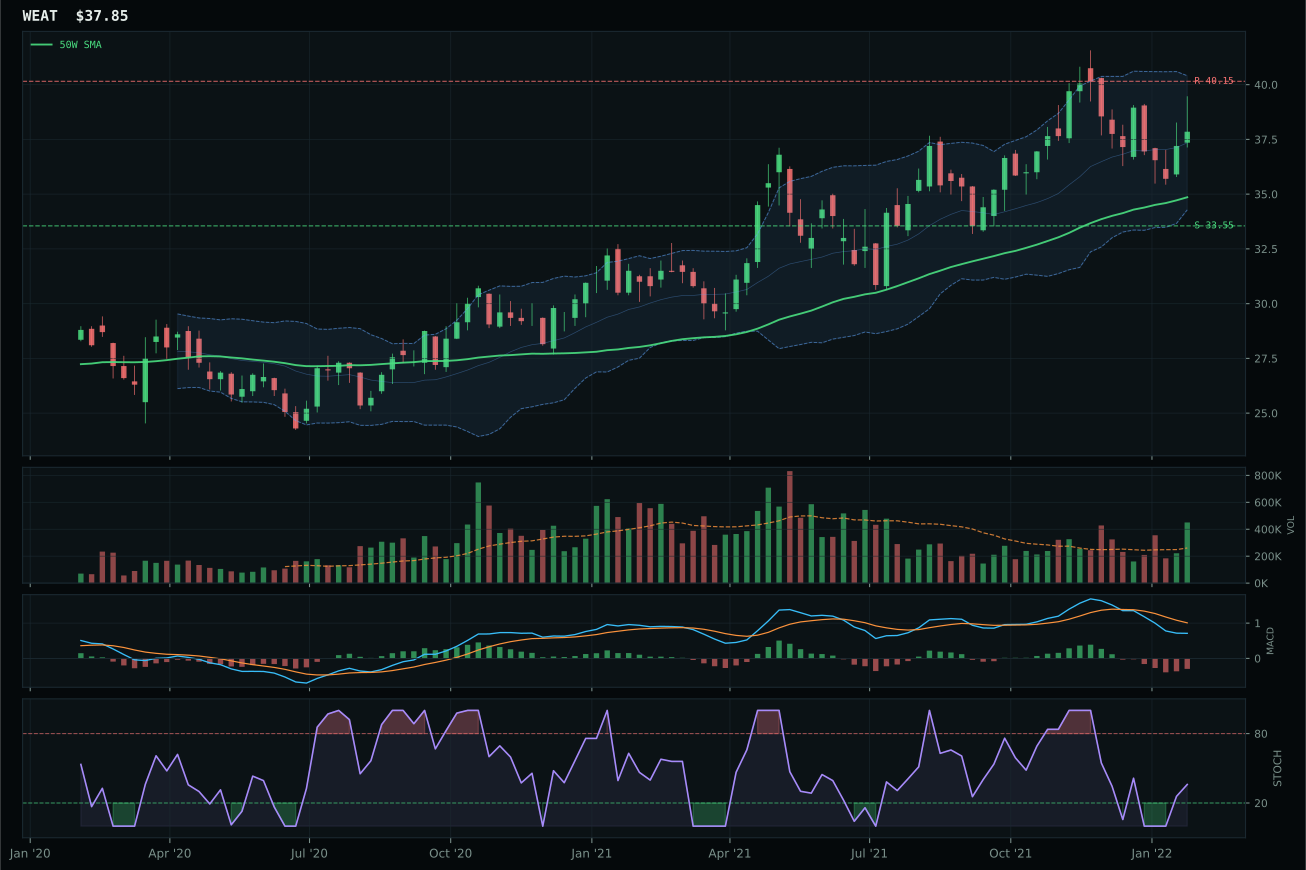
WEAT has a neutral structure profile with 4.3% 13-week relative strength versus SPY.
A failed hold above support would weaken the setup.
Tracked, but not top-2 eligible because: .
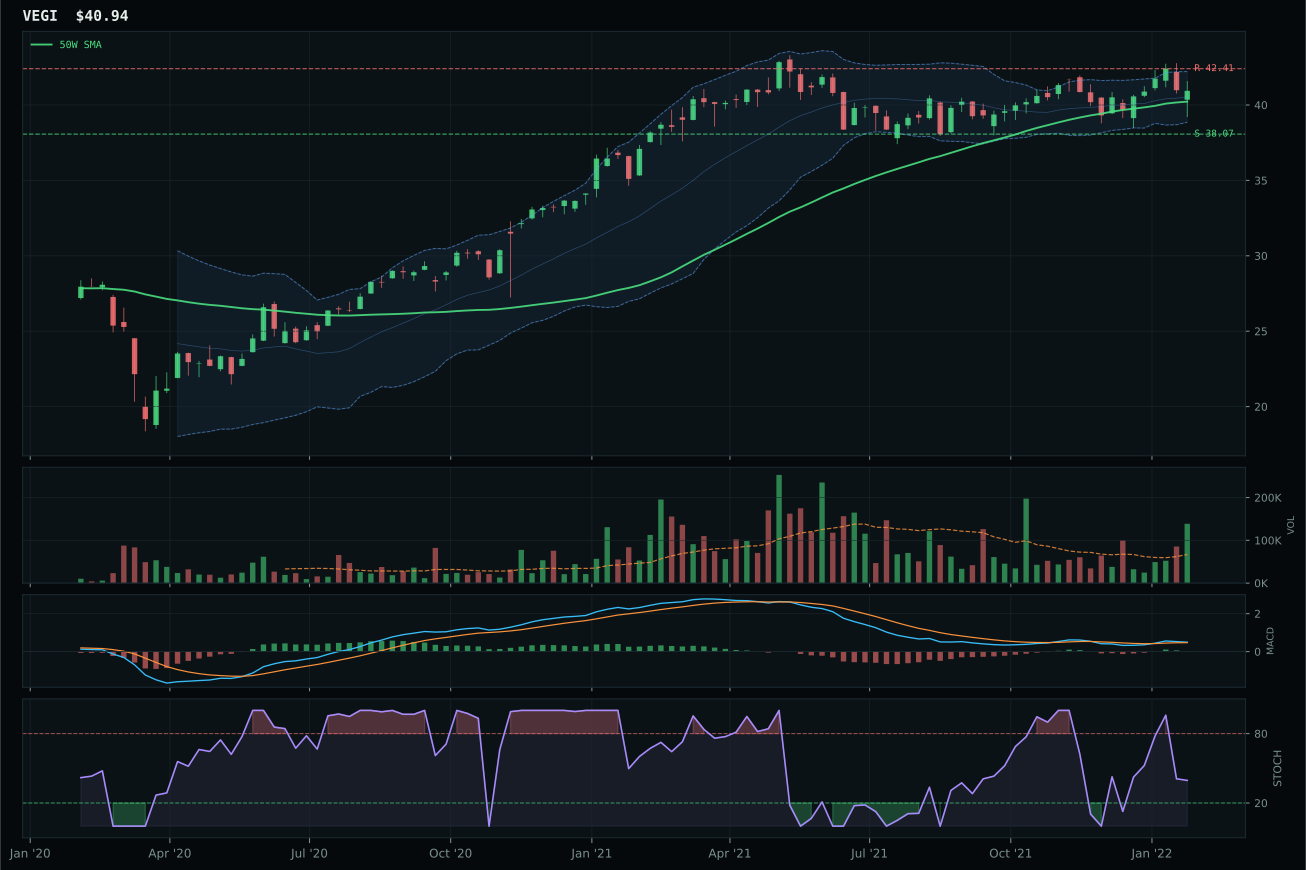
VEGI has a compression near 50W profile with 4.8% 13-week relative strength versus SPY.
A failed hold above support would weaken the setup.
Tracked, but not top-2 eligible because: .
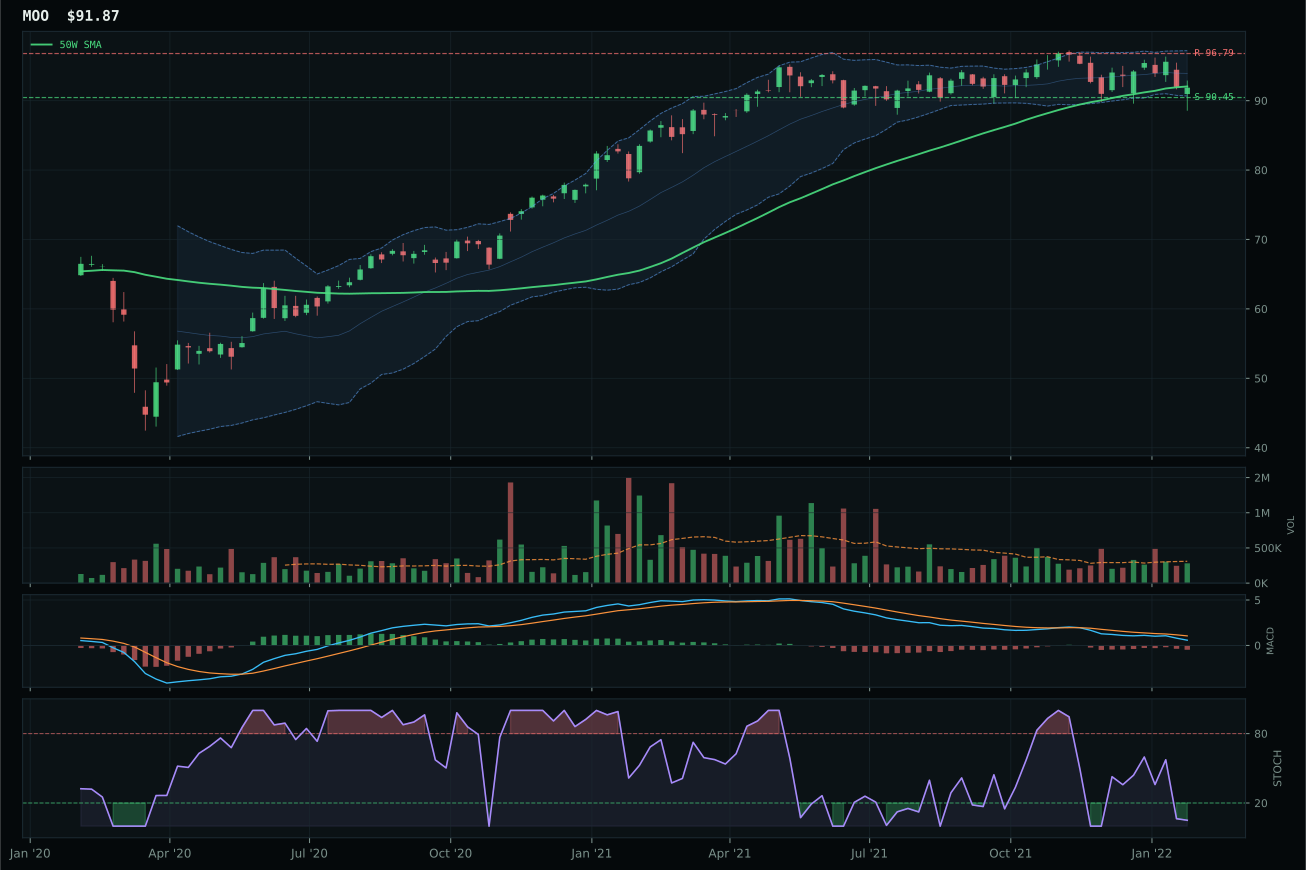
MOO has a pullback into support profile with -0.2% 13-week relative strength versus SPY.
A failed hold above support would weaken the setup.
Actionable but governed by invalidation levels.
MOO claimed the Agriculture category by a razor-thin margin over WEAT, winning on timing (95.0 vs 78.0) and risk-reward (90.0 vs 58.0) despite WEAT's superior technical evidence of 45.0 versus MOO's 14.2. MOO sits nearly flush with the 50-week moving average (–0.2% distance) at the 0.236 upper Fibonacci retracement with stochastic RSI at deep oversold (0.05), creating a setup where buyers are testing support without panic selling yet evident. WEAT, by contrast, trades 8.6% above its 50-week line in neutral structure, which removes the defined invalidation area that makes MOO's entry mechanically superior. Both face headwinds from neutral volume and weak momentum (MOO's 4-week return is –3.7%, WEAT's is better at +0.5%), but MOO's pullback-into-support configuration offers a cleaner risk-controlled entry with just 1.6% downside versus WEAT's extended setup and poor risk-reward ratio of 58.0.
Agriculture earned 5% allocation despite a 36.6 category score that ties with Defense and trails significantly behind Industrial Metals and Traditional Energy. The macro fit is excellent at 86.0—supply shortage, inflation pressure, real-asset sponsorship, and commodity breadth are all working in favor of this exposure. Nevertheless, the technical evidence across the three-ETF basket (VEGI, WEAT, MOO) is weak at just 14.2 for the winner, reflecting a sector in transition where macro support has not yet translated into genuine leadership. Volume is neutral, momentum is poor, and the -4.0% 13-week return shows that agricultural commodities are not yet participating in the resource rally. The allocation holds because the macro case is real and the setup is reasonable, but the category ranks behind precious metals (47.5), industrial metals (60.0), and energy (89.4) where buyers are actually showing up. This becomes a long-term strategic position in commodities and inflation hedges rather than a short-term tactical trade, justified by the macro story but capped at 5% pending better technicals.
Nuclear Energy — URA
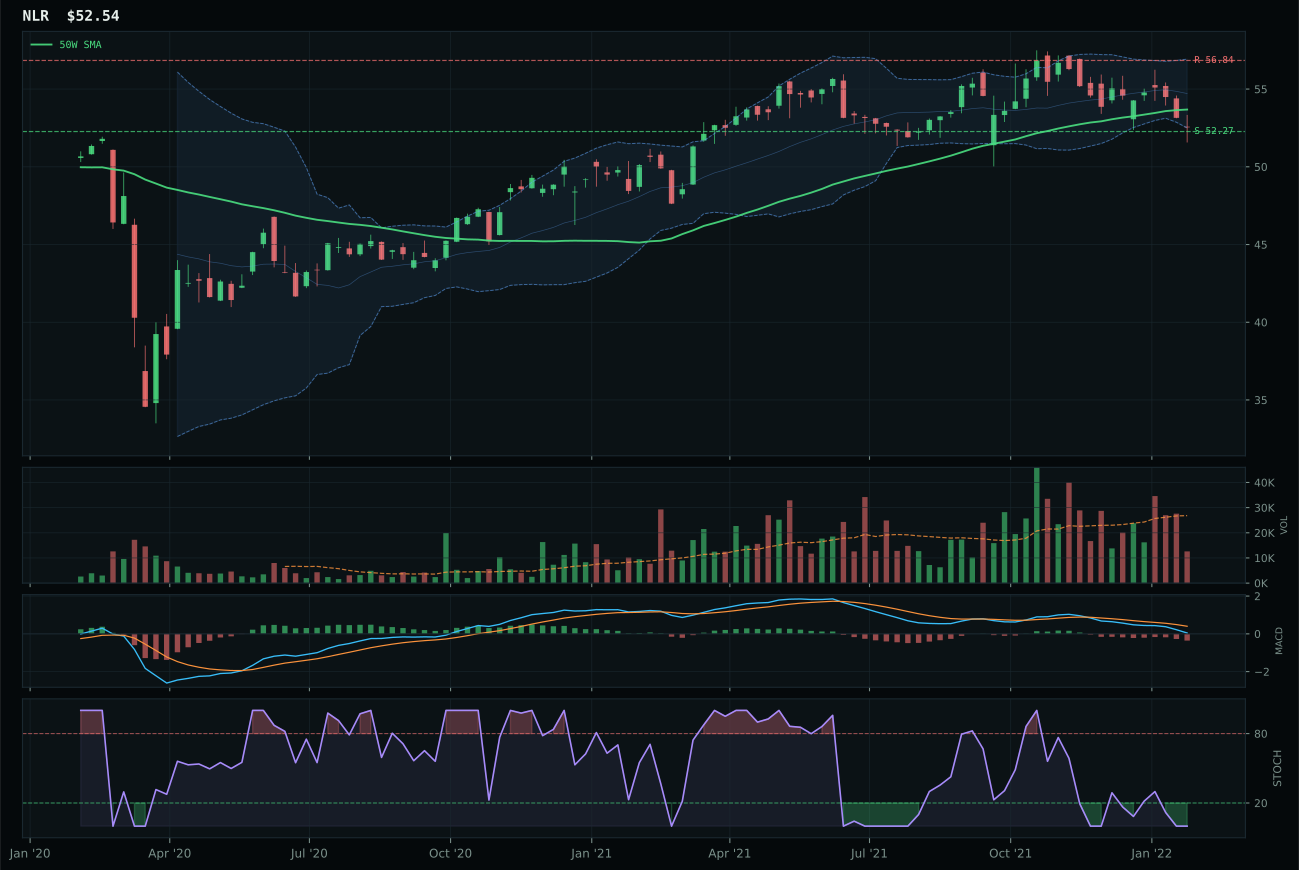
NLR has a pullback into support profile with -1.5% 13-week relative strength versus SPY.
A failed hold above support would weaken the setup.
Tracked, but not top-2 eligible because: .
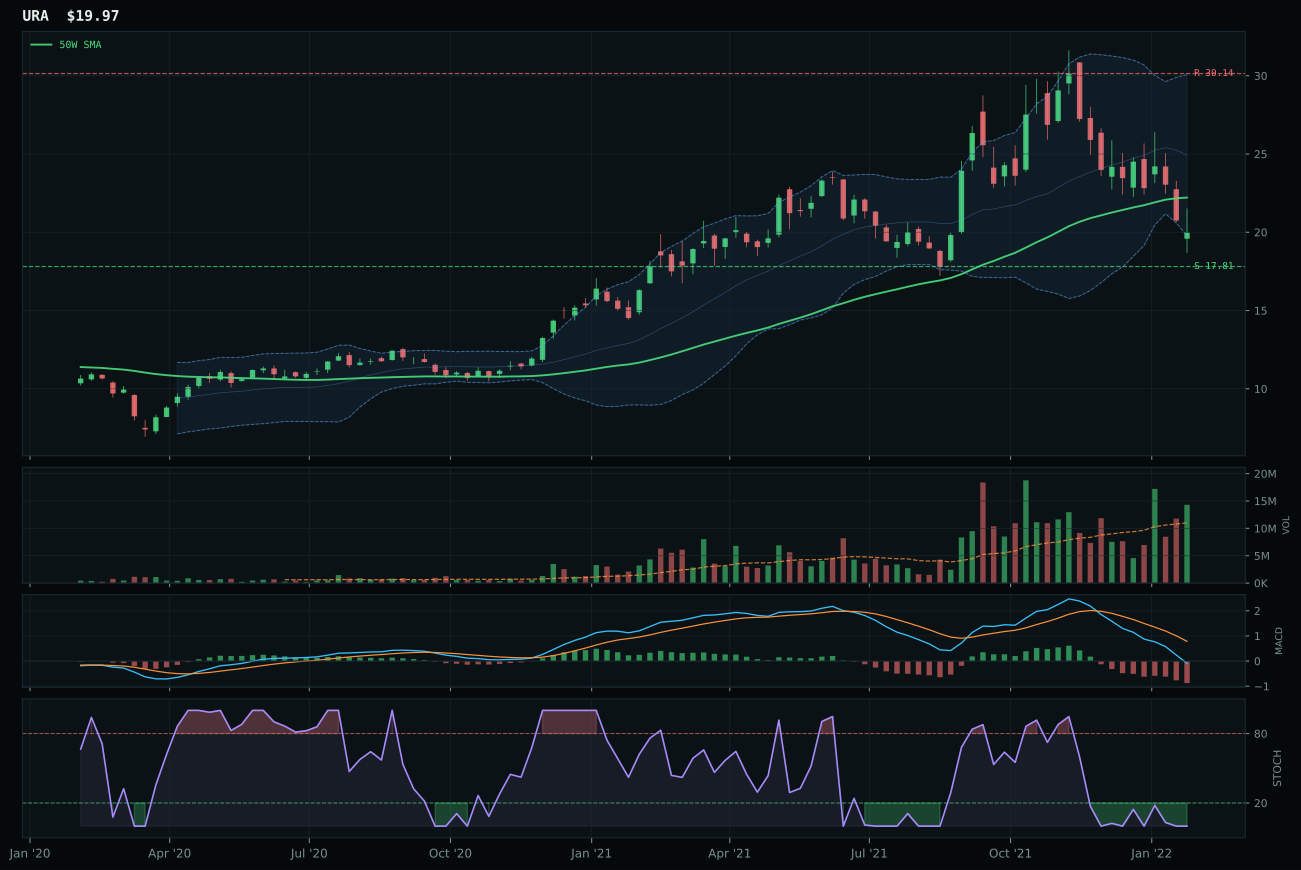
URA has a neutral structure profile with -21.9% 13-week relative strength versus SPY.
A failed hold above support would weaken the setup.
Actionable but governed by invalidation levels.
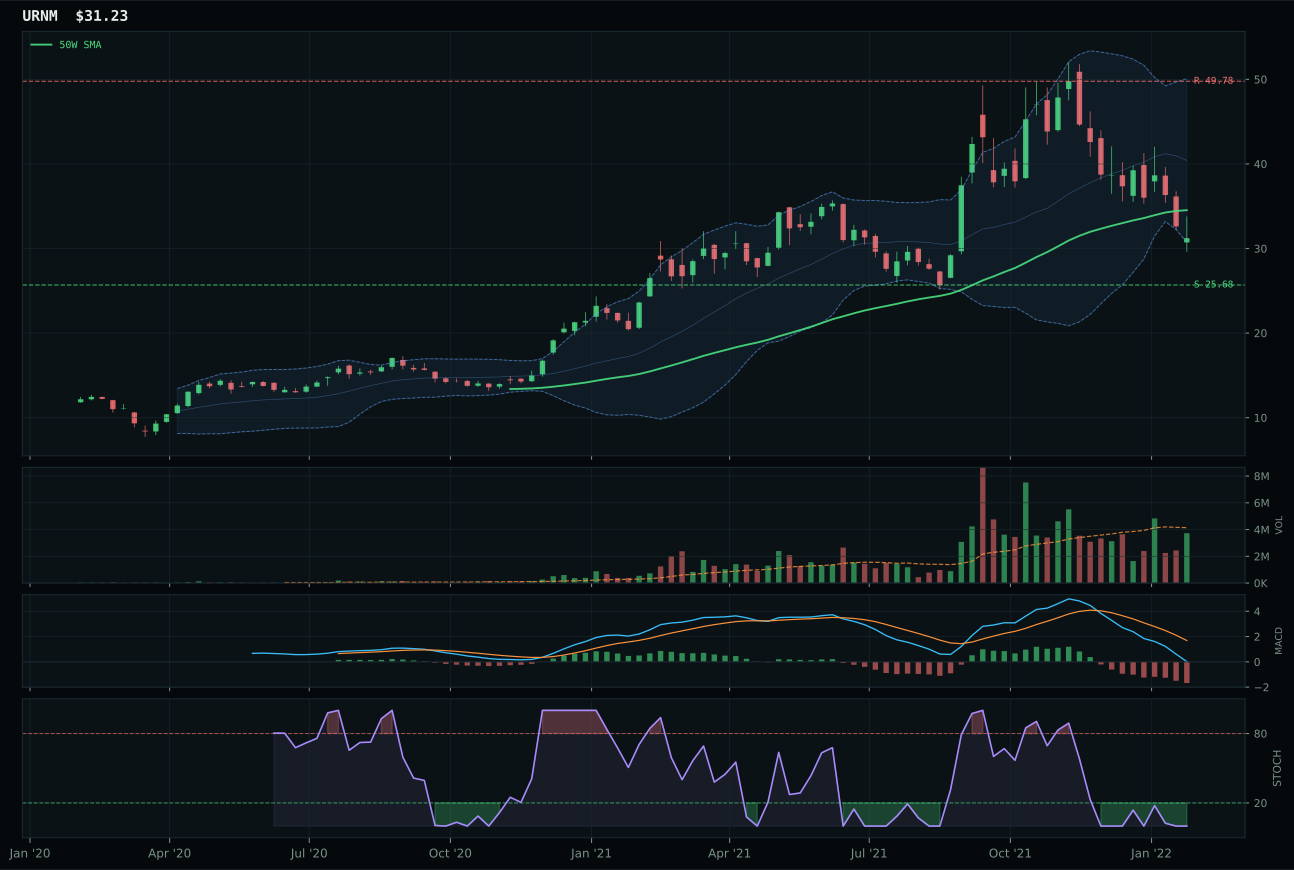
URNM has a neutral structure profile with -25.0% 13-week relative strength versus SPY.
A failed hold above support would weaken the setup.
Actionable but governed by invalidation levels.
URA won Nuclear Energy in a near-dead heat with NLR (score gap of 0.6 points), succeeding primarily through above-average volume participation (1.30x the 20-week average) in a setup that is otherwise neutral. URA's 13-week return of –25.7% and –21.9% SPY-relative weakness are severe, but the chart sits at the 0.618 deep Fibonacci retracement level with stochastic RSI at absolute oversold (0.00), creating value-trap potential if energy scarcity narratives extend into nuclear. The neutral structure setup (versus NLR's pullback into support) removes mechanical buy signals, making this more of a conviction macro play than a technical entry. NLR lost despite superior timing (100.0 vs 57.0) and better relative strength (–1.5% vs SPY, better than URA's –21.9%) because of thinner volume participation and a more compressed distance from the 50-week line (–2.1% vs –10.1%), which left NLR less oversold and thus less likely to ignite on reversal.
Nuclear earned 5% allocation despite a depressed 29.6 category score, making it among the weakest holdings but still worthy of exposure because the macro case (energy scarcity active at +9, real-asset sponsorship at +7) is legitimate and the deep oversold condition (–25.7% in 13 weeks) creates optionality if the scarcity narrative gains institutional conviction. The technical evidence of 13.4 is among the portfolio's weakest, and momentum confirmation at 0.0 reflects genuine distress selling rather than positive accumulation. What justifies the 5% slot is strictly macro: if energy supply becomes systemically constrained and nuclear power gains regulatory urgency or investment tailwind, URA offers leveraged exposure from deeply depressed levels. This is not a buy recommendation based on charts; it is a hedge position against a tail-case energy escalation scenario. The weak technical evidence and negative 13-week returns keep this small, but the macro descriptor profile and extreme valuation suggest holding versus complete exclusion. The allocation would increase to 10% only if energy scarcity descriptors intensify further or if the chart shows actual accumulation rather than continued distribution.
AI — SMH
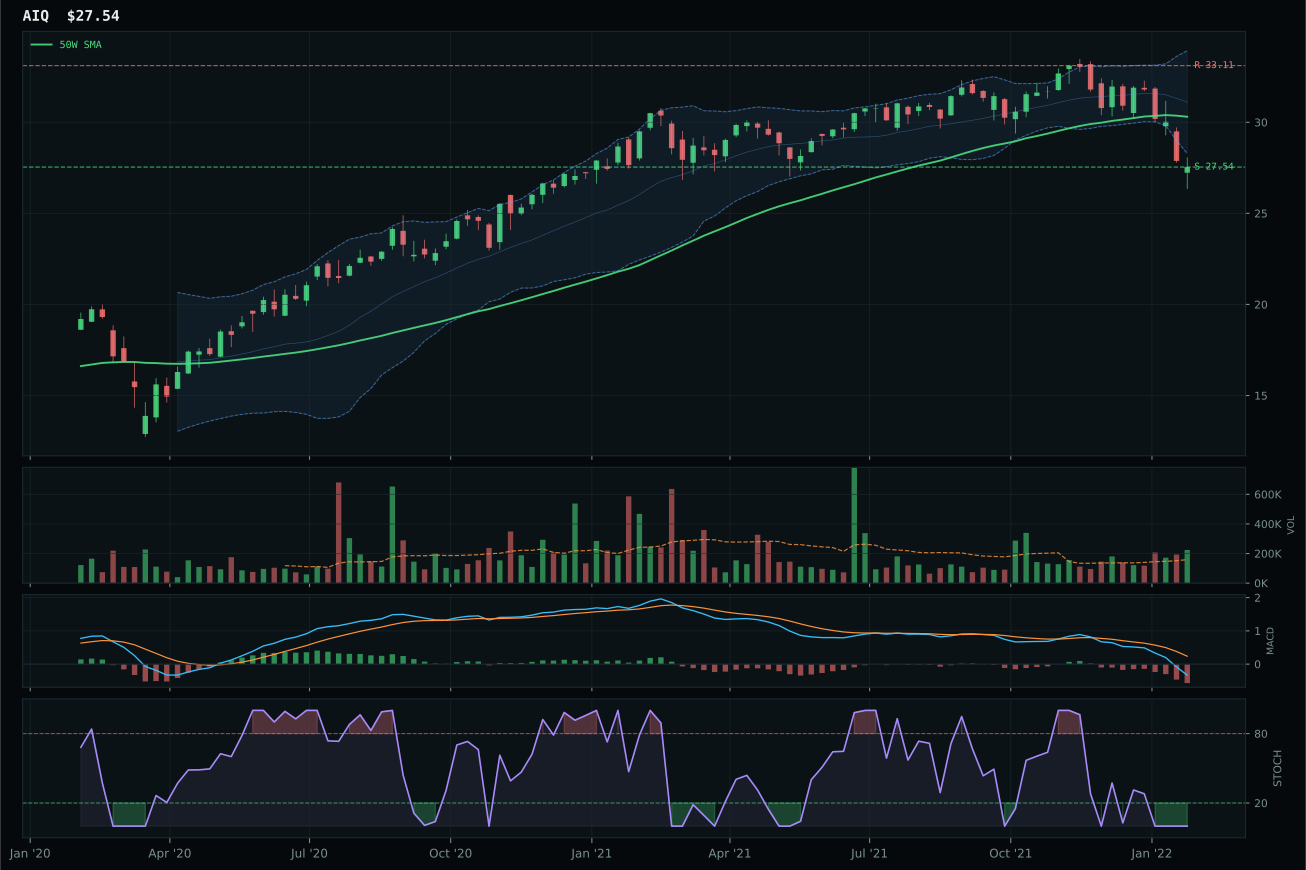
AIQ has a pullback into support profile with -9.4% 13-week relative strength versus SPY.
A failed hold above support would weaken the setup.
Tracked, but not top-2 eligible because: .
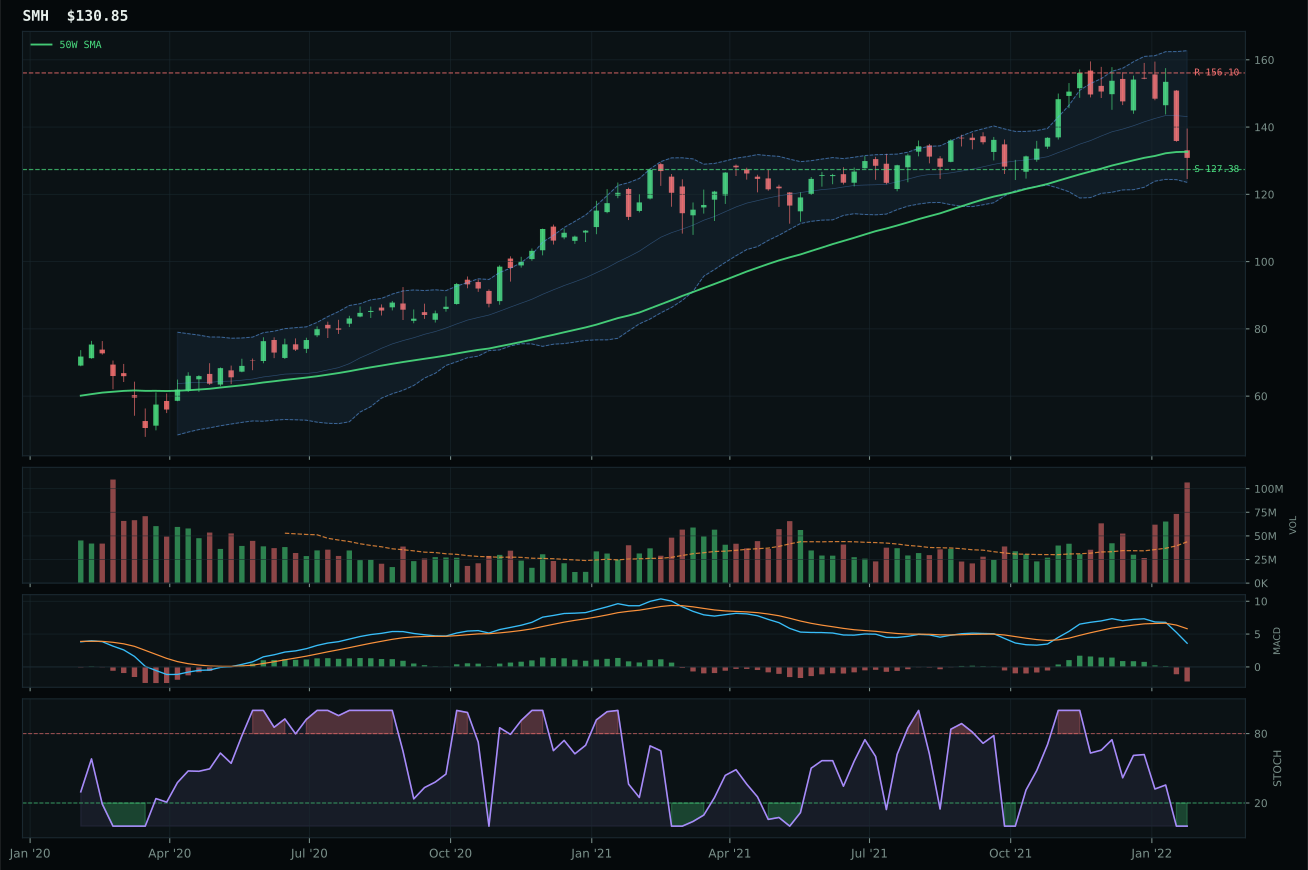
SMH has a pullback into support profile with -0.6% 13-week relative strength versus SPY.
A failed hold above support would weaken the setup.
Actionable but governed by invalidation levels.
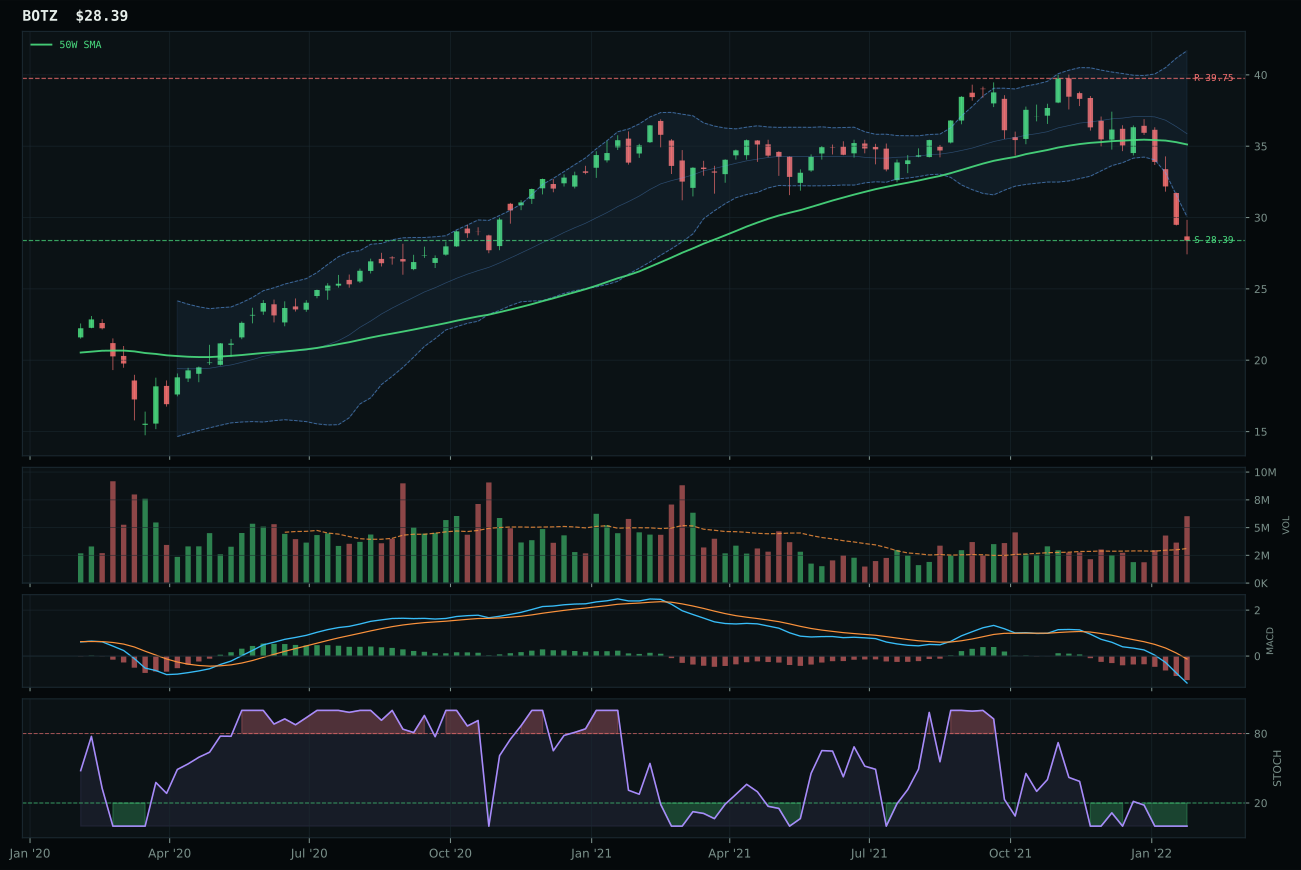
BOTZ has a pullback into support profile with -20.9% 13-week relative strength versus SPY.
A failed hold above support would weaken the setup.
Actionable but governed by invalidation levels.
SMH won the AI category not because of strong absolute momentum but because it offers the best blend of trend durability and timing precision within a deeply oversold cohort. The semiconductor representative is trading 1.4% below the 50-week moving average with stochastic RSI at absolute bottom (0.00) and MACD bearish but no longer deteriorating—a setup that offers lower entry risk than AIQ or BOTZ, both of which show worse category-relative strength and earlier stages of capitulation. SMH's 8.8% lead over the category median demonstrates that compute and infrastructure hardware is holding better than software breadth (AIQ) or robotics concepts (BOTZ), each down 13–25% over 13 weeks. Volume running at 2.44x the 20-week average suggests distribution pressure is being absorbed, and the 2.7% downside to 127.38 support gives the setup mechanical validity despite the sector's -0.6% 13-week return and negative positioning across the board.
AI receives zero allocation this week despite SMH posting a technical win, ranked 9th among the ten categories at a score of 24.5. The category suffers from a 48.0/100 macro fit because risk appetite is actively broken (-8) and broad market bear dynamics (-8) are working against speculative semiconductor and AI software exposure. Technical evidence came in at only 13.3/100 for SMH, meaning even the best setup in the category is fundamentally weak from a capital-flows perspective. The macro regime transition is actively punishing velocity stories; until either risk appetite stabilizes or the category produces compelling relative-strength evidence, holding any AI exposure would be fighting the regime rather than exploiting it. A sustained bounce in stochastic RSI paired with SPY-relative outperformance would be the entry signal to reconsider.
Emerging Markets — INDA
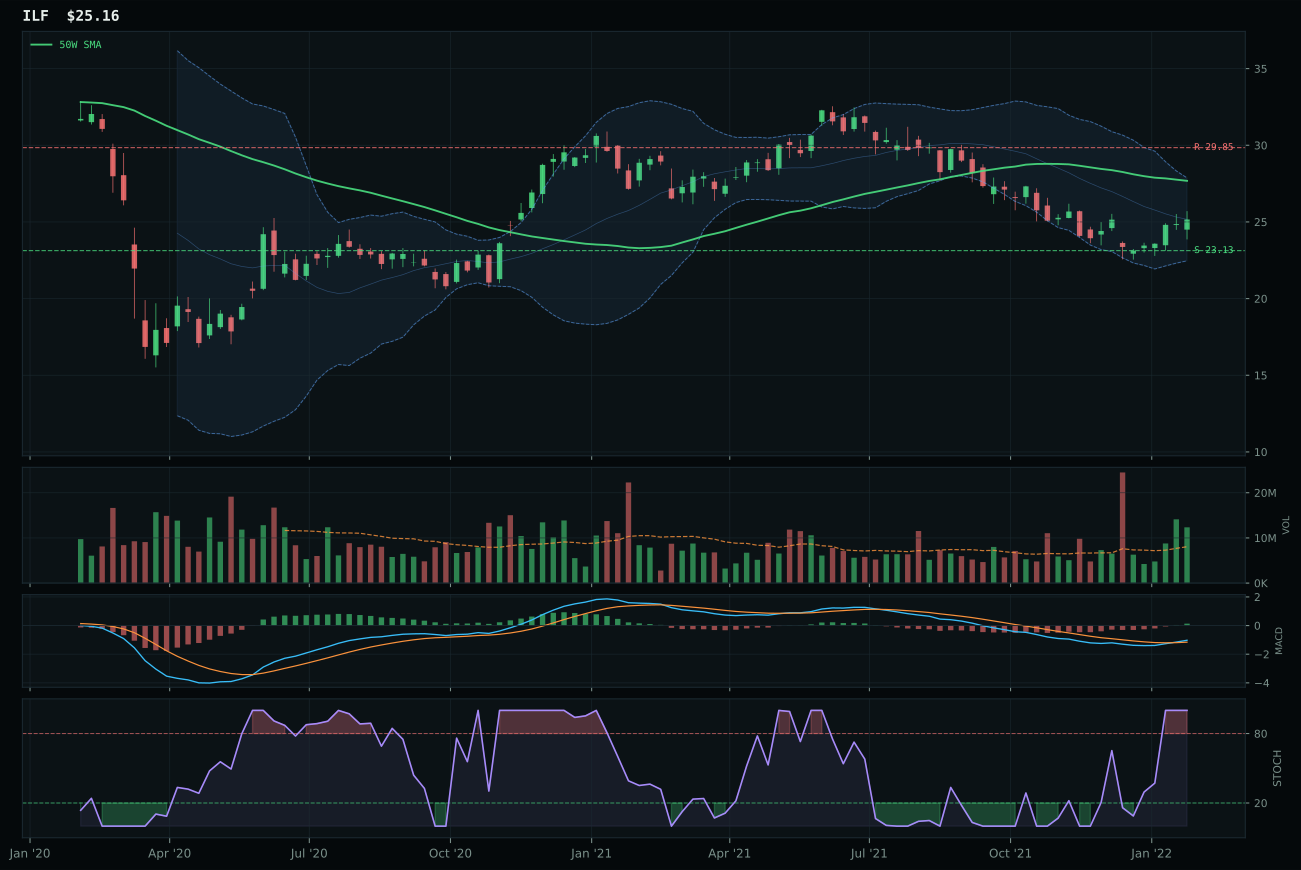
ILF has a neutral structure profile with 4.1% 13-week relative strength versus SPY.
Extension and support failure are the main tactical risks.
Tracked, but not top-2 eligible because: structurally broken.
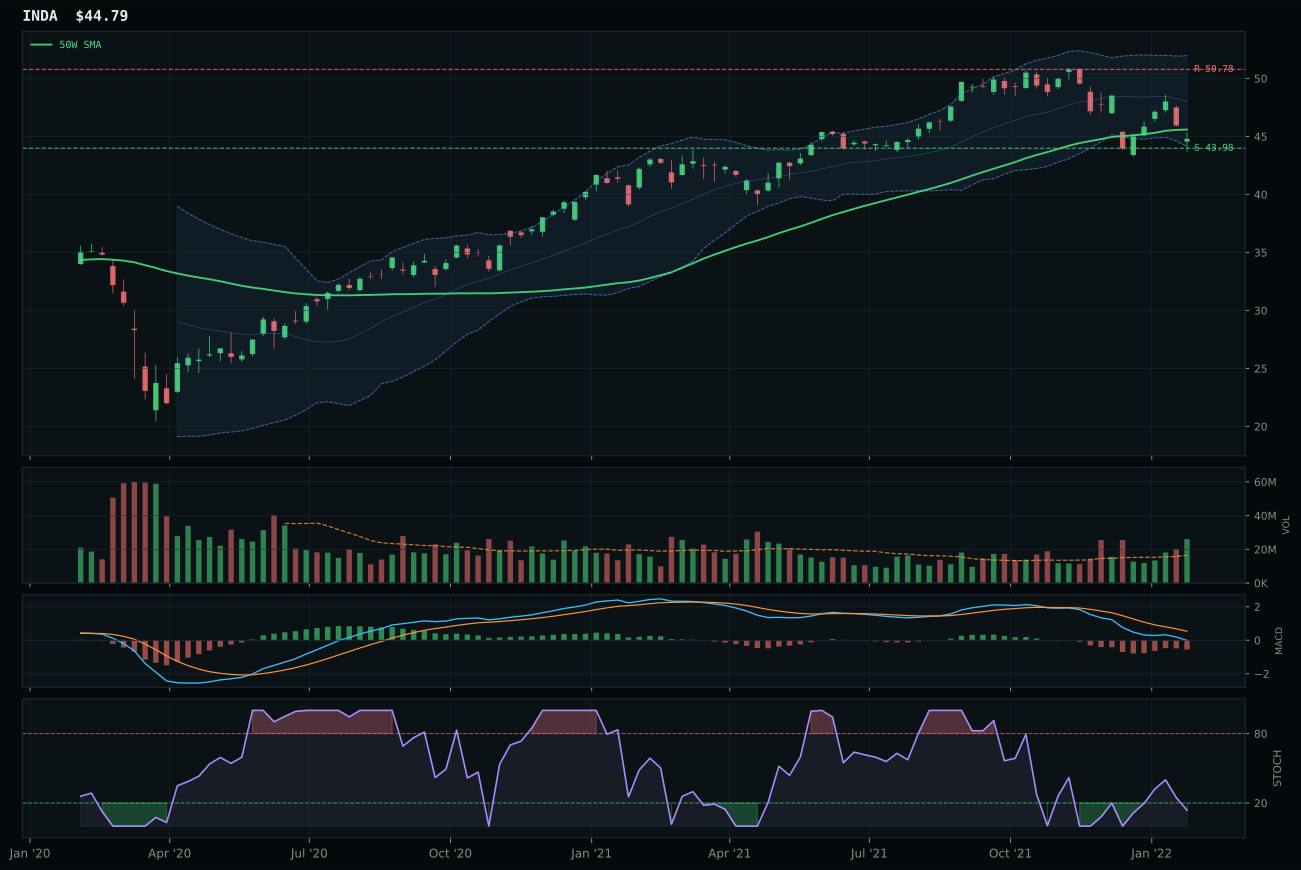
INDA has a pullback into support profile with -4.5% 13-week relative strength versus SPY.
A failed hold above support would weaken the setup.
Actionable but governed by invalidation levels.
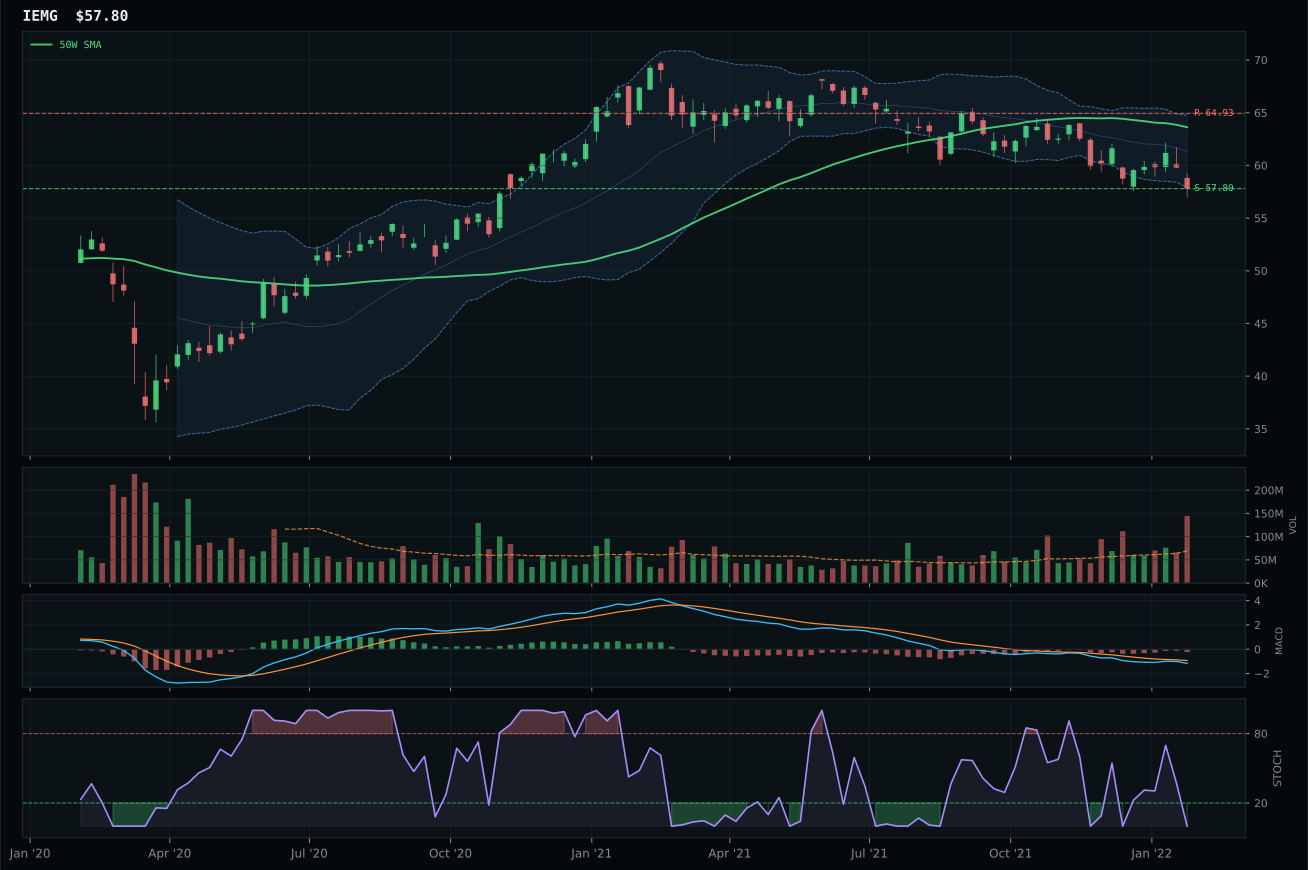
IEMG has a pullback into support profile with -3.6% 13-week relative strength versus SPY.
A failed hold above support would weaken the setup.
Actionable but governed by invalidation levels.
INDA captured Emerging Markets with a 65 composite score versus ILF's 43, winning on structure cleanliness and timing precision rather than absolute momentum. INDA sits just 1.8% below the 50-week moving average at the 0.500 Fibonacci middle retracement with stochastic RSI at oversold (0.14) and MACD bearish but improving—a setup that offers clarity on invalidation at 43.98 support. ILF's neutral structure and overbought stochastic reading eliminate the defined technical entry point, even though ILF's 13-week return of +0.3% and +4.1% SPY-relative strength are superior to INDA's –8.3% and –4.5%. The category-relative strength of INDA at –0.9% versus ILF's +7.7% suggests that India growth is underperforming Latin America commodity, yet INDA's timing score of 100.0 versus ILF's 75.0 reveals that INDA offers a cleaner entry into the oversold condition. Volume at 1.58x the 20-week average confirms distribution pressure is manageable.
Emerging Markets received zero allocation this week, ranked 9th of 10 categories at an 8.2 score, with macro conditions actively hostile. Dollar pressure is active at -14 descriptor weight (the single largest negative signal in the system), broad market bear at -9, reflecting a regime where strong dollar flows capital away from EM risk. Category-level macro fit scored 35.0/100, the lowest in the portfolio. INDA's technical timing (100.0) cannot overcome systematic headwinds where the U.S. dollar strengthens, pushing foreign asset values lower both in absolute and relative terms. The 18.2/100 INDA technical proof order reflects this: even the strongest EM setup is fundamentally weak. Until dollar-pressure descriptor flips inactive or broad-market risk appetite restores, this entire category remains outside the allocation framework. A break above 50.78 resistance with momentum would be the first credible signal to reassess.