
2022-01-21
Informational purposes only. The content in this report, including allocations, analysis, and commentary, is provided solely for informational and educational purposes. It does not constitute financial advice, investment advice, trading advice, or any other type of advice. Past performance does not guarantee future results. Always conduct your own research and consult a qualified financial professional before making investment decisions.
Weekly Allocation
| Ticker | Category | Weight | Role |
|---|---|---|---|
| XLE | Traditional Energy | 20% | Top-2 (20%) |
| GLD | Precious Metals | 20% | Top-2 (20%) |
| COPX | Industrial Metals | 10% | Tier-2 (10%) |
| IGF | Utilities & Infrastructure | 10% | Tier-2 (10%) |
| ITA | Defense & Aerospace | 10% | Tier-2 (10%) |
| XLK | Technology | 10% | Tier-2 (10%) |
| MOO | Agriculture & Livestock | 10% | Tier-2 (10%) |
| URA | Nuclear Energy | 10% | Tier-2 (10%) |
Trade Instructions — Monday Open
Sell the tranche from 2021-12-24 (completing its 4-week hold). Buy the new tranche. Instructions show net portfolio changes — same-asset positions cancel, weight changes show the delta.
| Action | Ticker | Instruction |
|---|---|---|
| SELL | FBTC | Sell 50% of FBTC position (reduce 25.00% → 12.50%) |
| SELL | XLU | Sell 33% of XLU position (reduce 3.75% → 2.50%) |
| SELL | XAR | Sell entire XAR position (1.25% of portfolio) |
| SELL | SMH | Sell 50% of SMH position (reduce 2.50% → 1.25%) |
| BUY | XLE | Buy XLE — 15.38% of freed cash (adds 2.50% to portfolio) |
| BUY | GLD | Buy GLD — 23.08% of freed cash (adds 3.75% to portfolio) |
| BUY | MOO | Buy MOO — 7.69% of freed cash (adds 1.25% to portfolio) |
| BUY | URA | Buy URA — 7.69% of freed cash (adds 1.25% to portfolio) |
| BUY | XLK | Buy XLK — 15.38% of freed cash (adds 2.50% to portfolio) |
| BUY | ITA | Buy ITA — 15.38% of freed cash (adds 2.50% to portfolio) |
| BUY | IGF | Buy IGF — 15.38% of freed cash (adds 2.50% to portfolio) |
Current Portfolio After Trade
Combined holdings across all 4 active tranches. Each tranche is 25% of the portfolio.
| Ticker | % of Portfolio | Weight Bar |
|---|---|---|
| COPX | 15.00% | |
| FBTC | 12.50% | |
| XLE | 12.50% | |
| GLD | 11.25% | |
| IGF | 10.00% | |
| MOO | 8.75% | |
| ITA | 8.75% | |
| XLK | 6.25% | |
| URA | 5.00% | |
| INDA | 3.75% | |
| XLU | 2.50% | |
| CIBR | 2.50% | |
| SMH | 1.25% |
Macro Regime — Transition / Mixed
Macro Evidence Charts
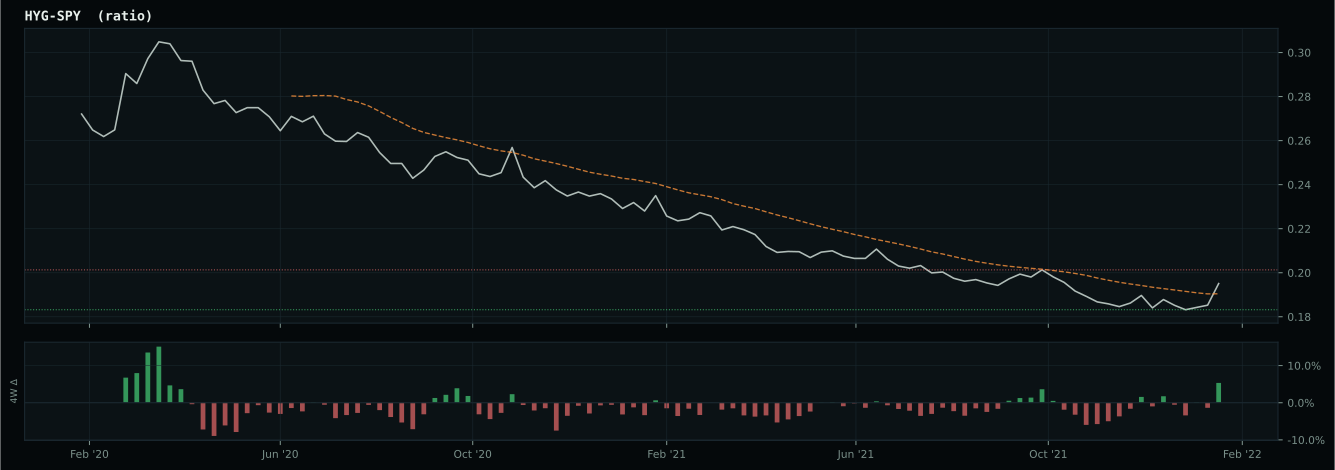
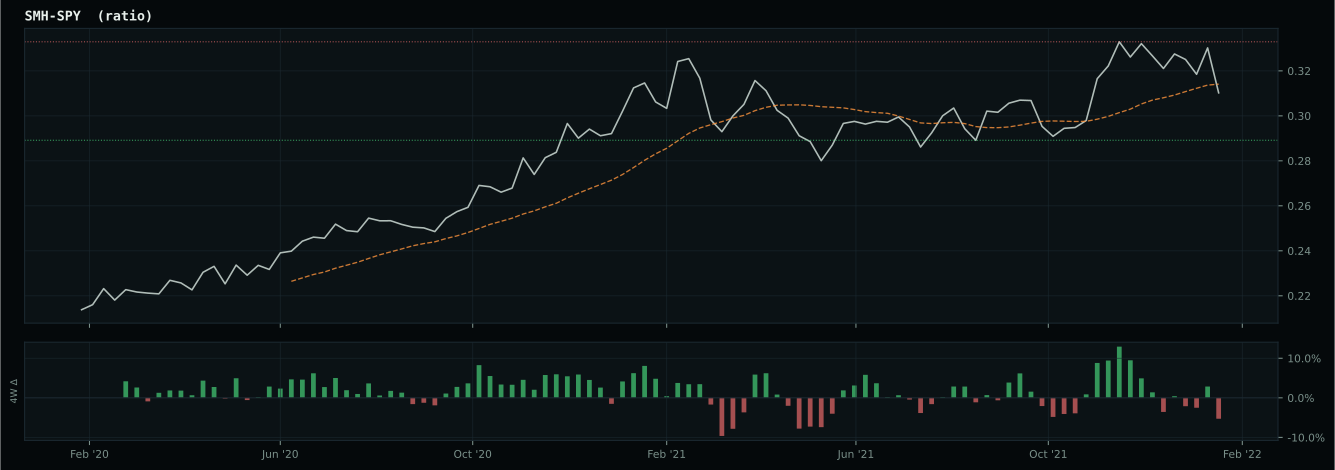
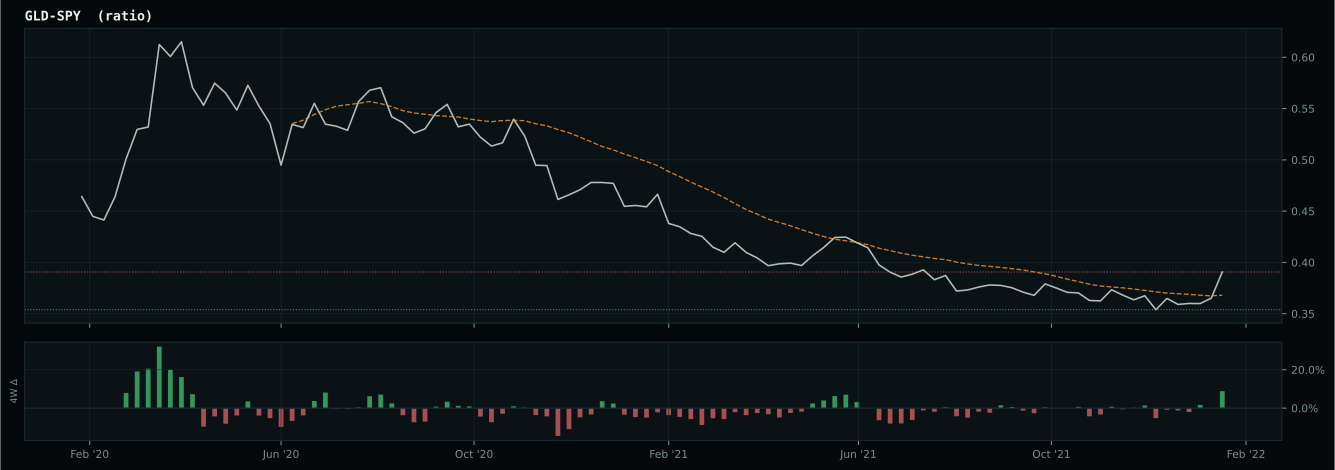
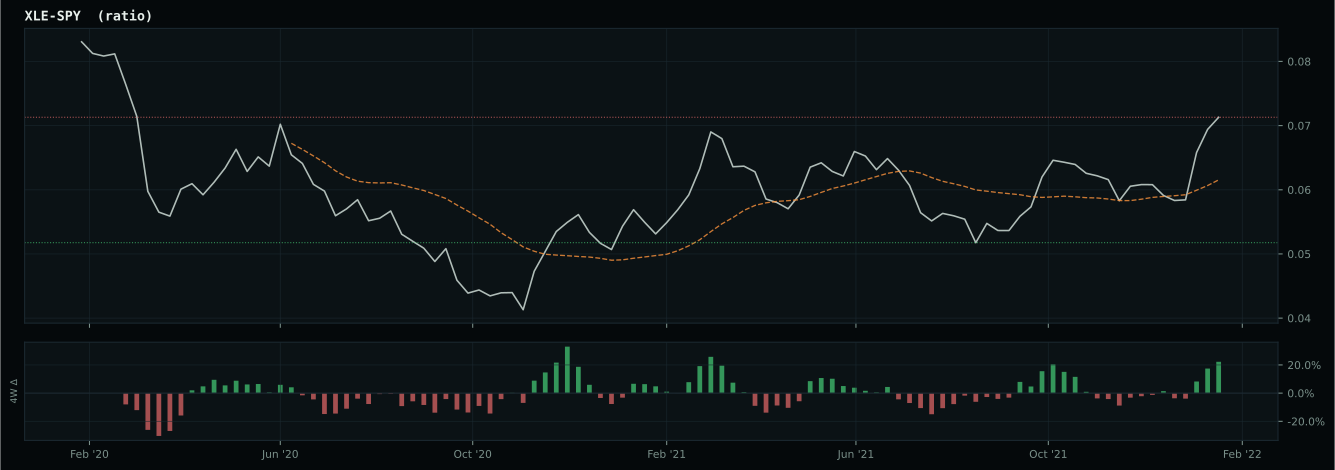
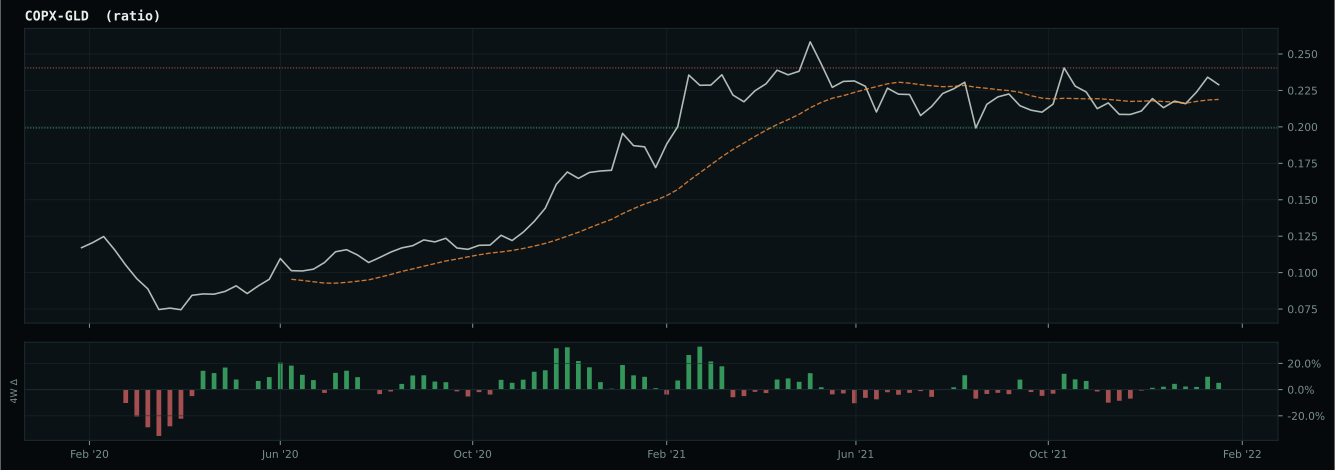
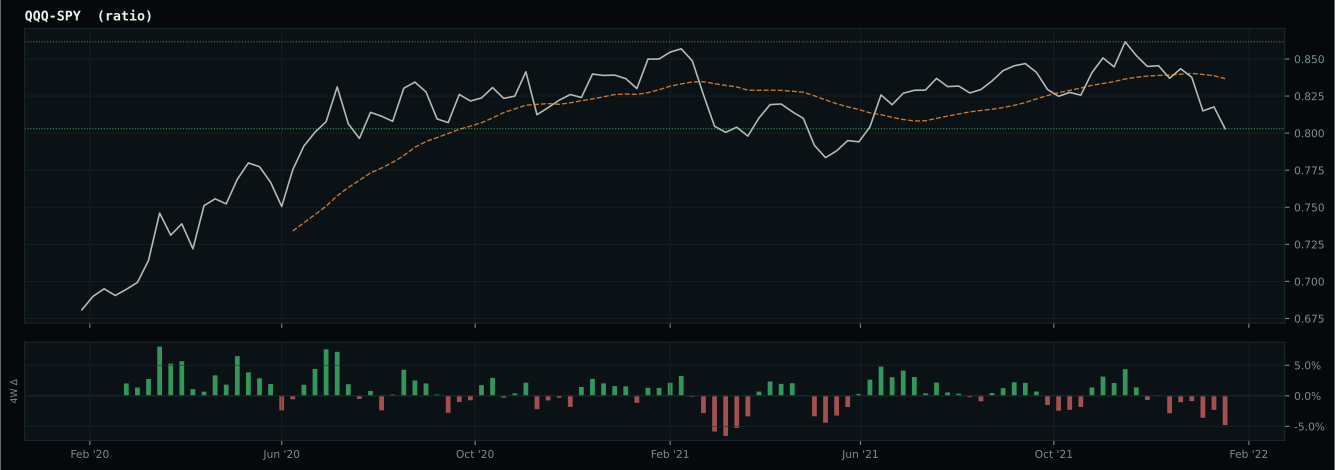
Market-implied signals behind the macro regime scores. Each ratio compares two assets; the direction and slope of the ratio is what the macro engine reads.
Crypto Regime — NoCrypto
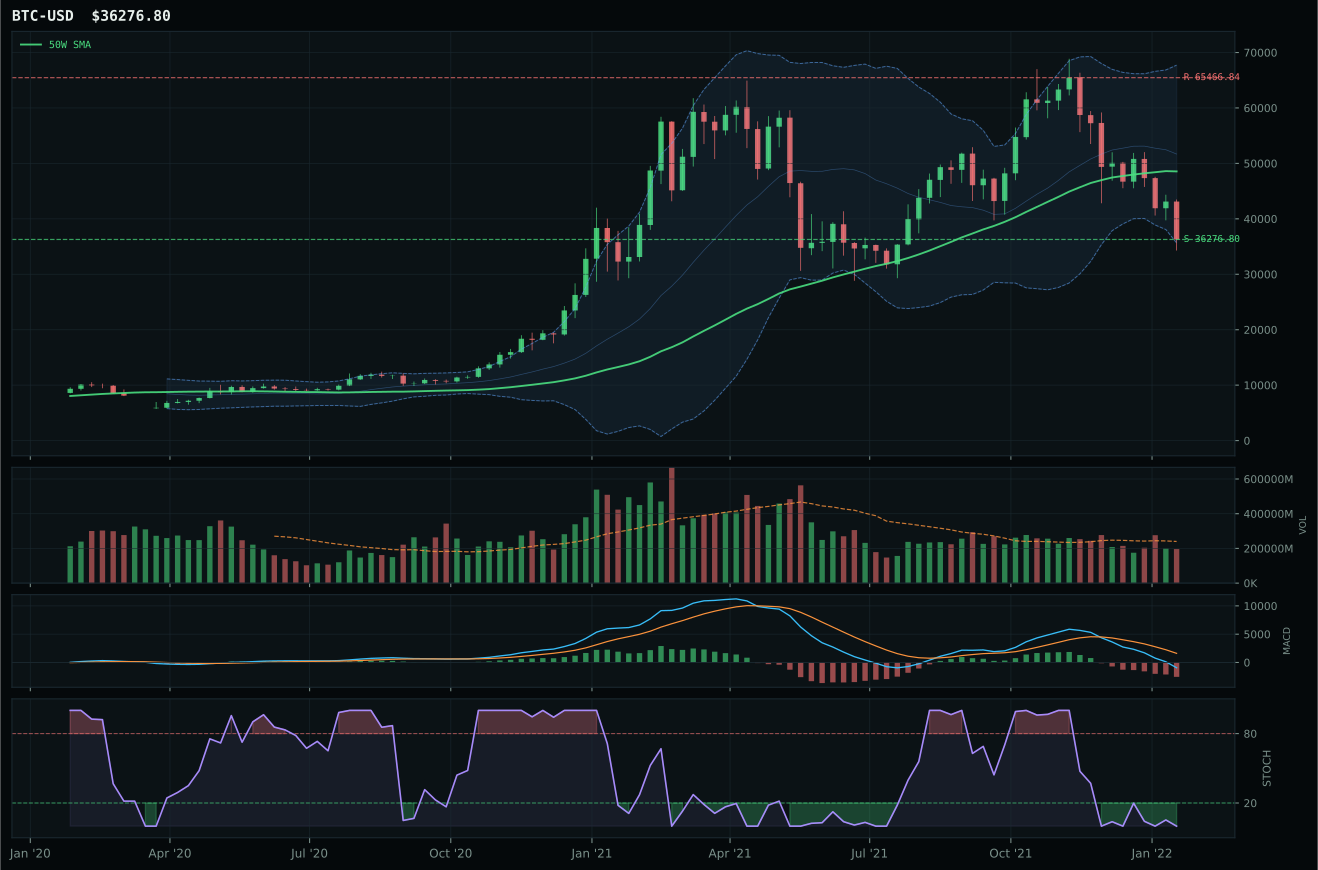
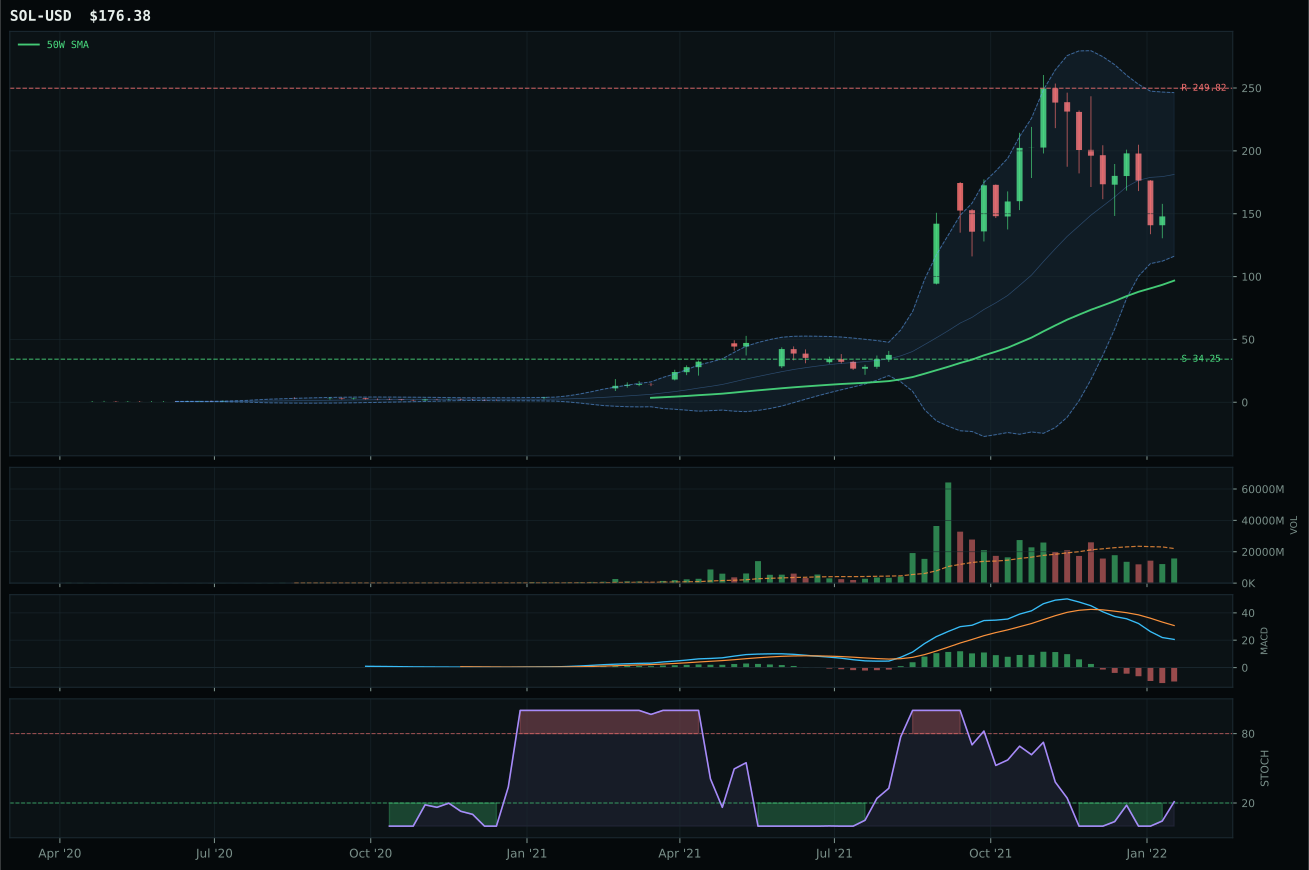
ValueBTC not armed: BTC has not made the first post-breakdown touch of the 200W buy zone after losing the 50W
TrendBTC not confirmed
one or more available conditions failed
Category Rankings
| Rank | Category | Winner | Score | Alloc | 4W Ret | Peers (4W) |
|---|---|---|---|---|---|---|
| 1 | Traditional Energy | XLE | 78.5 | 20% | +14.99% | XOP +15.4% · FCG +17.7% |
| 2 | Precious Metals | GLD | 73.6 | 20% | +3.43% | SLV +1.7% · GDX +9.9% |
| 3 | Industrial Metals | COPX | 70.1 | 10% | +8.34% | PICK +8.3% · REMX +3.8% |
| 4 | Utilities & Infrastructure | IGF | 60.3 | 10% | +1.87% | XLU -3.3% · PAVE +2.1% |
| 5 | Defense & Aerospace | ITA | 44.4 | 10% | +3.82% | XAR +1.7% · ROKT -1.5% |
| 6 | Technology | XLK | 42.4 | 10% | -0.61% | CIBR +0.3% · IGV -2.0% |
| 7 | Agriculture & Livestock | MOO | 42.2 | 10% | +3.74% | VEGI +4.4% · WEAT +4.4% |
| 8 | Nuclear Energy | URA | 33.8 | 10% | +5.92% | NLR -0.7% · URNM +4.5% |
| 9 | AI | SMH | 33.7 | 0% | -1.47% | AIQ -3.4% · BOTZ -0.6% |
| 10 | Emerging Markets | INDA | 25.3 | 0% | -0.29% | IEMG -0.3% · ILF +8.6% |
Traditional Energy — XLE
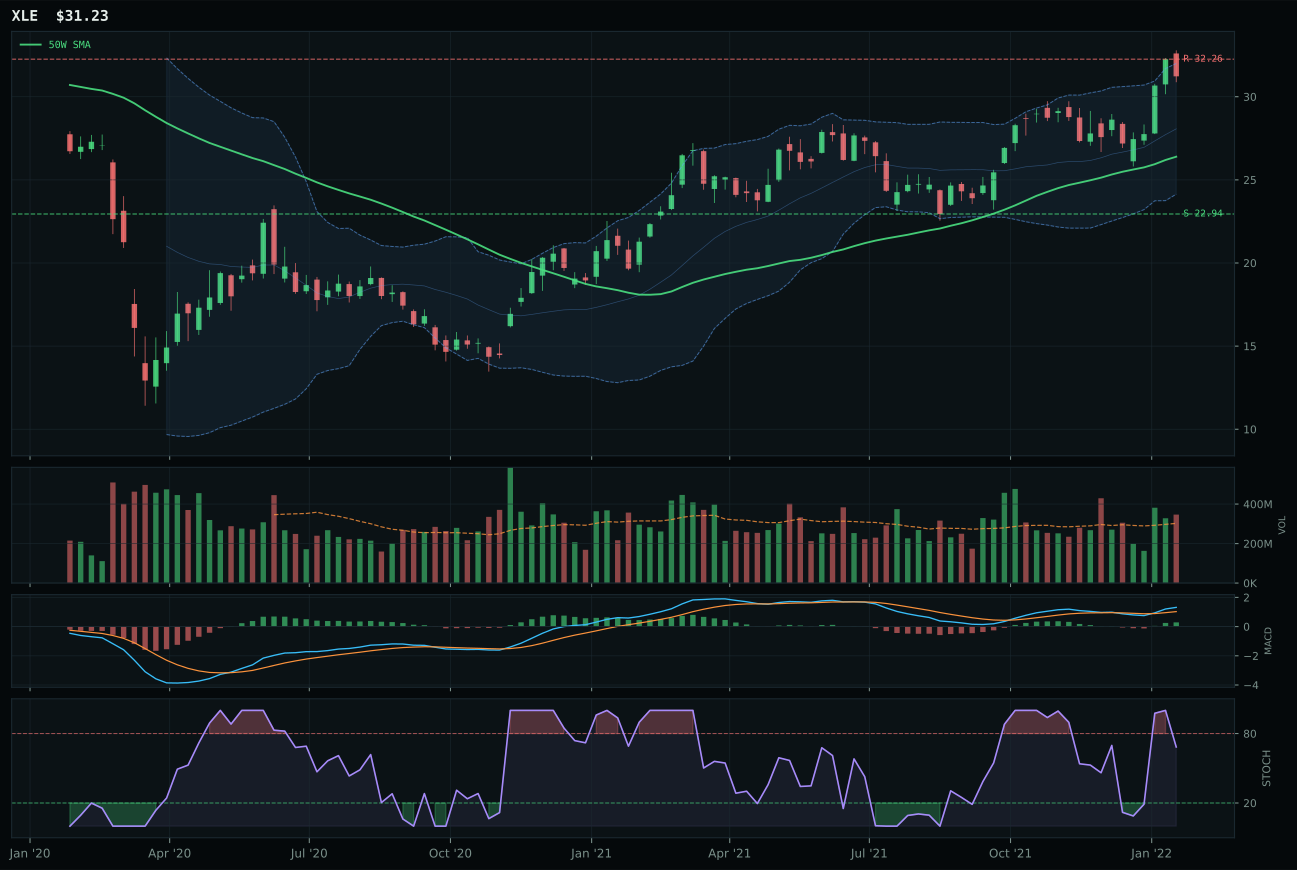
XLE has a vertical extension profile with 11.1% 13-week relative strength versus SPY.
A failed hold above support would weaken the setup.
Actionable but governed by invalidation levels.
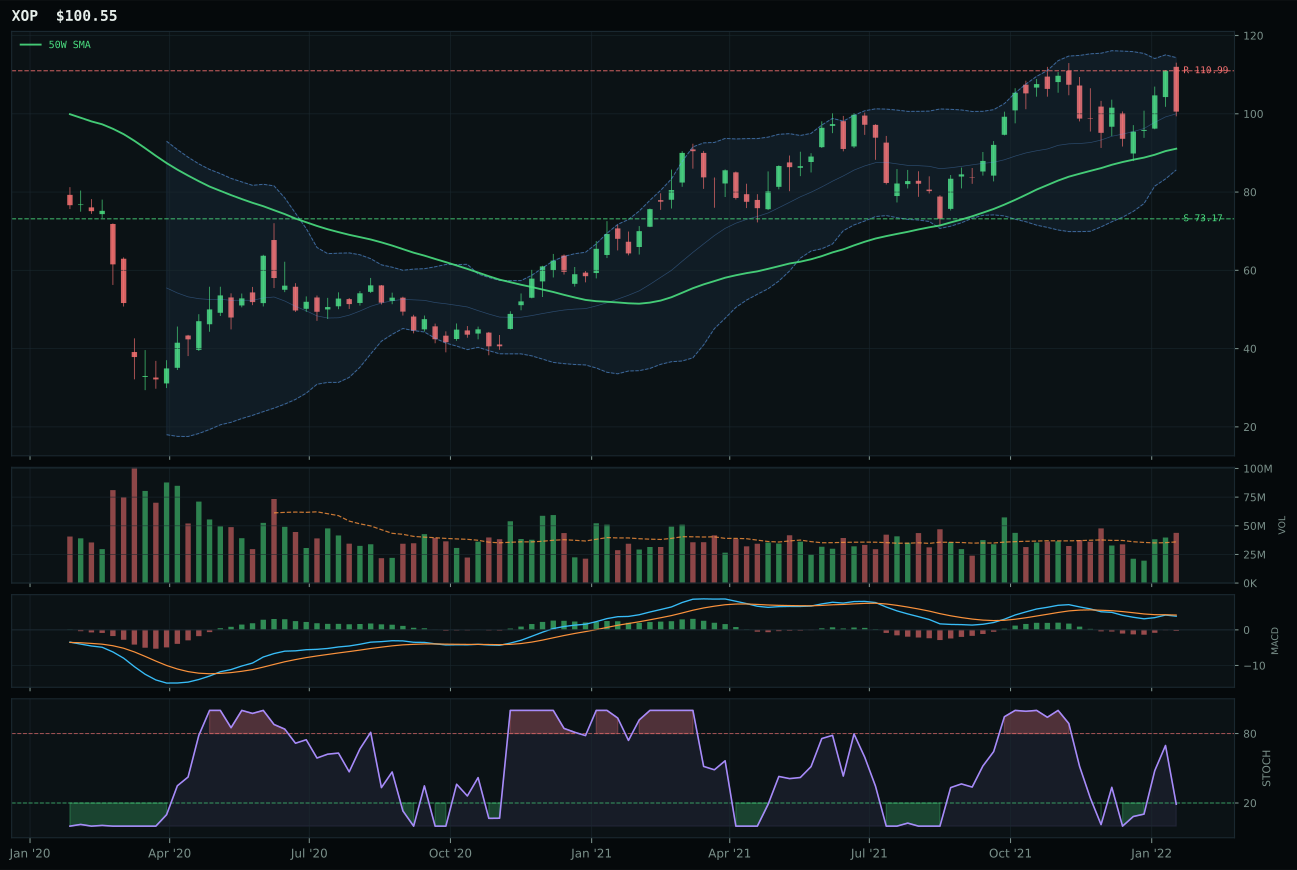
XOP has a neutral structure profile with -3.2% 13-week relative strength versus SPY.
A failed hold above support would weaken the setup.
Actionable but governed by invalidation levels.
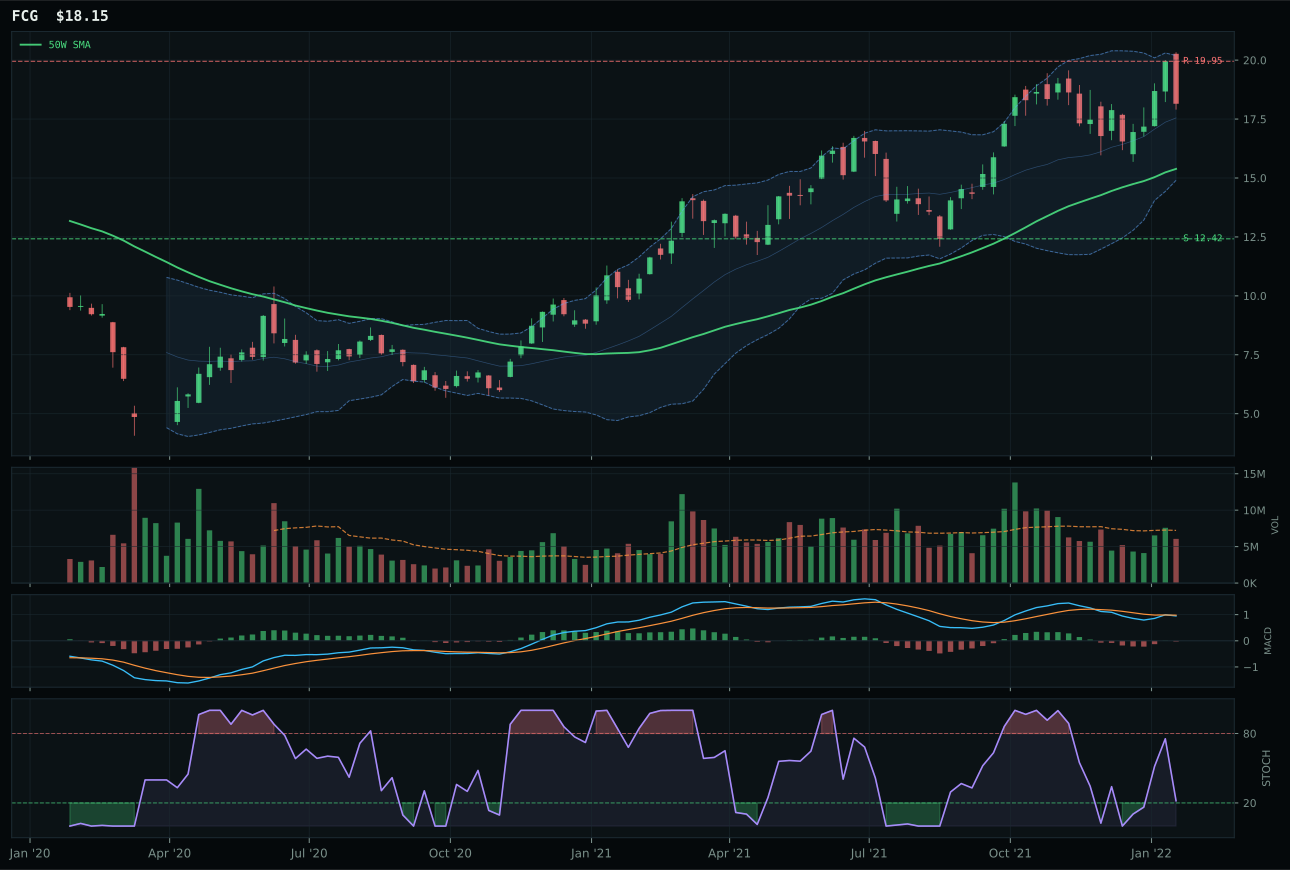
FCG has a vertical extension profile with 0.7% 13-week relative strength versus SPY.
A failed hold above support would weaken the setup.
Actionable but governed by invalidation levels.
XLE qualifies for the second 20% allocation slot with a 78.5 category score because its 100.0 trend, 100.0 momentum confirmation, and dominant 11.1% SPY relative strength overwhelm timing concerns created by an 18.3% extension above the 50-week moving average. The extended price is the trade-off for real money: 7.8% 13-week return, 13.8% 4-week return, and 1.15x above-average volume prove XLE is not a technical dead cat bounce but sustained energy-complex accumulation. XOP's setup is cleaner (compression near the 50W) but its bearish-but-improving MACD and -3.2% SPY relative strength expose it as the follower. MACD quality separates decisively: XLE's bullish-and-improving condition versus XOP's repair mode creates a hierarchy. The 10.4% category-relative strength confirms XLE as the only genuine peer leader.
Traditional Energy earns the second 20% slot because it scores 78.5, ranked second only behind precious metals (73.6), driven by a portfolio-high 92.0/100 macro fit. Energy scarcity is active (+16), inflation pressure is real (+10), supply shortage is structural (+9), and real asset sponsorship is broad (+7). XLE's 36.1% downside to support at 22.94 is steep, but the macro case is ironclad: dollar weakness, rate shock fears, and geopolitical tension all support energy as an inflation hedge and cash-flow generator. Extend duration into energy because the macro regime is shifting away from pure financial assets toward real productive capacity. Accept the timing premium on XLE (it is already extended) because being wrong means missing energy's decade-long repricing. This is conviction allocation, not technical entry.
Precious Metals — GLD
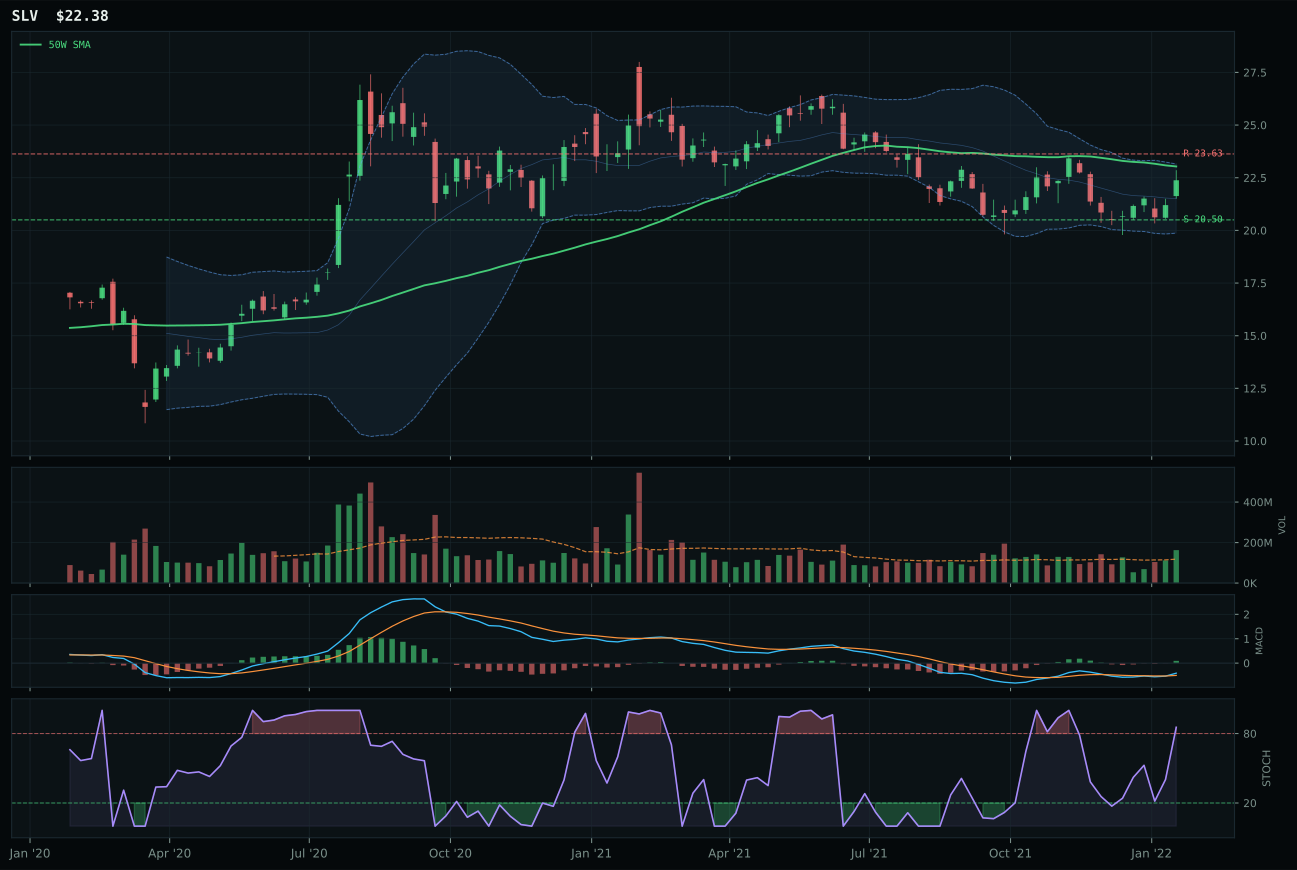
SLV has a compression near 50W profile with 2.6% 13-week relative strength versus SPY.
A failed hold above support would weaken the setup.
Actionable but governed by invalidation levels.
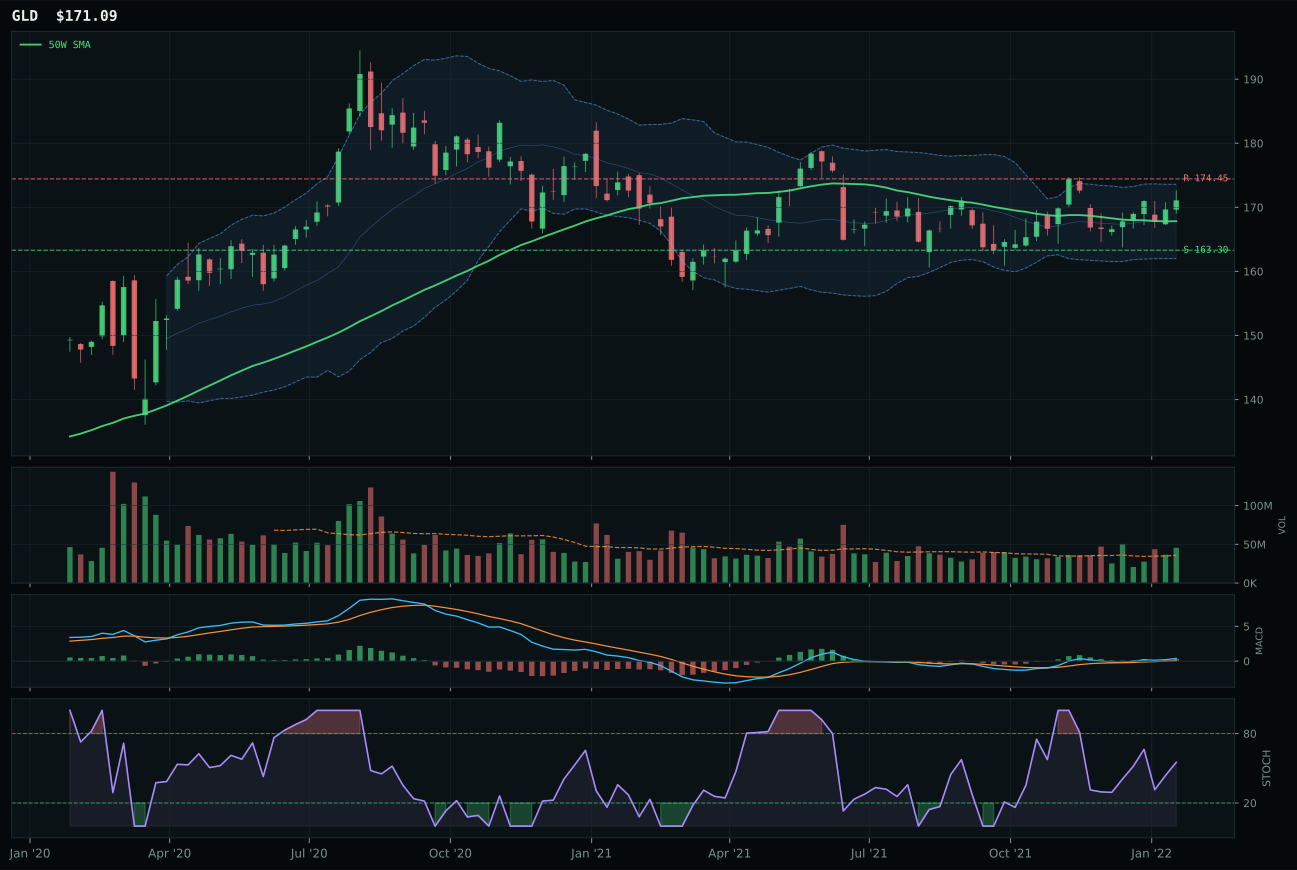
GLD has a pullback into support profile with 5.3% 13-week relative strength versus SPY.
A failed hold above support would weaken the setup.
Actionable but governed by invalidation levels.
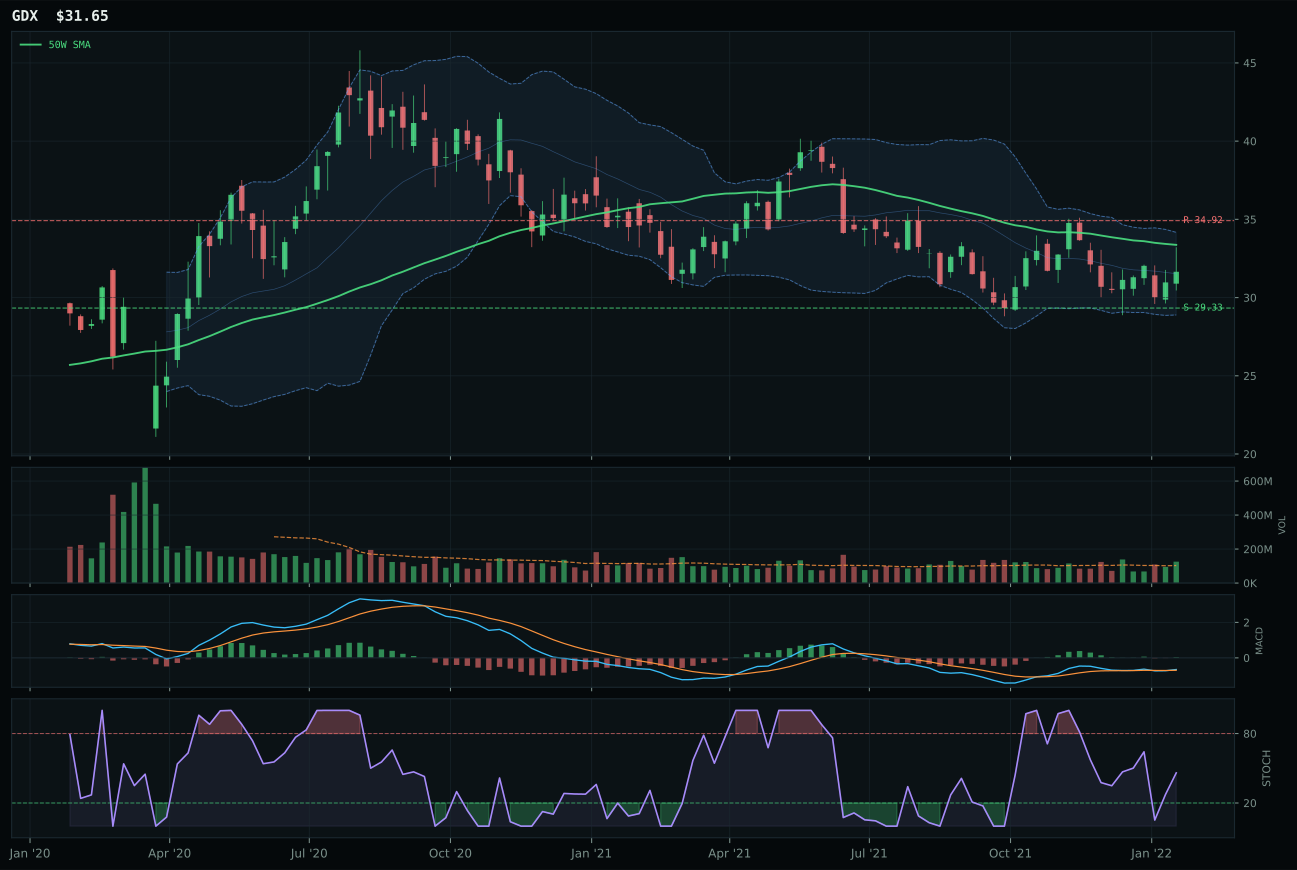
GDX has a neutral structure profile with -0.7% 13-week relative strength versus SPY.
A failed hold above support would weaken the setup.
Actionable but governed by invalidation levels.
GLD qualifies for 20% allocation as one of two top-ranked categories because it combines perfect 100.0 trend and timing scores with genuinely improving MACD momentum, 2.7% category-relative strength, and 5.3% SPY outperformance. The setup is textbook: pullback into support at 163.30 with only 1.9% distance to the 50-week moving average, upper Fibonacci retracement zone, and above-average volume at 1.27x the 20-week average—all confirming that buyers are defending a level, not abandoning it. SLV's compression near the 50W (69.0 macro fit vs GLD's 72.0) and overbought stochastic RSI (momentum zone) mark it as extended; GLD's falling/neutral reading provides cleaner entry geometry. The 7.5-point gap in reasoned ETF proof order (85.1 vs 78.3) reflects GLD's superior structure and MACD clarity.
Precious Metals earns a top-2 allocation slot at 20% because the category score of 73.6 ranks second overall, driven by the highest macro fit (72.0/100) in the portfolio. The monetary hedge bid is active (+14), defensive rotation is real (+7), and dollar weakness creates tailwind (+3). GLD's 2.0% 13-week return and 83.1 momentum confirmation reveal accumulation within a beaten-down sector; the combination of technical repair and macro sponsorship is rare this week. Liquidity expansion provides a small headwind (-2), but precious metals serve as the portfolio's ballast against transition chaos. GLD's 52.3 risk/reward score (the lowest among its own peers) is acceptable because the macro case for gold as monetary insurance is robust. Capital concentration here reflects conviction that disinflation is not the path forward.
Industrial Metals — COPX
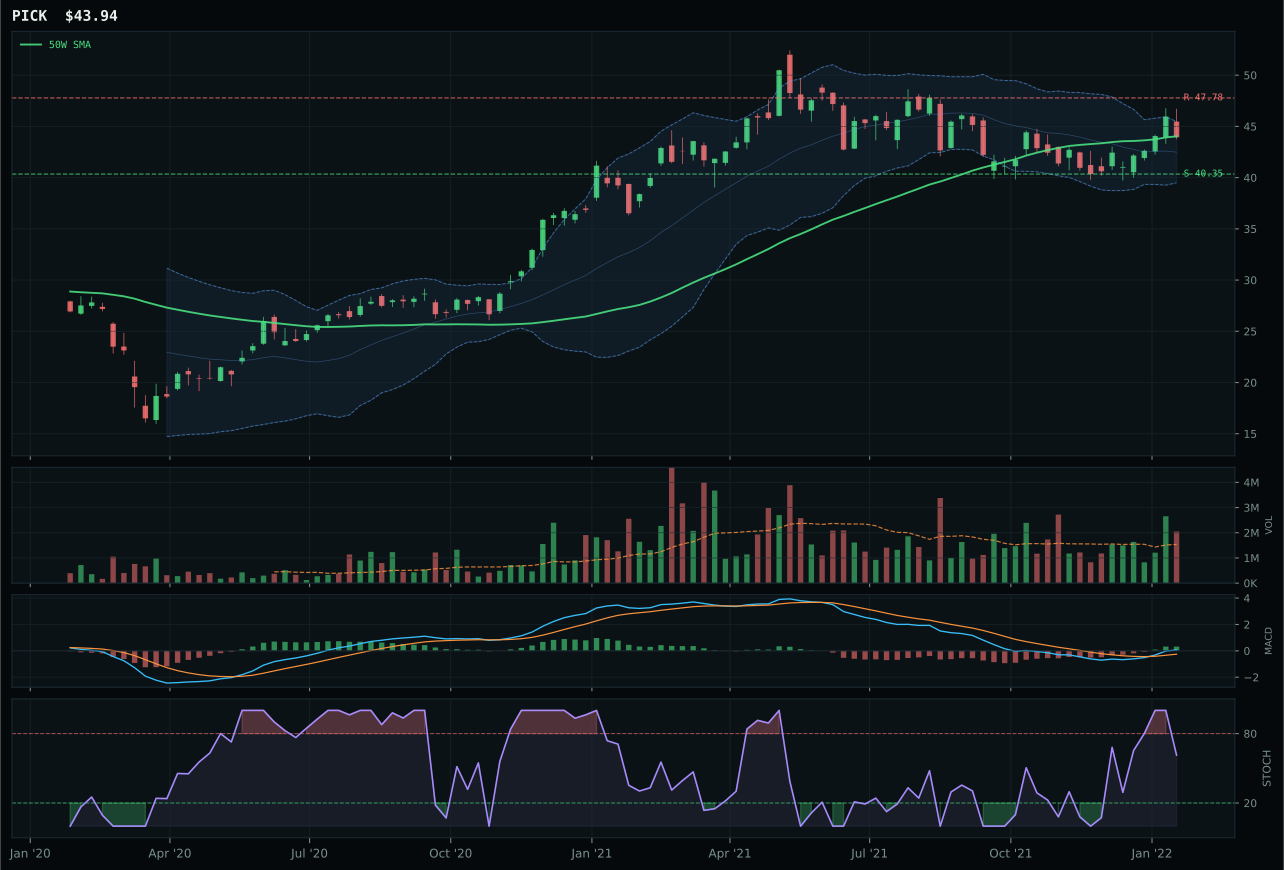
PICK has a compression near 50W profile with 5.8% 13-week relative strength versus SPY.
A failed hold above support would weaken the setup.
Actionable but governed by invalidation levels.
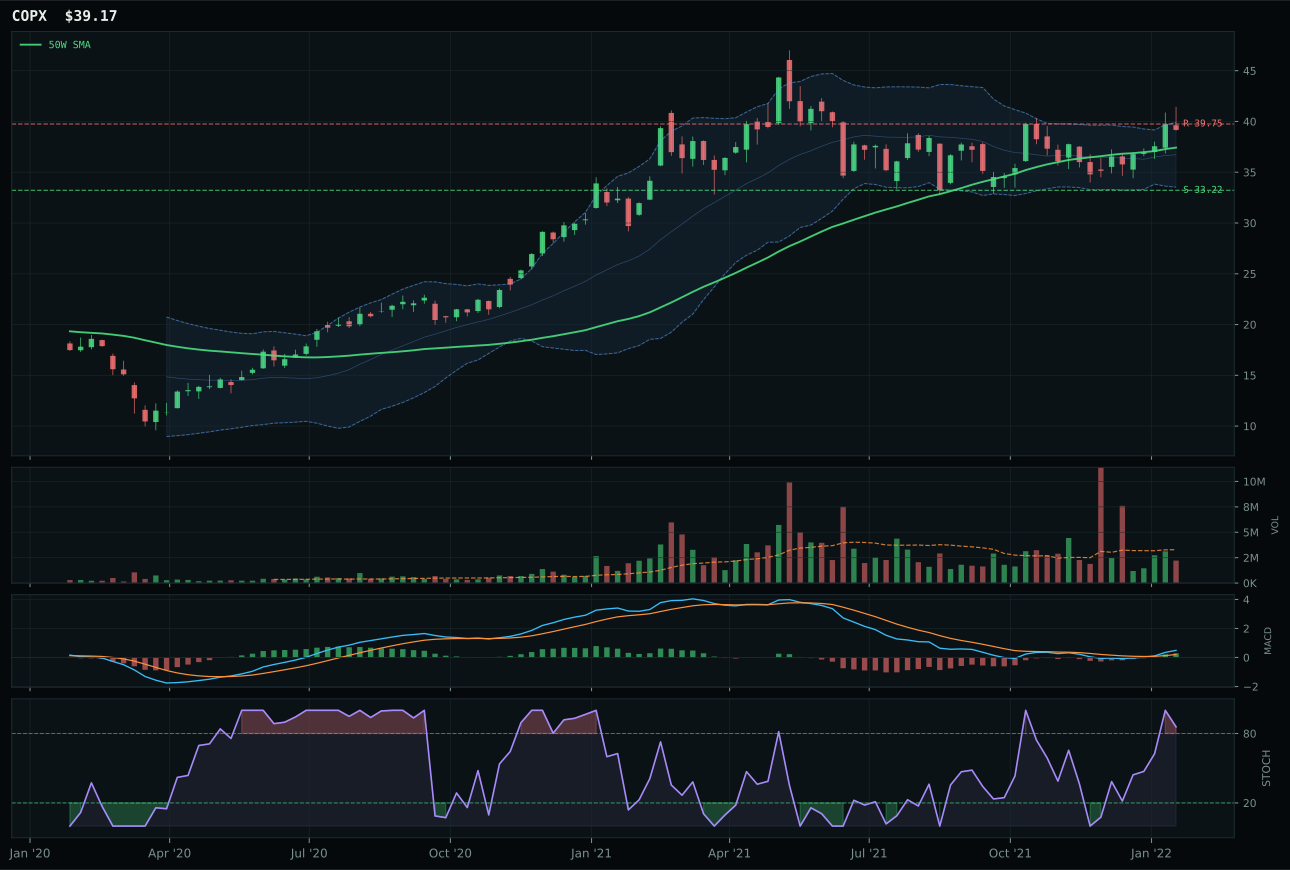
COPX has a neutral structure profile with 5.7% 13-week relative strength versus SPY.
A failed hold above support would weaken the setup.
Actionable but governed by invalidation levels.
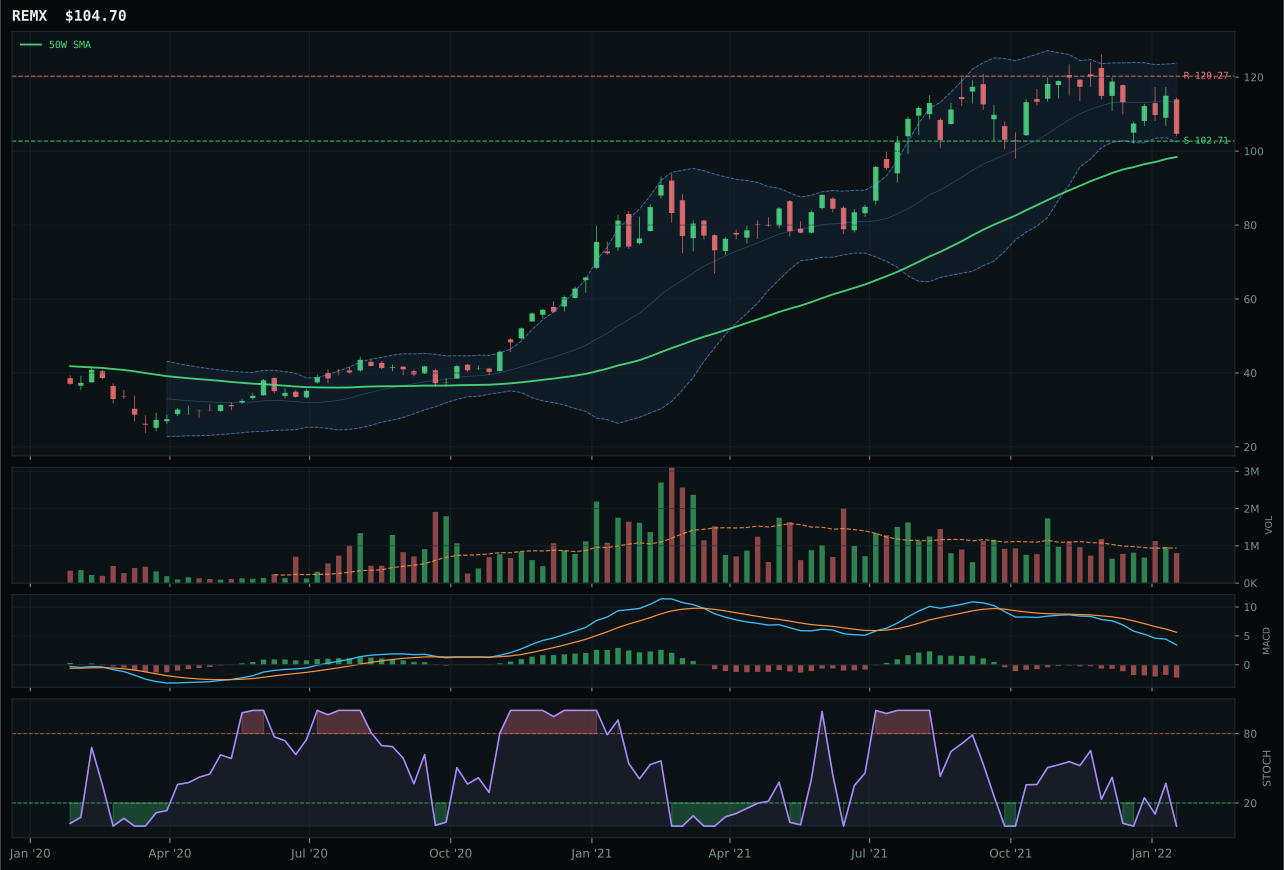
REMX has a pullback into support profile with -4.3% 13-week relative strength versus SPY.
A failed hold above support would weaken the setup.
Actionable but governed by invalidation levels.
COPX narrowly edges PICK despite PICK's superior technical score (92.2 vs 72.5) because COPX's reasoned ETF proof blends trend dominance (100.0), timing superiority (97.0 vs 100.0 for PICK), and macro specificity around copper scarcity and industrial demand. PICK's compression near the 50W is cleaner and its volume (above-average) confirms accumulation, but COPX sits 4.7% extended above its 50W with overbought stochastic RSI (0.86)—a signal that it is finishing, not starting. The category reasoner weighted metals scarcity (+12 at COPX level vs +6 for PICK) and commodity breadth (+7 vs +8), making COPX the play for near-term scarcity bid, while PICK is the position for sustained mining upside. COPX's 5.7% SPY relative strength and 2.4% 13-week return prove buyers are still engaged, even if entry timing is compressed.
Industrial Metals earns 10% allocation on a 70.1 category score that ranks fifth because PICK's technical superiority (composite 90 vs COPX's 85) is offset by macro conviction around industrial metals scarcity. The 73.0/100 macro fit (metals scarcity +14, commodity breadth +10, real asset sponsorship +6) aligns with the inflation and supply-chain regime. COPX's thin 0.67x volume participation and 1.5% upside to resistance make this a near-term tactical position rather than a structural conviction. Capital flows to energy and precious metals first because their macro cases are cleaner. However, if copper holds 39.75 resistance and volume accelerates, metals could graduate to 20%; at present, COPX serves as the portfolio's scarcity hedge alongside agriculture. Monitor PICK for a cleaner compression and stronger volume as a potential upgrade signal.
Utilities & Infrastructure — IGF
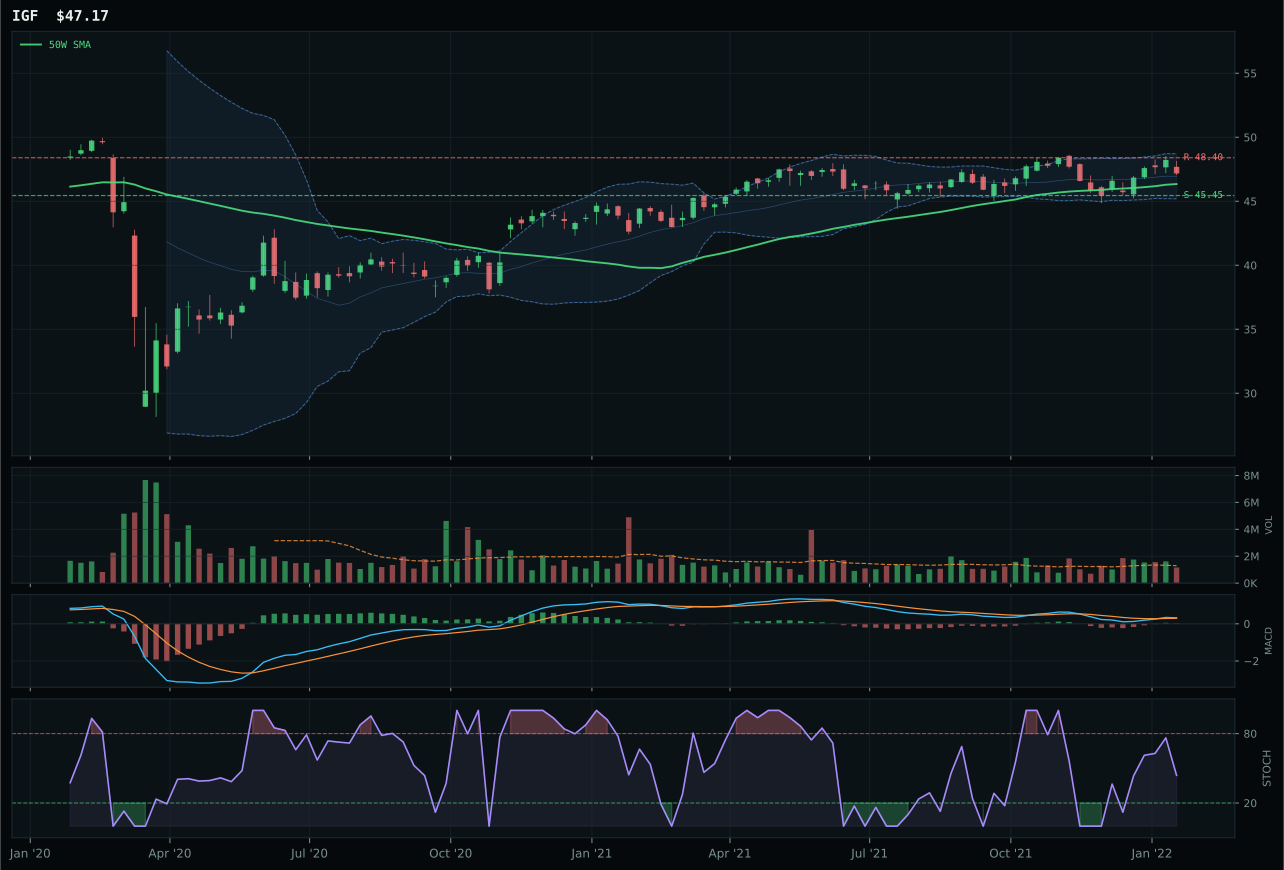
IGF has a pullback into support profile with 1.4% 13-week relative strength versus SPY.
A failed hold above support would weaken the setup.
Actionable but governed by invalidation levels.
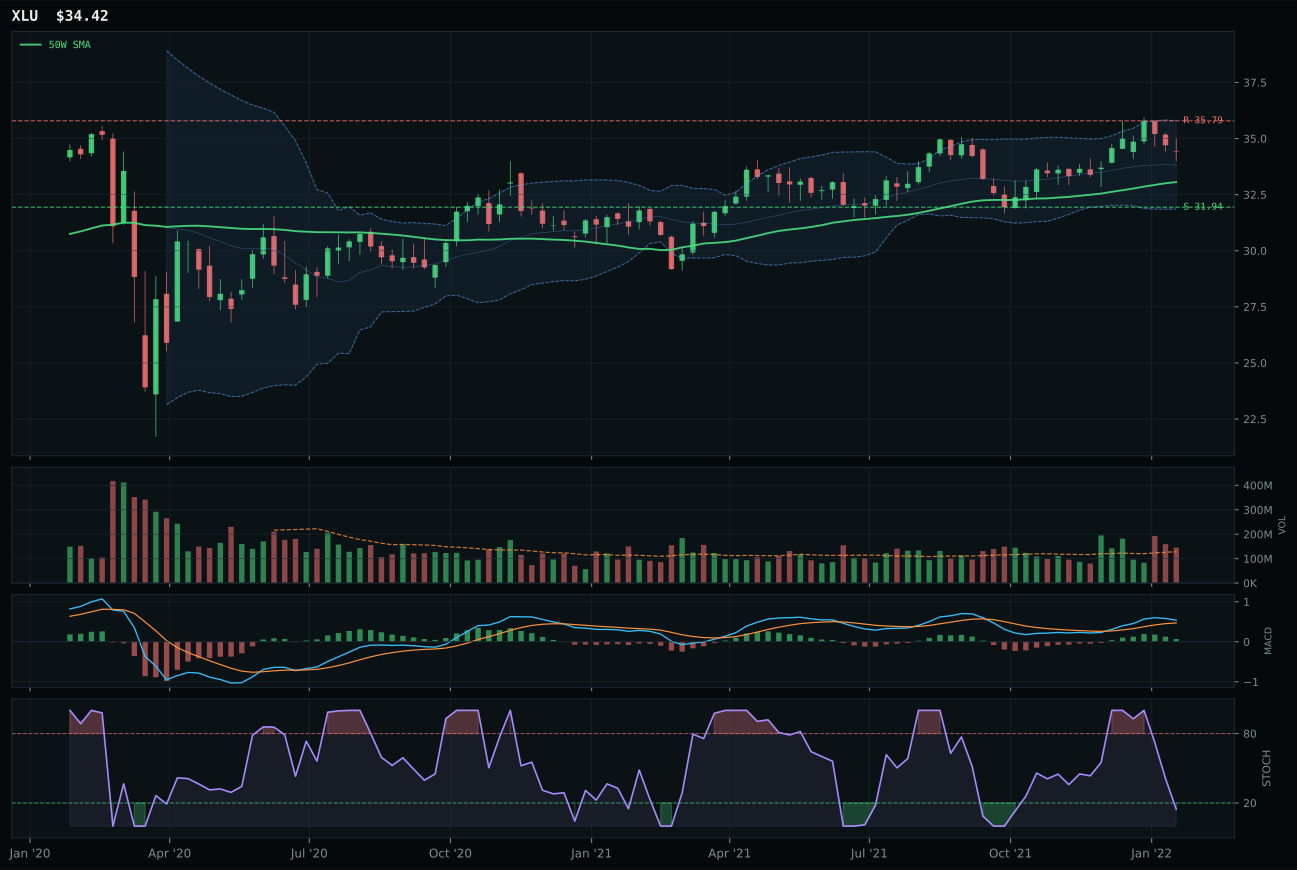
XLU has a neutral structure profile with 5.7% 13-week relative strength versus SPY.
A failed hold above support would weaken the setup.
Actionable but governed by invalidation levels.
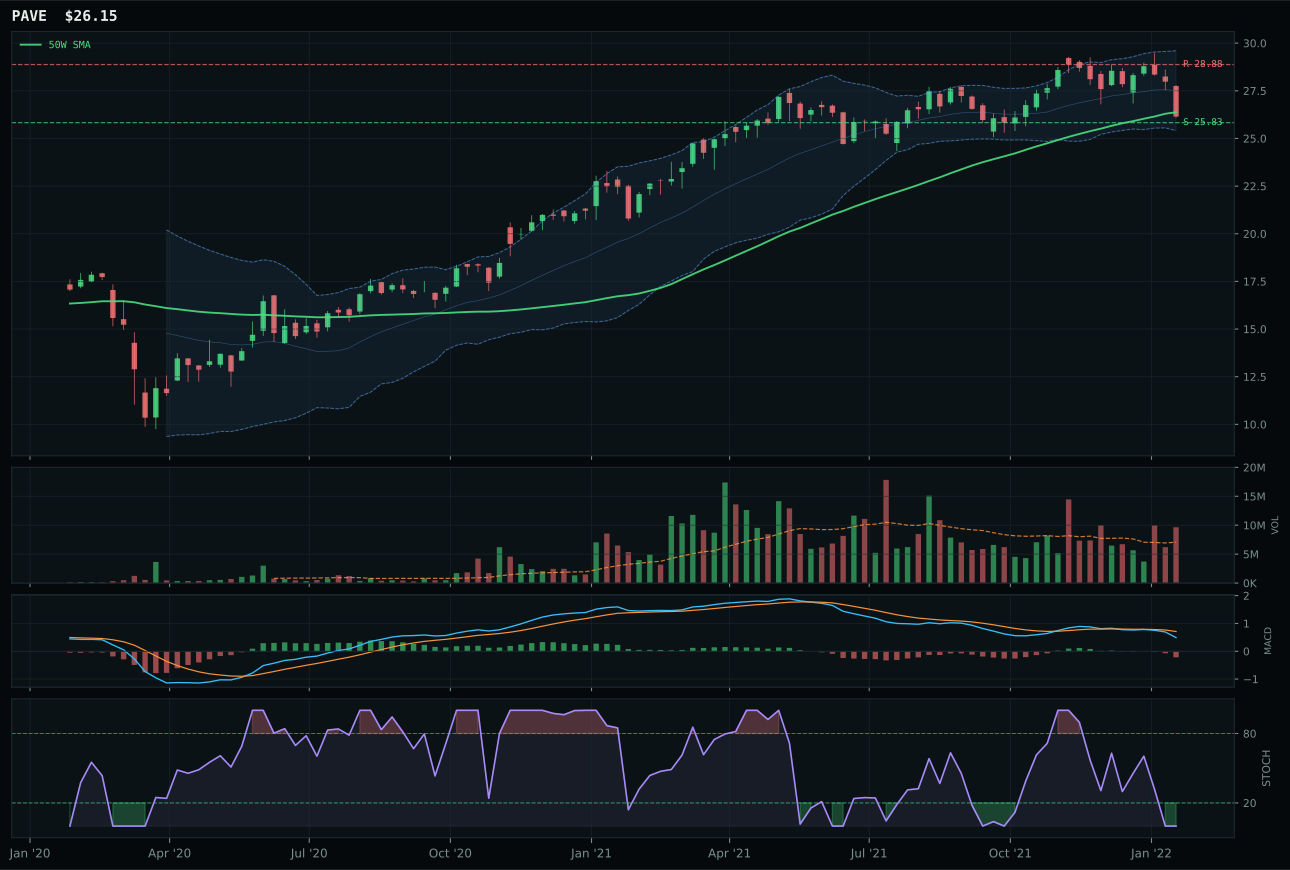
PAVE has a pullback into support profile with -1.1% 13-week relative strength versus SPY.
A failed hold above support would weaken the setup.
Actionable but governed by invalidation levels.
IGF narrowly edges XLU on timing perfection (100.0 vs 85.0) and MACD quality (bullish and improving versus bullish but flattening), though both charts sit above their 50-week moving averages with similar support/resistance geometry. IGF's 1.8% distance to the 50W is tighter than XLU's neutral structure placement, and the 73.3 structure score bests XLU's equivalent slightly. Category-relative strength of 0.0% shows neither has peer dominance, but IGF's 1.4% SPY relative strength confirms technical baseline while XLU's 5.7% suggests it is extended into the risk zone. Risk/reward splits 57.1 (IGF) versus 53.9 (XLU) in a compressed range—both are defensive plays with limited upside (2.5% for IGF, XLU's range is wider). The decision comes down to MACD durability: IGF's improving condition versus XLU's flattening trajectory signals IGF has momentum in hand.
Utilities & Infrastructure earns 10% on a 60.3 category score that ranks fifth because it offers genuinely defensive positioning within the transition regime. Macro fit at 64.0/100 reflects strong defensive rotation (+12) and broad market bear (+4), offset by inflation pressure (-6). IGF's -1.9% 13-week return and neutral 0.7% 4-week performance confirm that this is not a growth play but a capital-preservation tool. Allocation sits at 10% rather than higher because income and infrastructure lack the macro conviction of energy scarcity or precious metals monetary hedge. IGF's 57.1 risk/reward is anemic—2.5% upside to resistance at 48.40 versus 3.8% downside to support at 45.45—so this is a holding position for risk management, not a conviction add. Upgrade to 20% only if broad market volatility spikes and IGF breaks above 48.40 on rising volume, signaling genuine defensive rotation capital.
Defense & Aerospace — ITA
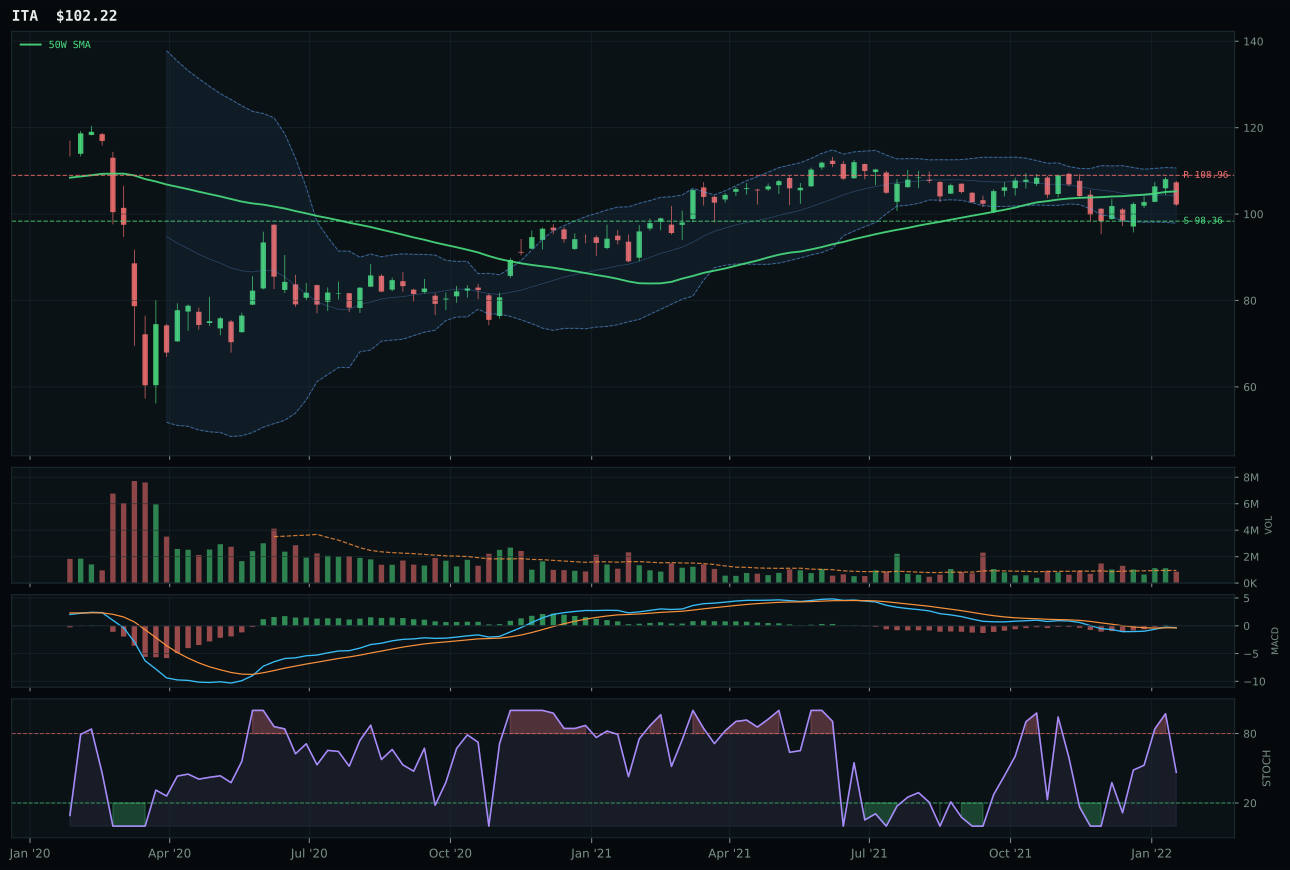
ITA has a pullback into support profile with -2.4% 13-week relative strength versus SPY.
A failed hold above support would weaken the setup.
Actionable but governed by invalidation levels.
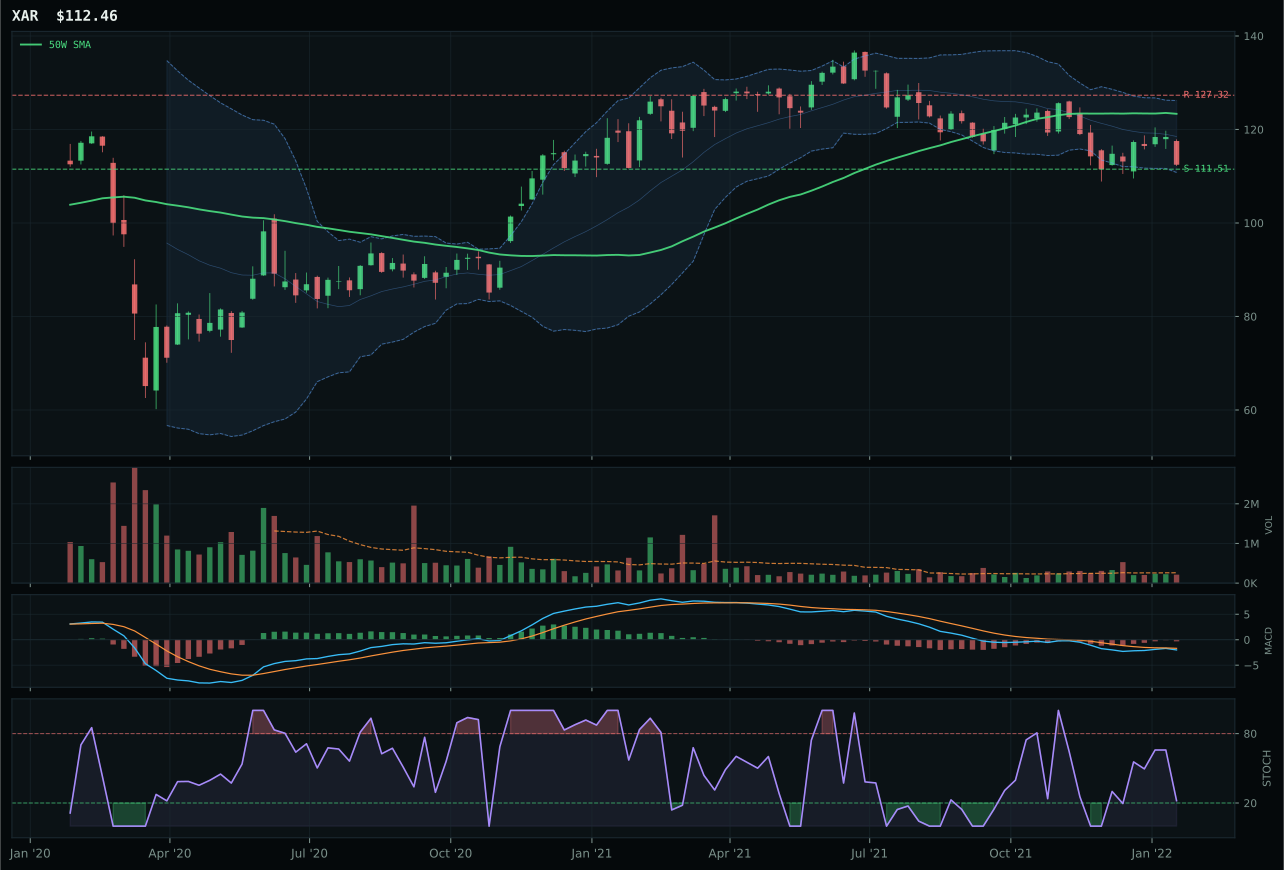
XAR has a pullback into support profile with -5.7% 13-week relative strength versus SPY.
A failed hold above support would weaken the setup.
Actionable but governed by invalidation levels.
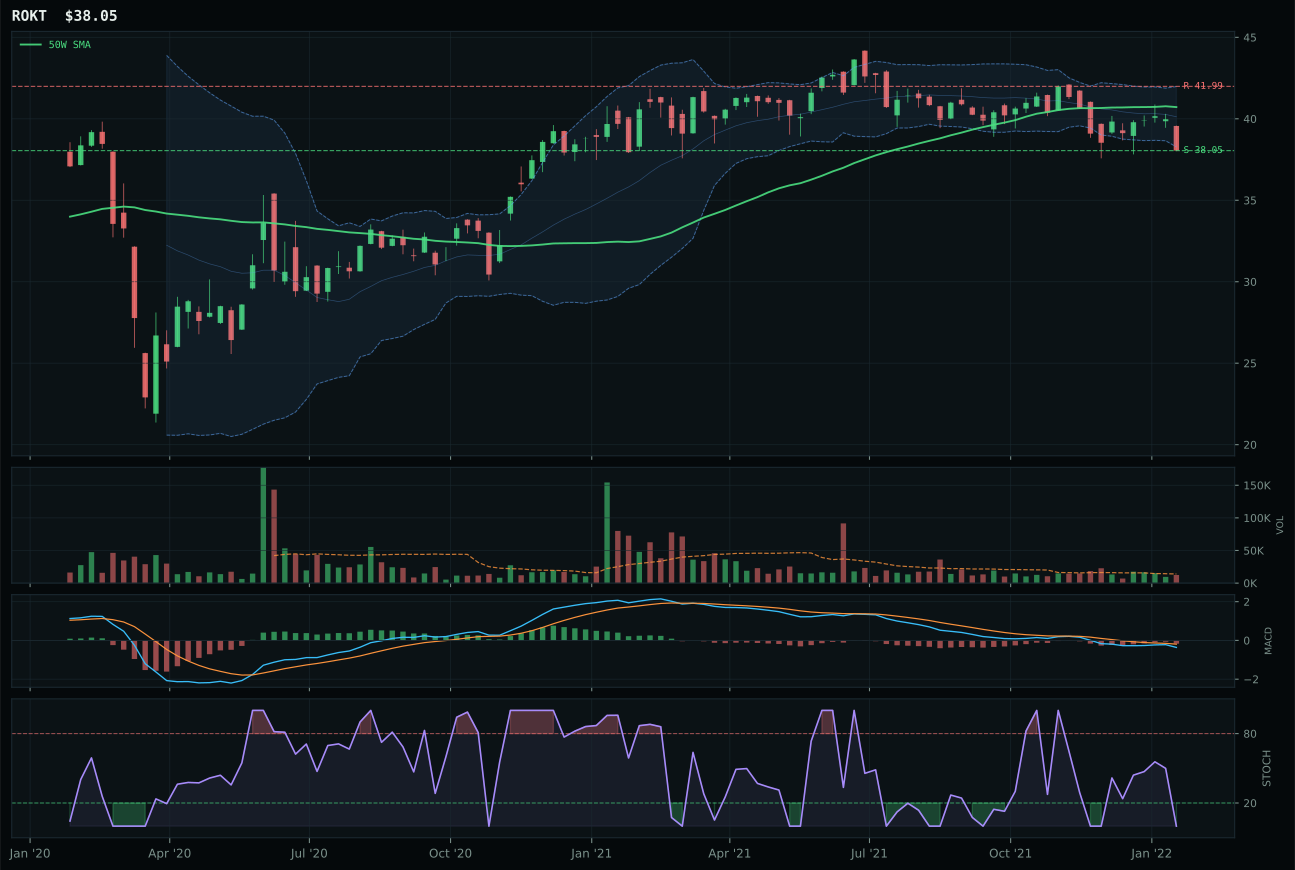
ROKT has a pullback into support profile with -4.7% 13-week relative strength versus SPY.
A failed hold above support would weaken the setup.
Tracked, but not top-2 eligible because: .
ITA claims the category despite sitting below its 50-week moving average because its MACD is bullish and improving—the only genuine momentum confirmation inside the trio. The -2.9% distance to the 50W combined with perfect 100.0 timing and a 56.1 momentum score (highest in basket) signals a reset that is being repaired, not rejected. XAR's MACD remains bearish (though improving) and its timing scores only 85.0, which disqualifies it despite competitive risk/reward at 90 versus ITA's 81.4. Category-relative strength of 2.3% gives ITA a sliver of peer leadership. Structure at 70.9 is cleaner than XAR's 68.4, and the 3.9% downside to support versus -6.2% upside to resistance creates a defined invalidation level that traders can respect.
Defense & Aerospace earns 10% allocation because its 44.4 category score ranks fourth, just above Utilities. Macro fit at 70.0/100 is robust (defensive rotation +8, broad market bear +6, dollar strength +3), and ITA's bullish MACD confirmation is rare in this transition regime. However, the category cannot justify 20% because relative SPY weakness at -2.4% and -5.7% drawdowns in the 13-week window show this sector is still finding its footing. The setup is valid, but conviction is moderate: capital flows to energy and precious metals, which offer both technical and macro alignment. ITA's allocation depends on holding 98.36 support; breach of that level would force a reappraisal.
Technology — XLK
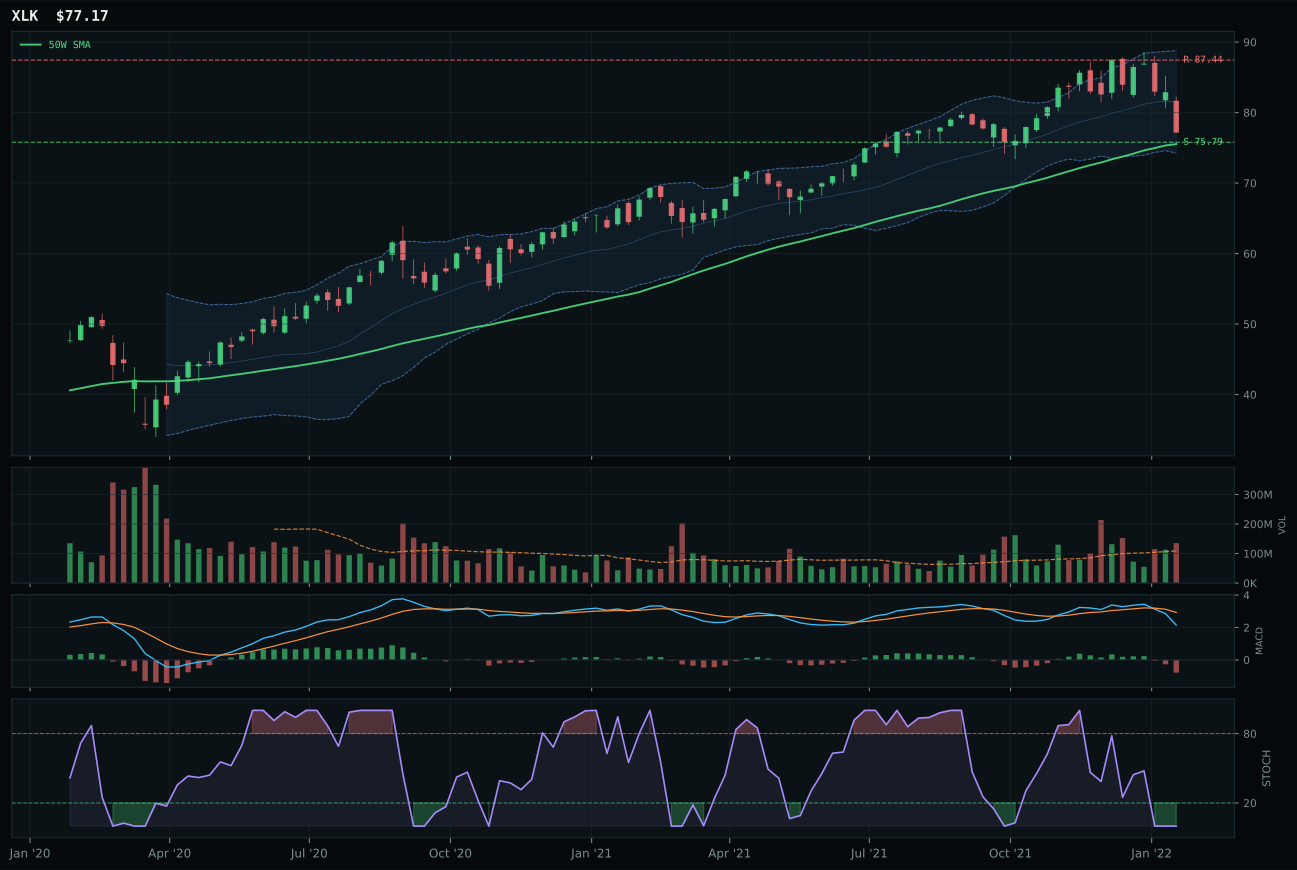
XLK has a pullback into support profile with 0.8% 13-week relative strength versus SPY.
A failed hold above support would weaken the setup.
Actionable but governed by invalidation levels.
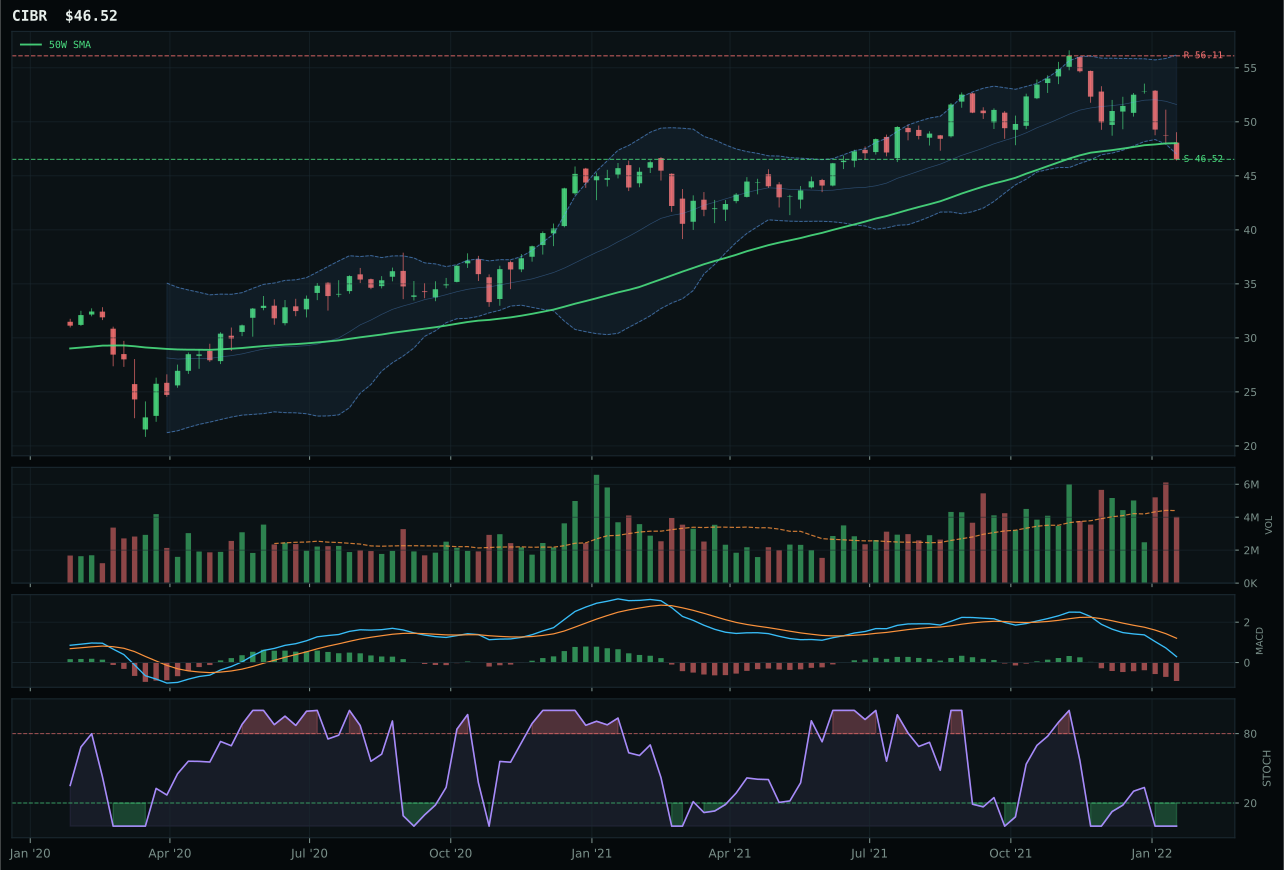
CIBR has a pullback into support profile with -9.6% 13-week relative strength versus SPY.
A failed hold above support would weaken the setup.
Actionable but governed by invalidation levels.
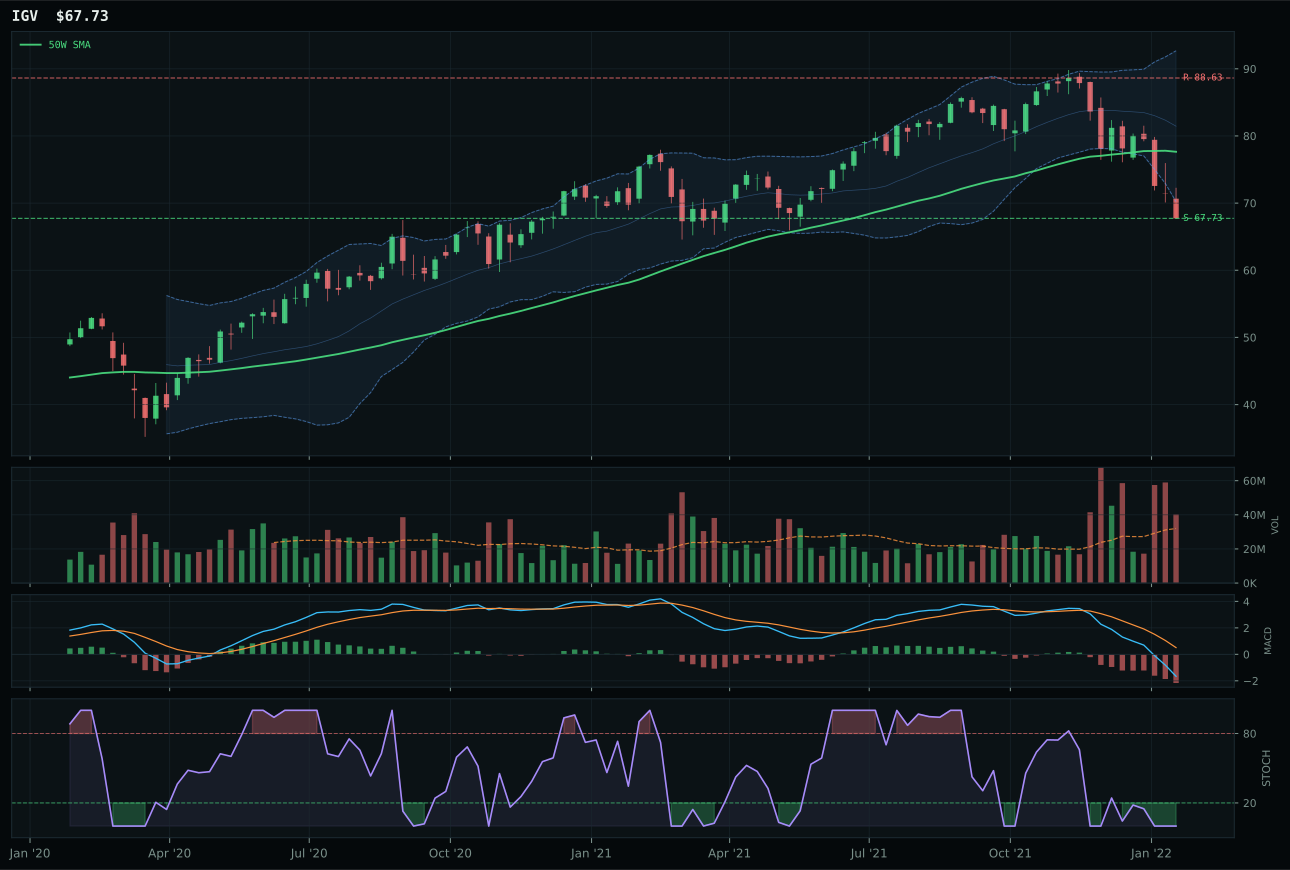
IGV has a pullback into support profile with -18.5% 13-week relative strength versus SPY.
A failed hold above support would weaken the setup.
Actionable but governed by invalidation levels.
XLK captures the category because it holds the only bullish technical edge: 10.4% relative strength within the basket versus CIBR's flat 0.0%, paired with a cleaner pullback structure (73.1 vs 70.2) and genuine above-average volume participation at 1.24x its 20-week average. CIBR's -9.6% relative strength versus SPY and -13.0% 13-week return expose it as the category laggard, even though both charts are oversold and pulling into support. The gap widens further on risk/reward: XLK's 1.8% downside to support against an 11.8% reach to resistance creates asymmetry that CIBR's weaker 91.5 score cannot match. The setup favors XLK because it sits 2.2% from its 50-week moving average with distribution pressure that suggests accumulation, not capitulation.
Technology earns only 10% allocation because a 42.4 category score ranks sixth among eight eligible categories this week—above only Nuclear and Emerging Markets. Macro support exists (liquidity expansion, AI sponsorship active) at 60.0/100, but the broader issue is that XLK's 13-week return of -2.6% and flattish momentum confirmation score of 35.2 reveal a sector still in repair mode. The transition regime and defensive positioning mean growth stocks must prove they're accumulating, not bouncing; XLK's above-average volume and 0.8% SPY relative strength help, but the category's macro fit of 56.0/100 lags peers dramatically. Capital allocation goes to categories with clearer conviction: precious metals (20%), energy (20%), and industrials all offer better risk/reward marriages with the current macro state.
Agriculture & Livestock — MOO
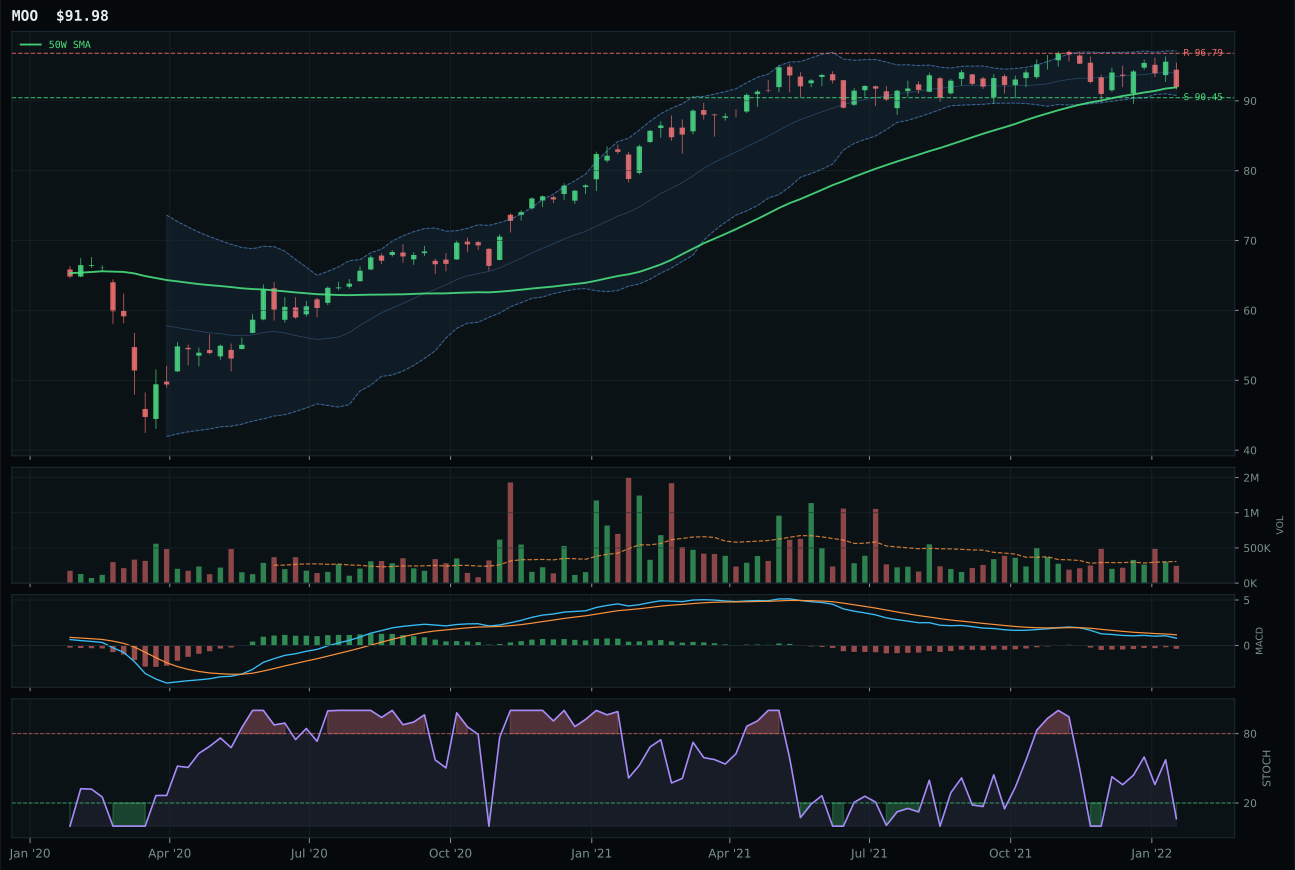
MOO has a pullback into support profile with -0.1% 13-week relative strength versus SPY.
A failed hold above support would weaken the setup.
Actionable but governed by invalidation levels.
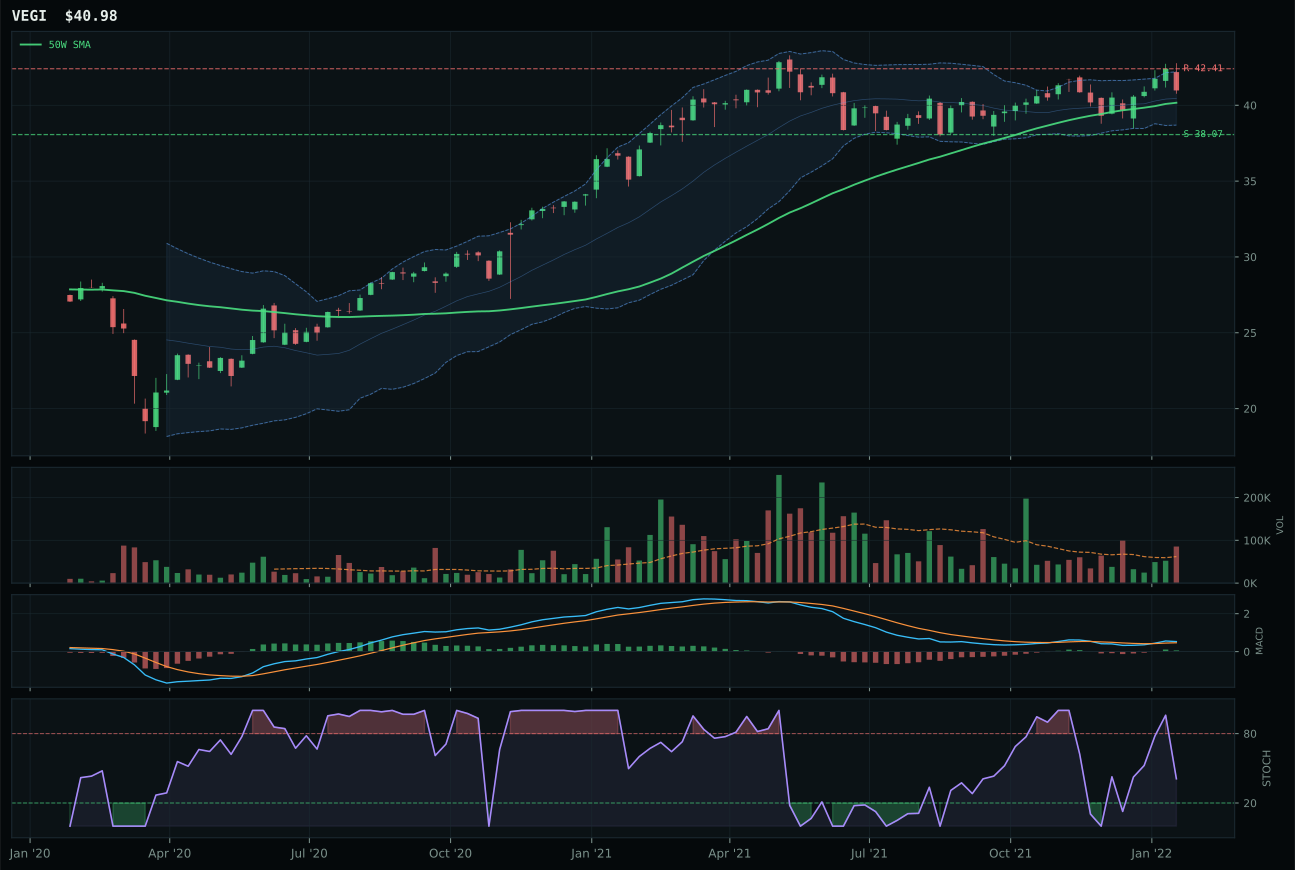
VEGI has a compression near 50W profile with 4.3% 13-week relative strength versus SPY.
A failed hold above support would weaken the setup.
Tracked, but not top-2 eligible because: .
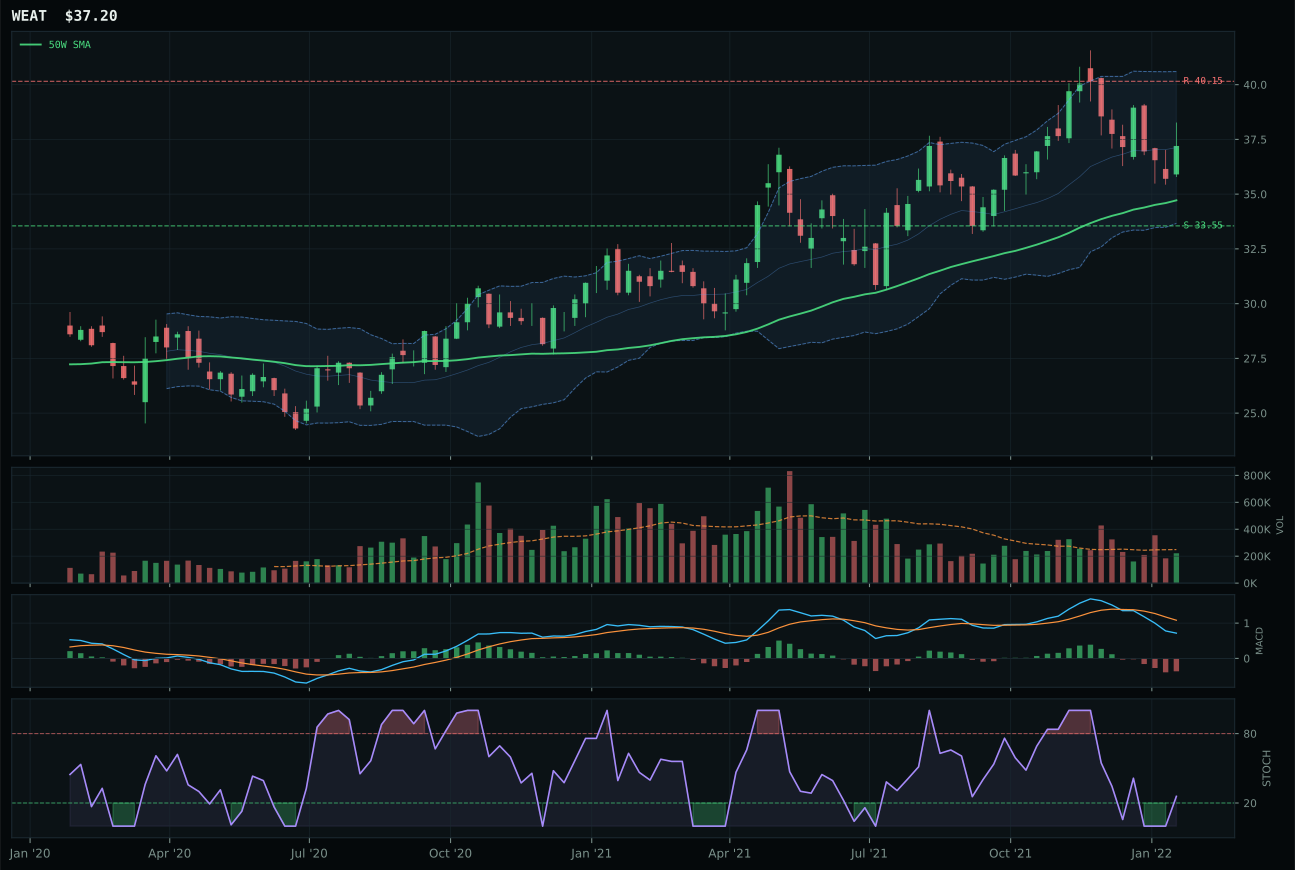
WEAT has a neutral structure profile with 4.0% 13-week relative strength versus SPY.
A failed hold above support would weaken the setup.
Tracked, but not top-2 eligible because: .
MOO edges VEGI because risk/reward tips decisively in its favor (90.0 vs 52.9)—a critical edge when positioning for inflation and supply shortage. MOO sits 0.1% from its 50-week average with oversold stochastic RSI (0.06) and a bearish-but-improving MACD, creating a pullback-into-support structure (70.0 cleanliness) that VEGI's compression near the 50W cannot match. VEGI's bullish/improving MACD and falling neutral stochastic look better on the surface, but the 4.3% SPY relative strength overheats its risk/reward calculus: upside to 42.41 resistance is only 1.1%, leaving almost no room for error. MOO's trend score of 92.9 (almost perfect) combined with 100.0 timing dominates VEGI's momentum score of 76—a setup that rewards patience over chase.
Agriculture earns 10% despite a 42.2 score because its 86.0/100 macro fit is the highest-ranked macro environment in the portfolio: supply shortage +13, inflation pressure +10, real asset sponsorship +8, commodity breadth +5. MOO's neutral -0.1% SPY relative strength paradoxically becomes an asset in a regime where uncorrelated inflation hedges matter more than momentum. The category ranks fifth on technical merit alone, but macro conviction lifts it into the 10% tier. Allocation would climb to 20% only if MOO closes above 96.79 resistance and volume climbs to above-average participation; currently, the 0.80x volume and 100.0 timing score suggest buyers are barely engaged. Hold here, monitor for acceleration.
Nuclear Energy — URA
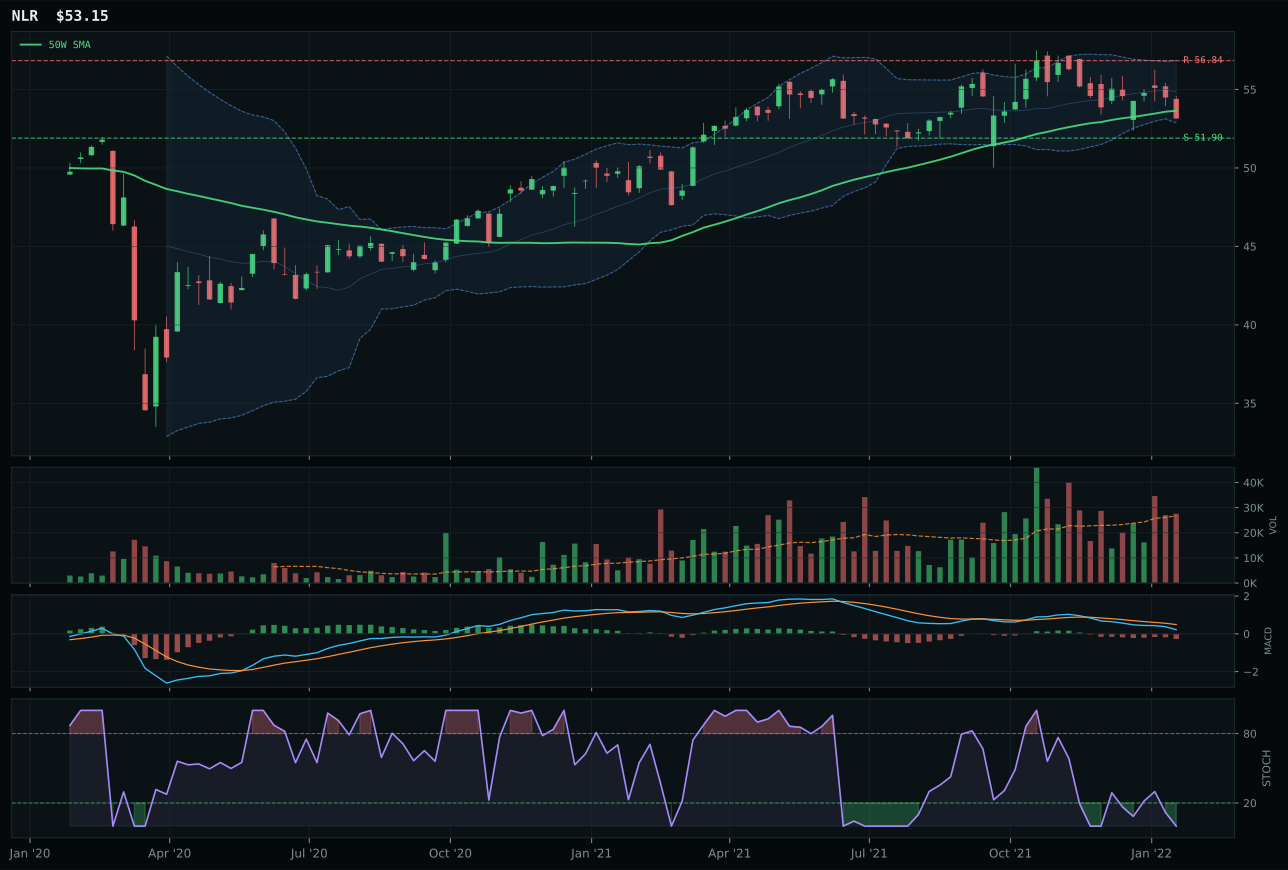
NLR has a pullback into support profile with -3.2% 13-week relative strength versus SPY.
A failed hold above support would weaken the setup.
Tracked, but not top-2 eligible because: .
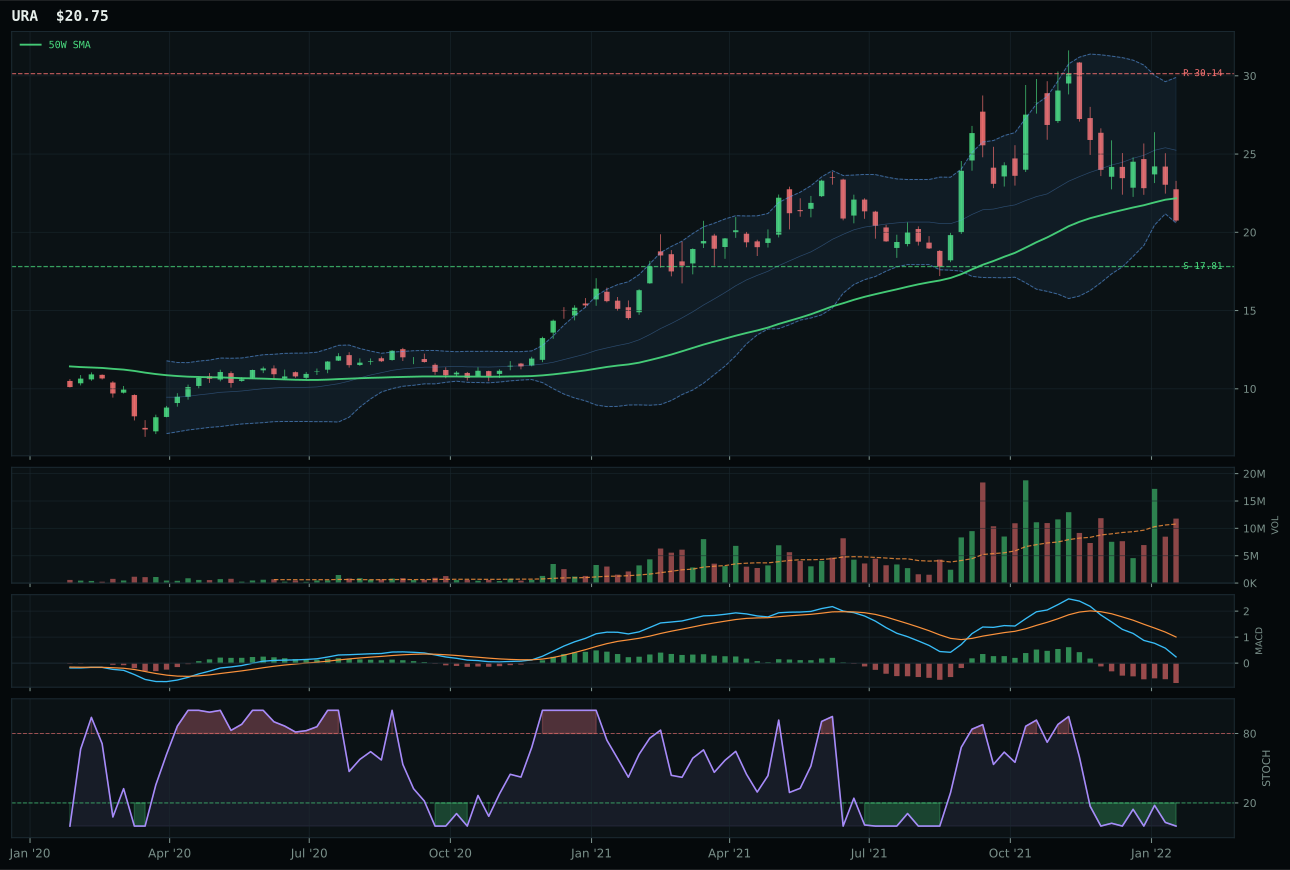
URA has a neutral structure profile with -23.4% 13-week relative strength versus SPY.
A failed hold above support would weaken the setup.
Actionable but governed by invalidation levels.
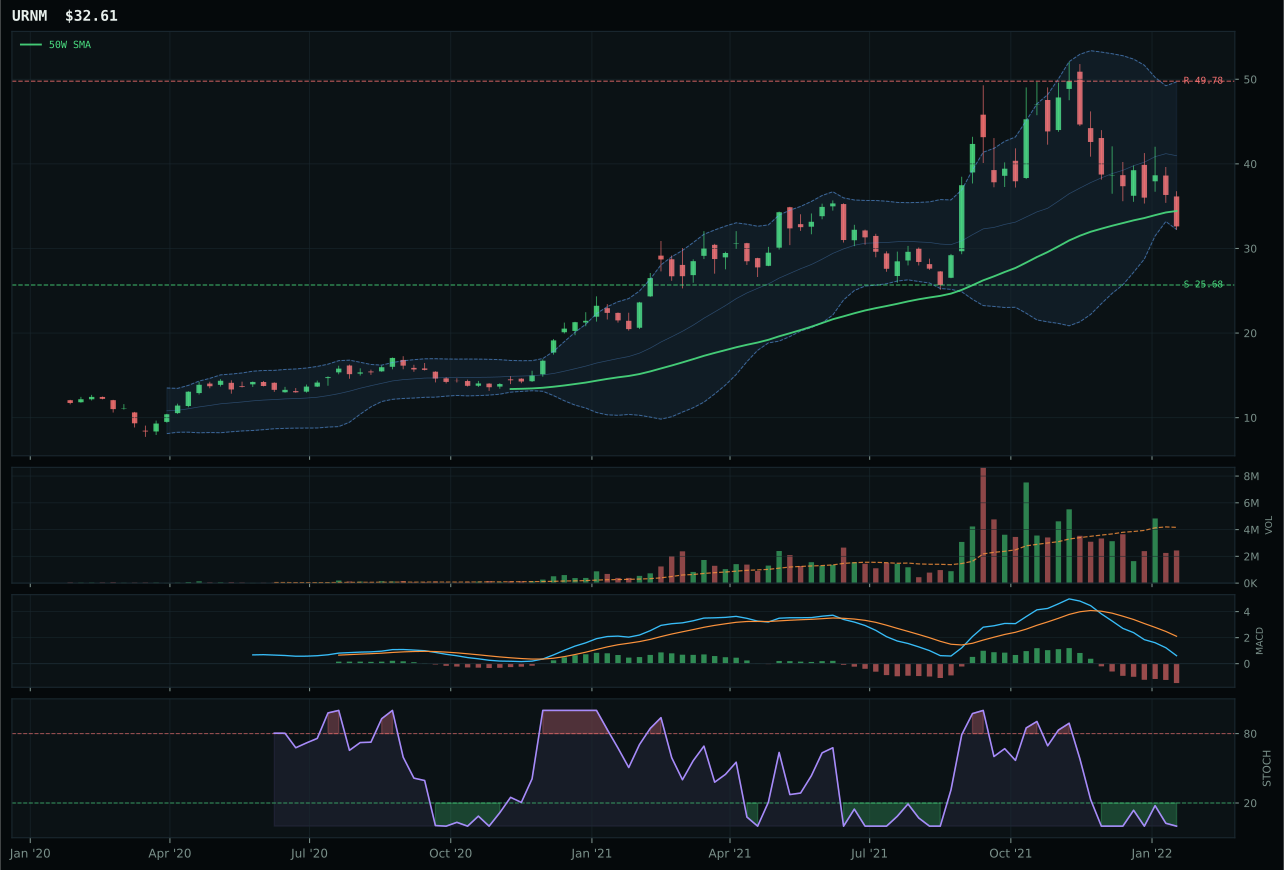
URNM has a neutral structure profile with -27.3% 13-week relative strength versus SPY.
A failed hold above support would weaken the setup.
Actionable but governed by invalidation levels.
URA wins the category despite its weakest technical composite (42) by the slimmest margin because it is marginally less oversold in structure and timing than NLR. URA's -6.4% distance to the 50W and neutral structure (57.6) hold better than NLR's pullback setup, and both face identical MACD bearish/weakening and oversold stochastic RSI conditions. The category is severely broken: URA's -26.7% 13-week return and -23.4% SPY relative strength reflect panic selling, not selective weakness. NLR's -6.5% 13-week and -3.2% SPY relative strength look marginally less severe, but NLR's -0.9% distance to the 50W makes it more stretched into the reversal point. The 77.0 timing score (URA) versus 100.0 (NLR) initially favors NLR, but the deep retracement / value zone Fibonacci location (0.618 at 21.00) gives URA better repair geometry for a reset.
Nuclear Energy merits only 10% despite ranking sixth because its 33.8 category score is the joint-worst technical performance, and macro fit at 50.0/100 is neutral—there is no category-specific descriptor profile available. Energy scarcity (+9) and real asset sponsorship (+7) exist, but they cannot overcome the sector's capitulation. URA's -26.7% 13-week drawdown is too severe to dignify with strategic capital; this is a 10% tactical allocation to capture mean-reversion bounce if the sector finds 17.81 support. Move to zero if URA closes below support. Macro conviction resides in integrated energy (XLE) and precious metals, where both technical and macro conditions align. Nuclear can become a top-3 category only if the broad market stabilizes and valuations compress further. Current allocation reflects caution, not conviction.
AI — SMH
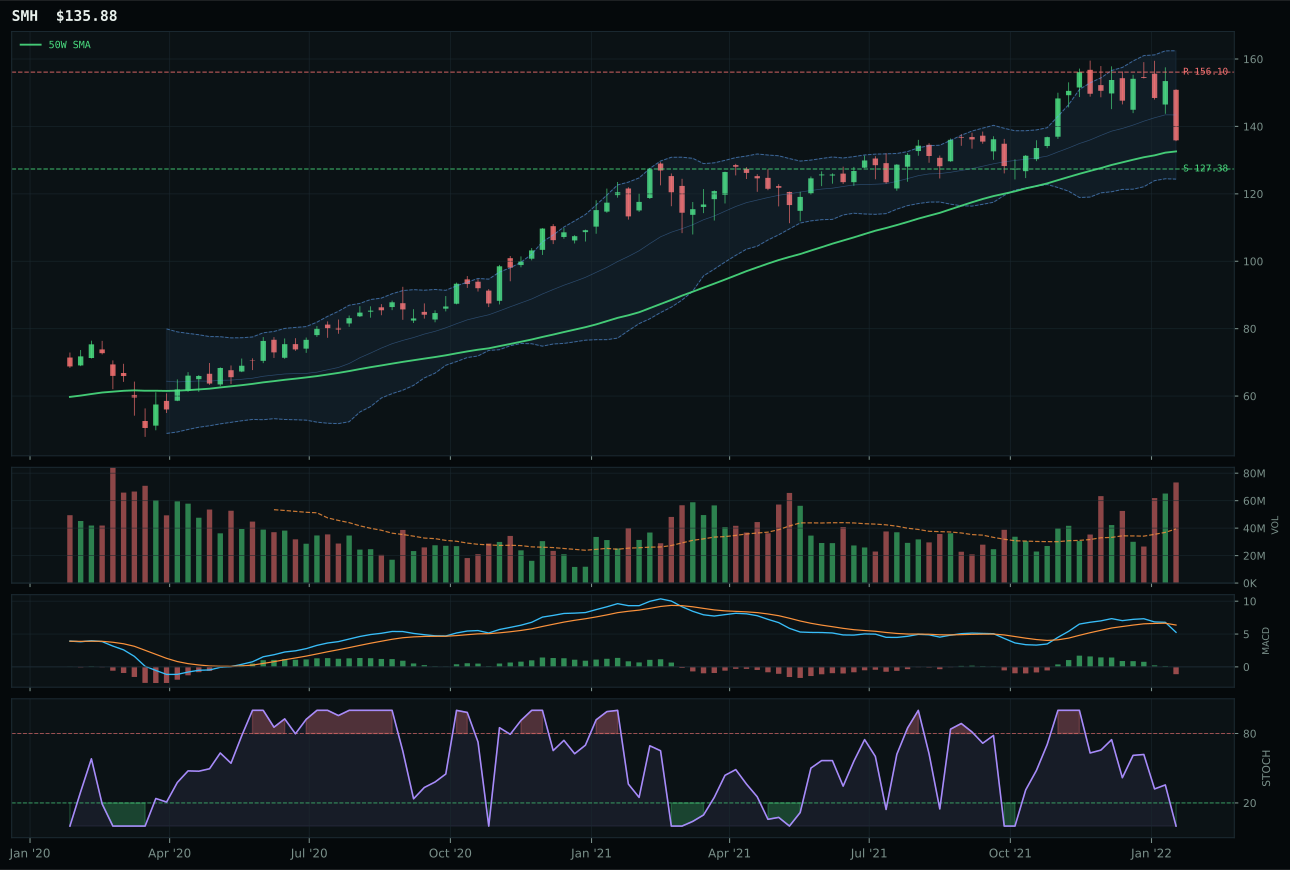
SMH has a compression near 50W profile with 5.1% 13-week relative strength versus SPY.
A failed hold above support would weaken the setup.
Actionable but governed by invalidation levels.
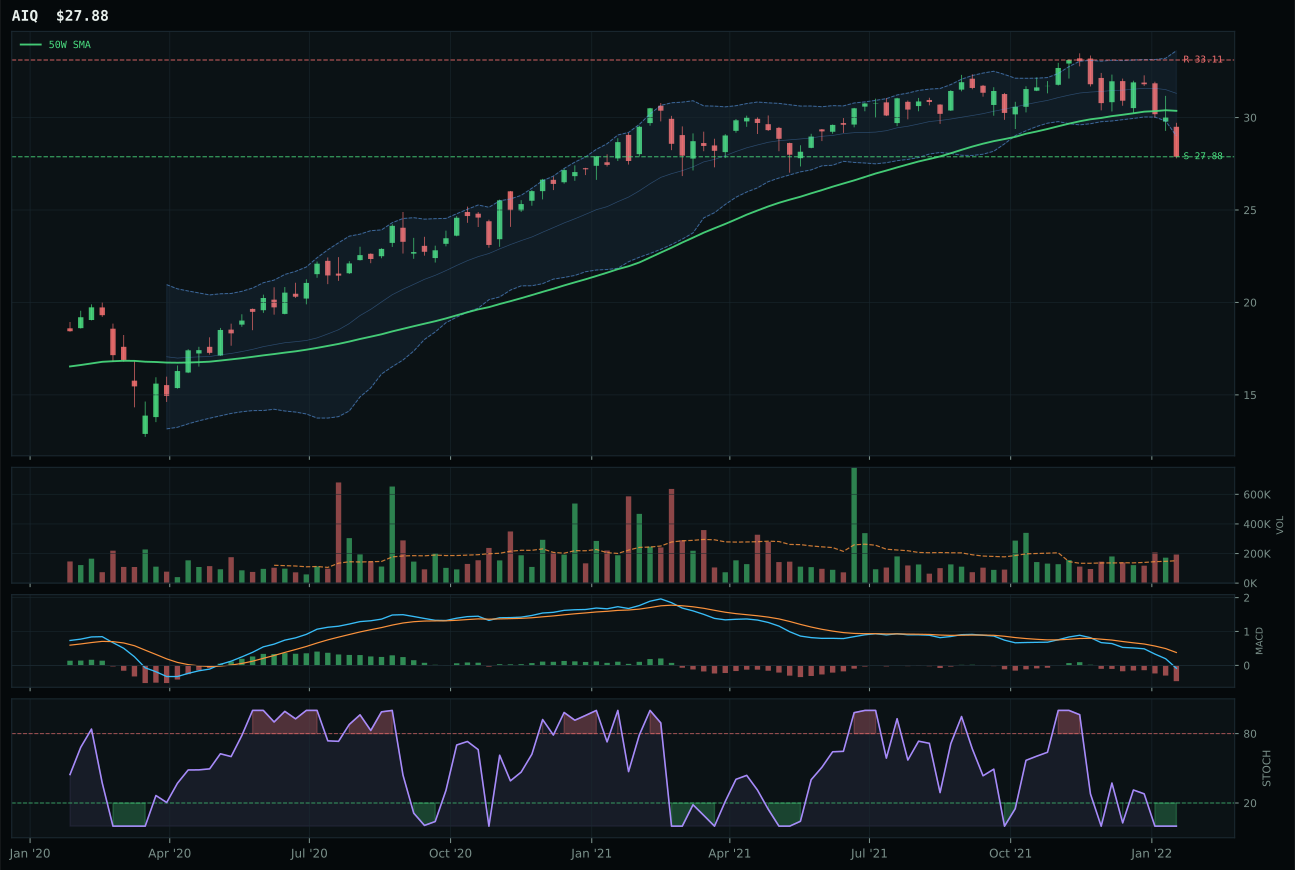
AIQ has a pullback into support profile with -8.5% 13-week relative strength versus SPY.
A failed hold above support would weaken the setup.
Tracked, but not top-2 eligible because: .
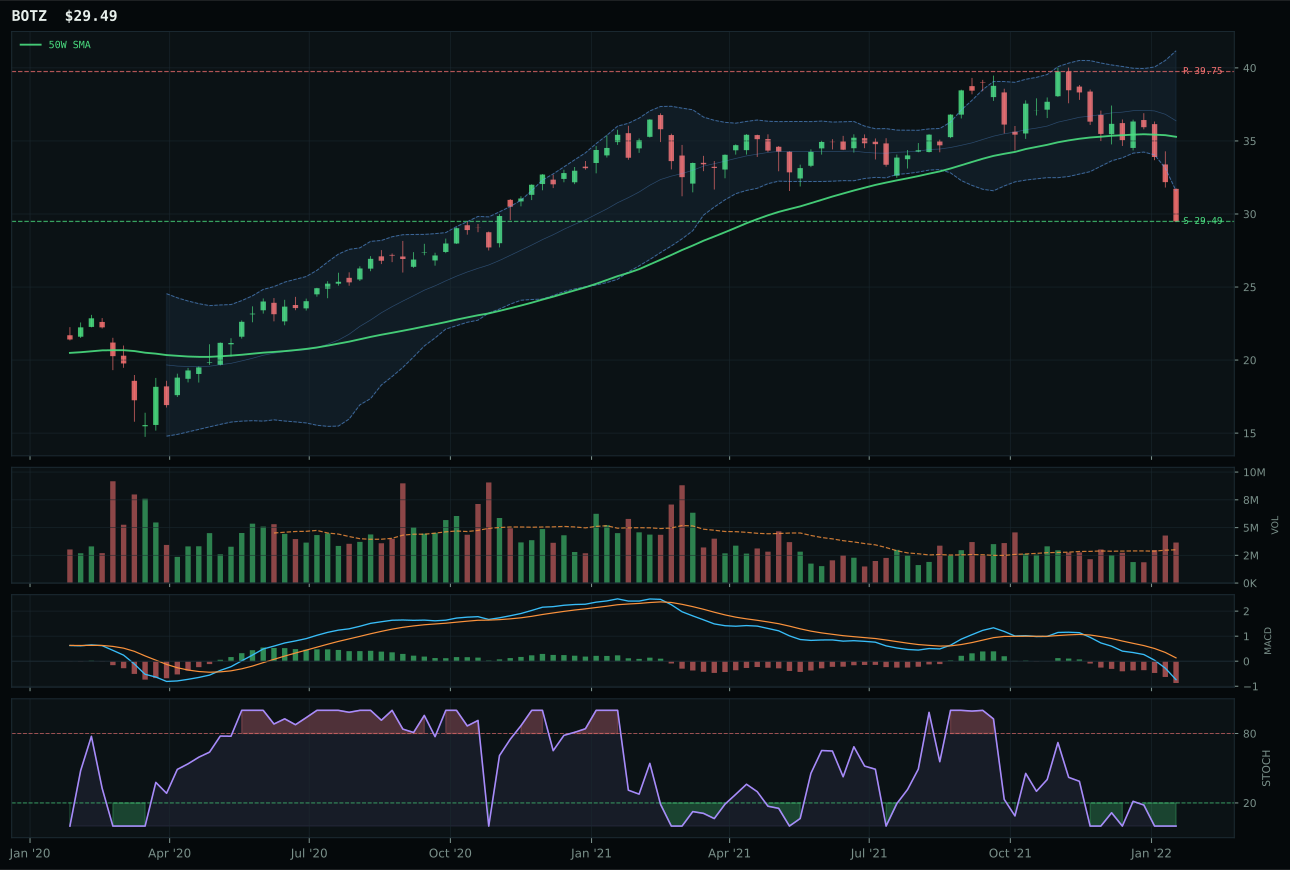
BOTZ has a pullback into support profile with -17.2% 13-week relative strength versus SPY.
A failed hold above support would weaken the setup.
Actionable but governed by invalidation levels.
SMH wins AI on the strength of a 89.6 trend score and perfect 100.0 timing versus AIQ's weaker 24 trend and 80.0 timing. The semiconductor ETF sits only 2.5% above its 50-week moving average with MACD bullish/weakening and stochastic RSI oversold—a textbook compression setup near a major moving average. Category-relative strength of 13.6% shows SMH outpacing both AIQ and BOTZ, and 5.1% relative strength versus SPY confirms the bucket is not broken. AIQ's -8.5% SPY relative strength and -11.9% 13-week return paint it as a software/application play that has disconnected from market strength, while SMH's 1.7% 13-week return and compression near support suggest buyers are defending. Volume distribution pressure at 1.86x the 20-week average does create entry risk, but the technical structure overwhelmingly favors the hardware compute thesis.
AI is excluded entirely at 0% allocation, ranking 9th or 10th against competing categories. The 33.7 category score masks a technical setup that is mechanically clean but loaded with skepticism: SMH's positive momentum (+1.7% thirteen-week return) stands alone in a basket where AIQ and BOTZ are down -11.9% and -20.5% respectively. The 62.0 macro fit score is respectable—AI growth sponsorship is +14—but broad market bear (-8) and dollar pressure (-4) work against mean-reversion attempts. More fundamentally, the distribution pressure and persistence score of 34.6 tell us that whatever strength exists lacks sponsorship from accumulating capital. This category needs either a full macro reset (risk-off ending, liquidity returning) or a clean technical reset from much lower levels to earn allocation capital.
Emerging Markets — INDA
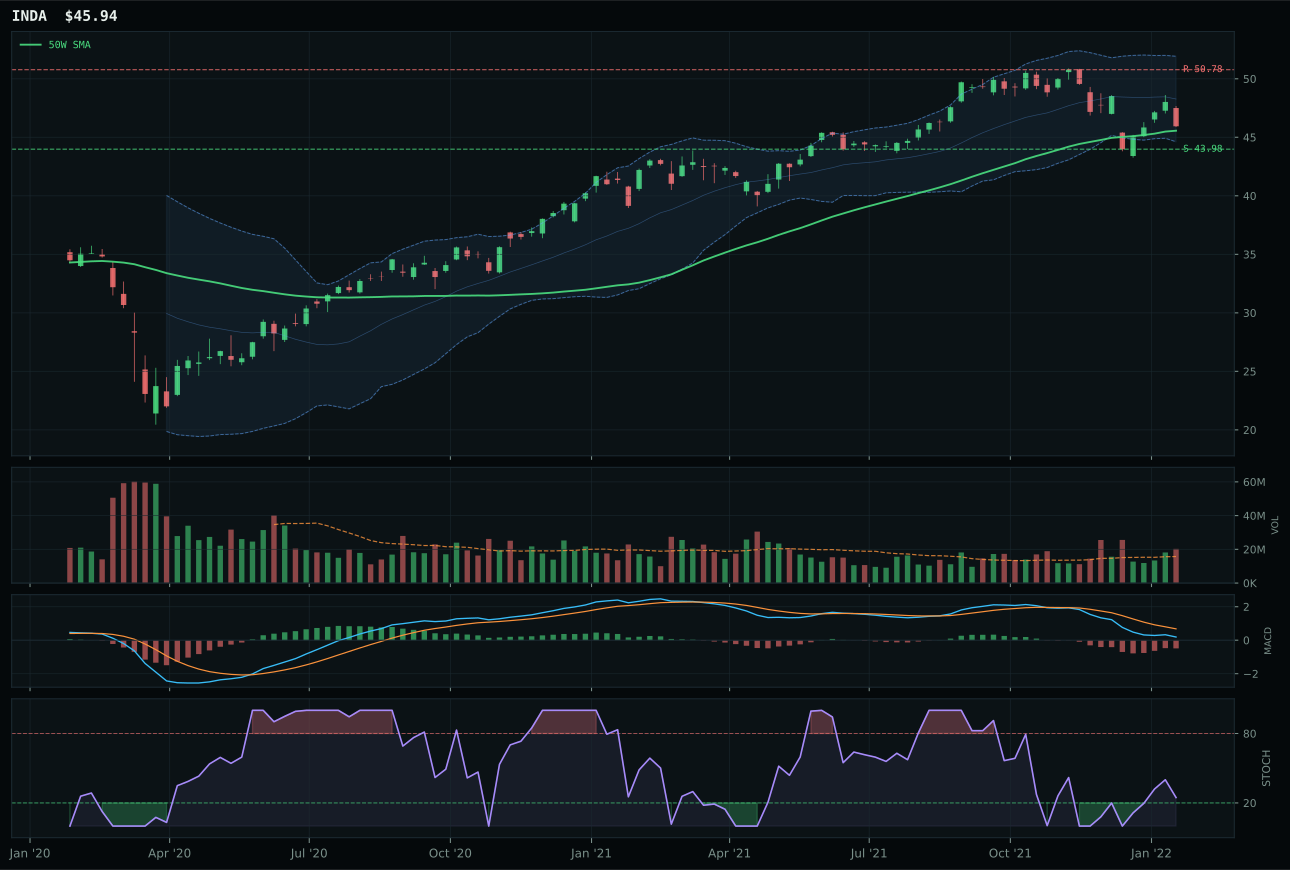
INDA has a pullback into support profile with -3.6% 13-week relative strength versus SPY.
A failed hold above support would weaken the setup.
Actionable but governed by invalidation levels.
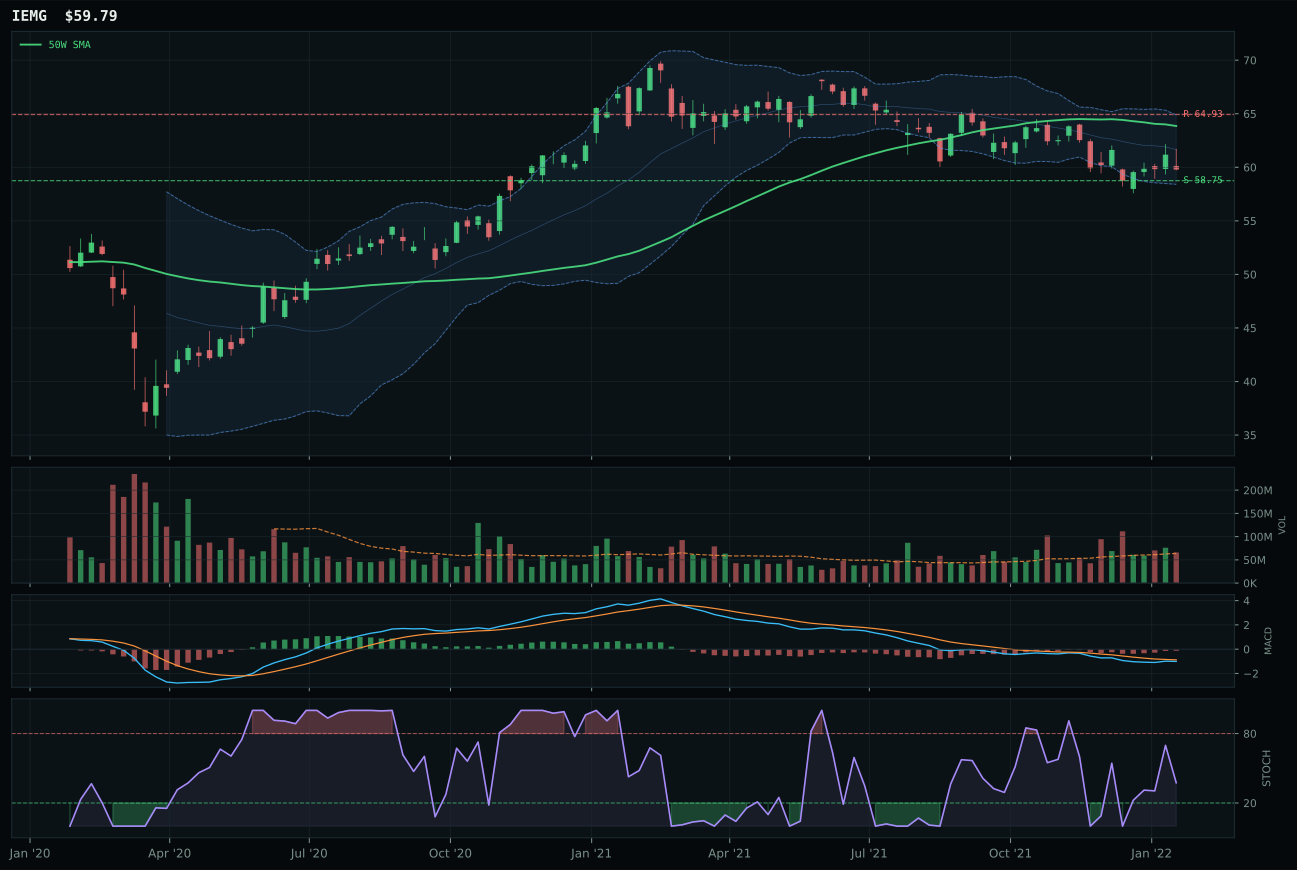
IEMG has a pullback into support profile with -2.7% 13-week relative strength versus SPY.
A failed hold above support would weaken the setup.
Actionable but governed by invalidation levels.
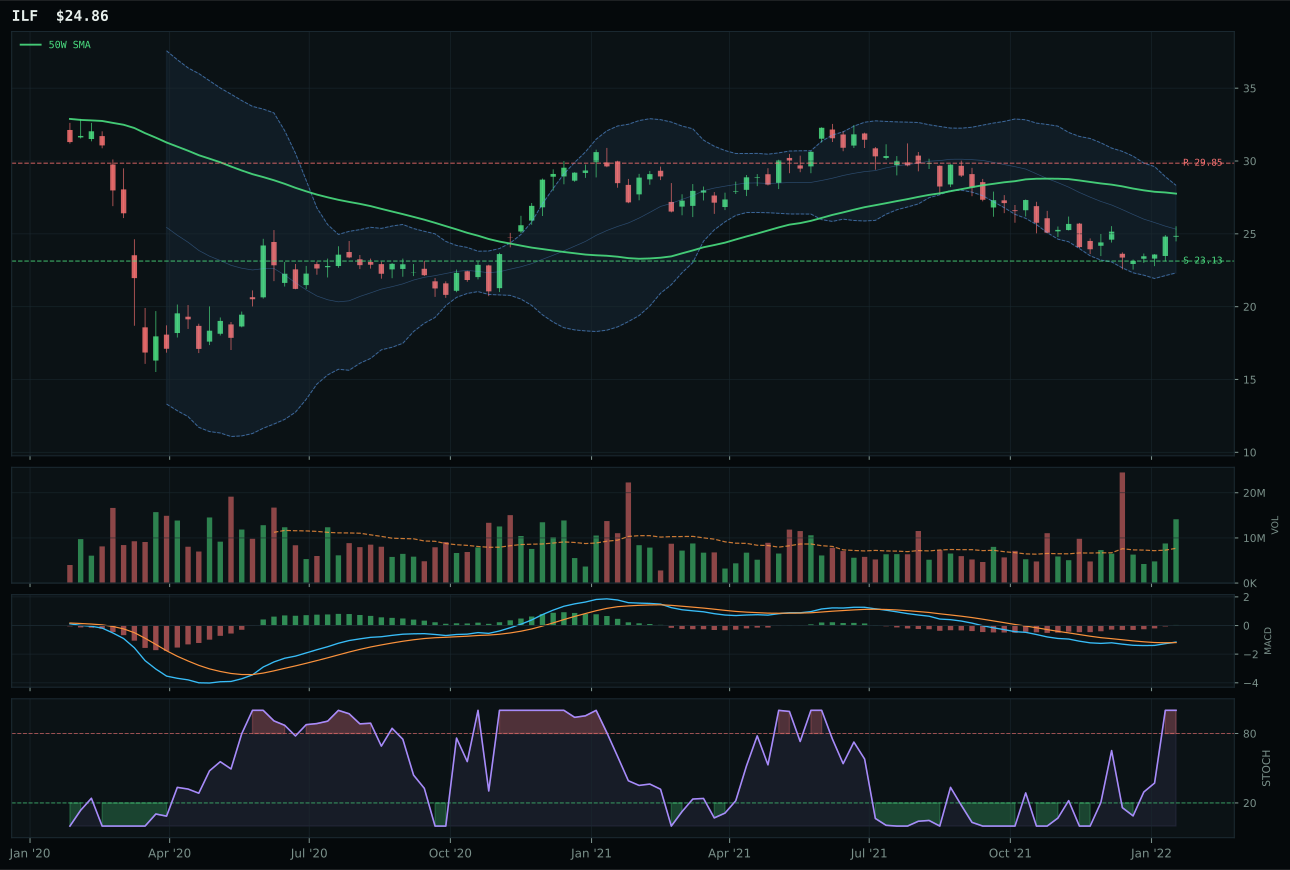
ILF has a neutral structure profile with -0.2% 13-week relative strength versus SPY.
Extension and support failure are the main tactical risks.
Tracked, but not top-2 eligible because: structurally broken.
INDA captures the category on superior structure (79.4 vs 75.0 for IEMG) and perfect 100.0 timing despite both charts sitting in pullback-into-support patterns with similar MACD bearish-but-improving conditions. INDA's 0.8% distance to the 50W and above-average volume at 1.29x the 20-week average mark it as tighter compression and genuine accumulation, whereas IEMG's neutral volume signals weak participation. Category-relative strength of -0.9% (INDA) versus 0.0% (IEMG) barely separates them, but INDA's 91.5 risk/reward (9.5% upside to 50.78 resistance, 4.5% downside to 43.98 support) edges IEMG's 90.0. Both carry -3% to -6% 13-week underperformance, so this is a clean structural call, not a momentum decision. INDA's rising-mid-zone stochastic RSI (0.25) versus IEMG's identical state suggests they are in phase, but INDA's price proximity to the 50W gives it the sharper setup.
Emerging Markets is allocated 0%—completely excluded this week—because the 25.3 category score and 10th-place rank reflect a 35.0 macro fit that is the second-weakest in the portfolio. Dollar pressure is -14 and broad market bear is -9, creating a macro headwind that overwhelms any technical recovery setup. INDA's 76.2 technical evidence is respectable, but the category's 51.9 persistence score reveals that capital is not accumulating—volume-price confirmation is breaking down. This is a tactical mean-reversion candidate in a structurally unfriendly regime, not a strategic holding. Emerging Markets will re-enter allocation only when dollar weakness accelerates materially or when broad market bearishness reverses; until then, the 10% capital allocated here is better deployed in commodity inflation hedges and defensive real assets.