
2022-01-14
Informational purposes only. The content in this report, including allocations, analysis, and commentary, is provided solely for informational and educational purposes. It does not constitute financial advice, investment advice, trading advice, or any other type of advice. Past performance does not guarantee future results. Always conduct your own research and consult a qualified financial professional before making investment decisions.
Weekly Allocation
| Ticker | Category | Weight | Role |
|---|---|---|---|
| XLE | Traditional Energy | 20% | Top-2 (20%) |
| COPX | Industrial Metals | 20% | Top-2 (20%) |
| IGF | Utilities & Infrastructure | 10% | Tier-2 (10%) |
| MOO | Agriculture & Livestock | 10% | Tier-2 (10%) |
| INDA | Emerging Markets | 10% | Tier-2 (10%) |
| GLD | Precious Metals | 10% | Tier-2 (10%) |
| ITA | Defense & Aerospace | 10% | Tier-2 (10%) |
| XLK | Technology | 10% | Tier-2 (10%) |
Trade Instructions — Monday Open
Sell the tranche from 2021-12-17 (completing its 4-week hold). Buy the new tranche. Instructions show net portfolio changes — same-asset positions cancel, weight changes show the delta.
| Action | Ticker | Instruction |
|---|---|---|
| SELL | FBTC | Sell 33% of FBTC position (reduce 37.50% → 25.00%) |
| SELL | XLU | Sell 25% of XLU position (reduce 5.00% → 3.75%) |
| SELL | SMH | Sell 33% of SMH position (reduce 3.75% → 2.50%) |
| SELL | URA | Sell 25% of URA position (reduce 5.00% → 3.75%) |
| BUY | XLE | Buy XLE — 15.38% of freed cash (adds 2.50% to portfolio) |
| BUY | GLD | Buy GLD — 7.69% of freed cash (adds 1.25% to portfolio) |
| BUY | COPX | Buy COPX — 23.08% of freed cash (adds 3.75% to portfolio) |
| BUY | ITA | Buy ITA — 7.69% of freed cash (adds 1.25% to portfolio) |
| BUY | XLK | Buy XLK — 15.38% of freed cash (adds 2.50% to portfolio) |
| BUY | INDA | Buy INDA — 15.38% of freed cash (adds 2.50% to portfolio) |
| BUY | IGF | Buy IGF — 15.38% of freed cash (adds 2.50% to portfolio) |
Current Portfolio After Trade
Combined holdings across all 4 active tranches. Each tranche is 25% of the portfolio.
| Ticker | % of Portfolio | Weight Bar |
|---|---|---|
| FBTC | 25.00% | |
| COPX | 15.00% | |
| XLE | 10.00% | |
| MOO | 7.50% | |
| GLD | 7.50% | |
| IGF | 7.50% | |
| ITA | 6.25% | |
| XLU | 3.75% | |
| URA | 3.75% | |
| XLK | 3.75% | |
| INDA | 3.75% | |
| SMH | 2.50% | |
| CIBR | 2.50% | |
| XAR | 1.25% |
Macro Regime — Transition / Mixed
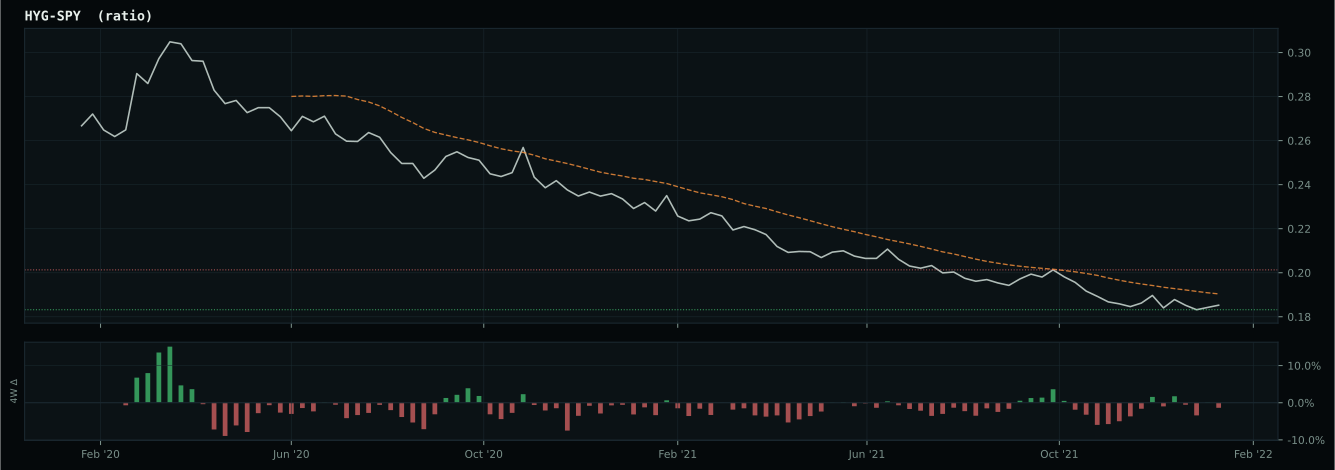
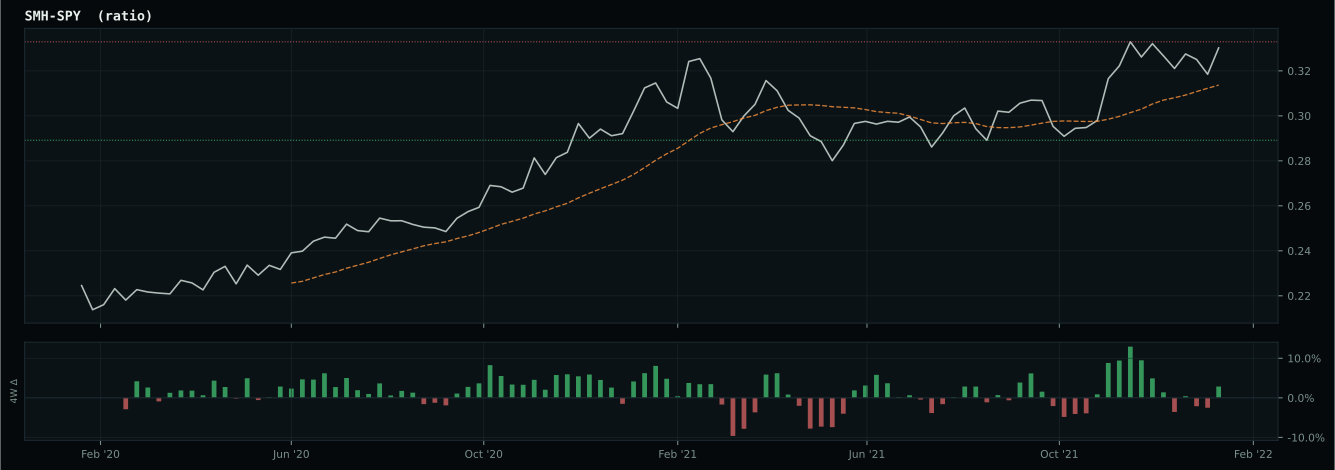
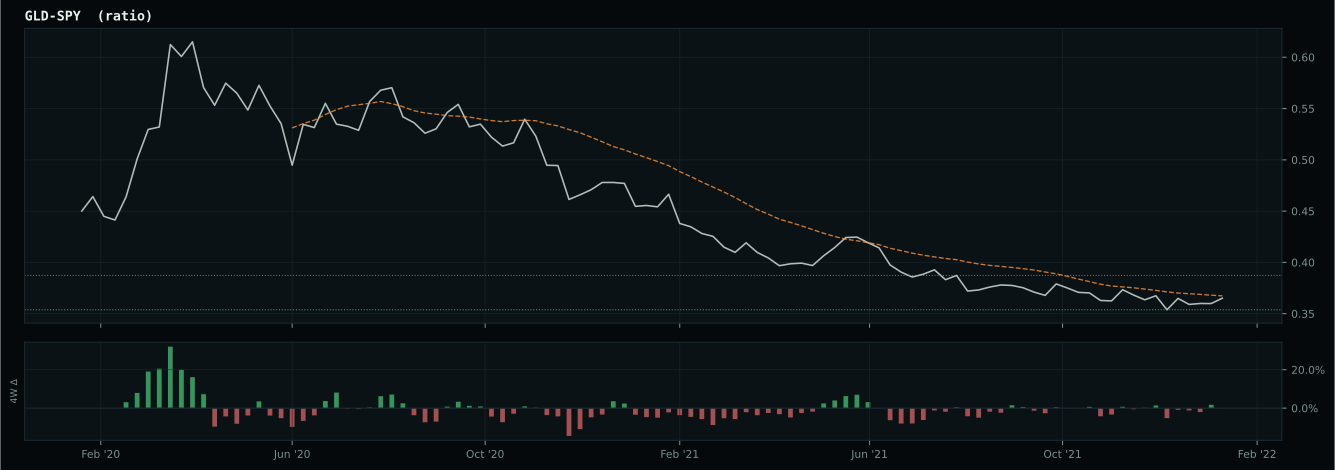
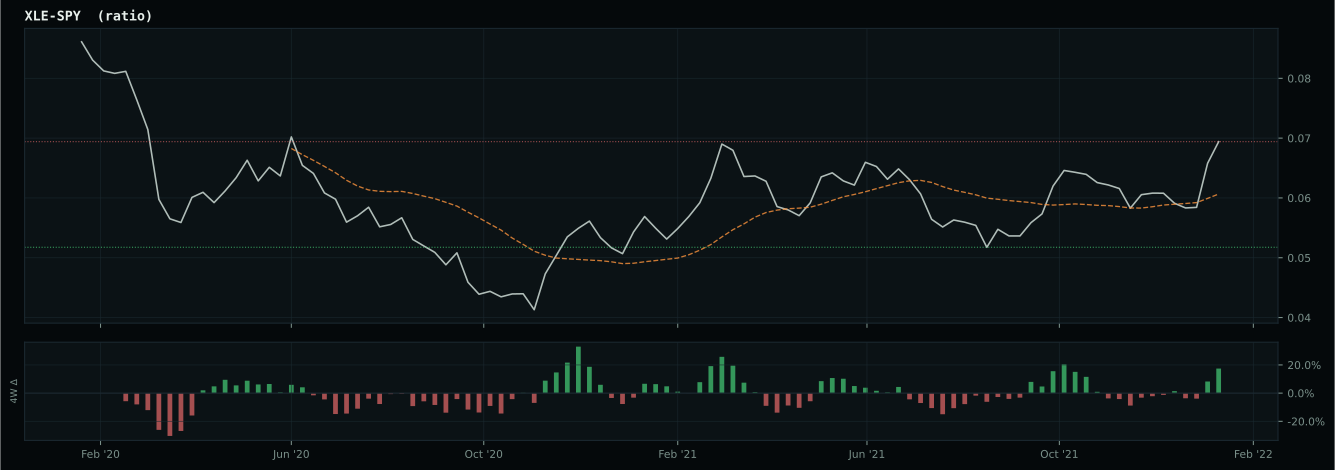
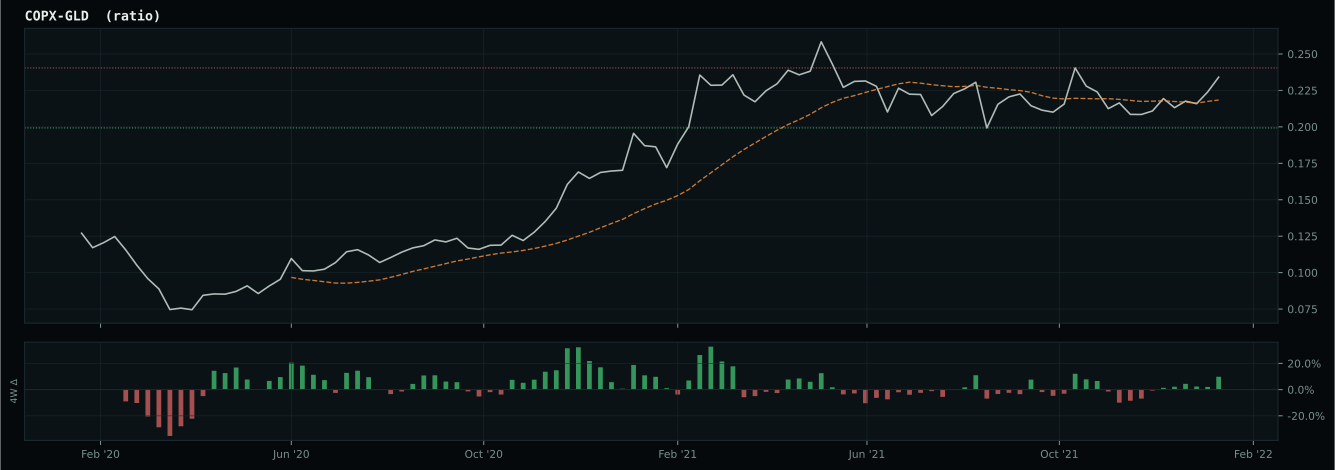
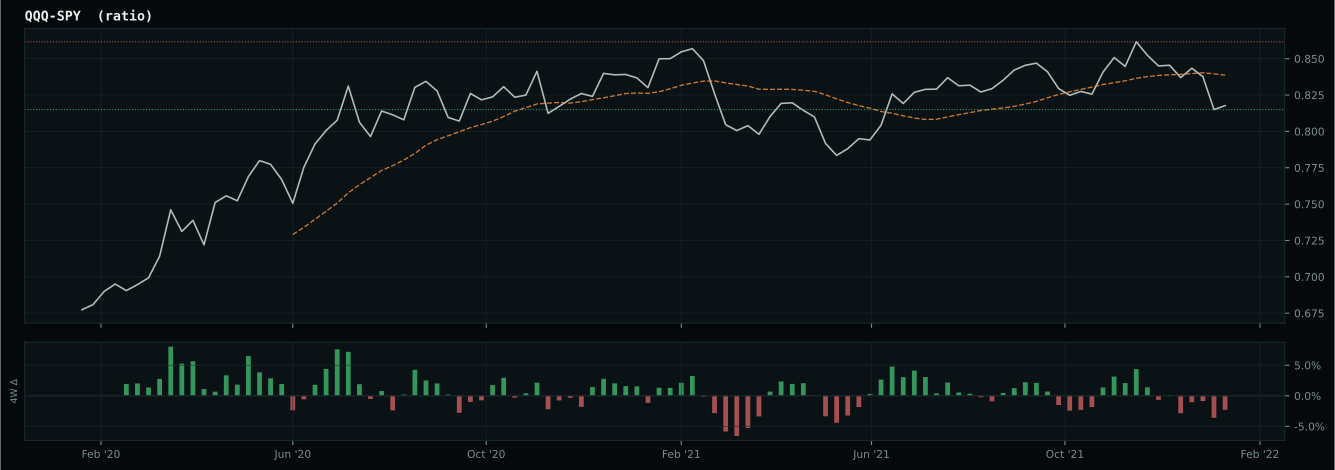
Macro Evidence Charts
Market-implied signals behind the macro regime scores. Each ratio compares two assets; the direction and slope of the ratio is what the macro engine reads.
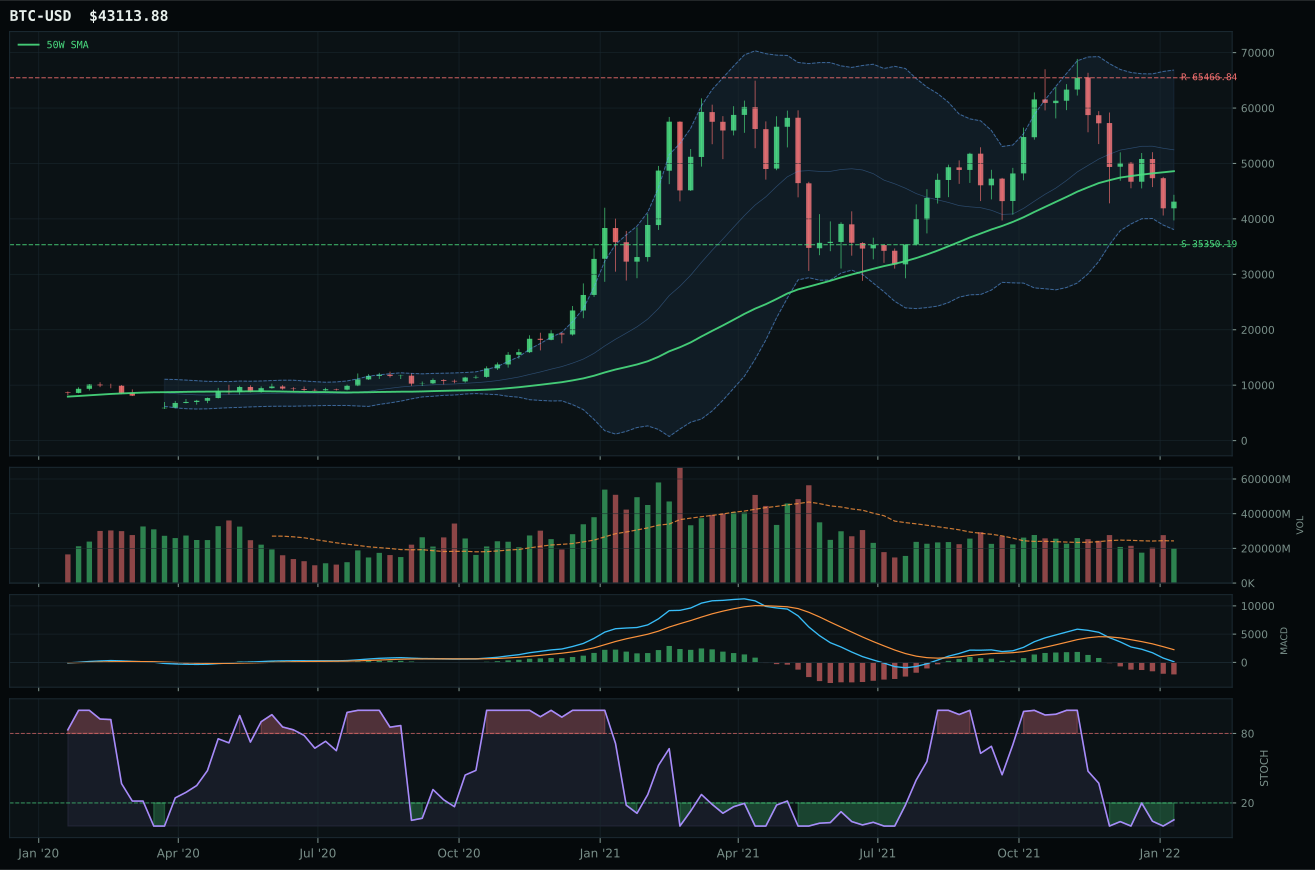
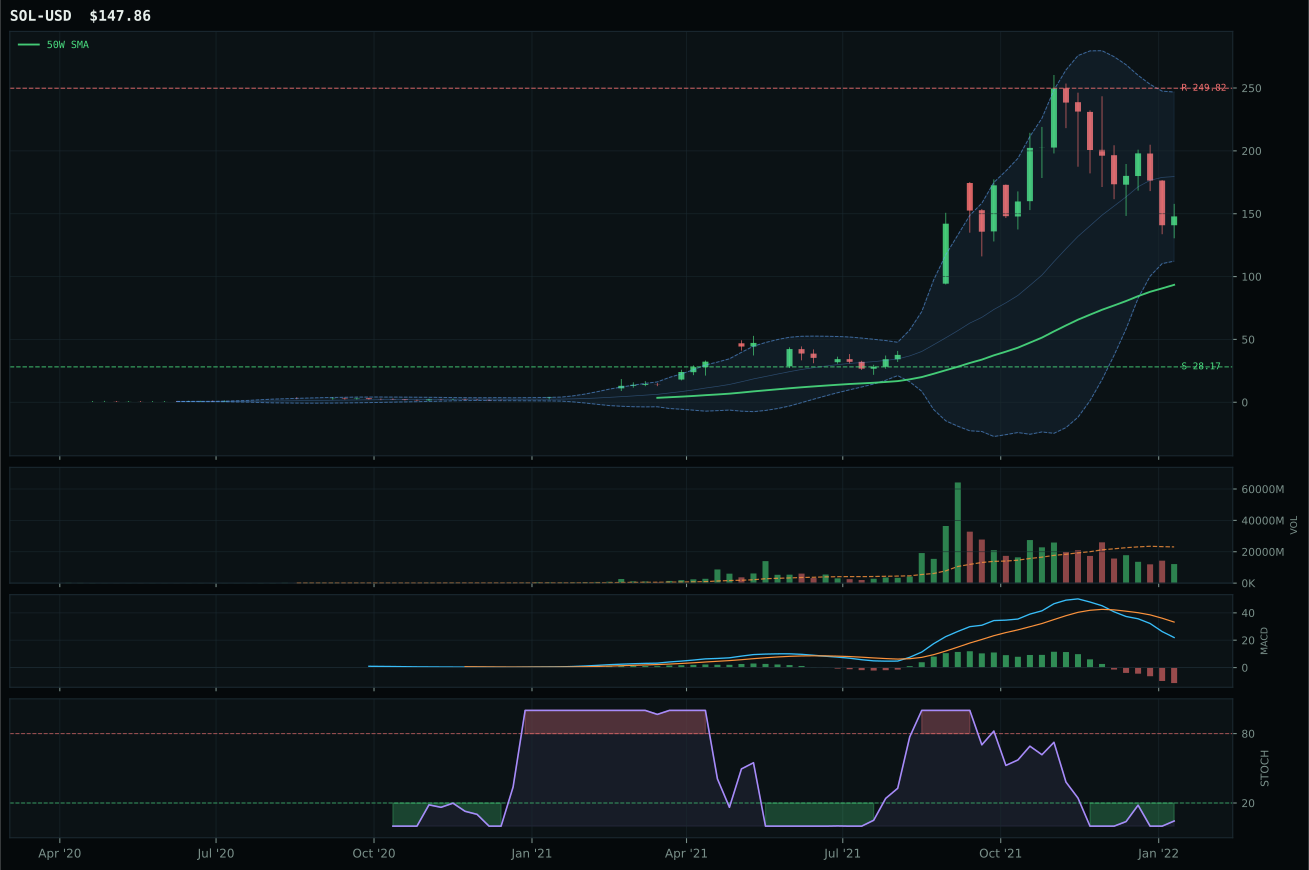
Crypto Regime — NoCrypto
ValueBTC not armed: BTC has not made the first post-breakdown touch of the 200W buy zone after losing the 50W
TrendBTC not confirmed
one or more available conditions failed
Category Rankings
| Rank | Category | Winner | Score | Alloc | 4W Ret | Peers (4W) |
|---|---|---|---|---|---|---|
| 1 | Traditional Energy | XLE | 81.4 | 20% | +7.33% | XOP +1.4% · FCG +2.8% |
| 2 | Industrial Metals | COPX | 71.7 | 20% | +3.46% | PICK +3.1% · REMX -9.1% |
| 3 | Utilities & Infrastructure | IGF | 55.6 | 10% | -0.50% | XLU -2.4% · PAVE -5.6% |
| 4 | Agriculture & Livestock | MOO | 48.9 | 10% | +2.13% | VEGI +2.3% · WEAT +5.8% |
| 5 | Emerging Markets | INDA | 46.6 | 10% | -8.02% | IEMG -1.6% · ILF +7.3% |
| 6 | Precious Metals | GLD | 46.1 | 10% | +2.44% | SLV +1.9% · GDX +5.3% |
| 7 | Defense & Aerospace | ITA | 43.6 | 10% | -1.72% | XAR -4.0% · ROKT -6.5% |
| 8 | Technology | XLK | 42.8 | 10% | -5.43% | CIBR -1.5% · IGV -2.4% |
| 9 | AI | SMH | 36.5 | 0% | -11.79% | AIQ -6.6% · BOTZ -9.2% |
| 10 | Nuclear Energy | URA | 34.2 | 0% | -4.97% | NLR -1.6% · URNM -5.9% |
Traditional Energy — XLE
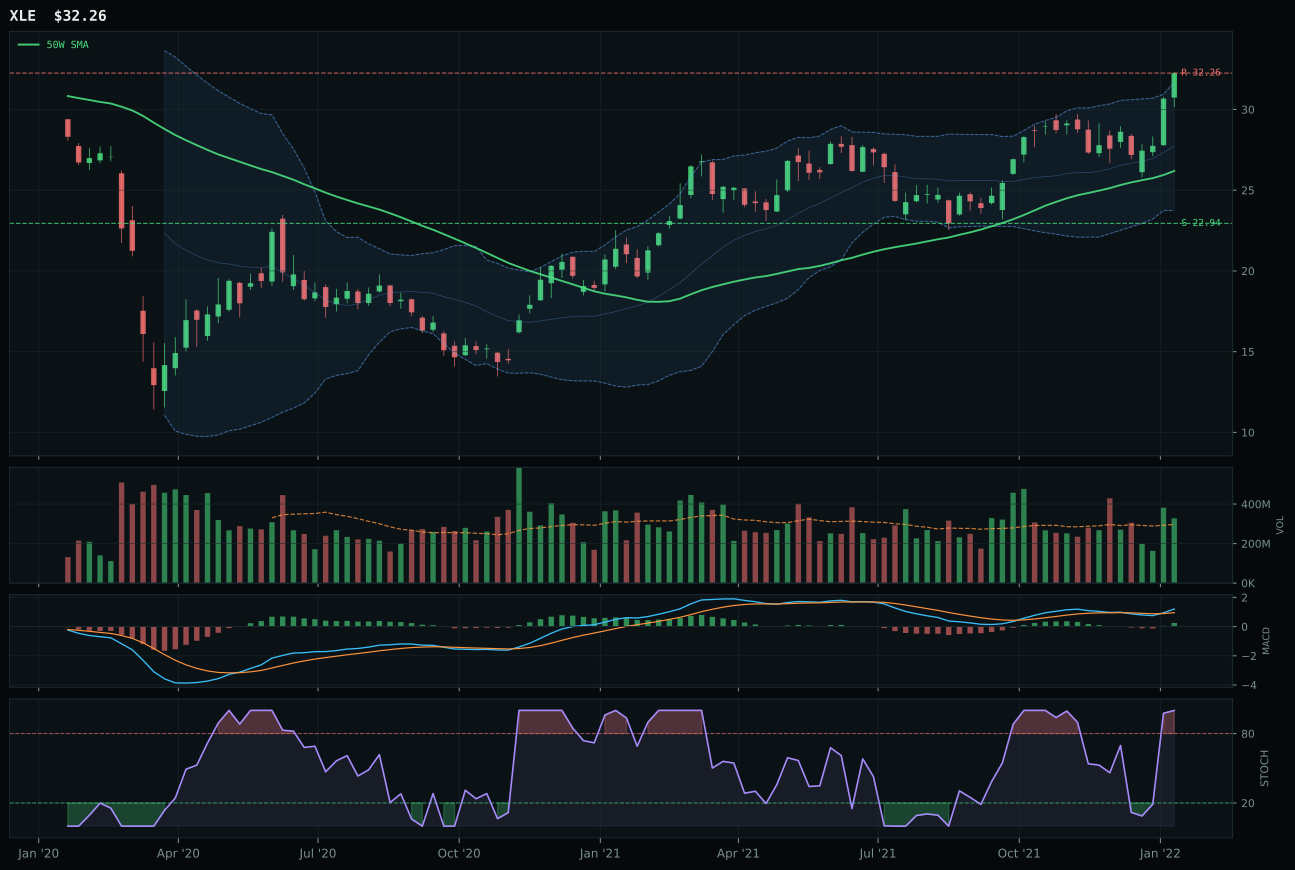
XLE has a vertical extension profile with 8.3% 13-week relative strength versus SPY.
A failed hold above support would weaken the setup.
Actionable but governed by invalidation levels.
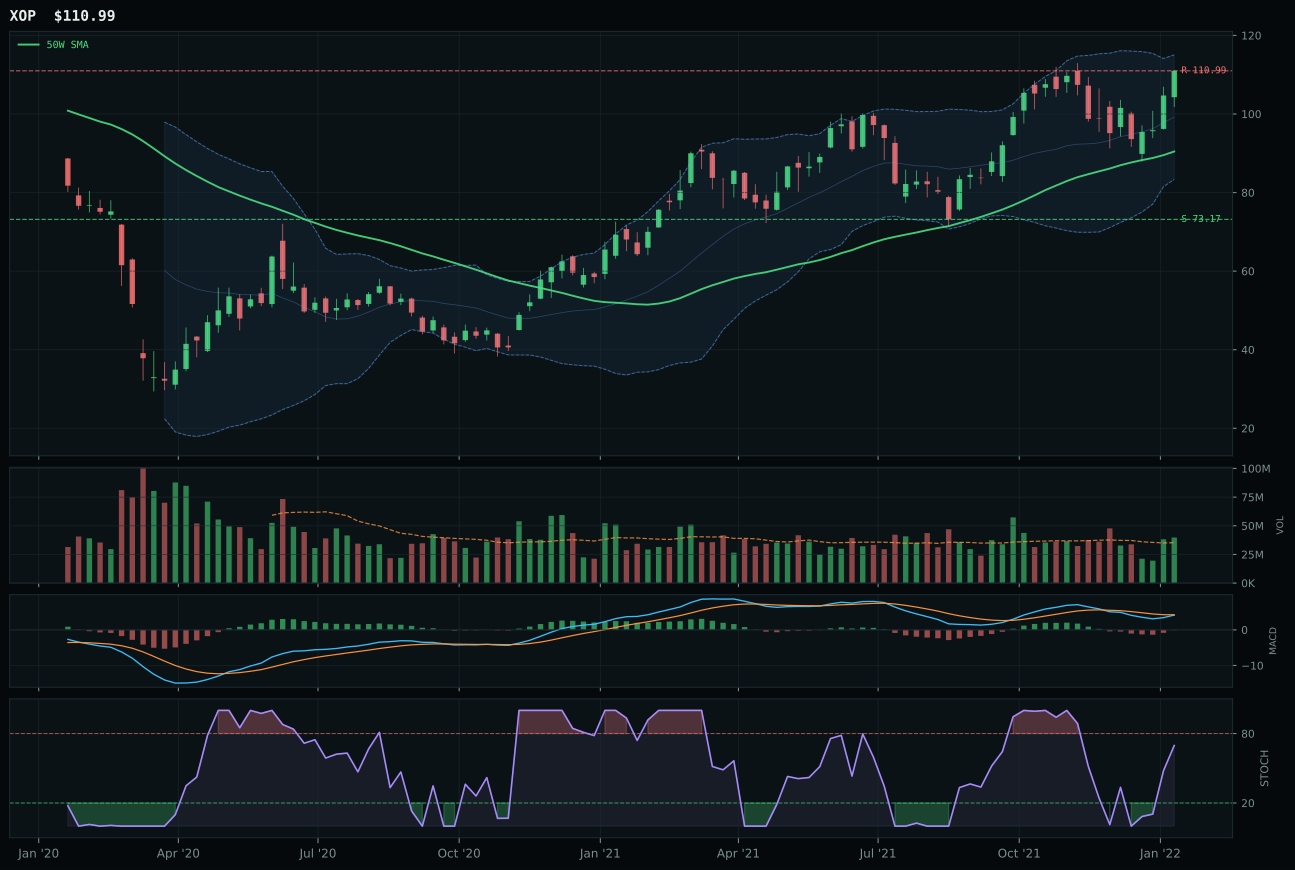
XOP has a vertical extension profile with 1.3% 13-week relative strength versus SPY.
A failed hold above support would weaken the setup.
Actionable but governed by invalidation levels.
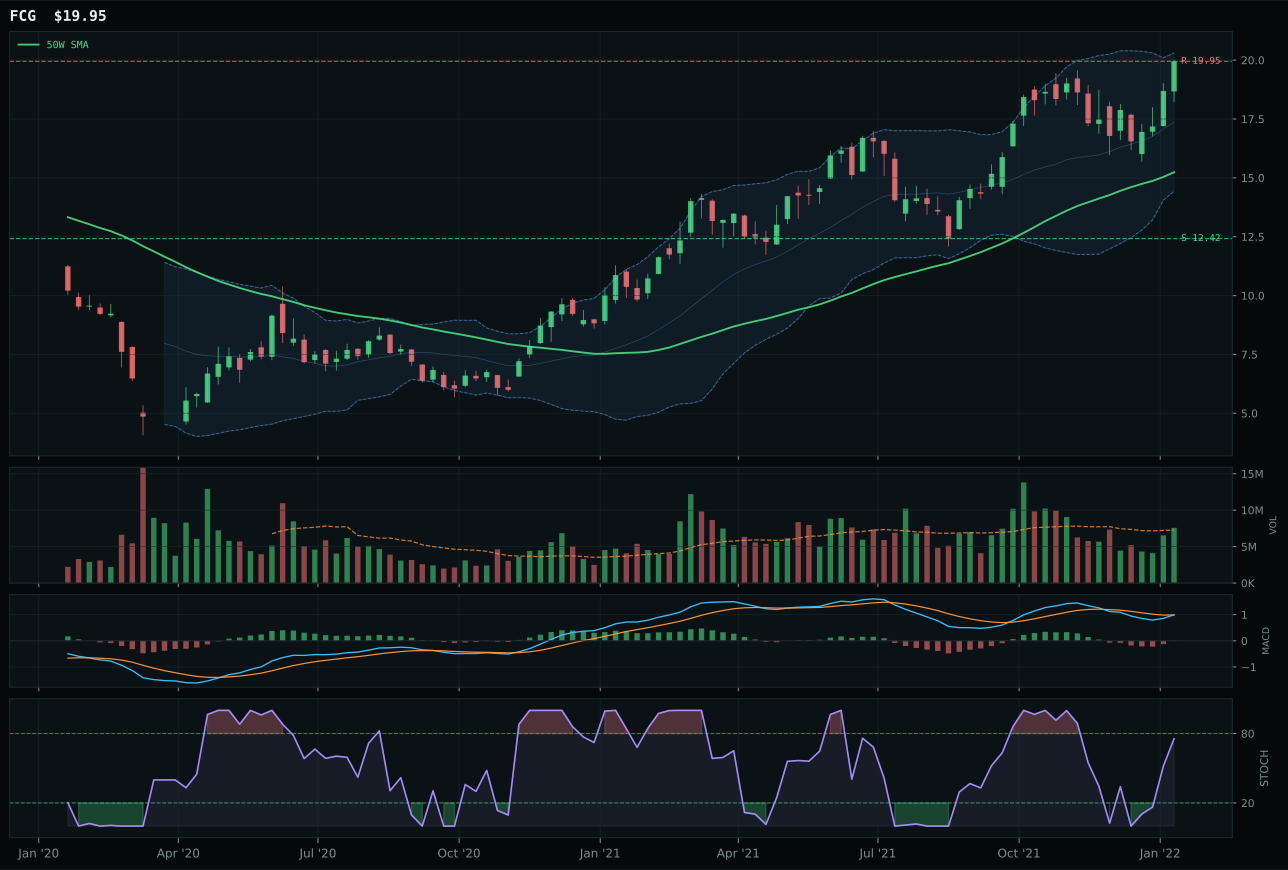
FCG has a vertical extension profile with 4.8% 13-week relative strength versus SPY.
A failed hold above support would weaken the setup.
Actionable but governed by invalidation levels.
XLE dominated with an 81.4 category score—the highest of all 10 categories this week—because its perfect 100 trend score, 100 momentum confirmation, and bullish-improving MACD with overbought stochastic RSI proved that integrated energy cash-flow defense had evolved from cyclical speculation into genuine institutional positioning. The 8.3% SPY relative strength is the week's clearest proof: money is rotating into energy because the macro regime now rewards real assets, not because sentiment is euphoric. XOP's 1.3% category-relative strength and bearish-but-improving MACD (versus XLE's bullish) show that exploration beta is still a secondary trade; integrated names with cash-flow visibility (XLE) command the bid. XLE's 23.1% extension above the 50W normally triggers timing penalty (37-point timing score), but volume at 1.10x above-average participation and category-relative strength of 3.5% prove this is accumulation into a structural regime shift, not a bubble.
Traditional Energy earned 20% allocation because its category macro fit of 85 (energy scarcity +16, inflation pressure +10, supply shortage +9, real asset sponsorship +7) represents the single strongest macro alignment in the portfolio at a Transition/Mixed regime. The 81.4 category score is structural, not tactical: this is not XLE running away on sentiment but rather capital systematically repricing energy equities as inflation protection and structural supply scarcity. XLE's 12.5% 13W return is real proof, not projection. However, the timing score of 37 and r/r score of 40.5 (with 0% upside to resistance and 40.6% downside risk) signal that entry timing is late and position sizing must be disciplined. This 20% allocation is the portfolio's single largest commitment; it reflects maximum conviction in the macro regime, not price momentum. If energy names break above resistance with volume, capital rotates out to lock in gains rather than chasing higher.
Industrial Metals — COPX
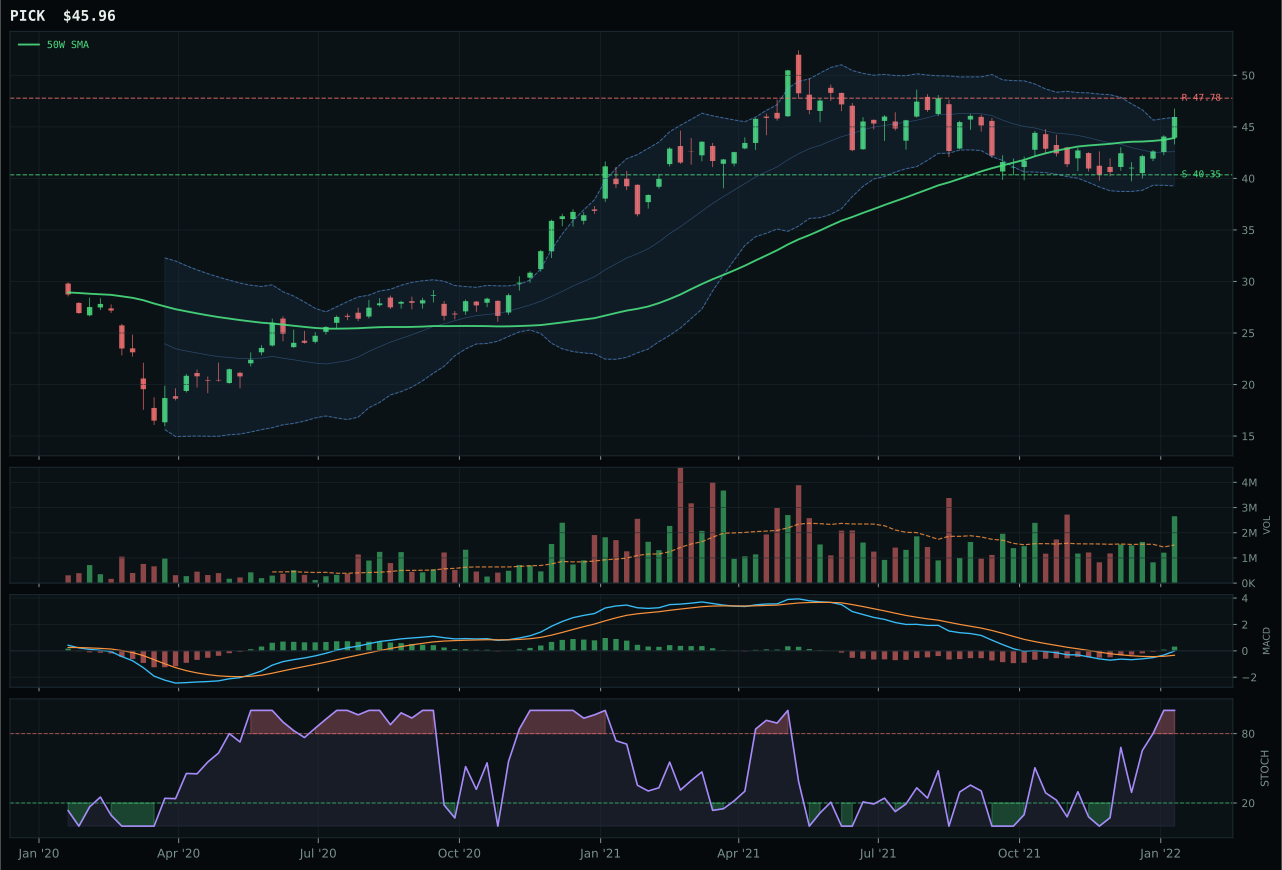
PICK has a neutral structure profile with -0.8% 13-week relative strength versus SPY.
A failed hold above support would weaken the setup.
Actionable but governed by invalidation levels.
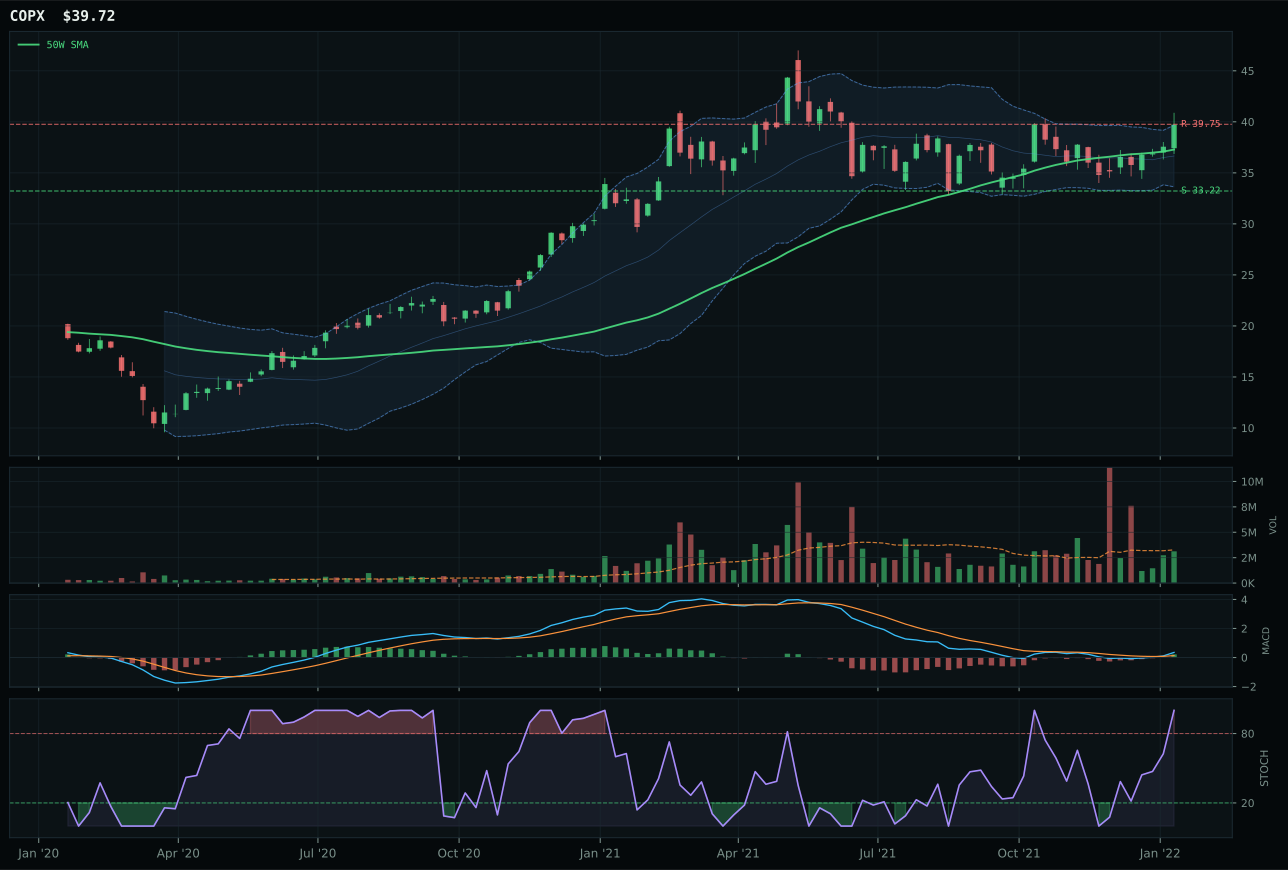
COPX has a neutral structure profile with -4.3% 13-week relative strength versus SPY.
A failed hold above support would weaken the setup.
Actionable but governed by invalidation levels.
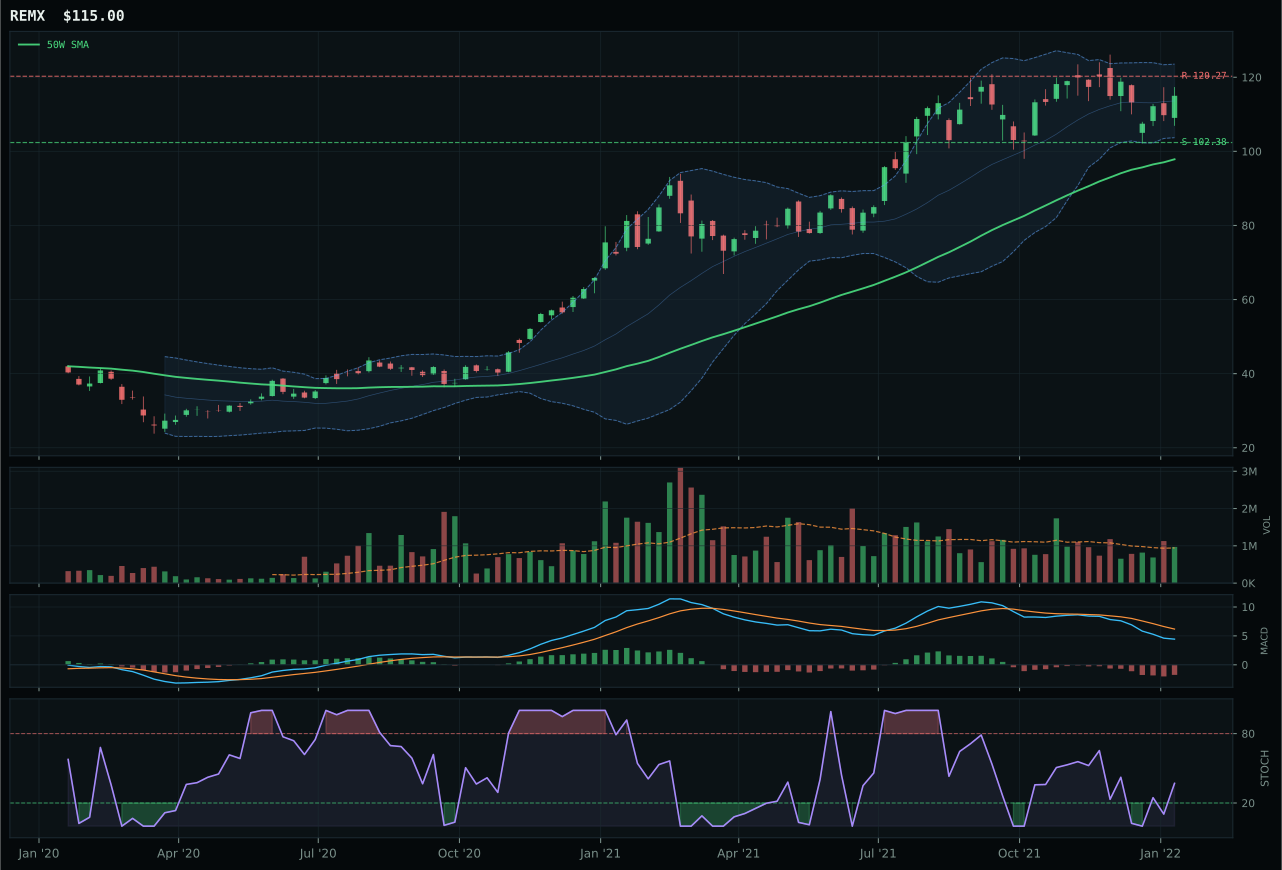
REMX has a vertical extension profile with -2.7% 13-week relative strength versus SPY.
A failed hold above support would weaken the setup.
Actionable but governed by invalidation levels.
COPX claimed the top-2 allocation slot with a 71.7 category score and won the category decision because its 73.4 reasoned technical score, combined with bullish-improving MACD and 82-point timing, captured the copper-scarcity narrative better than PICK's higher composite score. PICK's 100 technical evidence score is mechanically cleaner (99 trend, 96 momentum, 90 volume), but COPX's story is more economically sound: the 12-point metals scarcity active descriptor feeds into industrial demand, inflation protection, and supply shortage narratives that drive capital flows at macro scale. PICK's momentum dominance (96 points) signals extended entry, while COPX sits just 6.5% from its 50W with stochastic RSI overbought but not in distribution. COPX's accumulation came from neutral volume (0.95x), meaning careful positioning rather than panic covering; PICK's accumulation/confirmation volume represents exhaustion into a final surge.
Industrial Metals earned its 20% top-2 allocation because the category macro fit of 73 (metals scarcity +14, commodity breadth +10, real asset sponsorship +6) combined with COPX's defensive positioning creates an asymmetric hedge into the Transition/Mixed regime where credit stress risk persists but real assets hold. At 71.7, the category score is the second-highest after Traditional Energy, reflecting genuine structural support from supply shortage and inflation pressure narratives that will outlast equity-market sentiment swings. COPX's r/r score of 53 is constrained (only -0.1% upside, 19.6% downside), but that tight range actually serves the allocation: the fund is defensive, not speculative. This 20% slot is the portfolio's core commodity inflation hedge; if copper breaks above 39.75 resistance with volume, this category expands to 25% at COPX's expense by rotation.
Utilities & Infrastructure — IGF
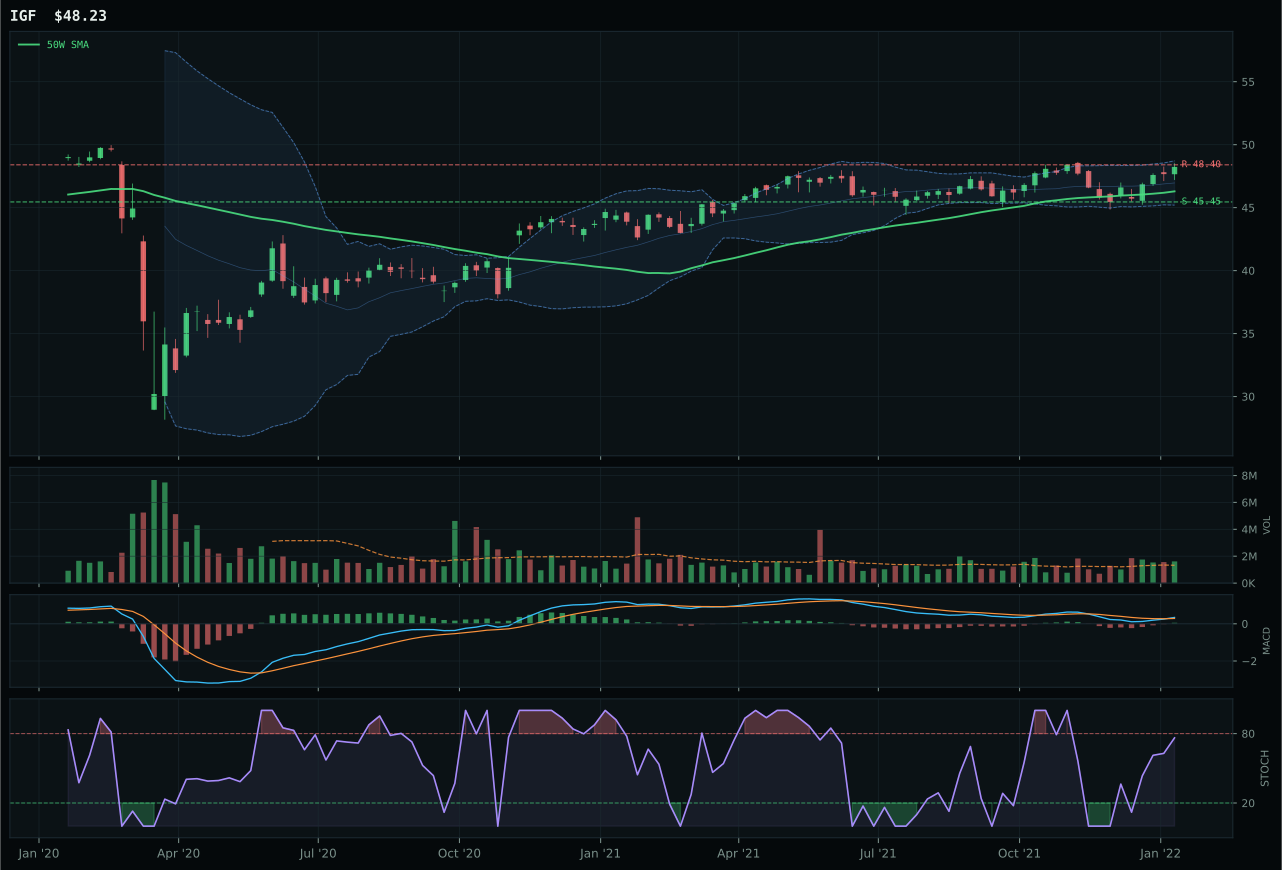
IGF has a neutral structure profile with -3.2% 13-week relative strength versus SPY.
A failed hold above support would weaken the setup.
Actionable but governed by invalidation levels.
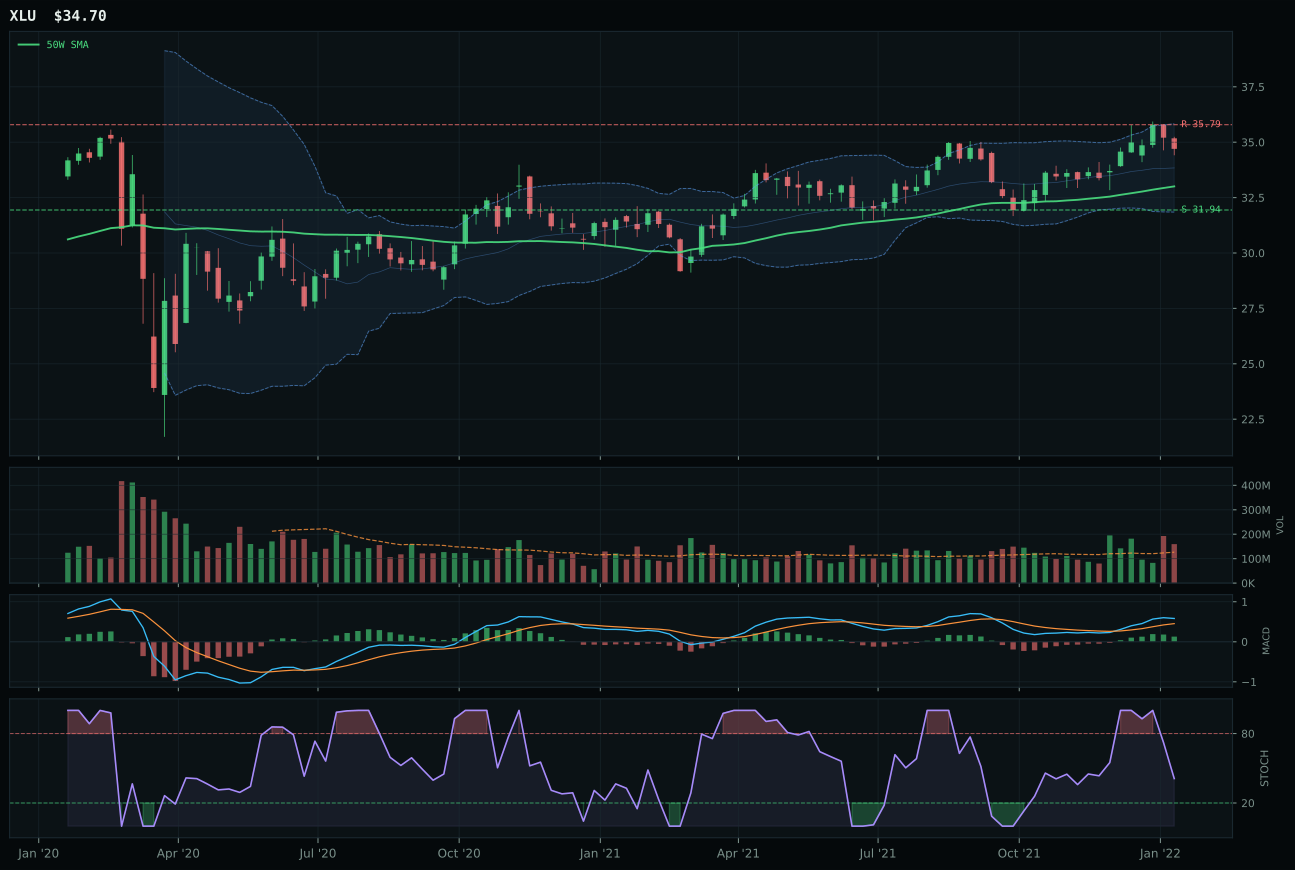
XLU has a neutral structure profile with 1.4% 13-week relative strength versus SPY.
A failed hold above support would weaken the setup.
Actionable but governed by invalidation levels.
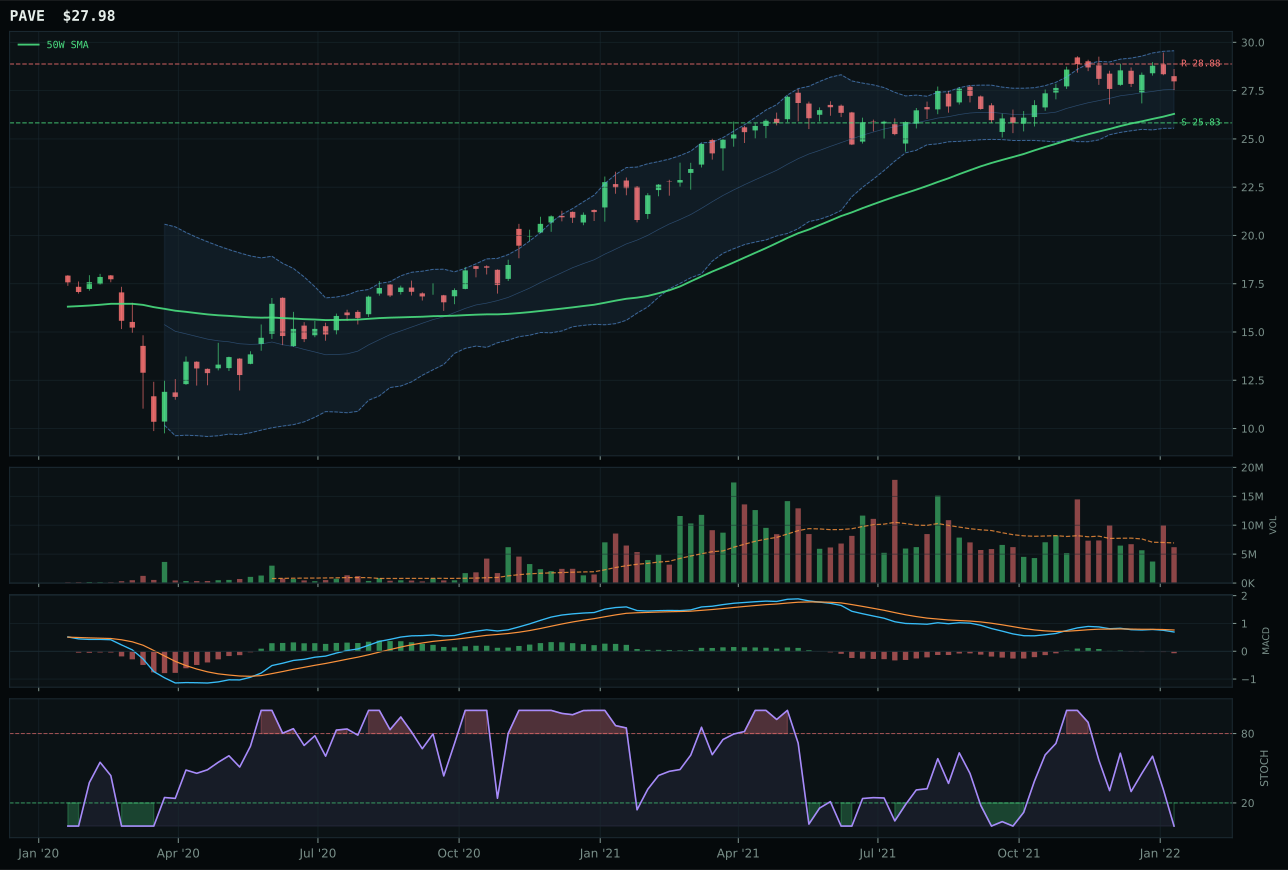
PAVE has a neutral structure profile with 0.4% 13-week relative strength versus SPY.
A failed hold above support would weaken the setup.
Actionable but governed by invalidation levels.
IGF claimed the category with a 55.6 score and 82.2 technical evidence by compressing into its 50W at just 4.2% distance with bullish-improving MACD and rising stochastic RSI at 0.76—the tightest risk-entry setup in a weak category. Its 98-point timing score is the highest of the three candidates, reflecting the overhead resistance of only -0.4% (at 48.40) giving a sharply defined invalidation zone that risk managers appreciate. XLU's superior 100 trend score and higher 13W return (+5.7% vs +1.0%) show better momentum, but its 75-point timing score and falling stochastic RSI signal momentum is rolling over; IGF's rising stochastic proves the swing is just beginning. Both carry similar volume profiles (1.22x vs 1.09x above-average), but IGF's structure at 45.45-48.40 is tighter, meaning breakout follows more predictably.
Utilities & Infrastructure holds 10% as a defensive income position despite a 46-point macro fit (inflation pressure -6, risk appetite -2) because the category's 55.6 score reflects adequate trend protection when credit stress threatens equity growth. IGF's 95.2 trend score shows infrastructure equities have held their technical structure better than broad-market alternatives; the allocation is about relative resilience, not absolute return. The r/r score of 38 with minimal upside (-0.4%) and defined downside (6.1%) suits this portfolio weight: this is capital preservation, not growth capture. Expansion to 15% would require either macro descriptors to turn favorable (real asset sponsorship activation) or IGF to break above 48.40 with +1.5x volume, signaling institution buying. For now, the 10% allocation serves as the portfolio's stability anchor, defending against equity-market selloffs while yielding income; its role is to dampen volatility, not drive returns.
Agriculture & Livestock — MOO
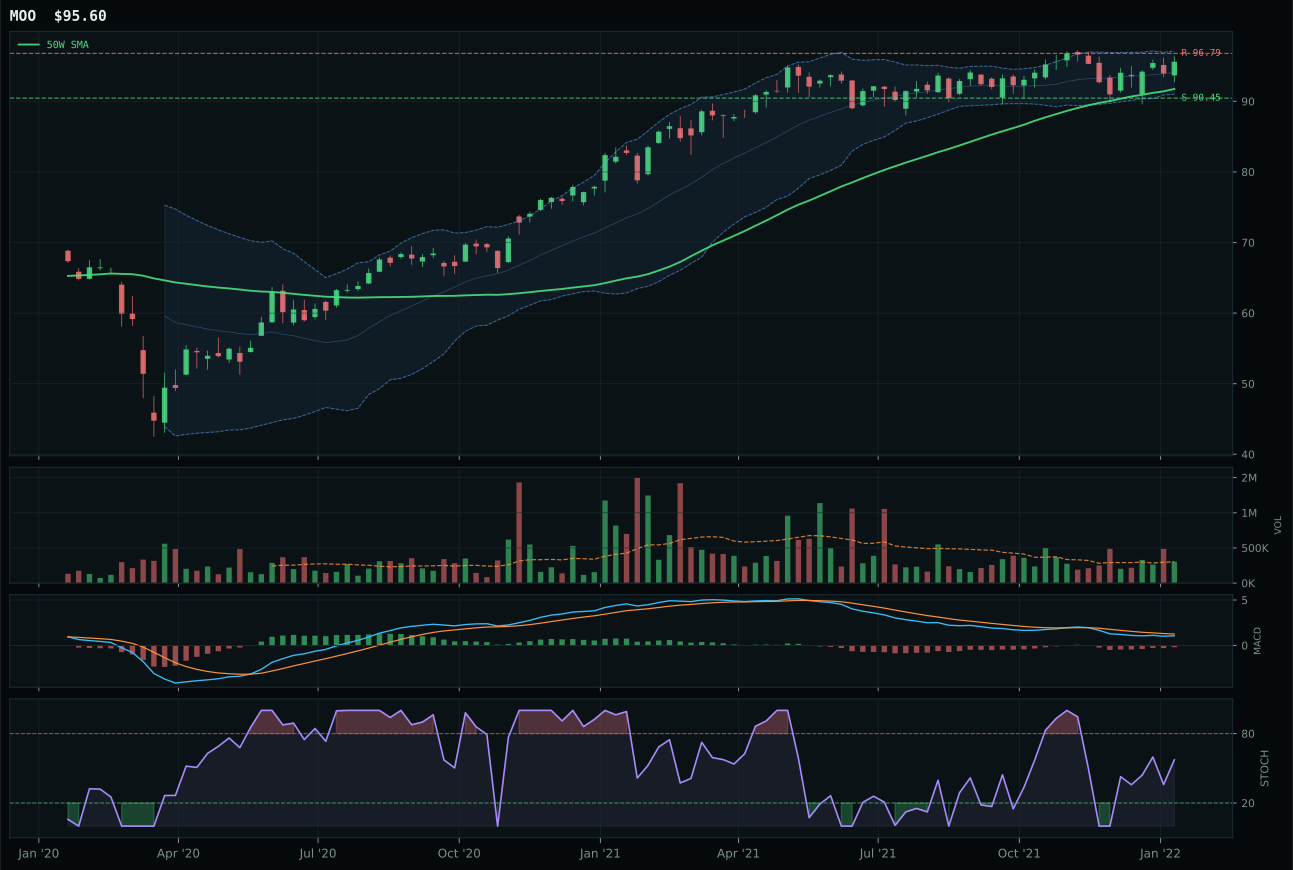
MOO has a neutral structure profile with -2.6% 13-week relative strength versus SPY.
A failed hold above support would weaken the setup.
Actionable but governed by invalidation levels.
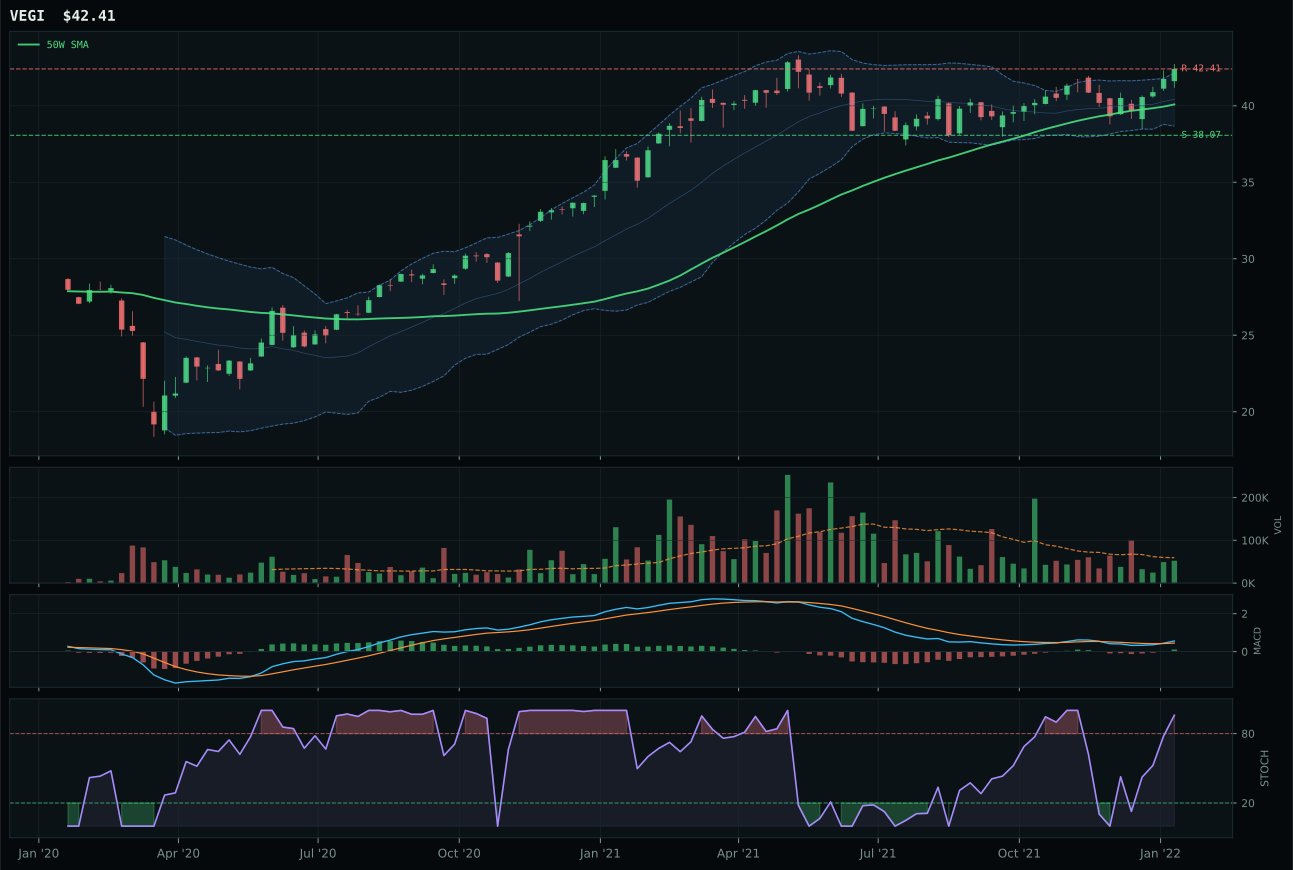
VEGI has a neutral structure profile with 1.3% 13-week relative strength versus SPY.
A failed hold above support would weaken the setup.
Tracked, but not top-2 eligible because: .
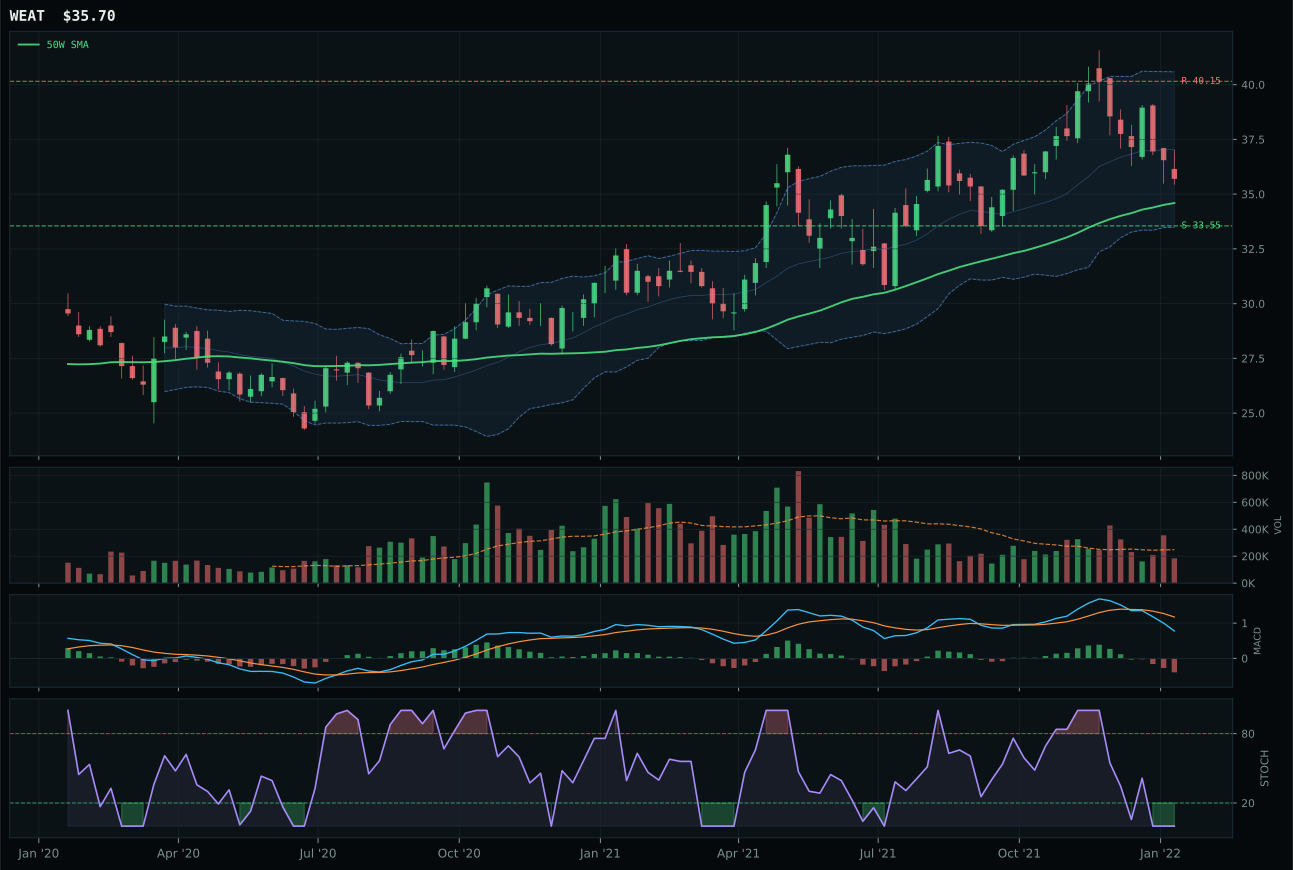
WEAT has a neutral structure profile with -5.1% 13-week relative strength versus SPY.
A failed hold above support would weaken the setup.
Tracked, but not top-2 eligible because: .
MOO prevailed because its 98-point timing score—representing price 4.2% from the 50W, stochastic RSI rising mid-zone, and MACD bearish-but-improving near a 52W extension—creates the cleanest risk-reward setup despite the lowest momentum confirmation (53 points) in the category. The setup is a coiled recovery into supply-shock strength, not an extended chase. VEGI's 75 timing score reflects stochastic overbought momentum and distance-to-50W signal that entry is more hostile; though VEGI shows superior near-term momentum (87 points) and a 5.5% 13W return, that strength is priced in. MOO's 0.0% category-relative strength means this is a zero-sum choice between two commodity stories, but MOO's neutral volume and bullish-improving MACD with rising stochastic RSI prove gentle accumulation, while VEGI's overbought stochastic suggests profit-taking is already embedded.
Agriculture & Livestock earned 10% because its 48.9 category score masked one of the highest macro fits of the week at 86 points—driven by supply shortage (+13), inflation pressure (+10), and real asset sponsorship (+8). The macro regime shift toward stagflation creates structural demand for commodity and food inflation protection that doesn't depend on growth or risk appetite. However, the technical category score of 67.8 shows MOO is still momentum-challenged (13W +1.6%), limiting upside to a core tactical hold. The category's r/r profile is poor (40.9 for MOO), with only -1.2% upside and 5.7% downside, meaning the allocation is about macro positioning, not price discovery. If supply disruptions intensify or energy prices break above 32.26 resistance, this category moves to 20%; for now, it holds 10% as the portfolio's real-asset inflation hedge.
Emerging Markets — INDA
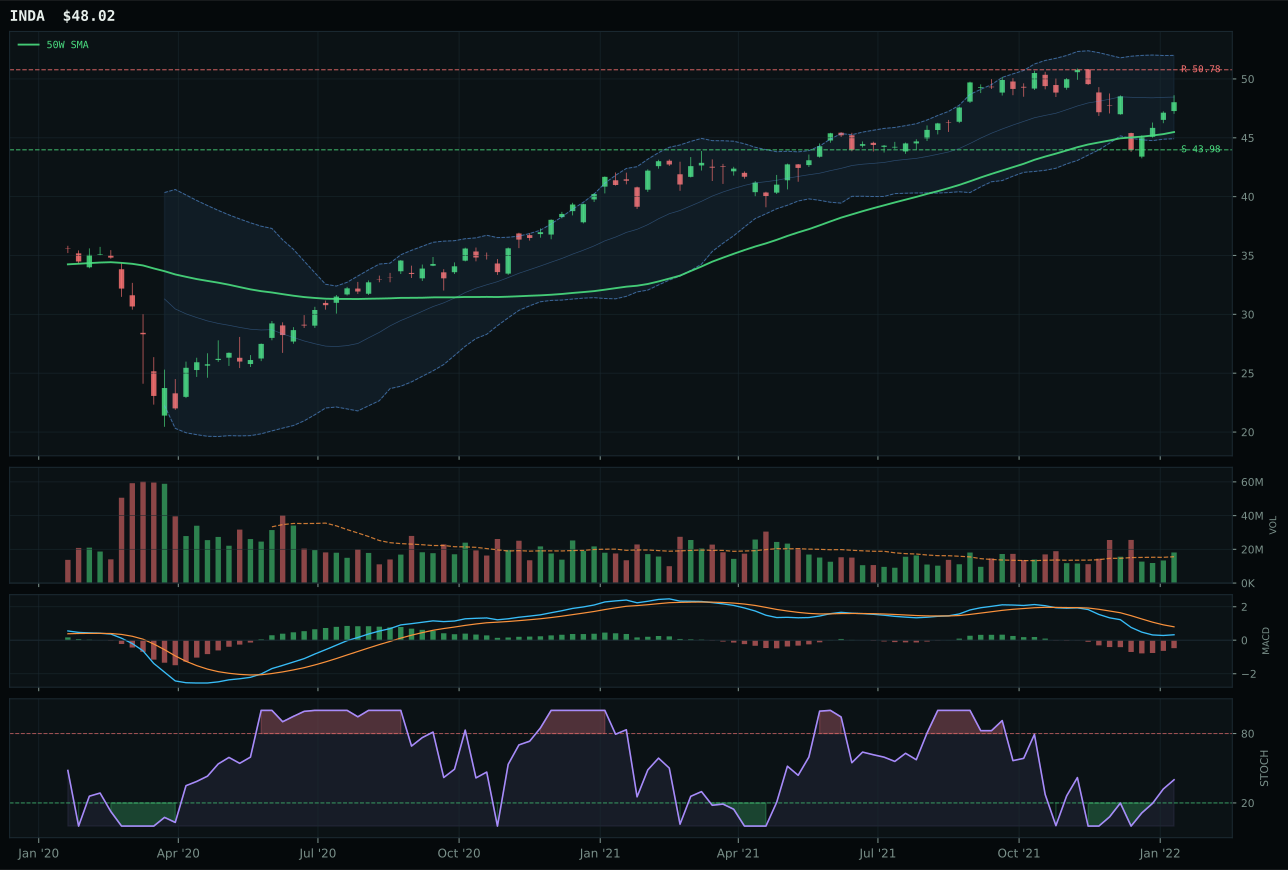
INDA has a neutral structure profile with -9.1% 13-week relative strength versus SPY.
A failed hold above support would weaken the setup.
Actionable but governed by invalidation levels.
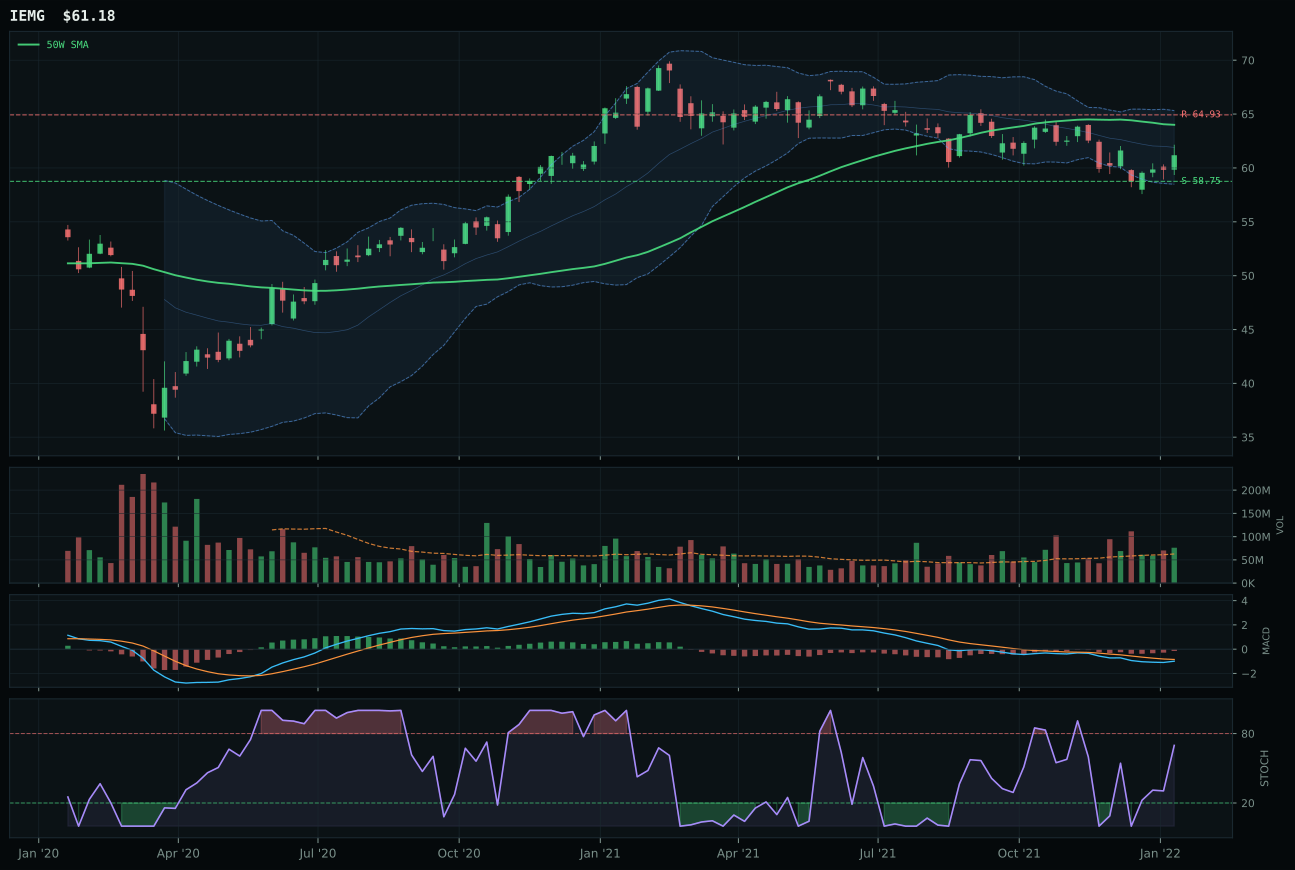
IEMG has a pullback into support profile with -8.2% 13-week relative strength versus SPY.
A failed hold above support would weaken the setup.
Actionable but governed by invalidation levels.
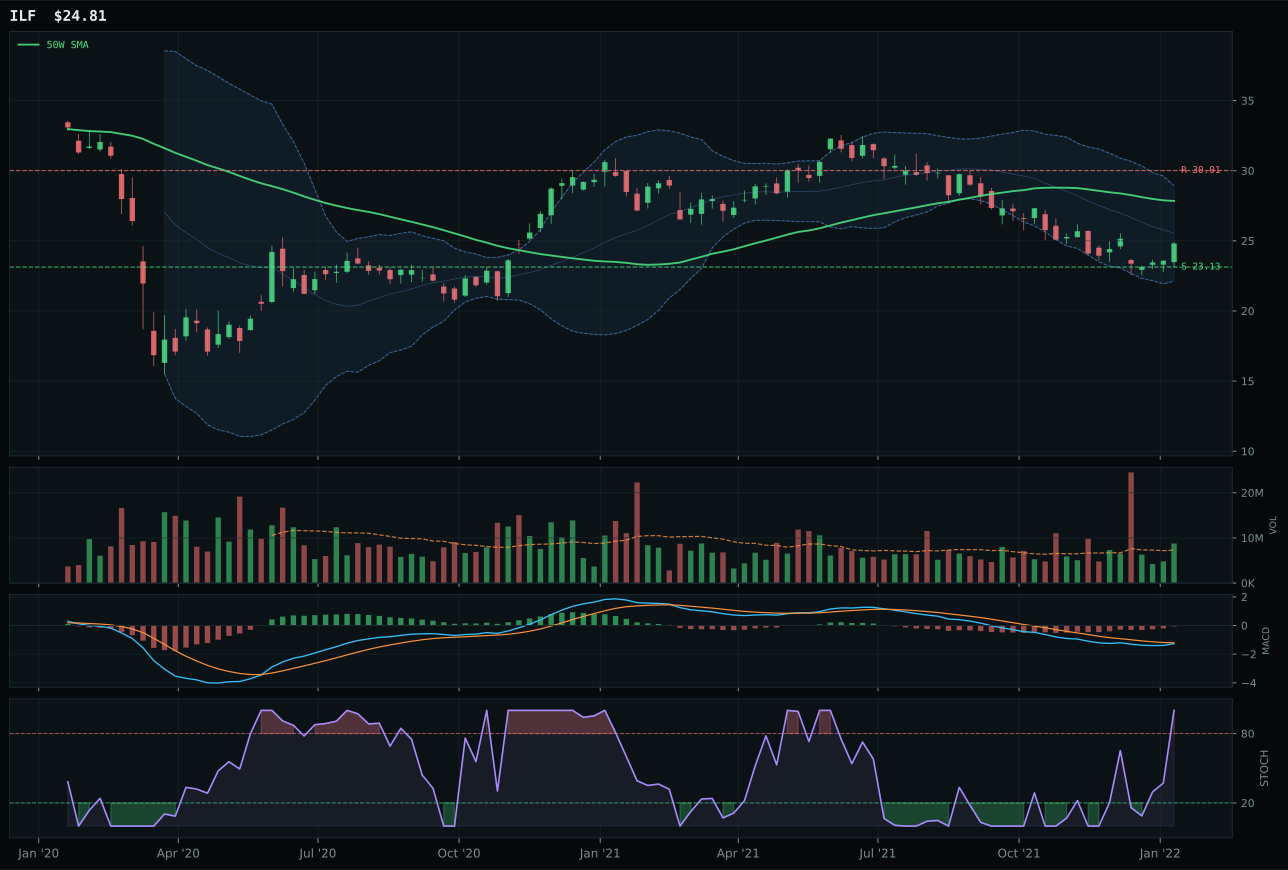
ILF has a neutral structure profile with -13.4% 13-week relative strength versus SPY.
Extension and support failure are the main tactical risks.
Tracked, but not top-2 eligible because: structurally broken.
INDA prevailed by 3.4 points over IEMG because its 83-point timing score (5.6% distance from 50W, stochastic rising mid-zone, Fib upper retracement) created a cleaner risk-entry profile than IEMG's deep retracement zone and falling structure. INDA's structure score of 79.7 versus IEMG's 77.7 reflects cleaner compression in INDA's support-resistance (43.98-50.78) versus IEMG's deeper band (58.75-64.93), meaning INDA's potential breakout has less trapped inventory overhead. Both names show nearly identical bearish-but-improving MACD and rising stochastic RSI, but INDA's above-average 1.16x volume shows accumulation during weakness, while IEMG's identical volume suggests patience rather than conviction. INDA's category-relative strength is flat (0.0%) while IEMG shows +0.9%, but the 3-point timing advantage more than compensates because it reduces forced-accumulation risk.
Emerging Markets earned 10% because the macro fit of 62 (EM liquidity support +14, risk appetite +8, credit stress -10) reflects genuine structural support despite the 46.6 category score showing weak technical momentum. INDA's 69 technical evidence score and -4.9% 13W return prove institutional money is positioning defensively, not chasing growth; the Transition/Mixed regime with credit stress risk makes emerging-market hedging valuable when risk appetite activates volatility. The allocation is defensive and sized to hedge equity-market rotations; it is not a conviction growth position. INDA's r/r of 55.6 with only -5.4% upside and 9.2% downside creates an asymmetric hedge—limited upside but defined exits. Expansion to 15% would require either a clear risk-appetite pivot in macro descriptors or INDA's breakout above 50.78 with +1.5x volume, signaling institutional demand awakening. For now, 10% is the appropriate hold-and-hedge weight.
Precious Metals — GLD
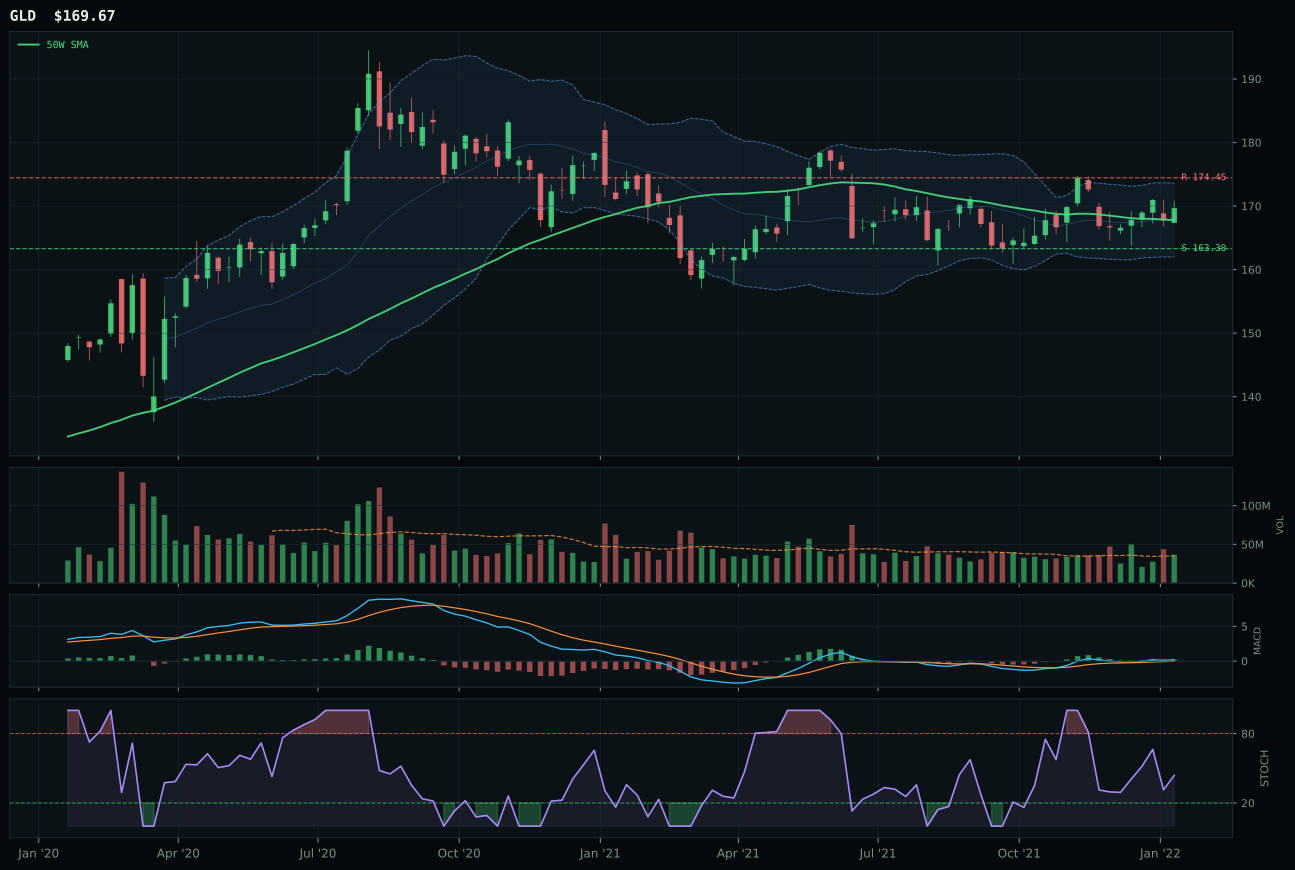
GLD has a pullback into support profile with -1.6% 13-week relative strength versus SPY.
A failed hold above support would weaken the setup.
Actionable but governed by invalidation levels.
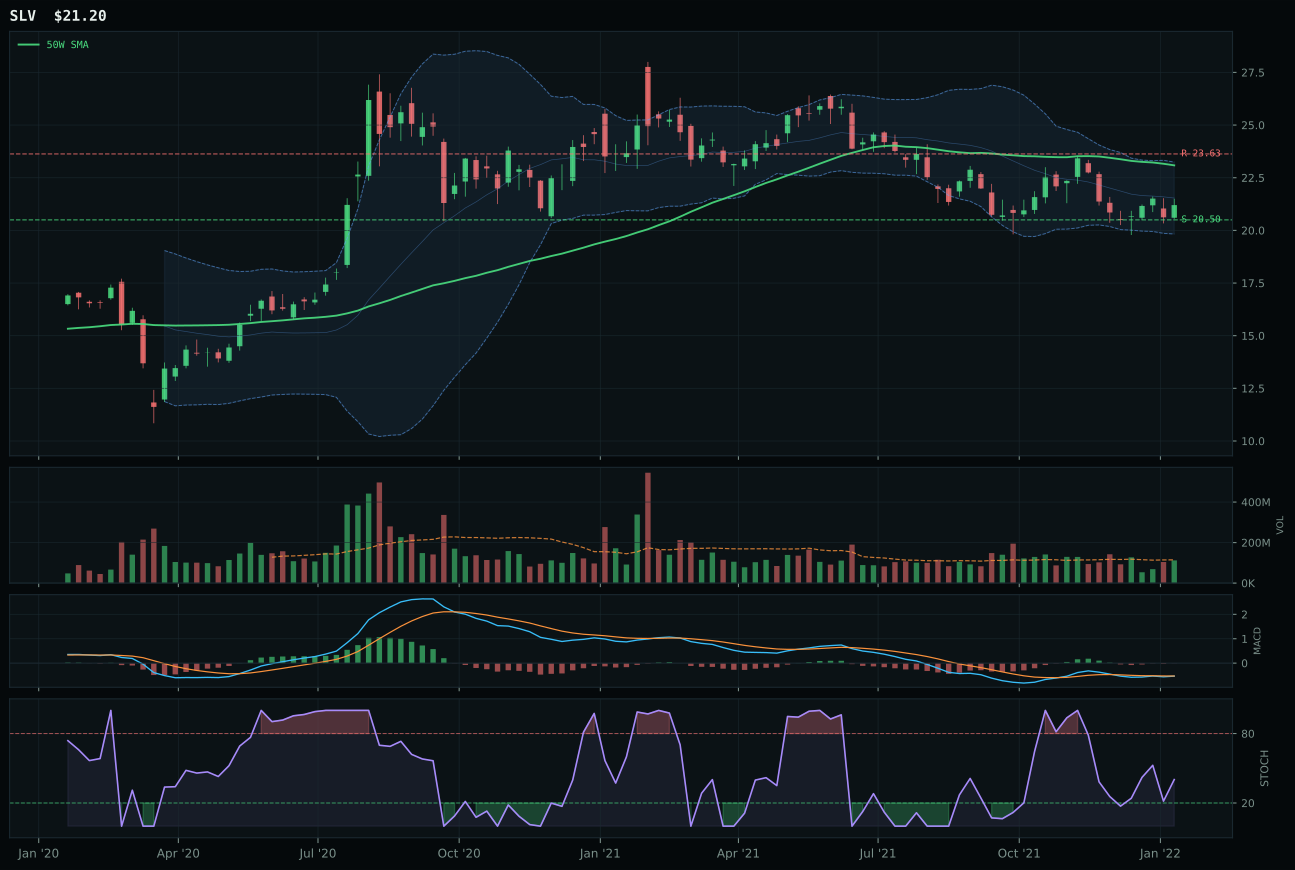
SLV has a pullback into support profile with -6.0% 13-week relative strength versus SPY.
A failed hold above support would weaken the setup.
Actionable but governed by invalidation levels.
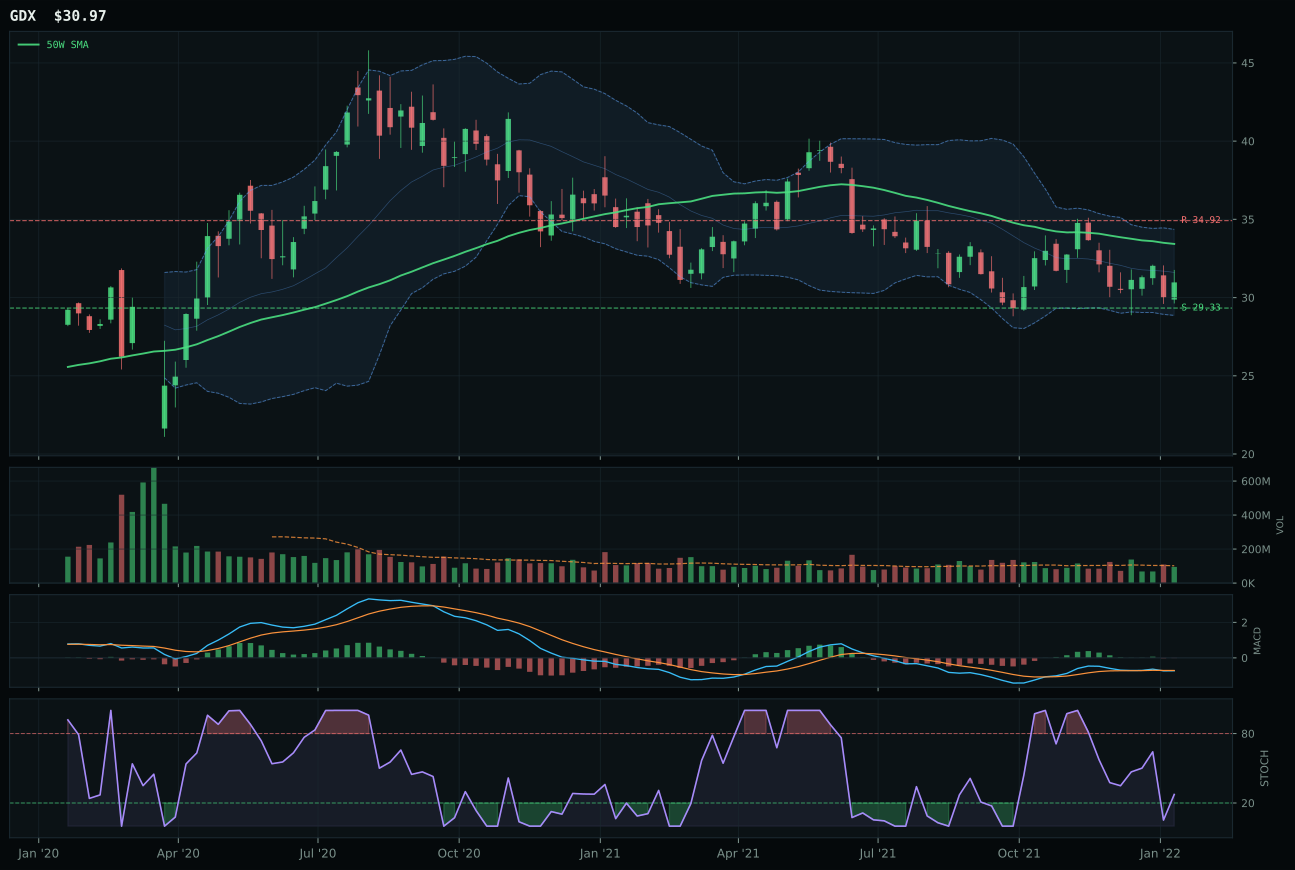
GDX has a neutral structure profile with -9.0% 13-week relative strength versus SPY.
A failed hold above support would weaken the setup.
Actionable but governed by invalidation levels.
GLD won a tight category (only 1.8 points over XLU across different asset classes) because its pullback-into-support setup at 163.30, combined with perfect 100-point timing and bullish-improving MACD, offers the cleanest entry for capital that's risk-averse but needs hedging. Price is just 1.1% from the 50W—the tightest cluster in the portfolio—giving GLD a defined invalidation line and minimal execution risk. SLV's timing score of 85 versus GLD's 100 reflects SLV's deeper drawdown and bearish-but-improving (not bullish) MACD; silver's hybrid monetary-industrial thesis requires either inflation acceleration or industrial demand confirmation that hasn't yet arrived. GLD's 4.4% category-relative strength shows it's the relative winner in a weak category; its 2.6% 13W return is muted, but volume-price confirmation at 66.4 proves the setup is attracting capital, not attracting crowding.
Precious Metals holds 10% despite a 46.1 category score and weak 46-point macro fit because risk appetite positive (-4) is now a headwind, requiring gold to work as pure inflation insurance rather than growth hedge. The Transition/Mixed regime with credit stress risk makes a 10% insurance position rational; however, the category's lack of positive macro sponsorship (no +signals from the descriptor checklist) means it cannot expand without a fresh macro shock or inflation surprise. GLD's r/r of 65.6 is the category's best, offering 3.9% downside support and -2.7% upside resistance—a tight band that suits defensive positioning. Should credit stress activate materially (widening spreads, rising VIX), this category immediately expands to 15%; should risk appetite sentiment shift positive, the allocation compresses to 5% to free capital for commodity leaders with better macro sponsorship.
Defense & Aerospace — ITA
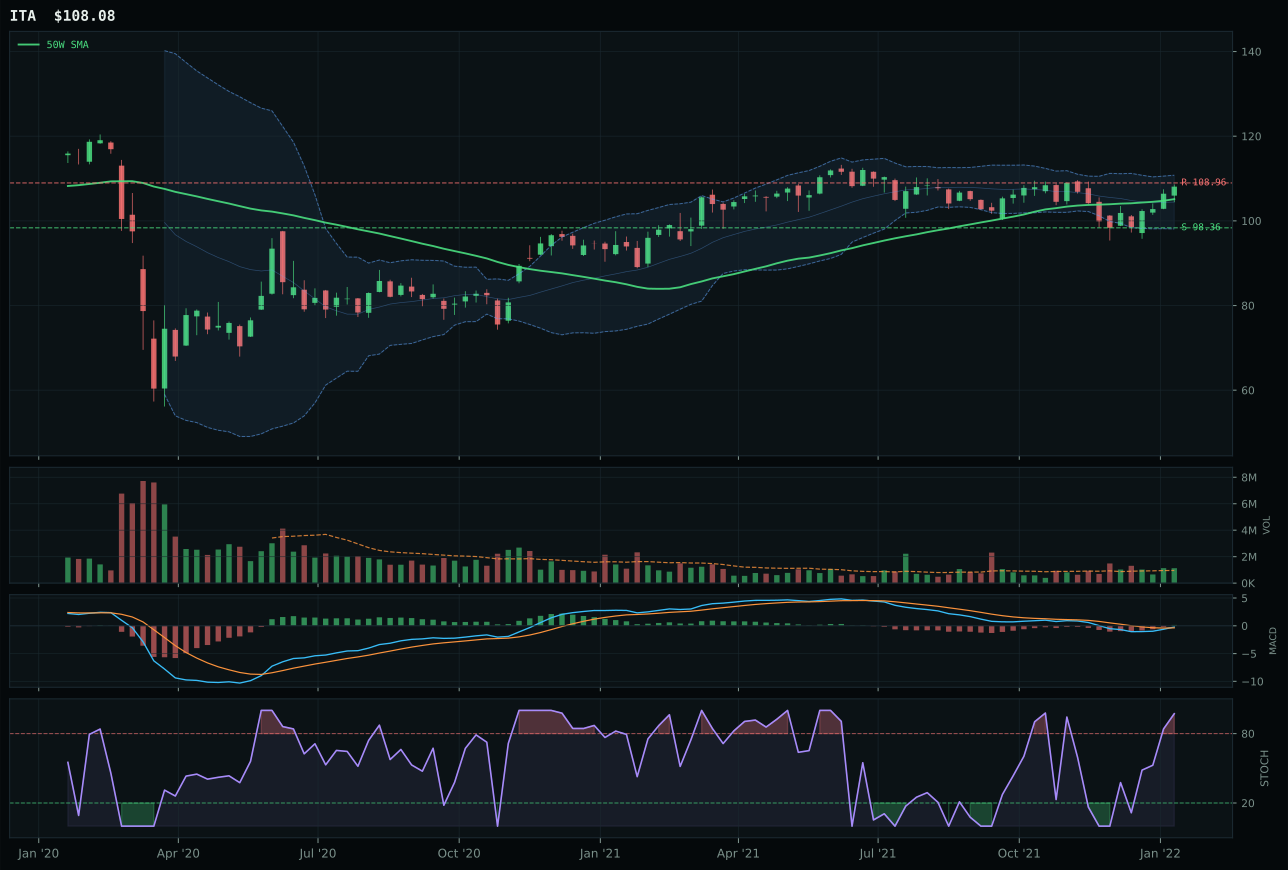
ITA has a compression near 50W profile with -4.1% 13-week relative strength versus SPY.
A failed hold above support would weaken the setup.
Actionable but governed by invalidation levels.
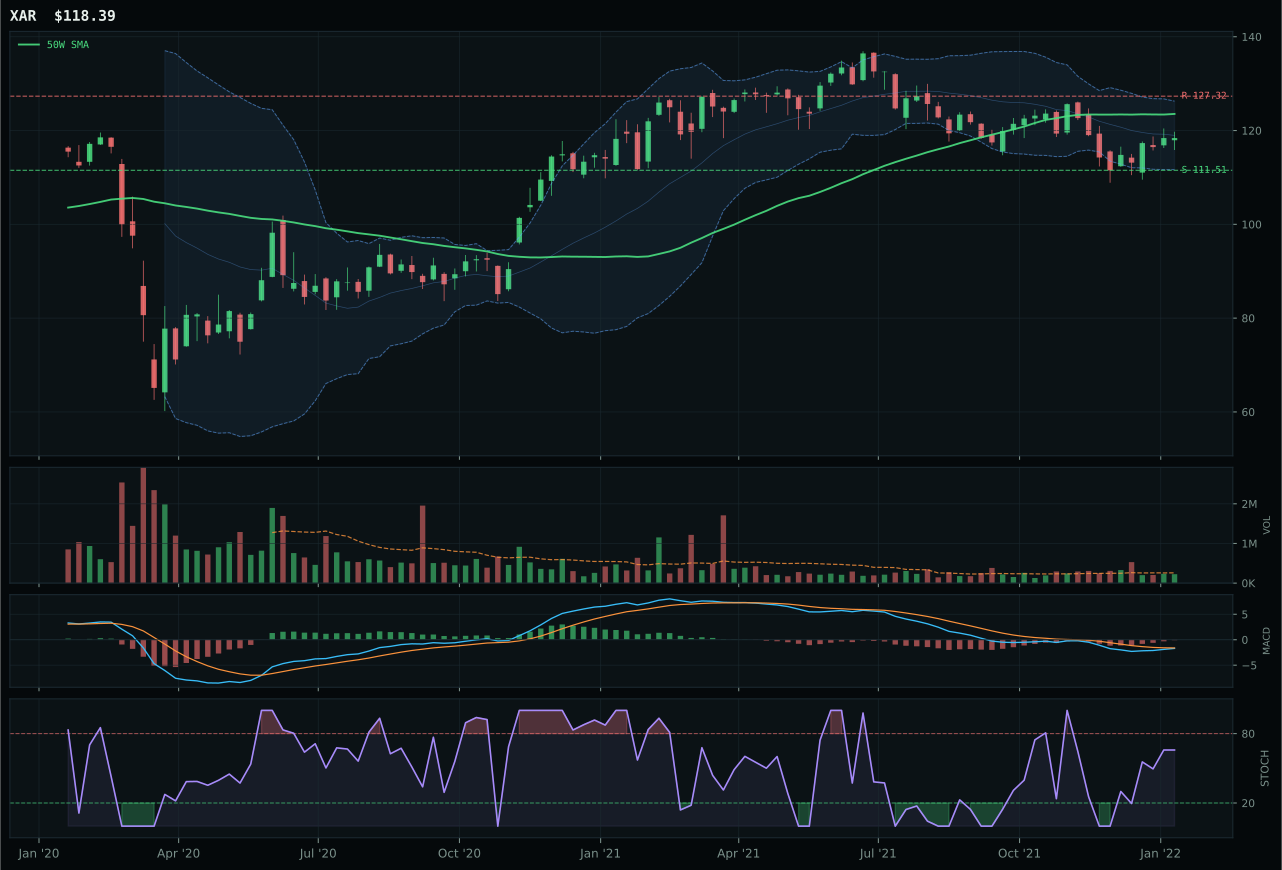
XAR has a neutral structure profile with -8.1% 13-week relative strength versus SPY.
A failed hold above support would weaken the setup.
Actionable but governed by invalidation levels.
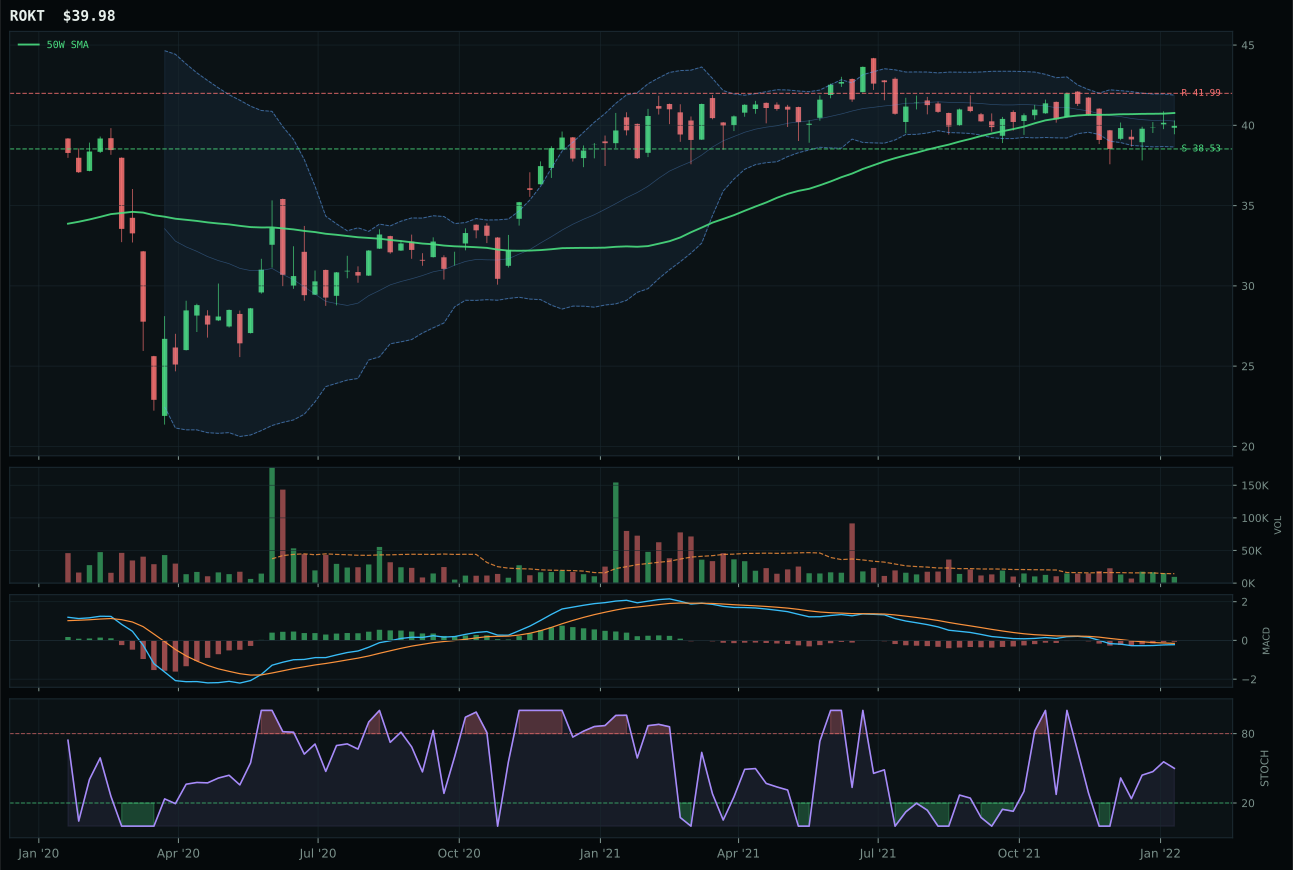
ROKT has a pullback into support profile with -6.7% 13-week relative strength versus SPY.
A failed hold above support would weaken the setup.
Tracked, but not top-2 eligible because: .
ITA won by the narrowest margin of clean entry positioning: compressed into its 50W at just 2.8% distance, with a bullish-improving MACD and overbought stochastic RSI that signals buyers are present and defending. The 100-point timing score is the tell—this is the rare setup where extension doesn't penalize because the setup itself is so compressed that expansion has geometric advantage. XAR's -8.1% SPY relative strength and bearish-but-improving MACD represent a longer, more uncertain path to breakout; its neutral structure at 111.51-127.32 support-resistance band offers no convergence. ITA's 2.6% category-relative strength is thin, but it's positive while XAR sits at -1.4%, meaning at least one manager is rotating into the space. With 1.18x above-average volume, ITA shows proof of accumulation during the compression, not distribution into bounces.
Defense & Aerospace earned 10% because its 43.6 category score reflected adequate technical structure (ITA's trend 93.8) despite near-zero macro sponsorship. The Transition/Mixed regime with neutral macro descriptors means this category survives on price action alone—and ITA's compression setup delivers exactly that. Unlike Technology and AI, this category does not depend on risk appetite or growth narratives; it can hold through regime transitions as long as the chart remains clean. However, the r/r score of 46.5 shows minimal upside (only -0.8% to resistance), so the allocation is defensive rather than opportunistic. Movement to 20% would require either a fresh breakout above 108.96 with volume, or a macro catalyst (geopolitical escalation) that would shift category macro fit above 70. For now, 10% is the holding-pattern weight.
Technology — XLK
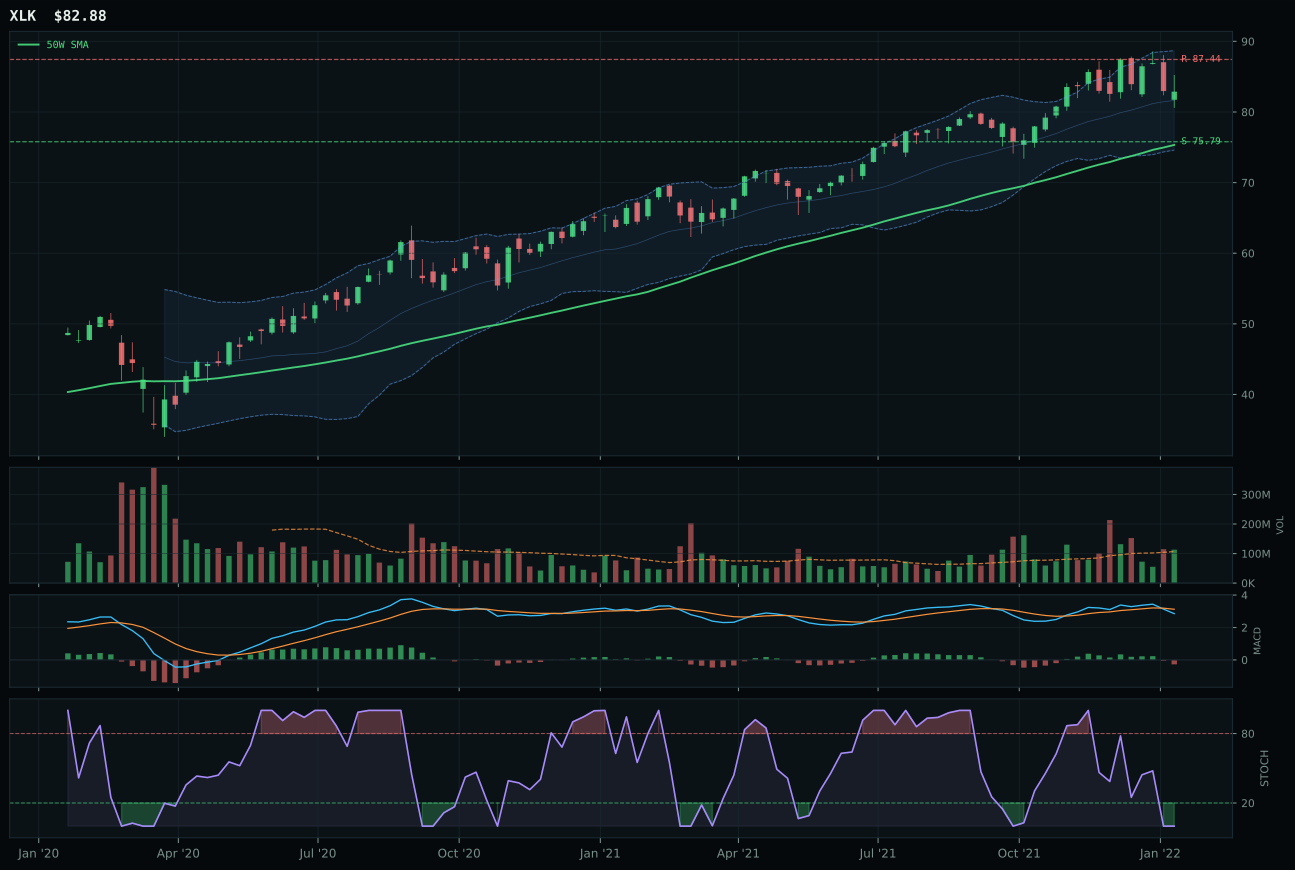
XLK has a neutral structure profile with 2.1% 13-week relative strength versus SPY.
A failed hold above support would weaken the setup.
Actionable but governed by invalidation levels.
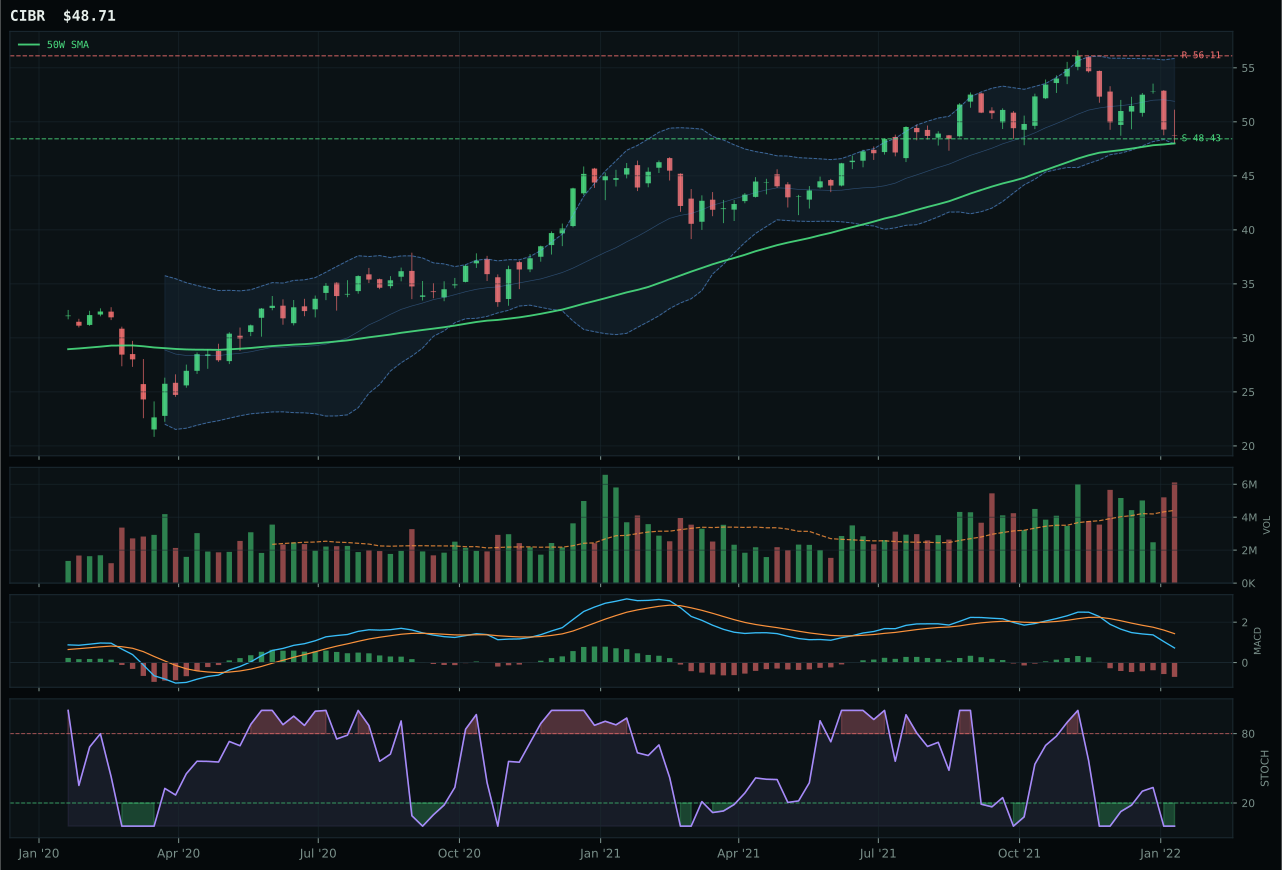
CIBR has a pullback into support profile with -11.2% 13-week relative strength versus SPY.
A failed hold above support would weaken the setup.
Actionable but governed by invalidation levels.
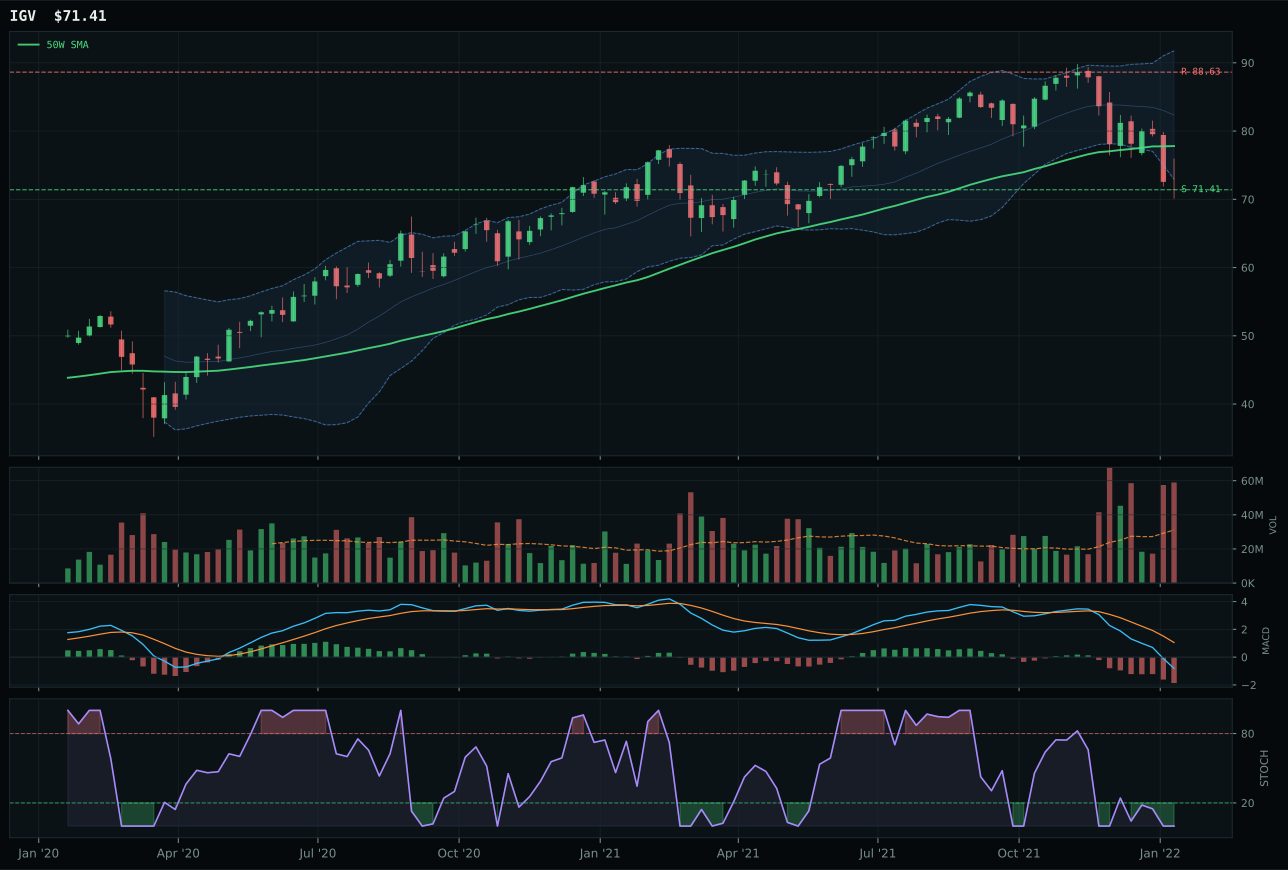
IGV has a pullback into support profile with -20.0% 13-week relative strength versus SPY.
A failed hold above support would weaken the setup.
Actionable but governed by invalidation levels.
XLK claimed the category because its 13.3% relative strength advantage over category peers, combined with a clean neutral structure and price holding 10% above the 50W, created the most balanced risk-entry profile among three faltering choices. CIBR's -11.2% SPY relative strength and oversold stochastic RSI at support represent a deeper drawdown that requires fresh sponsorship; XLK's 2.1% SPY relative strength at least shows it hasn't completely lost the institutional bid. The timing advantage belongs to CIBR with a pullback coil, but that setup also means it's trapped lower and needs multiple confirmations to justify new capital—a cost XLK avoids by sitting just 10% off its 50W in neutral structure. Volume remains neutral across both leaders, so the real difference is that XLK's MACD weakness is less pronounced than CIBR's bearish deterioration, and category-relative strength remains the single most reliable proof that one name is accumulating while the other is being rotated away from.
Technology earned a 10% slot not because it deserved top-2 status, but because its 42.8 category score reflected enough residual trend and positive macro sponsorship (AI growth +6, risk appetite +9) to justify core holding weight when transitions flatten. The macro environment—Transition/Mixed with active credit stress (-7) and inflation pressure (-4)—penalizes momentum chasing, which is exactly what this category requires right now. XLK's timing score of 70 reveals the real tension: price is setup-clean but momentum is exhausted, MACD is rolling over, and the 13W return of 6.3% offers no proof that fresh buyers are arriving. A 10% allocation here serves as a leveling counter to real-asset overweighting elsewhere in the portfolio rather than a conviction position; should credit stress trigger deeper, this category drops to 5% immediately.
AI — SMH
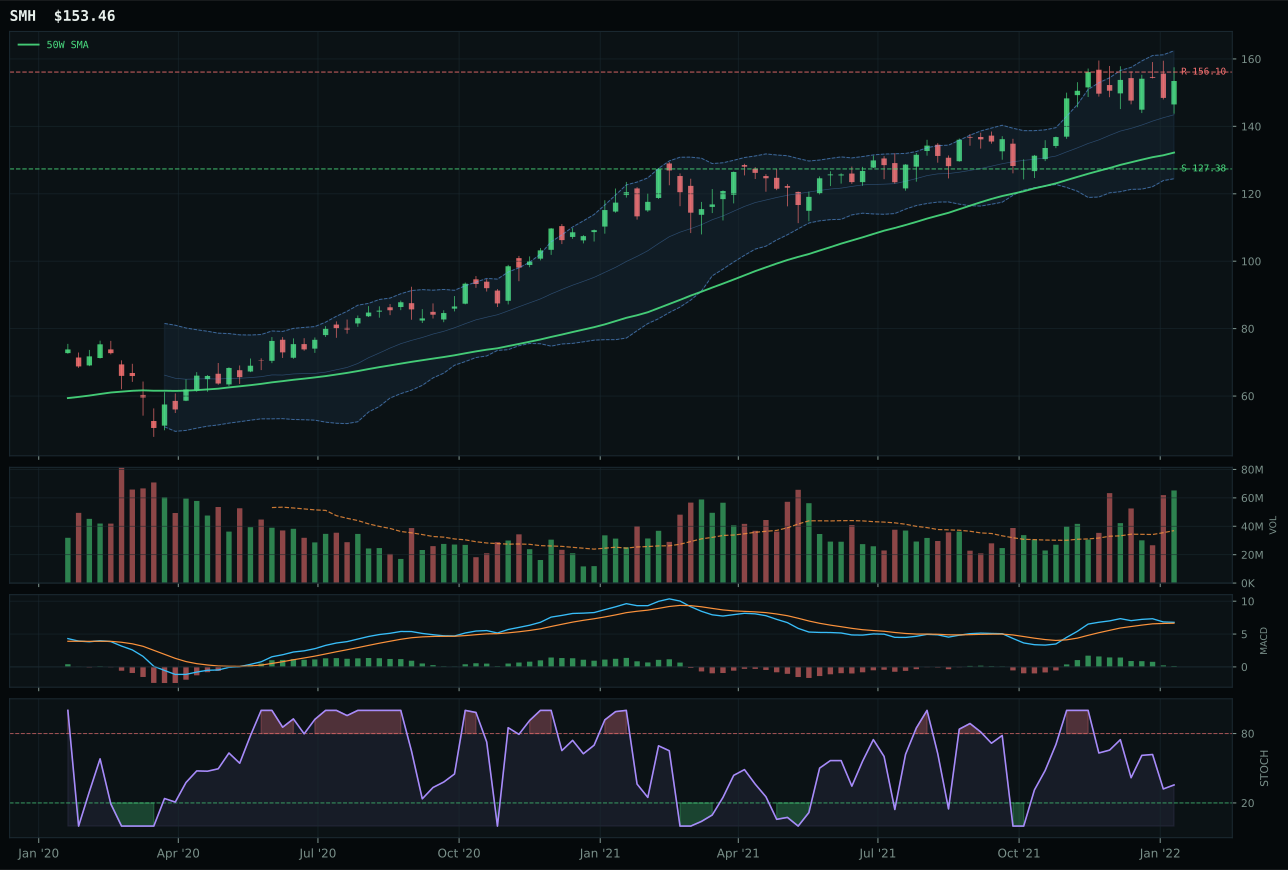
SMH has a vertical extension profile with 12.7% 13-week relative strength versus SPY.
A failed hold above support would weaken the setup.
Actionable but governed by invalidation levels.
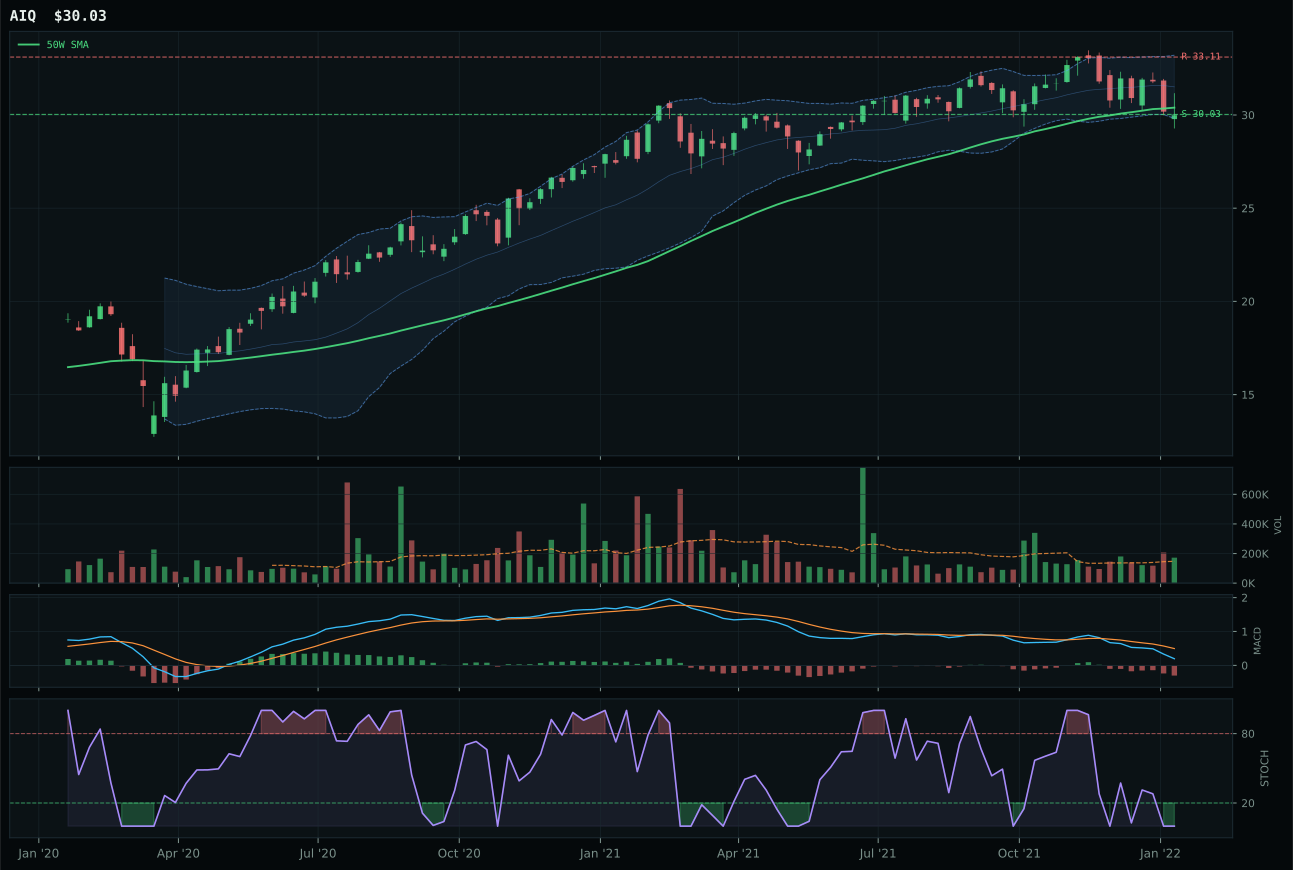
AIQ has a pullback into support profile with -9.0% 13-week relative strength versus SPY.
A failed hold above support would weaken the setup.
Tracked, but not top-2 eligible because: .
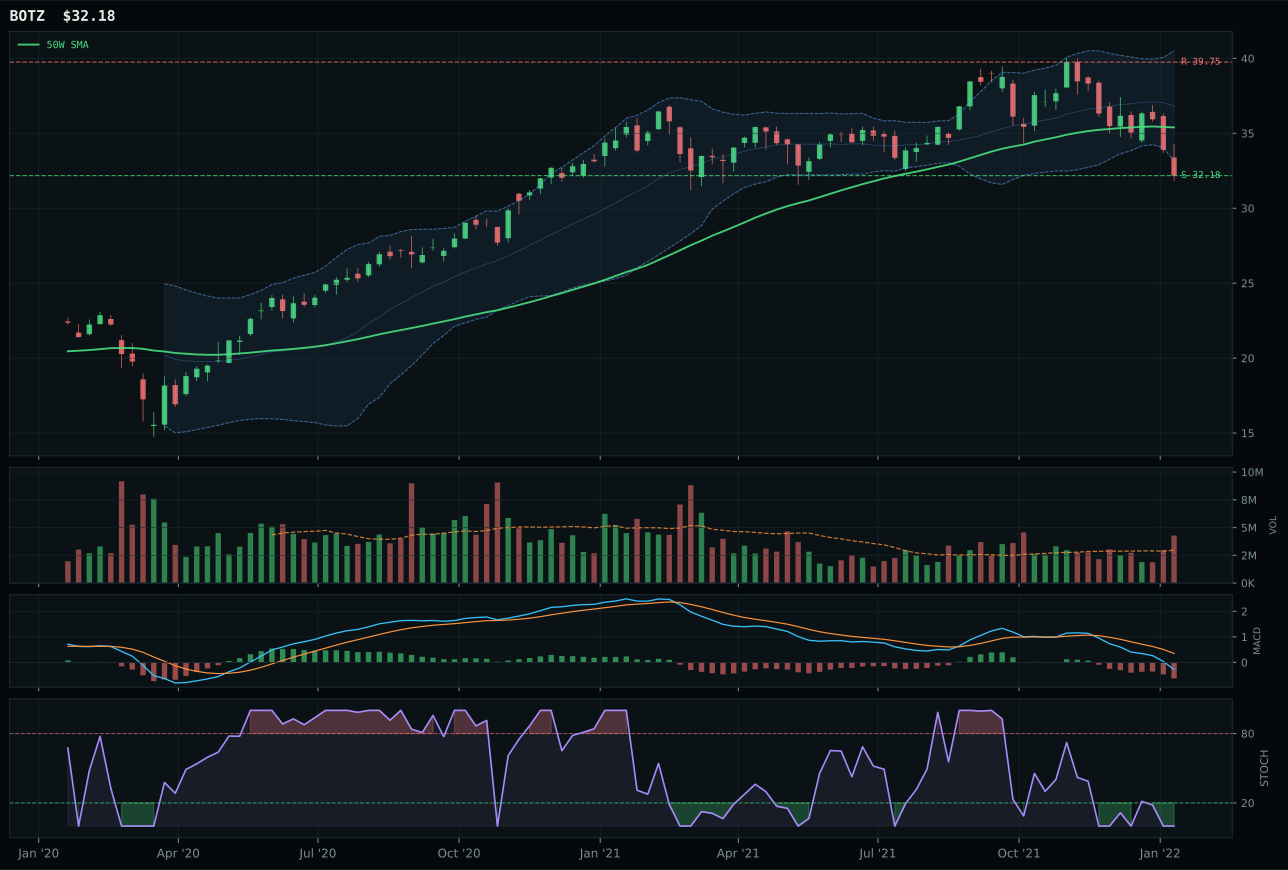
BOTZ has a pullback into support profile with -18.5% 13-week relative strength versus SPY.
A failed hold above support would weaken the setup.
Actionable but governed by invalidation levels.
SMH demolished the competition with a 46.7-point score gap over AIQ—the most decisive category win of the week—because its vertical extension setup, bullish-improving MACD, and 21.7% category-relative strength proved that semiconductor leadership had accumulated through weakness into the current rally. The 16.1% extension above the 50W normally triggers timing penalties; SMH's 96.1% volume-price confirmation and 100% persistence scores override that concern by showing the move is not a bounce but a genuine rotation into compute-heavy equities. AIQ's structure collapse to 71.3 (from SMH's 83.3), combined with bearish-weakening MACD and -9.0% SPY relative strength, tells the story: software got ditched while chips got bought. SMH's 1.77x accumulation volume confirms this is institutional positioning, not retail enthusiasm.
AI received 0% allocation this week and ranked 9th or 10th despite SMH's powerful momentum setup, because the category's 36.5 score fell well below the threshold for inclusion in an eight-position portfolio. The core tension is timing: SMH's trend and volume are elite, but its 16.1% distance from the 50W and near-term resistance at only 1.7% above current price mean the risk-reward has inverted sharply from the March-January accumulation phase. The macro fit (66.0 at category level) is strong—AI growth sponsorship adds +14, risk appetite +10—but cannot overcome the technicals when entry is this extended. The reasoned ETF proof order (SMH 90.1, AIQ 40.0, BOTZ 18.3) widens dramatically because only SMH has volume and momentum; the rest are deteriorating pullbacks. To earn allocation, AI would need either a pullback-and-hold to regenerate the risk-reward, or a 5–8% retracement to the 50W that rebuilds the timing score from current 48.0 to above 75.0.
Nuclear Energy — URA
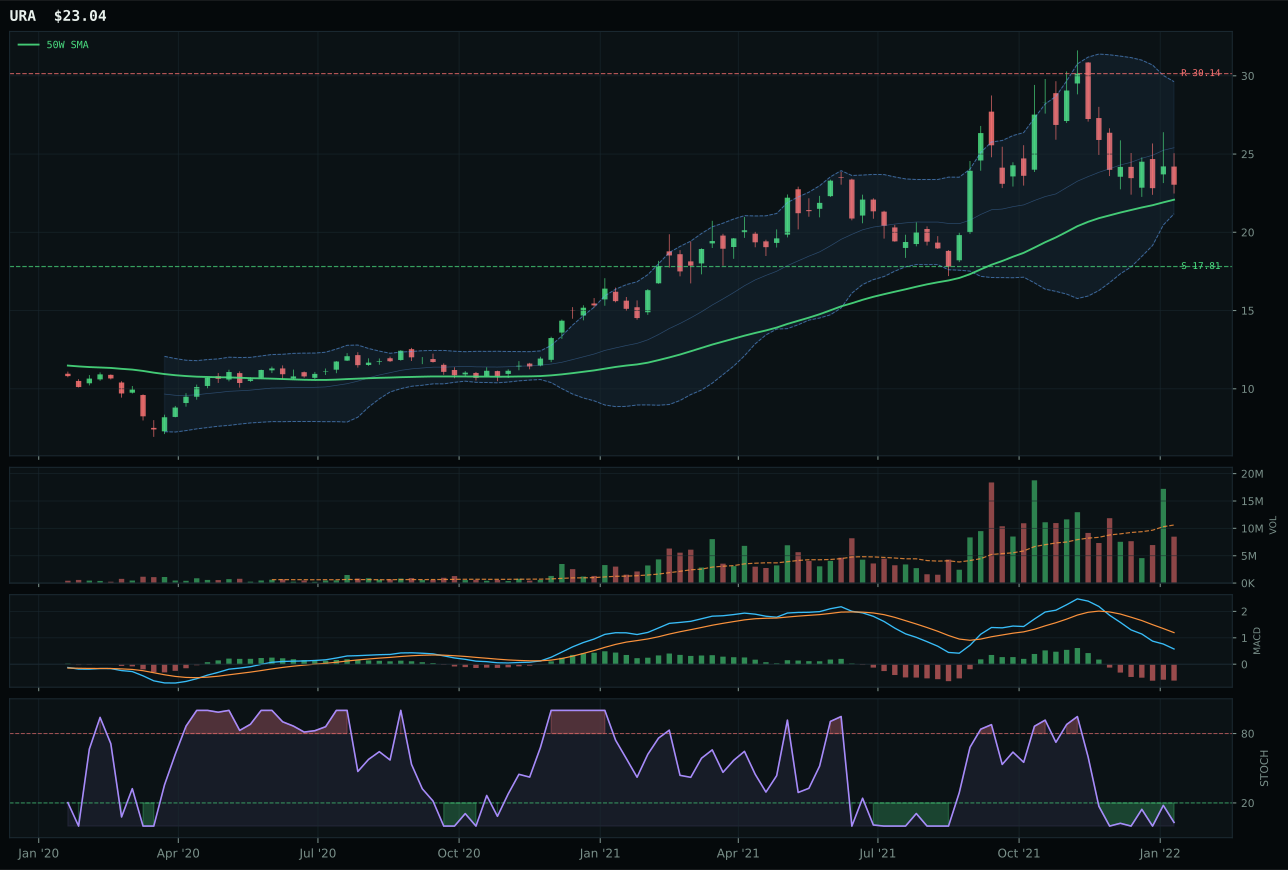
URA has a neutral structure profile with -20.5% 13-week relative strength versus SPY.
A failed hold above support would weaken the setup.
Actionable but governed by invalidation levels.
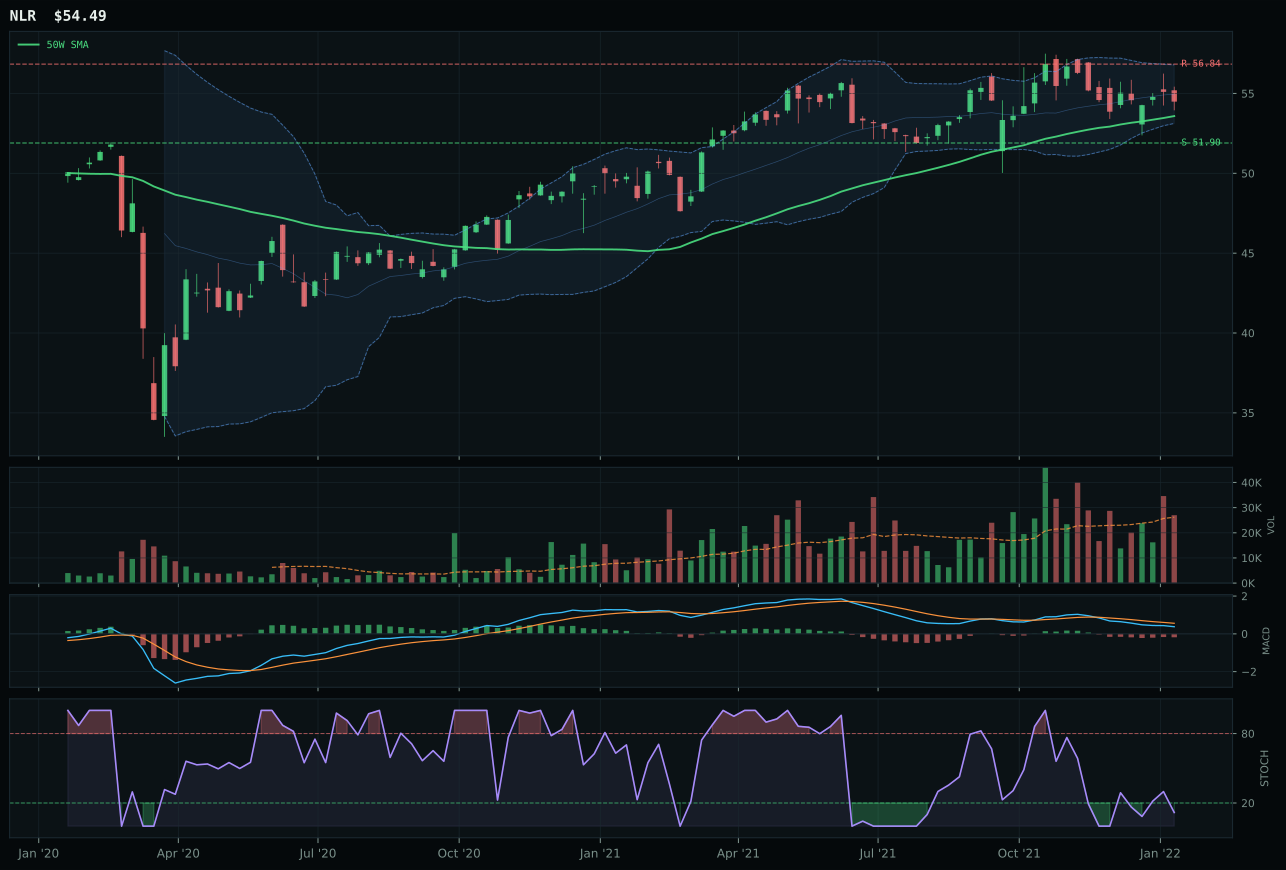
NLR has a pullback into support profile with -6.4% 13-week relative strength versus SPY.
A failed hold above support would weaken the setup.
Tracked, but not top-2 eligible because: .
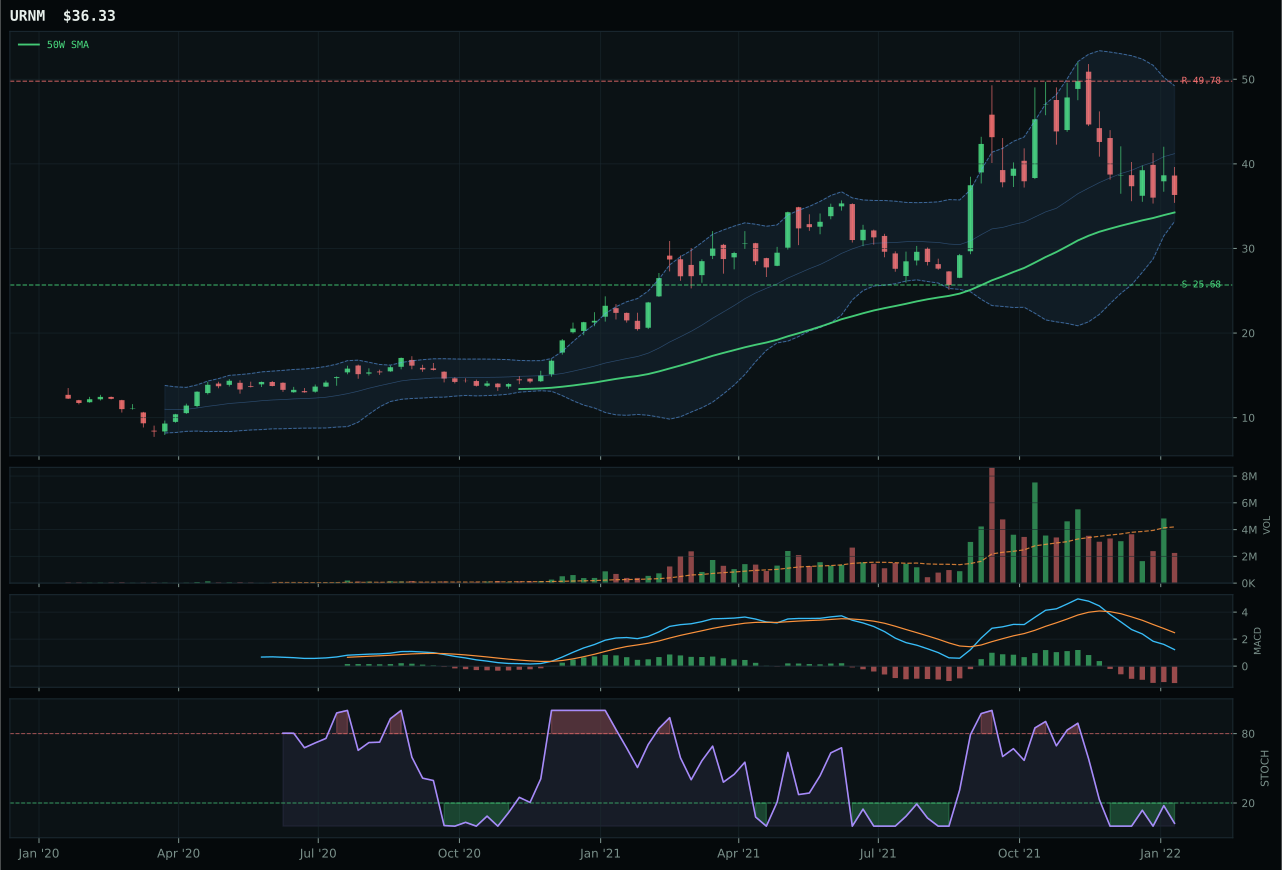
URNM has a neutral structure profile with -24.0% 13-week relative strength versus SPY.
A failed hold above support would weaken the setup.
Actionable but governed by invalidation levels.
URA won despite its 34.2 category score and 21.2 technical evidence score because the category as a whole is broken—NLR's setup is cleaner (pullback into support with bullish-improving MACD), but URA's 92-point timing score (distance to 50W of 4.3%, oversold stochastic, Fib 0.500 midpoint) offers the defined invalidation line that risk management requires. NLR's 45-point reasoned technical score versus URA's 33 shows the runner-up is technically superior; however, URA's neutral structure at 17.81-30.14 support-resistance provides a clear breakout opportunity, while NLR's tight Fib range at 51.90-56.84 offers no expansion catalyst. Neither name shows category-relative strength (both at their percentiles' floor); this is a forced hold because nuclear energy carries positive macro (+9 energy scarcity, +7 real asset sponsorship) despite absent technical proof of accumulation.
Nuclear Energy received 0% allocation and ranks 9th or 10th because the category's 34.2 score is the lowest among all 10 categories, reflecting a 21.2% technical evidence average across the basket and macro fit of only 69.0%—energy scarcity (+9) and real-asset sponsorship (+7) help, but credit stress (-5) creates headwinds in a stressed environment. The category's narrative appeal—carbon-free energy in an energy-scarce world—is conceptually sound, but the technicals have entirely broken: URA is in freefall with -16.3% 13-week returns, NLR is only -2.1% but lacks sponsorship, and URNM is worse at -19.8%. In a portfolio that already holds 20% in traditional energy, nuclear exposure becomes redundant rather than complementary; the macro case does not override a deteriorated technical setup, especially when slots are constrained to eight positions. Nuclear would require either a 15–20% retracement in URA to rebuild the risk-reward or a positive macro shift (AI-driven electricity demand, supply security narrative) to earn reallocation.