
2022-01-07
Informational purposes only. The content in this report, including allocations, analysis, and commentary, is provided solely for informational and educational purposes. It does not constitute financial advice, investment advice, trading advice, or any other type of advice. Past performance does not guarantee future results. Always conduct your own research and consult a qualified financial professional before making investment decisions.
Weekly Allocation
| Ticker | Category | Weight | Role |
|---|---|---|---|
| COPX | Industrial Metals | 20% | Top-2 (20%) |
| IGF | Utilities & Infrastructure | 20% | Top-2 (20%) |
| XLE | Traditional Energy | 10% | Tier-2 (10%) |
| MOO | Agriculture & Livestock | 10% | Tier-2 (10%) |
| GLD | Precious Metals | 10% | Tier-2 (10%) |
| URA | Nuclear Energy | 10% | Tier-2 (10%) |
| ITA | Defense & Aerospace | 10% | Tier-2 (10%) |
| CIBR | Technology | 10% | Tier-2 (10%) |
Trade Instructions — Monday Open
Sell the tranche from 2021-12-10 (completing its 4-week hold). Buy the new tranche. Instructions show net portfolio changes — same-asset positions cancel, weight changes show the delta.
| Action | Ticker | Instruction |
|---|---|---|
| SELL | FSOL | Sell entire FSOL position (12.50% of portfolio) |
| SELL | XLU | Sell 33% of XLU position (reduce 7.50% → 5.00%) |
| SELL | PICK | Sell entire PICK position (1.25% of portfolio) |
| SELL | XLK | Sell 50% of XLK position (reduce 2.50% → 1.25%) |
| SELL | SMH | Sell 25% of SMH position (reduce 5.00% → 3.75%) |
| BUY | MOO | Buy MOO — 6.67% of freed cash (adds 1.25% to portfolio) |
| BUY | GLD | Buy GLD — 6.67% of freed cash (adds 1.25% to portfolio) |
| BUY | ITA | Buy ITA — 6.67% of freed cash (adds 1.25% to portfolio) |
| BUY | COPX | Buy COPX — 26.67% of freed cash (adds 5.00% to portfolio) |
| BUY | URA | Buy URA — 13.33% of freed cash (adds 2.50% to portfolio) |
| BUY | IGF | Buy IGF — 26.67% of freed cash (adds 5.00% to portfolio) |
| BUY | CIBR | Buy CIBR — 13.33% of freed cash (adds 2.50% to portfolio) |
Current Portfolio After Trade
Combined holdings across all 4 active tranches. Each tranche is 25% of the portfolio.
| Ticker | % of Portfolio | Weight Bar |
|---|---|---|
| FBTC | 37.50% | |
| COPX | 11.25% | |
| XLE | 7.50% | |
| MOO | 7.50% | |
| GLD | 6.25% | |
| XLU | 5.00% | |
| ITA | 5.00% | |
| URA | 5.00% | |
| IGF | 5.00% | |
| SMH | 3.75% | |
| CIBR | 2.50% | |
| XLK | 1.25% | |
| XAR | 1.25% | |
| INDA | 1.25% |
Macro Regime — Transition / Mixed
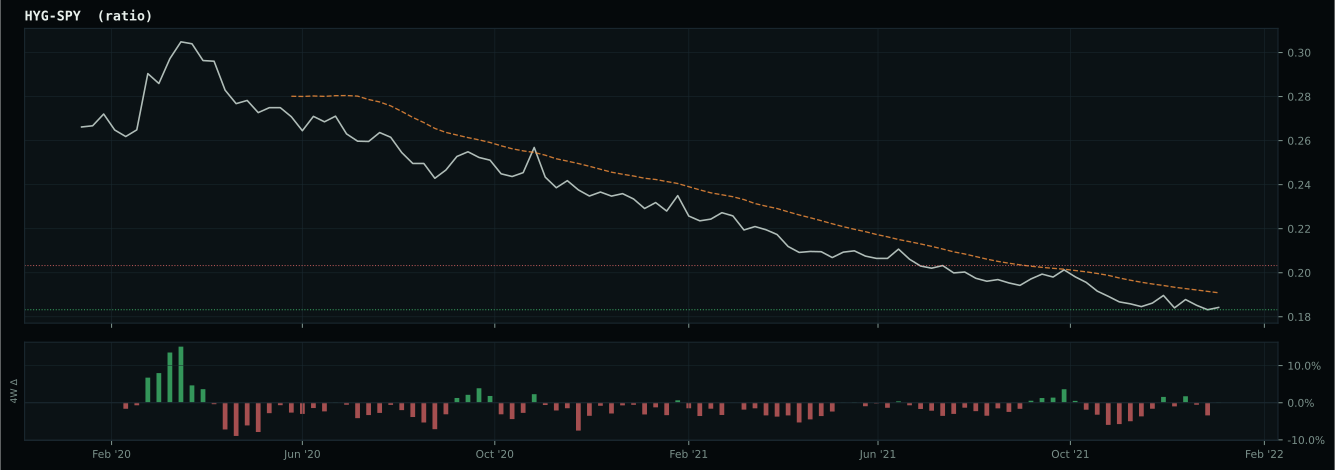
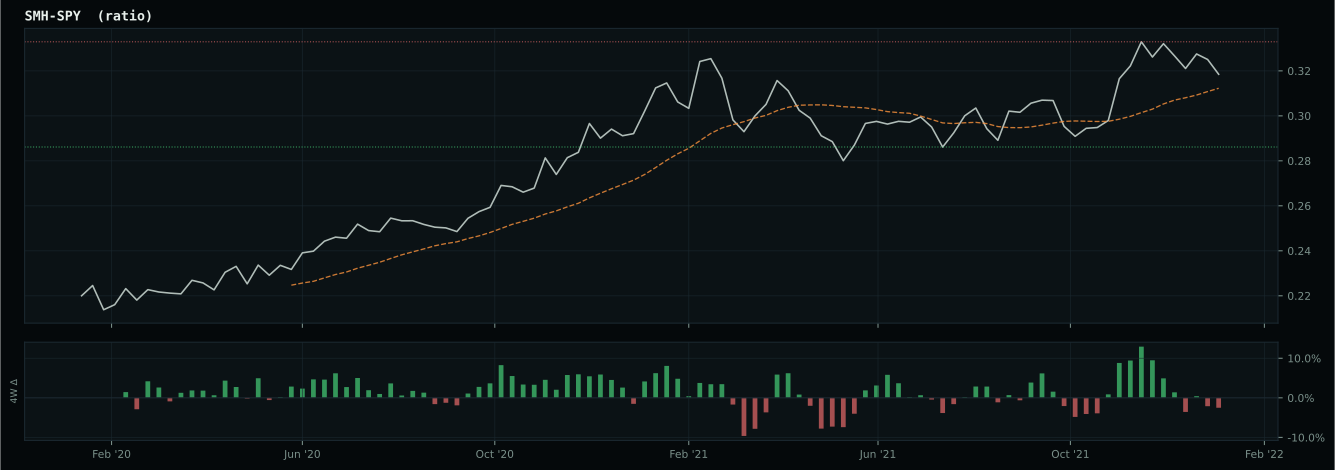
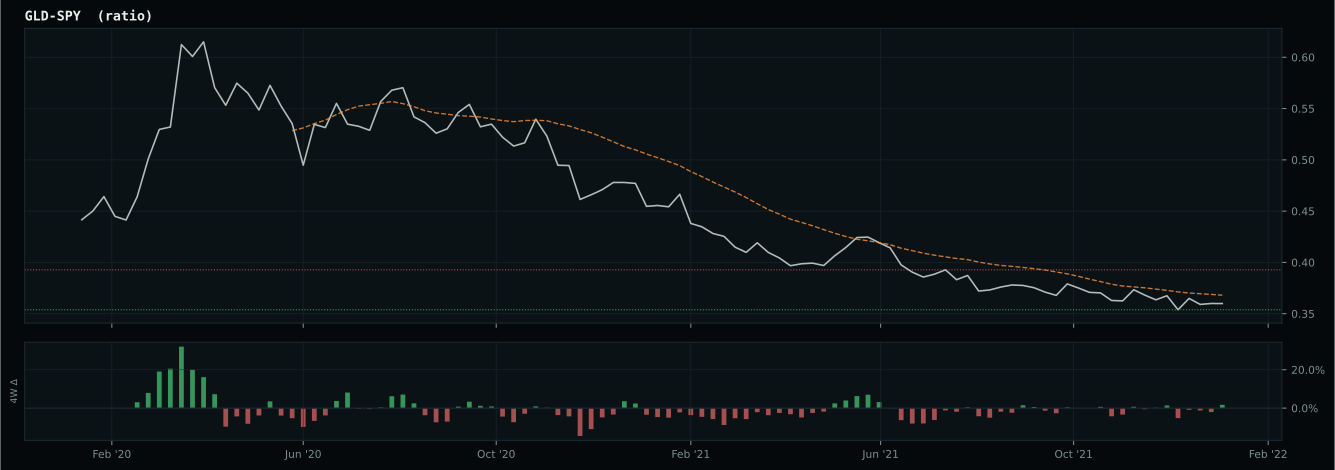
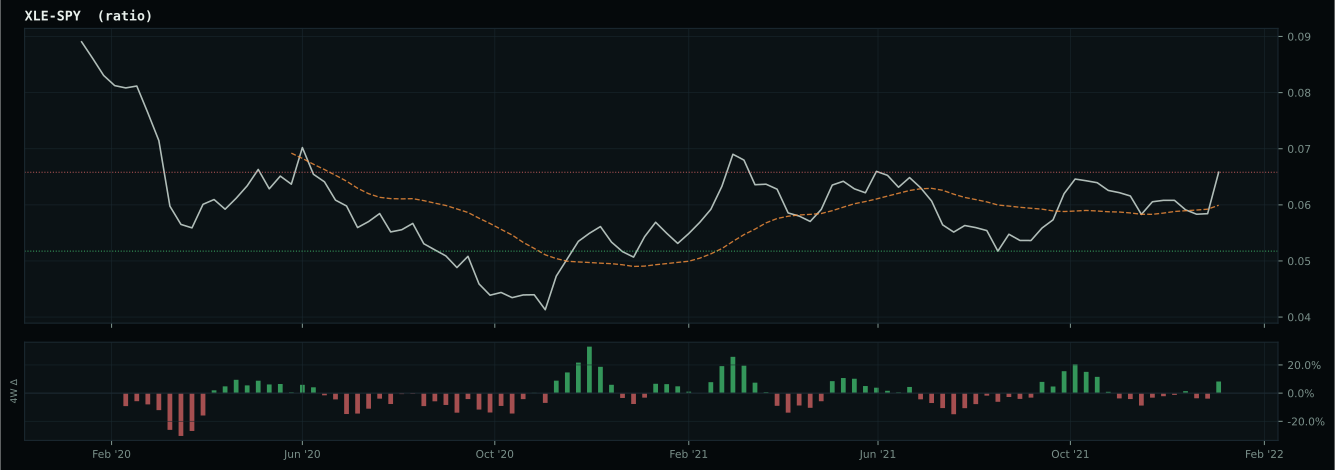
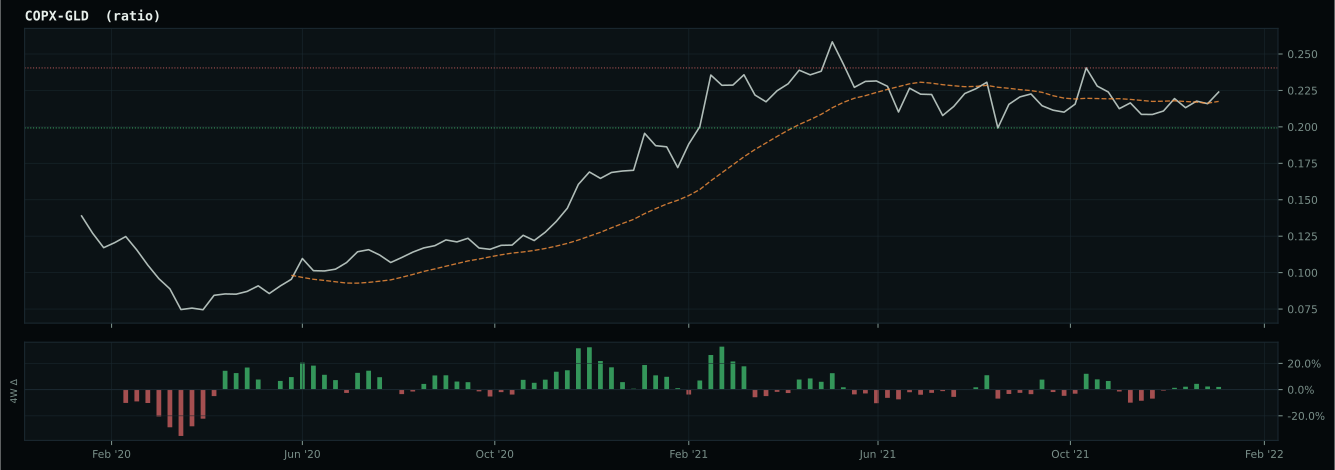
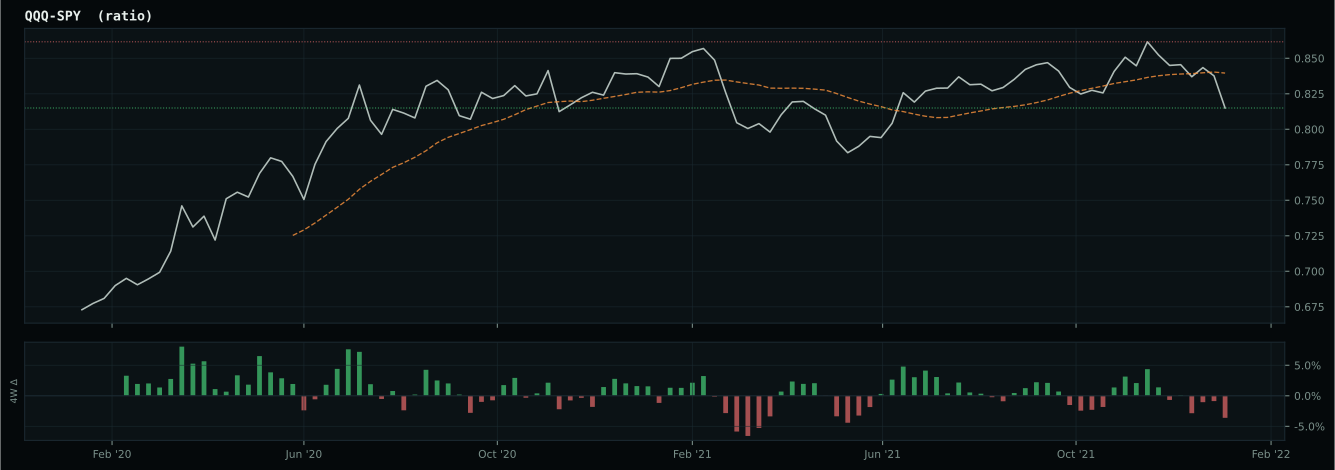
Macro Evidence Charts
Market-implied signals behind the macro regime scores. Each ratio compares two assets; the direction and slope of the ratio is what the macro engine reads.
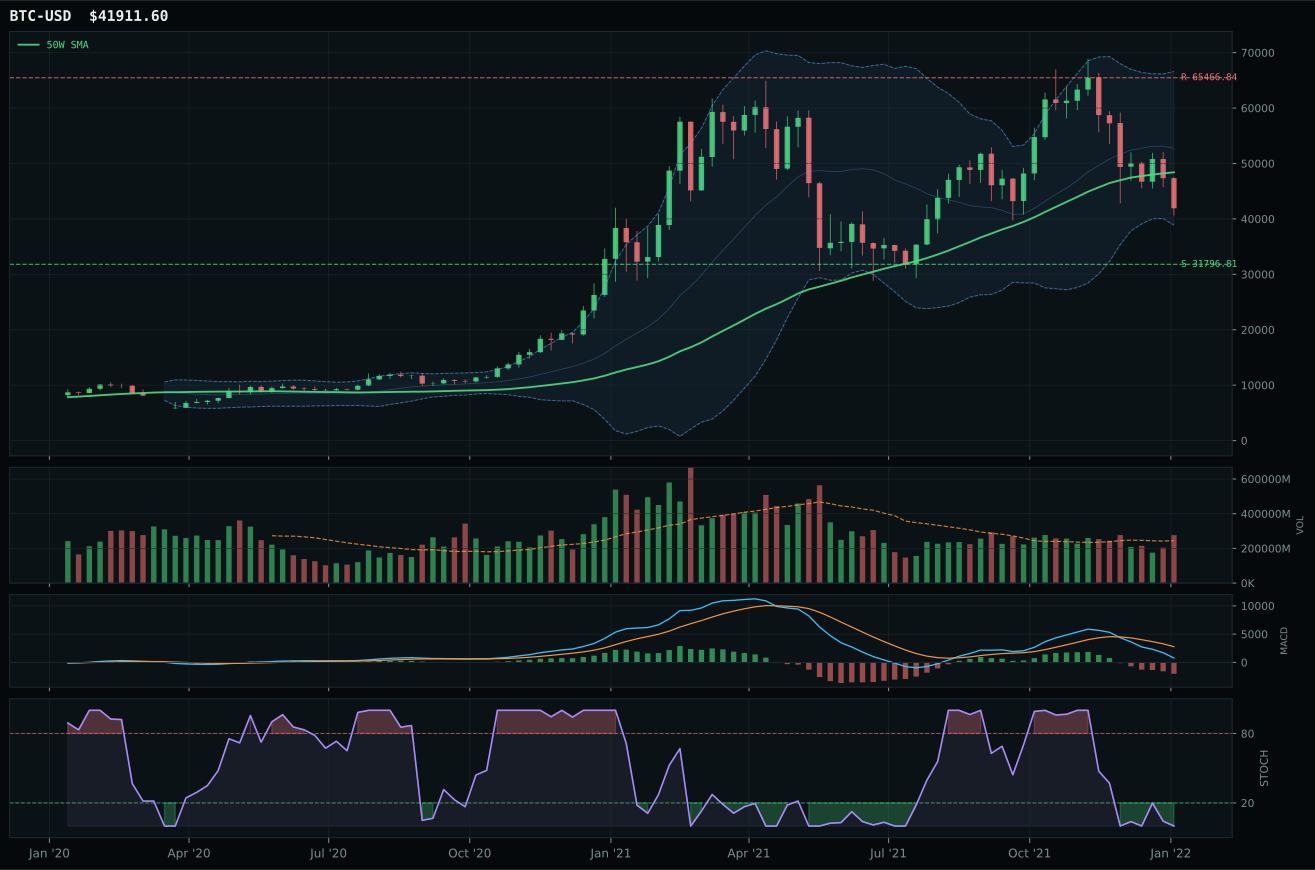
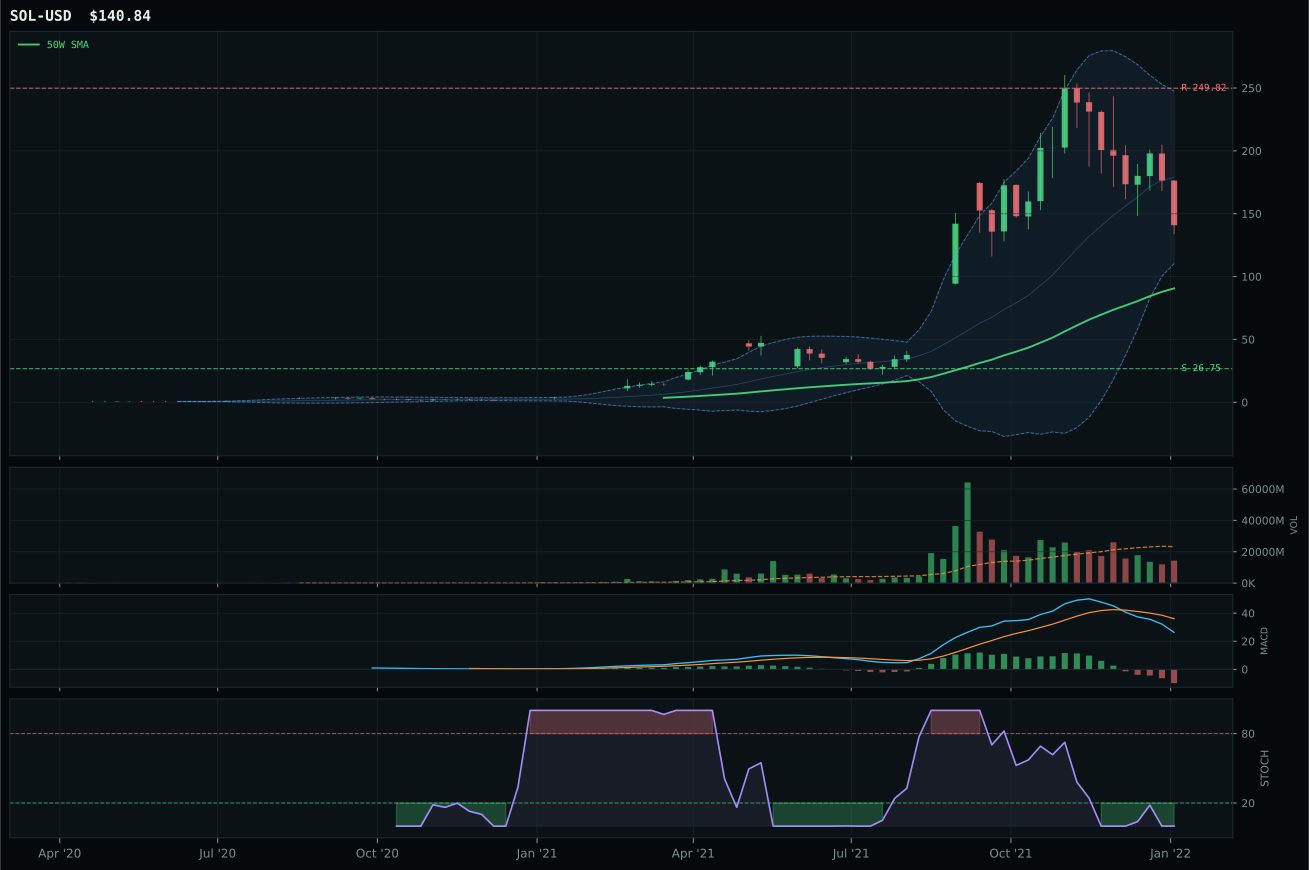
Crypto Regime — NoCrypto
ValueBTC not armed: BTC has not made the first post-breakdown touch of the 200W buy zone after losing the 50W
TrendBTC not confirmed
one or more available conditions failed
Category Rankings
| Rank | Category | Winner | Score | Alloc | 4W Ret | Peers (4W) |
|---|---|---|---|---|---|---|
| 1 | Industrial Metals | COPX | 68.5 | 20% | +2.67% | PICK +2.3% · REMX -6.3% |
| 2 | Utilities & Infrastructure | IGF | 51.6 | 20% | -0.82% | XLU -2.8% · PAVE -7.7% |
| 3 | Traditional Energy | XLE | 50.6 | 10% | +11.53% | XOP +6.0% · FCG +8.7% |
| 4 | Agriculture & Livestock | MOO | 48.5 | 10% | +0.30% | VEGI +0.1% · WEAT +2.8% |
| 5 | Precious Metals | GLD | 48.1 | 10% | +1.25% | SLV +2.6% · GDX +2.6% |
| 6 | Nuclear Energy | URA | 46.7 | 10% | -15.17% | URNM -16.2% · NLR -2.6% |
| 7 | Defense & Aerospace | ITA | 43.8 | 10% | -3.07% | XAR -6.4% · ROKT -6.5% |
| 8 | Technology | CIBR | 43.7 | 10% | -2.34% | XLK -2.3% · IGV -1.4% |
| 9 | AI | SMH | 41.7 | 0% | -6.56% | AIQ -5.1% · BOTZ -12.5% |
| 10 | Emerging Markets | INDA | 36.1 | 0% | -4.89% | IEMG -1.2% · ILF +8.3% |
Industrial Metals — COPX
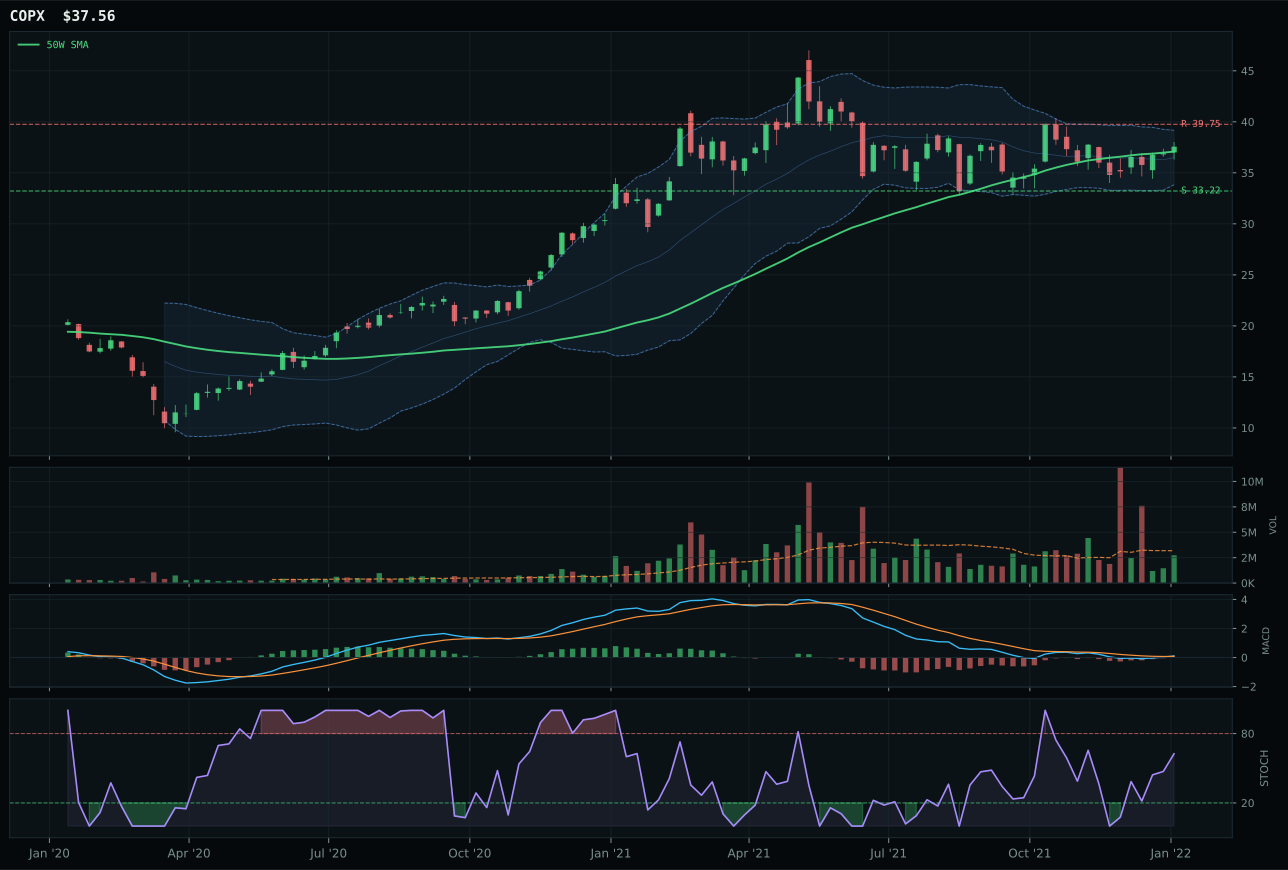
COPX has a compression near 50W profile with -0.4% 13-week relative strength versus SPY.
A failed hold above support would weaken the setup.
Actionable but governed by invalidation levels.
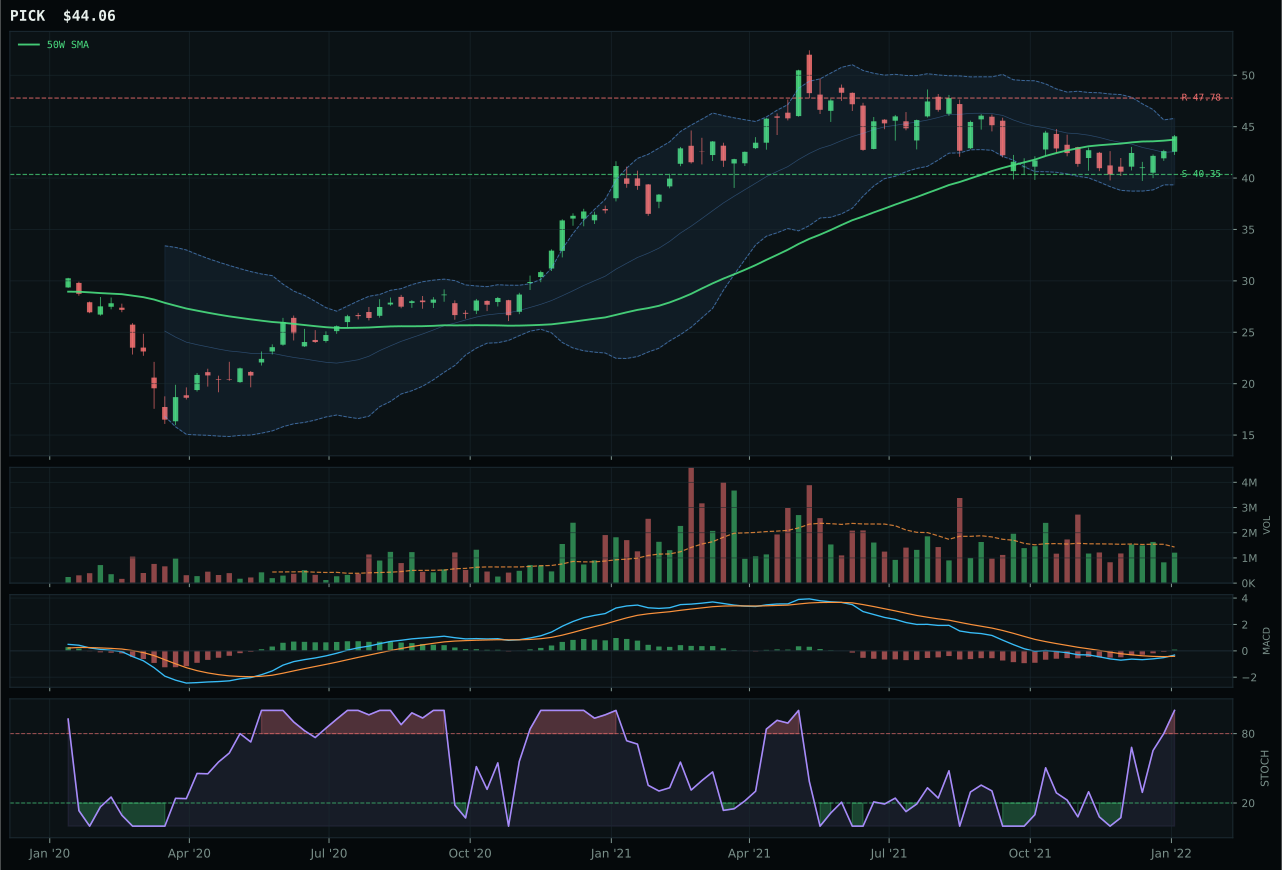
PICK has a compression near 50W profile with -0.8% 13-week relative strength versus SPY.
A failed hold above support would weaken the setup.
Actionable but governed by invalidation levels.
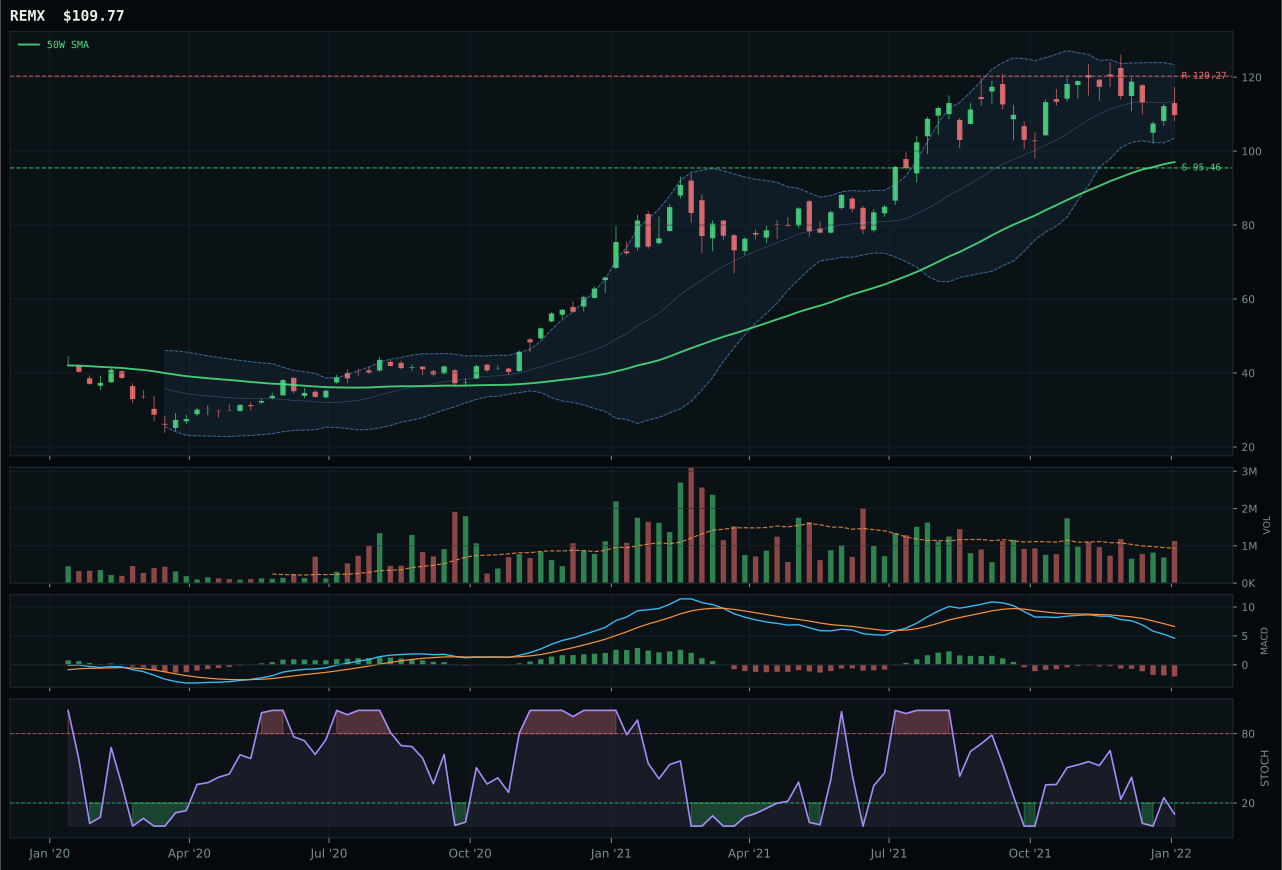
REMX has a neutral structure profile with 0.4% 13-week relative strength versus SPY.
A failed hold above support would weaken the setup.
Actionable but governed by invalidation levels.
COPX and PICK are nearly identical technicals separated by a single stochastic RSI reading, but COPX's rising mid-zone (0.62) beat PICK's overbought momentum (above 0.80). Both sit in compression near the 50W with support at 33.22 and resistance at 39.75, both sport bullish-and-improving MACD, and both show neutral-to-light volume. The 13W return of 6.1% for COPX versus 5.6% for PICK is marginal, but the RSI differential matters: PICK's overbought reading suggests the move has stretched its oscillator and may invite profit-taking, while COPX's rising mid-zone suggests momentum is building but has room to run without buyer exhaustion. Category-relative strength sits flat for COPX (0.0%), confirming that industrial metals buyers are diversifying across the basket rather than concentrating into copper. The score gap is effectively zero (COPX 76 composite vs. PICK 88 on direct comparison), but timing precision rules: in a compression setup, an RSI in the 60s is preferable to an RSI in the 80s because the former implies institutional accumulation while the latter implies retail chase.
Industrial Metals claimed a top-2 20% allocation because the category score of 68.5 is the highest-ranked after COPX's tight 1.3% distance from the 50W and macro sponsorship of 73.0/100 create a rare combination of technical precision and narrative alignment. Metals scarcity is active at +14, commodity breadth positive at +10, and real asset sponsorship at +6—the strongest macro tailwinds in the portfolio. The technical evidence of 83.2/100 for the representative (COPX) is driven by near-perfect trend (99.4) and pristine timing (100.0), with reasonable risk/reward at 60.6/100. The compression setup near the 50W with defined support at 33.22 offers a low-friction entry for portfolio rebalancing: if metals hold support, the position compounds; if they break, the loss is controlled at 13.1% downside. The 20% allocation reflects that Industrial Metals combines the tightest technical entry in the portfolio with the strongest macro narrative—a rare alignment that justifies maximum exposure.
Utilities & Infrastructure — IGF
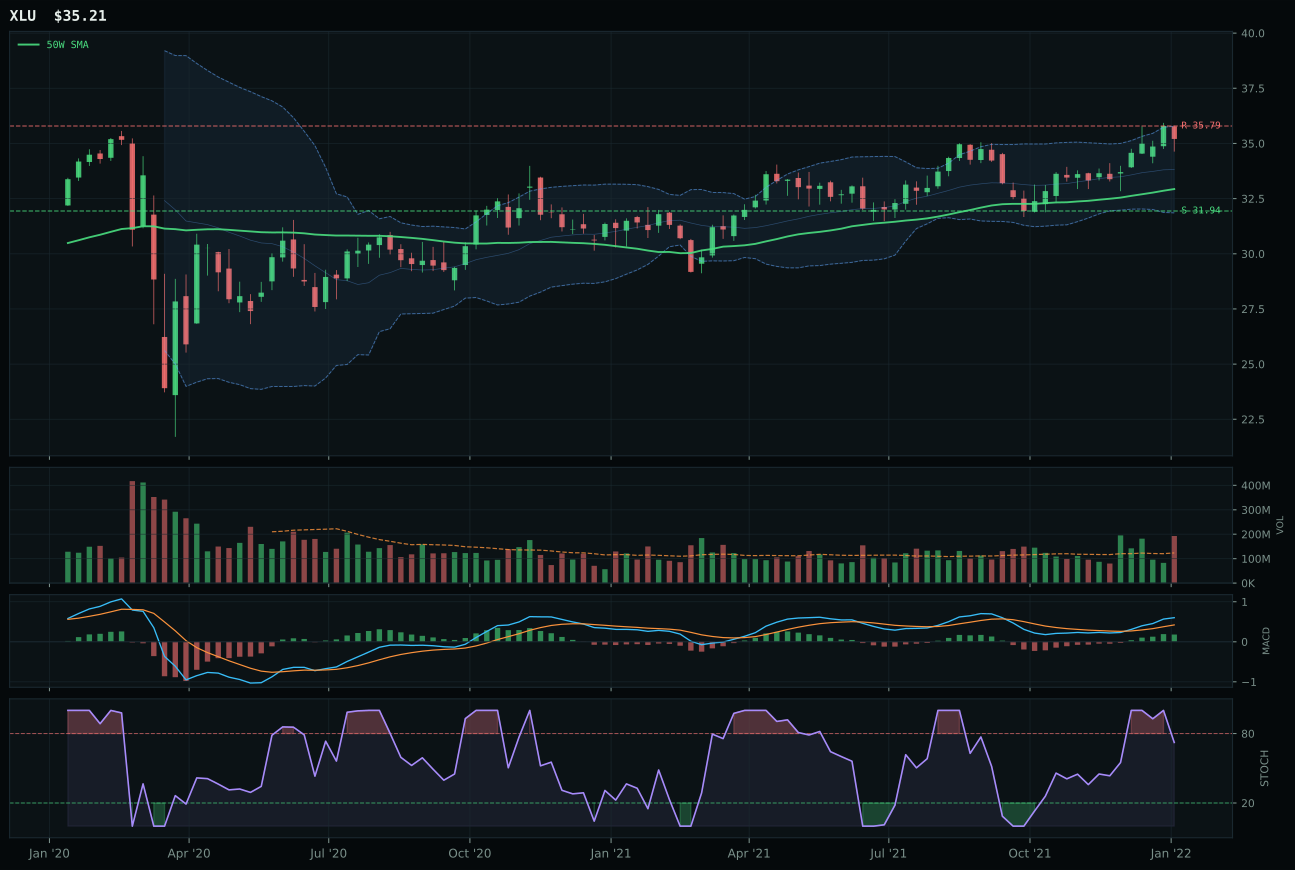
XLU has a neutral structure profile with 2.3% 13-week relative strength versus SPY.
A failed hold above support would weaken the setup.
Actionable but governed by invalidation levels.
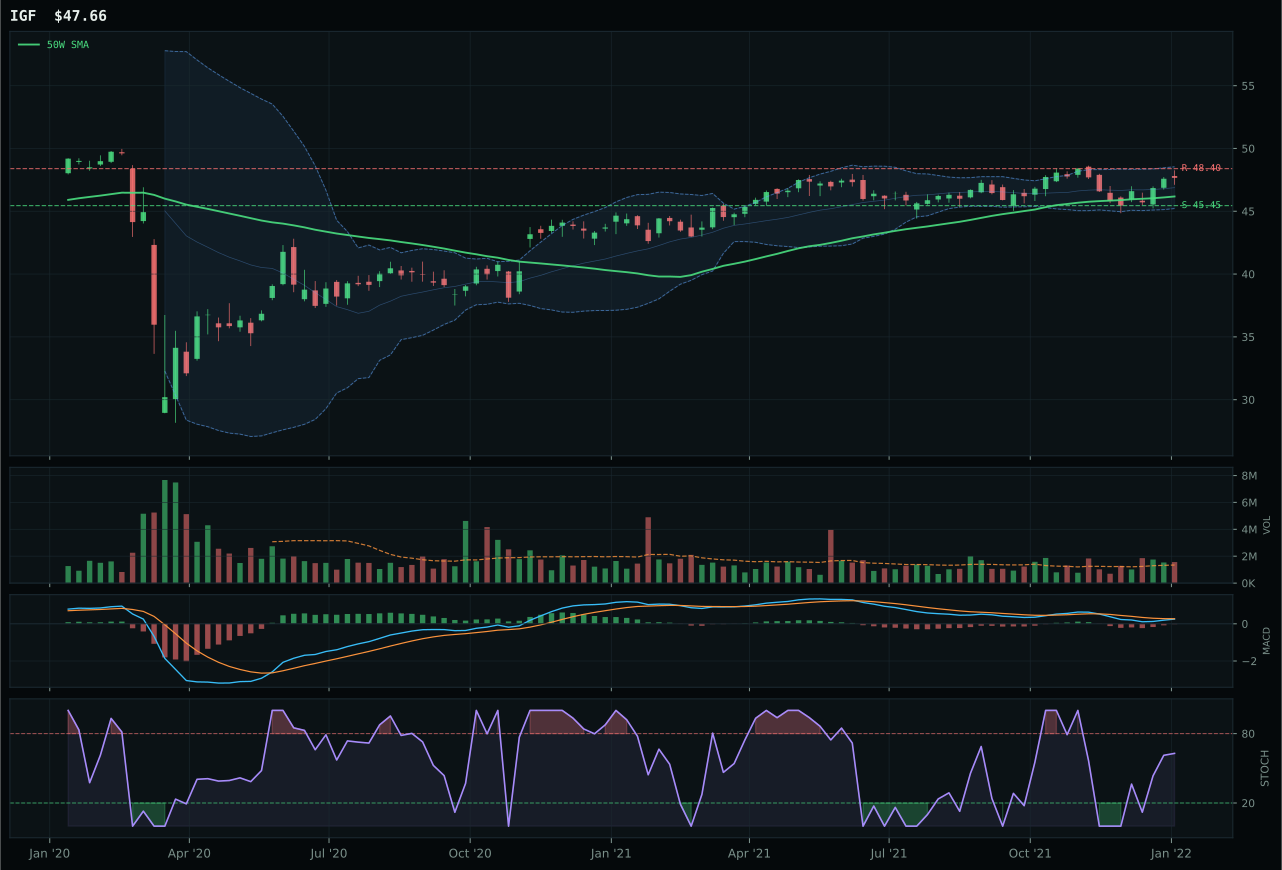
IGF has a pullback into support profile with -4.6% 13-week relative strength versus SPY.
A failed hold above support would weaken the setup.
Actionable but governed by invalidation levels.
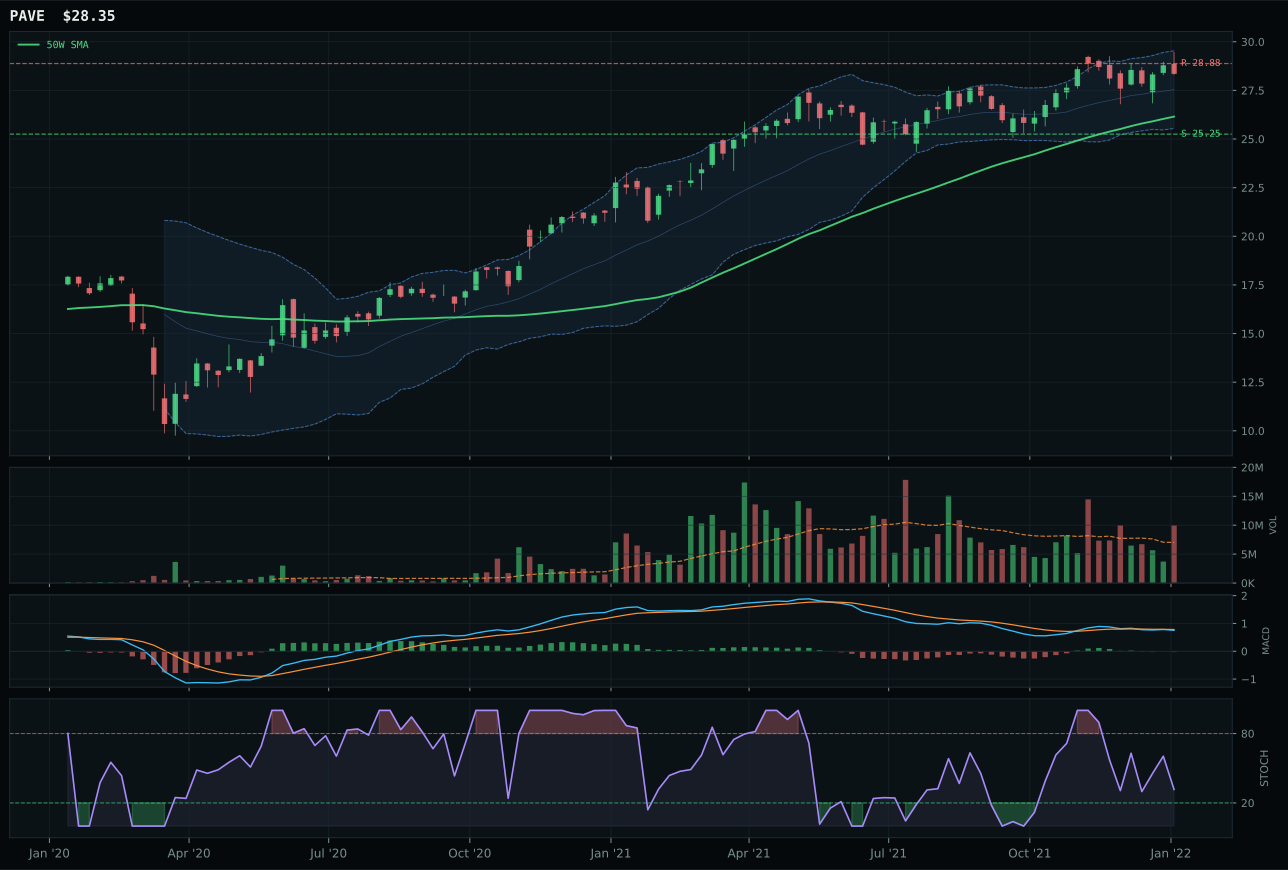
PAVE has a neutral structure profile with 2.2% 13-week relative strength versus SPY.
A failed hold above support would weaken the setup.
Actionable but governed by invalidation levels.
IGF captured the category on timing perfection and structure definition, though XLU is the stronger absolute chart. IGF sits 3.2% above the 50W in pullback-into-support at 45.45 with a tight 2.95-point resistance band at 48.40—a pristine entry box. XLU sits in neutral structure after an 8.7% thirteen-week rally, meaning the move has already harvested much of its quick profit potential. Both show defensive rotation sponsorship (XLU's bullish-and-improving MACD is stronger), but IGF's timing score of 100 versus XLU's 75 reflects one critical difference: pullback-into-support is where institutional buyers reload, while neutral structure after strength is where they take chips off. XLU's stochastic RSI is falling/neutral versus IGF's rising mid-zone, another sign of rally fatigue in the utility name. Volume confirms the pattern: IGF is above-average participation (1.16x) suggesting accumulation into the support zone, while XLU shows distribution pressure (volume expanding on a bounce), the opposite signal.
Utilities & Infrastructure earned a top-2 20% allocation because the category score of 51.6 is the second-highest-ranked in the portfolio, and the setup quality justifies it. Defensive rotation is the strongest-running macro narrative at +12, the Transition / Mixed regime adds +4, and IGF's technical evidence is 73.9/100 with perfect timing (100/100). Risk/reward is only 50.7/100, meaning the portfolio is not buying upside potential but downside protection—exactly the right frame for a transition regime where visibility is poor. The pullback-into-support structure at 45.45 offers institutional-quality entry risk management: buyers who accumulate here have defined invalidation, and the tight resistance band (48.40) caps immediate exploitation. This allocation reflects a two-fold thesis: first, that defensive rotation will persist as long as credit stress remains a shadow concern; second, that infrastructure income is less vulnerable to macro whipsaws than cyclical or growth equity. The 20% weighting is justified, but it is anchored by timing and structure clarity, not by bullish momentum—this is a defensive 20%, not an opportunistic one.
Traditional Energy — XLE
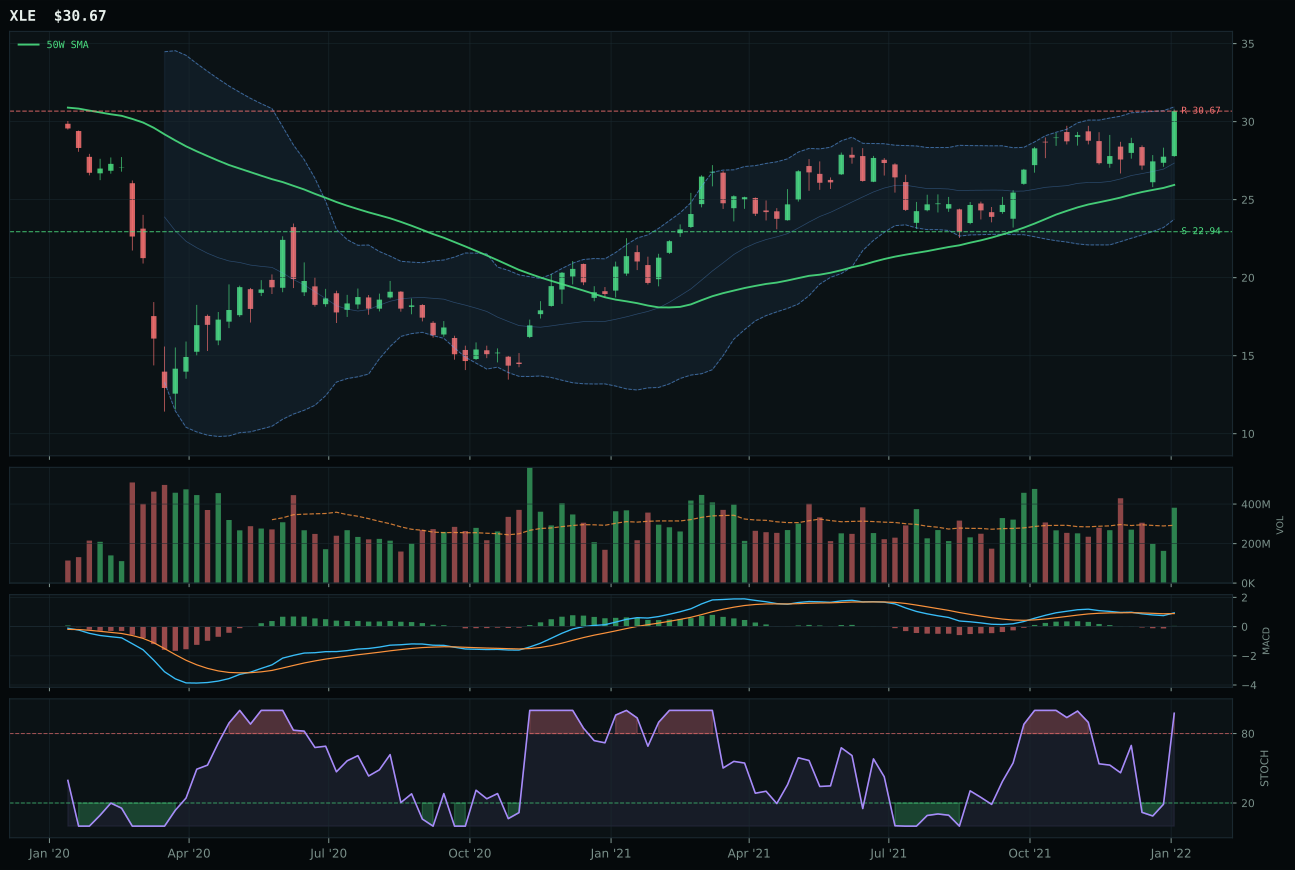
XLE has a vertical extension profile with 2.0% 13-week relative strength versus SPY.
A failed hold above support would weaken the setup.
Actionable but governed by invalidation levels.
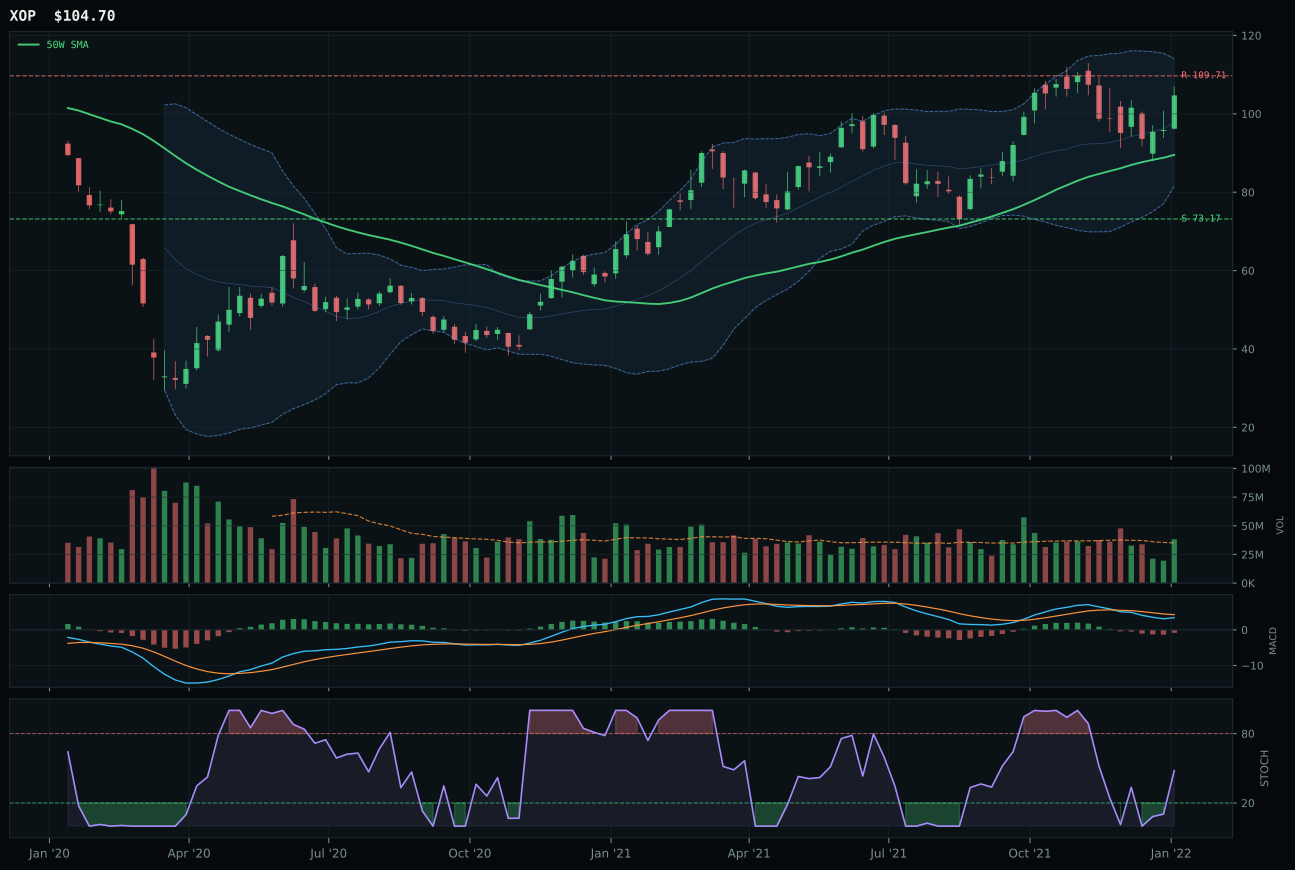
XOP has a vertical extension profile with -7.1% 13-week relative strength versus SPY.
A failed hold above support would weaken the setup.
Actionable but governed by invalidation levels.
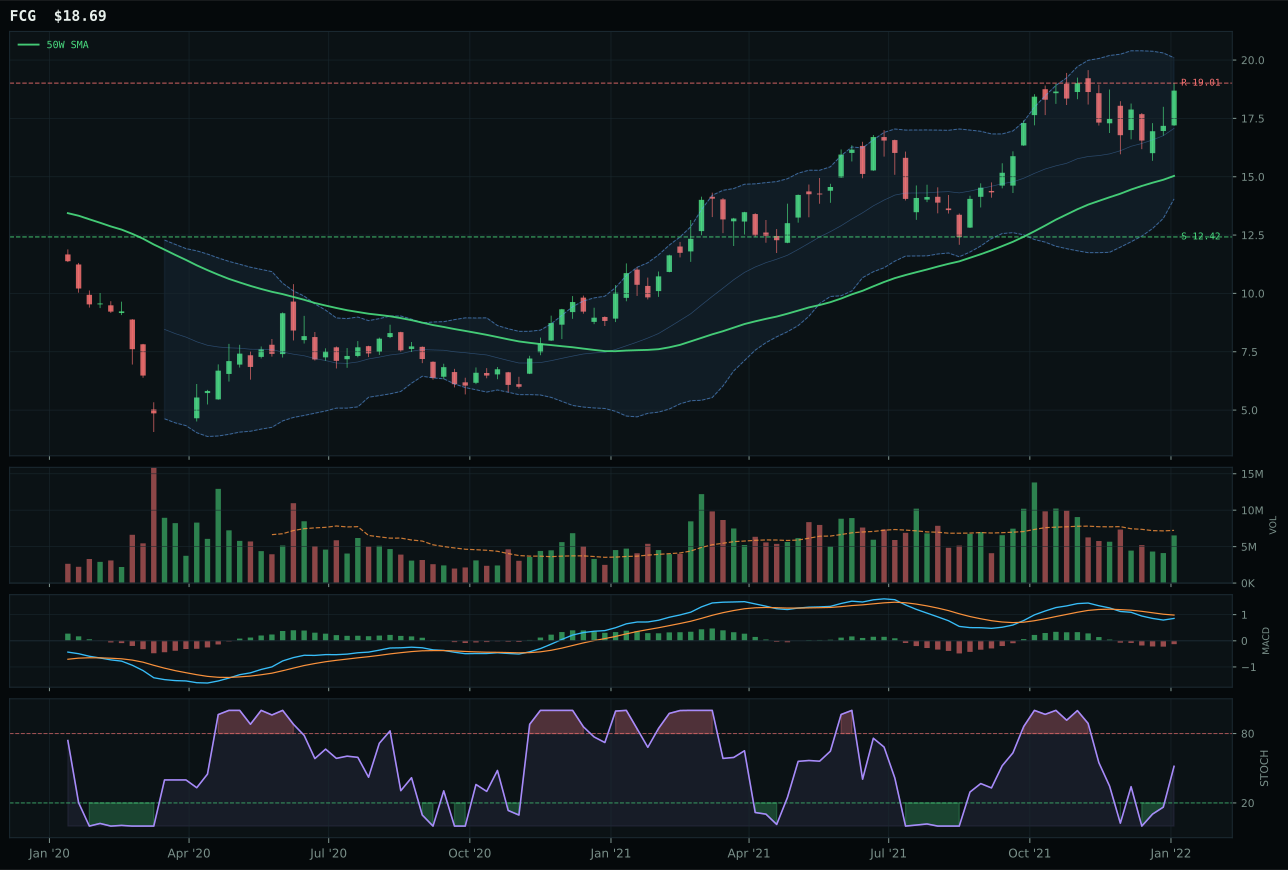
FCG has a vertical extension profile with -5.0% 13-week relative strength versus SPY.
A failed hold above support would weaken the setup.
Actionable but governed by invalidation levels.
XLE dominates the energy category despite severe entry-timing problems because momentum confirmation and sector-relative leadership overwhelm the objections. The ETF is 18.2% extended above the 50W, stochastic RSI is overbought at 0.98, and resistance sits directly overhead at 30.67, leaving zero upside room—textbook extended momentum. Yet the 13W return is 8.4%, the category-relative strength is 7.0% (highest in the sector), and volume is above-average participation on a bullish-and-improving MACD. XOP, the runner-up, has MACD rolling over to bearish/weakening even though it sits in similar extension, and category-relative strength at -2.0% suggests exploration beta is being rotated out. In a commodity bull market driven by energy scarcity (+14 in the macro), the question becomes: do you buy the extended leader that has sponsorship, or the pullback candidate that has broken momentum? The data says extended leaders with rising relative strength outperform pullbacks with deteriorating relative strength. XLE's timing score of 37/100 is the tax paid for entry risk, not a disqualification from leadership.
Traditional Energy earned 10% allocation despite a solid 50.6 category score because the extended price action and poor timing (37/100) mean the setup is defensive rather than opportunistic. The macro case is overwhelming: energy scarcity is +16, inflation pressure is +10, supply shortage is +9, and real asset sponsorship is +7—a 52-point macro tailwind. Yet the technical evidence of 84.3/100 for XLE is heavily dependent on trend and momentum; the timing score collapses because entry risk is real. Risk/reward is only 41.3/100, acknowledging that downside (33.7%) dwarfs upside (0%). The 10% allocation captures the energy narrative with defensive positioning: the portfolio holds XLE for the scarcity thesis, but at reduced size and with acceptance that entry will hurt if energy corrects. The allocation would hold at 10% unless XLE breaks below 22.94 support (a -25% move from entry) or rotates sharply above 30.67 on volume—either case would provide better timing. If energy weakness reverses and XLE compresses back to the 50W, the allocation could expand to 20%.
Agriculture & Livestock — MOO
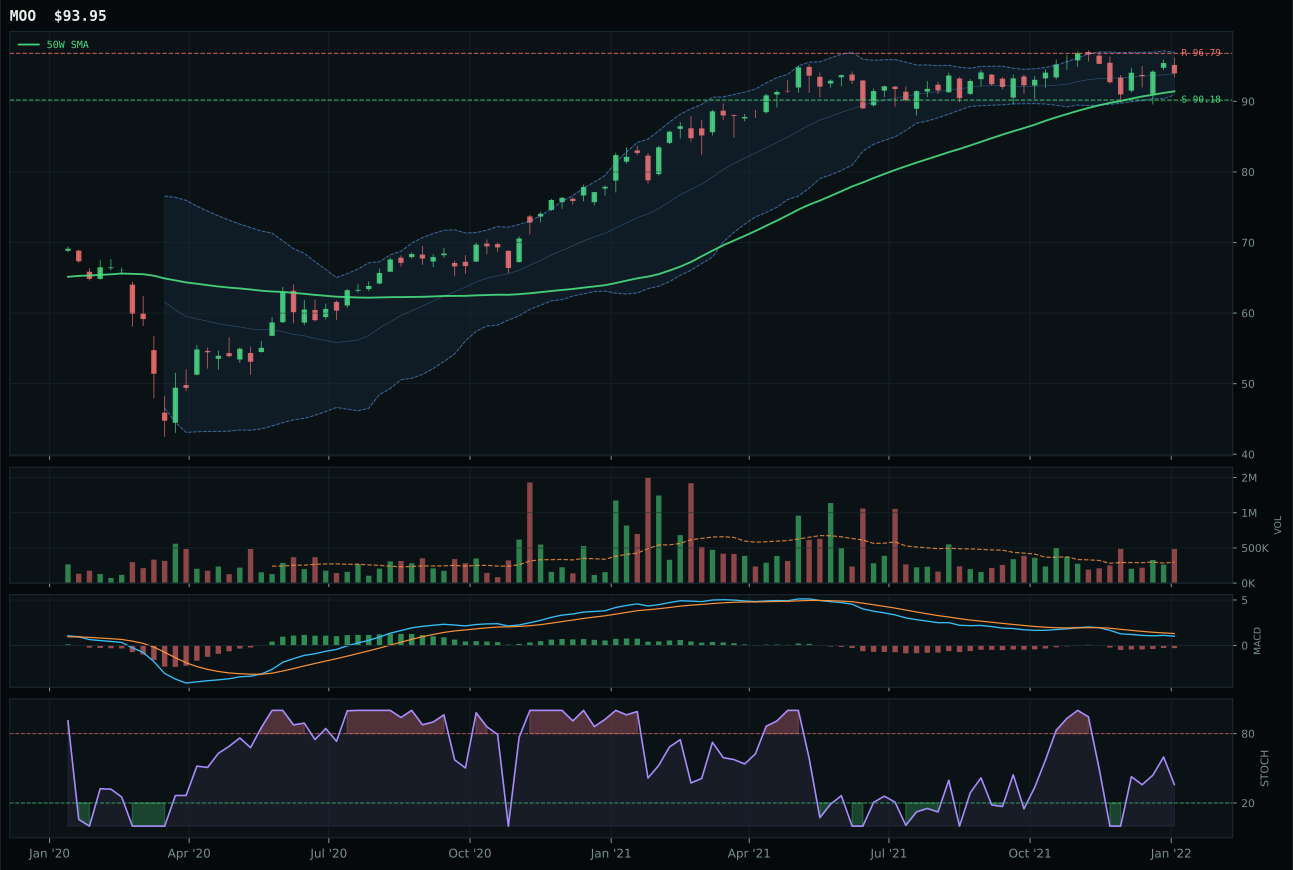
MOO has a pullback into support profile with -5.5% 13-week relative strength versus SPY.
A failed hold above support would weaken the setup.
Actionable but governed by invalidation levels.
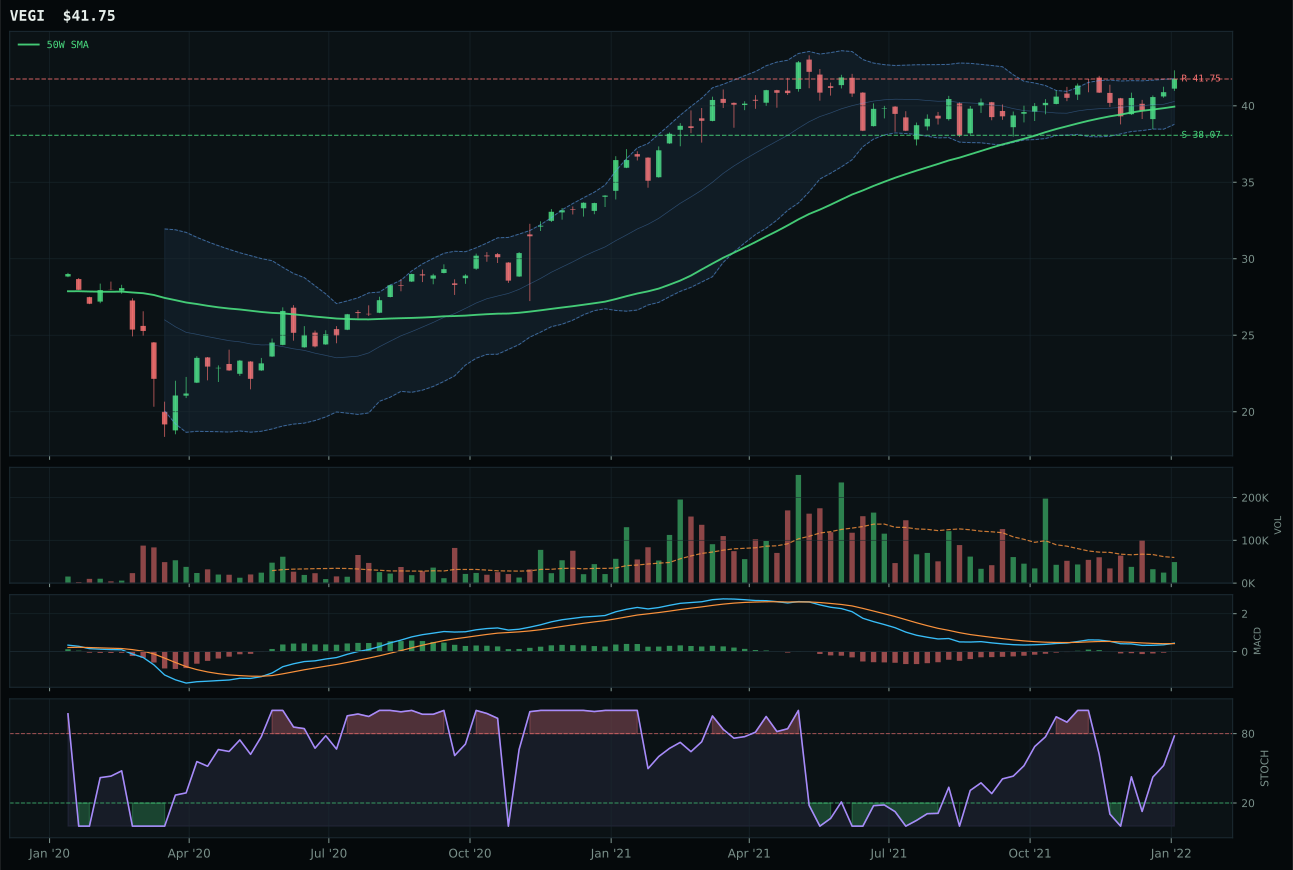
VEGI has a neutral structure profile with -2.0% 13-week relative strength versus SPY.
A failed hold above support would weaken the setup.
Tracked, but not top-2 eligible because: .
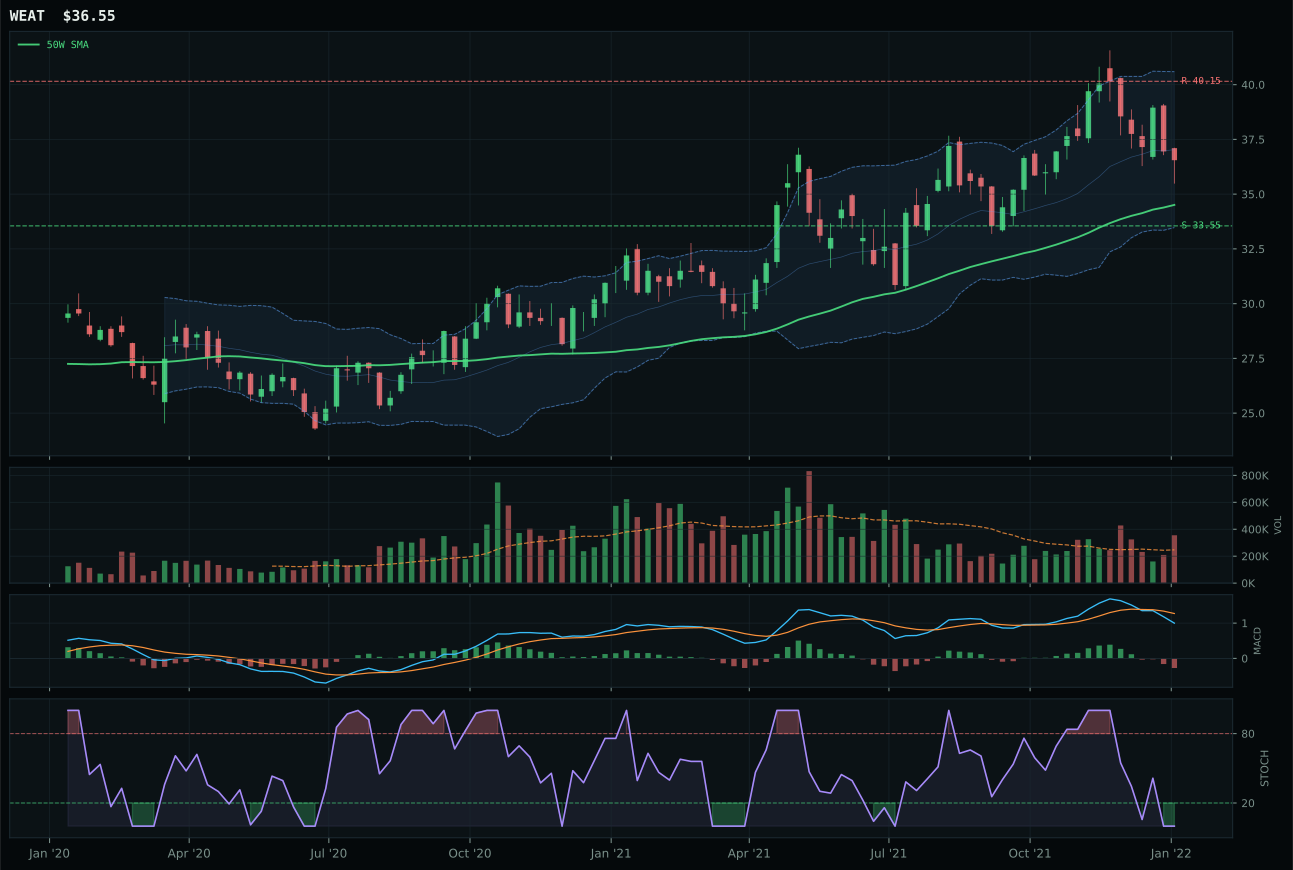
WEAT has a neutral structure profile with -4.5% 13-week relative strength versus SPY.
A failed hold above support would weaken the setup.
Tracked, but not top-2 eligible because: .
MOO defeated VEGI on timing precision and structure definition despite being the weaker technical chart. MOO sits 2.8% above the 50W in a pullback-into-support pattern with support at 90.18 and resistance at 96.79—a tight, invalidation-defined setup that lets the allocator sleep at night. VEGI's neutral structure and bullish MACD combined with a rising stochastic RSI should make it the obvious choice, but VEGI scored only 98.0 on timing versus MOO's perfect 100 because a neutral structure at the Fib 0.236 zone offers no defined invalidation point. MOO's distribution pressure (1.64x volume) on a -0.1% four-week return signals smart money taking profits into strength, not panic selling—a subtle positive. The thirteen-week returns favor VEGI at 4.4% versus 1.0%, but category-relative strength runs -1.0% for MOO versus +2.4% for VEGI, meaning MOO's strength is more internal to agribusiness while VEGI is riding broader EM commodity tailwinds. Structure and timing matter in transition regimes: MOO gives the portfolio an exit plan if the trade reverses, while VEGI leaves the position naked.
Agriculture earned 10% despite a 48.5 category score because the macro sponsorship is exceptional at 86.0/100—supply shortage is live at +13, inflation pressure at +10, and real asset sponsorship at +8. These are the strongest category-level macro readings in the portfolio. Yet the technical evidence is only 41.0/100, reflecting weak momentum (29.9 on momentum confirmation), poor volume persistence (36.2/100), and a risk/reward balance (49.6/100) that is barely half as attractive as Industrial Metals. The 10% allocation is a macro conviction with technical risk management: MOO's defined entry and support structure let the portfolio capture the supply-shortage and inflation narratives without overexposure to an extended rally. Until MOO demonstrates that it can hold support and reload above resistance on accumulation, or until VEGI's strength translates into category-relative leadership, agriculture remains a tactical hedge rather than a structural position. A sustained break above 96.79 on rising volume would justify rotation to 20%.
Precious Metals — GLD
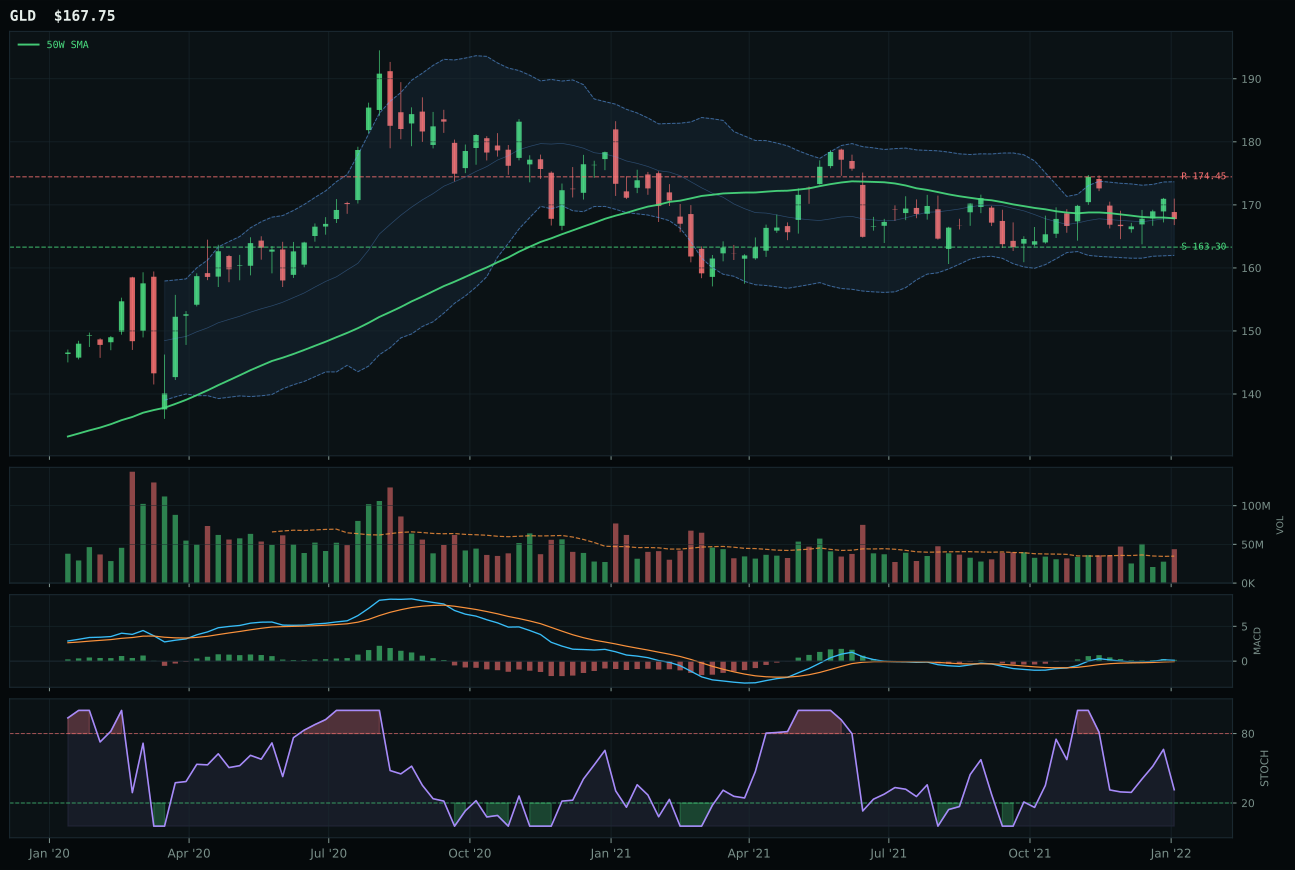
GLD has a pullback into support profile with -4.3% 13-week relative strength versus SPY.
A failed hold above support would weaken the setup.
Actionable but governed by invalidation levels.
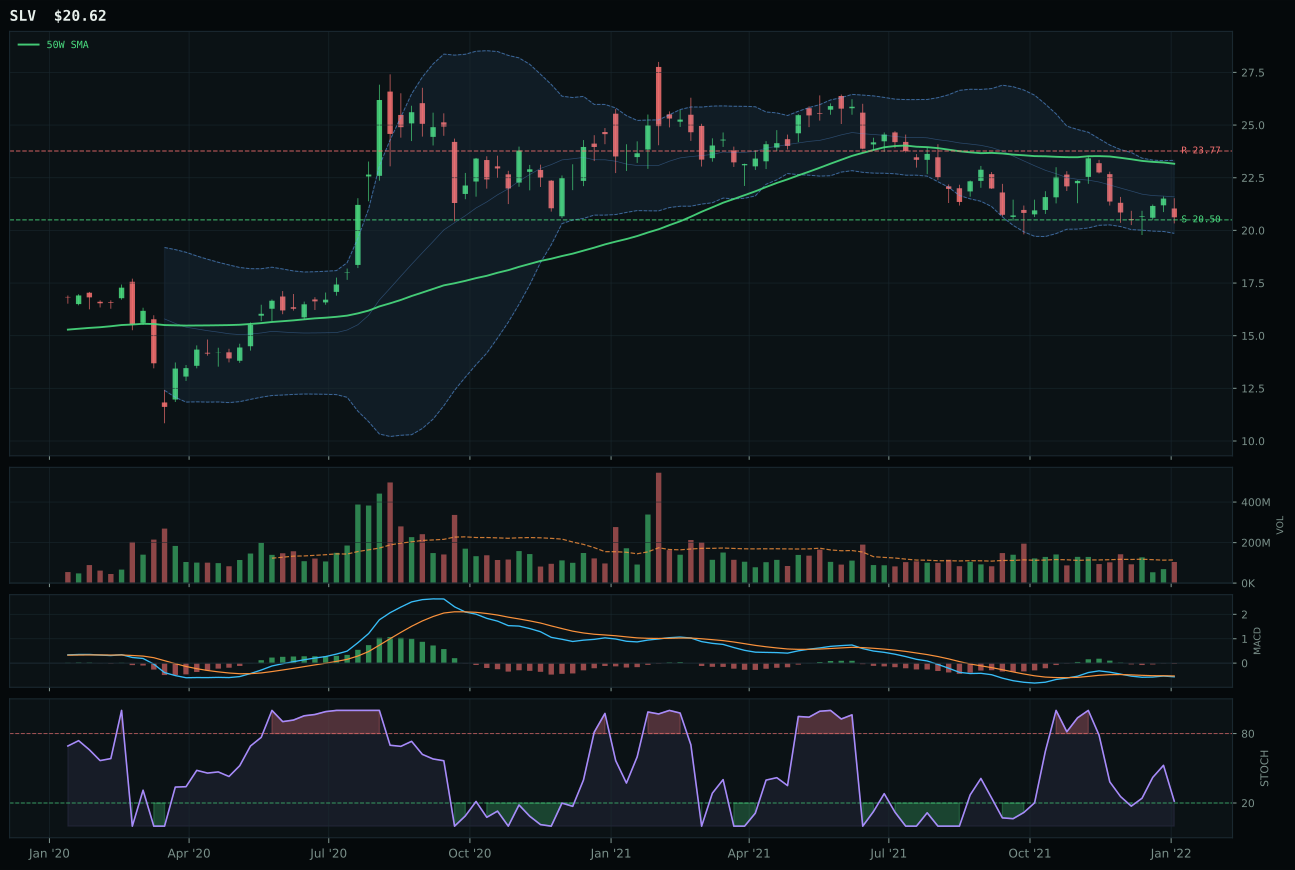
SLV has a pullback into support profile with -8.0% 13-week relative strength versus SPY.
A failed hold above support would weaken the setup.
Actionable but governed by invalidation levels.
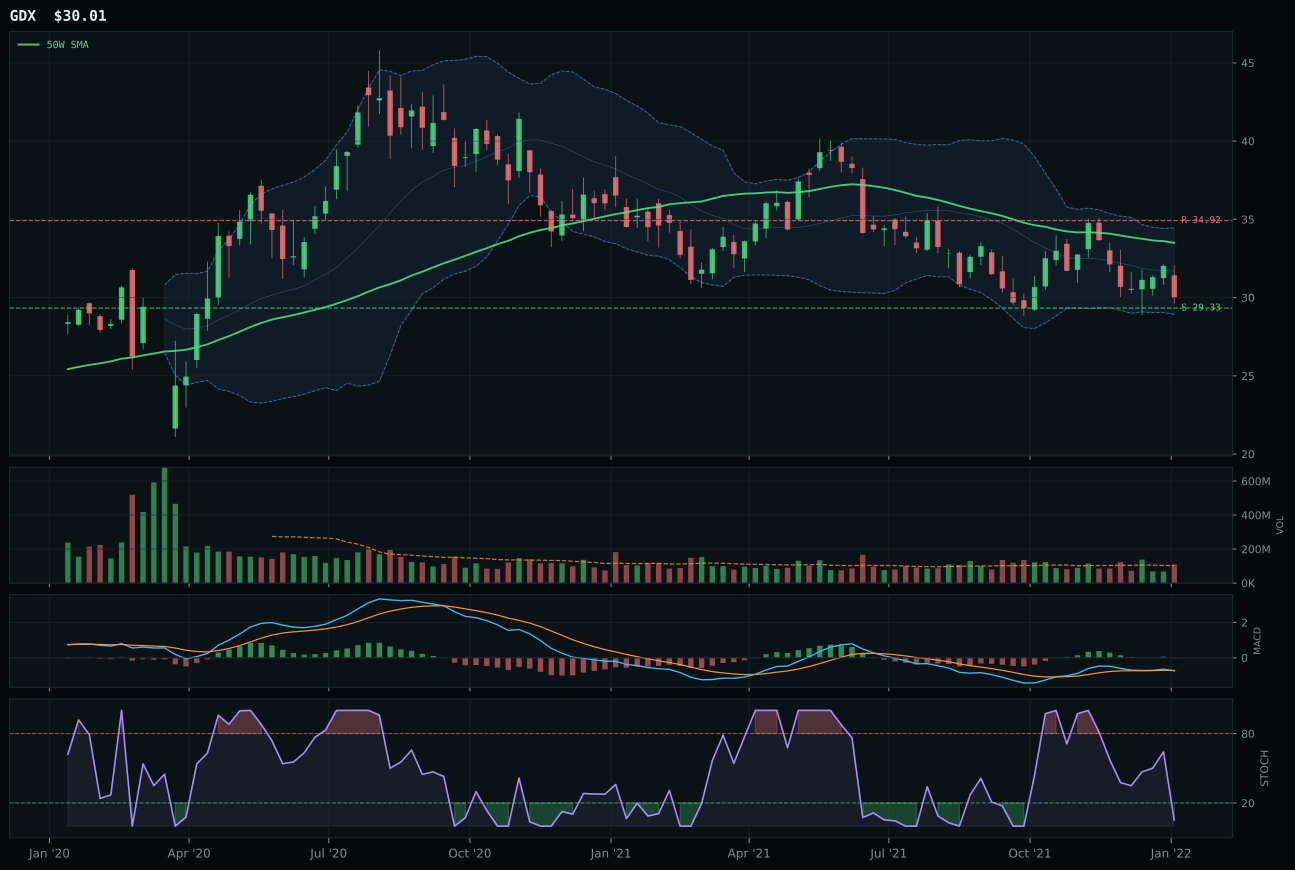
GDX has a pullback into support profile with -8.6% 13-week relative strength versus SPY.
A failed hold above support would weaken the setup.
Actionable but governed by invalidation levels.
GLD won despite sitting at the 50W (essentially a coin flip on trend) because the rest of the setup compensates with clarity and sponsor behavior. Below the 50W but above the 200W, GLD is in reset-not-collapse mode, and the pullback-into-support at 163.30 gives buyers a defined accumulation floor. SLV also trades pullback-into-support but sits deeper in retracement territory (near the 52W low / repair zone) with bearish-but-improving MACD versus GLD's bullish-and-improving, a critical distinction in a mixed macro environment. GLD's timing score of 100 derives from proximity to the 50W (-0.1%) combined with stochastic RSI at the falling/neutral point where buyers often defend—SLV's timing score is only 65 because it sits further from the moving average and its stochastic is also falling, meaning the two charts are in different phases of recovery. Category-relative strength of 3.7% for GLD means gold buyers are rotating into the monetary hedge rather than silver's hybrid industrial beta, exactly what you want to see in a credit-stress regime. SLV's volume is neutral while GLD's is above-average participation, a small but meaningful sign of accumulation conviction.
Precious Metals earned 10% because the category score of 48.1 places it firmly in the middle tier, neither compelling enough for 20% nor weak enough for exclusion. Defensive rotation is live at +7, which supports the allocation, but macro fit is only 52.0/100—credit stress and risk appetite are in tension. The technical evidence (72.8/100 for the category representative) is solid but not exceptional; GLD's below-50W position means the category has already pullback'd and is now proving it can stabilize rather than extending into new strength. The 10% holding captures the defensive narrative without overcommitting to metals on the assumption that credit concerns will spike. Risk/reward is favorable at 78.4/100, meaning the portfolio can afford to be patient with this position. The allocation would remain at 10% unless GLD breaks back above the 50W on accumulation volume or unless credit stress jumps into the +10 to +15 range, at which point metals would flip to 20% as a full defensive position.
Nuclear Energy — URA
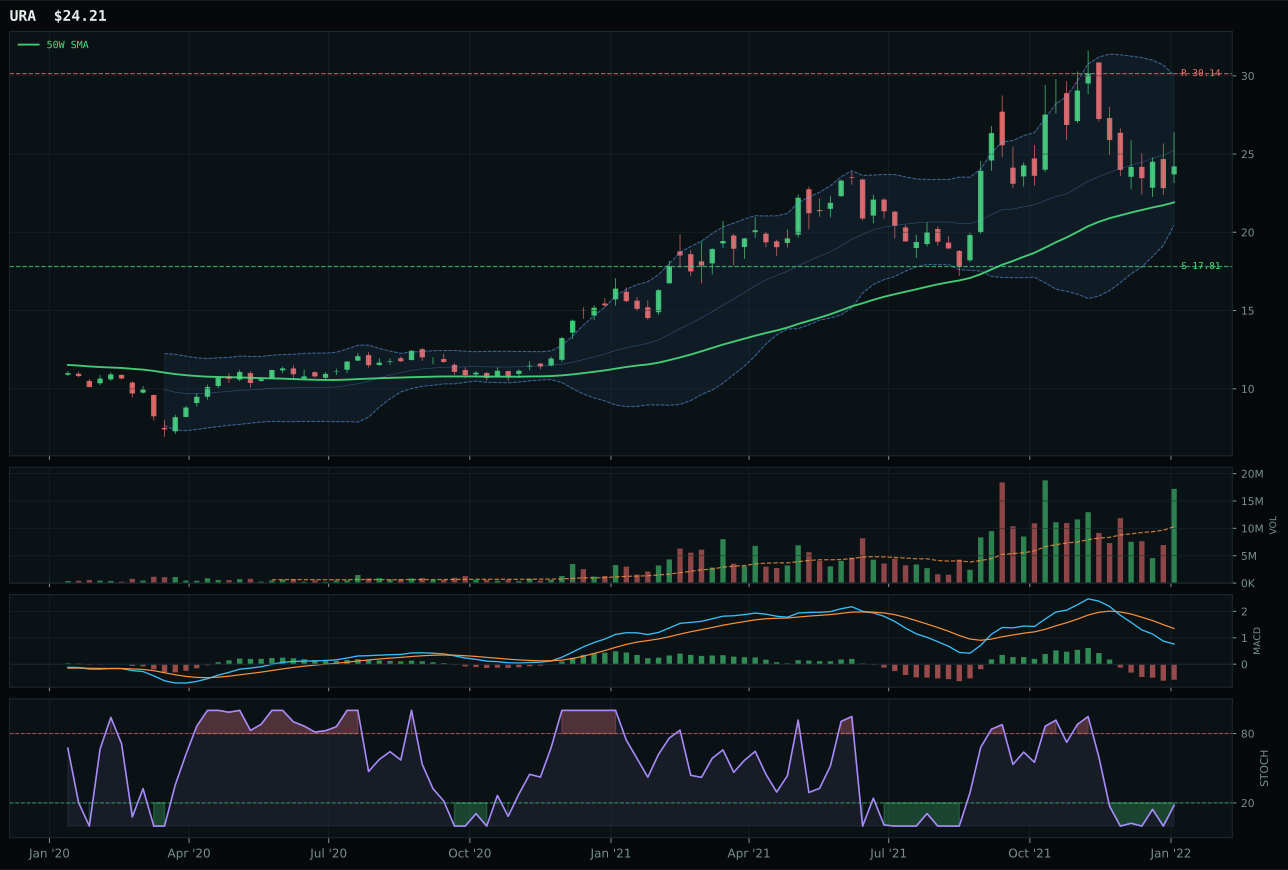
URA has a neutral structure profile with -3.9% 13-week relative strength versus SPY.
A failed hold above support would weaken the setup.
Actionable but governed by invalidation levels.
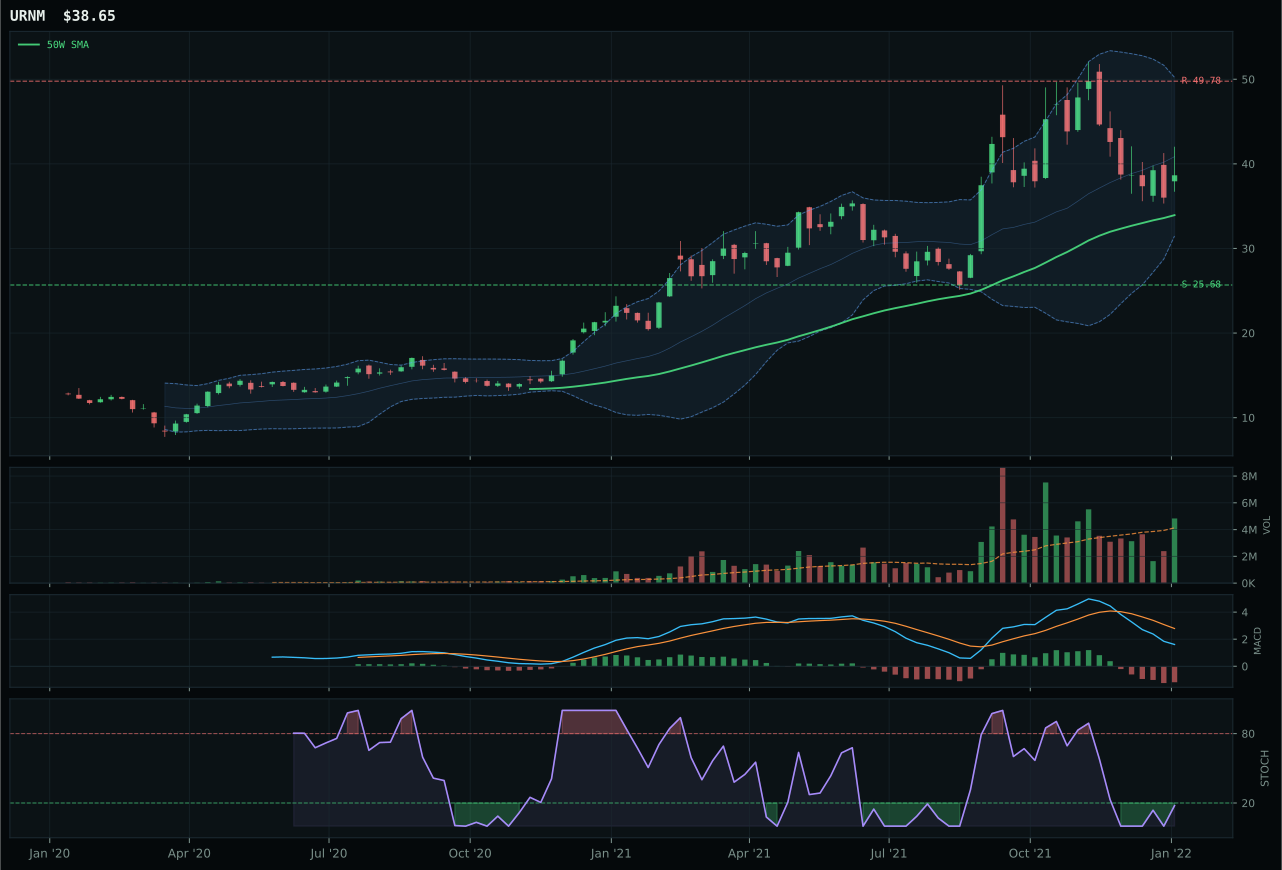
URNM has a neutral structure profile with -4.6% 13-week relative strength versus SPY.
A failed hold above support would weaken the setup.
Actionable but governed by invalidation levels.
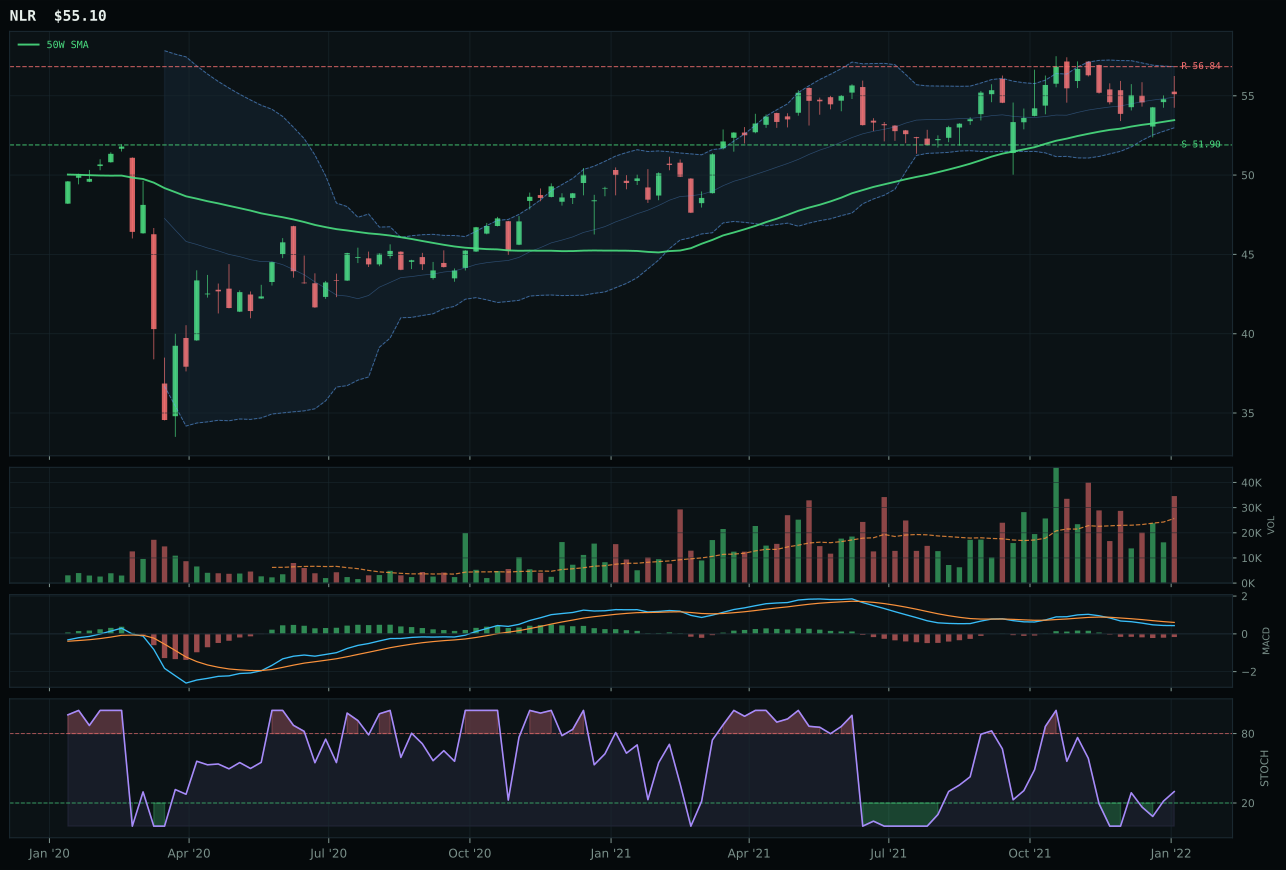
NLR has a neutral structure profile with -4.8% 13-week relative strength versus SPY.
A failed hold above support would weaken the setup.
Tracked, but not top-2 eligible because: .
URA beat URNM on structure cleanliness and timing consistency despite near-identical technical factors. Both sit above both moving averages with neutral structures and oversold-turn-up stochastic RSI readings, but URA's timing score of 91/100 exceeds URNM's 84/100 because URA sits 10.5% from the 50W in a better Fibonacci zone (0.382 middle retracement vs. URNM's 0.382, same level but URA got there first). URA's volume is accumulation/confirmation at 1.67x, a subtle positive suggesting smart money is building after the pullback, while URNM's above-average participation suggests wider distribution without clear sponsor intent. The thirteen-week returns are nearly flat for both (2.5% for URA, 1.9% for URNM), but URA carries a +0.7% category-relative edge, meaning uranium buyers are concentrating into the ETF structure rather than mining beta. Risk/reward is tighter for URA (44.9 vs. 38.0), acknowledging that uranium still has work to prove its recovery is real.
Nuclear Energy earned 10% because the category score of 46.7 sits in the middle of the portfolio and macro sponsorship is split. Energy scarcity is live at +9 and real asset sponsorship at +7, but the macro fit is only 50.0/100 overall and technical evidence is only 53.1/100. The setup reads as a genuine accumulation (stochastic oversold turning up, volume confirmation) rather than a dead-cat bounce, but momentum is barely there (4W return near zero, 13W return only 2.5%). The 10% allocation anchors the energy-scarcity theme with a nuclear-specific play that benefits from grid-demand tailwinds without overcommitting to a sector in early recovery. Unlike Traditional Energy (extended and crowded), URA offers entry risk but also reward potential—the portfolio can hold this and add on a break above 30.14 resistance if evidence of genuine buying emerges. The category stays at 10% unless technical evidence jumps materially (timing score above 95, MACD bullish and improving) or unless macro descriptors shift toward energy peak concerns.
Defense & Aerospace — ITA
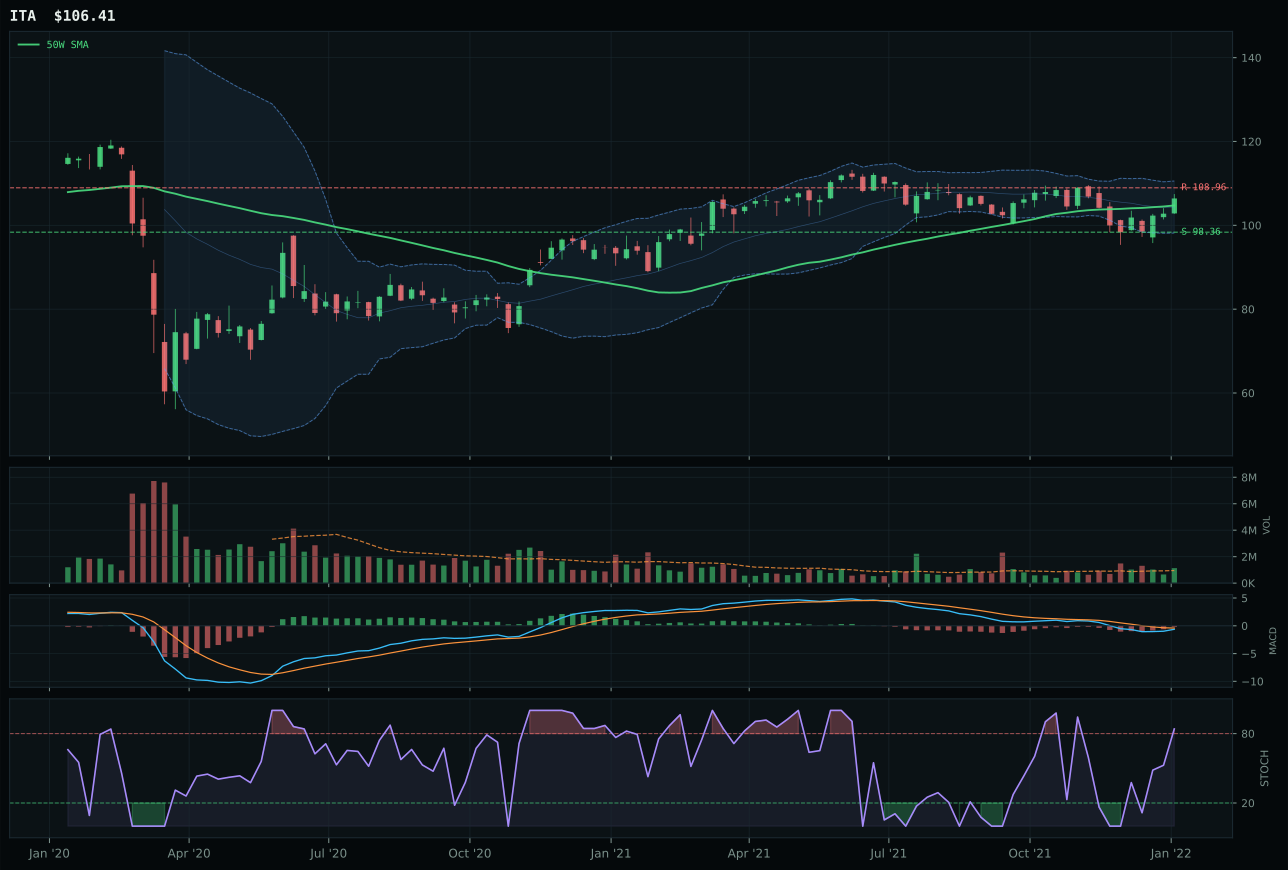
ITA has a compression near 50W profile with -7.7% 13-week relative strength versus SPY.
A failed hold above support would weaken the setup.
Actionable but governed by invalidation levels.
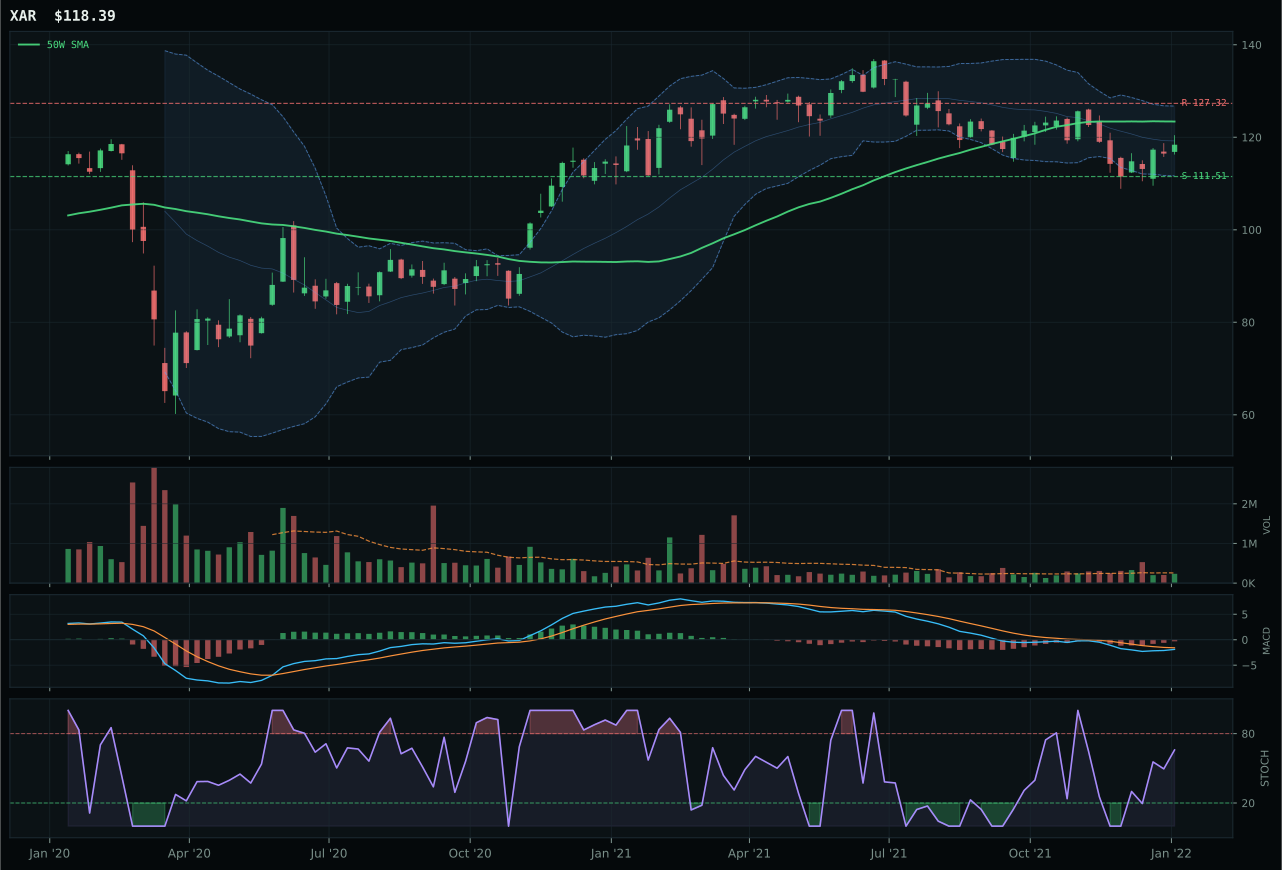
XAR has a neutral structure profile with -9.8% 13-week relative strength versus SPY.
A failed hold above support would weaken the setup.
Actionable but governed by invalidation levels.
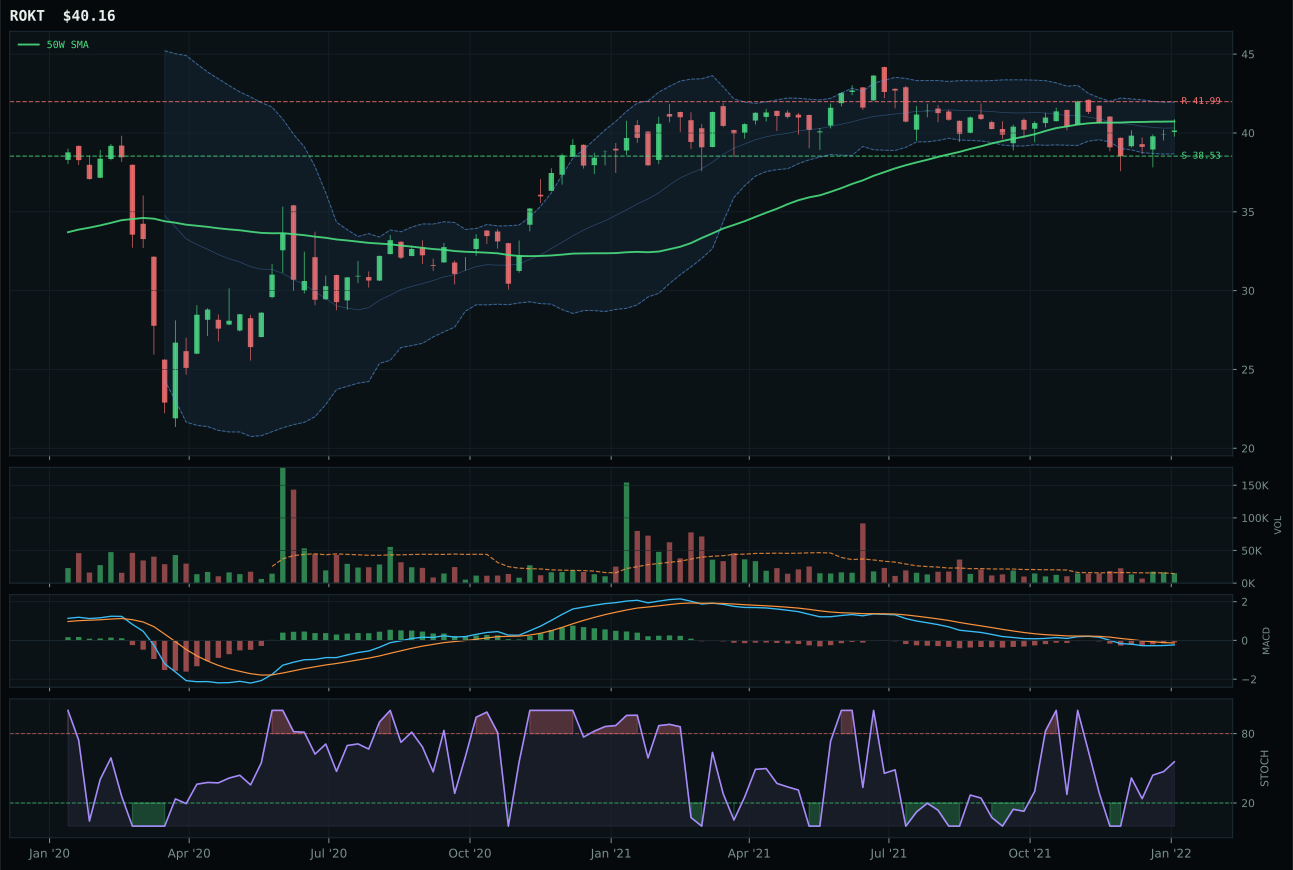
ROKT has a pullback into support profile with -7.6% 13-week relative strength versus SPY.
A failed hold above support would weaken the setup.
Tracked, but not top-2 eligible because: .
ITA earned the nod through timing precision and structural cleanliness despite flat momentum. Trading just 1.6% above the 50W in a compression pattern near that level, ITA offers what amounts to a coiled spring setup—if institutional buyers defend the moving average, compression can trigger expansion with defined risk. XAR's neutral structure and lower volume confirmation (neutral participation versus ITA's 1.19x above average) left it behind on risk/reward grounds even though both charts show improving MACD and similar SPY-relative weakness. ITA's stochastic RSI is overbought momentum, which would normally be a drag, but the timing score of 100 reflects the fact that compression near the 50W is where buyers accumulate before expansion, not where they fade. The 22-point score gap is severe, driven by XAR's lack of participation and its deeper Fibonacci retracement (0.500 zone versus ITA's 0.236), which signals less institutional readiness to defend upside. Category-relative strength is flat for ITA, meaning defense rotation is happening equally across the sector rather than concentrating into aerospace durability.
Defense & Aerospace received 10% because the category score of 43.8 came in third behind Industrial Metals and Utilities, though the macro setup is strong. Defensive rotation is live at +8, and the Transition / Mixed regime is adding +4, which should amplify defense demand. However, technical evidence is only 65.7/100—better than many categories, but not sufficient to justify a top-2 claim when timing is stretched (18.2% extension in Energy) or momentum is failing (eight-week return negative in Technology). ITA's compression setup is legitimate, but it requires follow-through buying to matter; the 50.1 risk/reward score acknowledges that upside potential is modest relative to downside if institutional support evaporates. The 10% allocation anchors the defensive rotation narrative without overcommitting to a sector where price has already run. A break above 108.96 resistance on rising volume would upgrade ITA and likely lift the entire category toward 20%.
Technology — CIBR
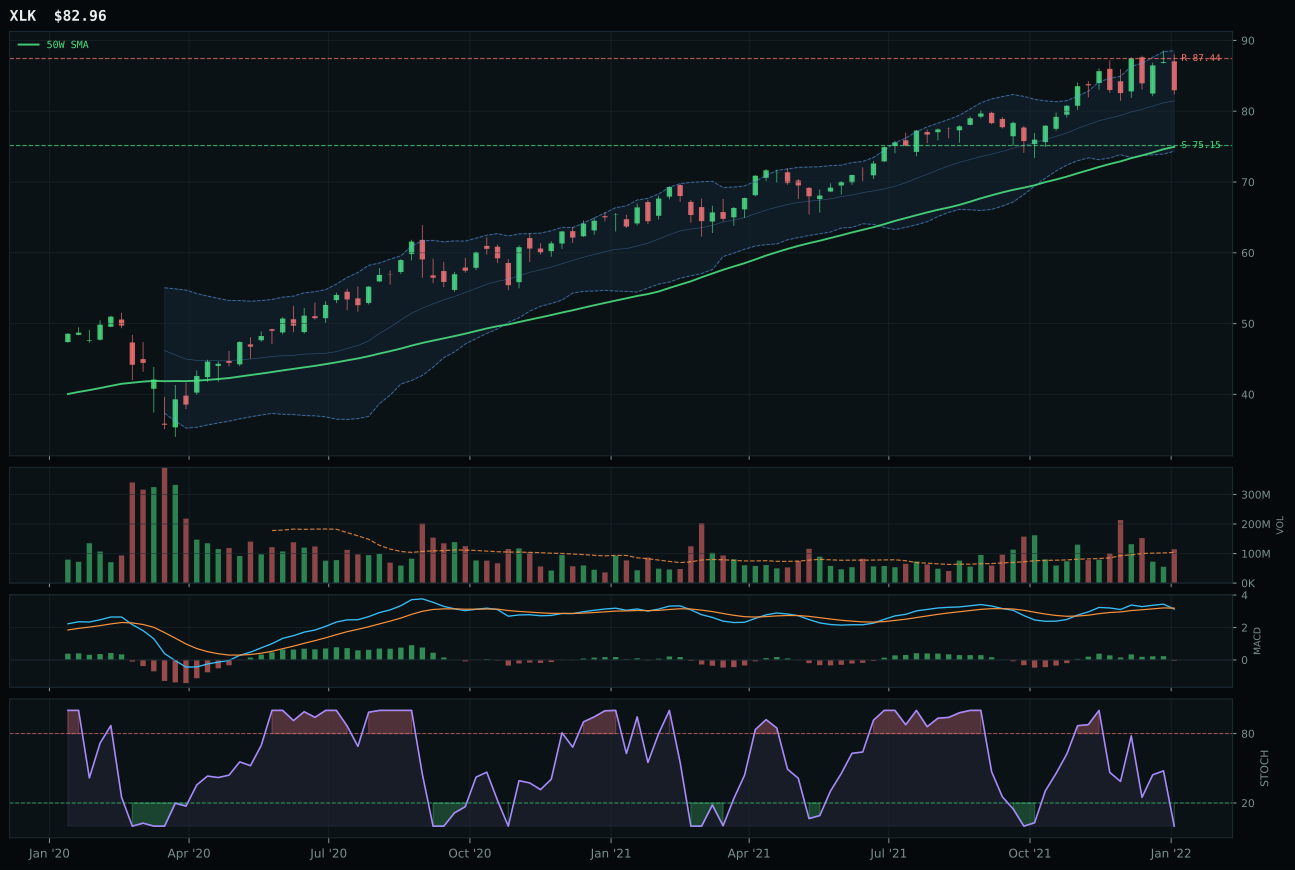
XLK has a neutral structure profile with 2.7% 13-week relative strength versus SPY.
A failed hold above support would weaken the setup.
Actionable but governed by invalidation levels.
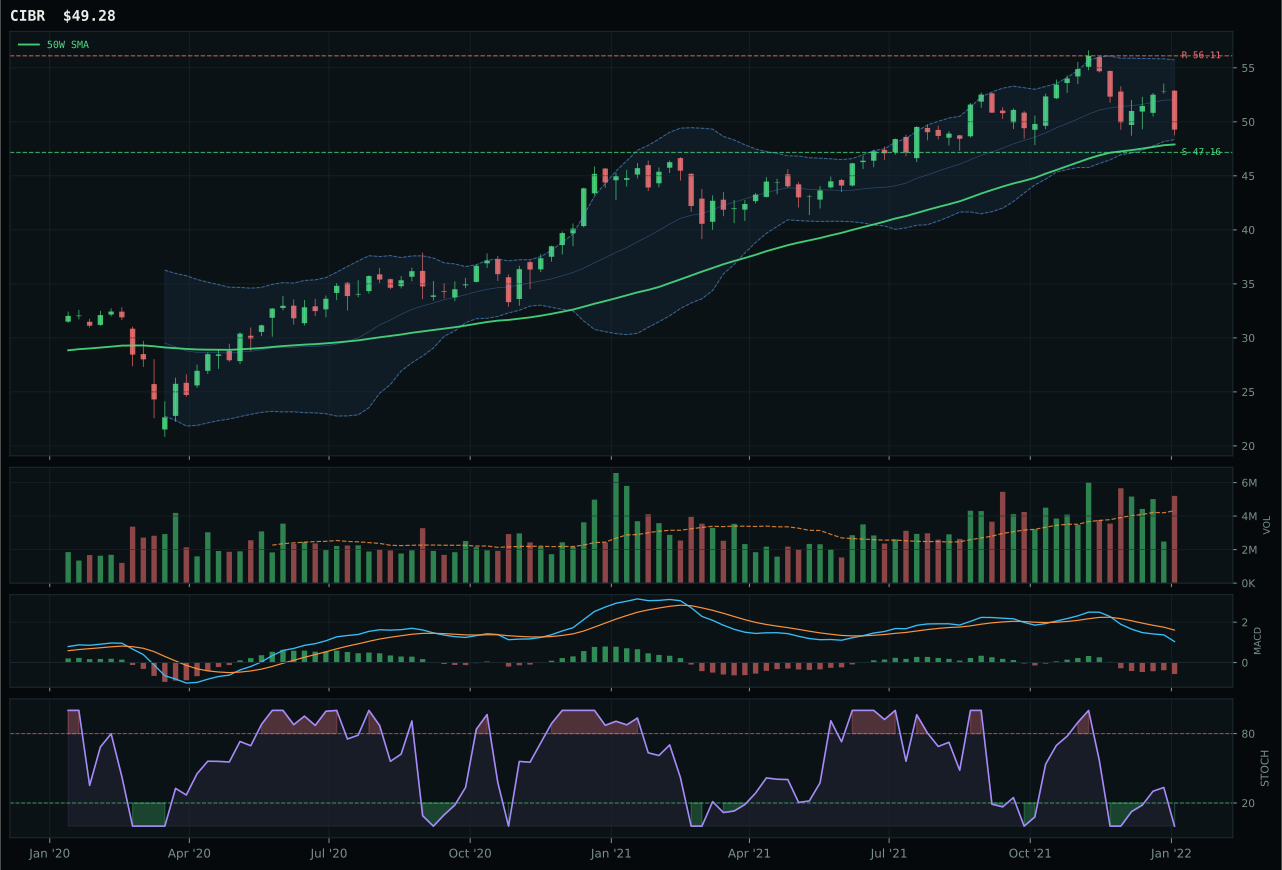
CIBR has a pullback into support profile with -7.5% 13-week relative strength versus SPY.
A failed hold above support would weaken the setup.
Actionable but governed by invalidation levels.
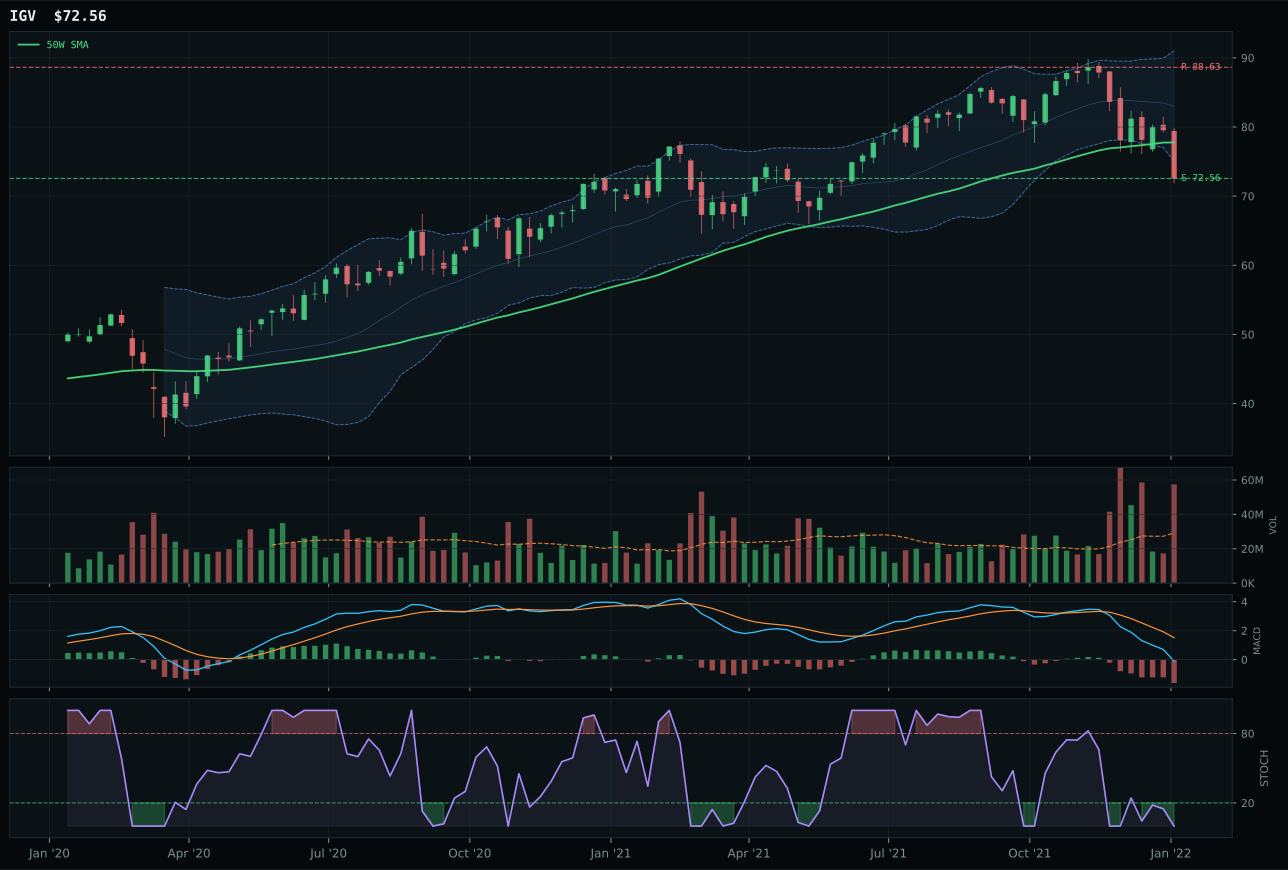
IGV has a pullback into support profile with -16.7% 13-week relative strength versus SPY.
A failed hold above support would weaken the setup.
Actionable but governed by invalidation levels.
CIBR claimed the category by offering the tightest entry point and the cleanest risk definition. At just 2.9% above the 50-week moving average, the fund sits in a pullback-into-support structure with a hard floor at 47.16 and resistance at 56.11—giving the setup an invalidation zone that cuts through market noise. XLK, the runner-up, has drifted 10.7% above its 50W and trades in neutral structure, meaning new buyers are absorbing upside at progressively worse prices while the MACD has rolled over identically to CIBR's. The stochastic RSI is oversold in both, but CIBR's timing score maxes at 100 because proximity to the 50W combined with a defined support level creates an asymmetric reward-to-risk equation. XLK's risk/reward scored only 53.9 versus CIBR's 98.0 because the extended position leaves nowhere to accumulate on further strength. Category-relative strength sits flat for CIBR, meaning buyers inside the technology basket are rotating into cybersecurity specifically rather than chasing broad tech leadership.
Technology earned 10% because it ranks outside the top two categories by score (43.7 vs. 68.5 and 51.6 for Industrial Metals and Utilities), yet it qualifies for the portfolio because the setup quality and macro alignment remain defensible. The Transition / Mixed regime is pulling capital into defensive rotations—credit stress is live at -7 and risk appetite is only slightly positive at +9, which penalizes the broader equity leadership that SMH and broad profitable tech would otherwise attract. CIBR's cybersecurity mandate offers a narrower, steadier duration hedge than XLK's profitable-growth exposure, and in a mixed macro backdrop where sentiment can whip, the tighter technicals and lower extension risk justify a modest 10% holding. The category would need either a sharper risk-off pivot that pushes every financial institution toward security spending, or a technical breakdown in XLK that opens the door to a complete category rotation before Technology moves to 20%.
AI — SMH
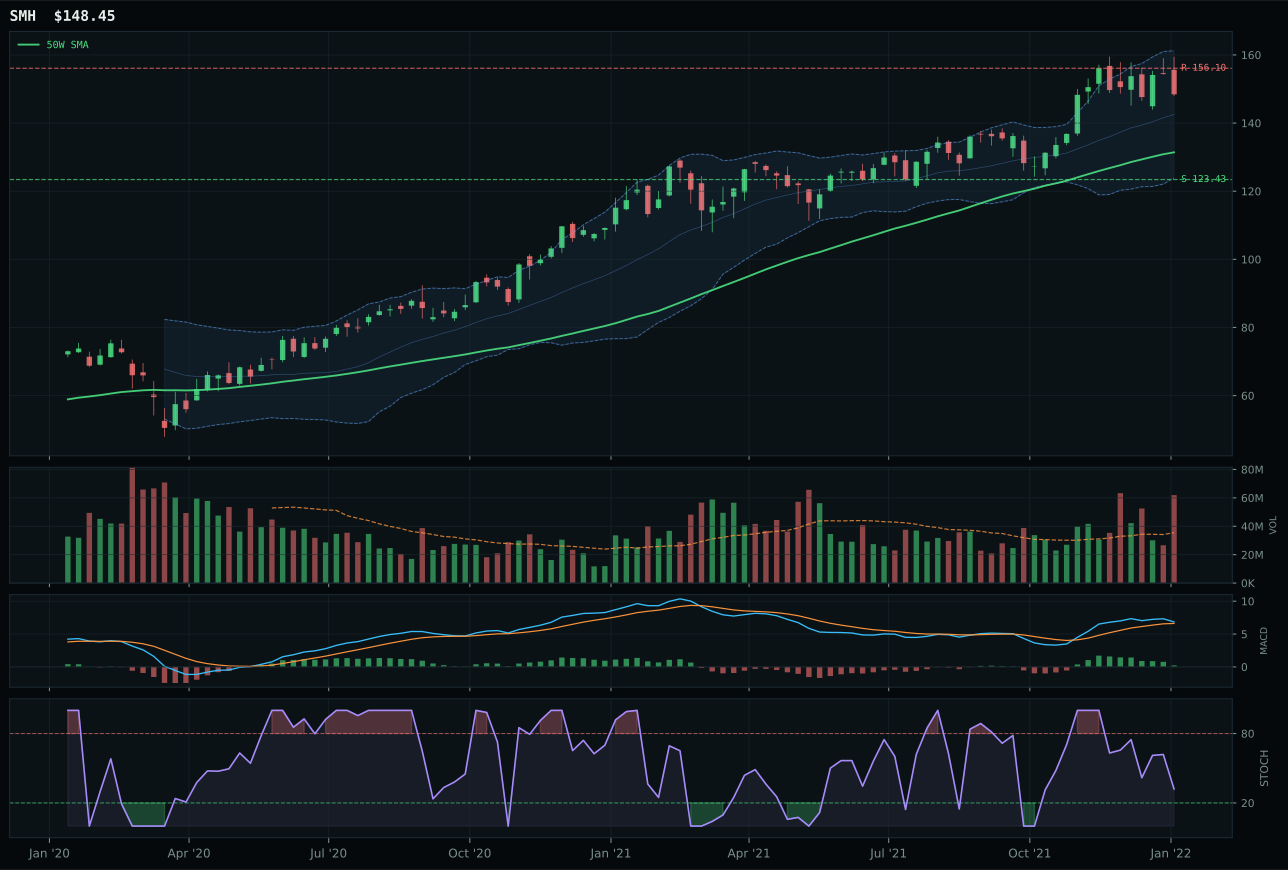
SMH has a neutral structure profile with 10.1% 13-week relative strength versus SPY.
A failed hold above support would weaken the setup.
Actionable but governed by invalidation levels.
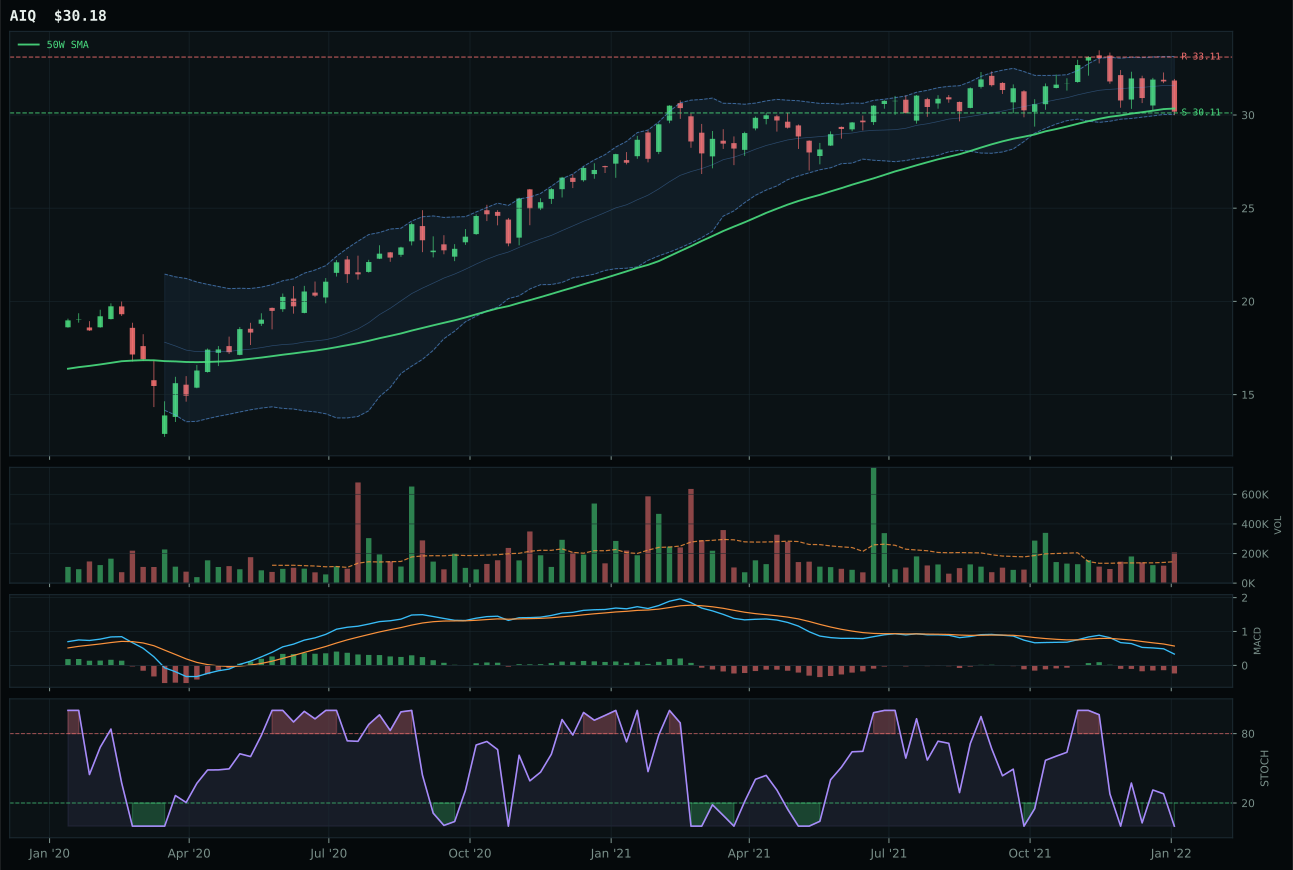
AIQ has a pullback into support profile with -7.8% 13-week relative strength versus SPY.
A failed hold above support would weaken the setup.
Tracked, but not top-2 eligible because: .
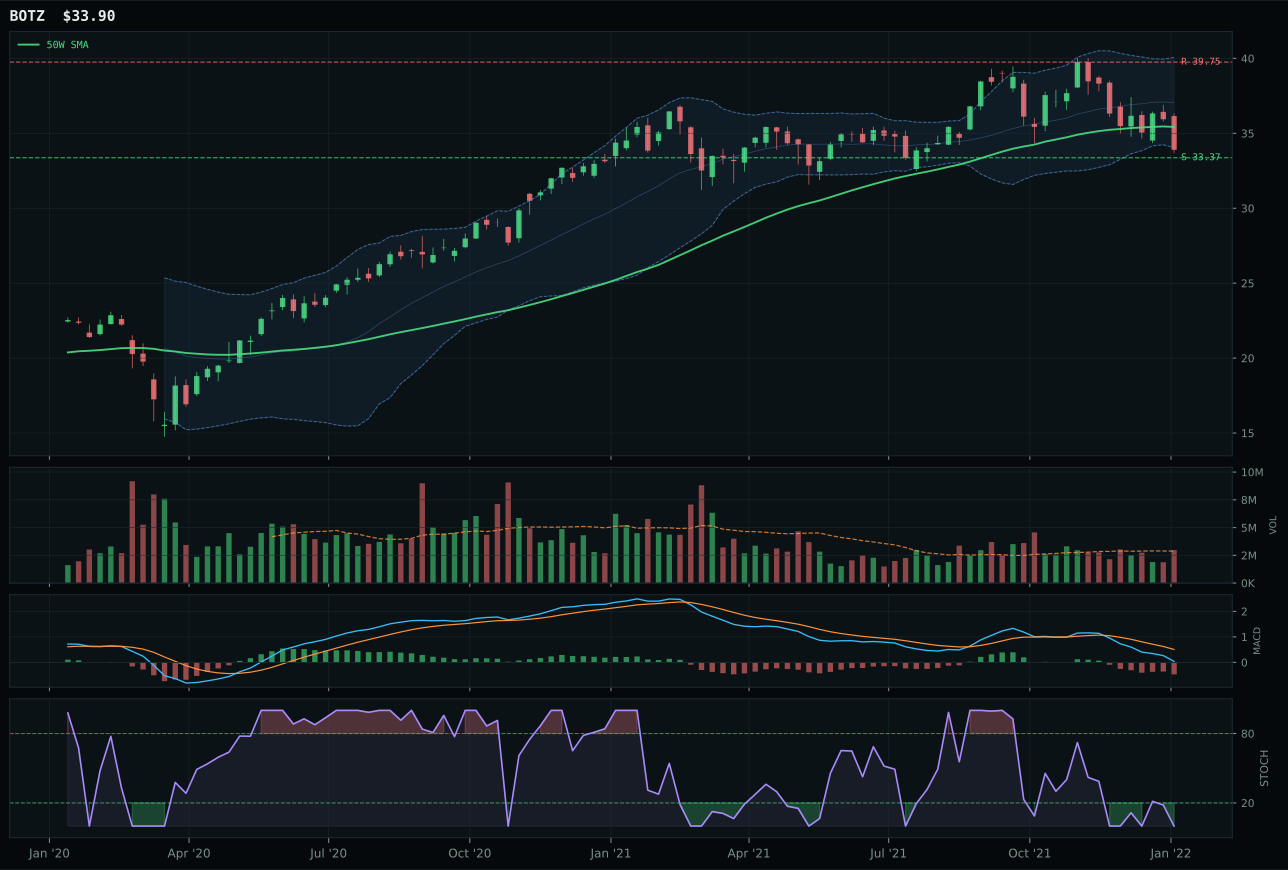
BOTZ has a pullback into support profile with -10.8% 13-week relative strength versus SPY.
A failed hold above support would weaken the setup.
Actionable but governed by invalidation levels.
SMH won decisively on momentum confirmation and breadth sponsorship, not timing. The semiconductor ETF is showing 16.5% thirteen-week returns and a 17.8% advantage versus its category median—those are the signatures of accumulated institutional demand. At 13.0% above the 50W with distribution pressure (1.74x volume), SMH is extended, but the MACD is bullish and flattening rather than rolling, meaning the engine is still running. AIQ trades down 1.3% over thirteen weeks with SPY-relative weakness at -7.8% and sits in a pullback-into-support at the Fib 0.382 zone—textbook short-cover technicals. The 48.7-point score gap between the two ETFs reflects a fundamental difference: SMH has relative strength inside the basket driving it higher despite being stretched, while AIQ has a clean entry but no real sponsorship beneath it. Volume is the differentiator: SMH's distribution pressure is occurring on rising momentum, which means sellers are not controlling the rally; AIQ's above-average participation sits over a -1.3% thirteen-week return, signaling rotation out rather than accumulation.
AI earned 0% allocation this week because its 41.7 final score fell to 9th rank, outside the portfolio's capacity to fund. The category carries strong macro sponsorship (66.0/100 macro fit) from AI growth narratives and risk appetite signals, but that tailwind runs headlong into its representative's structural weakness: SMH's risk-reward is crippling at 41.4/100, timing score is only 70/100 (penalized for extension), and the entire basis of the allocation would rest on momentum confirmation in an extended setup. Within a transition regime where credit stress is active, chasing a 16.5% 13-week performer 13% above its 50W is precisely the behavior that costs portfolios money in drawdowns. The portfolio instead prioritizes categories with tighter entry geometry and dual technical-plus-macro support. AI re-enters when either SMH contracts into its support near 123.43 with volume confirmation, or when credit stress signals fade and allow for genuine new-highs breakouts with lower execution risk.
Emerging Markets — INDA
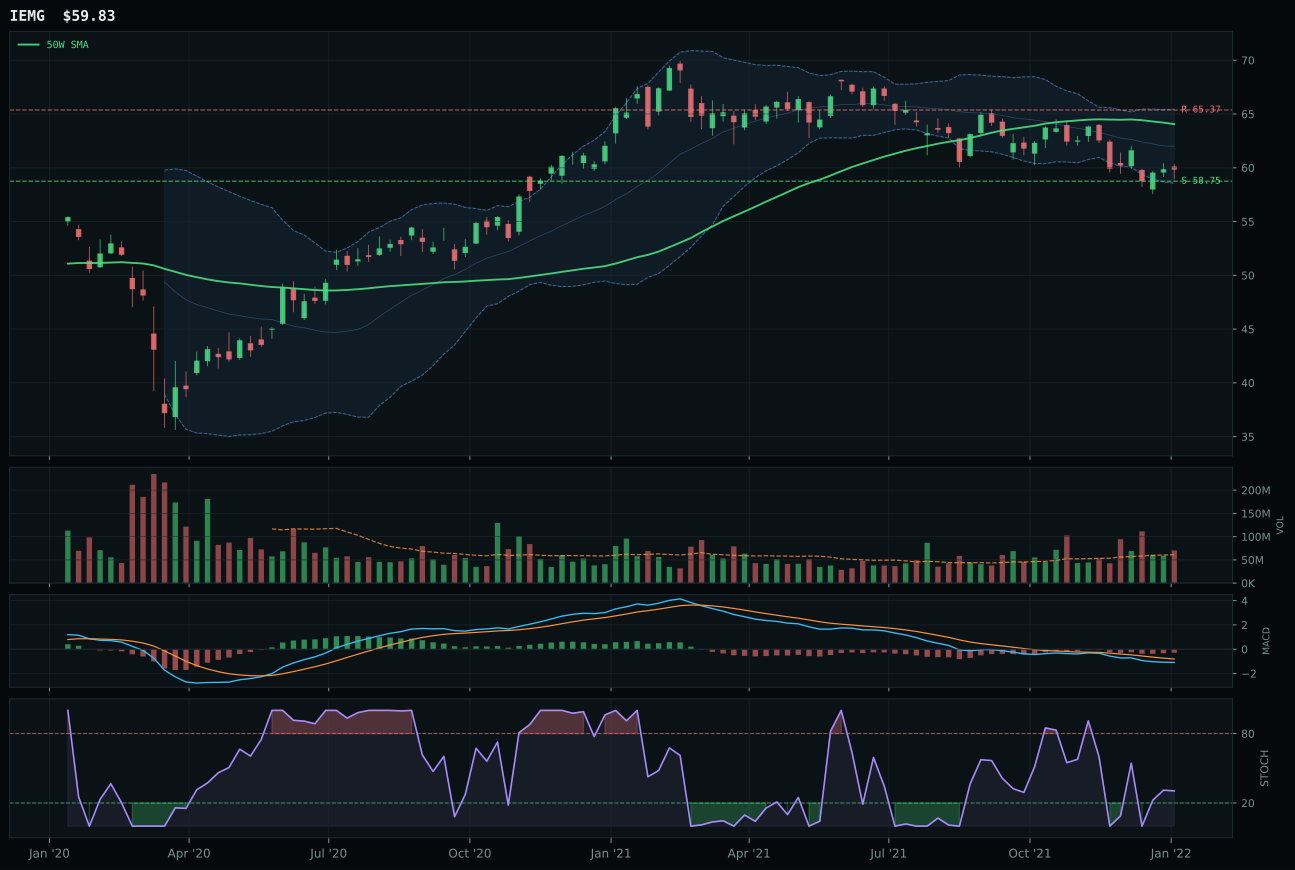
IEMG has a pullback into support profile with -10.4% 13-week relative strength versus SPY.
A failed hold above support would weaken the setup.
Actionable but governed by invalidation levels.
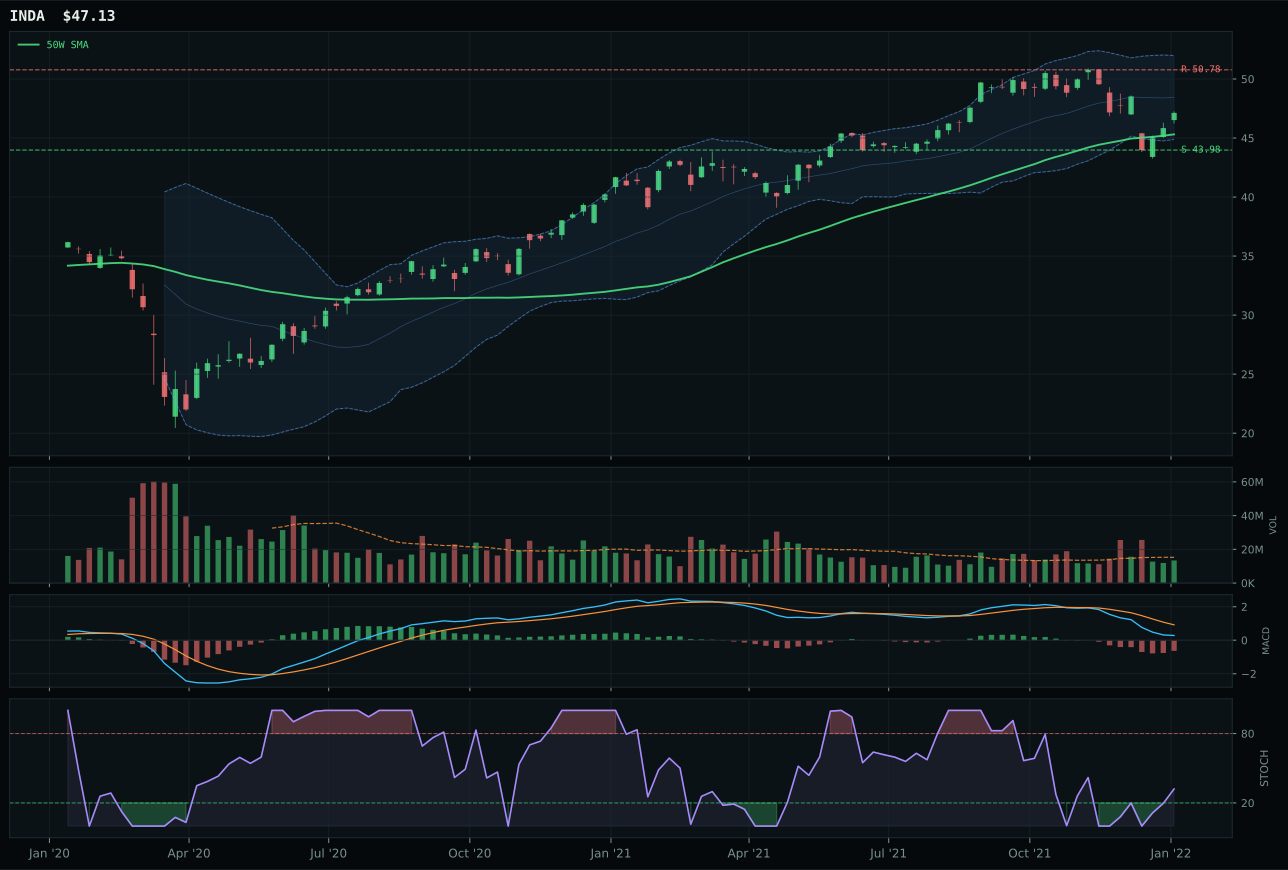
INDA has a neutral structure profile with -10.8% 13-week relative strength versus SPY.
A failed hold above support would weaken the setup.
Actionable but governed by invalidation levels.
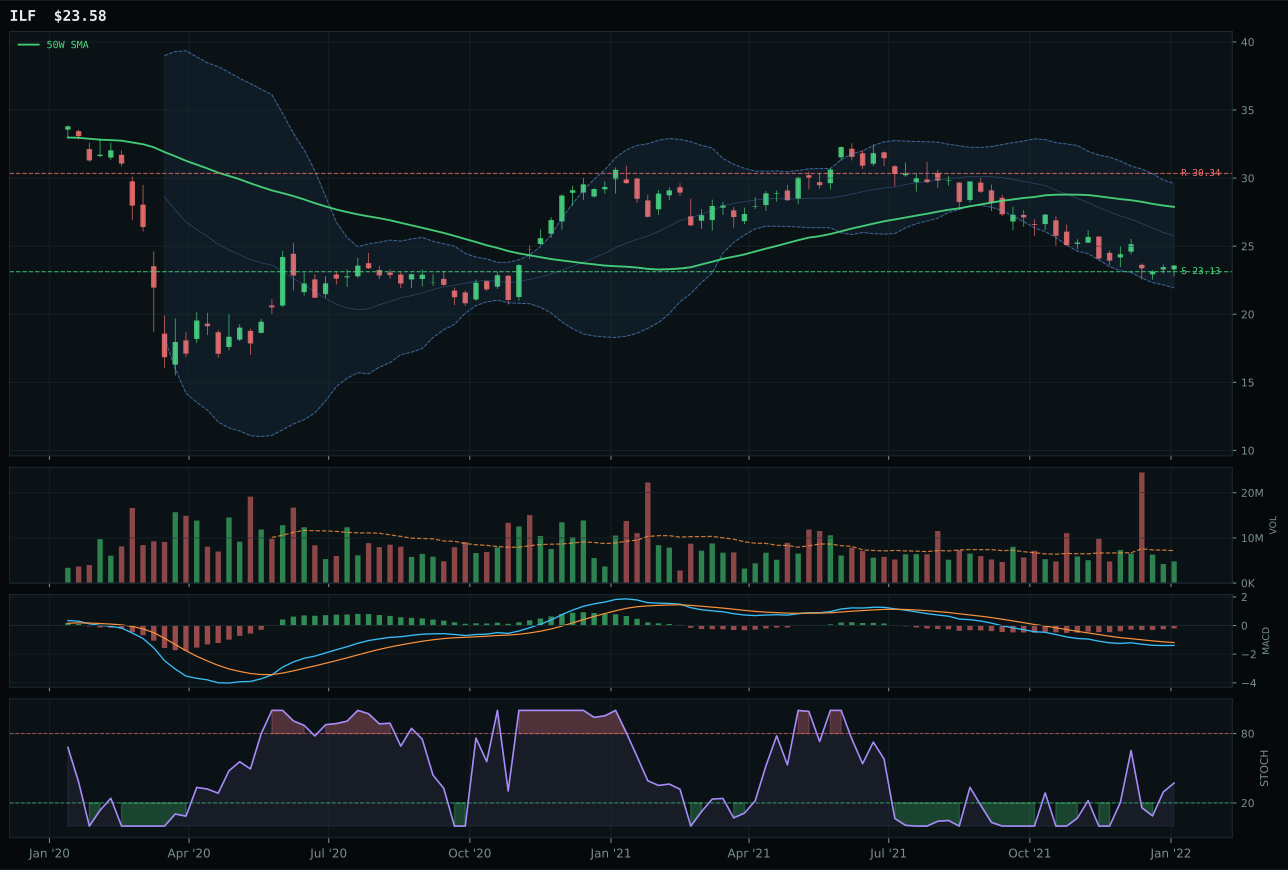
ILF has a pullback into support profile with -17.7% 13-week relative strength versus SPY.
Extension and support failure are the main tactical risks.
Tracked, but not top-2 eligible because: structurally broken.
INDA claimed the category not because it is strong, but because IEMG is weaker and ILF is comatose. INDA trades above both moving averages with neutral structure and sits at the Fib 0.382 zone; the timing score of 93/100 derives from proximity to the 50W (4.0%), a rising-mid-zone stochastic RSI, and improving MACD conditions. IEMG's timing is only 88 because it sits deeper in retracement territory (near the 52W low / repair zone), which is usually a positive for reversal, but here it signals that broad emerging-market weakness is more severe than India-specific strength. Category-relative strength is zero for INDA and +0.3% for IEMG, meaning there is no clear sponsor leadership, only relative degrees of damage. The real problem is momentum confirmation: both ETFs show negative thirteen-week returns (-4.3% for INDA, -4.0% for IEMG), with volume at or below neutral. This is not an opportunity; it is a damage assessment.
Emerging Markets earns 0% allocation because its 36.1 final score ranks 10th among all categories, making it the lowest-conviction position in the portfolio. The 62.0/100 macro fit cannot overcome the devastation of the technical setup: INDA's momentum confirmation sits at 8.6/100, persistence is only 38.1/100, and volume-price confirmation registers just 33.5/100. The category is being sold across the board—13-week returns are negative for both INDA and IEMG, relative strength versus SPY is deeply negative at -10.8% for the winner, and MACD is bearish/weakening with no internal strength. Although EM liquidity support signals are active (+14), credit stress (-10) and broad risk-off sentiment dominate current price action. The category exits entirely because no member offers either technical support or macro catalysts sufficient to justify capital allocation in a transition regime. Re-entry would require a decisive break of INDA above 50.78 resistance on volume, coupled with credit stress signal improvement, signaling a pivot toward risk-on positioning.