
2021-12-31
Informational purposes only. The content in this report, including allocations, analysis, and commentary, is provided solely for informational and educational purposes. It does not constitute financial advice, investment advice, trading advice, or any other type of advice. Past performance does not guarantee future results. Always conduct your own research and consult a qualified financial professional before making investment decisions.
Weekly Allocation
| Ticker | Category | Weight | Role |
|---|---|---|---|
| FBTC | 50% | Overlay | |
| XLU | Utilities & Infrastructure | 10% | Top-2 (10%) |
| COPX | Industrial Metals | 10% | Top-2 (10%) |
| XLK | Technology | 5% | Tier-2 (5%) |
| GLD | Precious Metals | 5% | Tier-2 (5%) |
| SMH | AI | 5% | Tier-2 (5%) |
| INDA | Emerging Markets | 5% | Tier-2 (5%) |
| ITA | Defense & Aerospace | 5% | Tier-2 (5%) |
| MOO | Agriculture & Livestock | 5% | Tier-2 (5%) |
Trade Instructions — Monday Open
Sell the tranche from 2021-12-03 (completing its 4-week hold). Buy the new tranche. Instructions show net portfolio changes — same-asset positions cancel, weight changes show the delta.
| Action | Ticker | Instruction |
|---|---|---|
| SELL | FSOL | Sell 50% of FSOL position (reduce 25.00% → 12.50%) |
| SELL | XLE | Sell 25% of XLE position (reduce 10.00% → 7.50%) |
| SELL | PICK | Sell 67% of PICK position (reduce 3.75% → 1.25%) |
| SELL | URA | Sell 33% of URA position (reduce 3.75% → 2.50%) |
| BUY | XLU | Buy XLU — 6.67% of freed cash (adds 1.25% to portfolio) |
| BUY | ITA | Buy ITA — 6.67% of freed cash (adds 1.25% to portfolio) |
| BUY | FBTC | Buy FBTC — 66.67% of freed cash (adds 12.50% to portfolio) |
| BUY | COPX | Buy COPX — 13.33% of freed cash (adds 2.50% to portfolio) |
| BUY | INDA | Buy INDA — 6.67% of freed cash (adds 1.25% to portfolio) |
Current Portfolio After Trade
Combined holdings across all 4 active tranches. Each tranche is 25% of the portfolio.
| Ticker | % of Portfolio | Weight Bar |
|---|---|---|
| FBTC | 37.50% | |
| FSOL | 12.50% | |
| XLE | 7.50% | |
| XLU | 7.50% | |
| MOO | 6.25% | |
| COPX | 6.25% | |
| SMH | 5.00% | |
| GLD | 5.00% | |
| ITA | 3.75% | |
| URA | 2.50% | |
| XLK | 2.50% | |
| PICK | 1.25% | |
| XAR | 1.25% | |
| INDA | 1.25% |
Macro Regime — Goldilocks
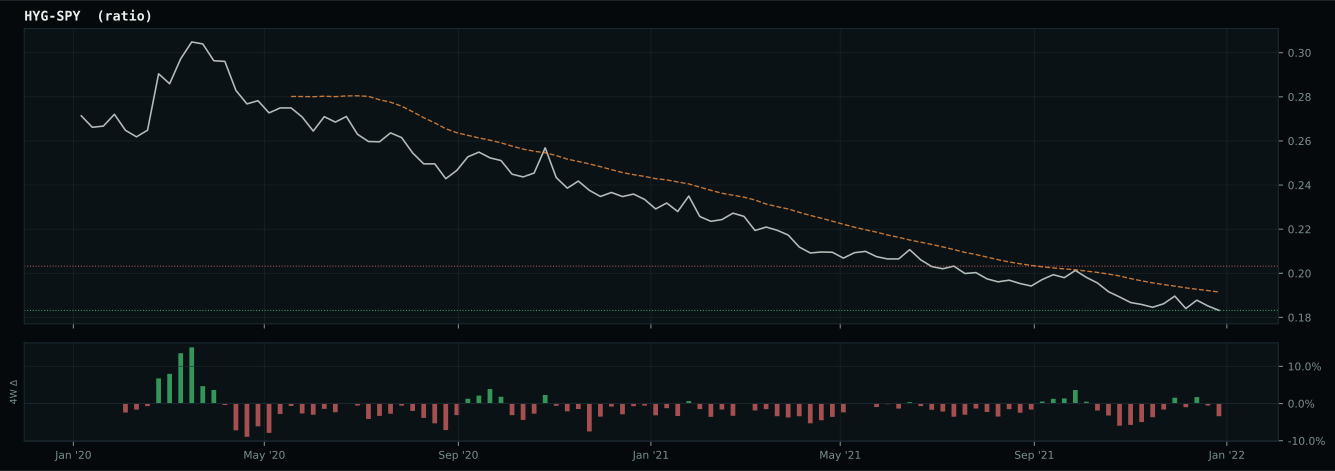
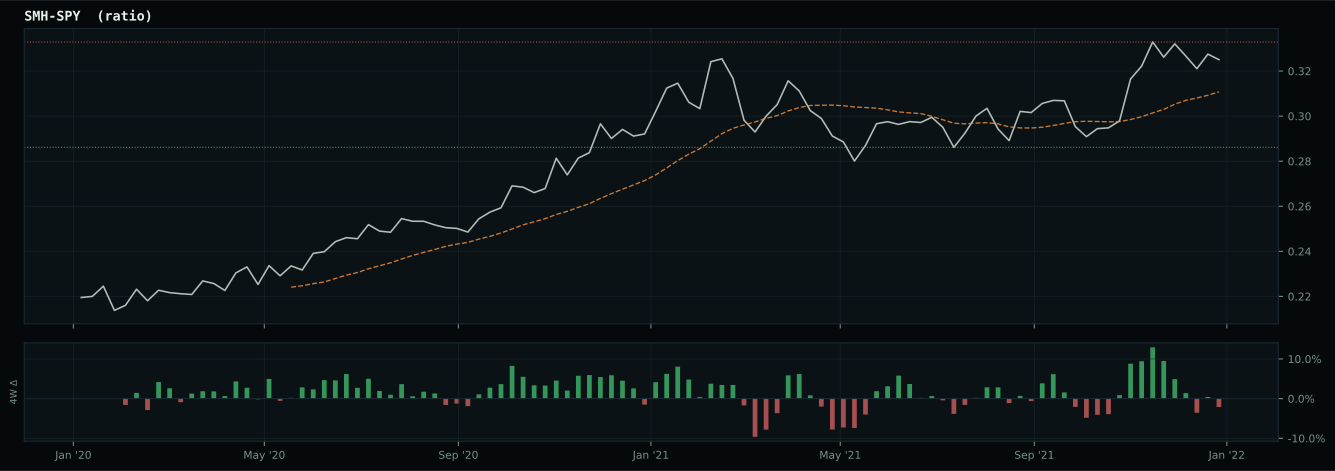
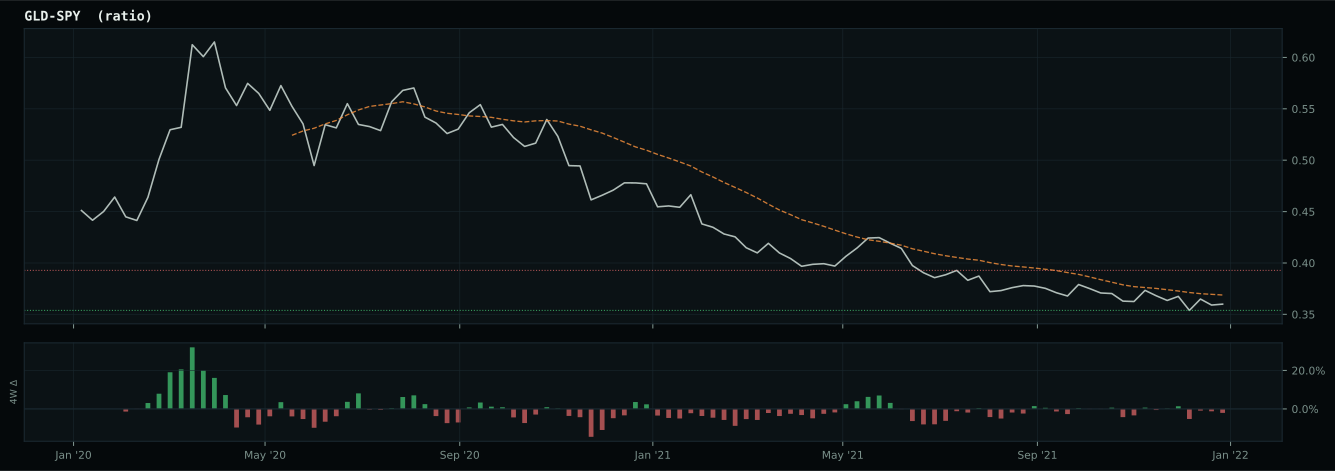
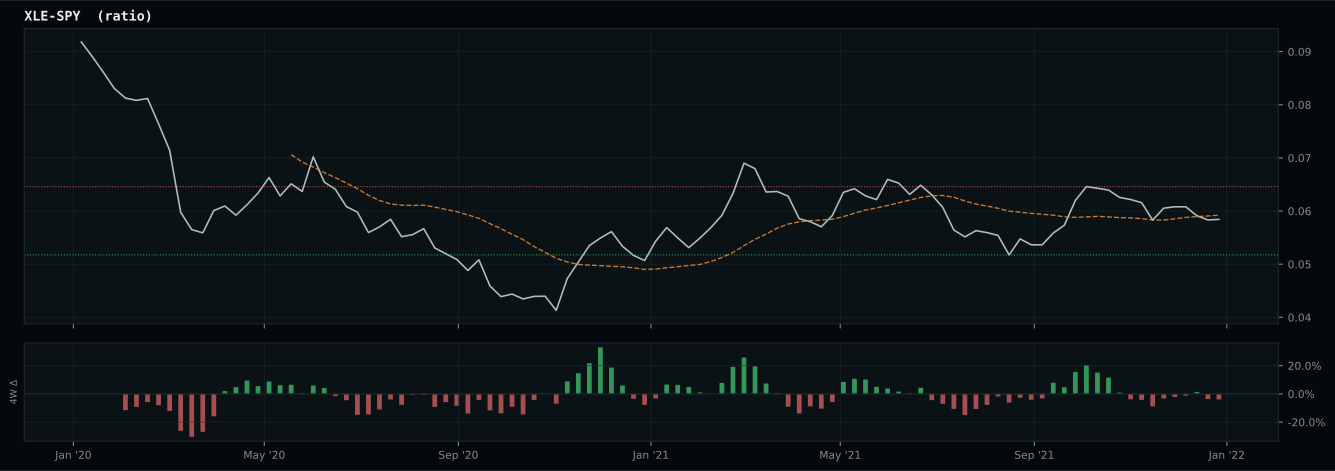
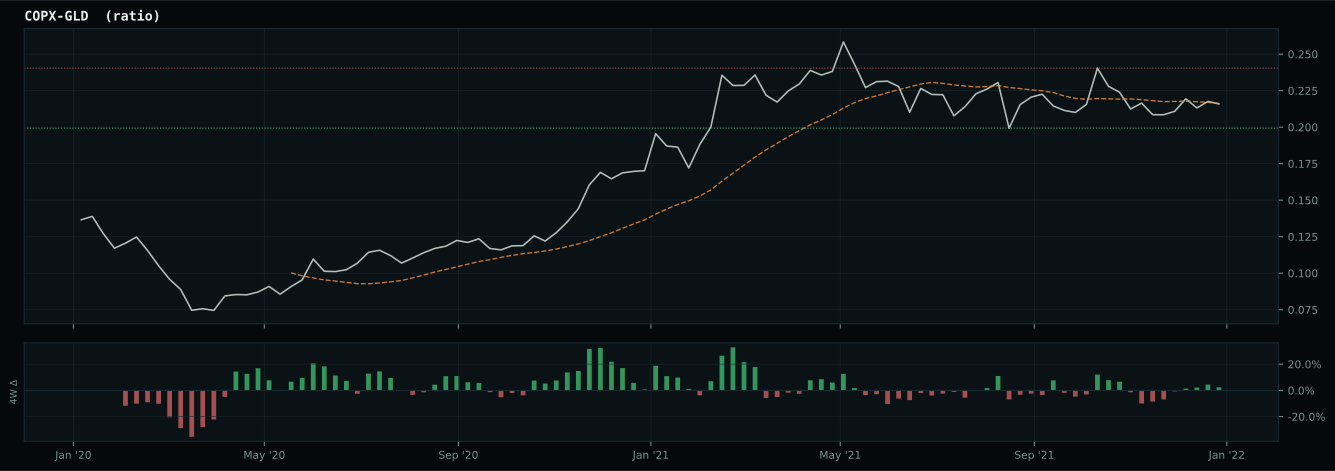
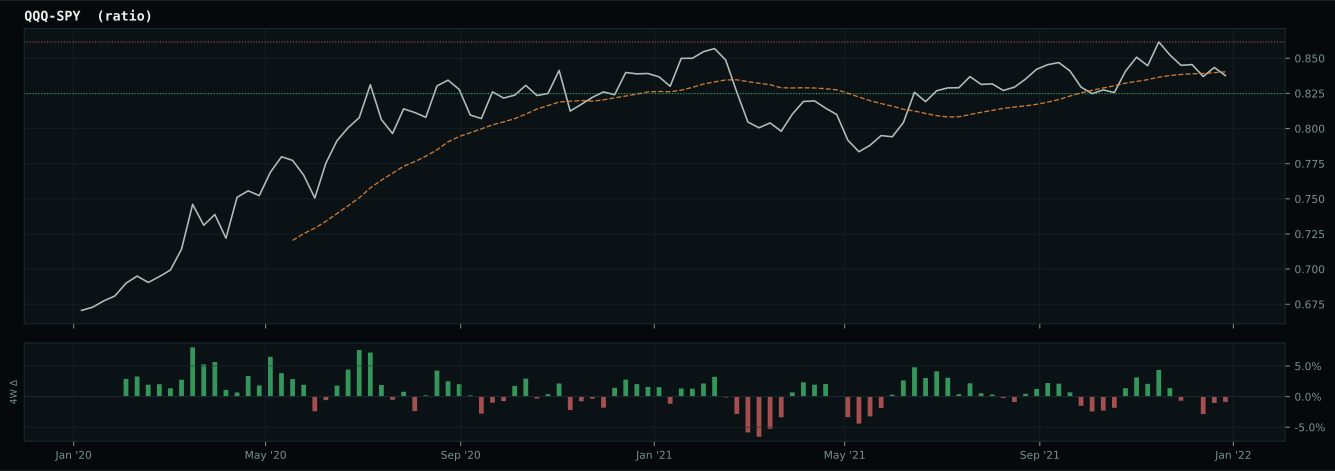
Macro Evidence Charts
Market-implied signals behind the macro regime scores. Each ratio compares two assets; the direction and slope of the ratio is what the macro engine reads.
Crypto Regime — TrendBTC
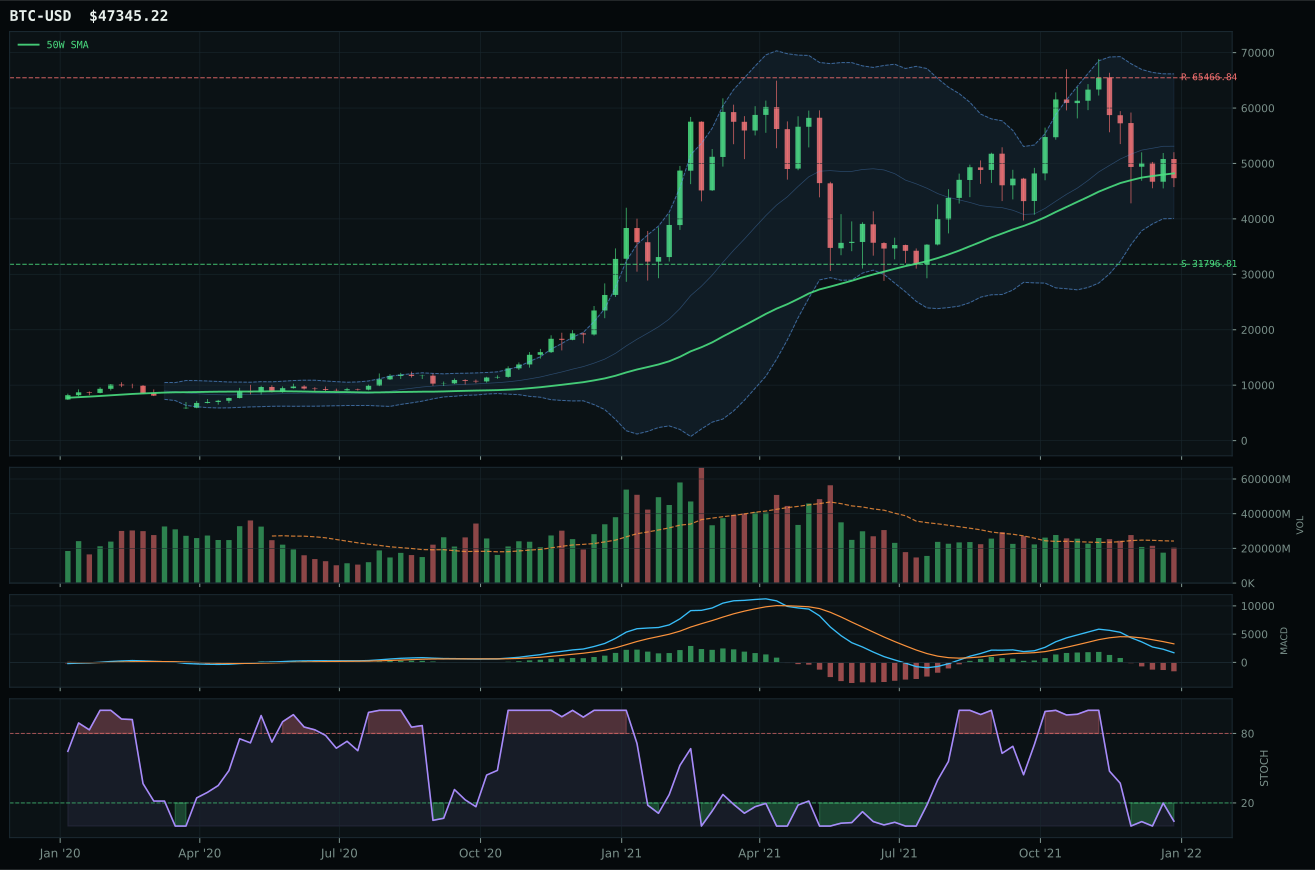
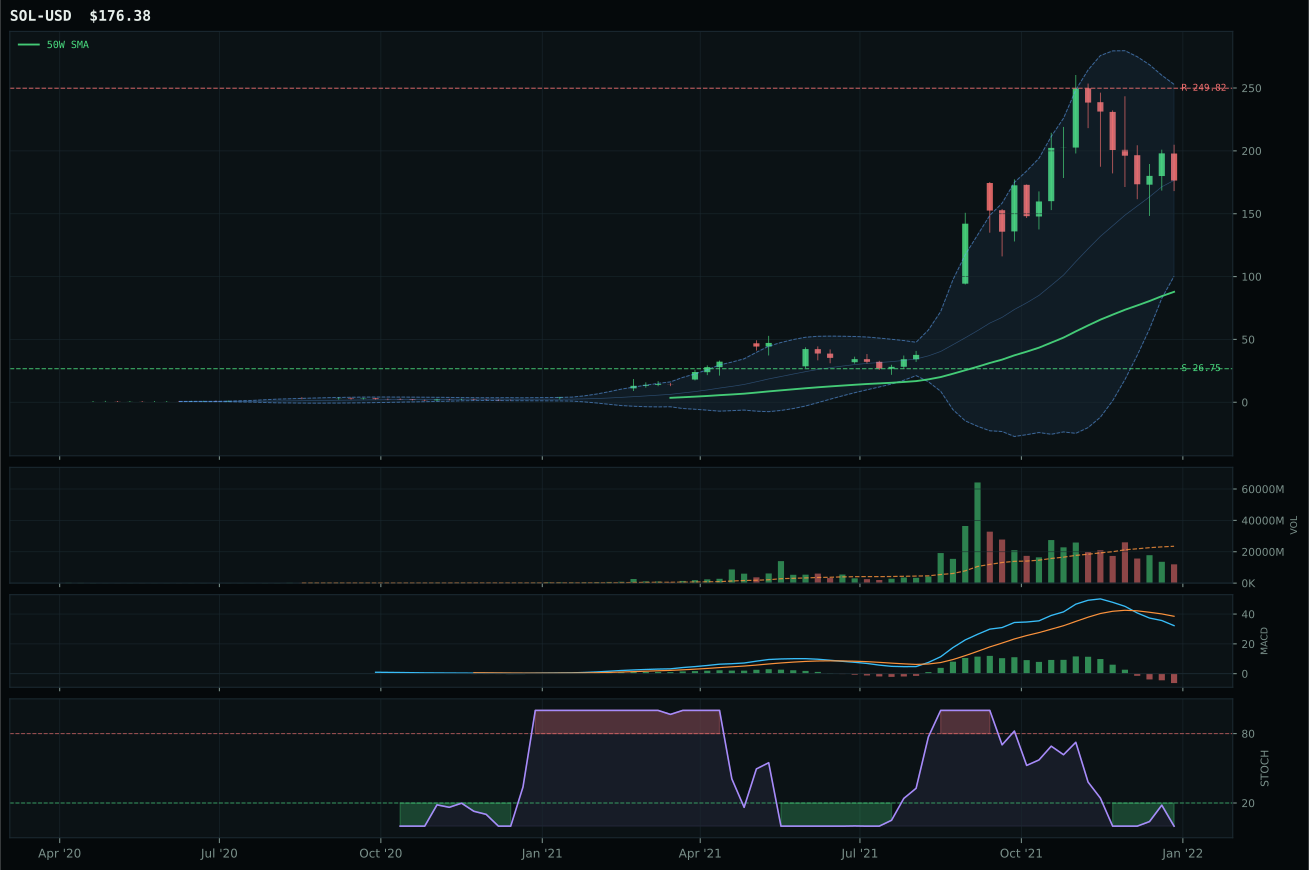
ValueBTC not armed: BTC has not made the first post-breakdown touch of the 200W buy zone after losing the 50W
TrendBTC not confirmed
one or more available conditions failed
Category Rankings
| Rank | Category | Winner | Score | Alloc | 4W Ret | Peers (4W) |
|---|---|---|---|---|---|---|
| 1 | Utilities & Infrastructure | XLU | 67.7 | 20% | -5.58% | IGF -2.7% · PAVE -10.5% |
| 2 | Industrial Metals | COPX | 57.3 | 20% | +0.03% | PICK -0.7% · REMX -13.3% |
| 3 | Technology | XLK | 53.2 | 10% | -9.22% | CIBR -13.6% · IGV -13.5% |
| 4 | Precious Metals | GLD | 51.1 | 10% | -0.63% | GDX -5.9% · SLV -1.4% |
| 5 | AI | SMH | 48.1 | 10% | -15.37% | BOTZ -20.8% · AIQ -12.8% |
| 6 | Emerging Markets | INDA | 38.5 | 10% | -2.56% | IEMG -2.7% · ILF +8.2% |
| 7 | Defense & Aerospace | ITA | 35.6 | 10% | -3.70% | XAR -8.1% · ROKT -7.6% |
| 8 | Agriculture & Livestock | MOO | 33.7 | 10% | -3.50% | VEGI -0.5% · WEAT +1.9% |
| 9 | Nuclear Energy | URA | 33.3 | 0% | -15.32% | NLR -5.0% · URNM -17.7% |
| 10 | Traditional Energy | XOP | 16.4 | 0% | +9.96% | XLE +17.8% · FCG +13.1% |
Utilities & Infrastructure — XLU
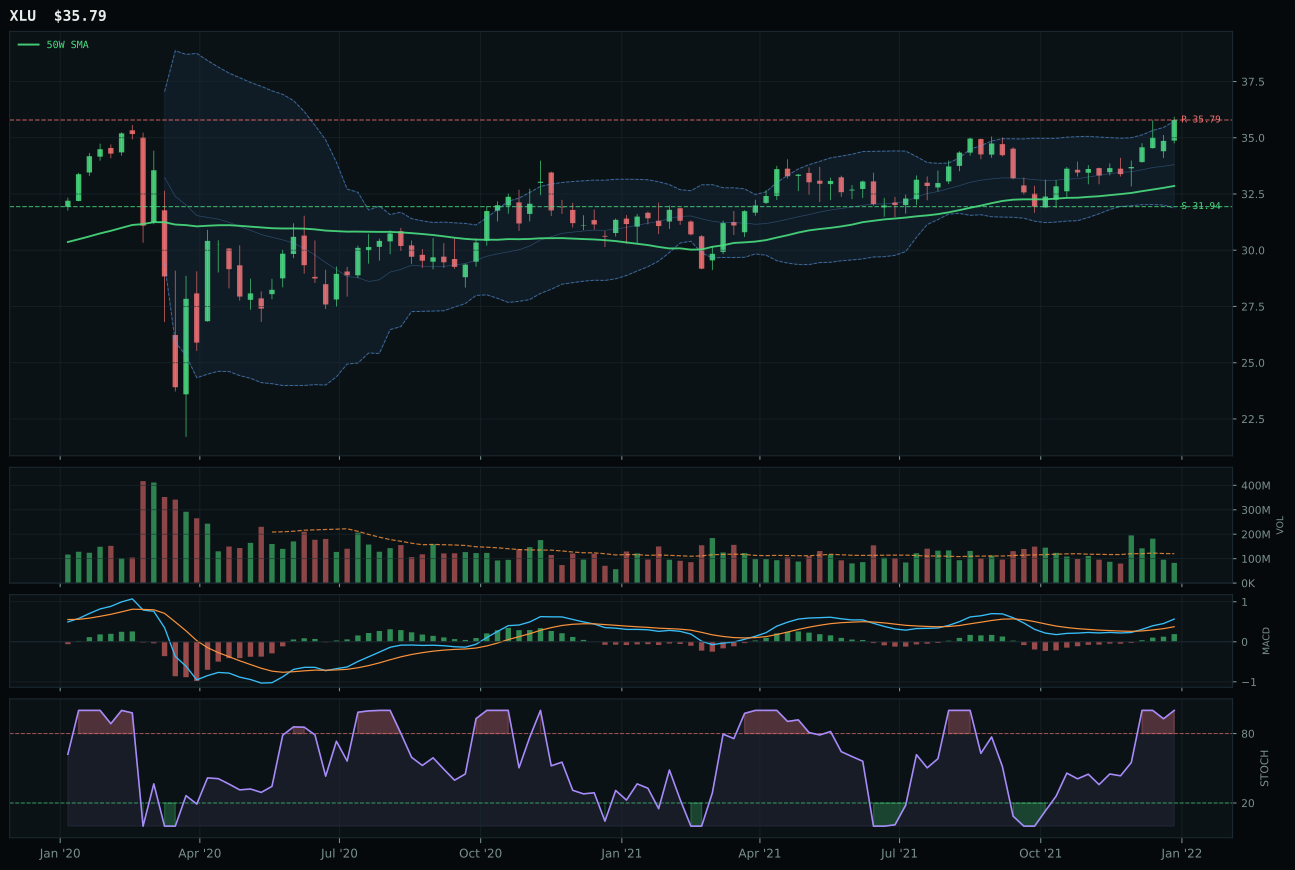
XLU has a neutral structure profile with 2.7% 13-week relative strength versus SPY.
A failed hold above support would weaken the setup.
Actionable but governed by invalidation levels.
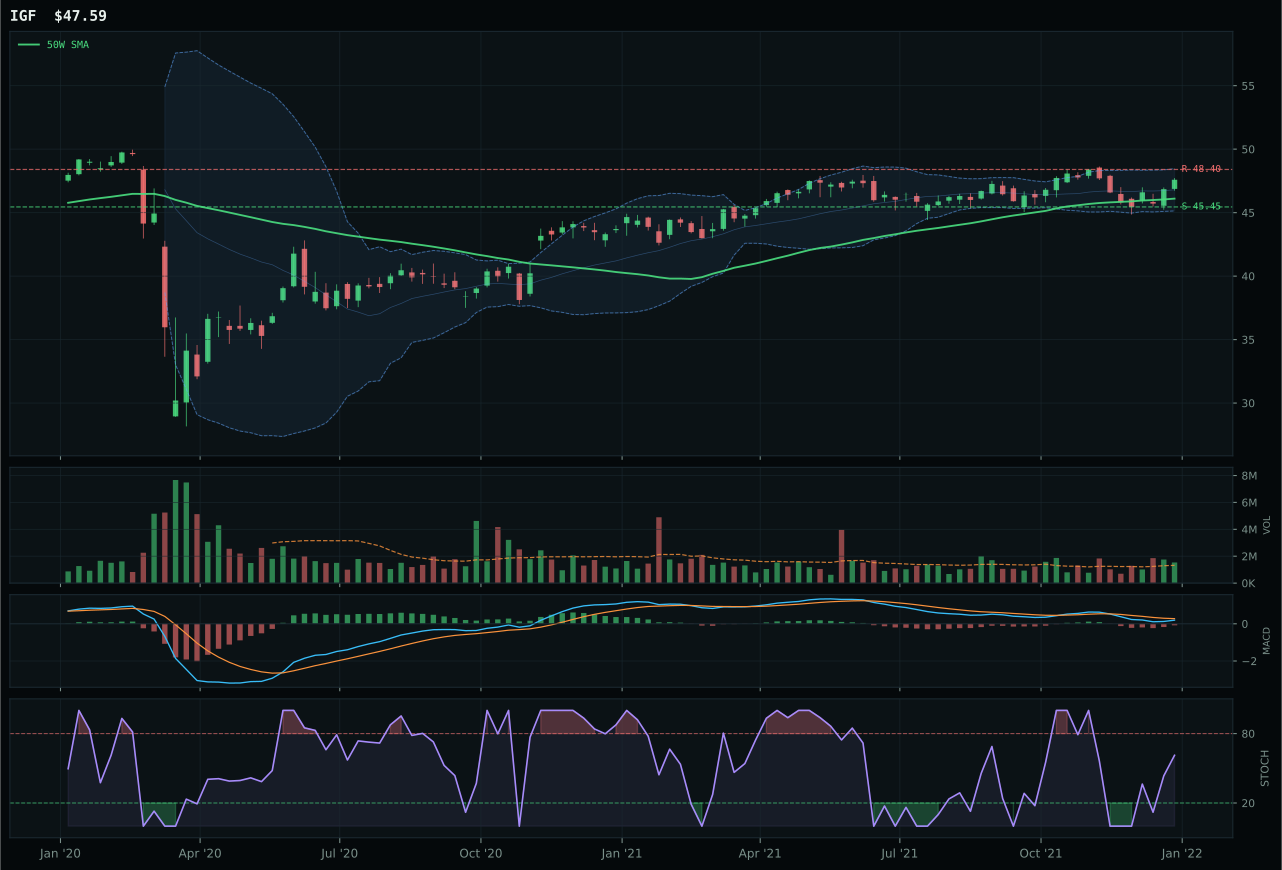
IGF has a pullback into support profile with -6.4% 13-week relative strength versus SPY.
A failed hold above support would weaken the setup.
Actionable but governed by invalidation levels.
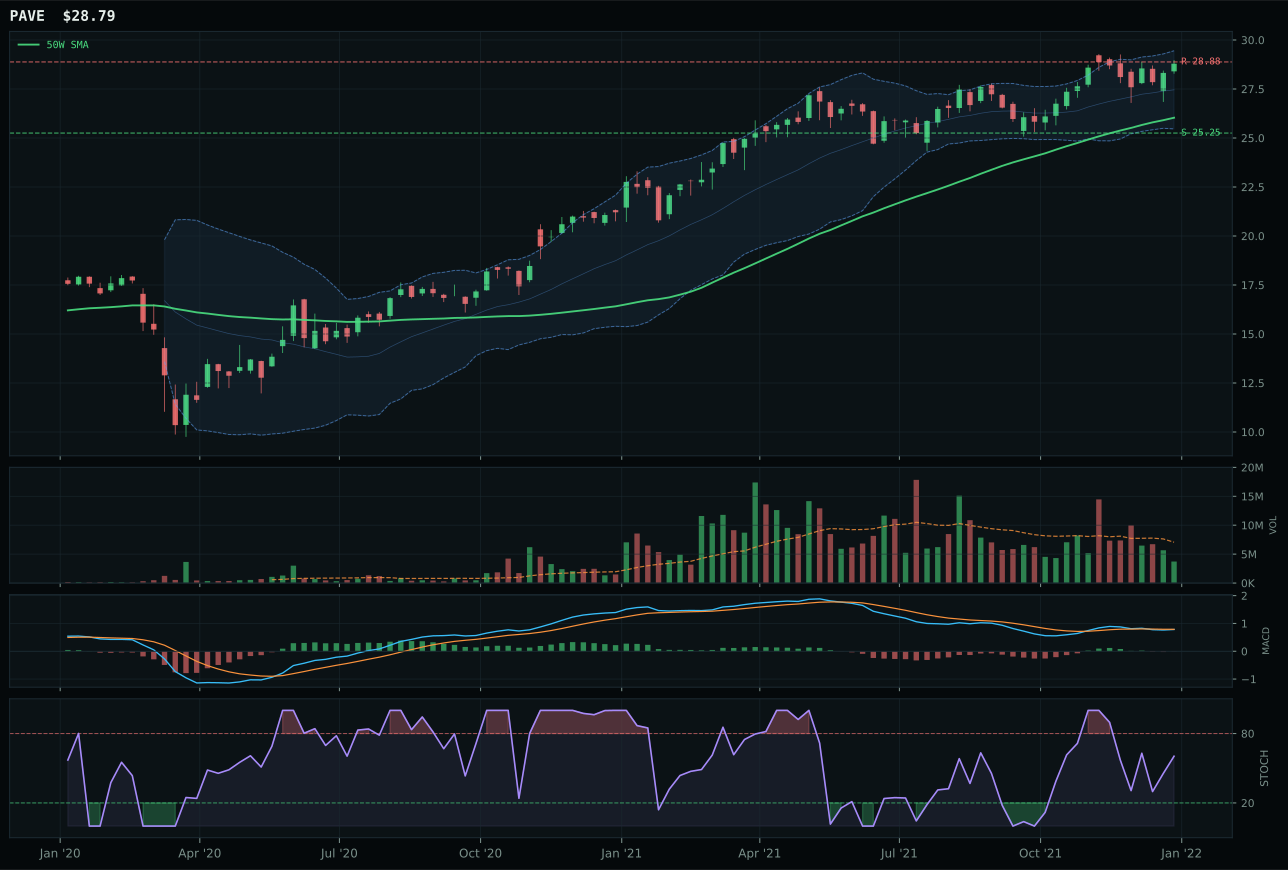
PAVE has a neutral structure profile with 2.1% 13-week relative strength versus SPY.
A failed hold above support would weaken the setup.
Actionable but governed by invalidation levels.
XLU claimed Utilities & Infrastructure as the portfolio's second-best-ranked category with a 3.4-point victory over IGF, meriting top-2 allocation and a 10% overweight commitment. The win is clean: XLU's 100/100 trend score from price above both the 50-week and 200-week moving averages, non-deteriorating slope (0.3%), and +2.7% SPY-relative strength confirm this is genuine defensive leadership, not a relative-weakness bounce. The 12.1% thirteen-week return and 84.5/100 momentum confirmation are the strongest in the category basket, evidence that capital is rotating into utilities in anticipation of sustained low-rate regimes under Goldilocks conditions. Stochastic RSI sits at 1.00 (overbought), a potential concern, but rising stochastic RSI near overbought often confirms sustained accumulation in defensive sectors rather than exhaustion. IGF's bearish but improving MACD and pullback into support offer a valid secondary setup, yet the -6.4% category-relative weakness (versus XLU's +0.6%) reveals that utilities are outpacing infrastructure on this rotation. Thin participation (0.69x average) across both names does not diminish the conviction; defensive rotations often sustain on thin volumes as flows are methodical rather than frenzied.
Utilities & Infrastructure earns 10% allocation as a top-2 overweight category with a 67.7 final score that ranks second only to Industrial Metals (57.3) in the portfolio. The 70.0/100 macro fit and active defensive rotation descriptor (+12) are portfolio-leading tailwinds; disinflation pressure (+6) further supports income-oriented names, and Goldilocks regime (+4) permits upside optionality if rates remain steady. XLU's 71.8 technical evidence composite and bullish, improving MACD create a convergence of technical and macro conviction that justifies tier-1 commitment. The category's only vulnerability is execution risk: XLU sits 8.9% above the 50-week moving average, approaching the extension threshold where new buyers arrive late; stochastic RSI at overbought (1.00) could signal momentum exhaustion if confirmed by volume or breadth divergence. Top-2 status assumes the defensive rotation persists and XLU can defend its resistance at 35.79 without rolling over. Should XLU break support or MACD deteriorate to bullish-flattening, the category could downgrade to tier-2, but the macro case for defensive income remains intact under current Goldilocks conditions.
Industrial Metals — COPX
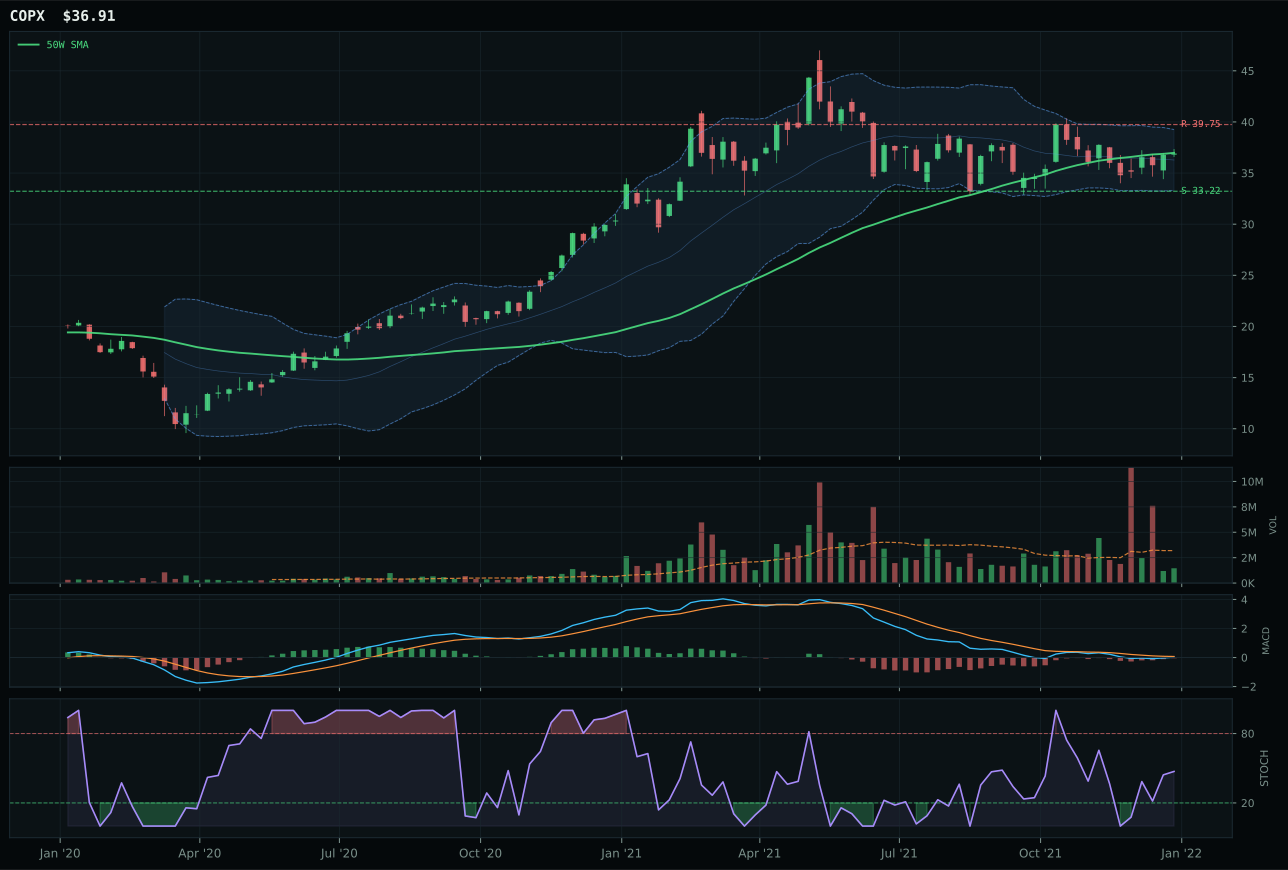
COPX has a compression near 50W profile with -2.6% 13-week relative strength versus SPY.
A failed hold above support would weaken the setup.
Actionable but governed by invalidation levels.
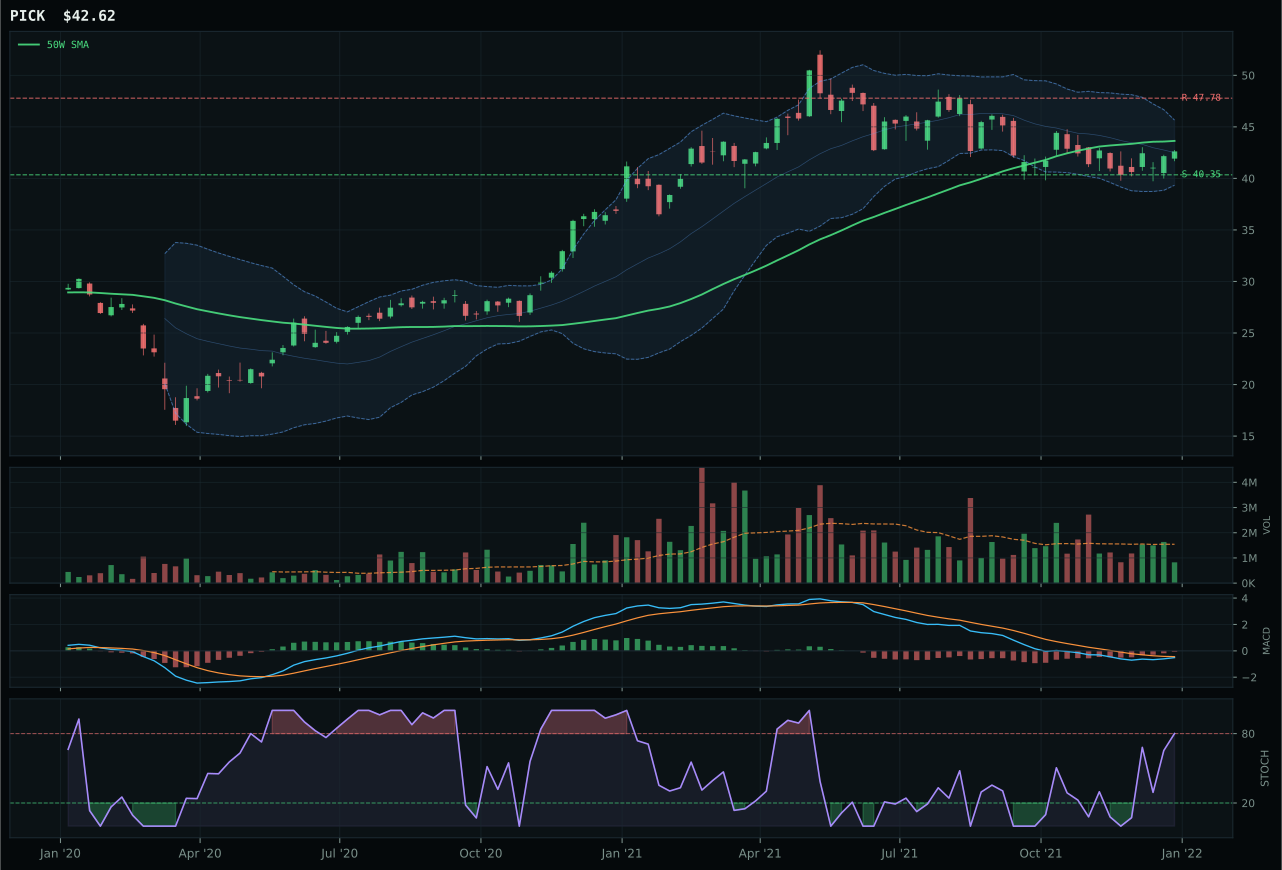
PICK has a compression near 50W profile with -5.7% 13-week relative strength versus SPY.
A failed hold above support would weaken the setup.
Actionable but governed by invalidation levels.
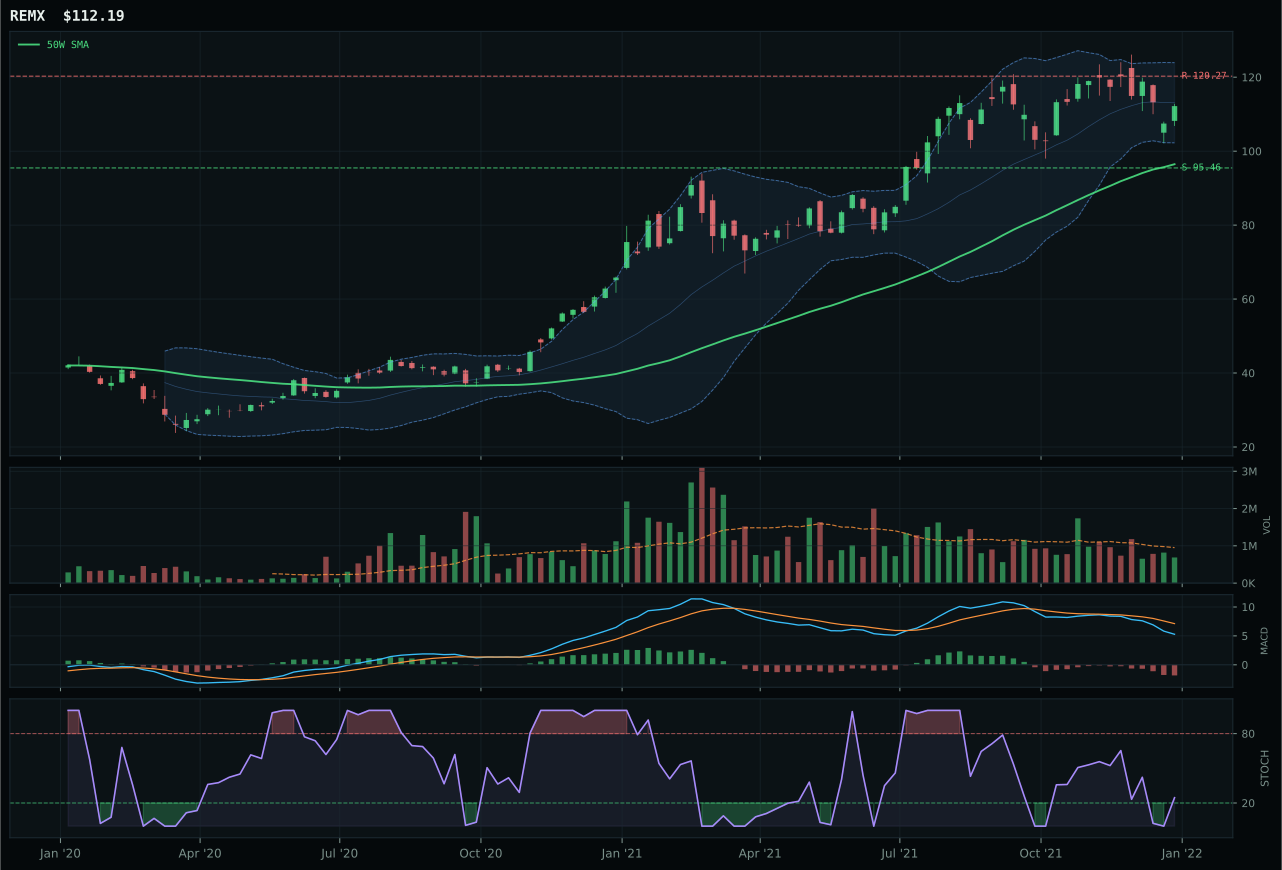
REMX has a vertical extension profile with -0.5% 13-week relative strength versus SPY.
A failed hold above support would weaken the setup.
Actionable but governed by invalidation levels.
COPX claimed the Industrial Metals crown with a decisive 10.9-point gap over PICK, meriting top-2 allocation despite sitting just 0.2% from the 50-week moving average in a compression setup that looks dormant at first glance. The win hinges on timing precision: COPX's distance to the 50W of -0.2% with bearish but improving MACD and rising mid-zone stochastic RSI (0.47) at Fibonacci 0.618 creates the textbook coil-and-expand pattern that allocators prize when macro descriptors are strong. Metals scarcity is active (+12) and commodity breadth positive (+7), powerful sponsorship that elevates the category's macro fit to 79.0/100, the highest in the entire portfolio. PICK's overbought momentum at 0.80+ stochastic RSI removes entry flexibility; thin participation at 0.46x average volume across both names signals capital is waiting, not accumulating. The 13-week return of 6.7% and category-relative strength at 0.0% confirm COPX is not leading yet—it is compressed and ready. This is a setup for expansion, not a continuation pattern, and the macro regime is willing to fund it.
Industrial Metals earns 10% allocation as a top-2 overweight category, reflecting a 57.3 final score that ranks second among all ten categories this week. The 79.0/100 macro fit is the portfolio's strongest: metals scarcity (+14) and commodity breadth positive (+10) are powerful, active descriptors that feed both the category reasoning and COPX's 63.4 reasoned ETF proof score. Goldilocks helps the exposure (+6), and real-asset sponsorship is active (+6), creating a convergence of structural and cyclical support that justifies the tier-1 commitment. The tension is execution: COPX is compressed, not extended, and thin volume participation (0.46x average) means capital is positioned but not yet deployed. The risk/reward is favorable (downside to support 11.1% vs upside to resistance -7.1%), creating asymmetry in a tight range. Top-2 allocation assumes the compression will resolve higher as macro conditions remain supportive and miners' real balance-sheet scarcity becomes harder to ignore. Industrial Metals could shift to tier-2 only if commodity breadth or metals scarcity descriptors flip, an unlikely event absent a sharp demand collapse.
Technology — XLK
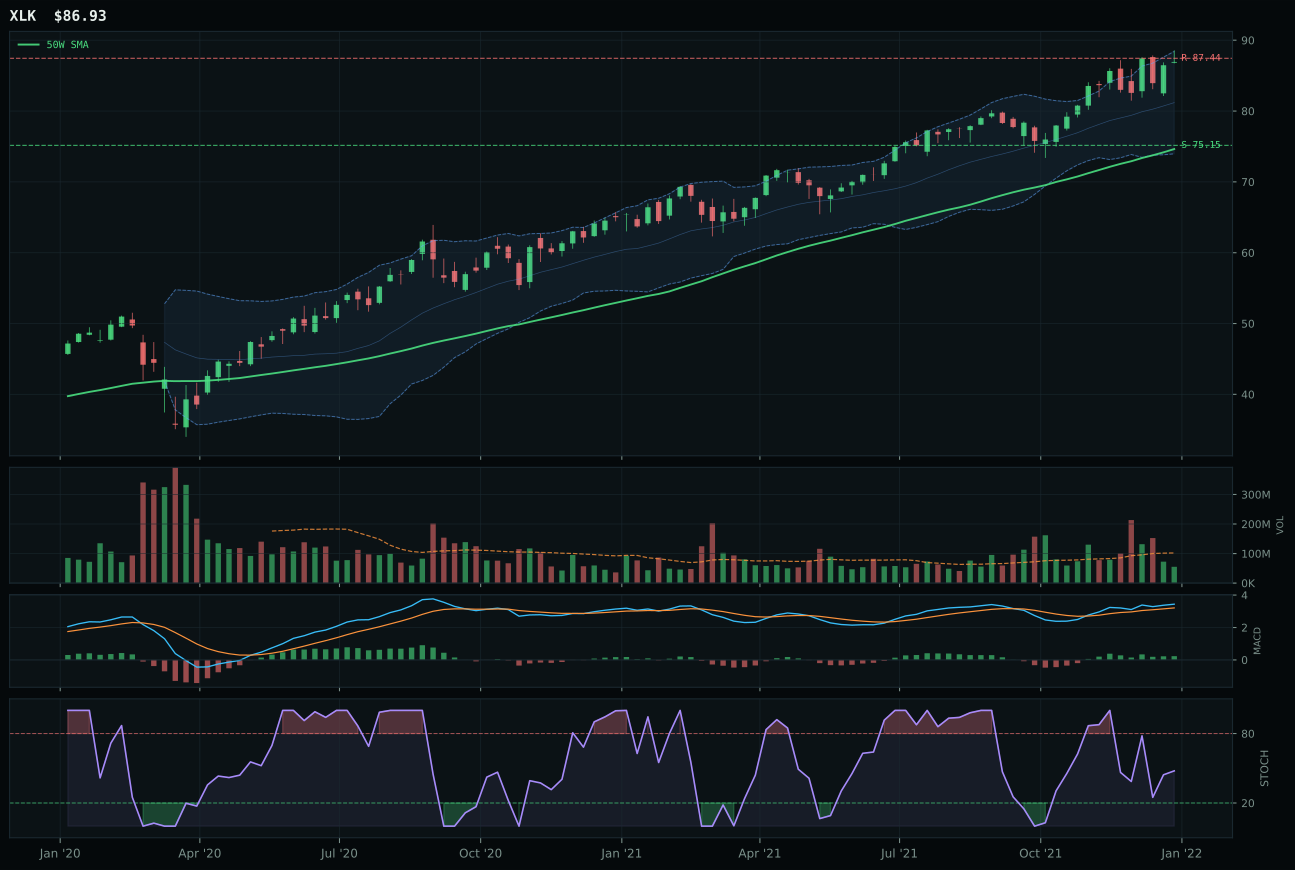
XLK has a vertical extension profile with 5.3% 13-week relative strength versus SPY.
A failed hold above support would weaken the setup.
Actionable but governed by invalidation levels.
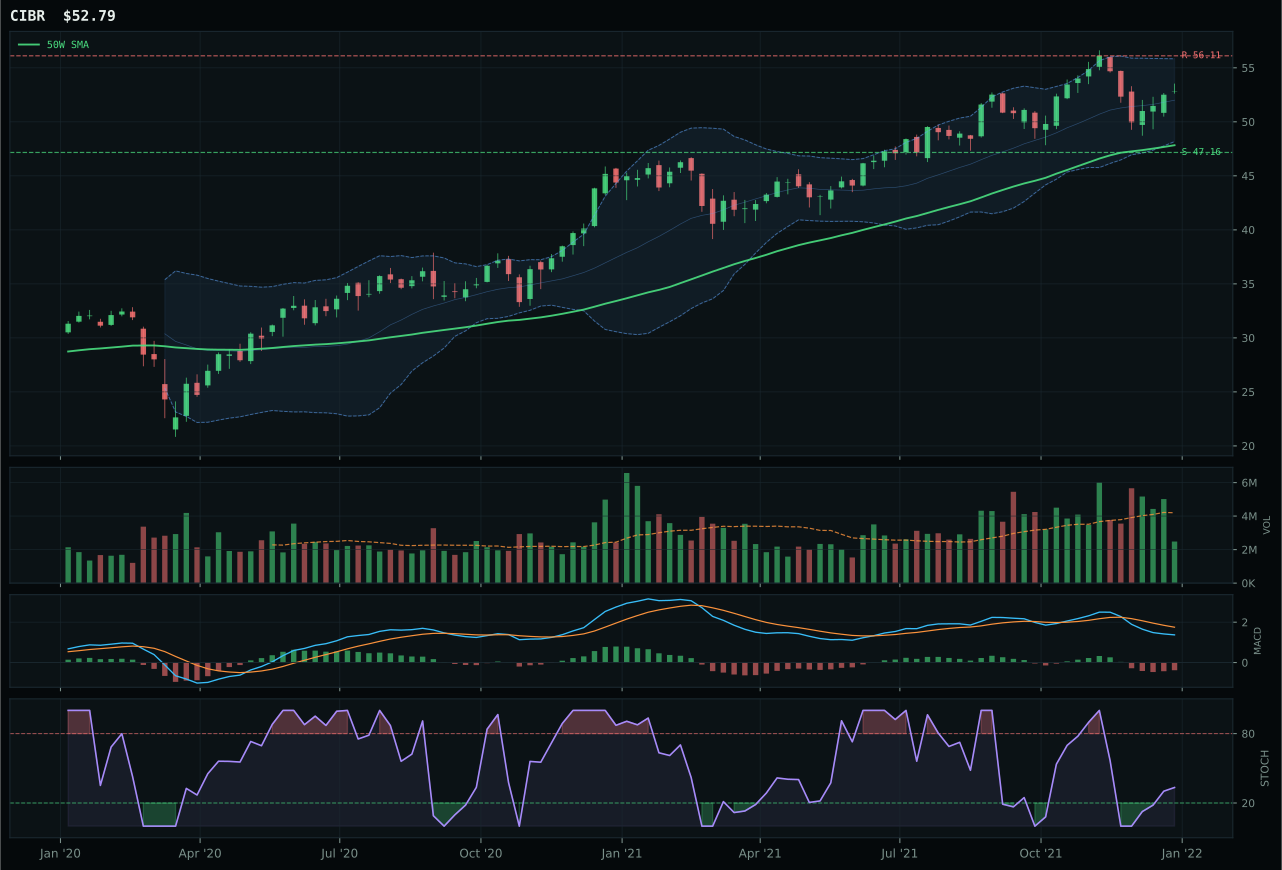
CIBR has a neutral structure profile with -2.5% 13-week relative strength versus SPY.
A failed hold above support would weaken the setup.
Actionable but governed by invalidation levels.
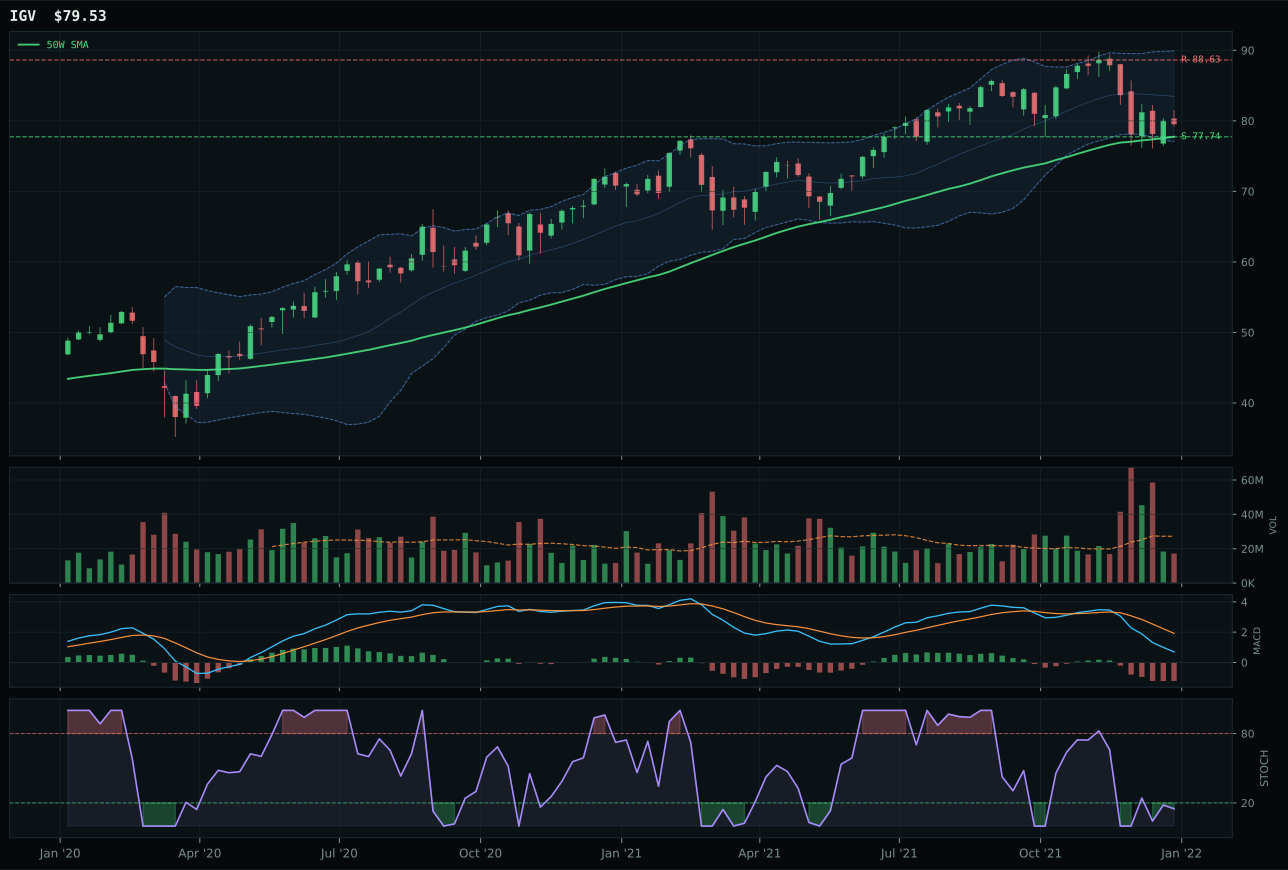
IGV has a pullback into support profile with -11.2% 13-week relative strength versus SPY.
A failed hold above support would weaken the setup.
Actionable but governed by invalidation levels.
XLK secured the category win with a 3.8-point advantage over CIBR, driven by superior relative strength inside the basket at 7.9% versus 0.0% and a cleaner technical setup. Price sitting 16.5% above the 50-week moving average with bullish, improving MACD and falling stochastic RSI signals that the momentum is genuine but the entry risk is material—this is extended leadership, not a fresh accumulation. The 14.7% thirteen-week return and 5.3% outperformance versus SPY confirm the move is being bought, though thin participation at 0.54x average volume means the setup lacks the sponsorship depth required to justify top-tier positioning. CIBR's bearish, weakening MACD and lagging 13-week return of 6.8% positioned it as the clear secondary choice, but the category's extension and macro tensions (AI growth sponsorship offset by active credit stress) explain why Technology landed in tier-2 rather than top-2 contention.
Technology earns 5% allocation as a tier-2 category with a 53.2 final score that trails the two tier-1 overweights by meaningful margins. The Goldilocks macro regime and active risk-appetite descriptor support the exposure, but the setup's 45.0 timing score—penalizing the 16.5% extension and distance from support—reveals a category wrestling with entry risk versus momentum confirmation. XLK's trend composite of 100/100 is offset by risk/reward scoring only 37.7/100, a tension that surfaces whenever an extended leader dominates a basket; the allocator is accepting late-cycle positioning in exchange for quality and relative strength. What would elevate Technology to top-2: either a mean-reversion pullback that cleans the entry for XLK without breaking trend, or a fresh MACD divergence that signals institutional rotation into smaller or fresher technology themes within the basket. For now, the 5% slot reflects conviction in the trend but discipline about entry timing.
Precious Metals — GLD
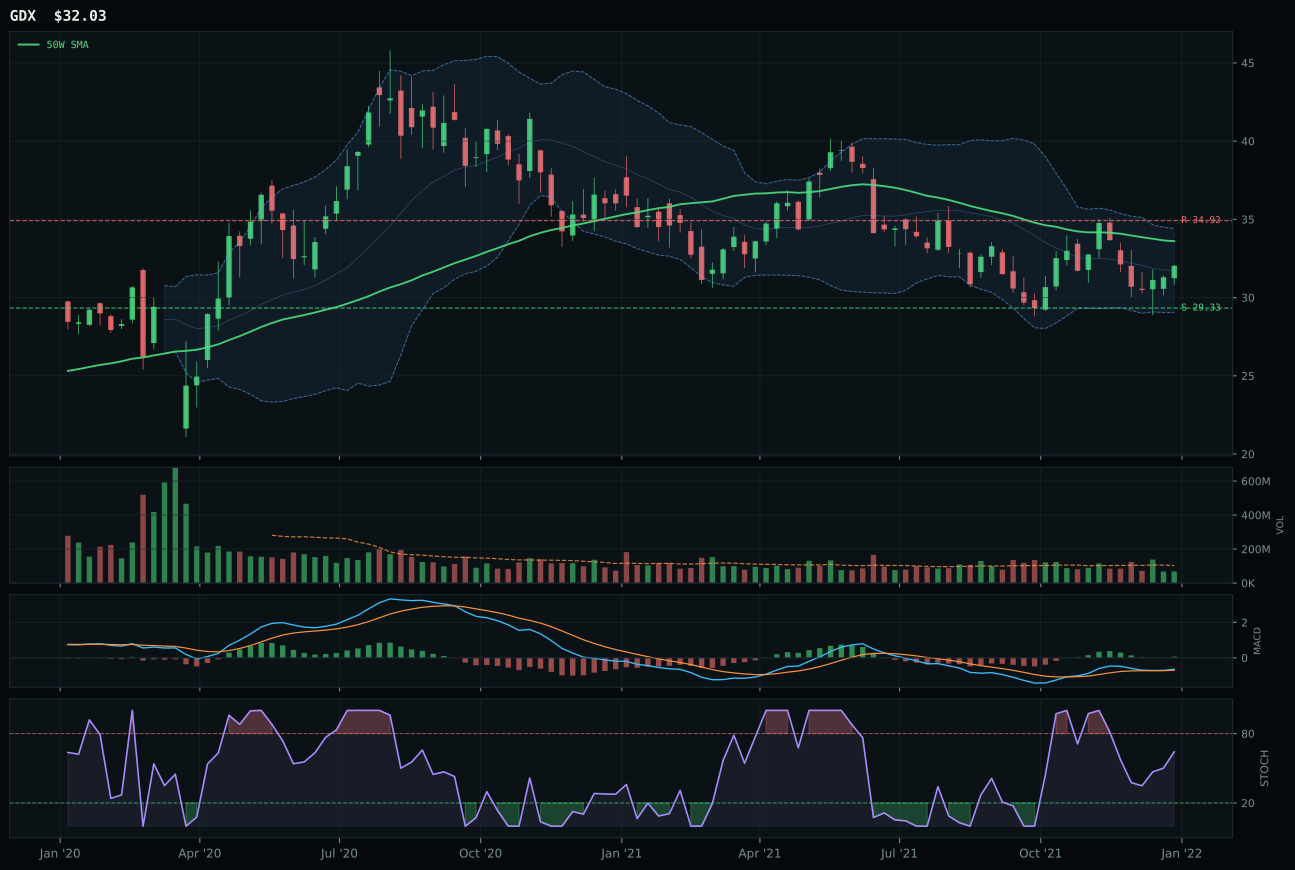
GDX has a neutral structure profile with -0.2% 13-week relative strength versus SPY.
A failed hold above support would weaken the setup.
Actionable but governed by invalidation levels.
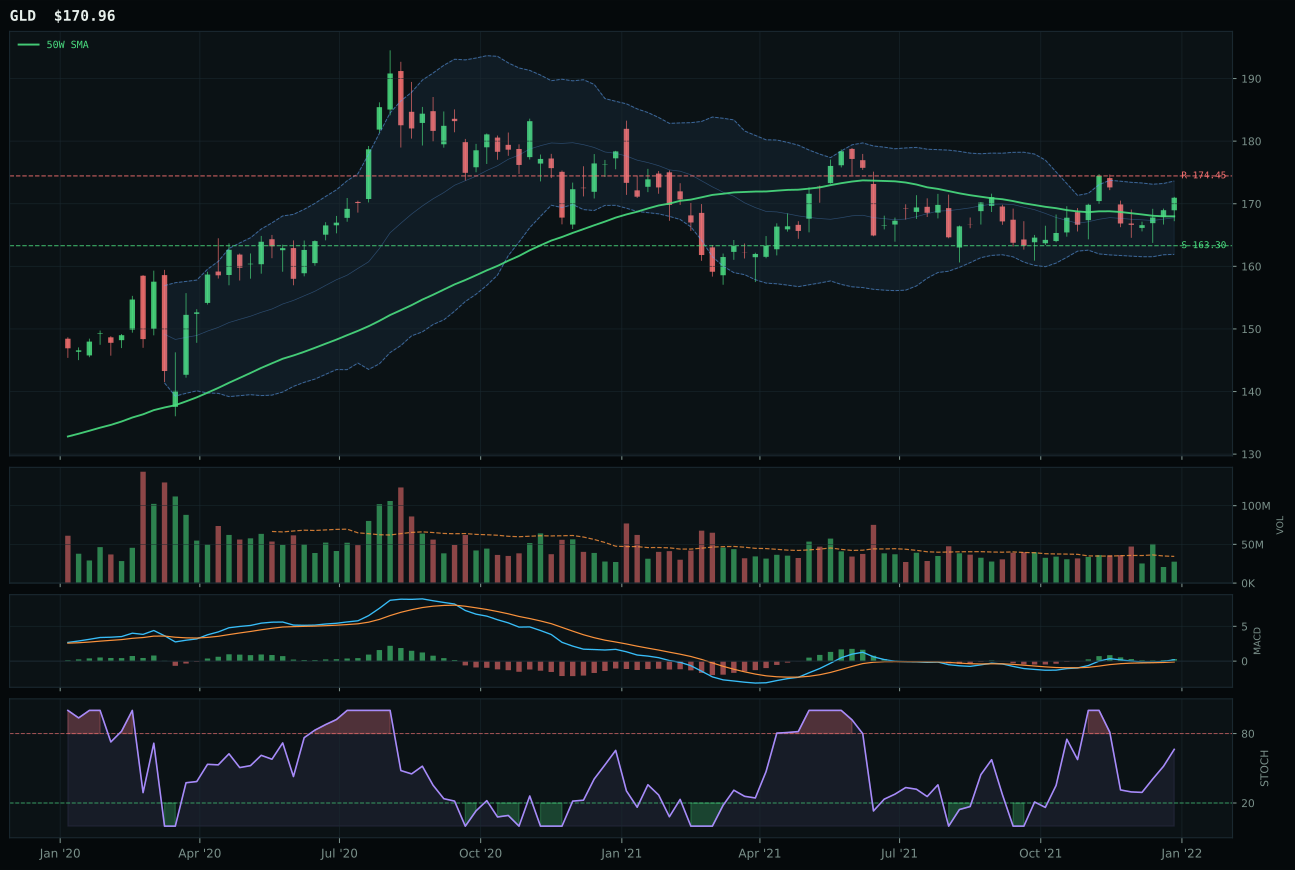
GLD has a pullback into support profile with -5.5% 13-week relative strength versus SPY.
A failed hold above support would weaken the setup.
Actionable but governed by invalidation levels.
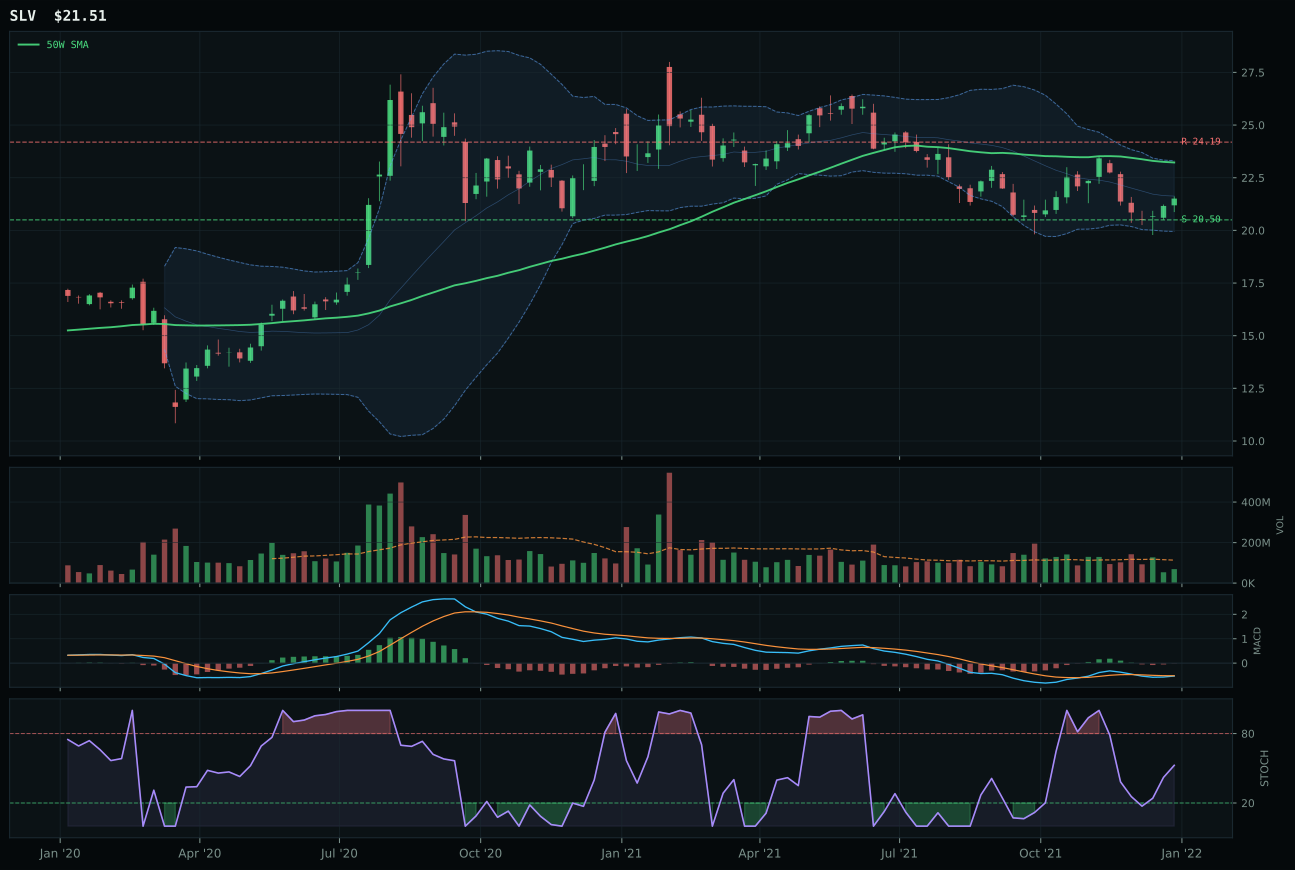
SLV has a pullback into support profile with -6.1% 13-week relative strength versus SPY.
A failed hold above support would weaken the setup.
Actionable but governed by invalidation levels.
GLD won the category with a 10.5-point advantage over GDX, capturing the allocation despite both candidates showing bearish, improving MACD and rising mid-zone stochastic RSI. The separator is technical precision: GLD's pullback into support at 163.30 with only 4.7% downside and 2.0% upside to resistance creates a defined risk/reward profile (60.7/100) that matches the 82.8/100 technical evidence composite and the bullish, improving MACD signal. GDX's neutral structure and flattening MACD, combined with thin participation at 0.53x average volume, position it as the secondary play—technically sound but lacking the clean-bottoming credentials that allocators favor in mean-reversion setups. GLD's thirteen-week return of 3.9% and SPY-relative performance of -5.5% are modest, yet the timing score of 100/100 confirms price is arriving at decision-zone support precisely when macro conditions (disinflation +8, defensive rotation +6) are most supportive. The gold-as-monetary-hedge narrative is cleaner and less leveraged than miner exposure.
Precious Metals earns 5% allocation as a tier-2 category with a final score of 51.1, sitting above several peers despite active tensions between defensive rotation and risk-appetite descriptors. Disinflation pressure (+8) and defensive rotation (+6) drive the 59.0/100 macro fit, but risk appetite is active (-4), a friction that prevents the category from claiming top-2 status despite GLD's 82.8 technical evidence composite. The Goldilocks regime ordinarily supports risk-on positioning, yet the portfolio's top-2 overweights (Utilities at 67.7 and Industrial Metals at 57.3) are capturing the defensive and real-asset flows that Precious Metals would otherwise inherit. What would elevate GLD and the category: either a broader risk-off event that upgrades defensive rotation intensity, or a MACD acceleration in GLD that proves the bullish-improving signal is not just a bounce but a new uptrend. For now, the 5% allocation respects the support-bounce timing and macro tailwinds while acknowledging that real-asset exposure is better captured elsewhere in the portfolio.
AI — SMH
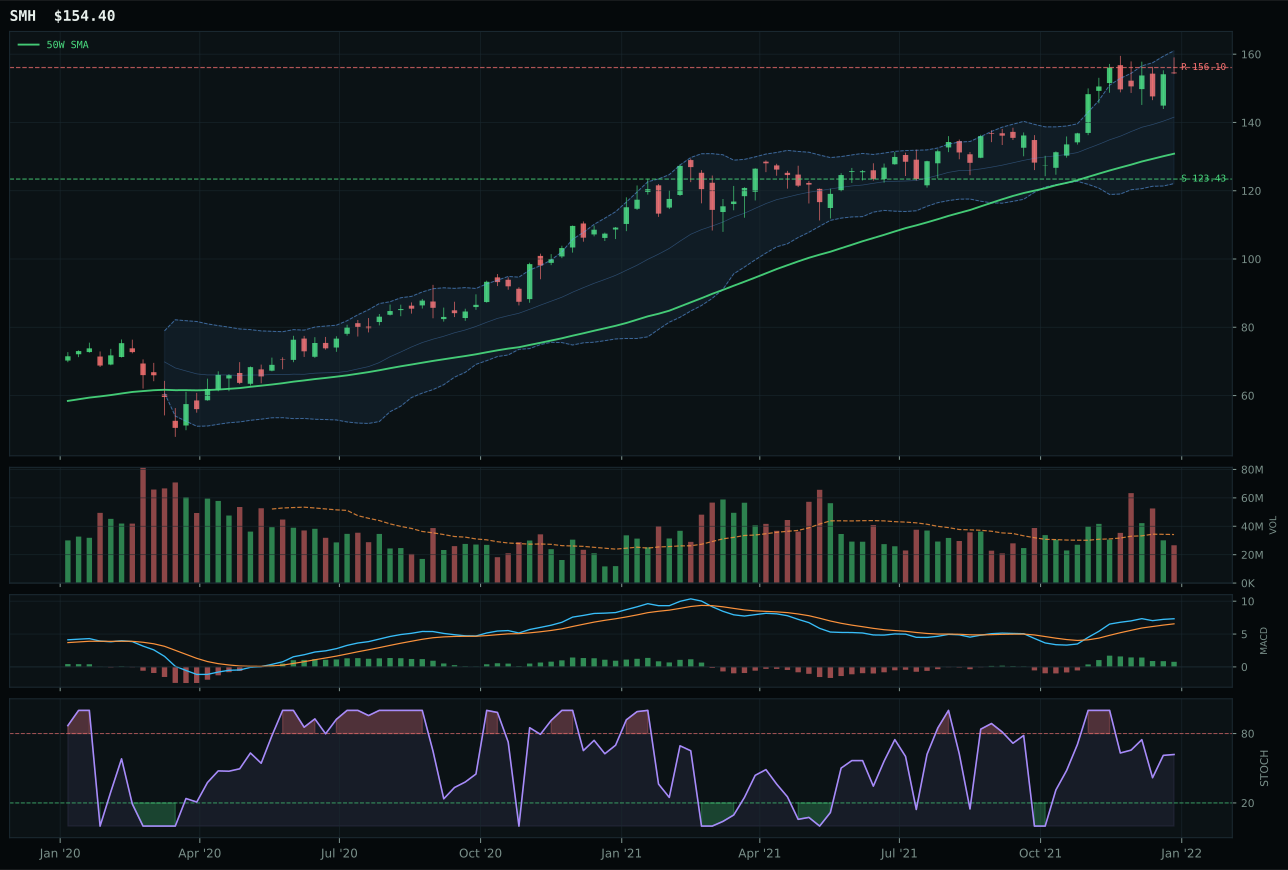
SMH has a vertical extension profile with 11.0% 13-week relative strength versus SPY.
A failed hold above support would weaken the setup.
Actionable but governed by invalidation levels.
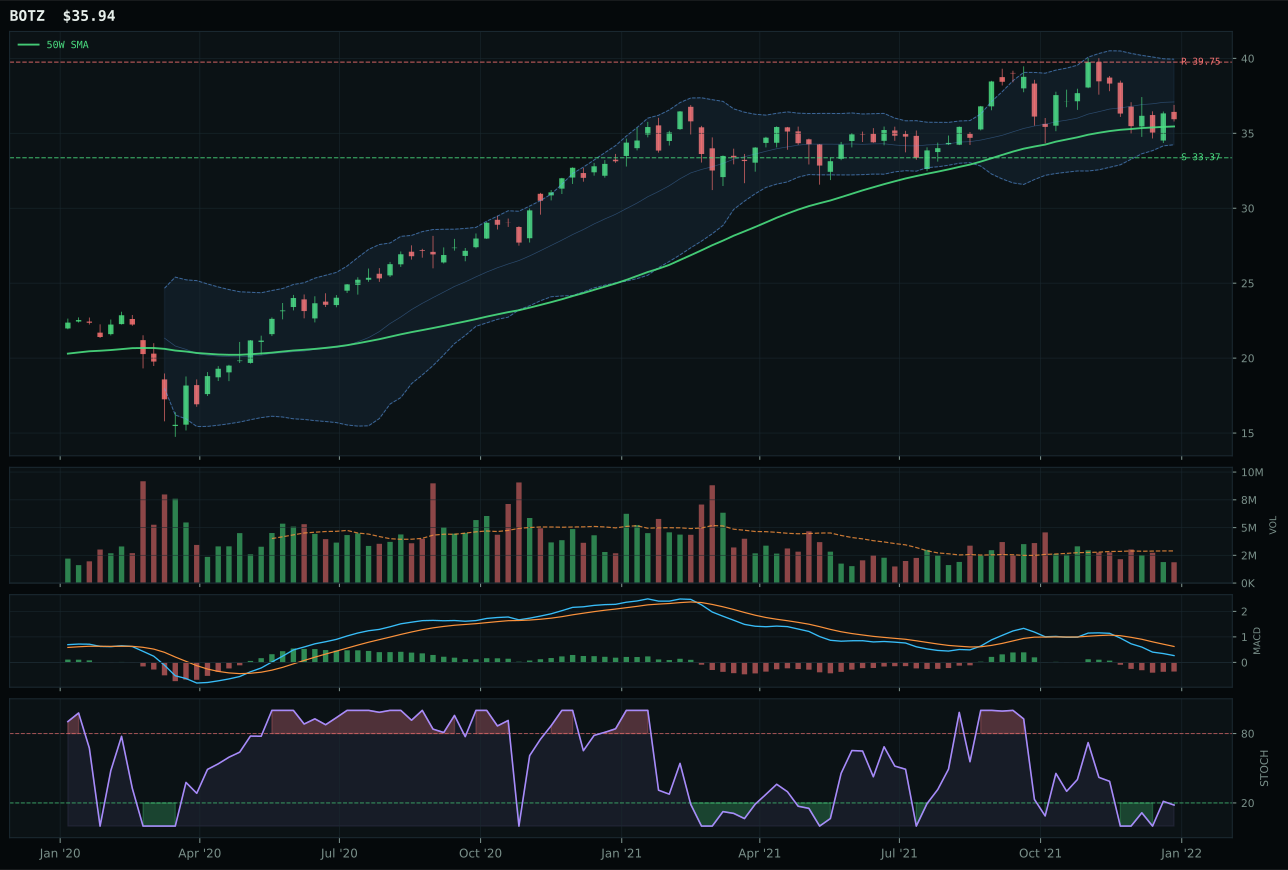
BOTZ has a compression near 50W profile with -9.9% 13-week relative strength versus SPY.
A failed hold above support would weaken the setup.
Actionable but governed by invalidation levels.
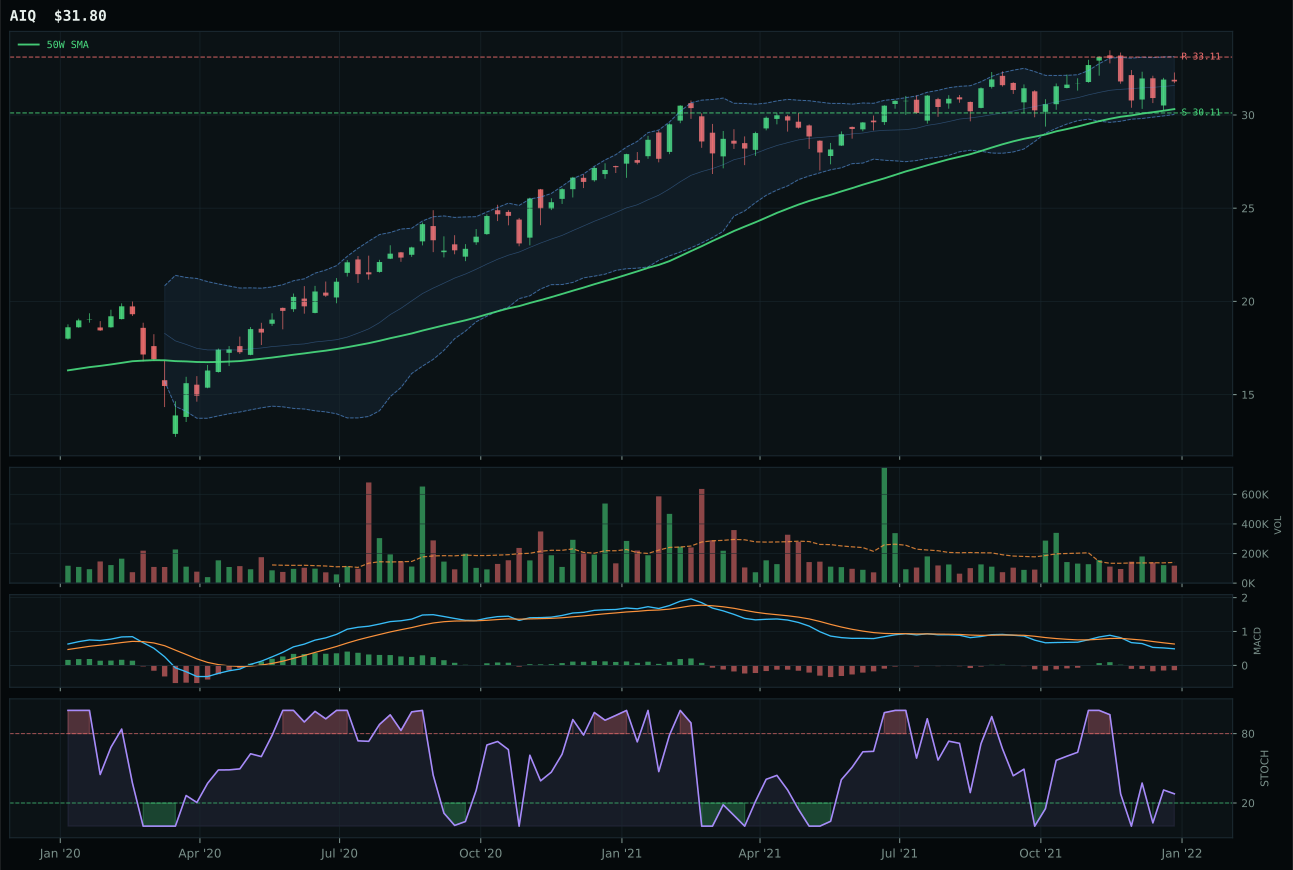
AIQ has a neutral structure profile with -4.3% 13-week relative strength versus SPY.
A failed hold above support would weaken the setup.
Tracked, but not top-2 eligible because: .
SMH edged BOTZ by just 0.1 points in the final reasoned proof order, a razor-thin margin that underscores how close this category decision truly was. The separator is technical: SMH's 20.4% thirteen-week return and 15.3% category-relative strength are accompanied by cleaner structure (80.0 vs 65.7) and a bullish, though flattening, MACD versus BOTZ's bearish, weakening trend. Semiconductors are delivering the compute-infrastructure alpha that AI sponsors demand, and the 11.0% outperformance versus SPY is material even accounting for the 18.0% extension above the 50-week moving average. Volume at neutral (0.78x average) gives the setup better staying power than the thin participation haunting many other winners, and the stochastic RSI falling into mid-zone territory signals room for continued accumulation without immediate momentum exhaustion. BOTZ's compression near the 50-week and oversold stochastic RSI create a dormant, coiled setup—technically valid but starved of the leadership momentum that SPY correlation demands.
AI receives 5% allocation as a tier-2 category despite a 48.1 final score and a macro fit of 76.0/100—among the strongest in the entire portfolio. The Goldilocks regime and the active ai-growth-sponsorship descriptor (+14) are powerful tailwinds, yet SMH's extended entry (18.0% above the 50W) and deflationary MACD (bullish but flattening) create a timing penalty that prevents top-2 qualification. This category is crowded with conviction but empty on fresh accumulation signals; the 100/100 trend score meets a 40.0 timing score, and that gap is decisive. To earn top-2: either a sharp pullback that resets the entry without breaking SMH's above-200W structure, or a MACD re-acceleration that proves the flattening is a pause, not a rollover. The 5% allocation honors the macro narrative and technical strength while respecting the entry-risk reality. If semiconductor upside momentum persists through year-end, AI could graduate to tier-1 on the next rotation.
Emerging Markets — INDA
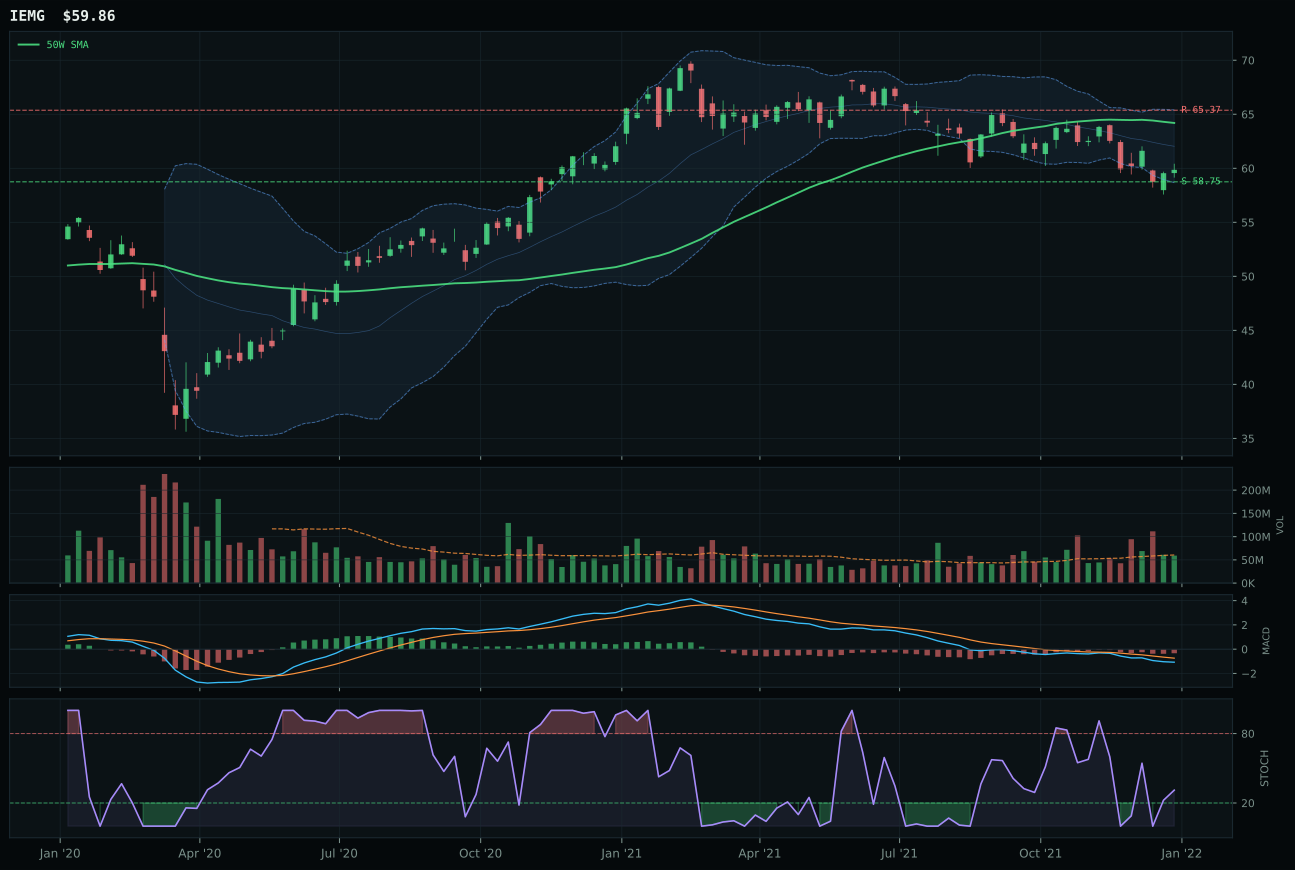
IEMG has a pullback into support profile with -12.5% 13-week relative strength versus SPY.
A failed hold above support would weaken the setup.
Actionable but governed by invalidation levels.
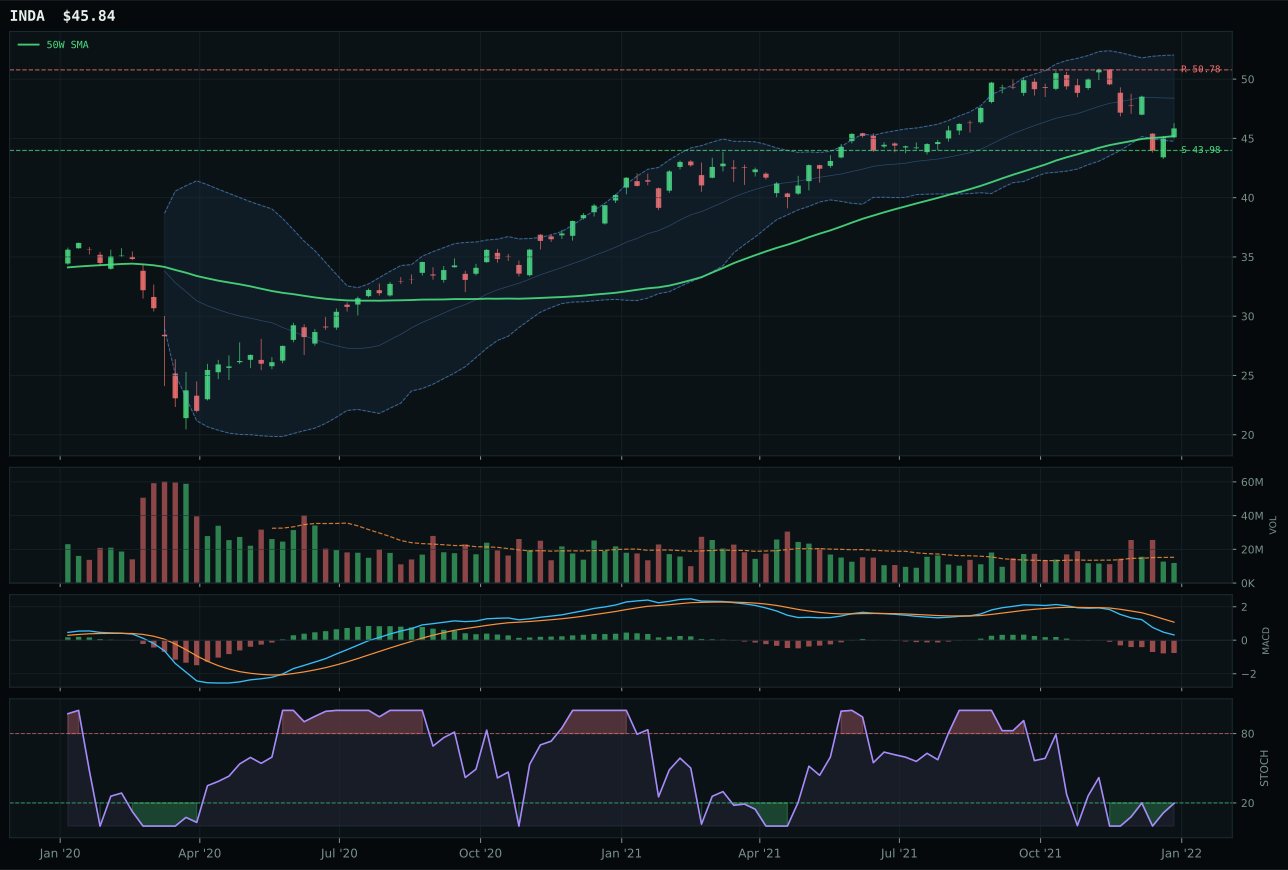
INDA has a pullback into support profile with -16.1% 13-week relative strength versus SPY.
A failed hold above support would weaken the setup.
Actionable but governed by invalidation levels.
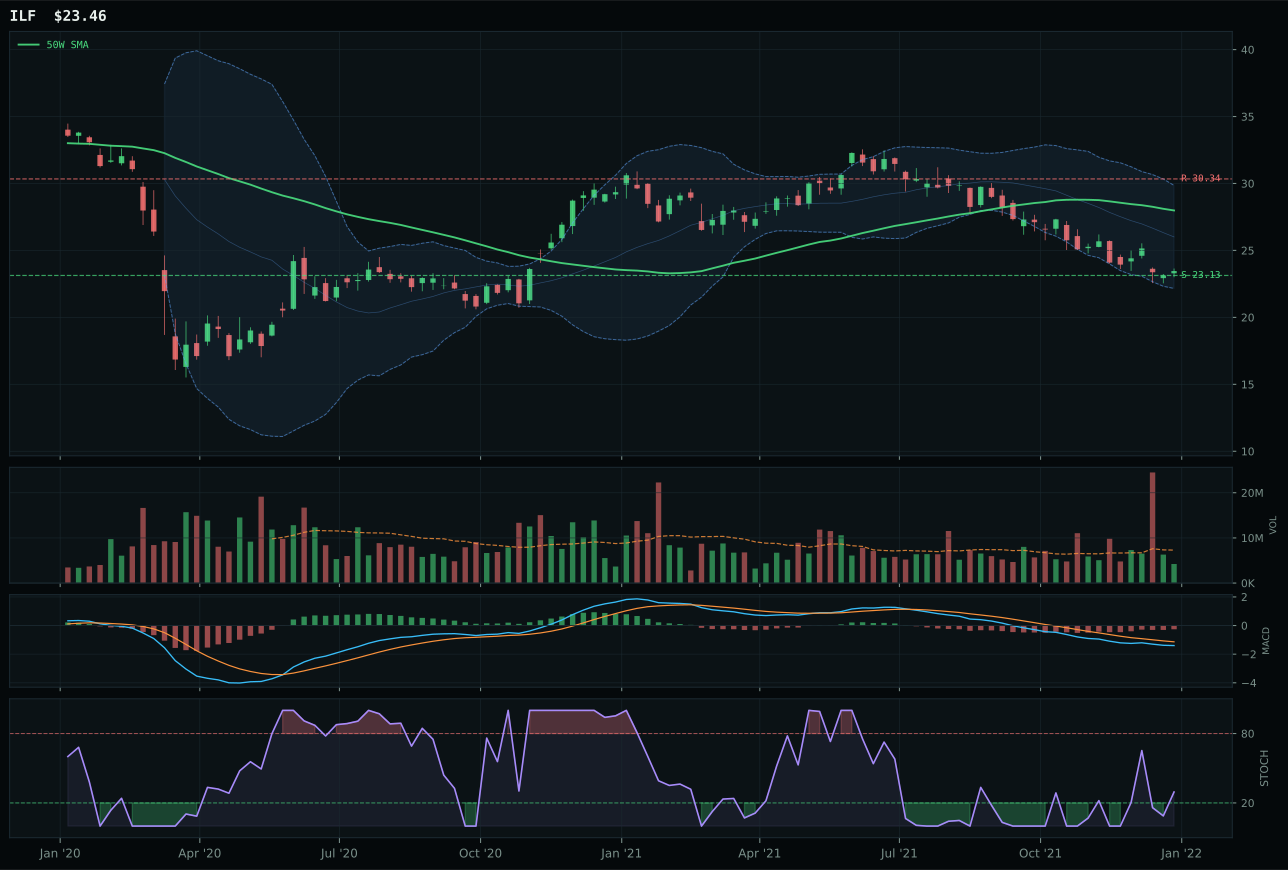
ILF has a pullback into support profile with -22.8% 13-week relative strength versus SPY.
Extension and support failure are the main tactical risks.
Tracked, but not top-2 eligible because: structurally broken.
INDA claimed the Emerging Markets crown with a 19.4-point advantage over IEMG despite delivering the worst thirteen-week return in its peer set at -6.7% and posting the lowest category-relative strength at 0.0%. The victory is entirely timing-driven: INDA's pullback into support at 43.98 with only 4.2% downside creates a defined risk/reward of 94.4/100, the highest in the entire portfolio for that metric alone. The stochastic RSI sits at 0.20 (deeply oversold) while MACD remains bearish but weakening, the classic recovery setup that allocators favor when macro conditions support it. The 100/100 timing score reflects INDA's precise arrival at Fibonacci 0.382 in the middle retracement zone; this is India quality-growth exposure arriving at marked-down valuations when emerging-market liquidity support (+14 in macro) and risk-appetite descriptors are active. IEMG's broader mandate and falling-neutral stochastic RSI create a less urgent setup; INDA's surgical entry point and high-conviction macro narrative make it the clear category winner despite absolute weakness.
Emerging Markets earns 5% allocation as a tier-2 category with a final score of 38.5 and a macro fit of 70.0/100 that benefits from strong emerging-market liquidity support (+14) and risk-appetite descriptors (+8) offset by active credit stress (-10). The tension is acute: INDA's macro setup is supportive, yet its -6.7% thirteen-week return and -16.1% SPY-relative weakness confirm that buyers have fled the category entirely. The 0.0% momentum confirmation score and 28.8 persistence composite reveal a category where price alone is attractive, not accumulation. Goldilocks regime helps (+8), but the 34.9 technical evidence for INDA means allocators are genuinely accepting negative momentum in exchange for valuation and macro narrative support. What would elevate Emerging Markets to tier-2 or higher: either a MACD break into bullish prints and stochastic RSI climb above 0.50 that confirms accumulation is beginning, or a shift in capital flows toward emerging-market assets as risk appetite accelerates. For now, the 5% allocation is a pure macro bet on EM liquidity remaining available; the technical setup is honest about its weakness and is pricing INDA for a recovery, not confirming one yet.
Defense & Aerospace — ITA
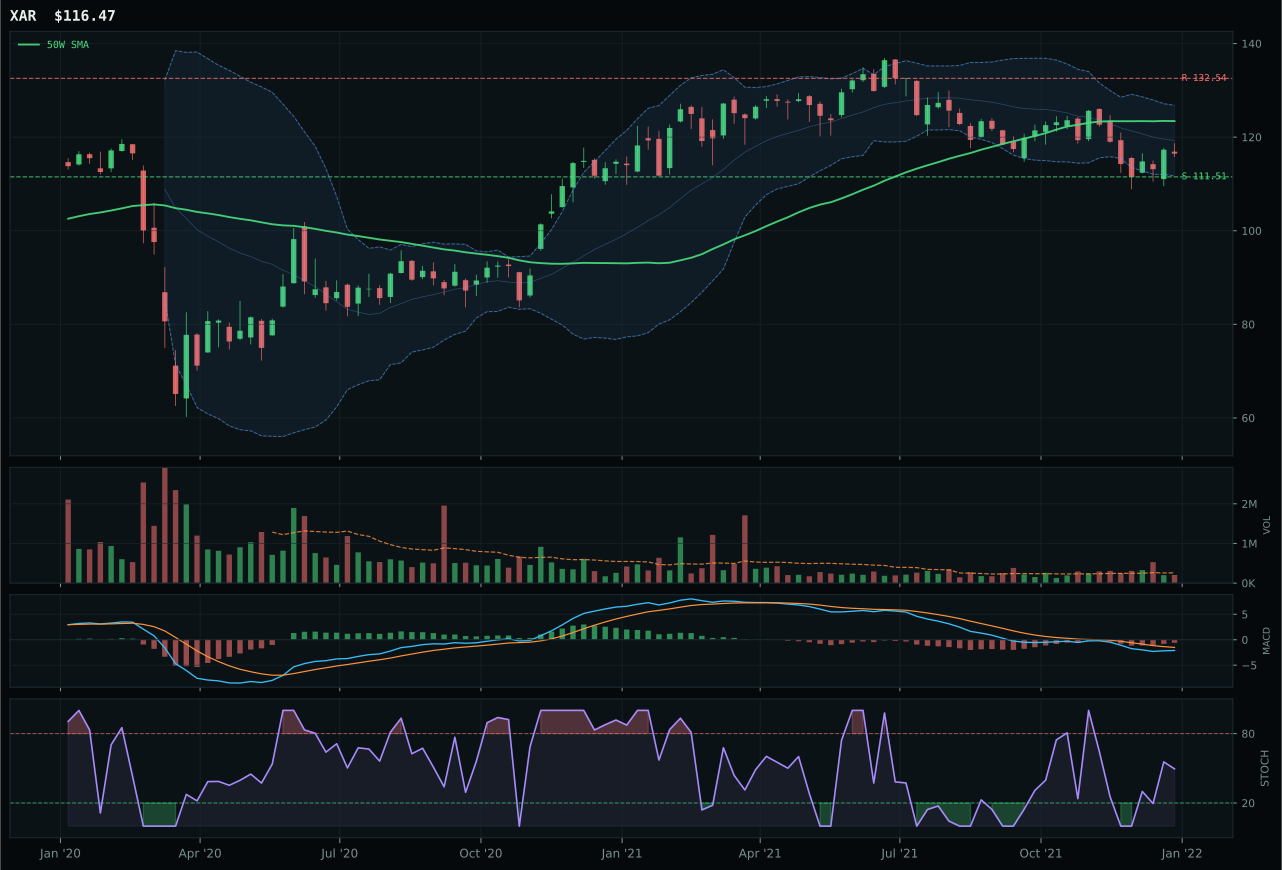
XAR has a pullback into support profile with -13.5% 13-week relative strength versus SPY.
A failed hold above support would weaken the setup.
Actionable but governed by invalidation levels.
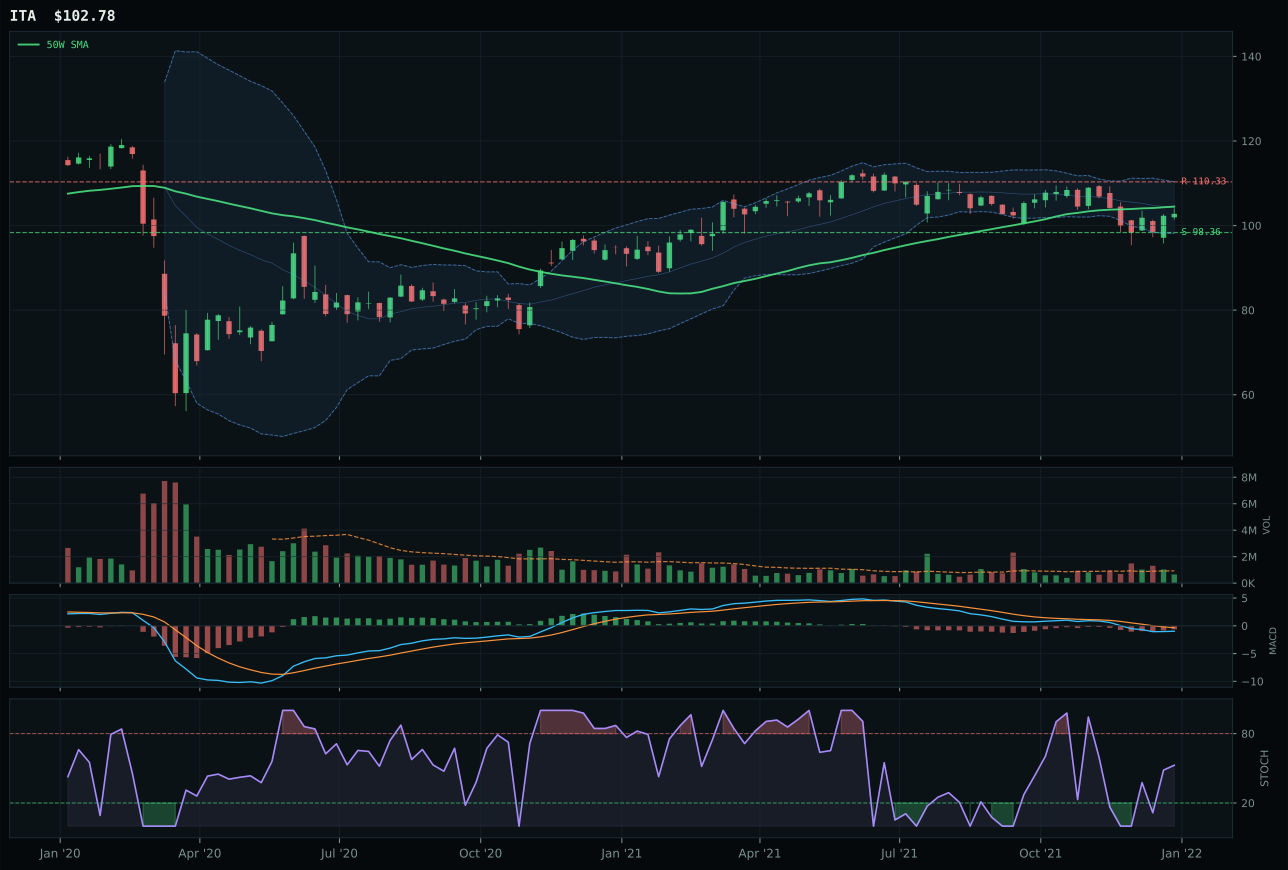
ITA has a pullback into support profile with -12.6% 13-week relative strength versus SPY.
A failed hold above support would weaken the setup.
Actionable but governed by invalidation levels.
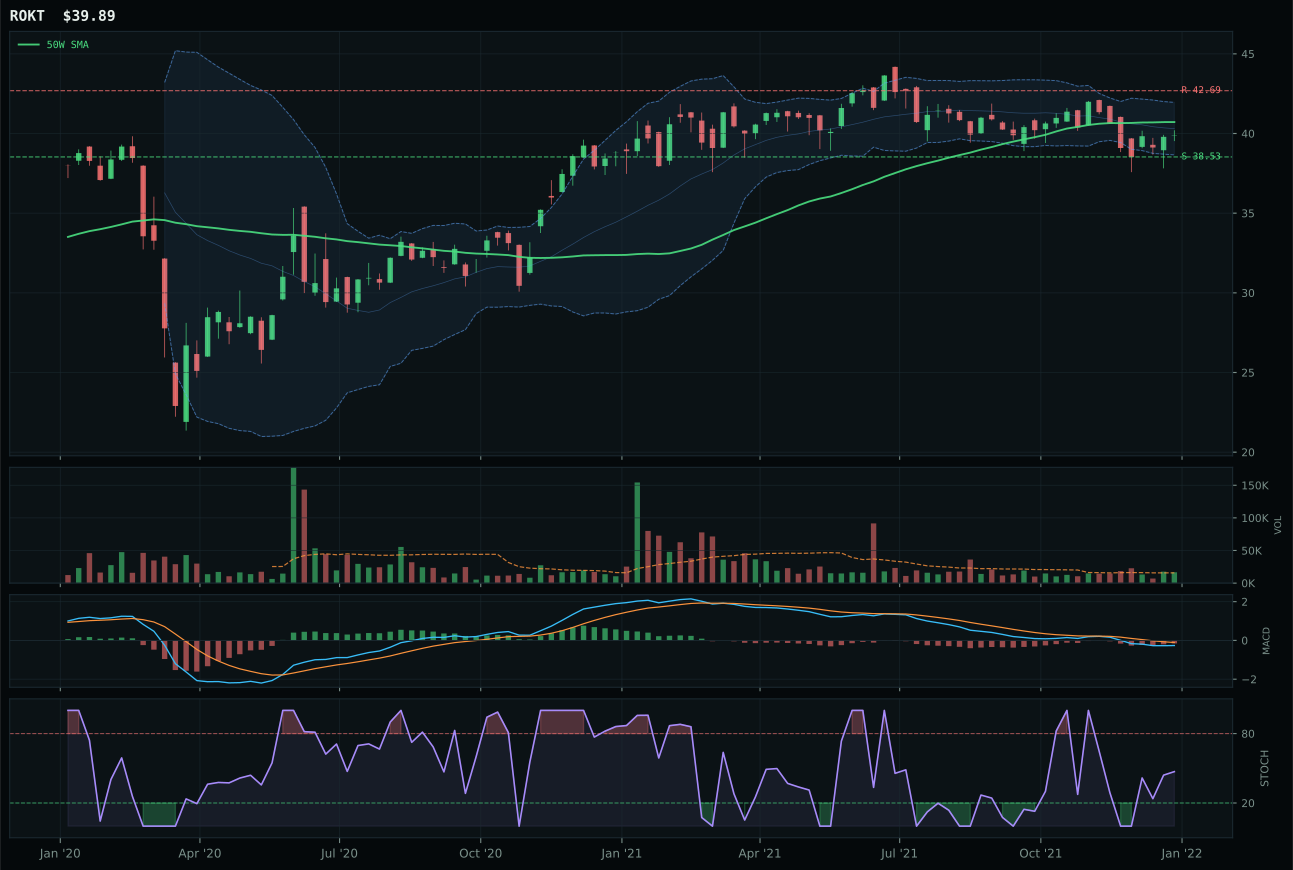
ROKT has a pullback into support profile with -10.2% 13-week relative strength versus SPY.
A failed hold above support would weaken the setup.
Tracked, but not top-2 eligible because: .
ITA defeated XAR by 12.7 points despite sitting below its 50-week moving average, a victory rooted entirely in superior risk/reward (80.4 vs 98.0 for XAR, a paradox resolved by noticing ITA's downside-to-support of only 4.5% versus XAR's deeper zone). The category is in repair mode: both candidates show bearish but improving MACD and rising mid-zone stochastic RSI, the textbook pattern of a bounce near support rather than a fresh uptrend. ITA's pullback into support near 98.36 offers a defined invalidation level, which allocators value far more than XAR's deeper retracement zone. Thirteen-week returns are both negative (ITA -3.2%, XAR -4.1%), and category-relative strength is flat at 0.0%, confirming this is a timing play on defense durability, not a momentum charge. Volume remains thin across the board, yet ITA's 45/100 volume-price confirmation score exceeds XAR's 35/100, evidence that the small trades executing near support are more constructive than those in deeper zones.
Defense & Aerospace earns 5% allocation as a tier-2 category with a final score of 35.6 that ranks it well below the tier-1 overweights and reflects significant headwinds. Defensive rotation is active (+8) and supporting the macro narrative, but the category's -12.6% relative weakness versus SPY and negative thirteen-week return expose a market that views defense as a crowded hedge rather than a growth engine in Goldilocks regimes. ITA's timing score of 100/100 is the sole pillar keeping the category afloat; it arrived at support precisely as allocators hunt for mean-reversion plays. To earn tier-1 status: Defense would need either a SPY correction that activates fresh flows into defensive names, or a MACD confirmation in ITA that proves the defense setup is not just tactical. Until then, the 5% allocation is a modest nod to the valuation discipline and support-bounce setup, positioned to capture mean reversion without over-committing to a category starved of breadth and momentum.
Agriculture & Livestock — MOO
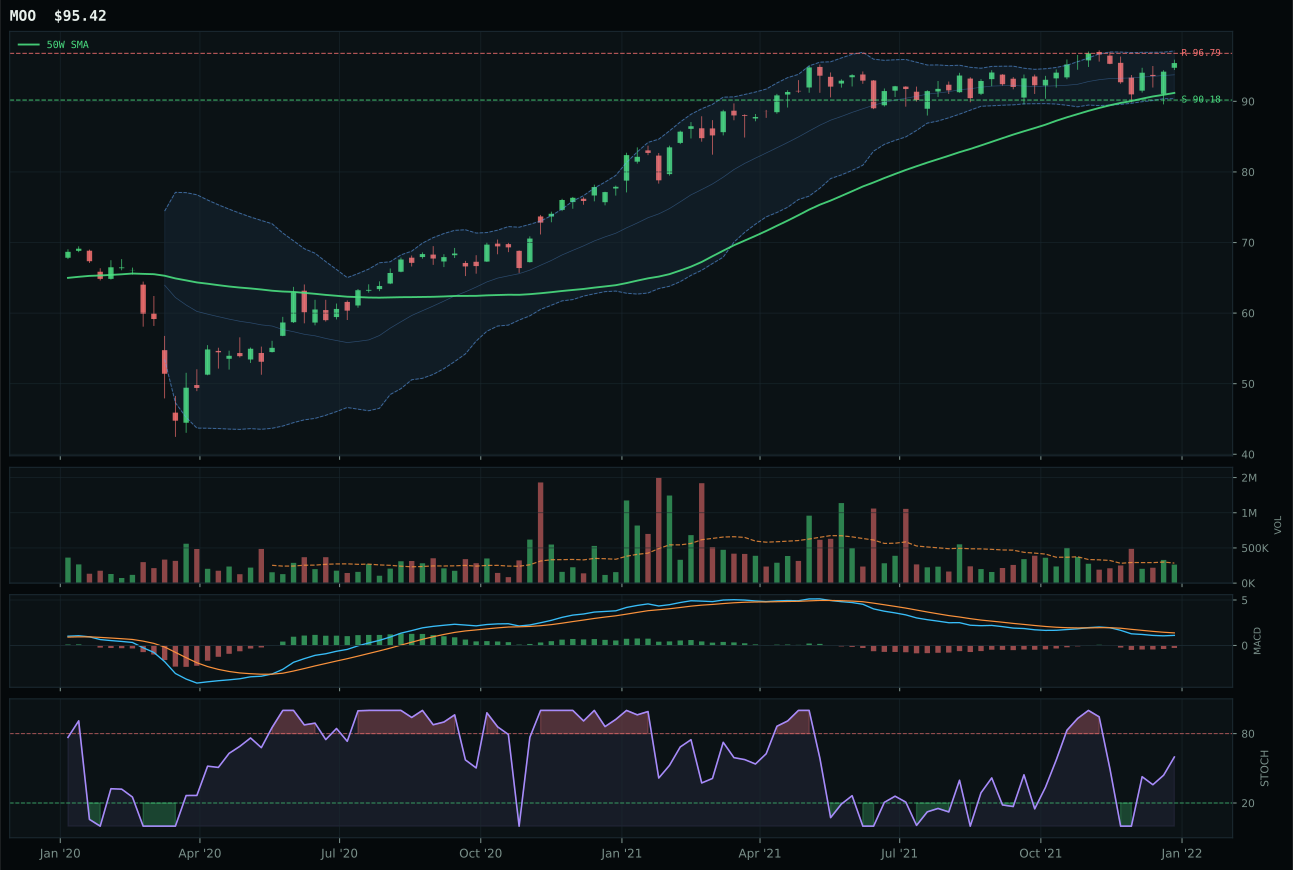
MOO has a neutral structure profile with -6.0% 13-week relative strength versus SPY.
A failed hold above support would weaken the setup.
Actionable but governed by invalidation levels.
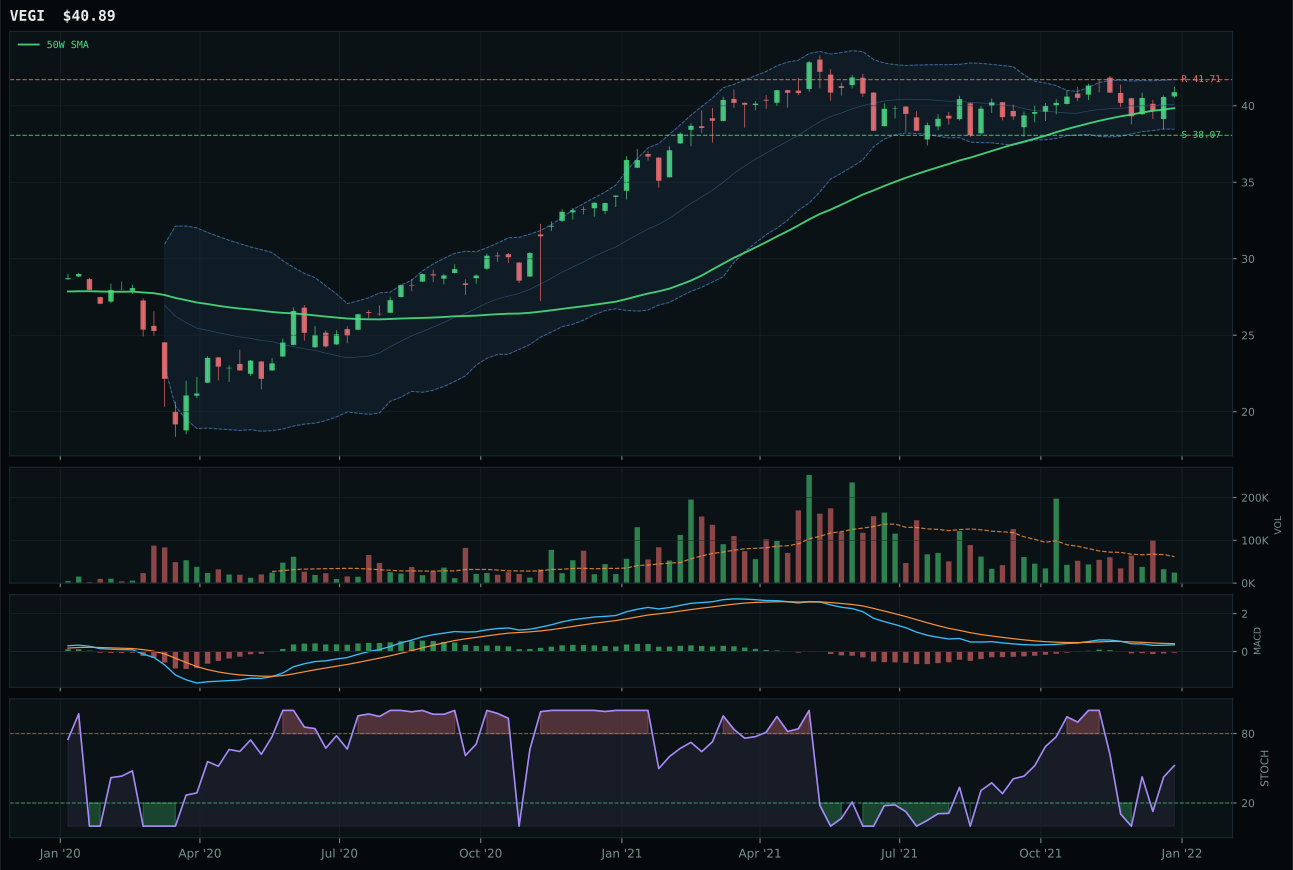
VEGI has a compression near 50W profile with -6.1% 13-week relative strength versus SPY.
A failed hold above support would weaken the setup.
Tracked, but not top-2 eligible because: .
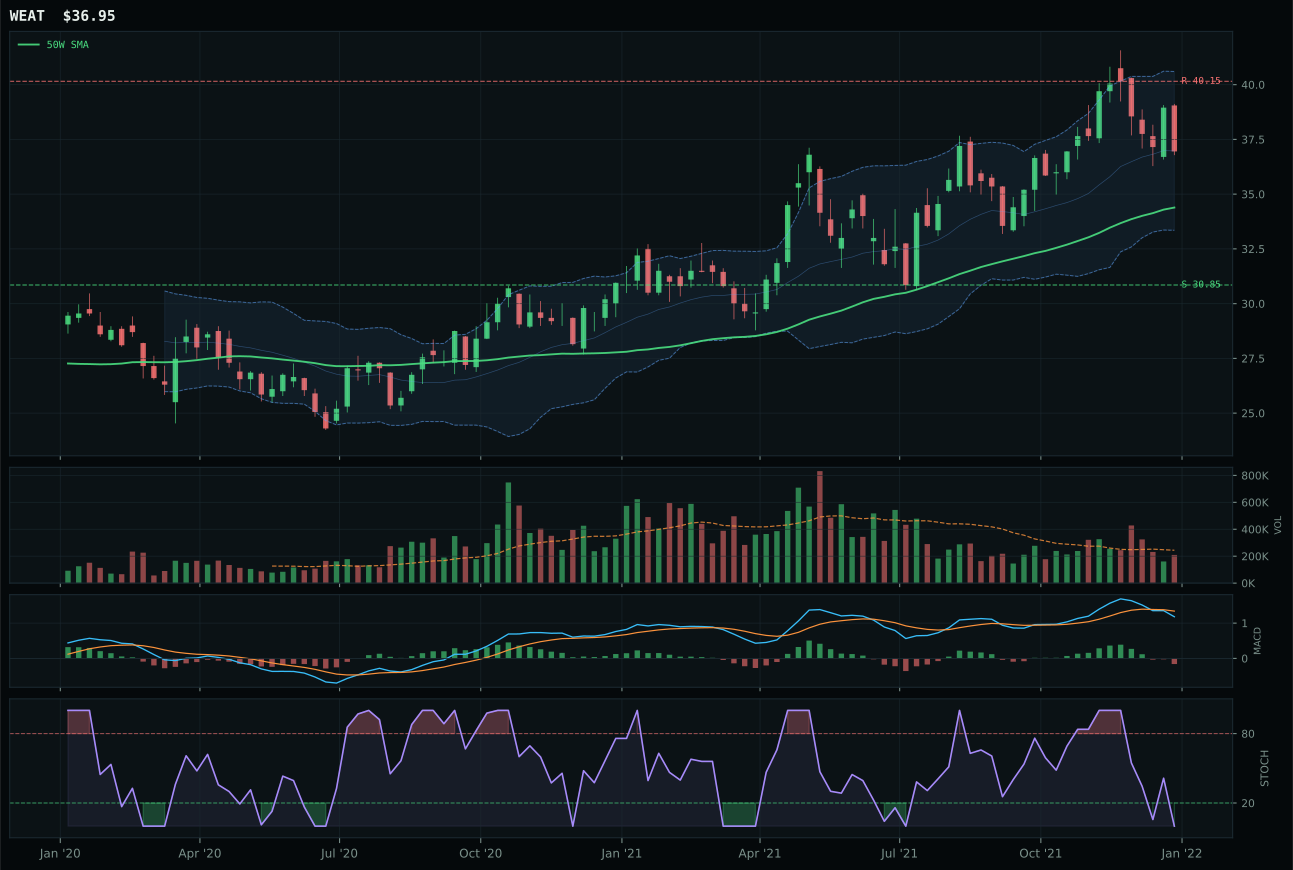
WEAT has a neutral structure profile with -8.6% 13-week relative strength versus SPY.
A failed hold above support would weaken the setup.
Tracked, but not top-2 eligible because: .
MOO secured the category win with a commanding 14.7-point lead over VEGI despite subdued absolute returns (3.4% thirteen-week) and negative six-week SPY-relative performance. The victory stems from MOO's superior structure score (75.3 vs 73.5), cleaner timing (98.0 vs 100.0, but MOO's 4.6% distance to the 50W versus VEGI's compression near the 50W), and neutral volume participation (0.92x average) versus VEGI's thin participation. The setup is not a momentum case; rather, it is a steady holder in a neutral structure near support, with stochastic RSI rising mid-zone and MACD bearish but improving—the recipe for quiet accumulation in real-asset categories when disinflation and commodity breadth collide. MOO's 0.1% category-relative strength is statistically flat, yet its breadth and volume positioning make it the cleaner vehicle for exposure to agribusiness equity relative strength. VEGI's thin participation and compression near-resistance removes optionality if the bounce extends.
Agriculture & Livestock earns 5% allocation as a tier-2 category with a final score of 33.7, ranking it in the lower half of the portfolio despite a 55.0/100 macro fit that benefits from real-asset sponsorship (+8) and commodity breadth positive (+5). The tension is straightforward: positive macro descriptors are offset by negative thirteen-week returns and weak absolute momentum, leaving MOO to carry the flag on mean-reversion setup quality alone. Disinflation pressure is active (-8), a headwind that directly opposes the commodity-positive narrative; Goldilocks supports the category, but the risk-appetite regime is not yet sustaining fresh flows into food producers. To earn top-2 or tier-1 status: Agriculture needs either a commodity-price bounce that lifts breadth into MOO's resistance zone without extension, or a shift in active descriptors that swaps commodity breadth positive for real-asset sponsorship dominance. The 5% allocation is a tactical position on support-bounce timing rather than a conviction hold on agricultural fundamentals.
Nuclear Energy — URA
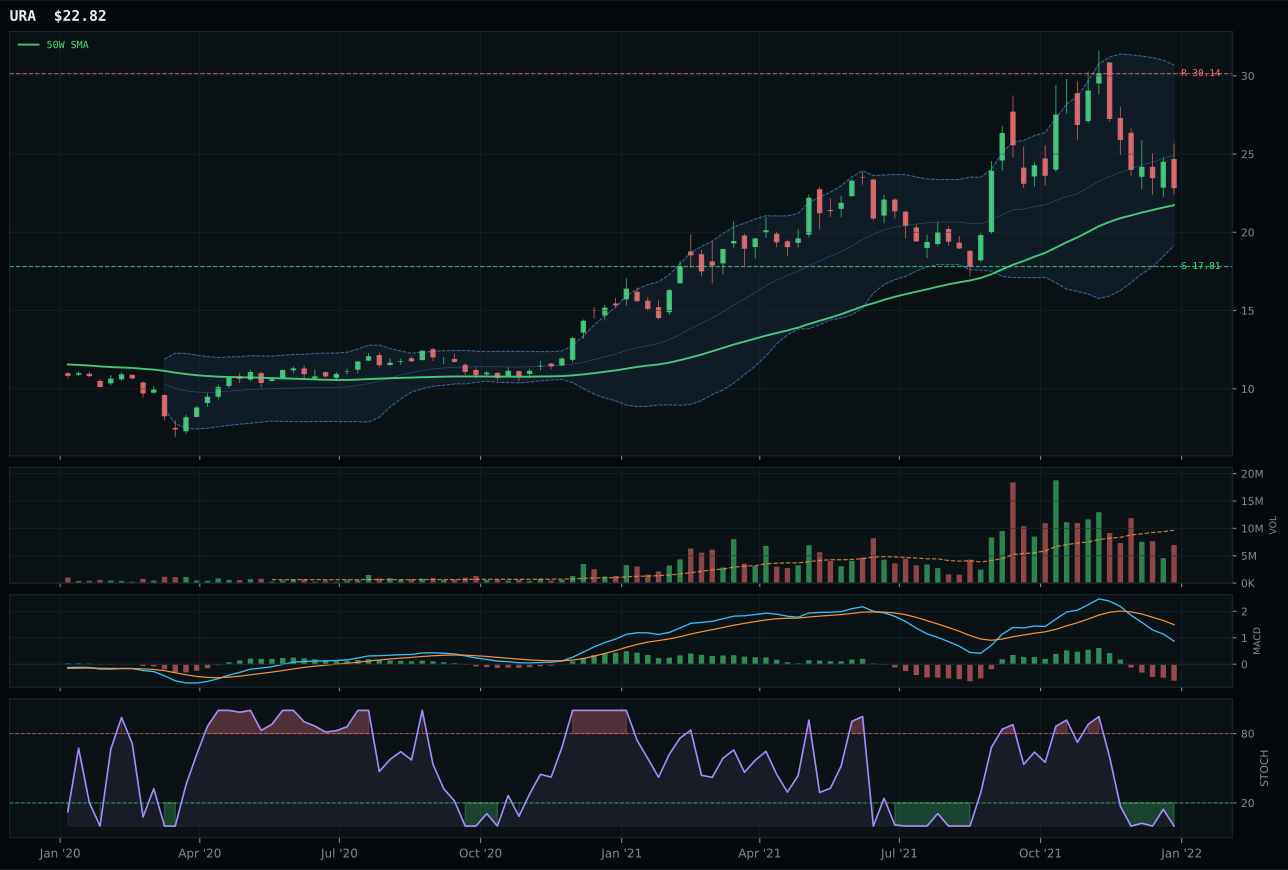
URA has a neutral structure profile with -15.4% 13-week relative strength versus SPY.
A failed hold above support would weaken the setup.
Actionable but governed by invalidation levels.
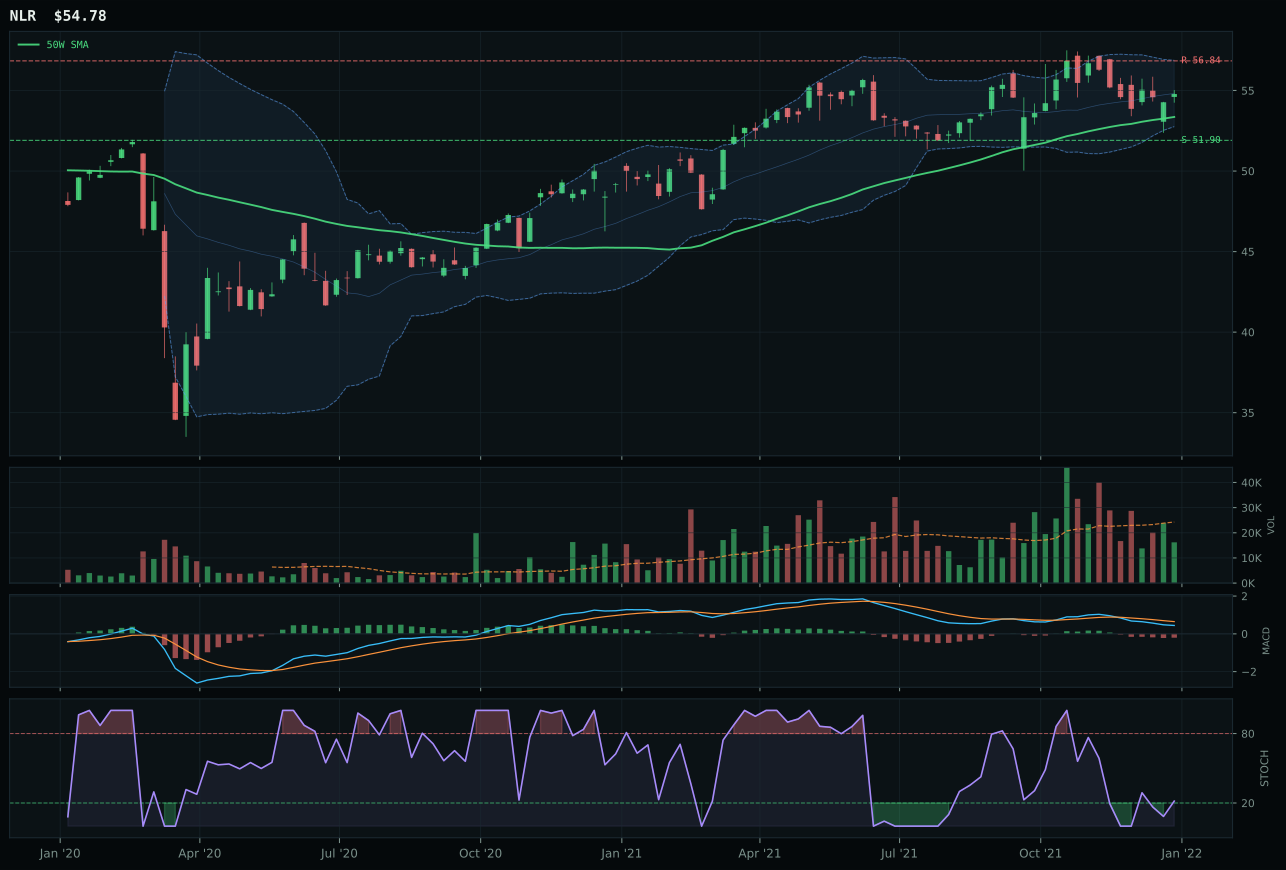
NLR has a compression near 50W profile with -7.2% 13-week relative strength versus SPY.
A failed hold above support would weaken the setup.
Tracked, but not top-2 eligible because: .
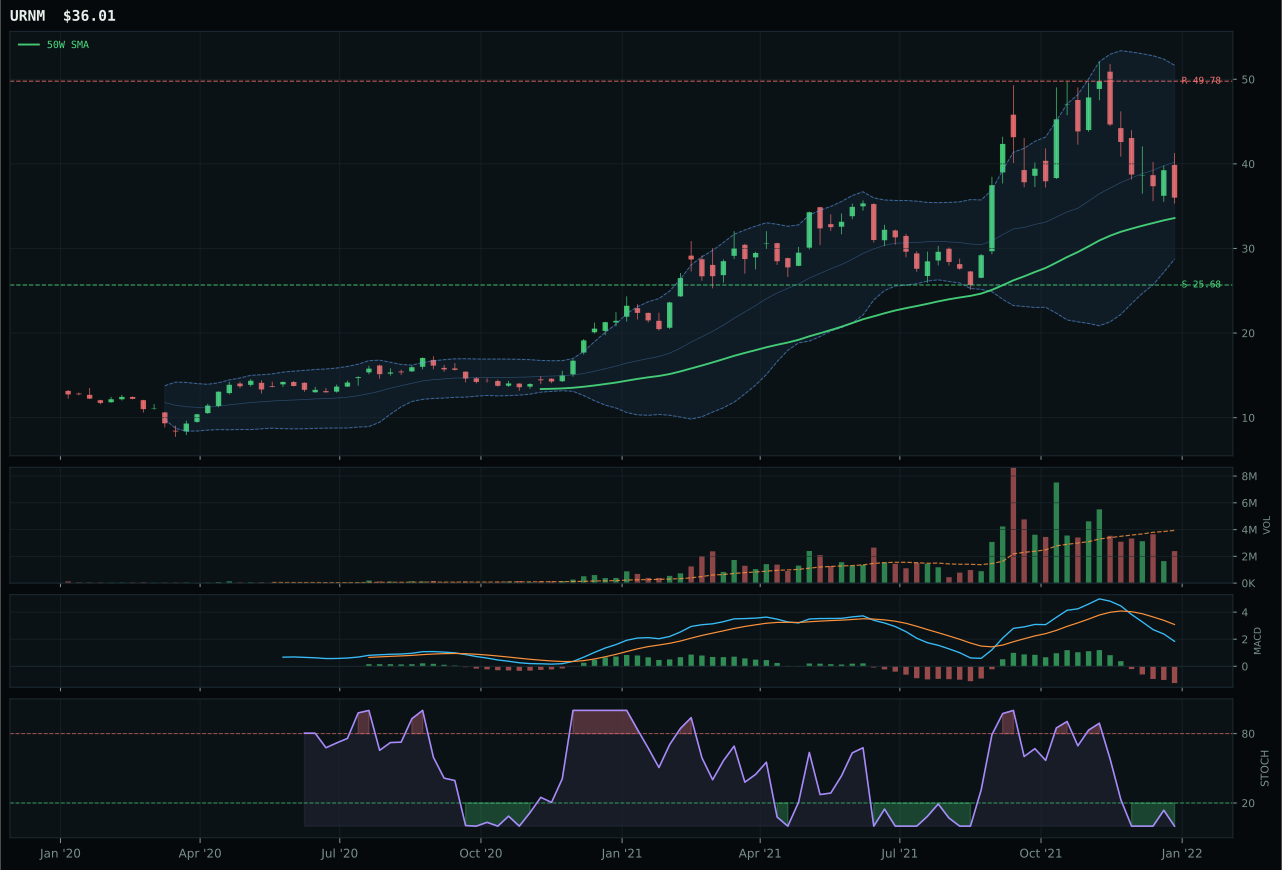
URNM has a neutral structure profile with -18.1% 13-week relative strength versus SPY.
A failed hold above support would weaken the setup.
Actionable but governed by invalidation levels.
URA won the nuclear category but earned 0% allocation, a technical victory that masks fundamental exclusion from the portfolio. Despite edging NLR by 2.5 points in the reasoned proof order, URA's technical evidence is only 20.4/100, reflecting a thirteen-week return of -6.0%, SPY-relative strength of -15.4%, and a stochastic RSI at 0.00 (completely oversold) while MACD remains bearish and weakening. The momentum confirmation score of 0.0/100 is the second-lowest in the entire portfolio, evidence that neither price nor volume is confirming any recovery thesis. NLR (runner-up) carries a superior 45.0 technical evidence composite and shows thirteen-week return of +2.2%, yet even that technical improvement cannot overcome the category's macro indifference: the macro fit is 57.0/100, weighted against a Goldilocks regime that is not yet sponsoring nuclear exposure. Price sits 24.3% below resistance and offers no defined upside path, making this a distressed asset masquerading as infrastructure. The category descriptors offer no nuclear-specific tailwind, leaving the setup entirely dependent on price-based mean reversion.
Nuclear Energy earns 0% allocation this week, ranked outside the tier-2 threshold with a final score of 33.2 that places it among the portfolio's weakest categories. The 57.0/100 macro fit and 20.4 technical evidence for the winner create a mismatch that cannot be reconciled: URA lacks momentum confirmation (0.0/100), carries the third-worst thirteen-week return in the portfolio at -6.0%, and offers no clear entry point. Real-asset sponsorship (+7) and ai-growth-sponsorship (+5) are weak positives overwhelmed by credit stress (-5) and the complete absence of nuclear-specific macro descriptors. What would restore nuclear to tier-2 at minimum: either a technical setup where stochastic RSI climbs out of oversold territory and MACD shows green prints confirming accumulation, or a macro pivot toward energy transition and grid modernization that upgrades category sponsorship. For now, energy transition narratives favor wind, solar, and grid infrastructure (captured via XLU and infrastructure names) rather than nuclear, leaving URA and the category as orphans. Reallocation should only occur when price breaks above mid-range technical resistance and macro descriptors explicitly shift to upgrade energy-security themes.
Traditional Energy — XOP
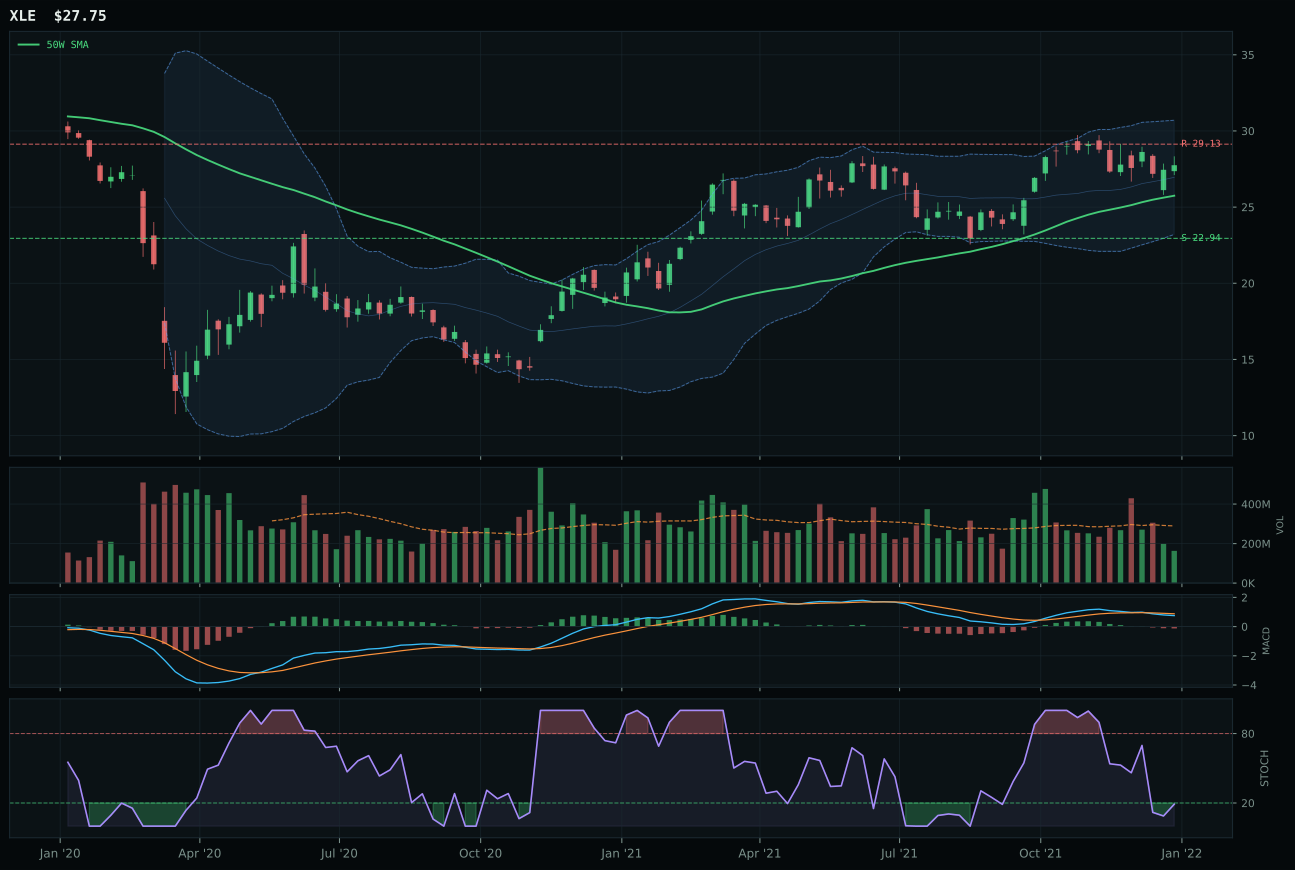
XLE has a neutral structure profile with -6.3% 13-week relative strength versus SPY.
A failed hold above support would weaken the setup.
Actionable but governed by invalidation levels.
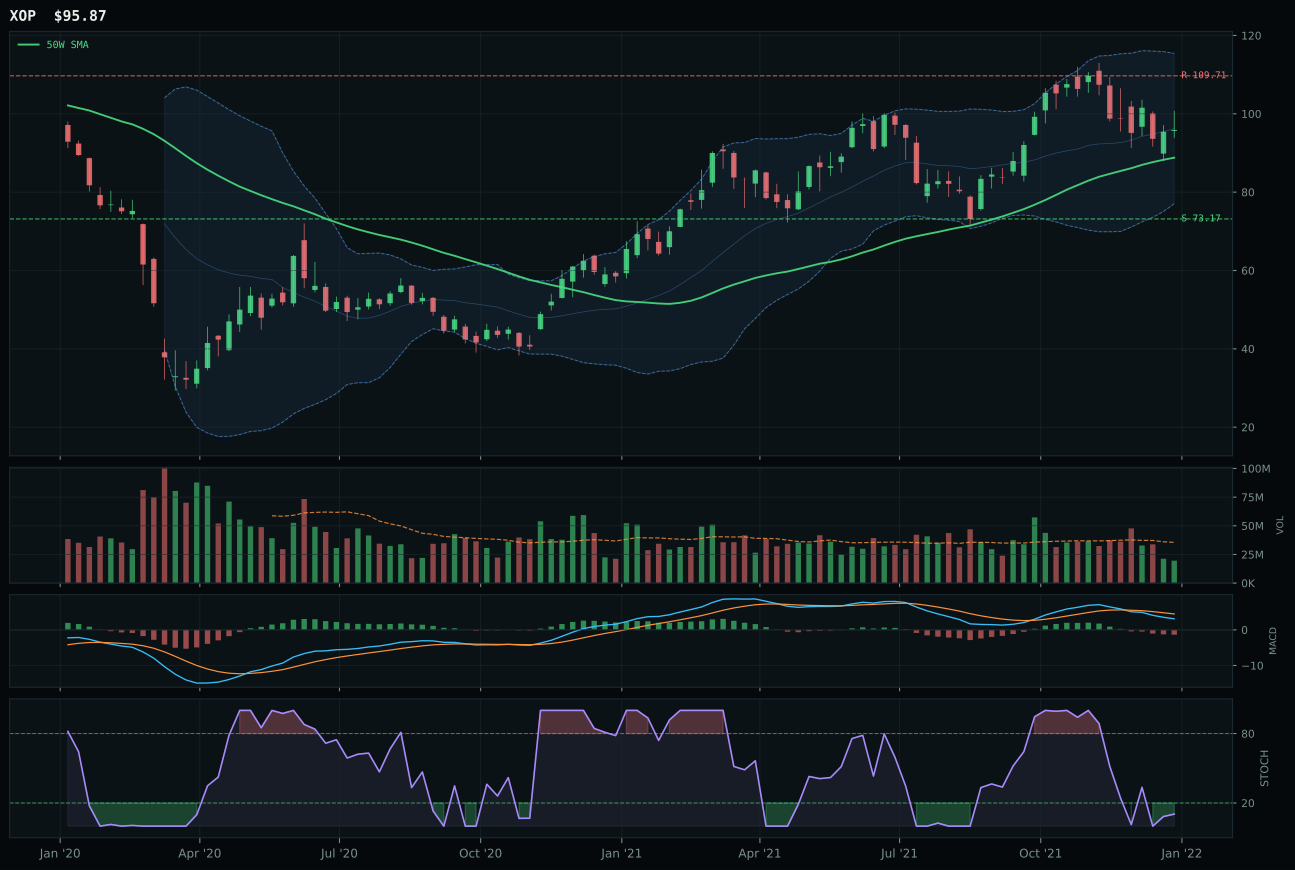
XOP has a neutral structure profile with -12.8% 13-week relative strength versus SPY.
A failed hold above support would weaken the setup.
Actionable but governed by invalidation levels.
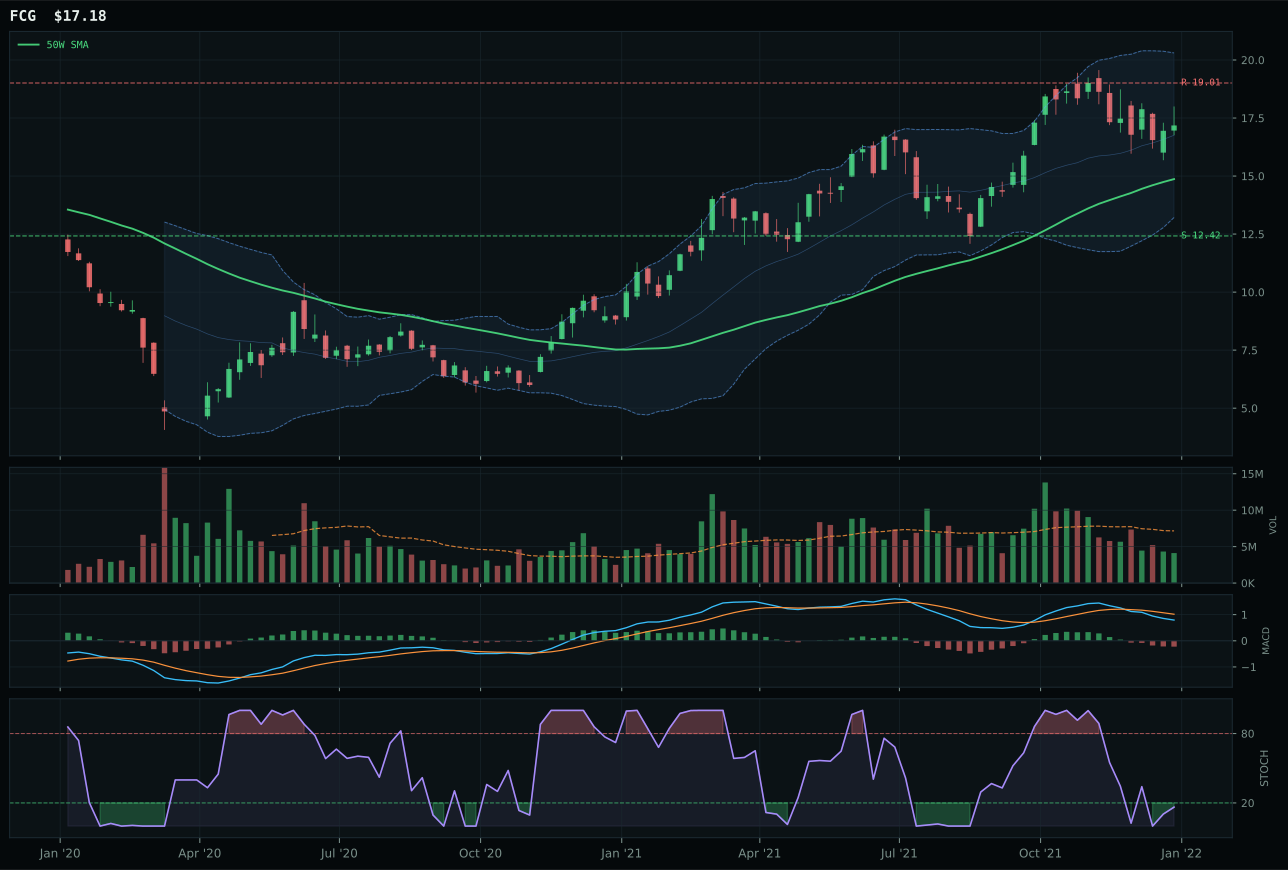
FCG has a vertical extension profile with -10.1% 13-week relative strength versus SPY.
A failed hold above support would weaken the setup.
Actionable but governed by invalidation levels.
XOP won the energy category but earned 0% allocation, a harsh reality reflecting the tier-2 exclusion driven by catastrophic fundamental weakness. Despite claiming the victory over XLE, XOP's technical evidence is only 19.4/100, the lowest composite in the entire portfolio: thirteen-week return is negative at -3.4%, SPY-relative strength is -12.8%, and the stochastic RSI sits deeply oversold at 0.10 while MACD remains bearish and weakening. The -12.6% upside to resistance and 31% downside to support create asymmetric risk that no macro tailwind can justify. XLE (runner-up) carries a 37.8 technical evidence score and shows 13-week return of +3.1%, yet even that improvement is insufficient to earn allocation when the category macro fit is only 40.0/100. Real-asset sponsorship (+7) and disinflation pressure (-10) net to net-negative, and credit stress (-7) compounds the headwinds. This is a category where the macro regime is actively hostile, and price action is confirming that hostility with weakness.
Traditional Energy earns 0% allocation this week, ranked ninth or tenth depending on the specific tie-breaking criteria, and removed from the portfolio entirely despite XOP's marginal technical win over its peers. The category's 16.4 final score and 40.0/100 macro fit reflect an environment where Goldilocks regime is explicitly non-supportive of commodity-dependent energy exposure; disinflation pressure (-10) and credit stress (-7) combine to suppress both demand expectations and sentiment. XOP's 19.4 technical evidence is a portfolio-low composite, confirming price action is not even attempting to defend support. What would restore energy to allocation: either a significant macro shift toward reflation or real-asset sponsorship, or a technical setup where MACD breaks into bullish territory and stochastic RSI no longer resides at oversold extremes. For now, energy is a crowded shorts book masquerading as a real-asset category. Allocators should only consider reentry if crude oil and natural gas begin to confirm upside MACD divergences and capital flows shift materially. Until that inflection, the 0% allocation is warranted discipline.