
2021-12-24
Informational purposes only. The content in this report, including allocations, analysis, and commentary, is provided solely for informational and educational purposes. It does not constitute financial advice, investment advice, trading advice, or any other type of advice. Past performance does not guarantee future results. Always conduct your own research and consult a qualified financial professional before making investment decisions.
Weekly Allocation
| Ticker | Category | Weight | Role |
|---|---|---|---|
| FBTC | 50% | Overlay | |
| COPX | Industrial Metals | 10% | Top-2 (10%) |
| XLE | Traditional Energy | 10% | Top-2 (10%) |
| XLU | Utilities & Infrastructure | 5% | Tier-2 (5%) |
| GLD | Precious Metals | 5% | Tier-2 (5%) |
| MOO | Agriculture & Livestock | 5% | Tier-2 (5%) |
| XAR | Defense & Aerospace | 5% | Tier-2 (5%) |
| SMH | AI | 5% | Tier-2 (5%) |
| URA | Nuclear Energy | 5% | Tier-2 (5%) |
Trade Instructions — Monday Open
Sell the tranche from 2021-11-26 (completing its 4-week hold). Buy the new tranche. Instructions show net portfolio changes — same-asset positions cancel, weight changes show the delta.
| Action | Ticker | Instruction |
|---|---|---|
| SELL | FSOL | Sell 33% of FSOL position (reduce 37.50% → 25.00%) |
| SELL | XLK | Sell 50% of XLK position (reduce 5.00% → 2.50%) |
| SELL | URNM | Sell entire URNM position (1.25% of portfolio) |
| SELL | PAVE | Sell entire PAVE position (1.25% of portfolio) |
| BUY | COPX | Buy COPX — 7.14% of freed cash (adds 1.25% to portfolio) |
| BUY | XLU | Buy XLU — 7.14% of freed cash (adds 1.25% to portfolio) |
| BUY | URA | Buy URA — 7.14% of freed cash (adds 1.25% to portfolio) |
| BUY | FBTC | Buy FBTC — 71.43% of freed cash (adds 12.50% to portfolio) |
| BUY | XAR | Buy XAR — 7.14% of freed cash (adds 1.25% to portfolio) |
Current Portfolio After Trade
Combined holdings across all 4 active tranches. Each tranche is 25% of the portfolio.
| Ticker | % of Portfolio | Weight Bar |
|---|---|---|
| FSOL | 25.00% | |
| FBTC | 25.00% | |
| XLE | 10.00% | |
| MOO | 6.25% | |
| XLU | 6.25% | |
| GLD | 5.00% | |
| SMH | 5.00% | |
| COPX | 3.75% | |
| PICK | 3.75% | |
| URA | 3.75% | |
| XLK | 2.50% | |
| ITA | 2.50% | |
| XAR | 1.25% |
Macro Regime — Transition / Mixed
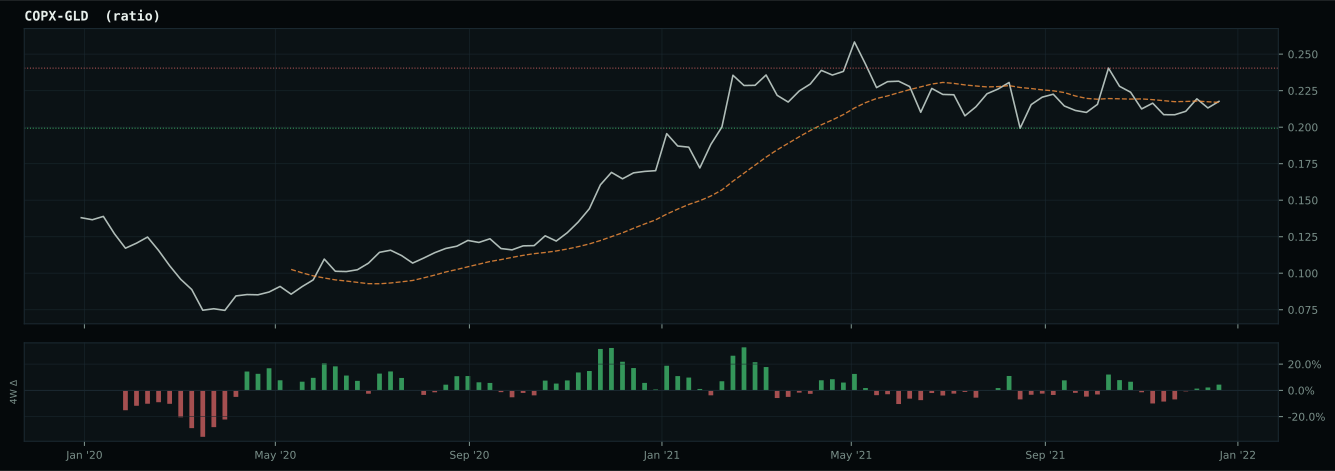
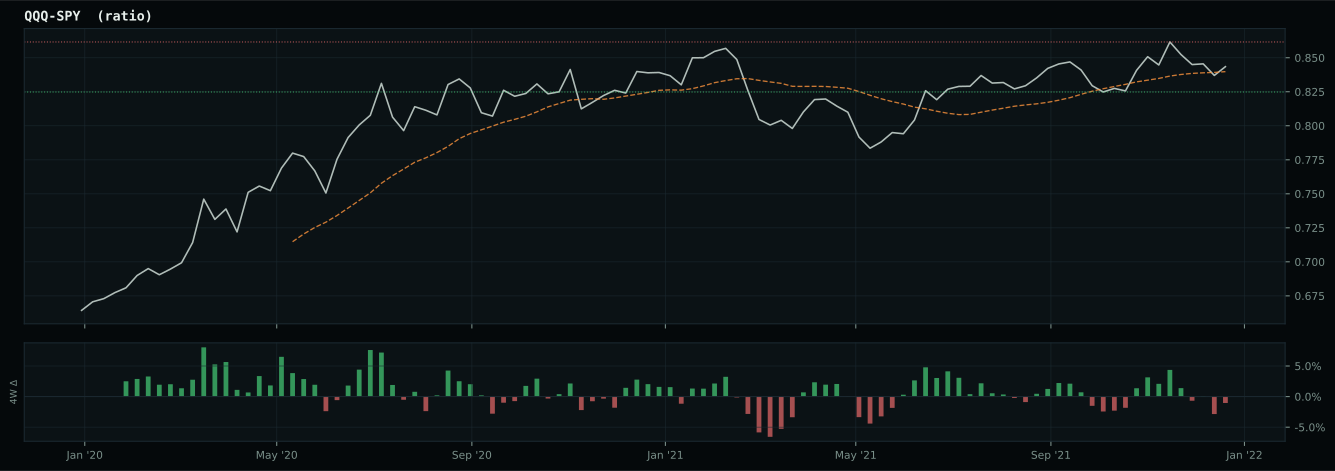
Macro Evidence Charts
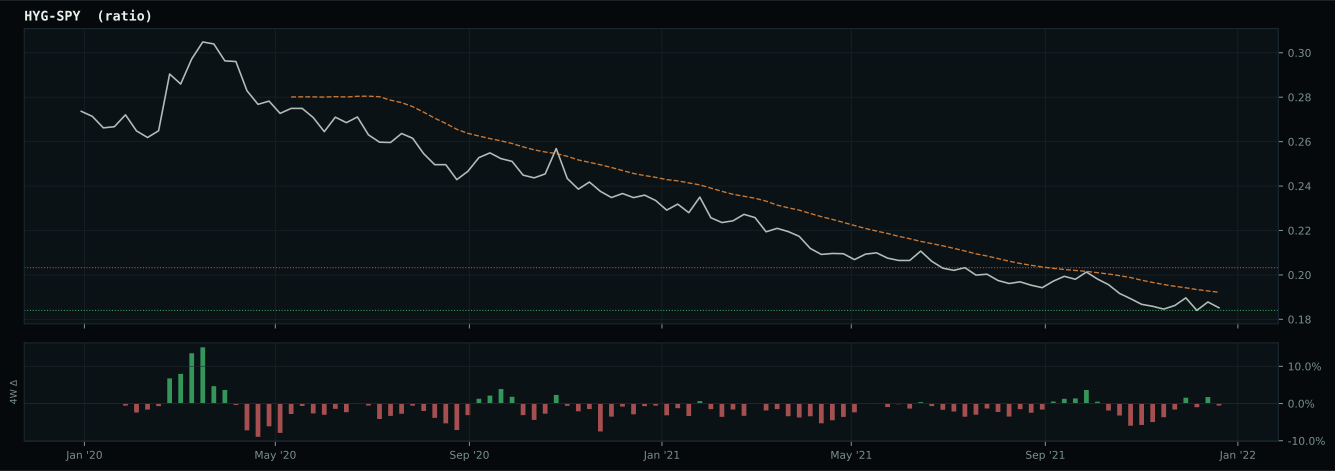
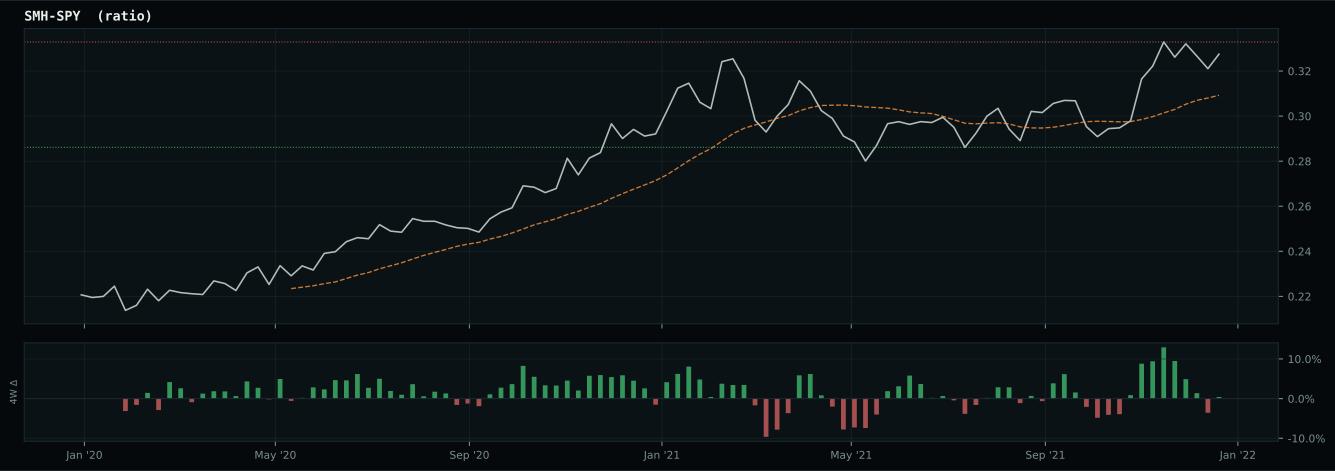
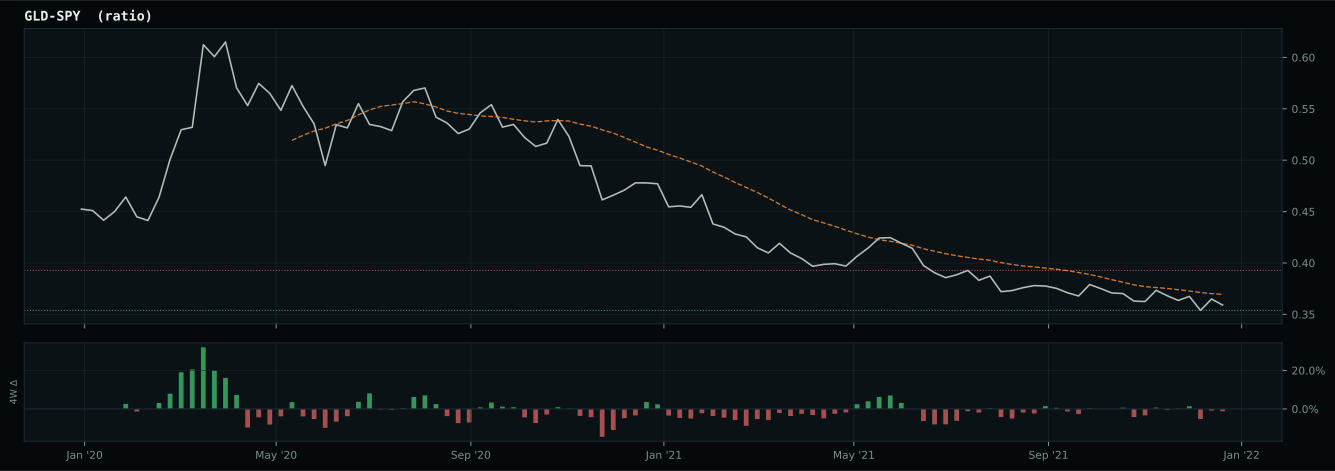
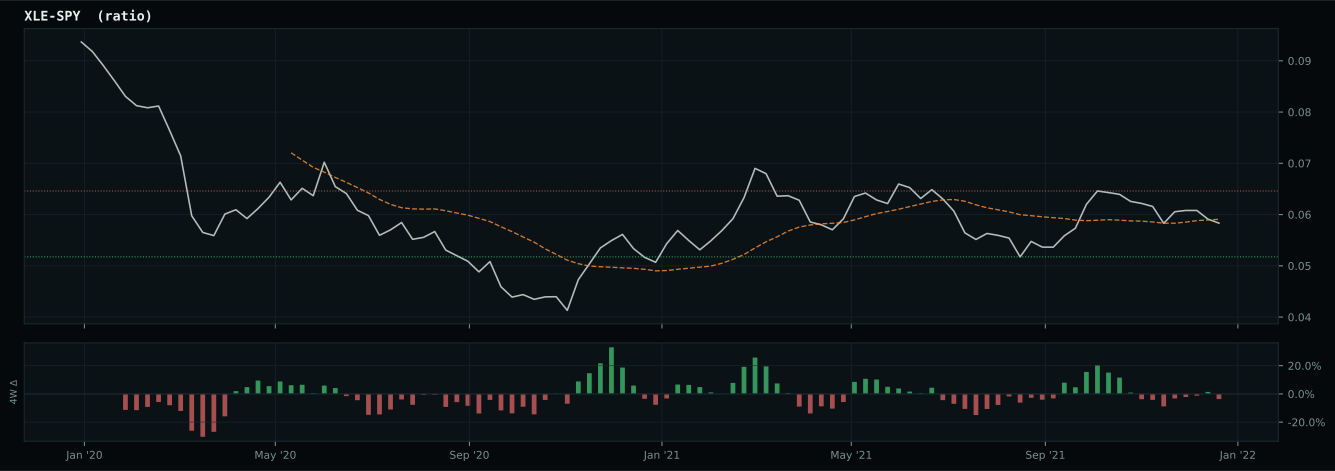
Market-implied signals behind the macro regime scores. Each ratio compares two assets; the direction and slope of the ratio is what the macro engine reads.
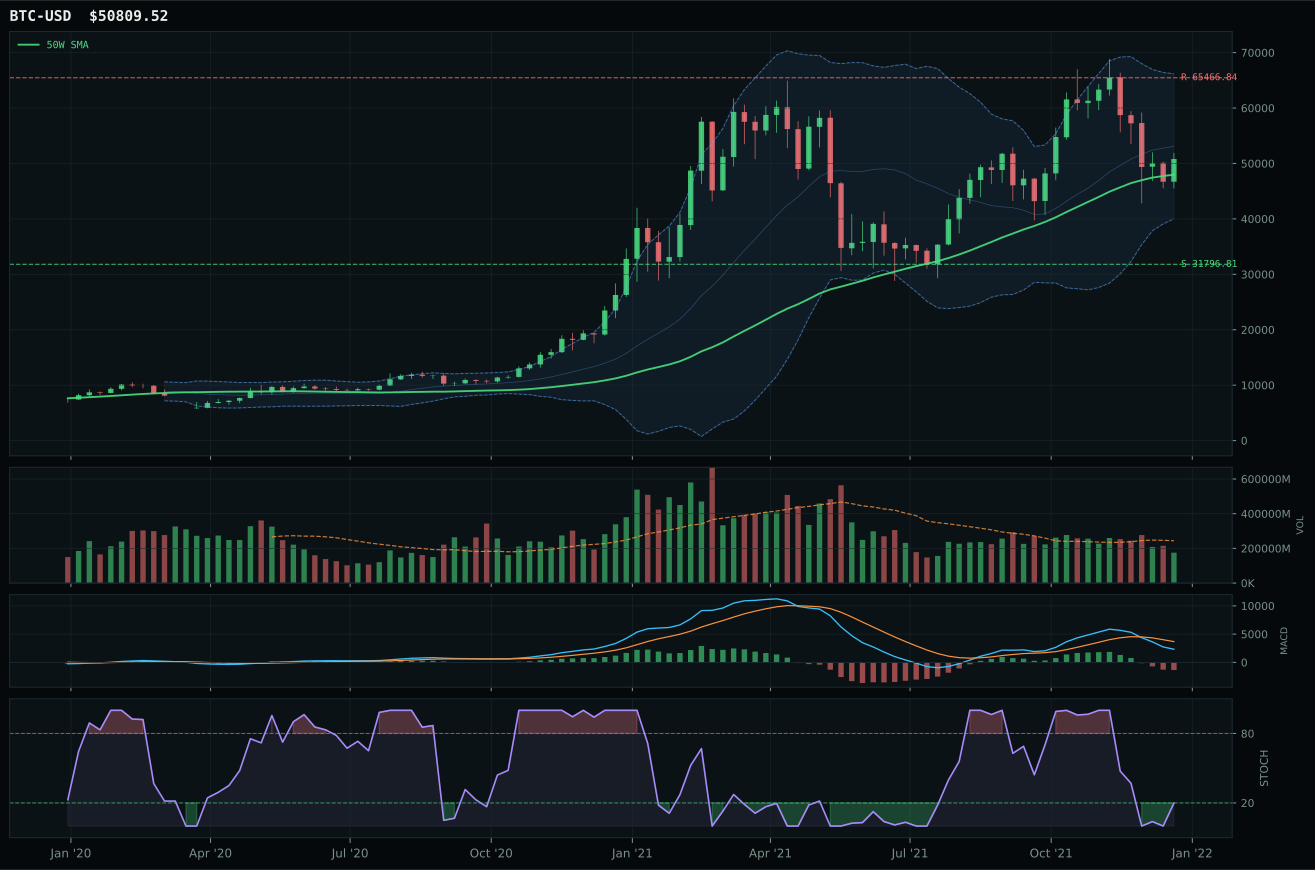
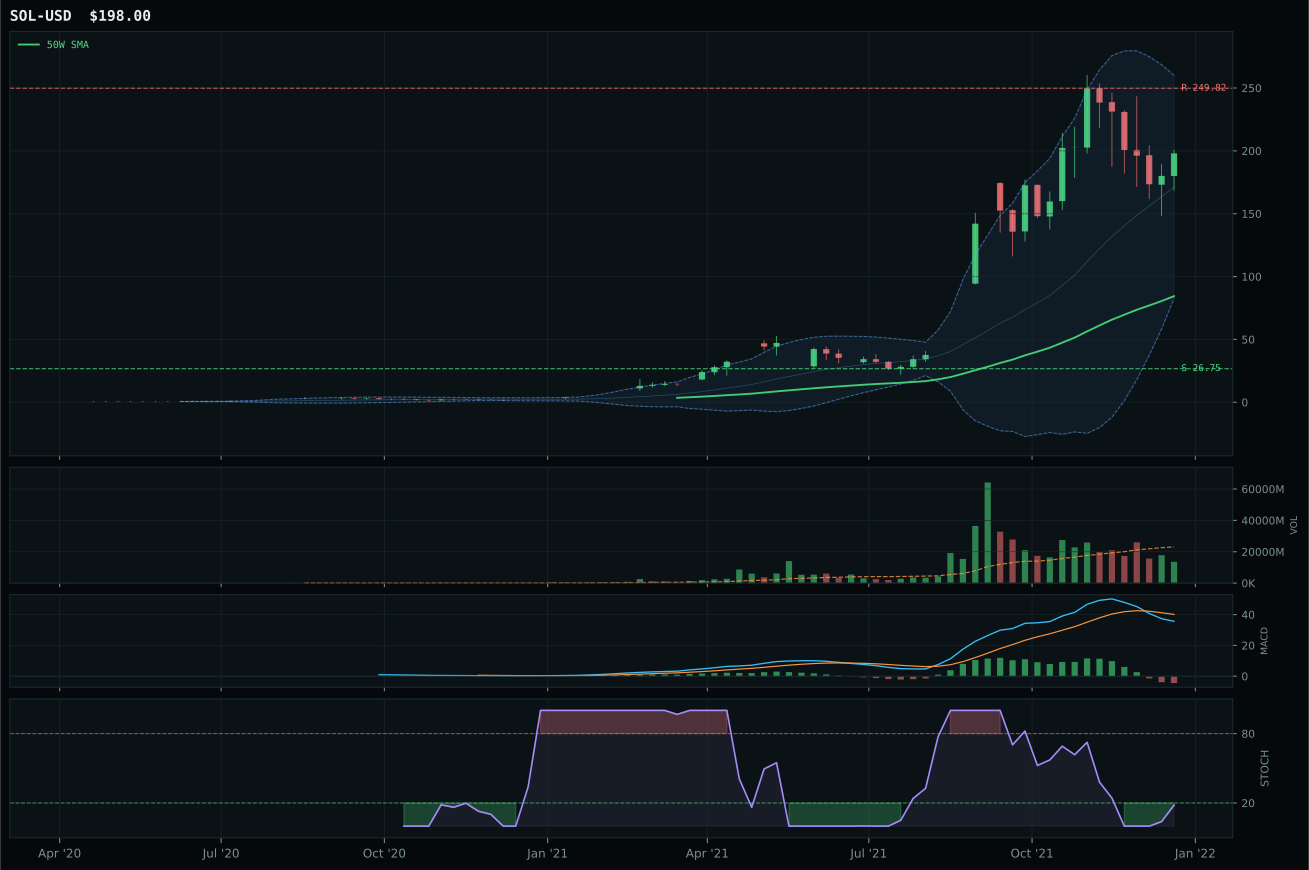
Crypto Regime — TrendBTC
ValueBTC not armed: BTC has not made the first post-breakdown touch of the 200W buy zone after losing the 50W
TrendBTC not confirmed
one or more available conditions failed
Category Rankings
| Rank | Category | Winner | Score | Alloc | 4W Ret | Peers (4W) |
|---|---|---|---|---|---|---|
| 1 | Industrial Metals | COPX | 59.5 | 20% | +2.69% | PICK +2.0% · REMX -6.1% |
| 2 | Traditional Energy | XLE | 56.5 | 20% | +11.42% | FCG +3.8% · XOP +1.5% |
| 3 | Utilities & Infrastructure | XLU | 53.5 | 10% | -1.42% | PAVE -9.1% · IGF -0.9% |
| 4 | Precious Metals | GLD | 53.0 | 10% | +1.67% | GDX +1.1% · SLV +3.9% |
| 5 | Agriculture & Livestock | MOO | 49.3 | 10% | -4.01% | VEGI -0.6% · WEAT -4.4% |
| 6 | Defense & Aerospace | XAR | 40.6 | 10% | -5.49% | ITA -1.4% · ROKT -5.6% |
| 7 | AI | SMH | 40.5 | 10% | -13.94% | AIQ -14.6% · BOTZ -21.3% |
| 8 | Nuclear Energy | URA | 38.6 | 10% | -20.62% | NLR -3.7% · URNM -23.0% |
| 9 | Technology | XLK | 33.6 | 0% | -12.60% | CIBR -13.6% · IGV -17.6% |
| 10 | Emerging Markets | INDA | 1.6 | 0% | -1.18% | IEMG -1.3% · ILF +5.2% |
Industrial Metals — COPX
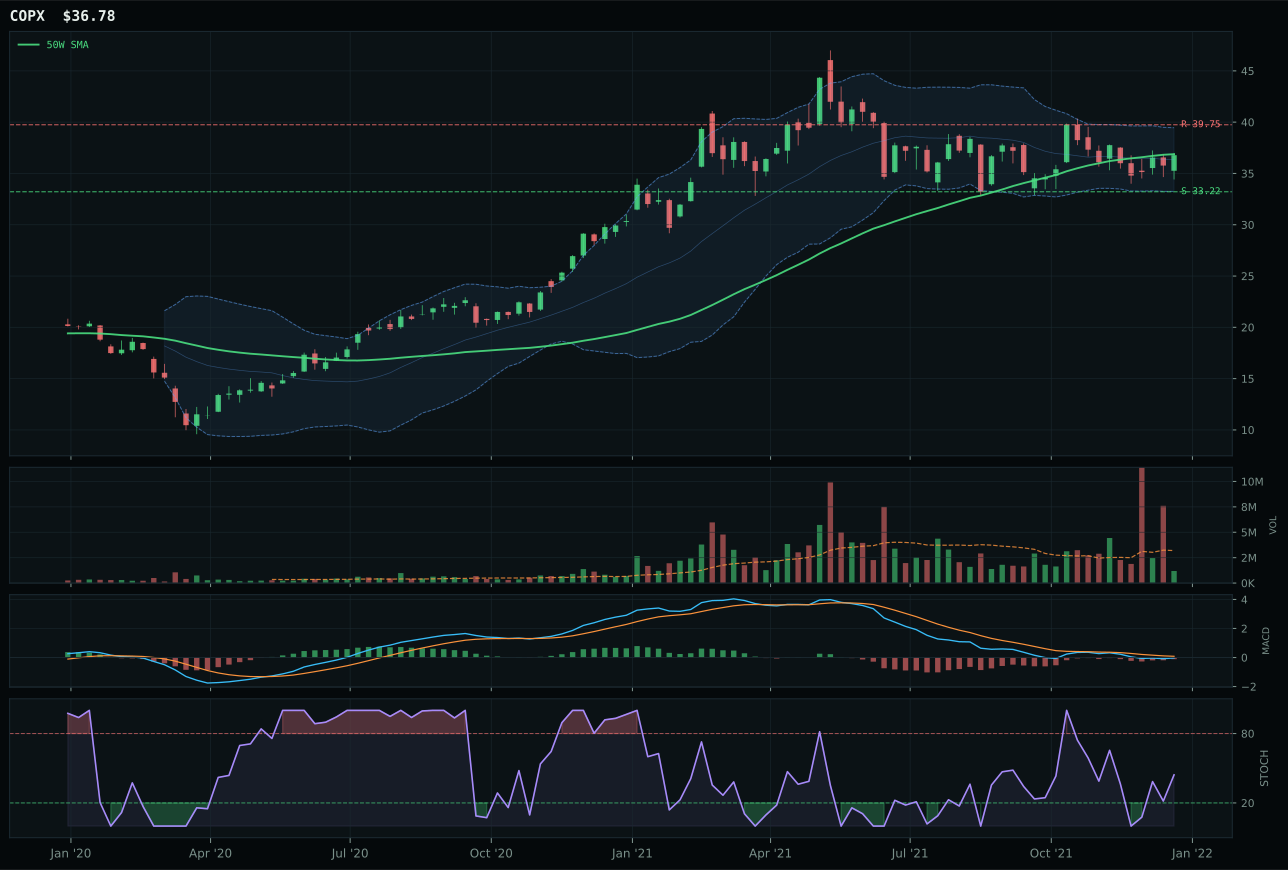
COPX has a compression near 50W profile with 0.5% 13-week relative strength versus SPY.
A failed hold above support would weaken the setup.
Actionable but governed by invalidation levels.
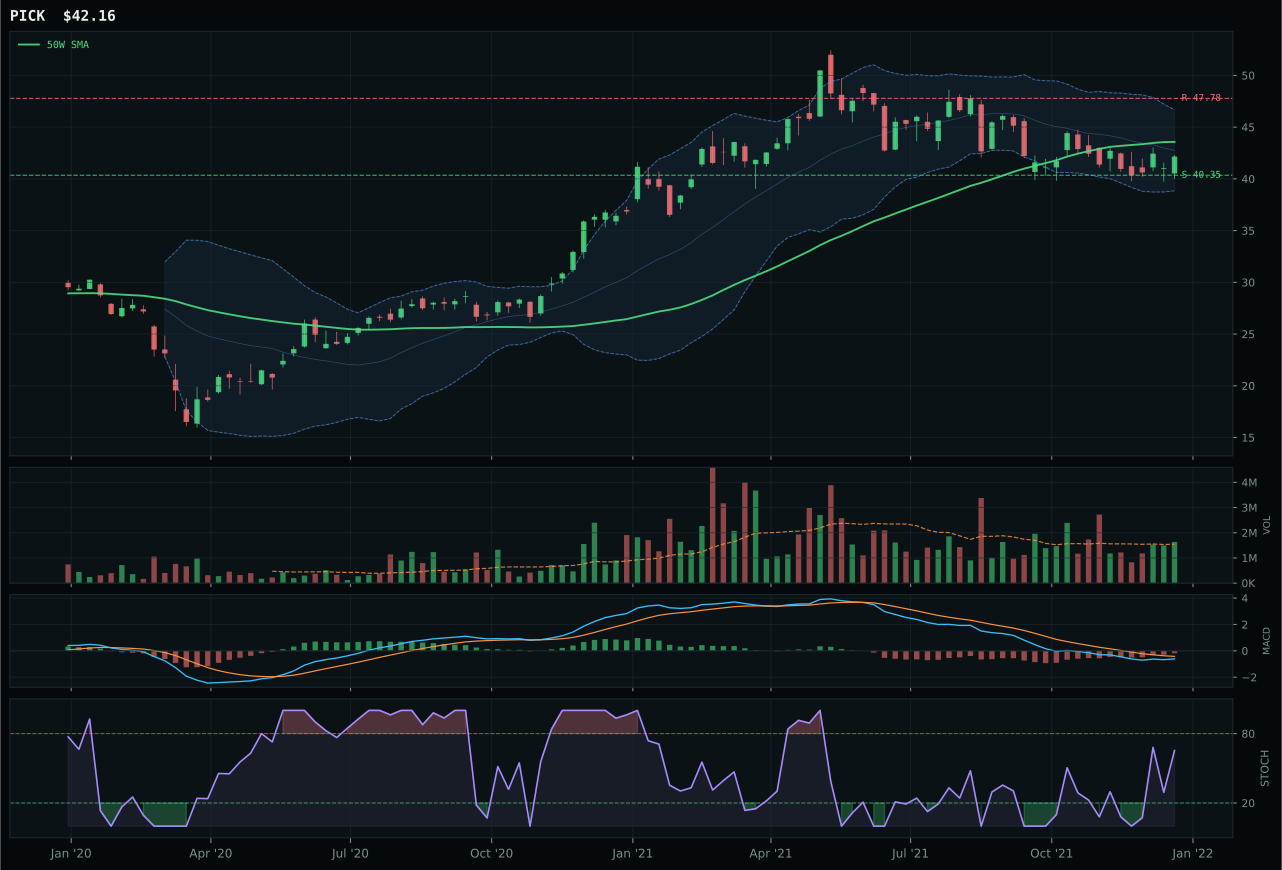
PICK has a pullback into support profile with -4.6% 13-week relative strength versus SPY.
A failed hold above support would weaken the setup.
Actionable but governed by invalidation levels.
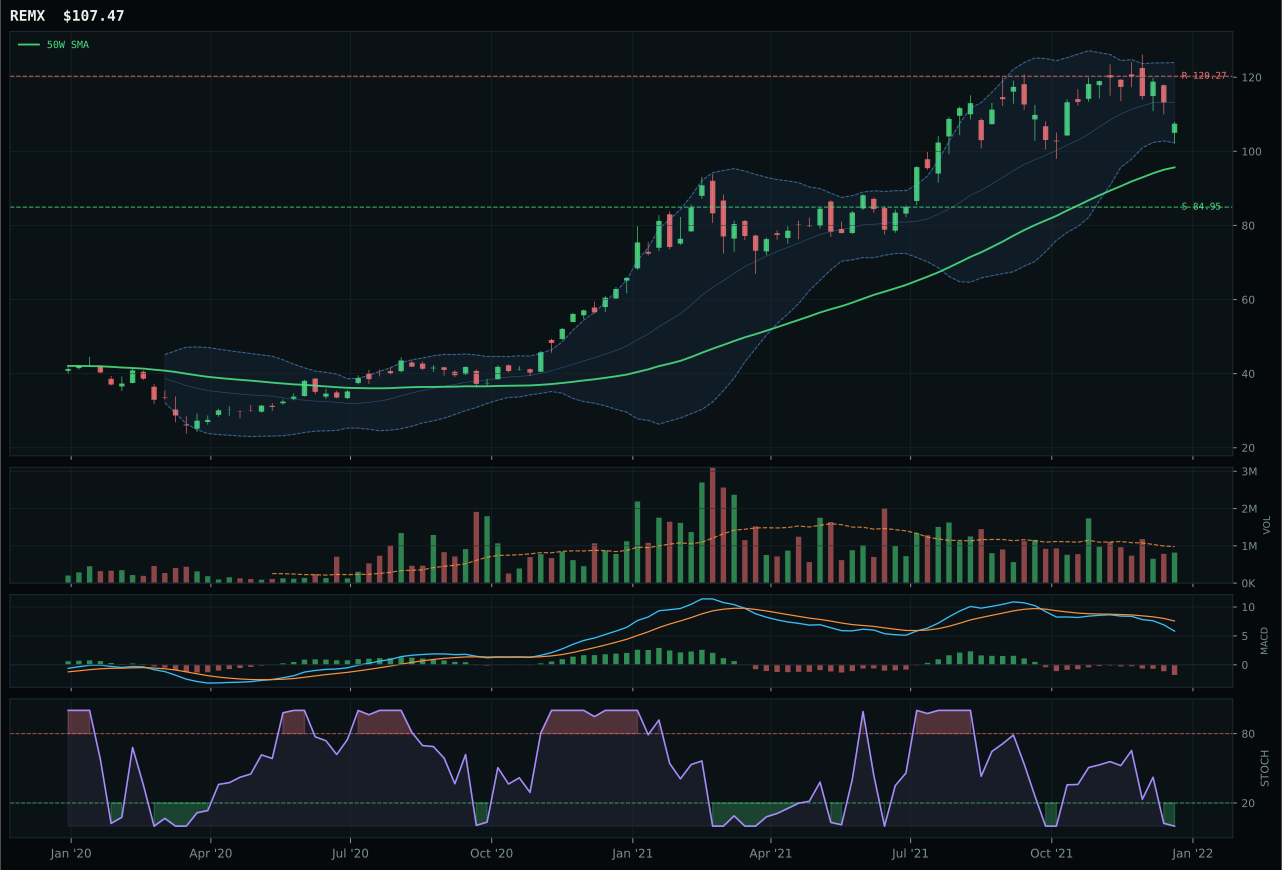
REMX has a neutral structure profile with -8.2% 13-week relative strength versus SPY.
A failed hold above support would weaken the setup.
Actionable but governed by invalidation levels.
COPX earned its top-2 slot by posting 71.7/100 momentum confirmation and 5.1% category-relative strength while compressed near the 50W at just -0.3% distance, creating a coil setup with defined expansion potential if buyers defend support at 33.22. MACD reads bearish but improving—not deteriorating—and compression at 67.3/100 paired with perfect timing (100/100) tells the story of a held level gathering force. The 13W return of 6.5% against SPY's broader gains reveals copper insiders are rotating into this asset despite flat macro setup; category-relative strength of 5.1% versus PICK's 0.0% proves COPX is winning the peer battle. Risk/reward (65.5/100) shows 10.7% downside cushion and only 7.5% upside constraint, inverse to many extended setups, making this a patient coil rather than a crowded chase. PICK's near-identical composite (82 vs 82) masks a critical deficiency: category-relative strength flatlined at 0.0%, and its pullback-into-support structure offers less mechanical clarity than COPX's compression-near-50W setup. The -0.2 point score gap is tight, but metals scarcity sponsorship (+14 macro points) actively favors copper specification over broad mining beta.
Traditional Energy — XLE
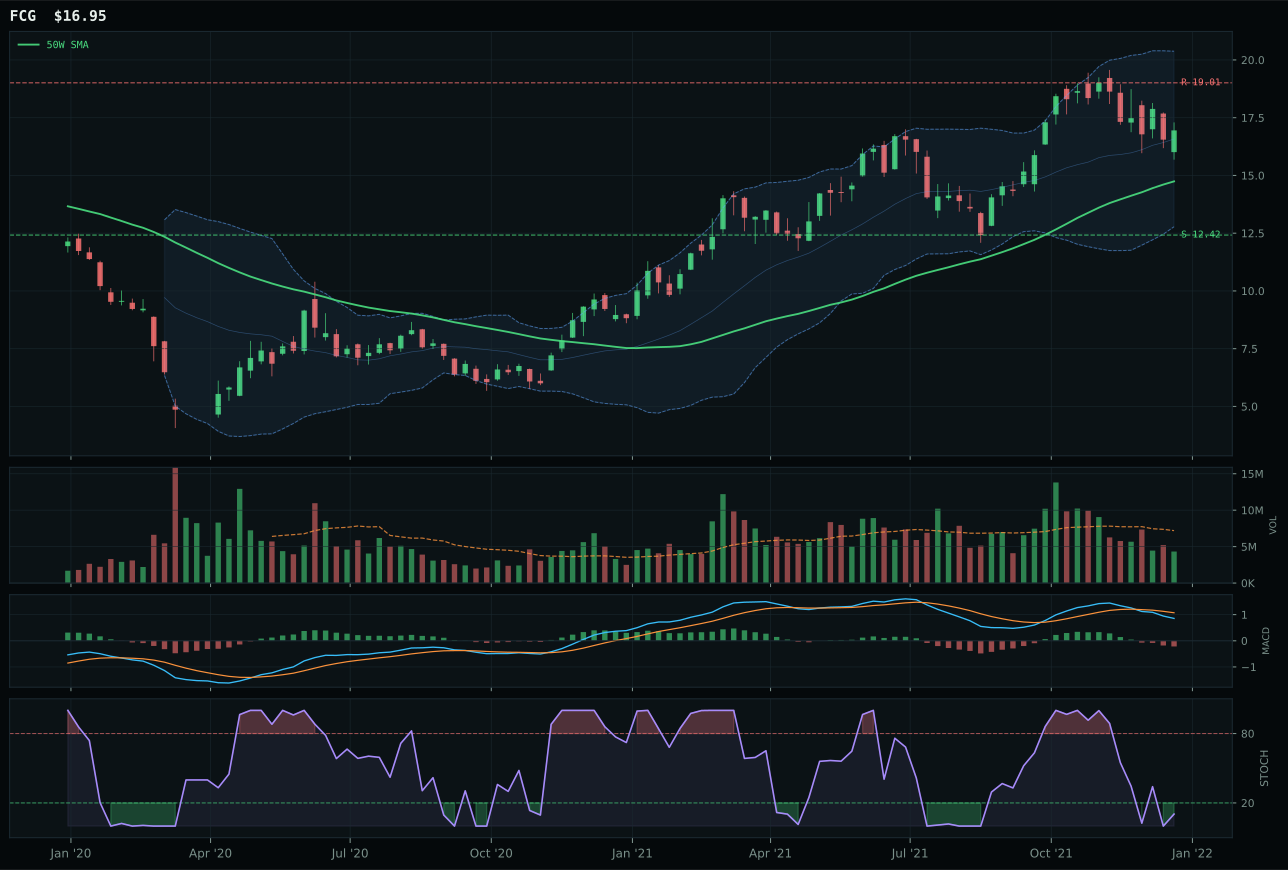
FCG has a neutral structure profile with 0.7% 13-week relative strength versus SPY.
A failed hold above support would weaken the setup.
Actionable but governed by invalidation levels.
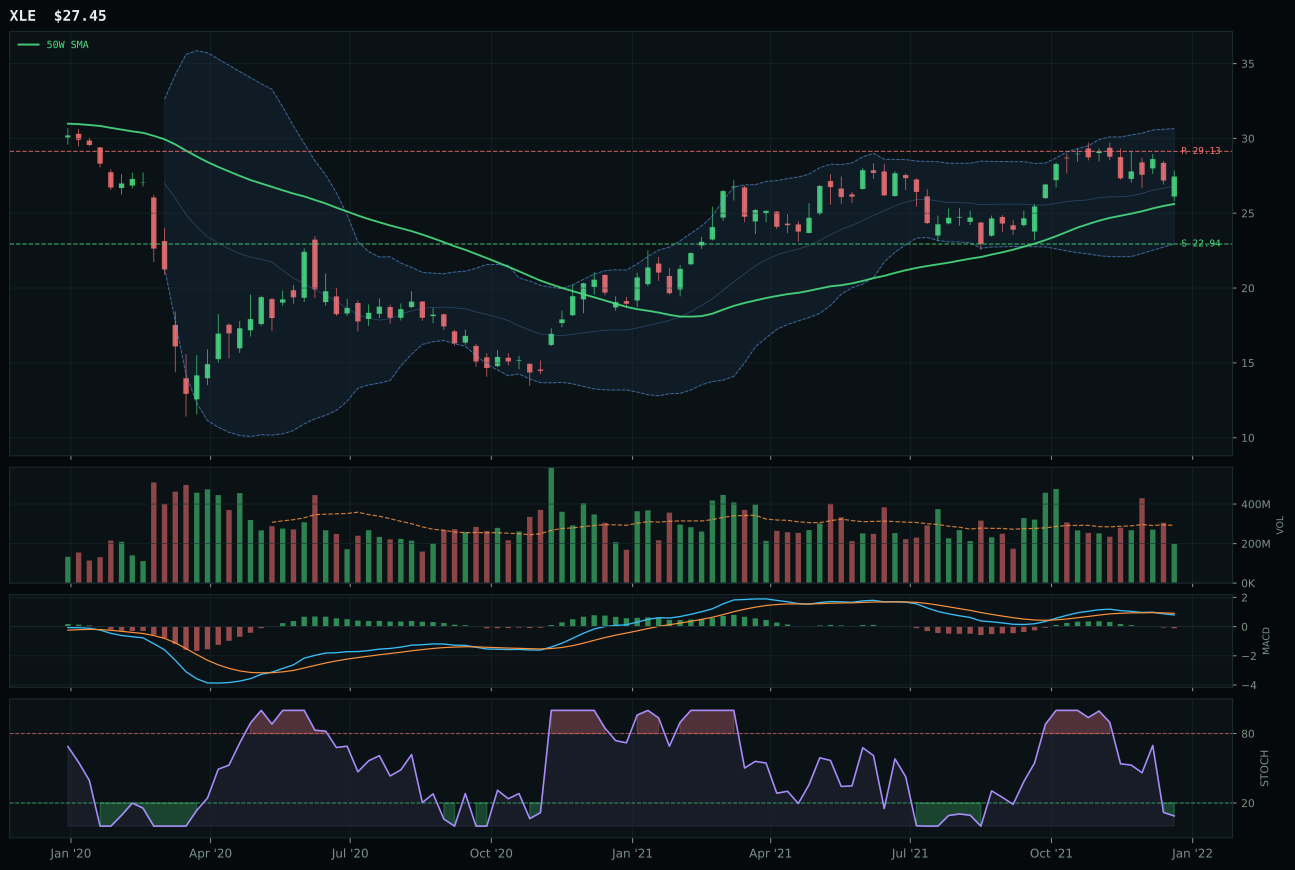
XLE has a neutral structure profile with 1.8% 13-week relative strength versus SPY.
A failed hold above support would weaken the setup.
Actionable but governed by invalidation levels.
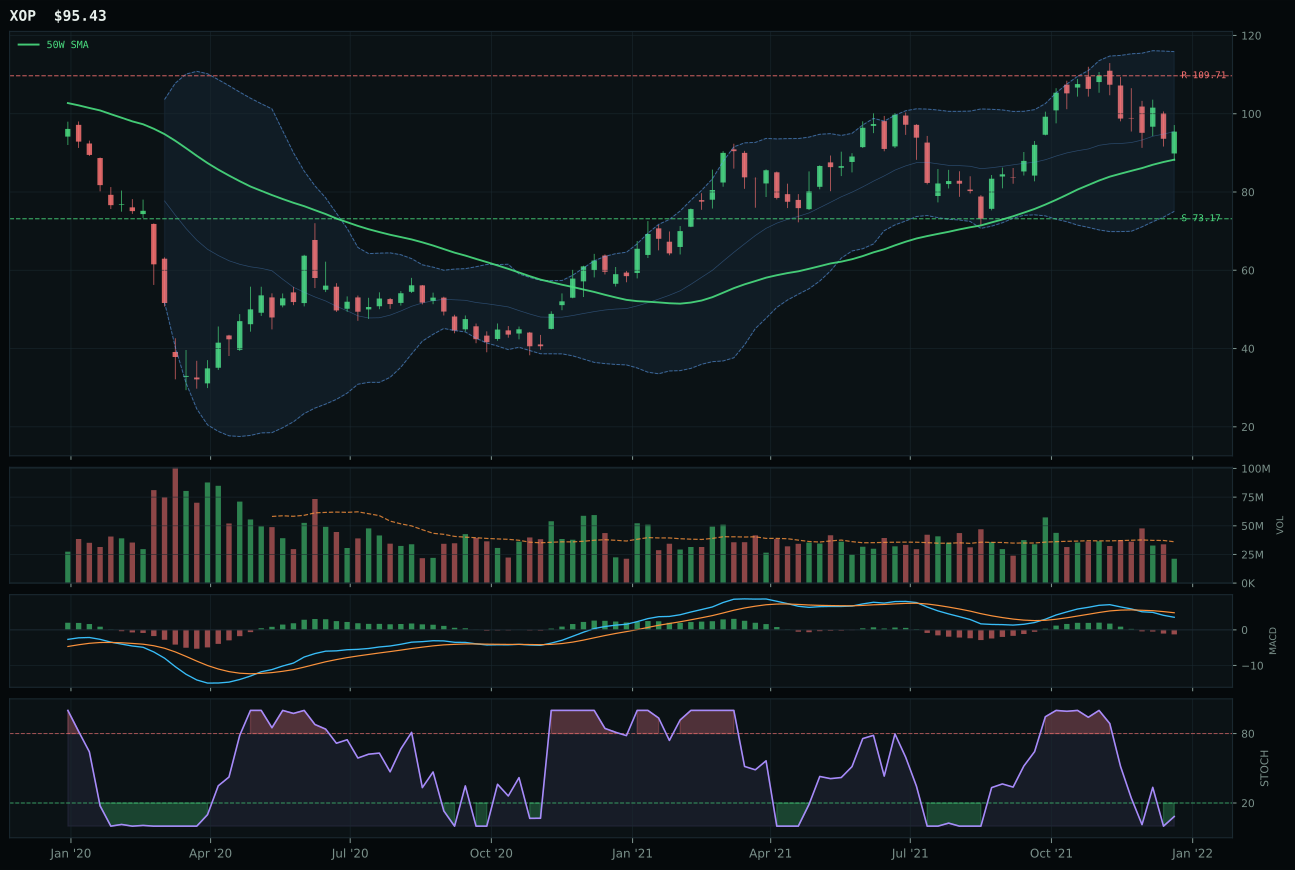
XOP has a neutral structure profile with -2.3% 13-week relative strength versus SPY.
A failed hold above support would weaken the setup.
Actionable but governed by invalidation levels.
XLE won the traditional energy category with a remarkable 86/100 macro/narrative fit score—the highest in its scoring layer—driven by energy scarcity (+14), inflation pressure (+10), supply shortage (+9), and real asset sponsorship (+7) all pushing allocators into the complex. Technically, XLE posts neutral structure and sits 7.1% above the 50W in upper-retracement territory, so the allocation is macro-driven rather than momentum-driven; that makes the 40.7/100 momentum confirmation score acceptable given the macro tailwind. Stochastic RSI sits oversold at 0.09, offering a mechanical turn-up signal for entry, though MACD remains bearish/weakening and 4-week returns are negative (-1.2%), confirming this is a catch-falling-knife setup. FCG lost by posting worse risk/reward (35.4 vs 50.3), cleaner structure (64.5 vs 70.5), and trading 15% from the 50W versus XLE's 7.1%, meaning FCG requires more aggressive conviction. The category score (56.5) is tier-2 material only because macro sponsorship is so strong; without the energy scarcity + real asset tailwind, this category would rank much lower given the technical evidence (41/100) remains weak.
Utilities & Infrastructure — XLU
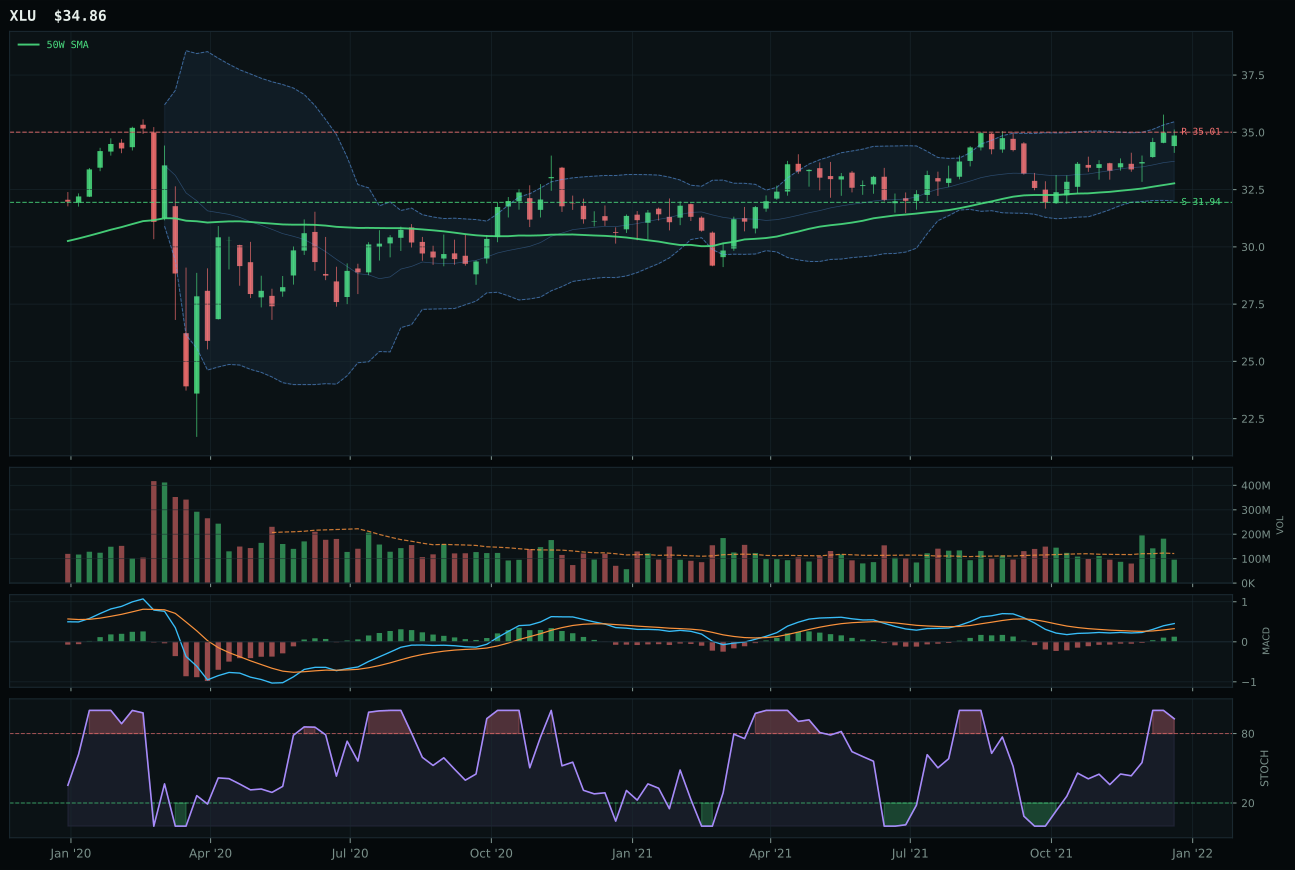
XLU has a neutral structure profile with 1.0% 13-week relative strength versus SPY.
A failed hold above support would weaken the setup.
Actionable but governed by invalidation levels.
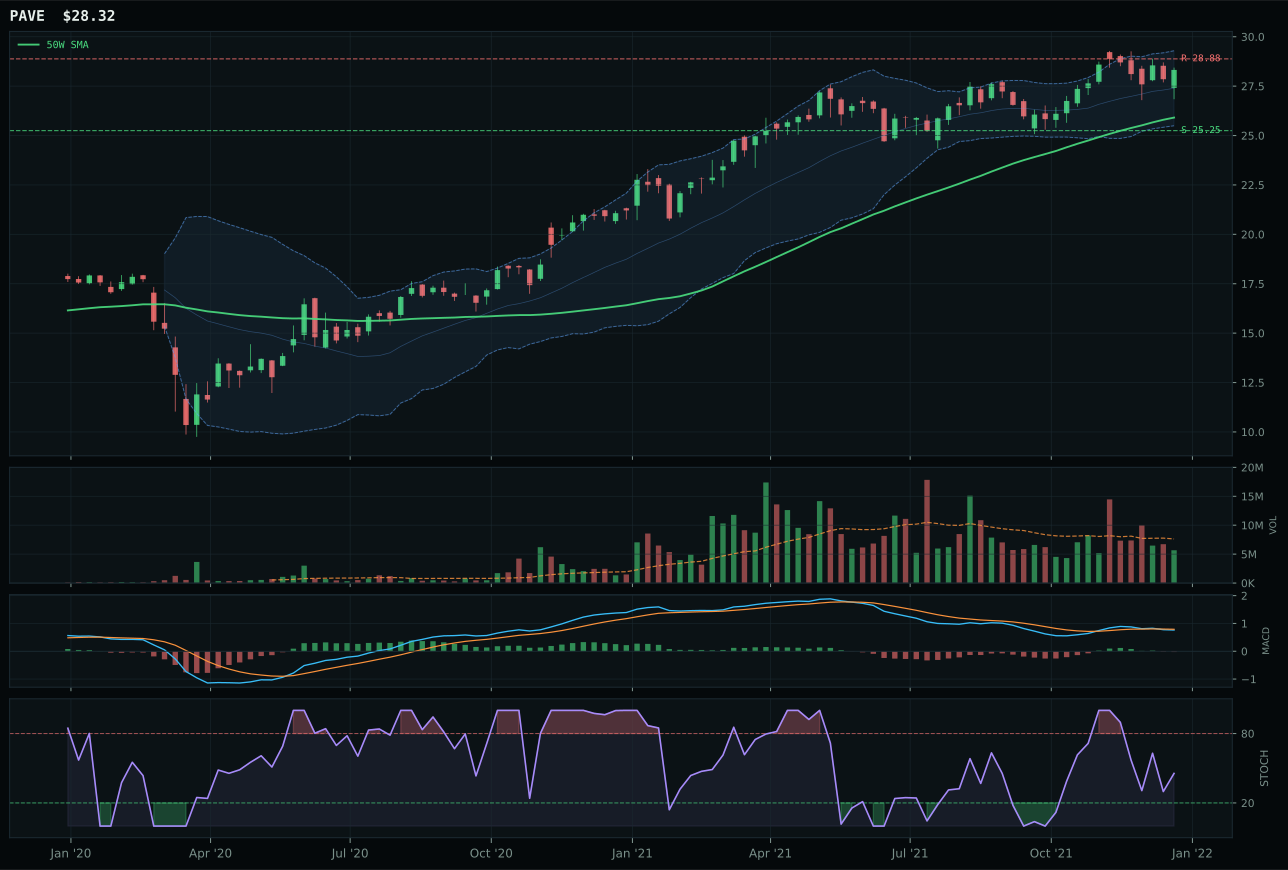
PAVE has a neutral structure profile with 2.7% 13-week relative strength versus SPY.
A failed hold above support would weaken the setup.
Actionable but governed by invalidation levels.
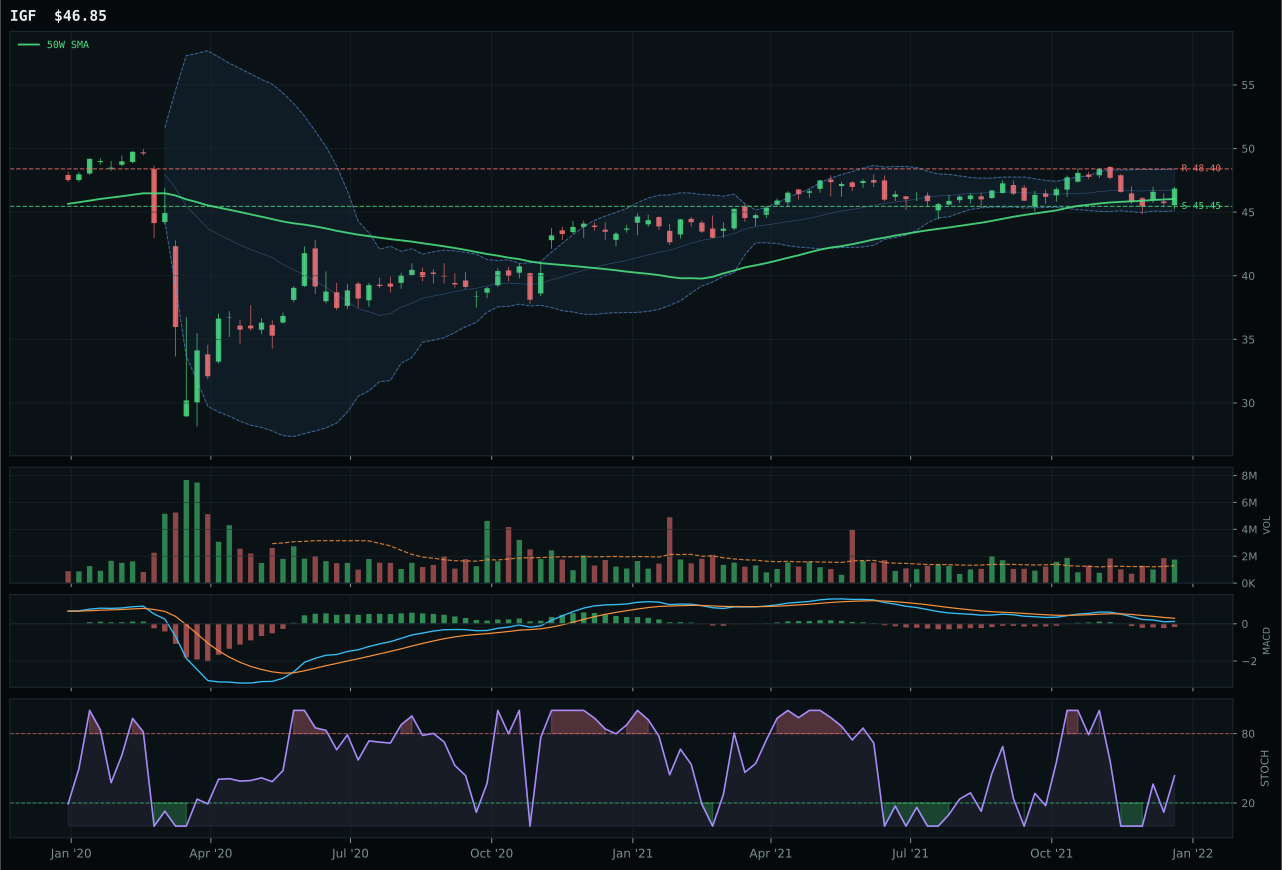
IGF has a pullback into support profile with -4.9% 13-week relative strength versus SPY.
A failed hold above support would weaken the setup.
Actionable but governed by invalidation levels.
XLU dominated utilities & infrastructure by achieving perfect 100/100 trend (price above both moving averages with 0.2% 50W slope) and 78/100 momentum confirmation driven by 7.0% 13W return and bullish-and-improving MACD—the only category representative to post improving MACD momentum this week. The 6.4% distance from the 50W in upper-retracement zone pairs with overbought stochastic momentum (0.93) to create a setup where price confirmation outweighs entry timing concerns; risk/reward (45.8/100) is compressed but acceptable given the trend clarity. Neutral volume (0.79x 20W) and neutral category-relative strength (0.0%) confirm this is a broad utility move, not a concentrated bet. PAVE lost on structure clarity (74.8 vs 78.0), MACD confirmation (bearish/weakening vs bullish and improving), and volume sponsorship (thin participation vs neutral), revealing that infrastructure beta is lagging regulated utility strength in this regime. The 9.4-point gap reflects XLU's rare 100/100 trend score and improving momentum posture, which matter more than PAVE's higher 13W absolute return (8.7% vs 7.0%) when macro backdrop is Transition / Mixed and inflation pressure (-6) is compressing valuations.
Precious Metals — GLD
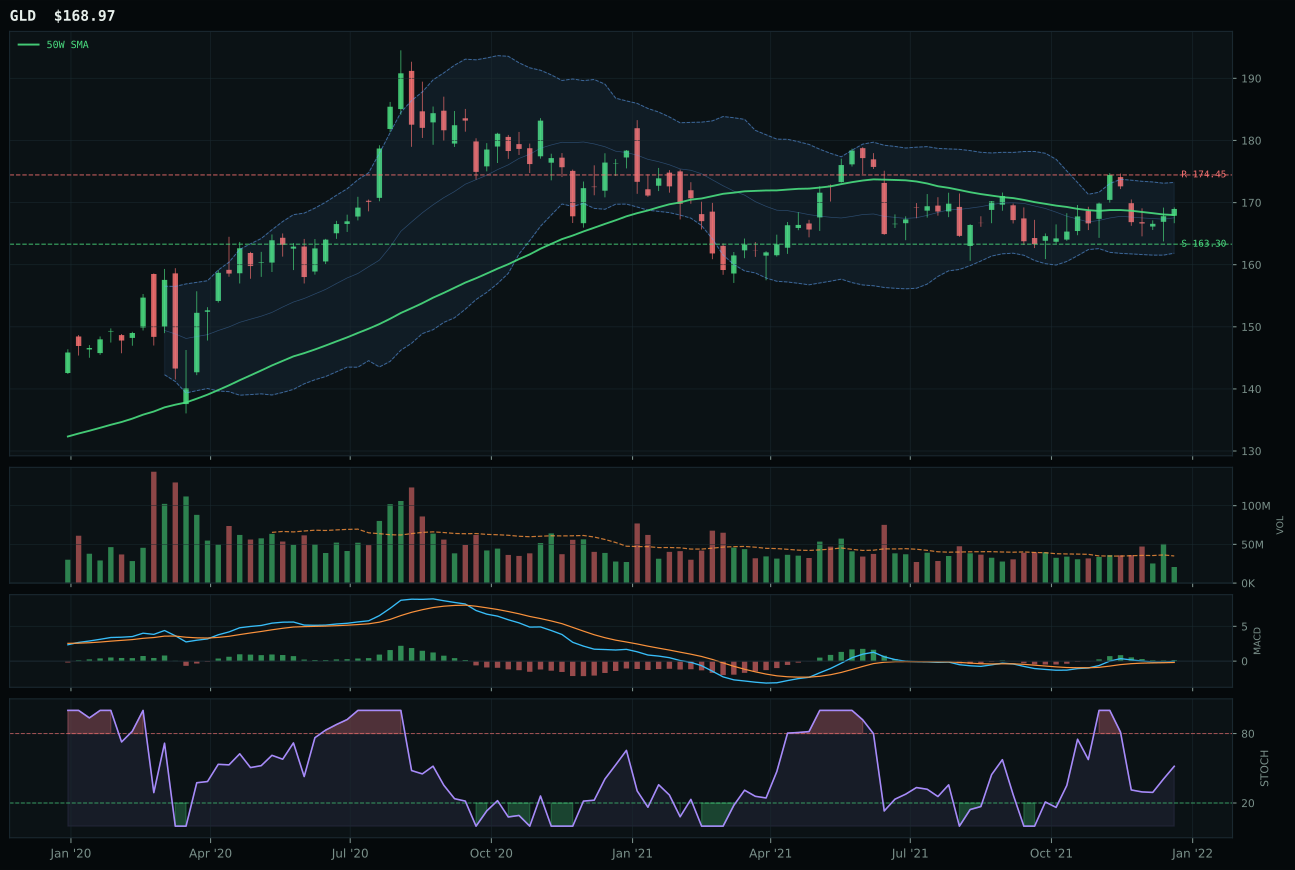
GLD has a pullback into support profile with -2.5% 13-week relative strength versus SPY.
A failed hold above support would weaken the setup.
Actionable but governed by invalidation levels.
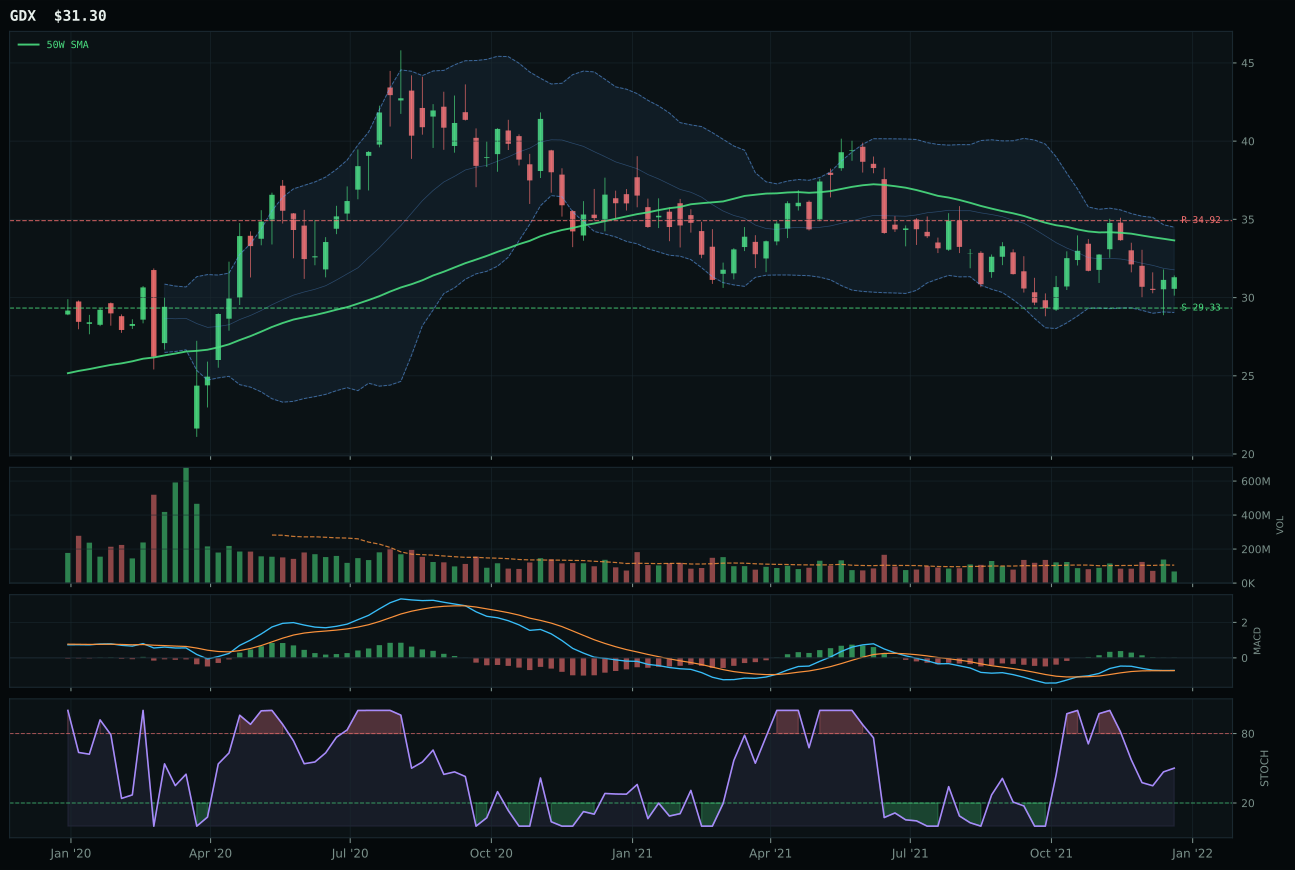
GDX has a neutral structure profile with -0.6% 13-week relative strength versus SPY.
A failed hold above support would weaken the setup.
Actionable but governed by invalidation levels.
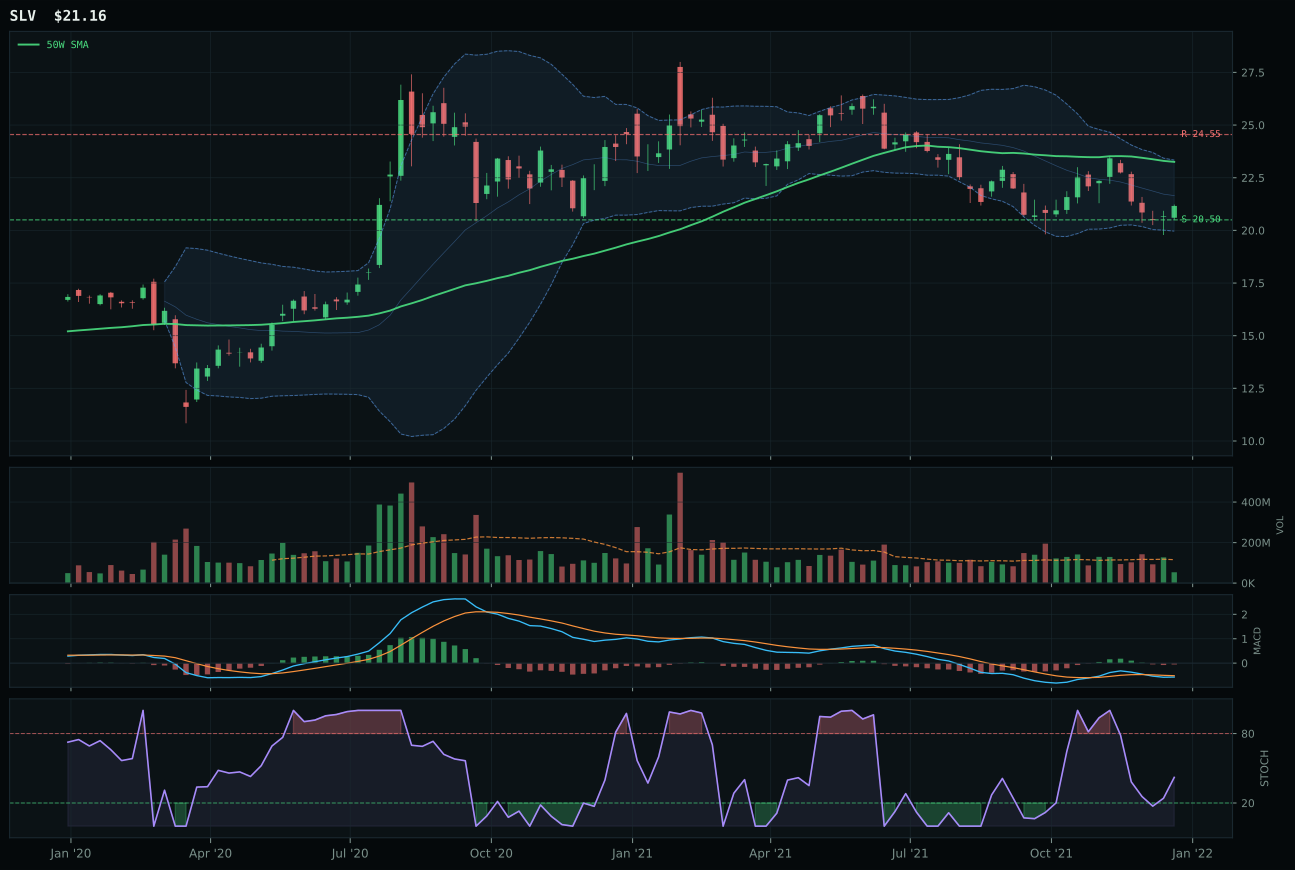
SLV has a pullback into support profile with -3.8% 13-week relative strength versus SPY.
A failed hold above support would weaken the setup.
Actionable but governed by invalidation levels.
GLD claimed the precious metals category by trading with surgical proximity to the 50W—just 0.6% above it—creating a textbook pullback-into-support setup that scores 100/100 on timing and 82.2/100 on trend despite a flat 50W slope (-0.1%). This tight positioning paired with bullish but flattening MACD and middle-retracement Fibonacci placement (0.500 zone) offers the mechanical advantage that matters most when macro sponsorship is mixed. Price sits only 3.5% above support at 163.30, constraining downside while providing defined invalidation; 69.3/100 risk/reward confirms the asymmetry. GDX lost by posting weaker timing (78/100 vs 100/100) due to its distance from the 50W and neutral structure placement, which requires more conviction from buyers than GLD's tighter coil offers. The 15.5-point score gap widens because GLD's technical evidence (75/100) exceeds GDX's (63.9/100), and dollar pressure (+2 for the category) provides just enough macro sponsorship to justify the allocation without requiring a breakdown in credit stress.
Agriculture & Livestock — MOO
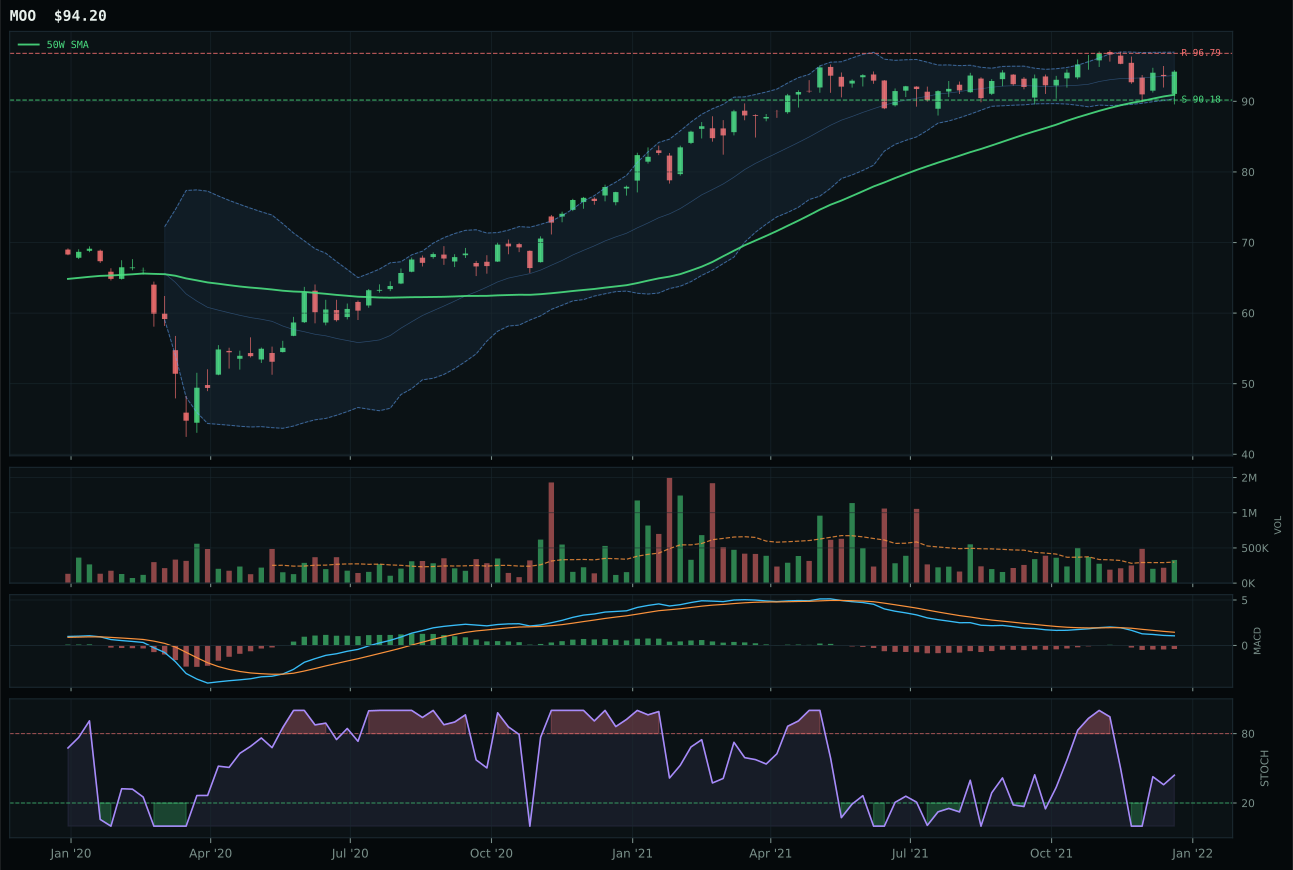
MOO has a pullback into support profile with -5.0% 13-week relative strength versus SPY.
A failed hold above support would weaken the setup.
Actionable but governed by invalidation levels.
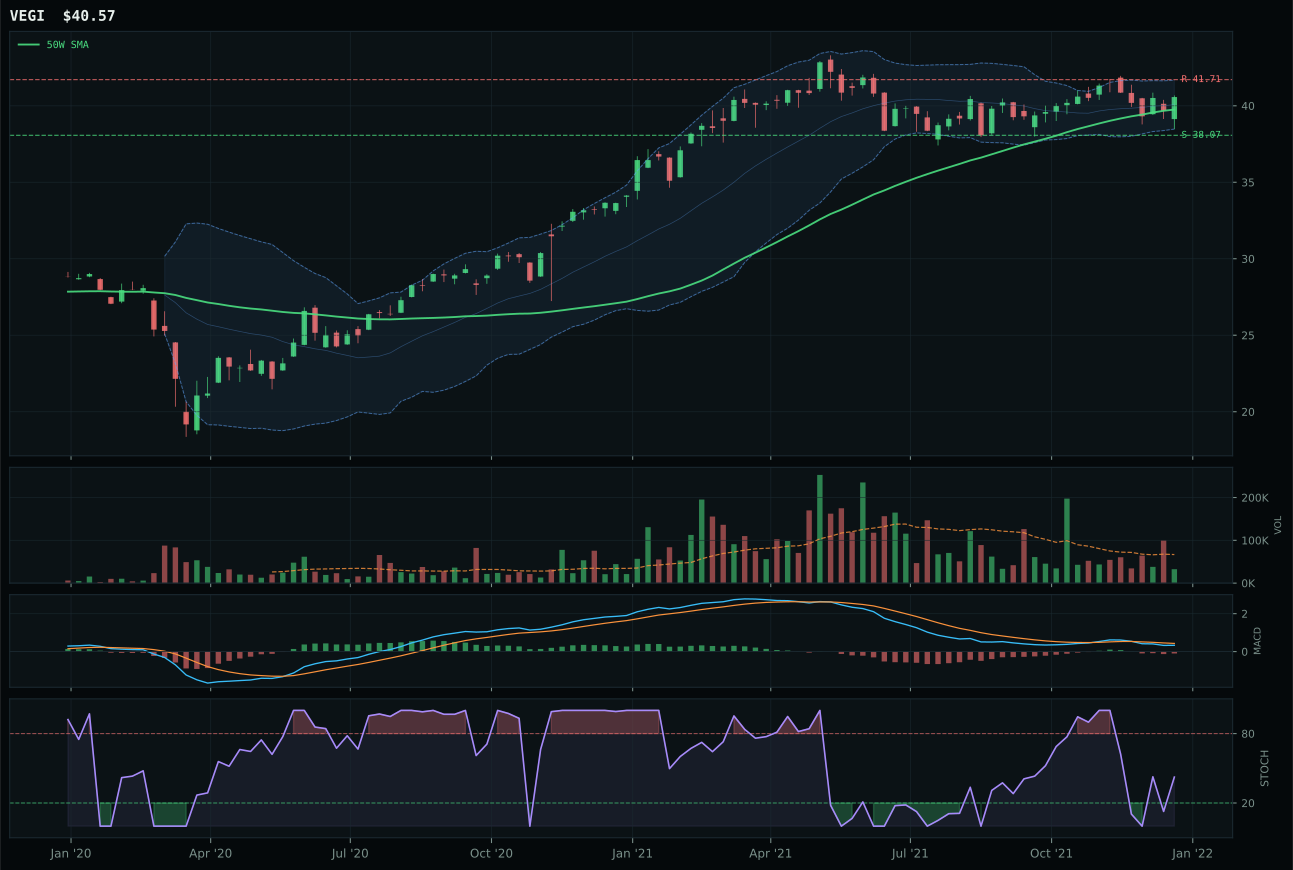
VEGI has a compression near 50W profile with -3.0% 13-week relative strength versus SPY.
A failed hold above support would weaken the setup.
Tracked, but not top-2 eligible because: .
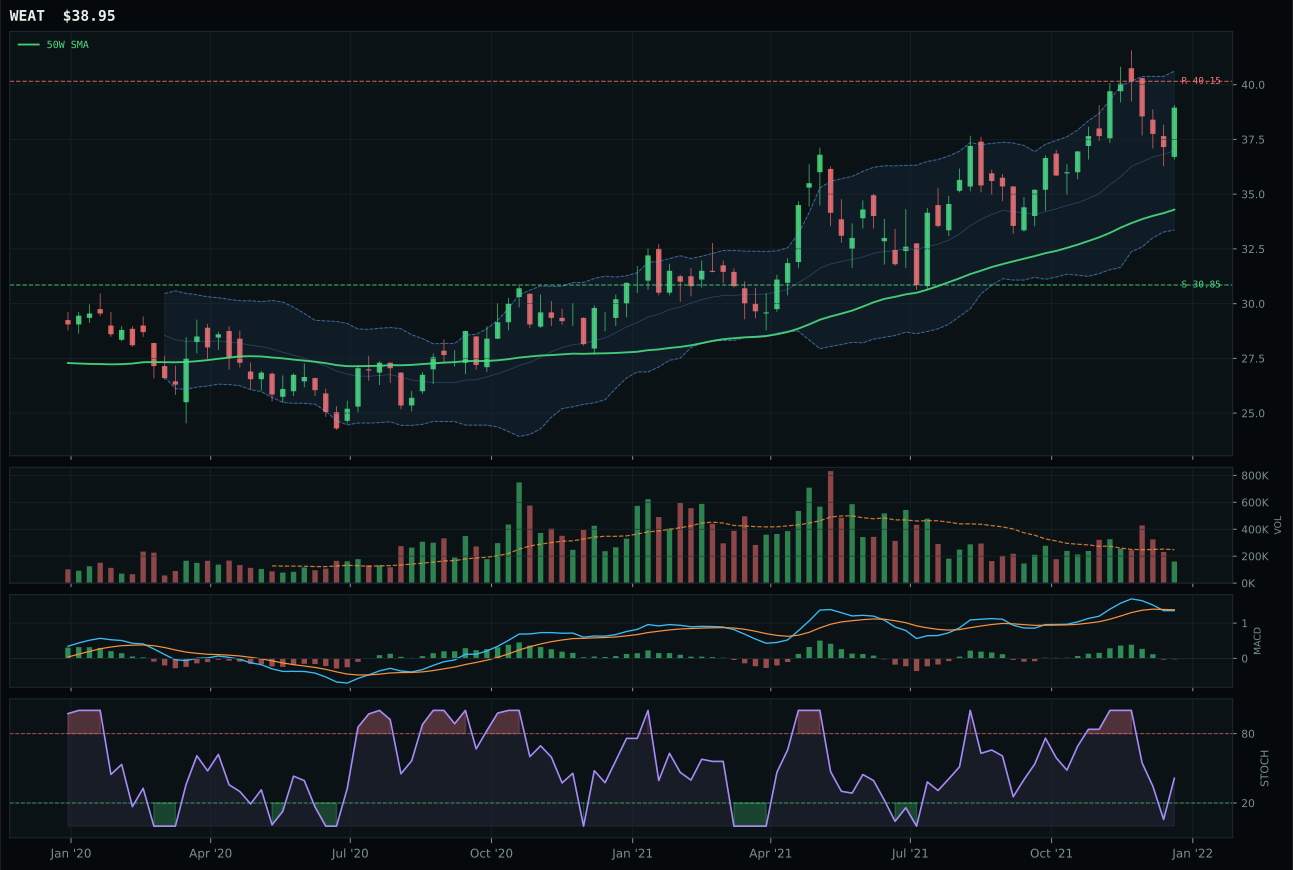
WEAT has a neutral structure profile with 4.6% 13-week relative strength versus SPY.
A failed hold above support would weaken the setup.
Tracked, but not top-2 eligible because: .
MOO won the agriculture category on the back of above-average volume participation (1.10x 20W average) confirming a pullback-into-support structure that sits just 3.6% above the 50W—a tight, defined invalidation zone that attracts tactical rotation. The 100/100 timing score reflects near-perfect proximity to the moving average combined with an oversold-turn-up stochastic reading, and MOO's 55.8/100 risk/reward (with 4.5% downside to support and 2.7% upside) signals mean-reversion opportunity rather than momentum chase. VEGI failed to match MOO's volume story; thin participation (0.72x) weakens conviction even as VEGI shows better 13W absolute returns (3.0% vs 1.0%), revealing that breadth is absent despite price action. The 20.6-point score gap is substantial and driven by MOO's technical evidence (43/100) paired with exceptional macro fit (70/100) as supply shortage and inflation pressure actively sponsor real-asset rotation into agribusiness.
Defense & Aerospace — XAR
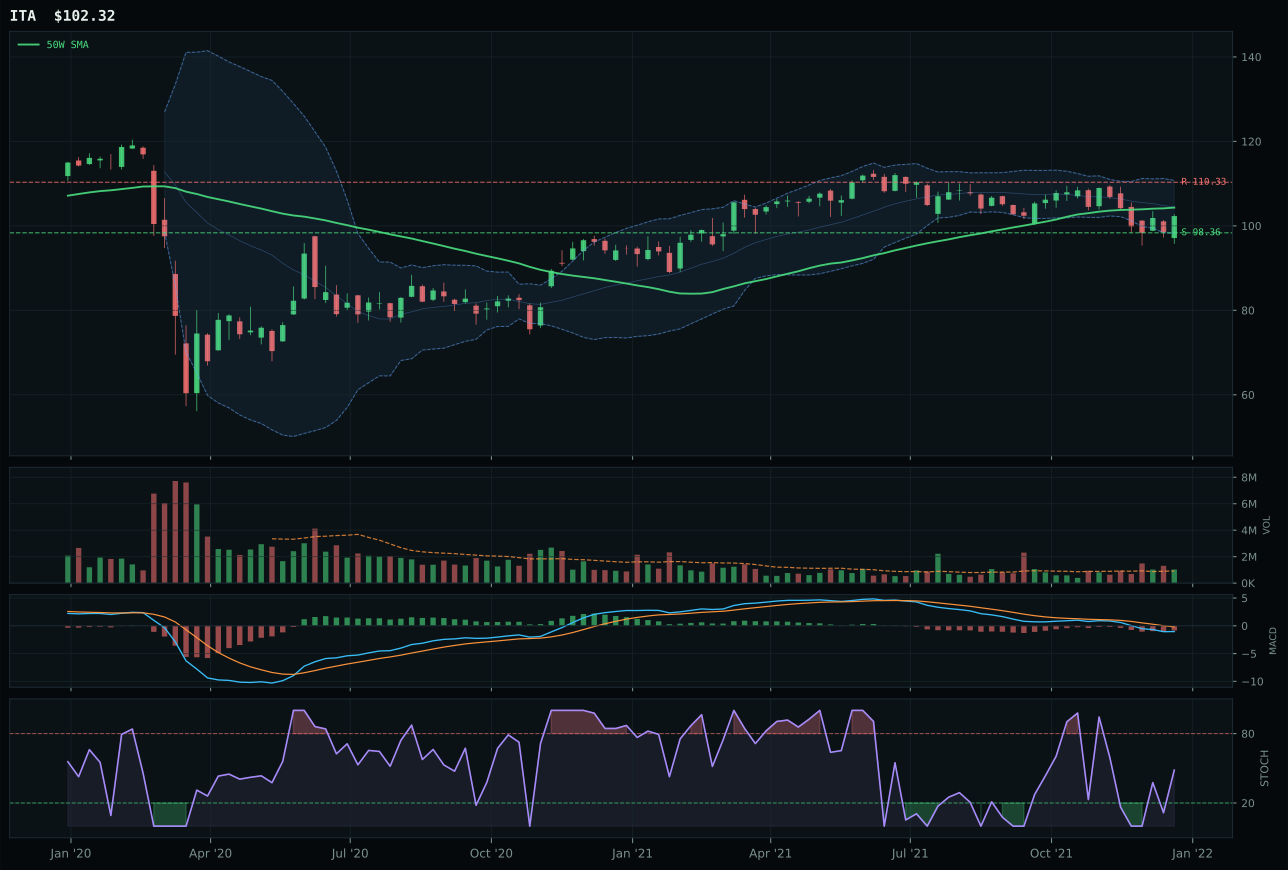
ITA has a pullback into support profile with -8.9% 13-week relative strength versus SPY.
A failed hold above support would weaken the setup.
Actionable but governed by invalidation levels.
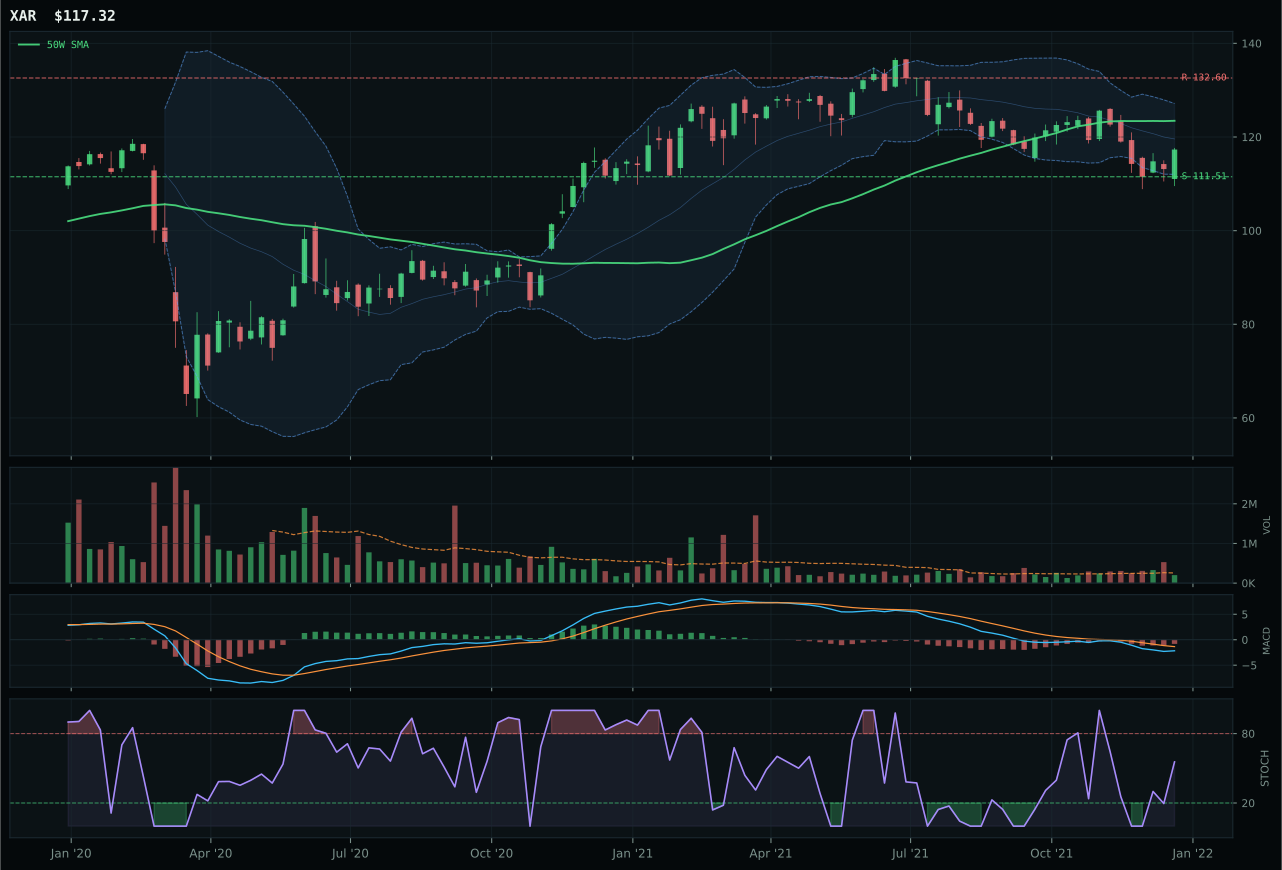
XAR has a neutral structure profile with -8.2% 13-week relative strength versus SPY.
A failed hold above support would weaken the setup.
Actionable but governed by invalidation levels.
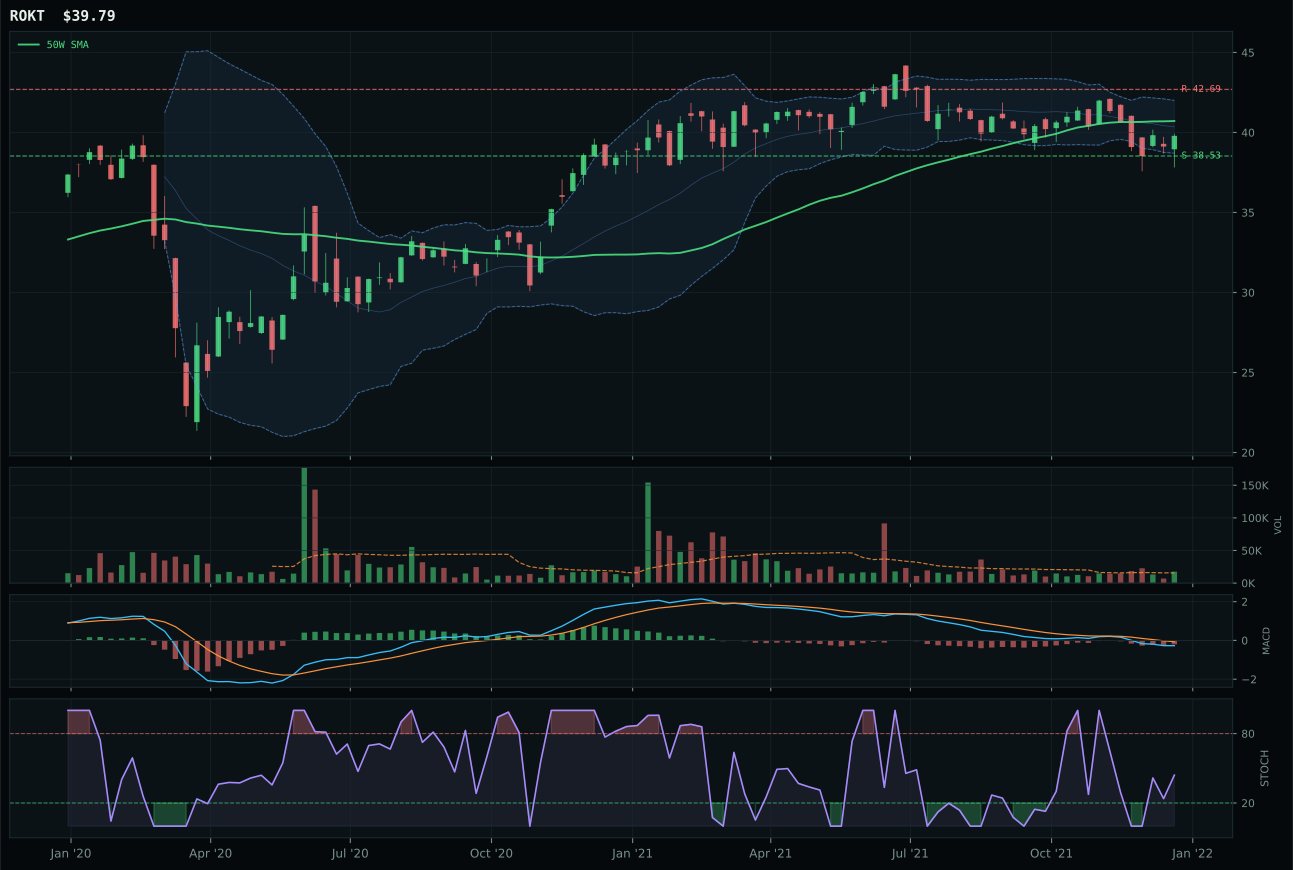
ROKT has a pullback into support profile with -7.5% 13-week relative strength versus SPY.
A failed hold above support would weaken the setup.
Tracked, but not top-2 eligible because: .
XAR wins Defense & Aerospace by capturing perfect timing (100/100) despite its pullback setup—price sits just 5.0% below the 50W, squarely in the defined invalidation zone where mean reversion risk/reward tips to the allocator's favor. Risk/reward scores 92.8/100, with only 5.2% downside to support versus 11.5% upside headroom, making this a classic coil ready for expansion if buyers defend the moving average. MACD reads bearish/weakening and stochastic RSI is rising mid-zone, confirming this is a reset and not a breakdown; that repair phase timing matters more than the negative 8.2% SPY relative strength here. ITA lost the category by posting weaker risk/reward (85.5 vs 92.8) and lagging category-relative strength at -0.7% versus XAR's neutral 0.0%, signaling that buyers are showing no preference within aerospace peers and thus pure technical setup quality becomes the tiebreaker. The 5.3-point score gap reflects a category where momentum is muted and the win goes to whichever ETF offers the cleanest mechanical setup for patient entry.
AI — SMH
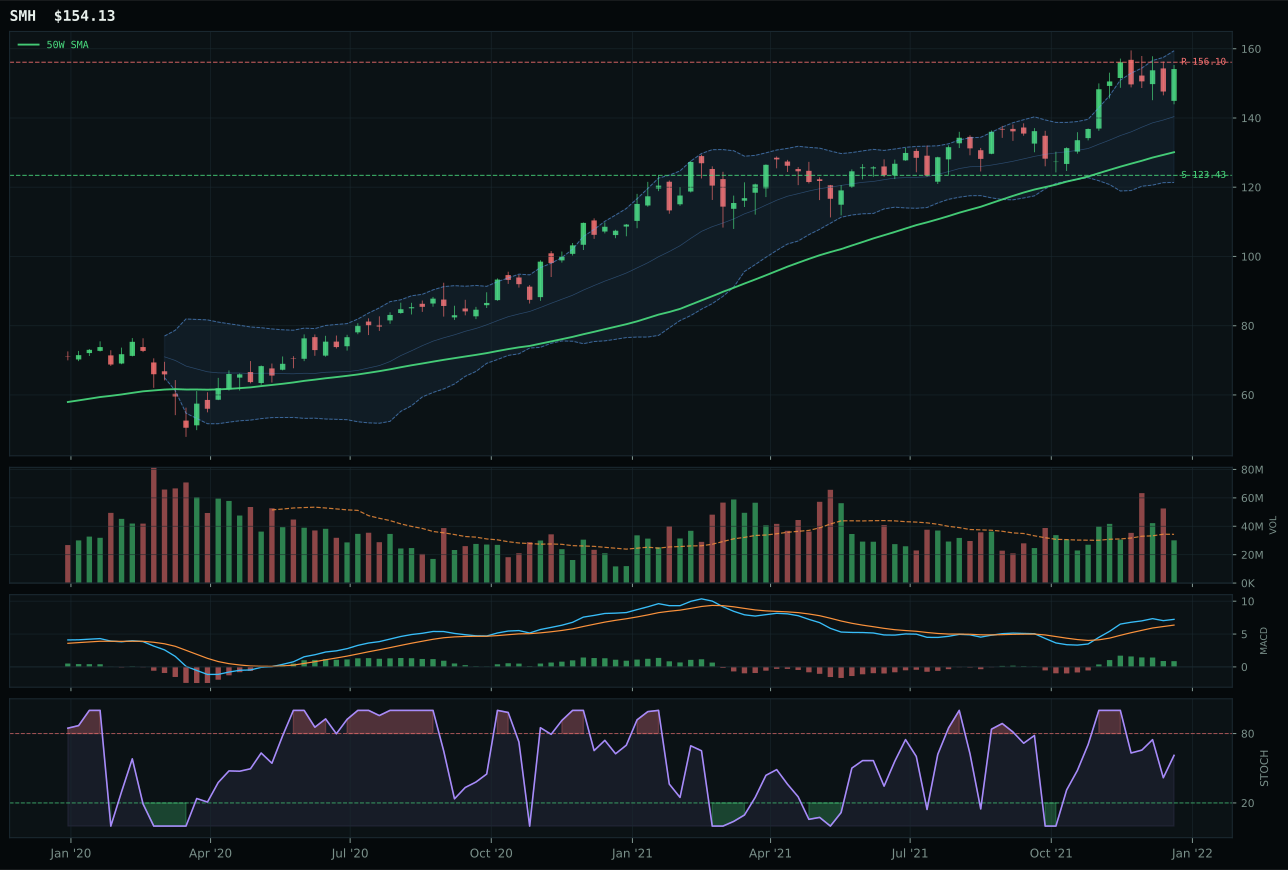
SMH has a vertical extension profile with 7.2% 13-week relative strength versus SPY.
A failed hold above support would weaken the setup.
Actionable but governed by invalidation levels.
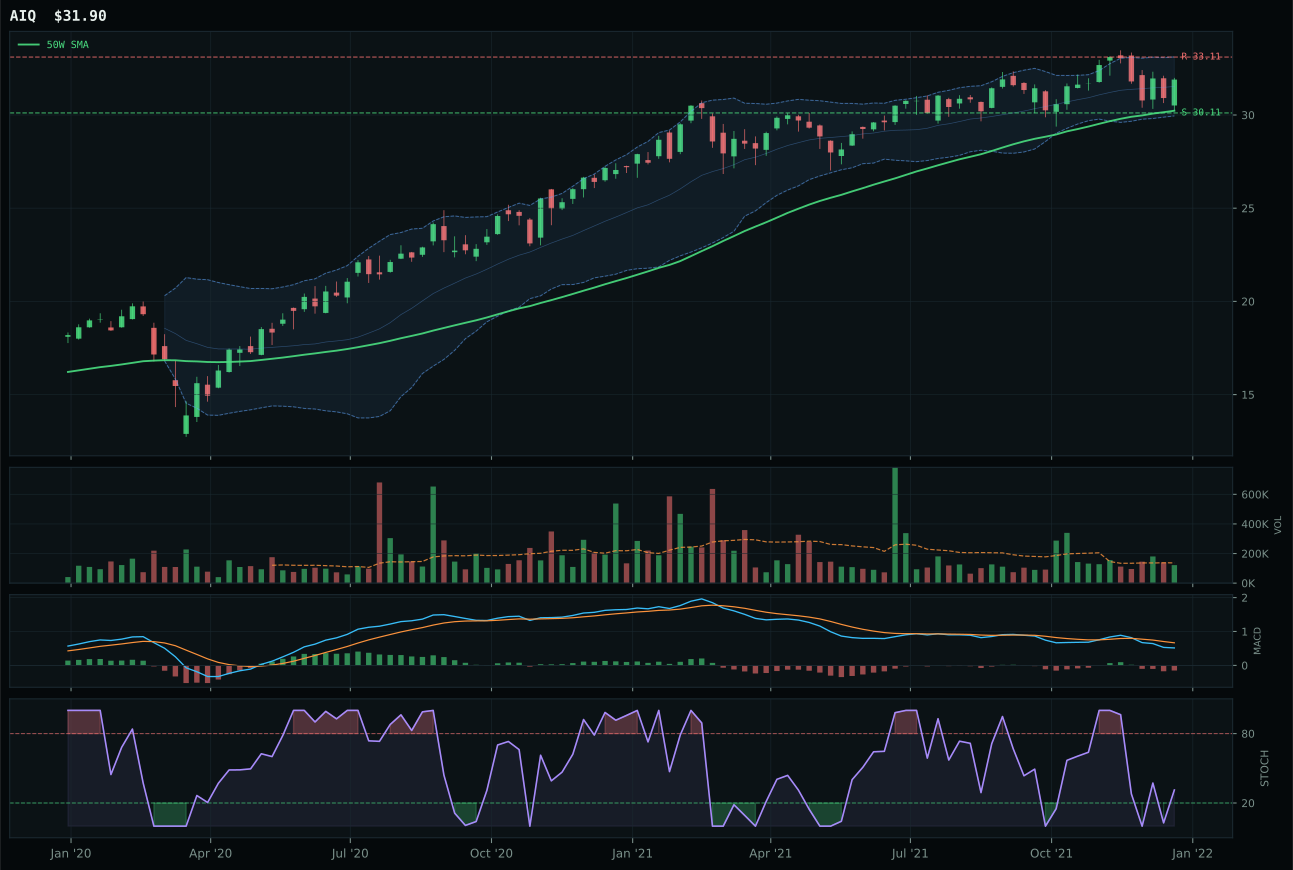
AIQ has a neutral structure profile with -4.5% 13-week relative strength versus SPY.
A failed hold above support would weaken the setup.
Tracked, but not top-2 eligible because: .
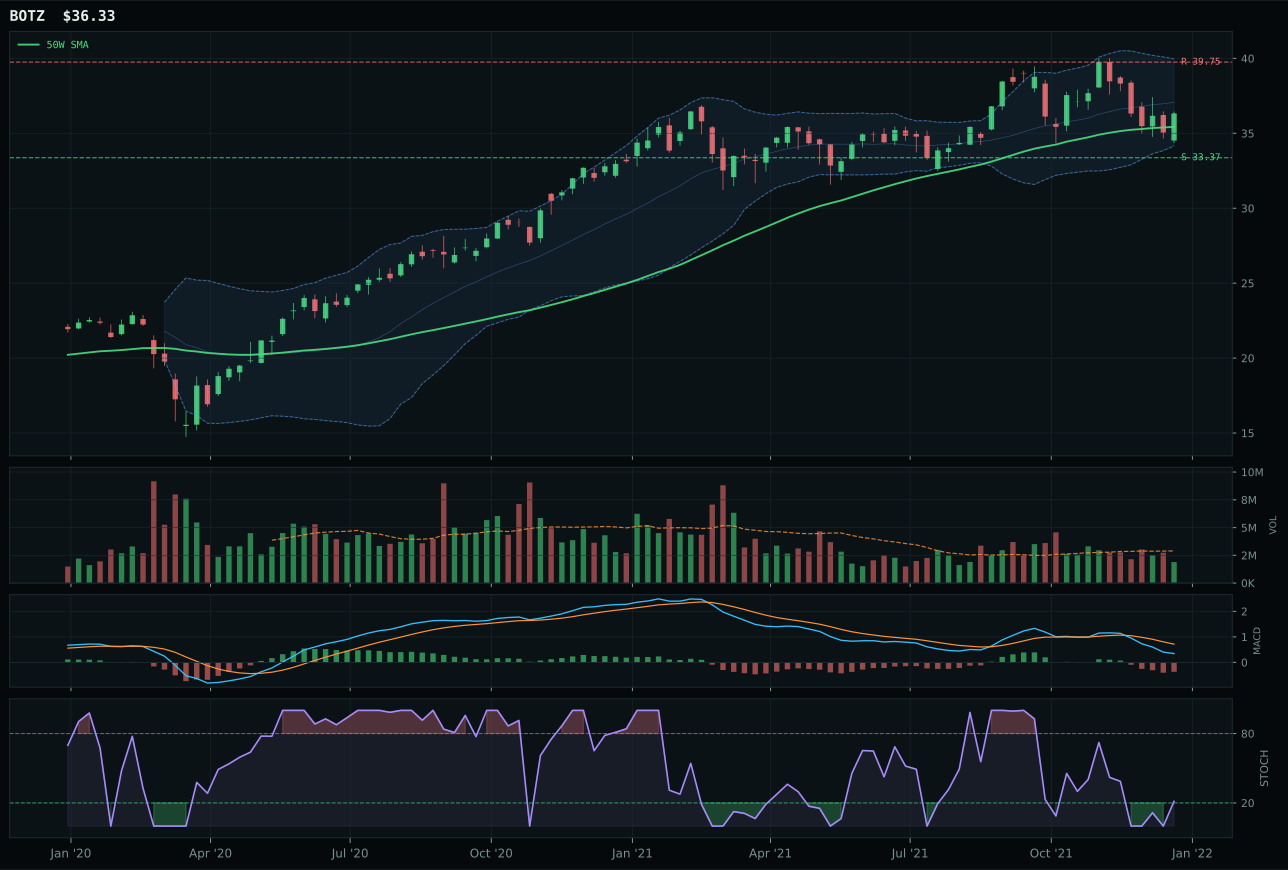
BOTZ has a compression near 50W profile with -12.3% 13-week relative strength versus SPY.
A failed hold above support would weaken the setup.
Actionable but governed by invalidation levels.
SMH captured the AI category with a 100/100 momentum confirmation score driven by 13.2% 13-week returns, 11.7% category-relative strength, and neutral volume participation (0.88x 20W) that proves buyers are absorbing supply without desperation. Price sits 18.5% above the 50W in a vertical extension setup, and while this penalizes timing to 40/100 and risk/reward to 37.9/100, the 70.4/100 technical evidence score and dominant 31.5-point spread over AIQ makes the decision clean and defensible. AIQ stumbled because its MACD turned bearish/weakening versus SMH's bullish but flattening pattern, structure quality lagged (76.4 vs 77.4), and category-relative strength flatlined at 0.0% while SMH printed 11.7%—evidence that the semiconductor compute complex is pulling away from pure software applications. SMH's 82/100 composite technical score reflects the kind of clean, broad-based leadership that justifies allocating to extended setups when the price action is being confirmed by category rotation.
Nuclear Energy — URA
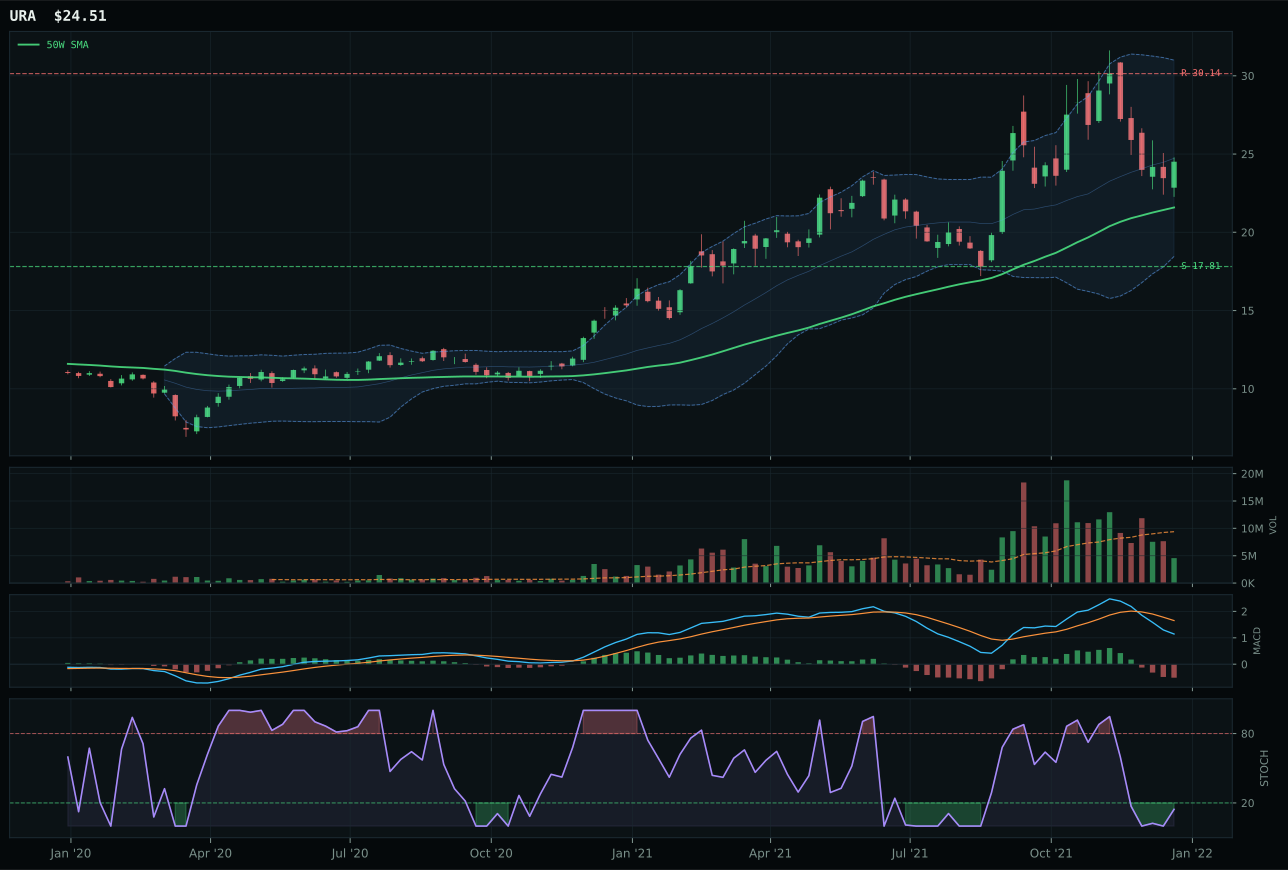
URA has a neutral structure profile with 0.1% 13-week relative strength versus SPY.
A failed hold above support would weaken the setup.
Actionable but governed by invalidation levels.
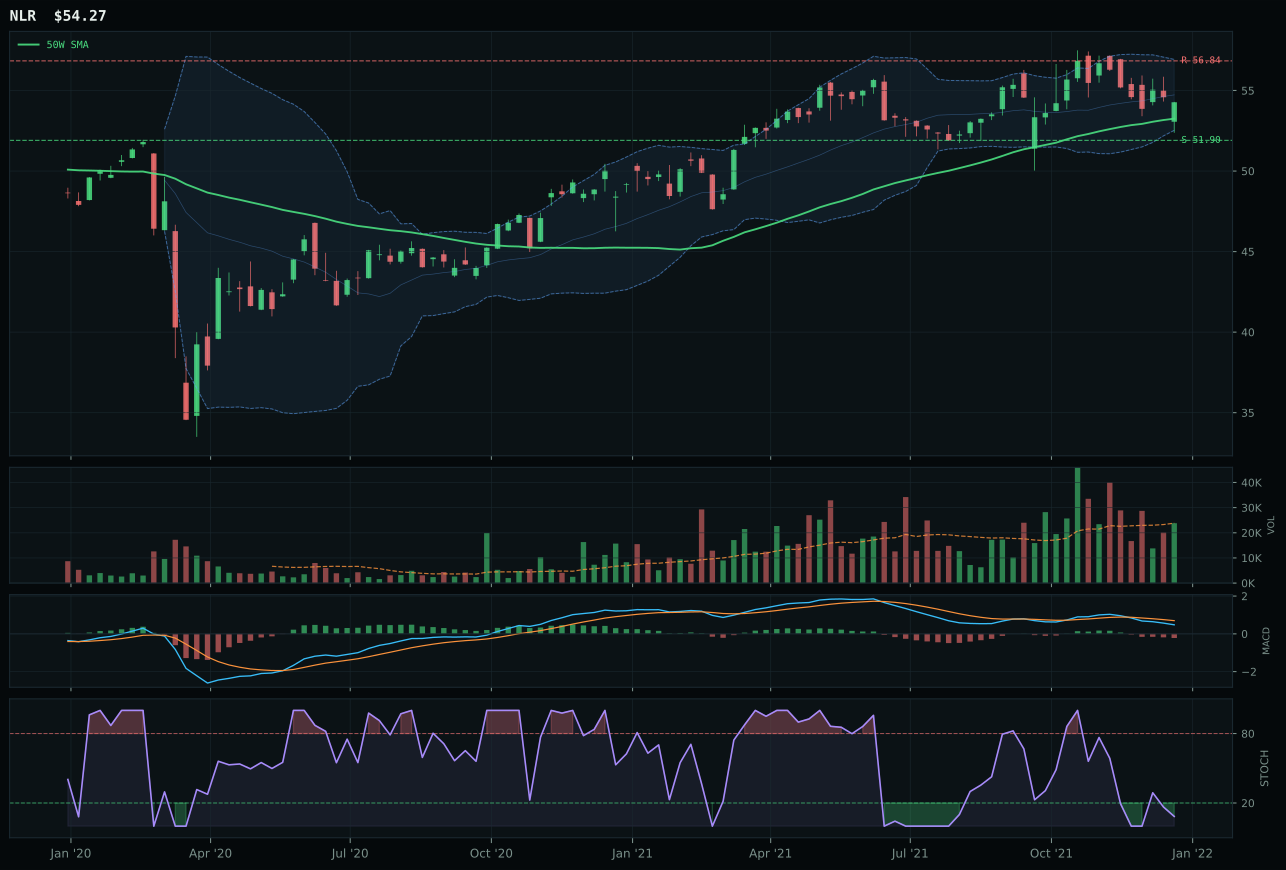
NLR has a pullback into support profile with -4.3% 13-week relative strength versus SPY.
A failed hold above support would weaken the setup.
Tracked, but not top-2 eligible because: .
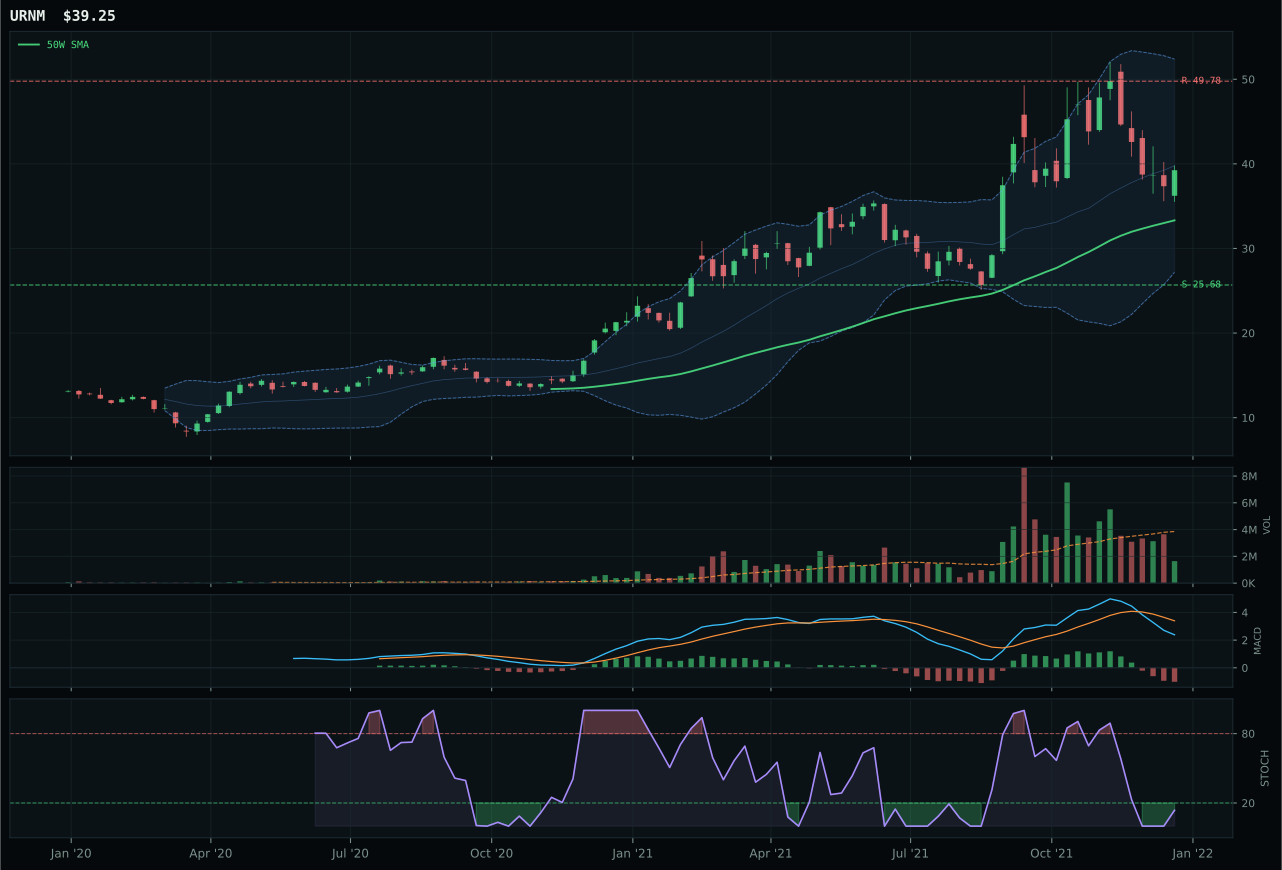
URNM has a vertical extension profile with -2.2% 13-week relative strength versus SPY.
A failed hold above support would weaken the setup.
Actionable but governed by invalidation levels.
URA captured nuclear energy with a 91/100 timing score reflecting its position 13.5% above the 50W paired with an oversold-turn-up stochastic reading (0.14) that offers mechanical entry signal despite bearish/weakening MACD. Neutral structure and compression below expectations (60.6/100) means the win is driven by timing discipline and risk/reward (46.9/100) that constraints upside to 18.7% downside but offers 37.6% technical cushion to support—an unusual inverse asymmetry that appeals to hedging rotations. The 82.1/100 trend score confirms price sits above both major moving averages with a non-deteriorating 0.8% 50W slope, creating a framework for patience. NLR lost by posting weaker category-relative strength (-2.0% vs 2.3%), signaling rotation away from nuclear utilities toward uranium miners; though NLR's pullback-into-support structure scores perfectly on timing (100/100), it cannot overcome the relative weakness versus URA's neutral but superior peer positioning. Momentum confirmation (35.5/100) remains weak across the category, reflecting broad energy sector hesitation, but the 5.1-point gap favors URA's structural clarity and slightly better SPY relative strength (0.1% vs -4.3%).
Technology — XLK
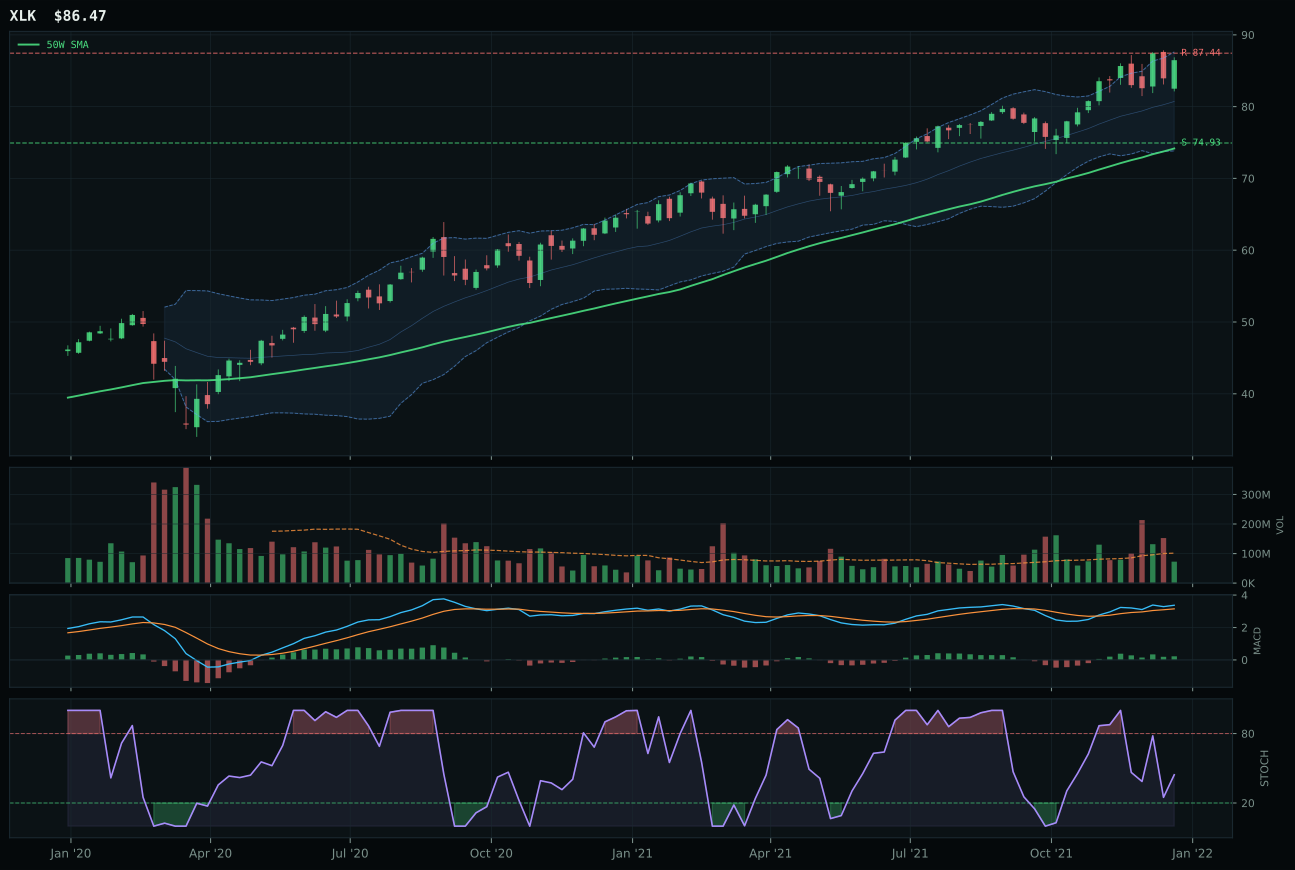
XLK has a vertical extension profile with 4.3% 13-week relative strength versus SPY.
A failed hold above support would weaken the setup.
Actionable but governed by invalidation levels.
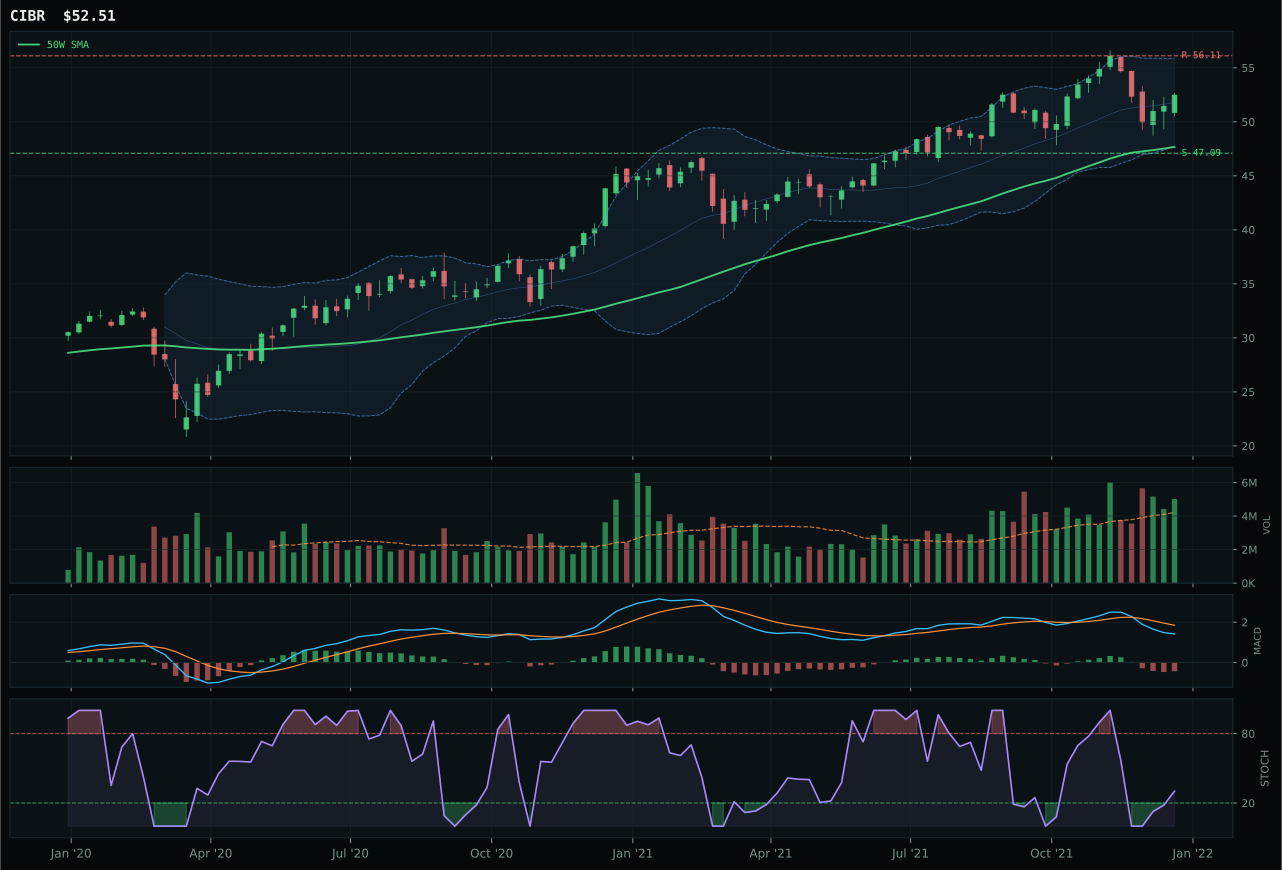
CIBR has a neutral structure profile with -3.3% 13-week relative strength versus SPY.
A failed hold above support would weaken the setup.
Actionable but governed by invalidation levels.
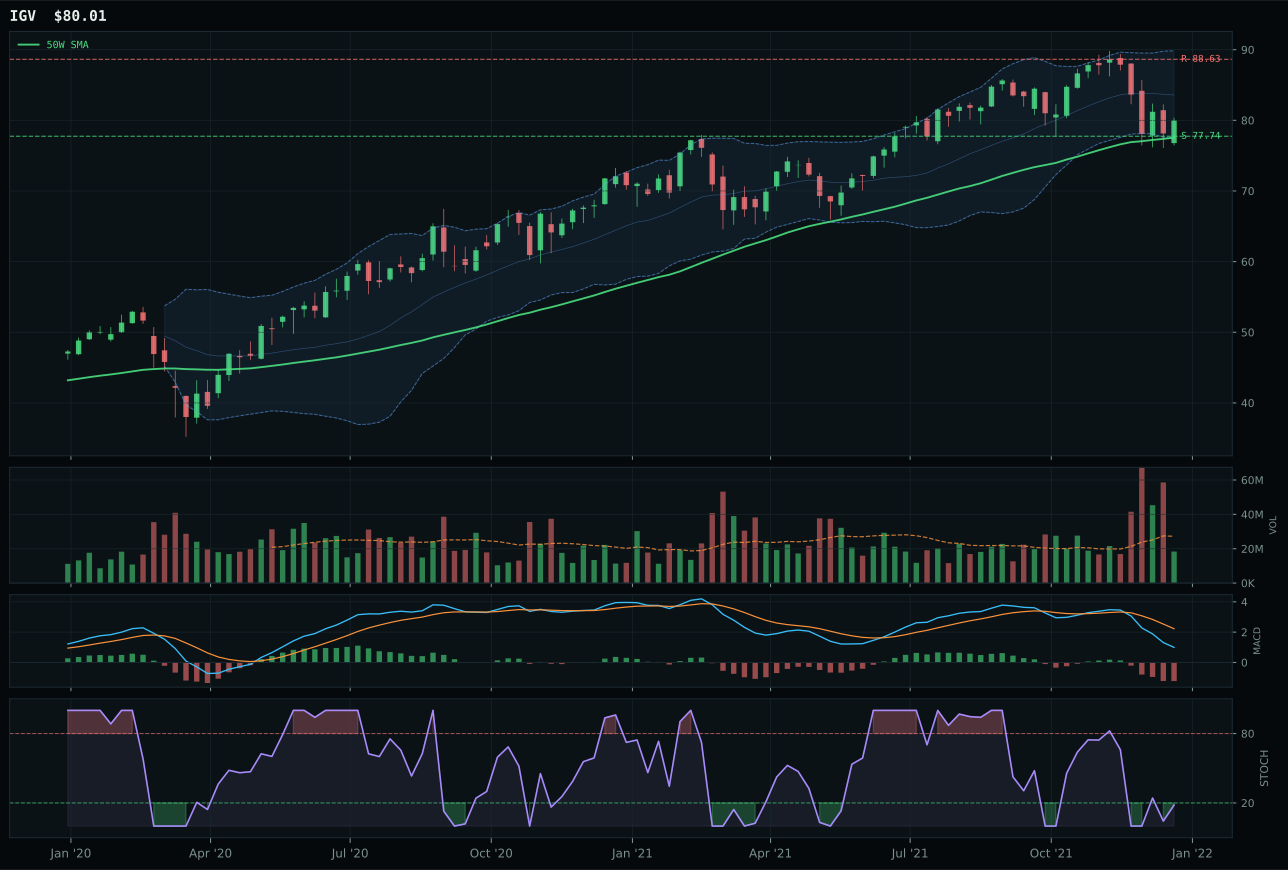
IGV has a pullback into support profile with -11.3% 13-week relative strength versus SPY.
A failed hold above support would weaken the setup.
Actionable but governed by invalidation levels.
XLK won the category with a 100/100 trend score anchored in price above both major moving averages and a 0.6% 50W slope that remains non-deteriorating, creating the foundation for its 7.6% outperformance versus the category median. The 4.3% relative strength to SPY and 10.4% 13-week return demonstrate persistent accumulation, even as the setup trades extended 16.6% above the 50W—a cost that penalizes the entry timing score to 48/100. CIBR lost ground on two fronts: its MACD flipped to bearish/weakening versus XLK's bullish but flattening posture, and category-relative strength collapsed to 0.0% while XLK held 7.6%, signaling that buyers were rotating into compute leadership and away from cybersecurity steadiness. The 0.9-point score gap reveals this was close technical contest, but XLK's volume sponsorship at neutral participation (0.88x 20W) kept the move from feeling forced.
Technology earned 0% allocation this week and ranks outside the portfolio entirely, falling to either 9th or 10th among the 10 categories with a final score of 33.6. The macro regime—Transition / Mixed—offers no tailwind here; in fact, three headwinds are actively compressing the category score: credit stress (-7), dollar pressure (-5), and inflation pressure (-4) each penalize technology's defensive positioning and equity-risk sensitivity. Even XLK's strong trend work and 7.6% category leadership cannot overcome the fact that AI growth sponsorship (+6) alone cannot offset the cumulative weight of macro erosion. For this category to earn a tier-2 or tier-1 slot, either credit stress would need to ease materially, inflation pressure would need to confirm as transitory, or category relative strength would need to accelerate beyond current levels to justify the entry risk at extended valuations.
Emerging Markets — INDA
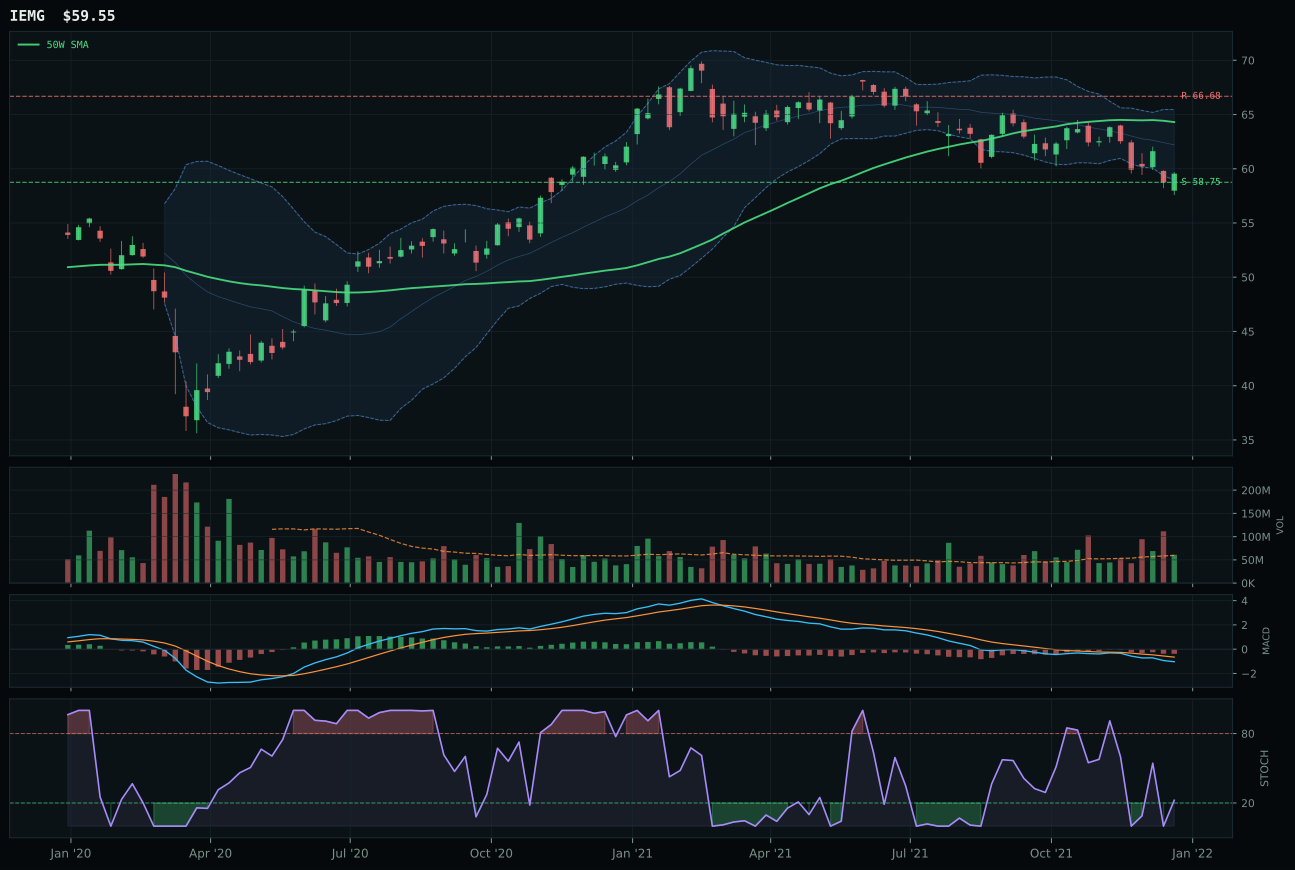
IEMG has a pullback into support profile with -10.4% 13-week relative strength versus SPY.
A failed hold above support would weaken the setup.
Actionable but governed by invalidation levels.
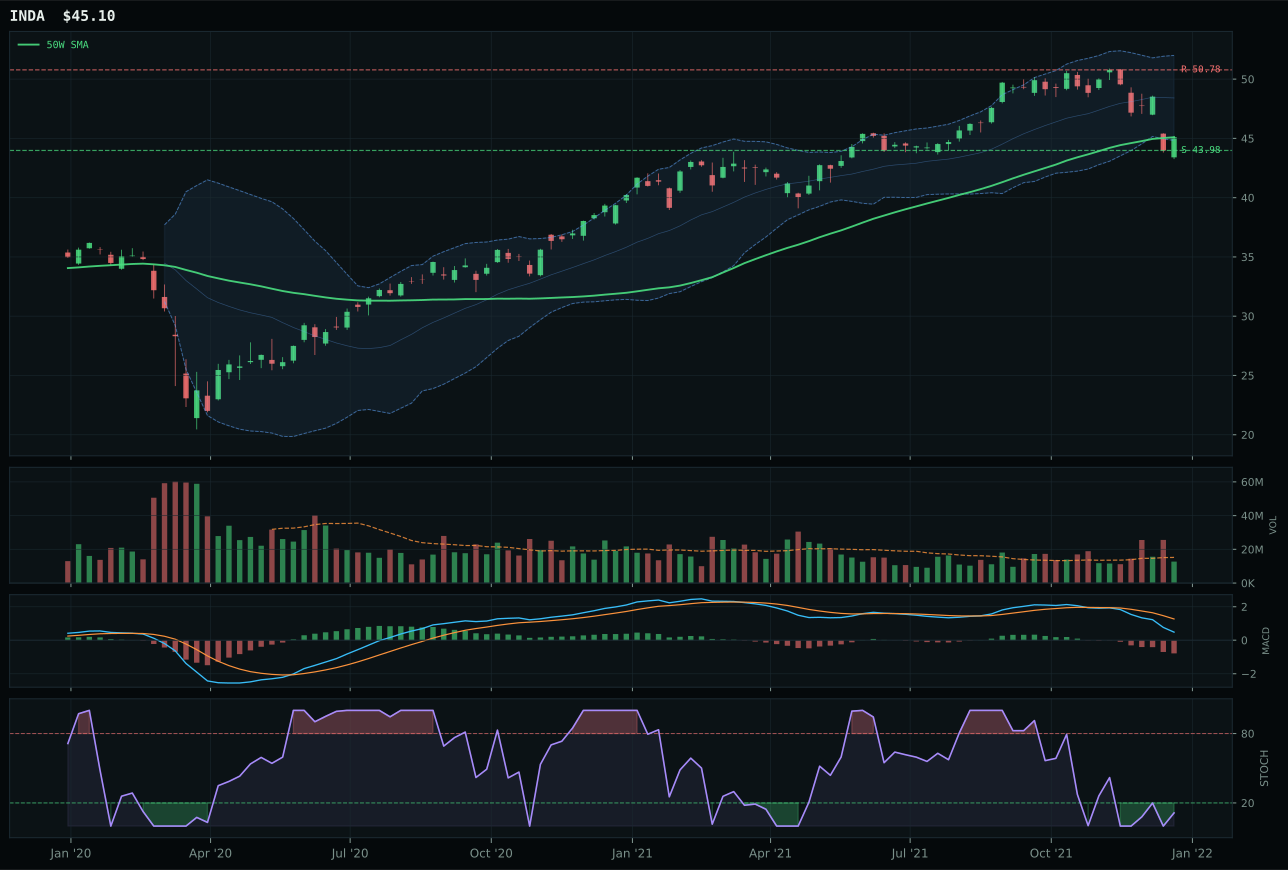
INDA has a pullback into support profile with -15.6% 13-week relative strength versus SPY.
A failed hold above support would weaken the setup.
Actionable but governed by invalidation levels.
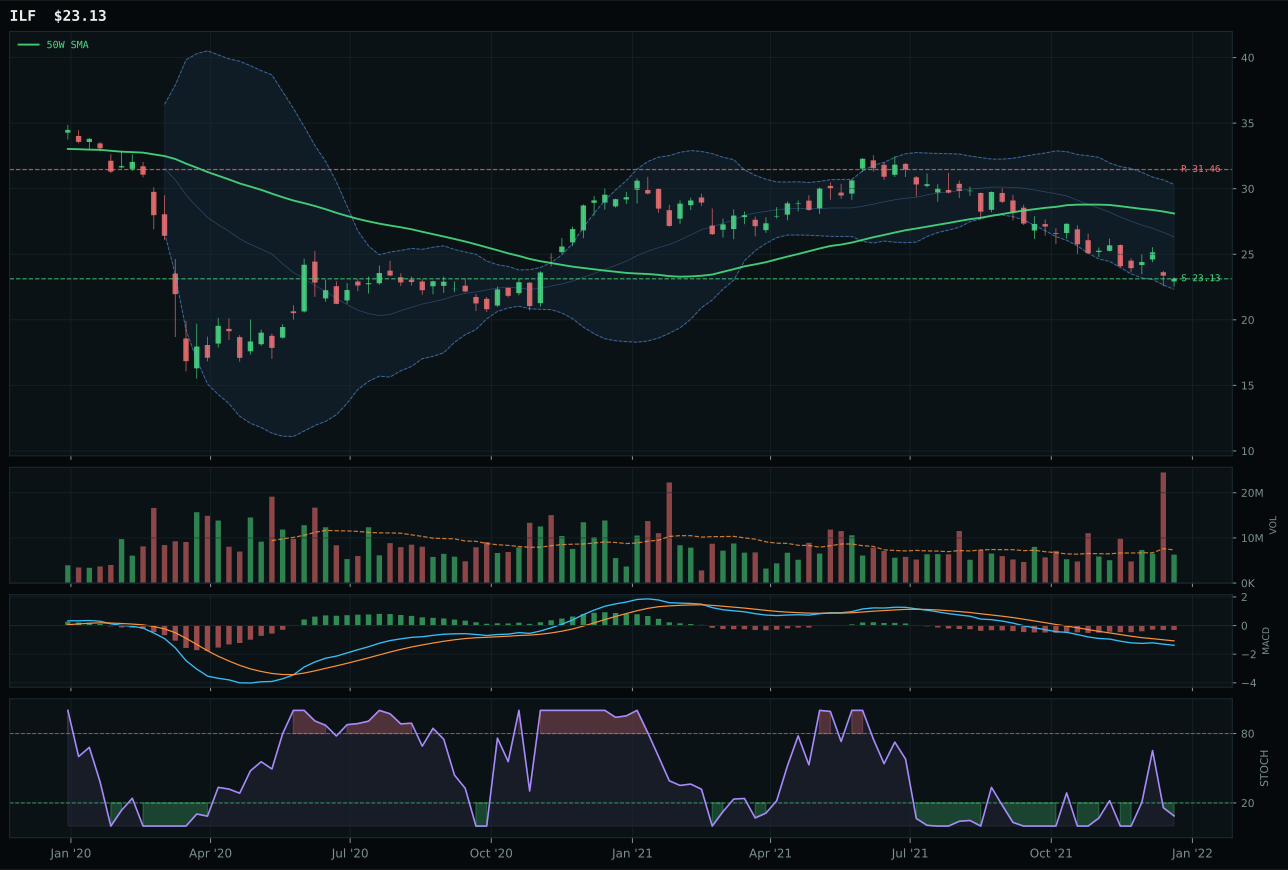
ILF has a pullback into support profile with -21.3% 13-week relative strength versus SPY.
Extension and support failure are the main tactical risks.
Tracked, but not top-2 eligible because: structurally broken.
INDA won emerging markets with a dominant 100/100 timing score and 98/100 risk/reward despite posting 0.0% momentum confirmation—the worst read in its scoring layer. Price trades exactly at the 50W after a long decline, with stochastic RSI turning up from oversold (0.11), giving the setup mechanical reversal signal even as 13W returns lag at -9.6% and SPY relative strength bleeds -15.6%. MACD remains bearish/weakening, volume is neutral (0.84x 20W), and there is zero category-relative strength (0.0%), meaning no peer is outperforming—yet risk/reward dominates: only 2.5% downside to support at 43.98 versus 11.2% upside to resistance, an asymmetry worth the timing entry. IEMG lost by posting weaker timing (88/100 vs 100/100)—it sits further from the 50W—and worse risk/reward (90/100 vs 98/100), plus stochastic reads rising mid-zone rather than turning up from true oversold. The 23.3-point score gap is massive, but the category itself scores 1.6/100, placing it outside allocation entirely. Emerging markets face relentless macro headwinds: dollar pressure (-14), credit stress (-10), and broad market bear (-9) all attack EMs simultaneously, and no technical setup strength can overcome category-level exclusion from the portfolio.