
2021-12-17
Informational purposes only. The content in this report, including allocations, analysis, and commentary, is provided solely for informational and educational purposes. It does not constitute financial advice, investment advice, trading advice, or any other type of advice. Past performance does not guarantee future results. Always conduct your own research and consult a qualified financial professional before making investment decisions.
Weekly Allocation
| Ticker | Category | Weight | Role |
|---|---|---|---|
| FBTC | 50% | Overlay | |
| XLE | Traditional Energy | 10% | Top-2 (10%) |
| MOO | Agriculture & Livestock | 10% | Top-2 (10%) |
| XLU | Utilities & Infrastructure | 5% | Tier-2 (5%) |
| GLD | Precious Metals | 5% | Tier-2 (5%) |
| COPX | Industrial Metals | 5% | Tier-2 (5%) |
| SMH | AI | 5% | Tier-2 (5%) |
| URA | Nuclear Energy | 5% | Tier-2 (5%) |
| ITA | Defense & Aerospace | 5% | Tier-2 (5%) |
Trade Instructions — Monday Open
Sell the tranche from 2021-11-19 (completing its 4-week hold). Buy the new tranche. Instructions show net portfolio changes — same-asset positions cancel, weight changes show the delta.
| Action | Ticker | Instruction |
|---|---|---|
| SELL | FSOL | Sell 25% of FSOL position (reduce 50.00% → 37.50%) |
| SELL | GLD | Sell 20% of GLD position (reduce 6.25% → 5.00%) |
| SELL | XLK | Sell 20% of XLK position (reduce 6.25% → 5.00%) |
| SELL | PAVE | Sell 50% of PAVE position (reduce 2.50% → 1.25%) |
| BUY | MOO | Buy MOO — 7.69% of freed cash (adds 1.25% to portfolio) |
| BUY | XLU | Buy XLU — 7.69% of freed cash (adds 1.25% to portfolio) |
| BUY | ITA | Buy ITA — 7.69% of freed cash (adds 1.25% to portfolio) |
| BUY | FBTC | Buy FBTC — 76.92% of freed cash (adds 12.50% to portfolio) |
Current Portfolio After Trade
Combined holdings across all 4 active tranches. Each tranche is 25% of the portfolio.
| Ticker | % of Portfolio | Weight Bar |
|---|---|---|
| FSOL | 37.50% | |
| FBTC | 12.50% | |
| XLE | 10.00% | |
| MOO | 6.25% | |
| GLD | 5.00% | |
| XLK | 5.00% | |
| SMH | 5.00% | |
| XLU | 5.00% | |
| PICK | 3.75% | |
| URA | 2.50% | |
| COPX | 2.50% | |
| ITA | 2.50% | |
| PAVE | 1.25% | |
| URNM | 1.25% |
Macro Regime — Transition / Mixed
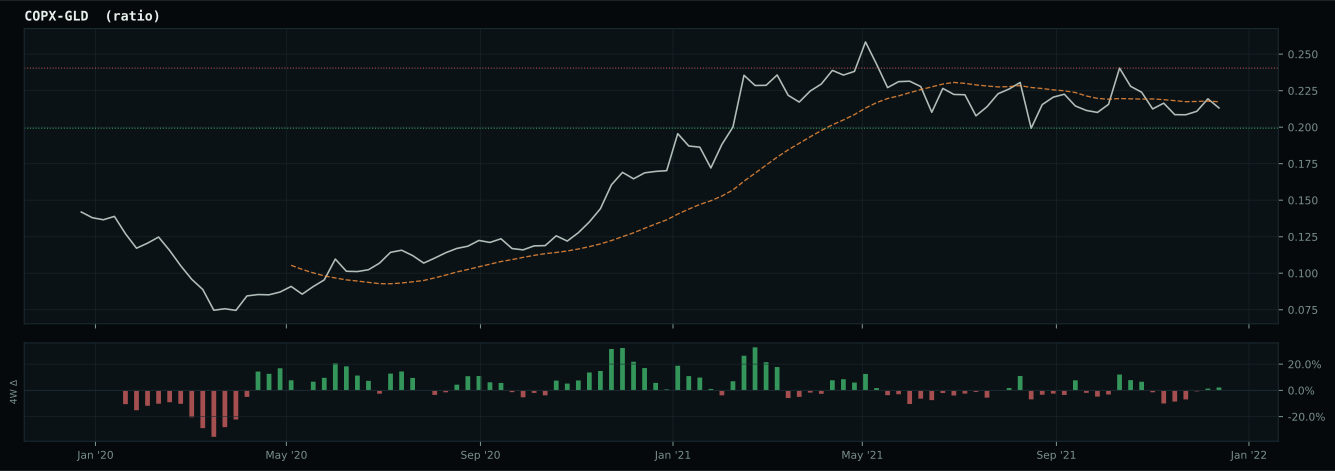
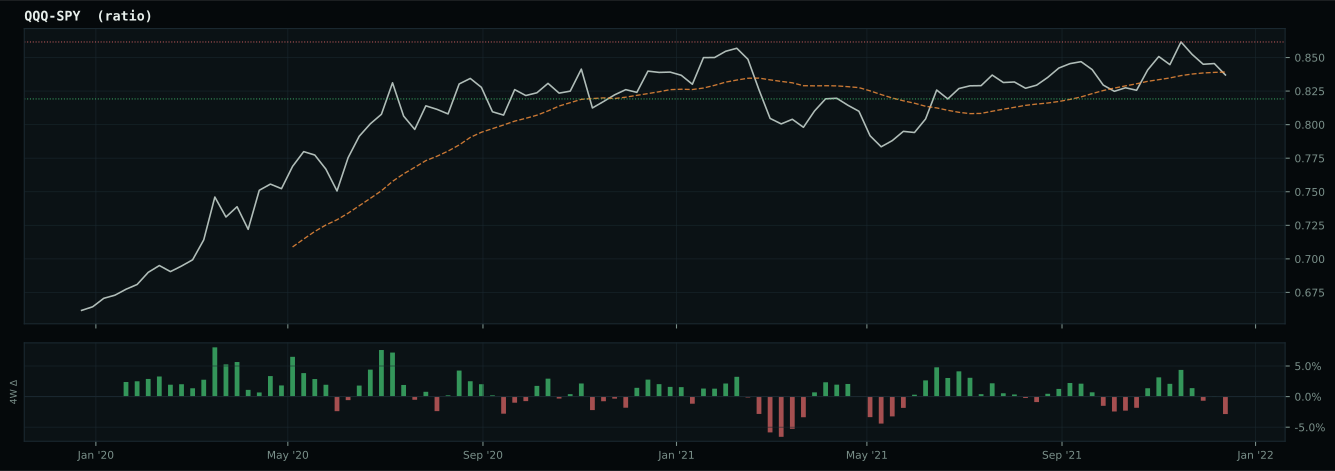
Macro Evidence Charts
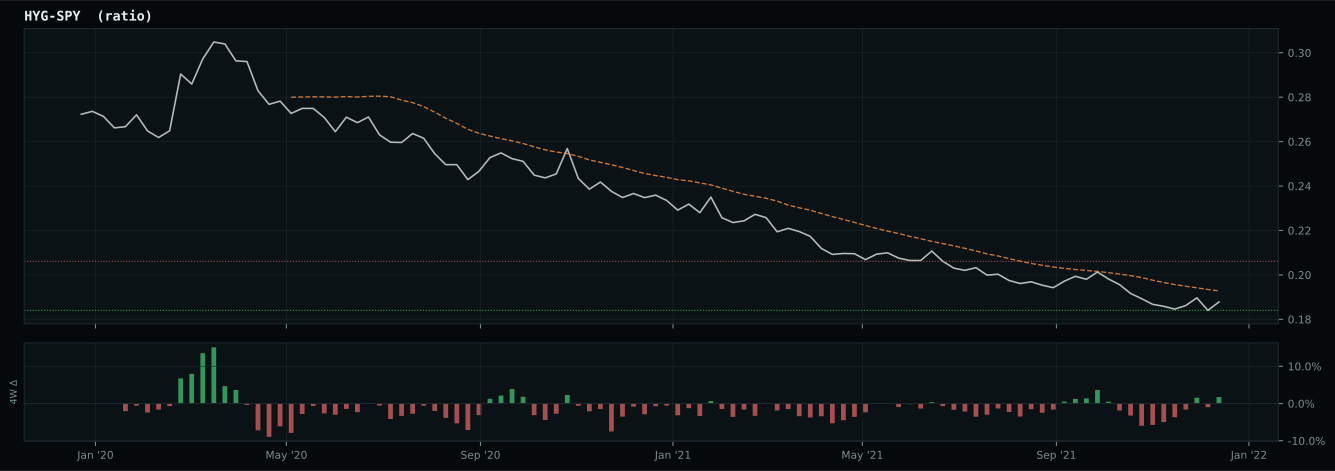
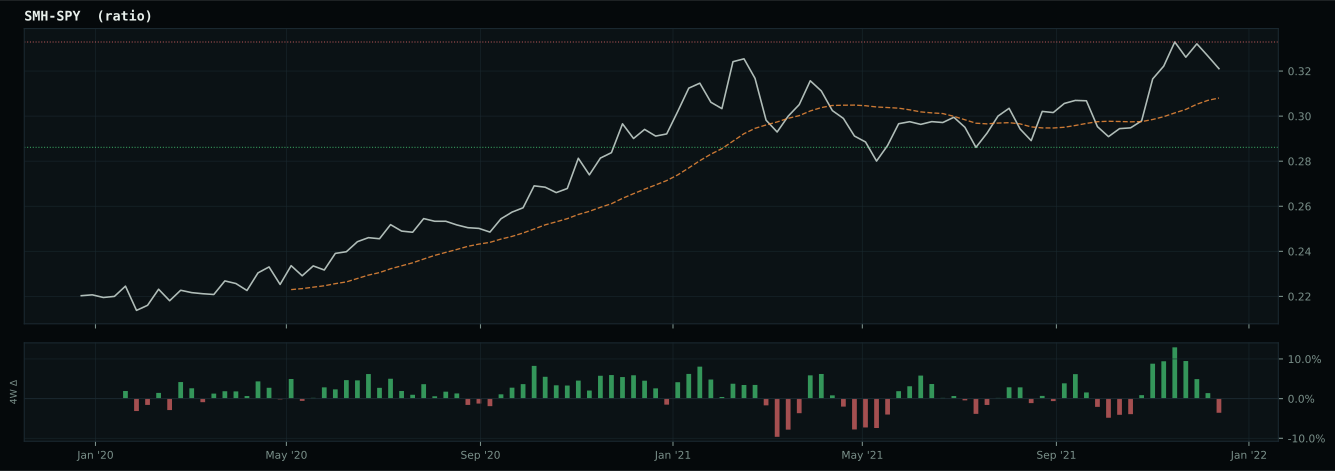
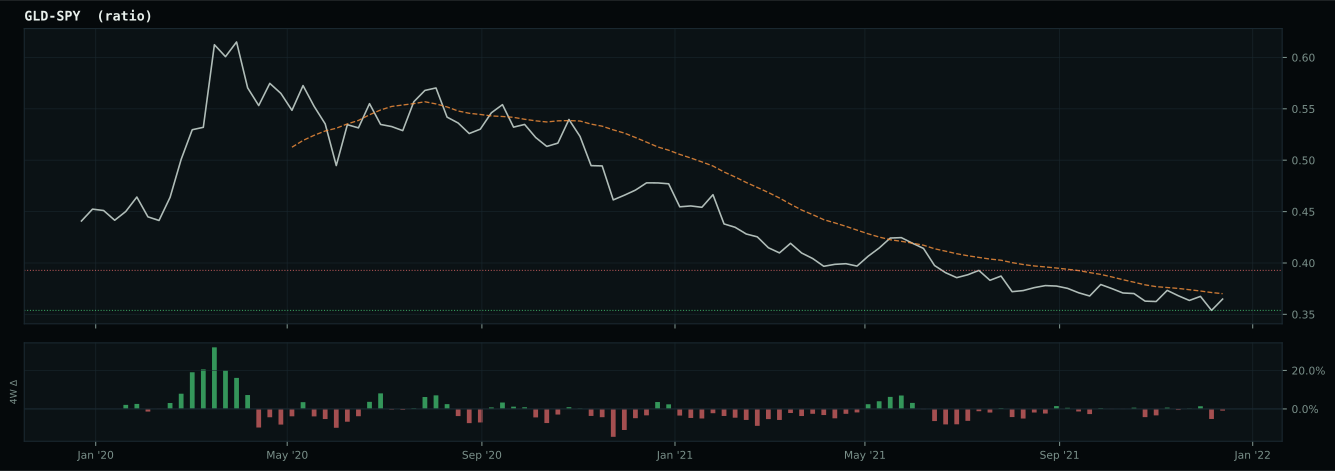
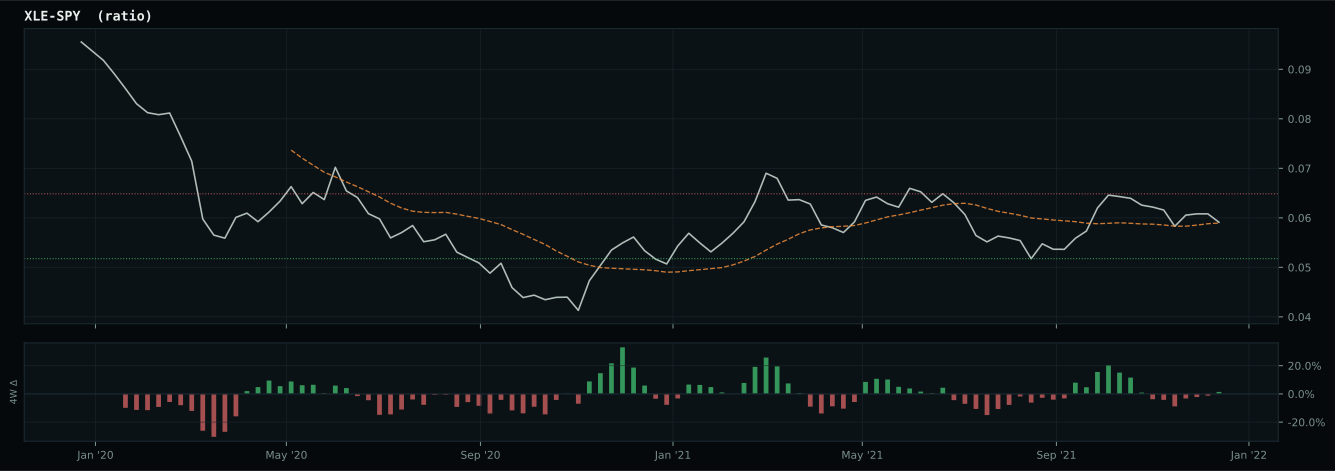
Market-implied signals behind the macro regime scores. Each ratio compares two assets; the direction and slope of the ratio is what the macro engine reads.
Crypto Regime — TrendBTC
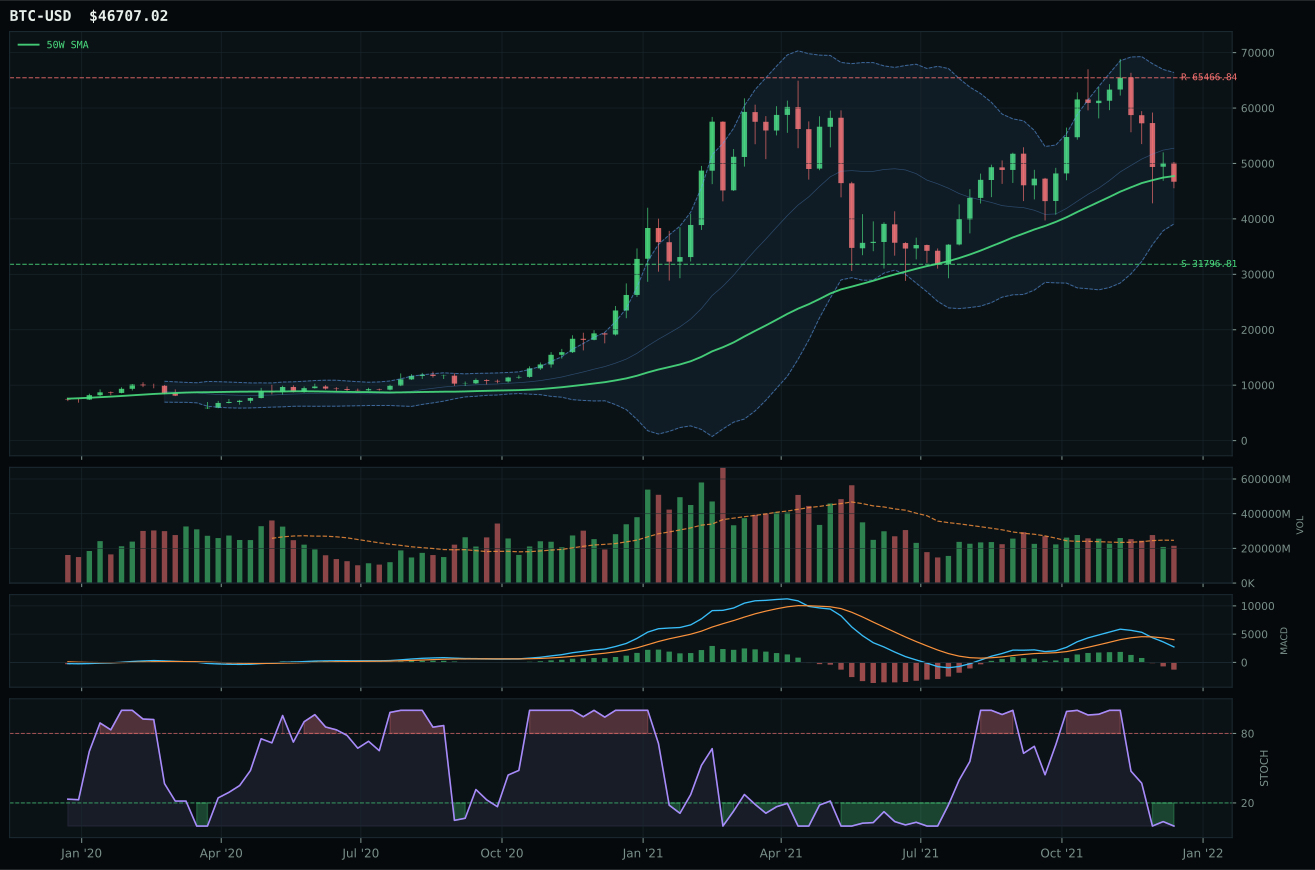
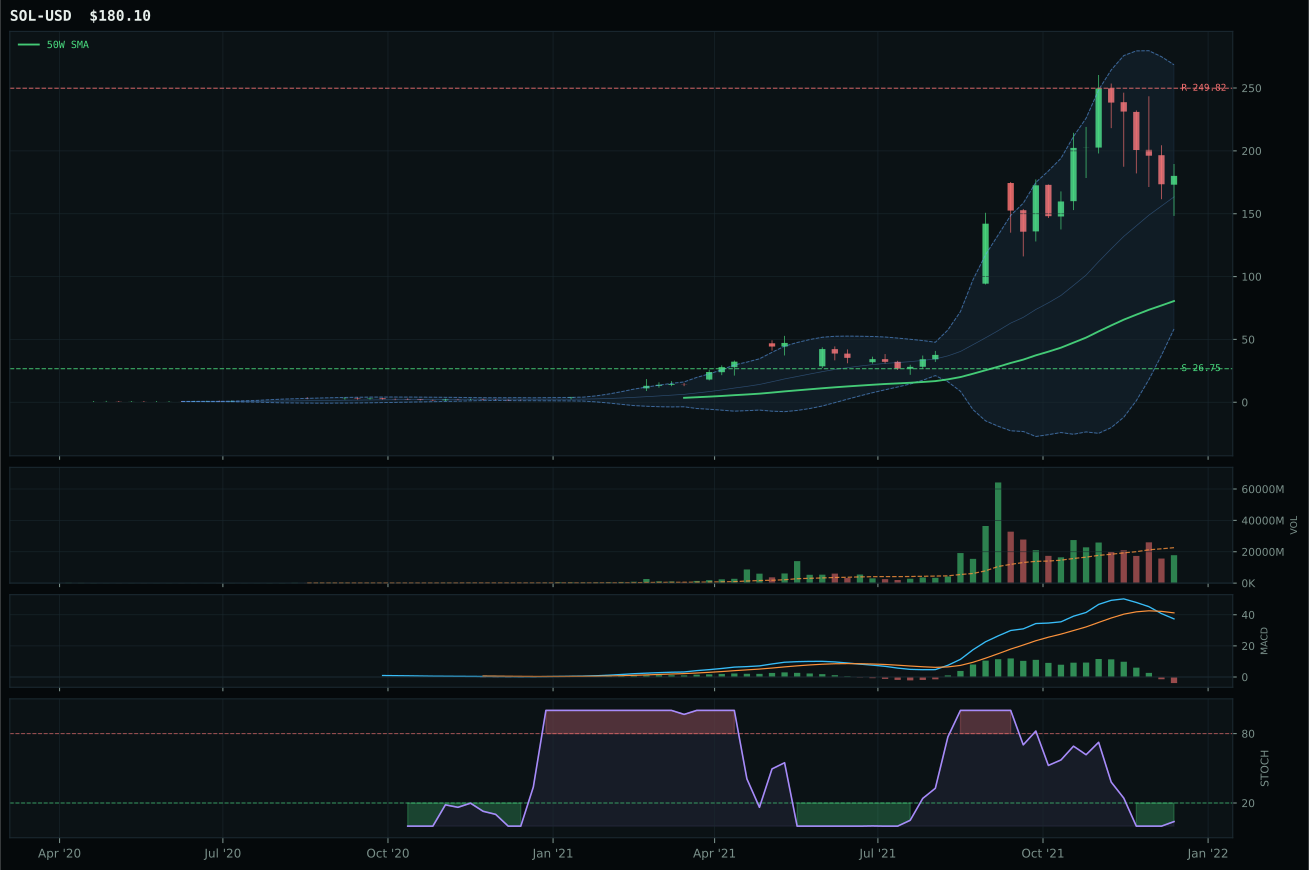
ValueBTC not armed: BTC has not made the first post-breakdown touch of the 200W buy zone after losing the 50W
TrendBTC not confirmed
one or more available conditions failed
Category Rankings
| Rank | Category | Winner | Score | Alloc | 4W Ret | Peers (4W) |
|---|---|---|---|---|---|---|
| 1 | Traditional Energy | XLE | 58.9 | 20% | +24.83% | FCG +26.6% · XOP +24.7% |
| 2 | Agriculture & Livestock | MOO | 48.9 | 20% | +3.73% | VEGI +7.8% · WEAT -2.2% |
| 3 | Utilities & Infrastructure | XLU | 47.8 | 10% | +0.13% | PAVE +1.2% · IGF +4.7% |
| 4 | Precious Metals | GLD | 47.5 | 10% | +1.05% | GDX +1.1% · SLV +5.0% |
| 5 | Industrial Metals | COPX | 44.5 | 10% | +12.39% | PICK +12.2% · REMX +8.6% |
| 6 | AI | SMH | 35.1 | 10% | +4.07% | AIQ -3.3% · BOTZ -8.1% |
| 7 | Nuclear Energy | URA | 33.9 | 10% | -0.44% | NLR +2.5% · URNM -0.2% |
| 8 | Defense & Aerospace | ITA | 28.4 | 10% | +10.53% | ROKT +1.6% · XAR +5.9% |
| 9 | Technology | XLK | 28.0 | 0% | -1.00% | CIBR -5.4% · IGV -8.0% |
| 10 | Emerging Markets | IEMG | — | 0% | +3.71% | ILF +8.2% · INDA +9.4% |
Traditional Energy — XLE
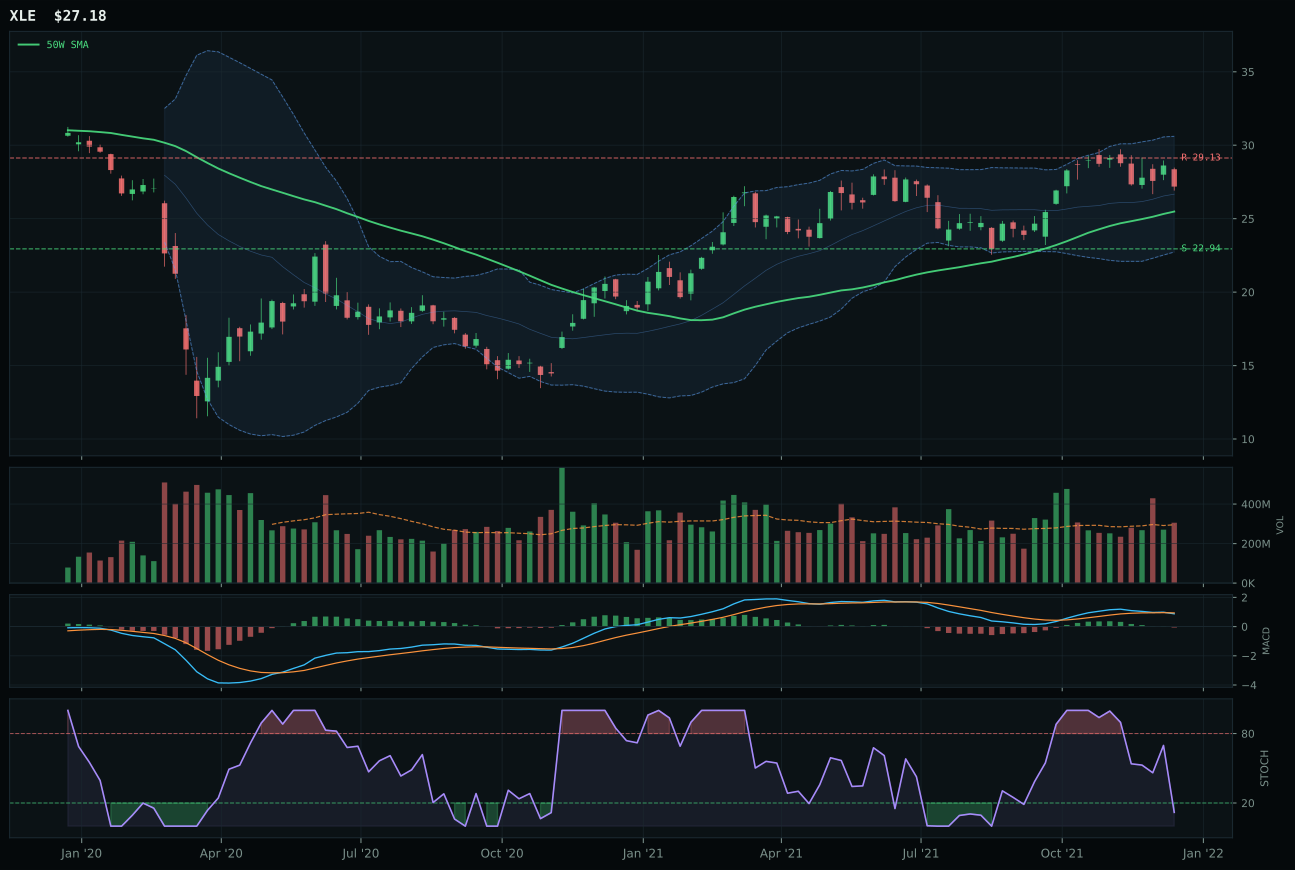
XLE has a neutral structure profile with 6.1% 13-week relative strength versus SPY.
A failed hold above support would weaken the setup.
Actionable but governed by invalidation levels.
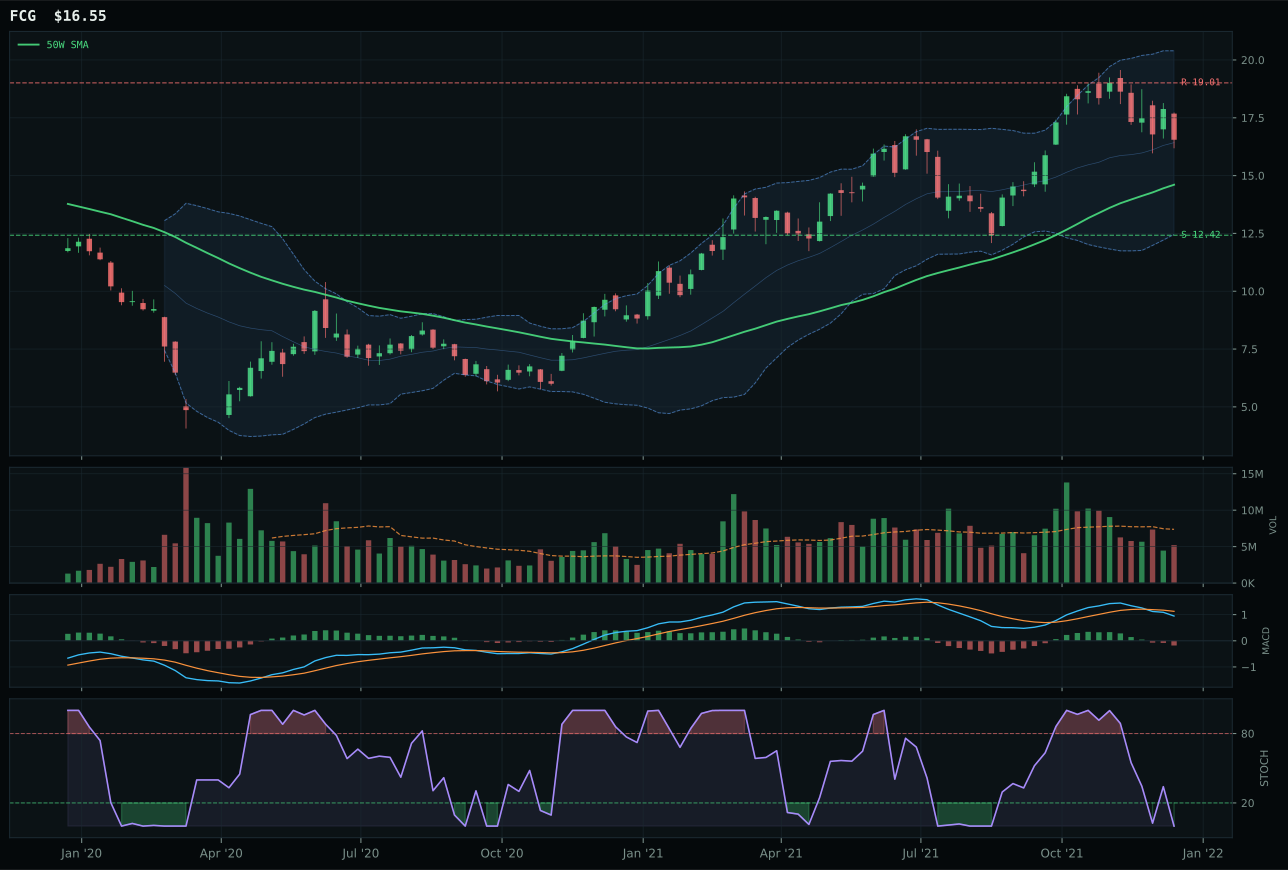
FCG has a neutral structure profile with 4.9% 13-week relative strength versus SPY.
A failed hold above support would weaken the setup.
Actionable but governed by invalidation levels.
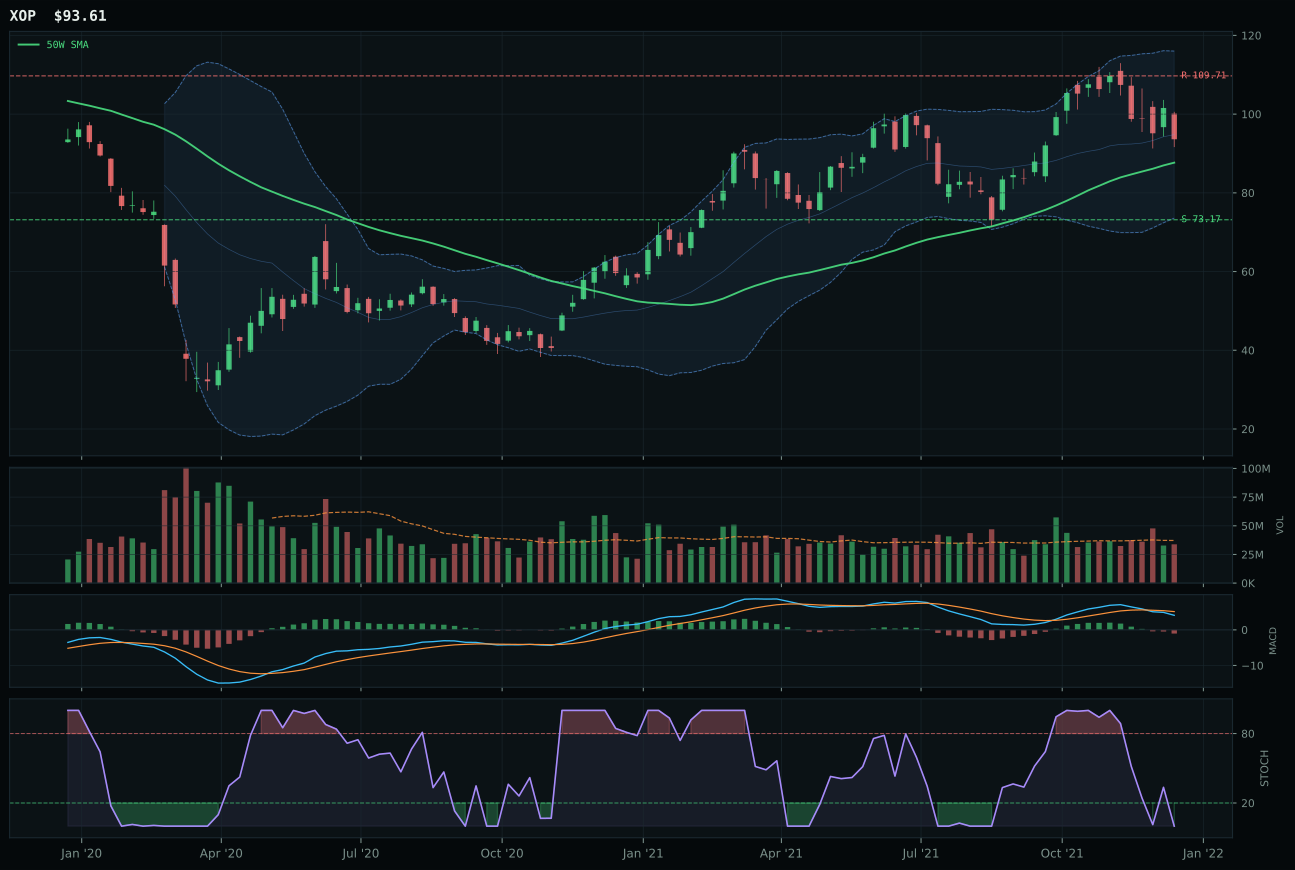
XOP has a neutral structure profile with 2.3% 13-week relative strength versus SPY.
A failed hold above support would weaken the setup.
Actionable but governed by invalidation levels.
XLE captures the top-2 Energy slot at 58.9/100 and 10% allocation by delivering 6.1% SPY outperformance on a 10.2% 13-week return—the strongest momentum in the portfolio—while maintaining category-relative strength of 1.1% despite price sitting just 6.7% above the 50W in a consolidation zone. MACD is bearish/weakening and stochastic RSI is oversold at 0.12, which would normally signal exhaustion, but the 70.0 timing score reflects that oversold conditions in a resource cycle are often capitulation moments, not peaks. Volume at 1.03x the 20W average is neutral, and structure is clean at 72.4—XLE is neither extended nor broken. FCG lost the category because it is stretched 13.3% from the 50W (more vulnerable to pullback), its stochastic RSI sits oversold but with no turn-up confirmation yet, volume is thin at participation levels, and category-relative strength is 0.0%. The 51.5 risk/reward favors XLE's tighter setup.
Traditional Energy ranks top-2 at 58.9/100 with 10% allocation because the macro fit of 85.0/100 is the highest in the portfolio: energy scarcity is active (+16 points), inflation pressure (+10), supply shortage (+9), and real-asset sponsorship (+7) create an overwhelming tailwind. Credit stress (–7) is the only headwind and is overwhelmed by the four supportive descriptors. XLE's technical evidence of 47.0/100 is moderate—trend 71.1, momentum confirmation 56.2, volume-price confirmation 50.5—yet the allocator is willing to carry a 10% overweight because macro regime alignment is so strong. In Transition/Mixed, with dollar pressure and inflation still running, energy's relative insensitivity to credit cycles and its inflation-hedge properties justify conviction sizing. This is a true top-2 macro conviction trade. A reversal to lower allocation would require energy scarcity to flip inactive or credit stress to escalate materially; neither is evident this week.
Agriculture & Livestock — MOO
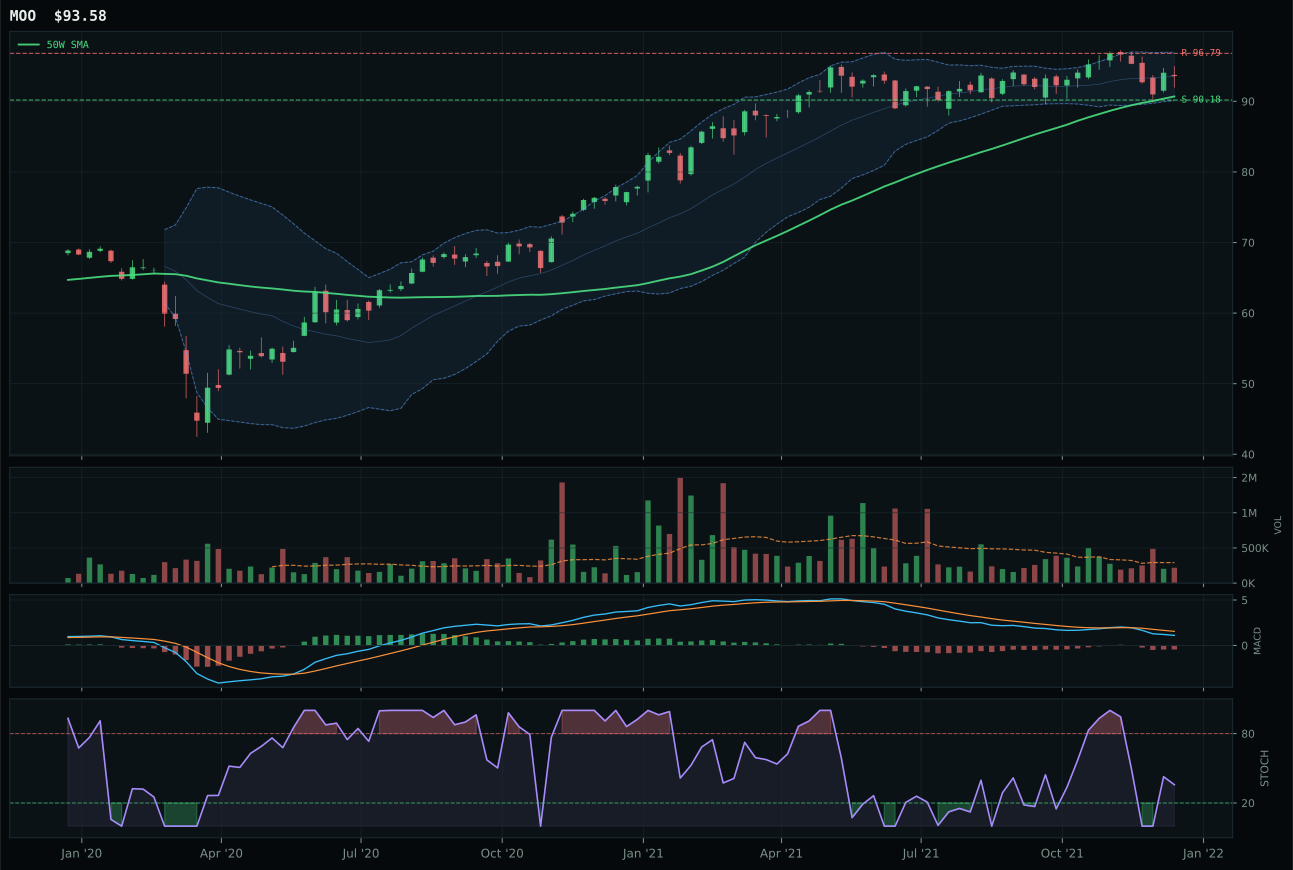
MOO has a pullback into support profile with -2.5% 13-week relative strength versus SPY.
A failed hold above support would weaken the setup.
Actionable but governed by invalidation levels.
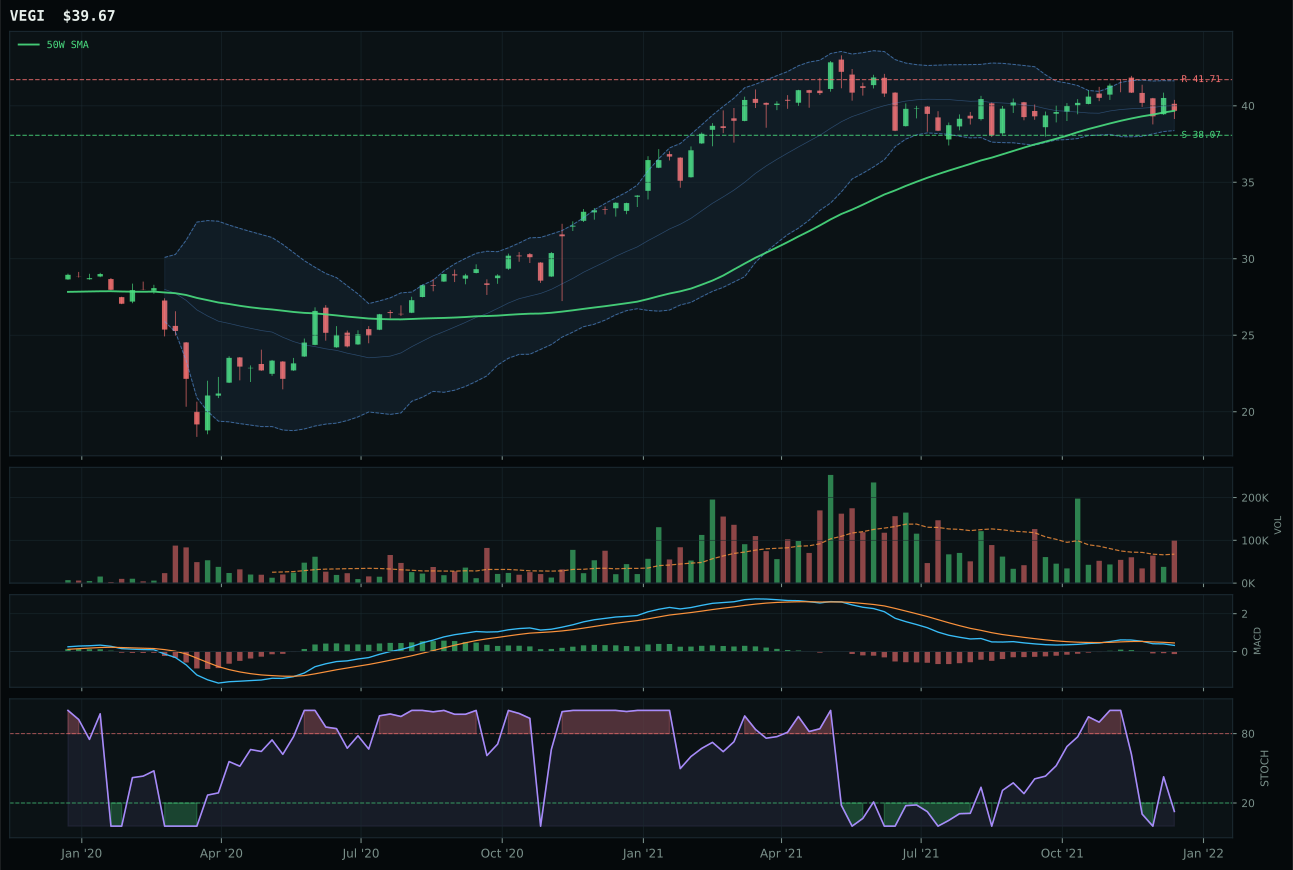
VEGI has a pullback into support profile with -3.3% 13-week relative strength versus SPY.
A failed hold above support would weaken the setup.
Tracked, but not top-2 eligible because: .
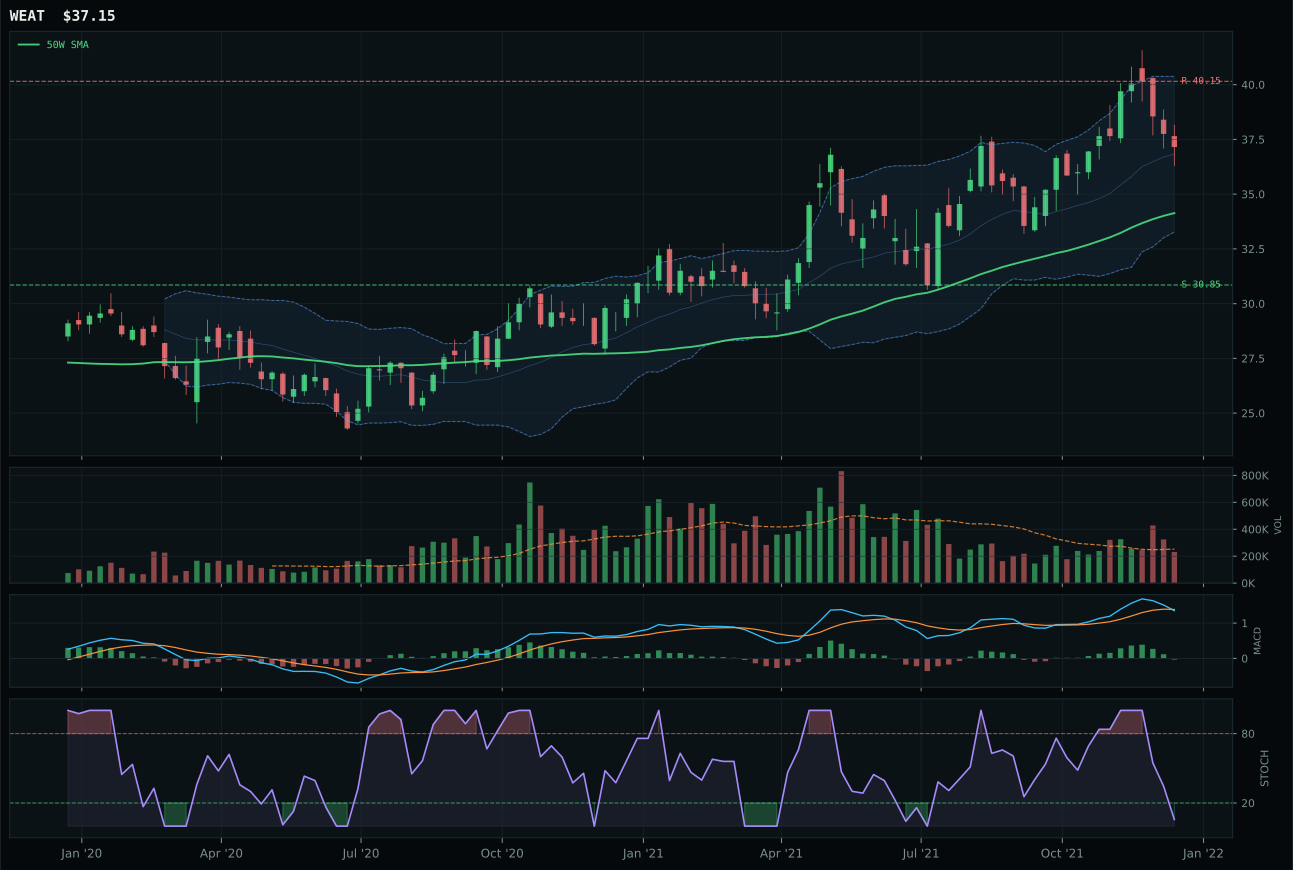
WEAT has a neutral structure profile with 3.8% 13-week relative strength versus SPY.
A failed hold above support would weaken the setup.
Tracked, but not top-2 eligible because: .
MOO secures the top-2 slot in Agriculture & Livestock with a 48.9 category score and 10% allocation by delivering a clean pullback-into-support setup that is timing-perfect: distance to 50W is 3.2%, stochastic RSI is rising mid-zone (0.36), and MACD is bearish/weakening but not broken—the chart says consolidation on firm ground. Category-relative strength is flat at 0.0%, which means MOO neither lags nor leads but is representative of the basket's pulse. The 100.0 timing score is the edge; price sits near Fib 0.236 at 92.01 with support just 3.8% below at 90.18, and the 60.8/100 risk/reward captures the asymmetry of a low-risk reset. VEGI stumbled despite higher volume and faster 13W return because stochastic RSI peaked at oversold turn-up (less confident setup) and trailed by 0.8% in relative strength. Agribusiness fundamentals are taut with supply shortage (+13 macro points) and inflation pressure (+10), creating structural tailwinds.
Agriculture & Livestock ranks as the top-2 category at 48.9/100 and receives 10% allocation because it combines defensible technicals with exceptional macro fit of 86.0/100. Supply shortage is active and worth +13 points, inflation pressure adds +10, real-asset sponsorship contributes +8, and commodity-breadth-positive is active (+5)—the macro vector is unambiguous. MOO's 78.2 trend score reflects price above both 50W and 200W with a 0.3% slope; the 100.0 timing score on a pullback is the crown jewel. Even though momentum confirmation is only 30.0/100 (13W return is weak at 1.7% and 4W return is –1.8%), the macro regime is so supportive that the allocator is willing to hold a low-energy setup. This is portfolio ballast: technicals say rest, macro says own. A 10% overweight reflects conviction that inflation and supply constraints will persist through year-end, making real assets the portfolio's anchor.
Utilities & Infrastructure — XLU
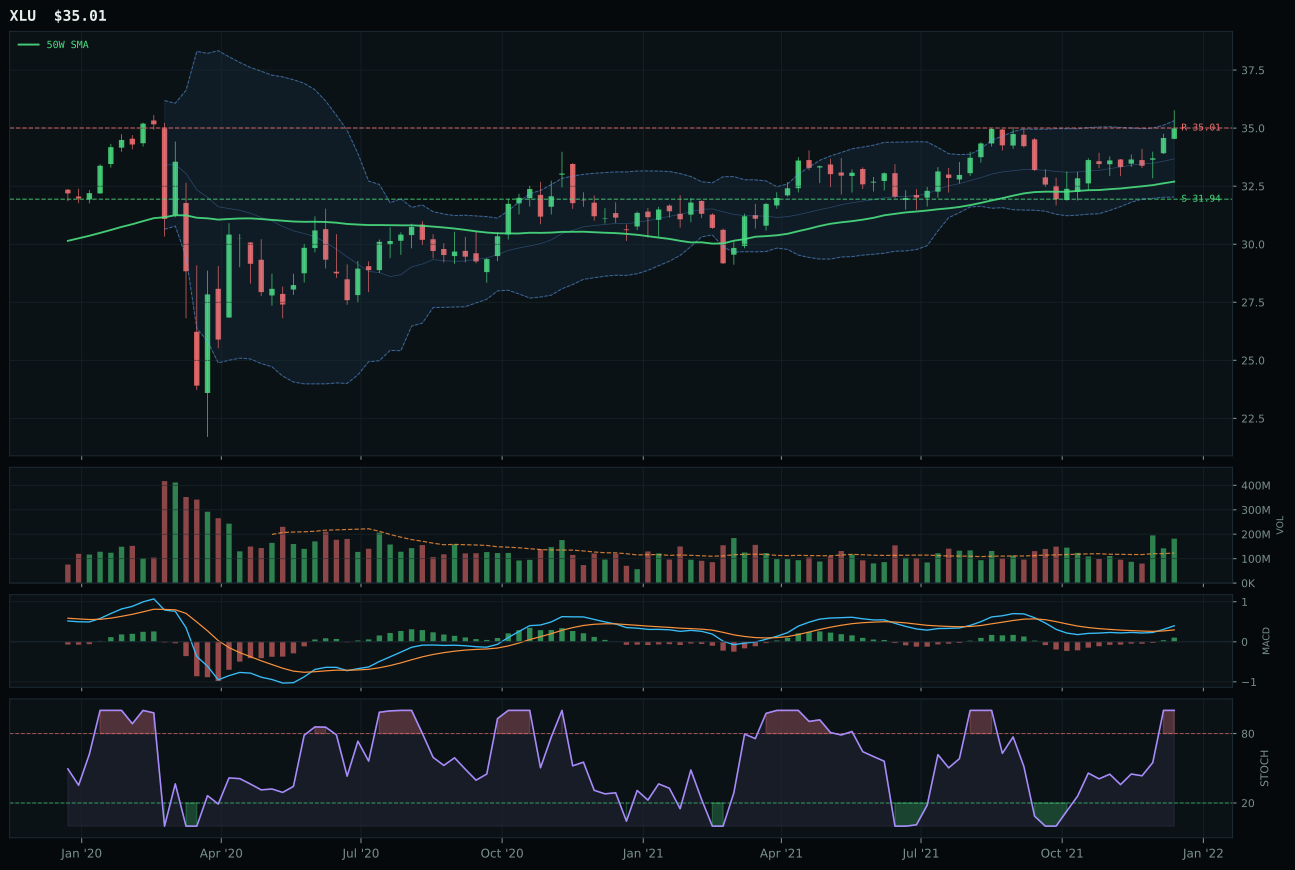
XLU has a neutral structure profile with 1.3% 13-week relative strength versus SPY.
A failed hold above support would weaken the setup.
Actionable but governed by invalidation levels.
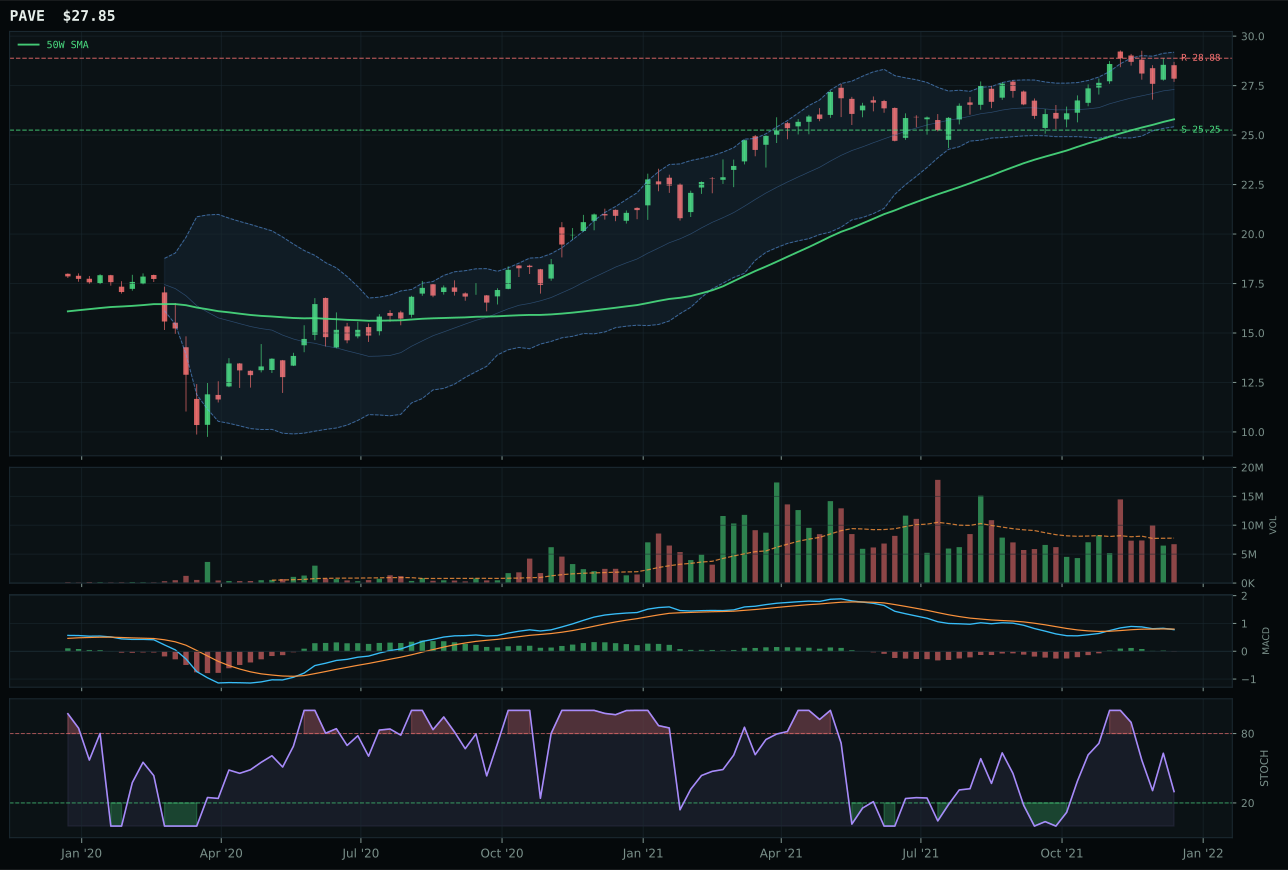
PAVE has a neutral structure profile with 3.1% 13-week relative strength versus SPY.
A failed hold above support would weaken the setup.
Actionable but governed by invalidation levels.
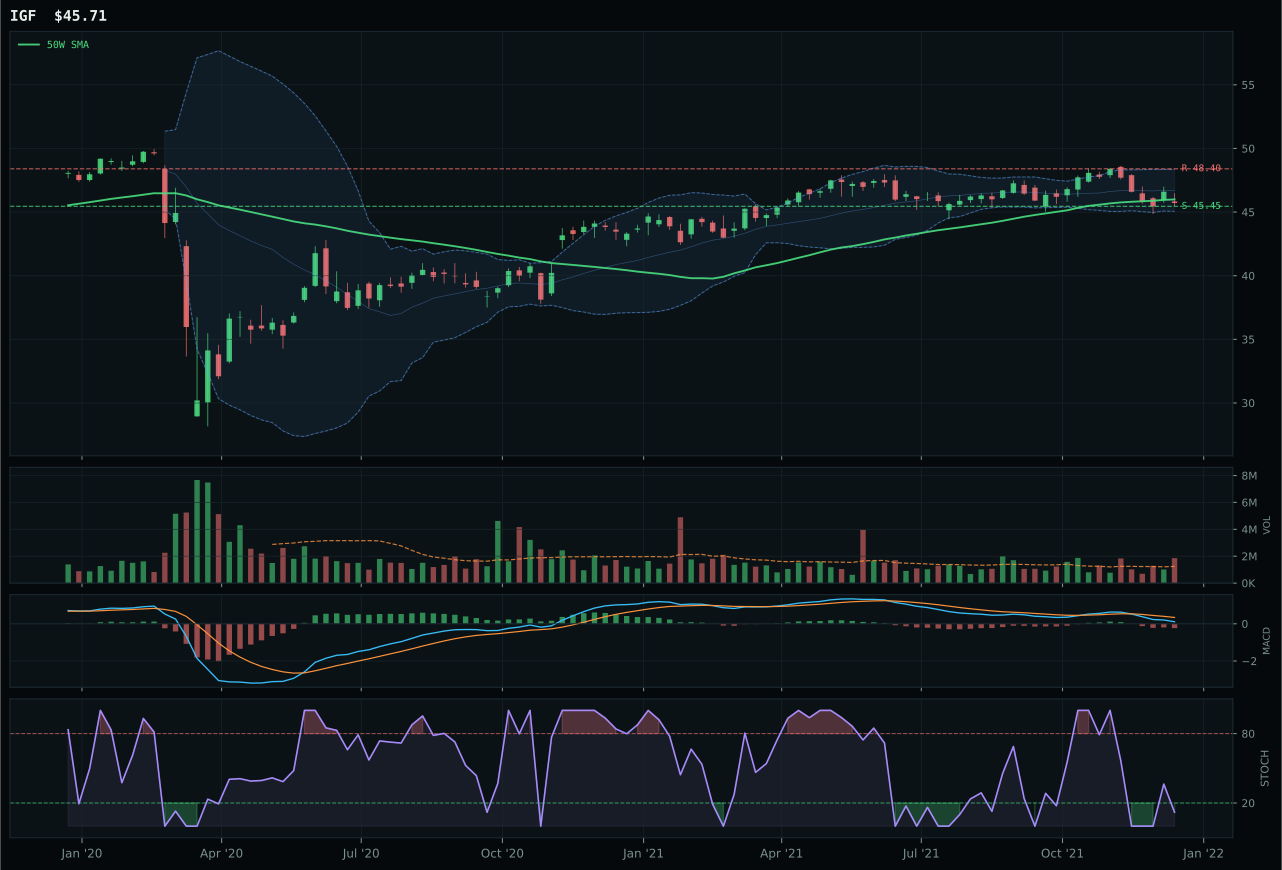
IGF has a pullback into support profile with -4.6% 13-week relative strength versus SPY.
A failed hold above support would weaken the setup.
Actionable but governed by invalidation levels.
XLU wins Utilities & Infrastructure with a 47.8 category score by delivering the portfolio's cleanest bullish technicals: price above both 50W and 200W with a 0.2% slope, MACD bullish-and-improving (not just flattening), stochastic RSI at full overbought momentum (1.00), and a 100.0 trend score. The 13W return of 5.4% is solid on only 1.3% SPY relative strength, which means utilities outperformance is pure sector quality, not beta. The 75.0 timing score and 80.3 momentum confirmation reflect that XLU is in an uptrend with confirmation; volume at 1.48x the 20W shows above-average participation, and the 80.6 structure score is the cleanest in its category. PAVE stumbled because MACD deteriorated to bearish/weakening, stochastic RSI is falling/neutral (no momentum), and volume turned neutral—PAVE is a laggard. The 13.4-point score gap is decisive.
Utilities & Infrastructure earned 5% as tier-2 despite XLU's clean setup, because the category score of 47.8/100 ranks below top-2 thresholds. Technical evidence is strong at 85.1/100 for XLU (the highest in its category), but macro fit is only 48.0/100—Transition/Mixed helps (+4), broad-market bear is active (+4), but inflation pressure creates drag (–6). Utilities are defensive and bond-proxy sensitive, so the current macro regime of lingering inflation and rate-regime uncertainty creates friction against larger sizing. XLU's full overbought stochastic RSI (1.00) and bullish MACD are the strongest technicals in the entire portfolio, yet the allocator sized this at only 5% tier-2 rather than pushing for top-2 because rate sensitivity limits conviction when macro uncertainty persists. To move to tier-1, Utilities would need macro fit to improve (inflation pressure to fade or credit stress to escalate sharply, making duration a strategic advantage), or XLU to show SPY outperformance above 2% with 13W momentum above 6%—current setup is technically excellent but macro-constrained.
Precious Metals — GLD
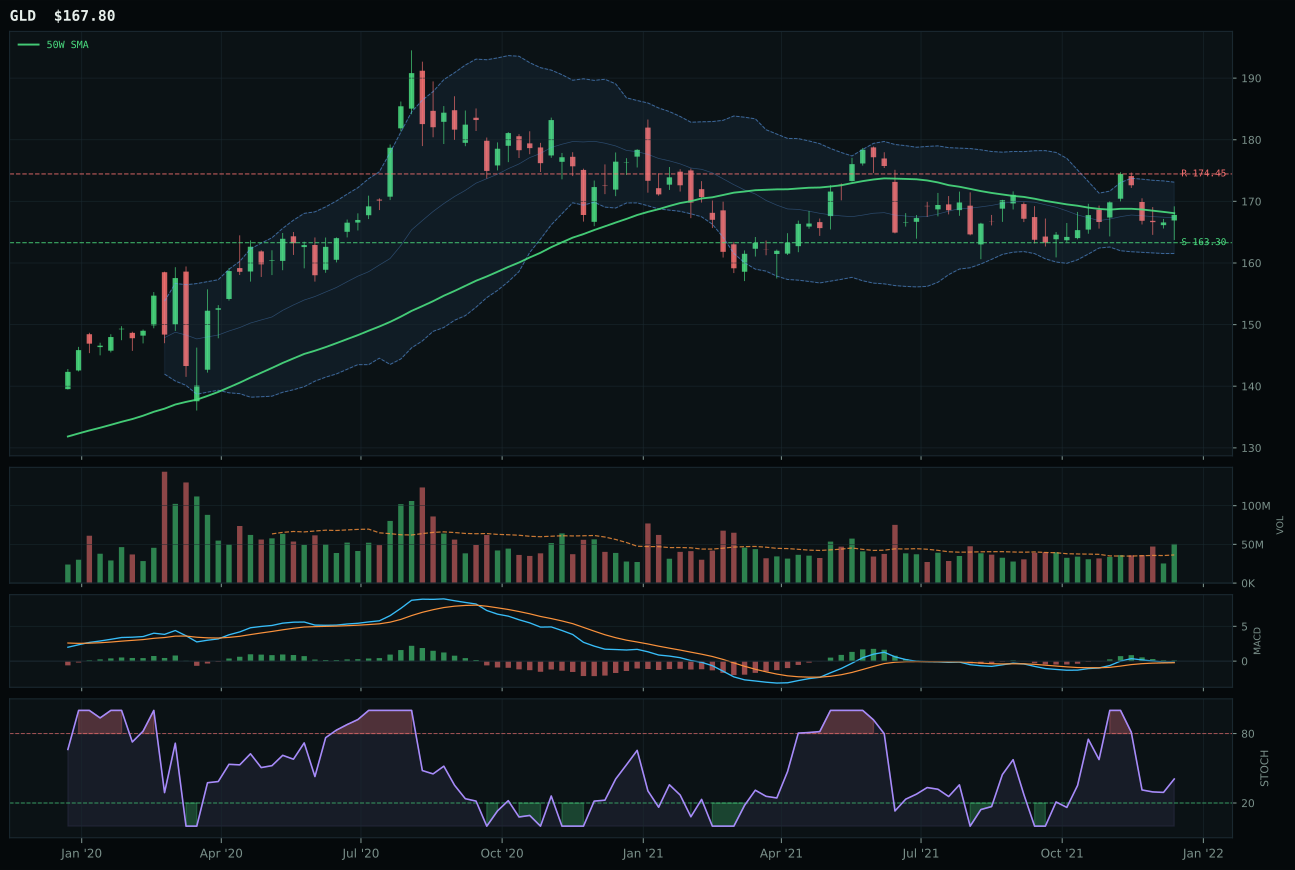
GLD has a pullback into support profile with -1.7% 13-week relative strength versus SPY.
A failed hold above support would weaken the setup.
Actionable but governed by invalidation levels.
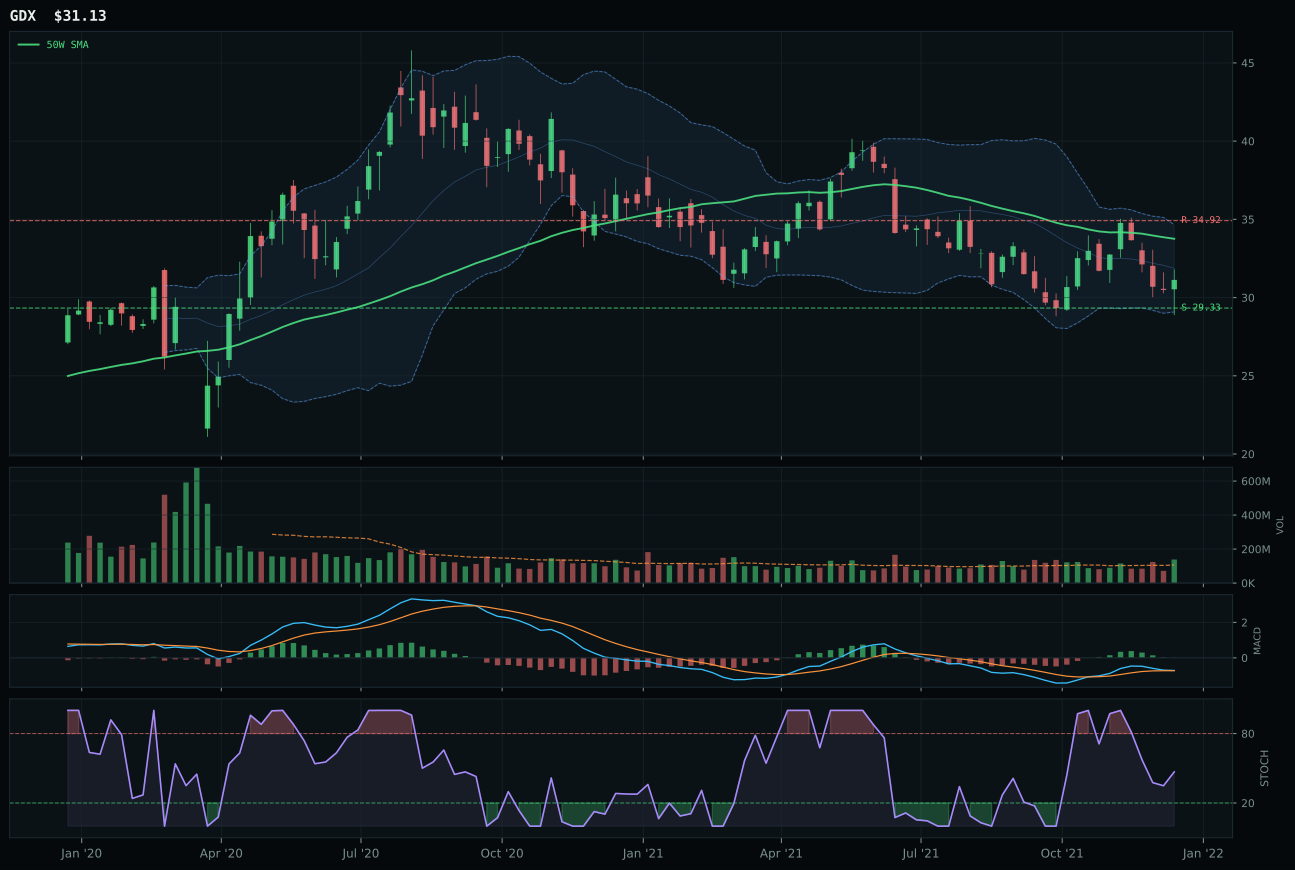
GDX has a neutral structure profile with -2.4% 13-week relative strength versus SPY.
A failed hold above support would weaken the setup.
Actionable but governed by invalidation levels.
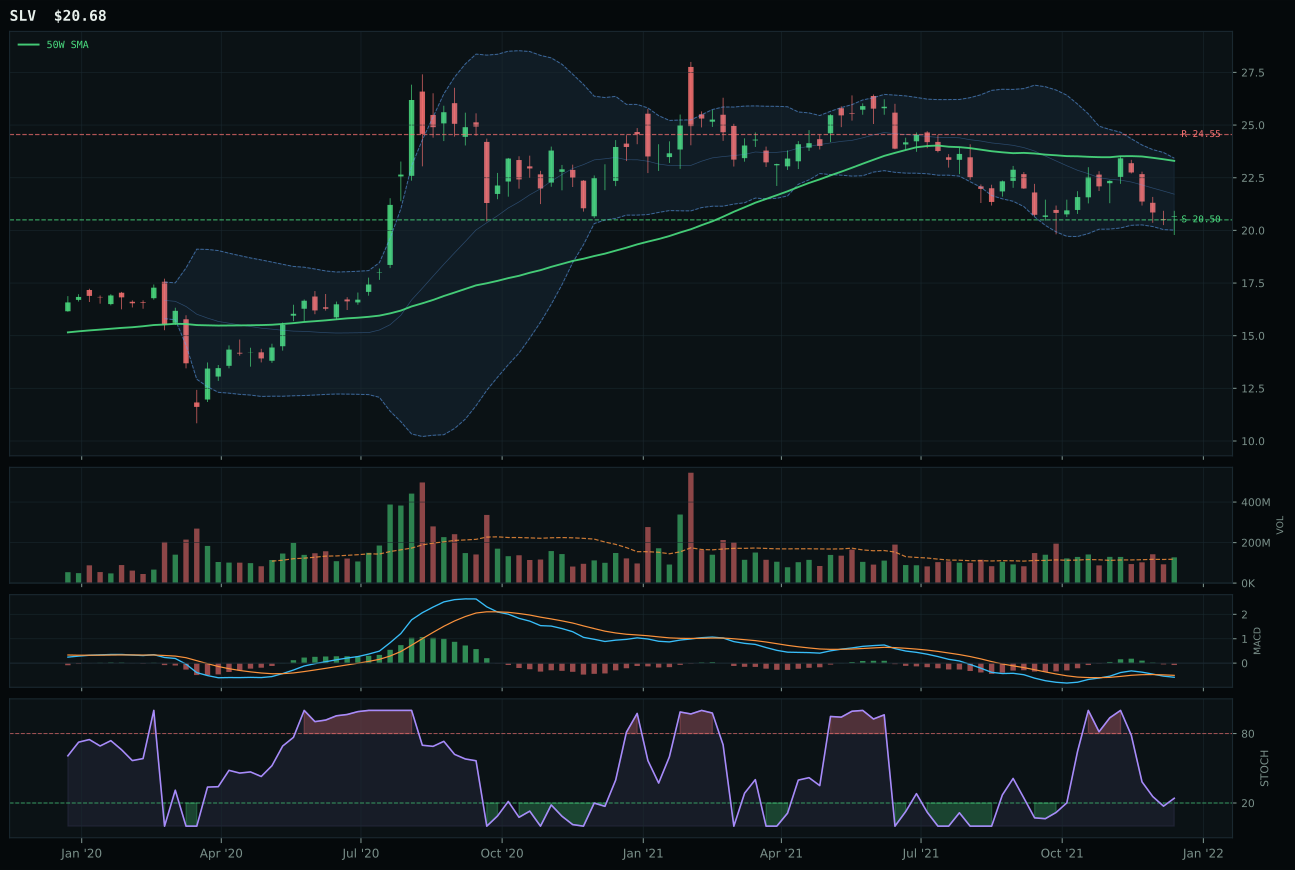
SLV has a pullback into support profile with -4.5% 13-week relative strength versus SPY.
A failed hold above support would weaken the setup.
Actionable but governed by invalidation levels.
GLD wins Precious Metals with a 47.5 category score by executing the most confidence-inspiring reset: price is just –0.2% from the 50W (no mechanical pullback, just a nudge), stochastic RSI is rising mid-zone, MACD is bullish-but-flattening, and support sits 2.8% below at 163.30. The 100.0 timing score reflects textbook decision-zone setup where buyers can scale in without fear of hard breakdown. GLD's 2.5% 13W return is modest, but the 0.7% category-relative strength and –1.7% SPY underperformance mean gold is behaving like a monetary hedge, not a momentum play—appropriate for Transition/Mixed regimes. Volume at 1.39x the 20W average shows institutional participation. GDX lost despite competitive timing because its stochastic RSI is falling/neutral (momentum darkening), structure is less clean at 71.5, and category-relative strength flatlined at 0.0%. The 77.9/100 risk/reward is tight—only 2.8% downside protection against –3.8% upside to resistance, which is cramped for a mean-reversion play.
Precious Metals earned 5% as tier-2 because the 47.5 category score ranks below top-2 thresholds, but dollar pressure (+3 macro points) and the Transition/Mixed regime create a small allocation warrant. GLD's technical evidence of 65.6/100 is respectable; MACD remains bullish though flattening, and the pullback-into-support setup is mechanically clean. However, the macro fit of 52.0/100 is middling—dollar pressure is the only active descriptor supporting metals, and credit stress is not flagged as a counterweight. In a regime where broad-market bear could accelerate, gold's 1.3% SPY relative strength is too weak to justify a larger slot; the category must prove it can outperform risk-on rebounds. To move to tier-1, GLD needs MACD to improve to bullish-and-improving (currently it is just maintaining), 13W returns to accelerate, and a clear breakdown in real rates or USD to push dollar-pressure negative; current setup is adequate hedge, not conviction core.
Industrial Metals — COPX
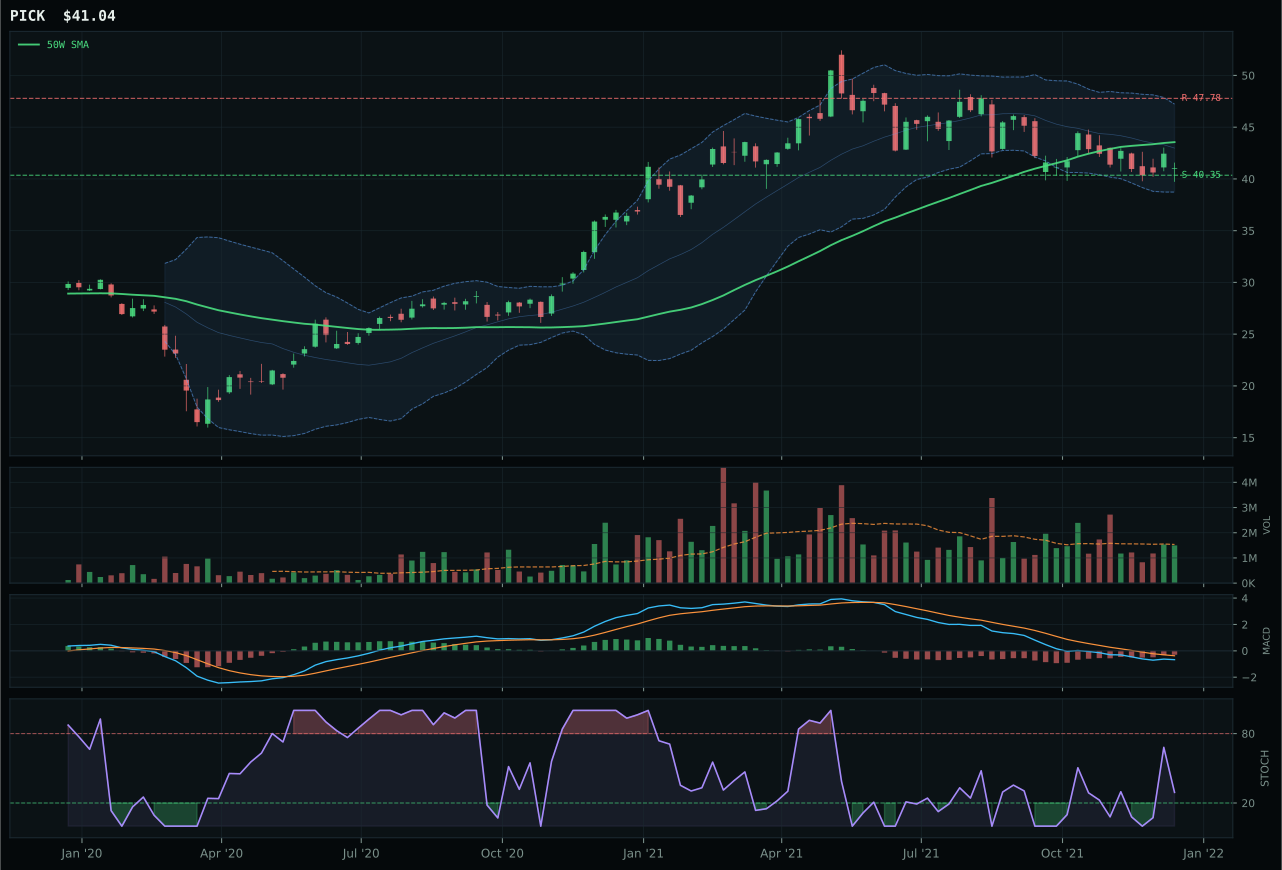
PICK has a pullback into support profile with -7.0% 13-week relative strength versus SPY.
A failed hold above support would weaken the setup.
Actionable but governed by invalidation levels.
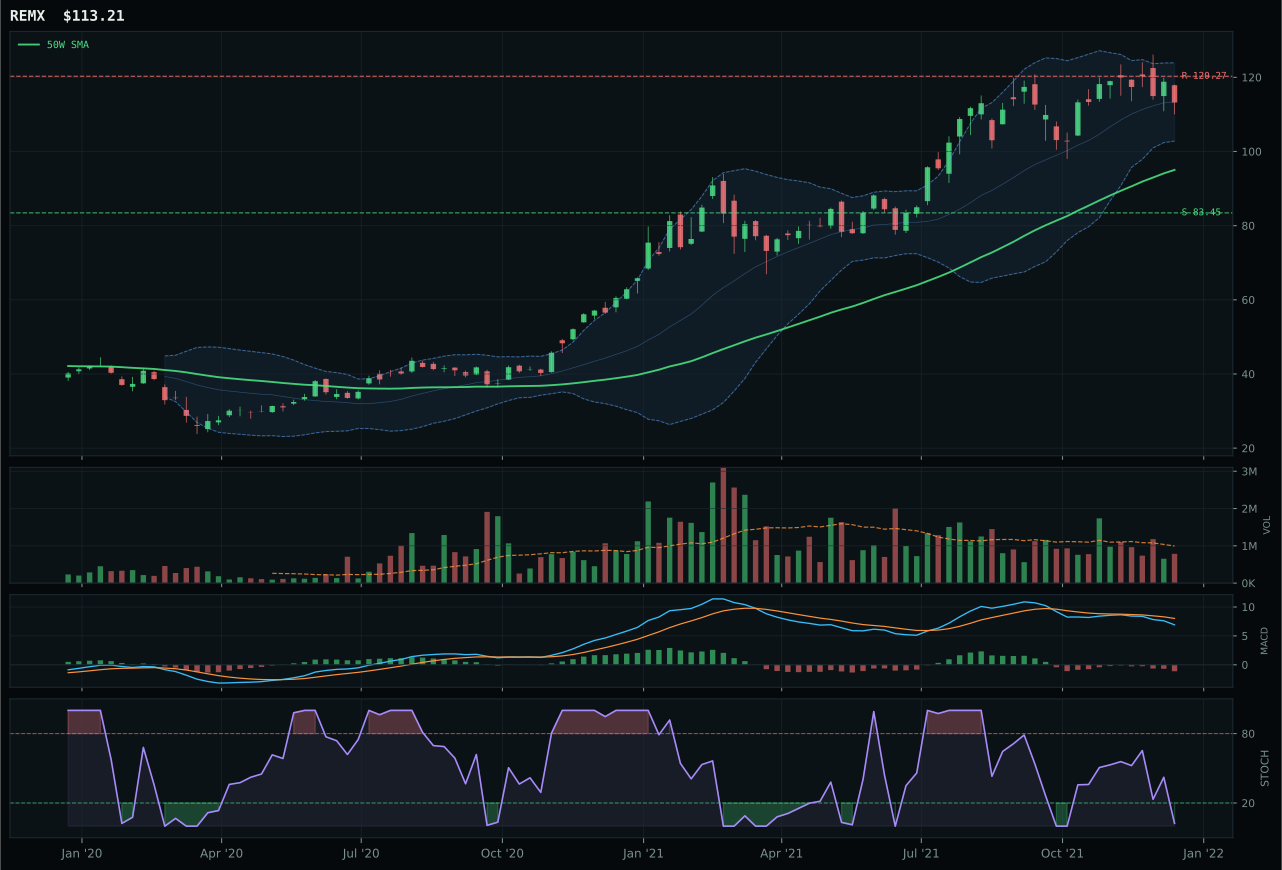
REMX has a vertical extension profile with -3.7% 13-week relative strength versus SPY.
A failed hold above support would weaken the setup.
Actionable but governed by invalidation levels.
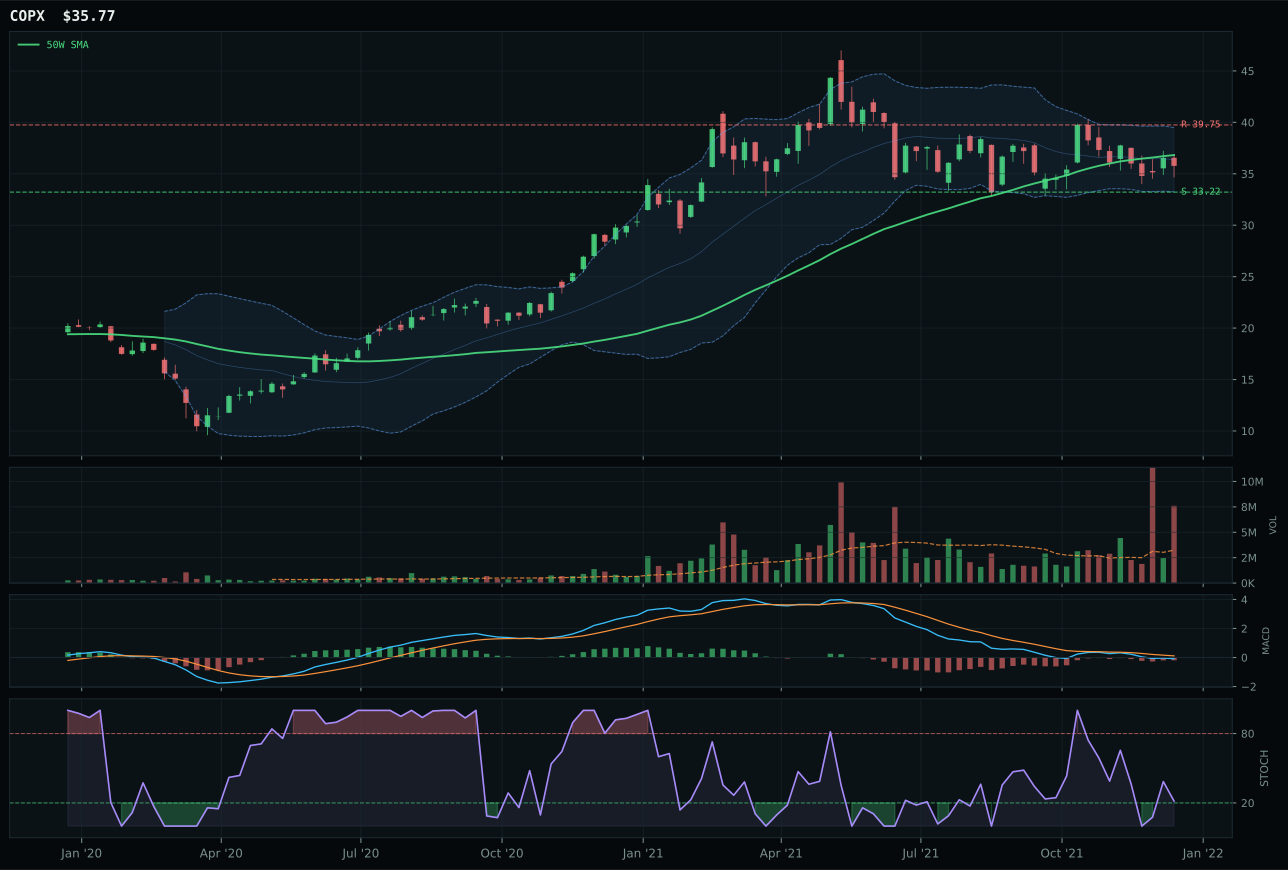
COPX has a compression near 50W profile with -2.4% 13-week relative strength versus SPY.
A failed hold above support would weaken the setup.
Actionable but governed by invalidation levels.
COPX wins Industrial Metals with a 44.5 category score by offering the highest timing score of 100.0 on a compression-near-50W setup—the chart is coiled, stochastic RSI is rising mid-zone (0.22), MACD is bearish/weakening but not collapsing, and price is just –2.9% from the 50W. Compression near the 50W can be either a prelude to accumulation or a false bounce, so the allocator depends on category-relative strength to arbitrate; COPX's 1.3% outperformance within the basket justifies representation. The 2.35x volume at 20W average shows distribution pressure—traders are selling rallies—but the 1.8% 13W return and –2.4% SPY underperformance signal that copper is not leading risk-on moves. PICK lost the bid despite a 46.9 reasoned ETF score higher than COPX's 34.8, because the category-reasoner filter penalizes momentum confirmation; PICK's –2.8% 13W return and –3.3% category-relative strength lagged, and the mining basket (PICK, REMX, COPX) showed signs of institutional rotation away from diversified miners toward copper-specific scarcity plays.
Industrial Metals earned 5% as tier-2, ranking below top-2 despite a category score of 44.5/100 driven by macro fit of 66.0/100—metals scarcity is active (+14 points) and commodity-breadth-positive is firing (+10). Real-asset sponsorship adds +6, but credit stress (–7) and dollar pressure (–7) create friction. COPX's technical evidence is weak at only 22.0/100; trend is 63.5, momentum confirmation is 22.5, and persistence is 26.7—these are not conviction signals. PICK ranked higher technically but lost the category representative slot because the reasoner filtered for quality persistence; COPX's compression setup, though tight, offers defined breakout potential. To justify a tier-1 slot, Industrial Metals needs MACD to improve across the basket, 13W returns to turn positive, and copper to show SPY outperformance above 2%; current allocation reflects scarcity-thesis belief but weak technical execution—a macro bet, not a momentum bet.
AI — SMH
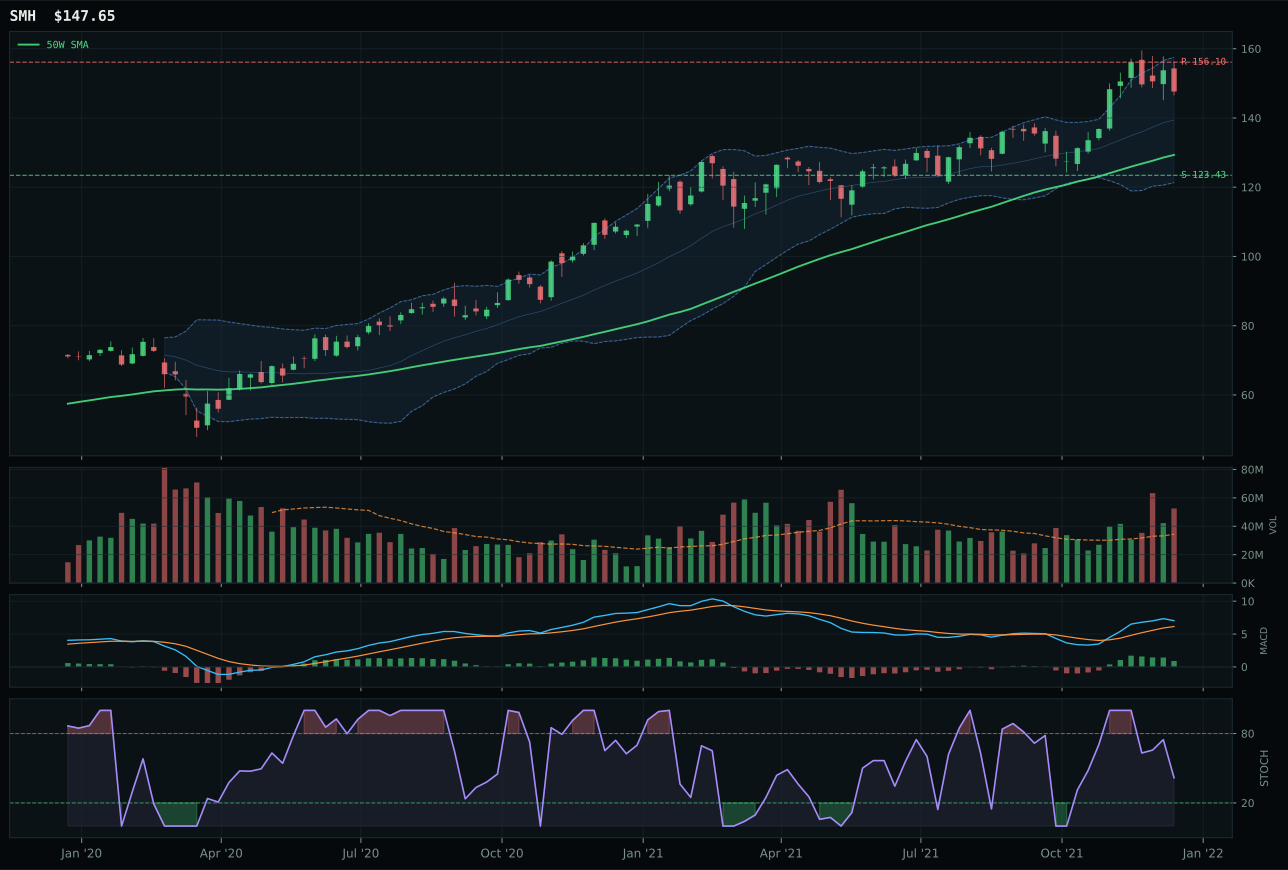
SMH has a neutral structure profile with 4.8% 13-week relative strength versus SPY.
A failed hold above support would weaken the setup.
Actionable but governed by invalidation levels.
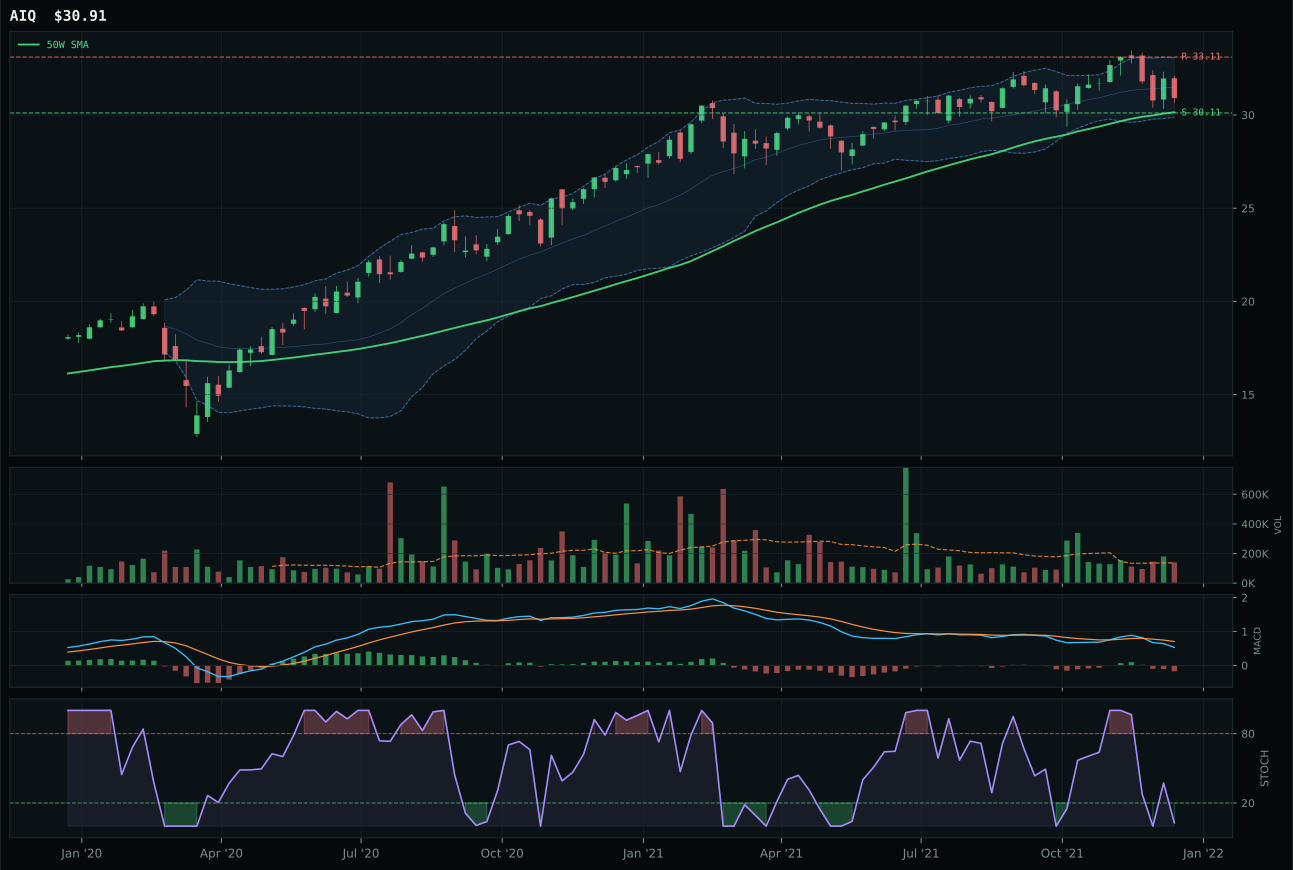
AIQ has a pullback into support profile with -5.6% 13-week relative strength versus SPY.
A failed hold above support would weaken the setup.
Tracked, but not top-2 eligible because: .
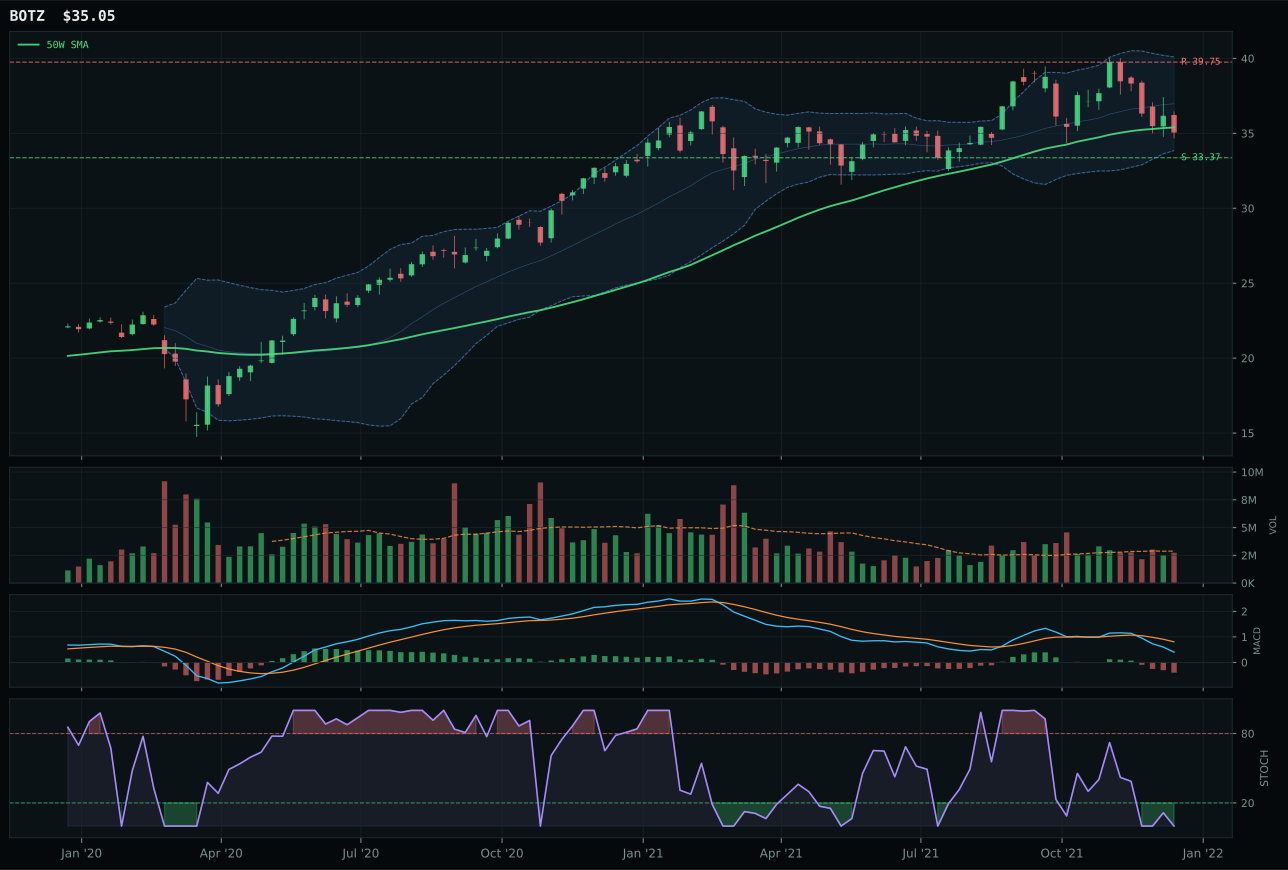
BOTZ has a compression near 50W profile with -14.3% 13-week relative strength versus SPY.
A failed hold above support would weaken the setup.
Actionable but governed by invalidation levels.
SMH captures the AI category with a 35.1 score by delivering 10.3% category-relative strength—the cleanest proof of intra-basket dominance—while posting a 4.8% SPY outperformance on 9.0% 13-week returns. The semiconductor/compute hardware thesis is mechanically sound: price above both the 50W and 200W with a 0.6% slope, MACD bullish-but-flattening, and stochastic RSI in falling/neutral at 0.42, which indicates momentum may be consolidating rather than rolling over. Volume sponsors the move at 1.53x the 20W average, and the structure is neutral—meaning buyers can accumulate without fighting extended-supply conditions. AIQ forfeited the contest with a bearish/weakening MACD, oversold stochastic turn-up that promised reversal but no actual confirmation, and 13-week return of only –1.4% paired with –5.6% SPY underperformance. The 21.6-point gap between winners is unambiguous.
AI received 5% allocation as a tier-2 holding, ranking below the two highest-scoring categories but still meriting a slot. The category scored 35.1/100 driven by robust macro fit of 44.0/100—AI growth sponsorship is active and worth +14 points, offsetting some credit stress damage. However, SMH's momentum confirmation of only 66.9/100 and its volume-price persistence at 54.9/100 signal that the uptrend, though technically intact, lacks the aggressive institutional sponsorship needed for a top-2 overweight. The macro regime supports holding but not pushing; credit stress remains active (–8 points at category level), and broad-market bear is now firing (–8 points), creating friction against momentum chasers. To earn top-2 status, this category would need MACD to improve to bullish-and-improving, SMH's 13W return to accelerate beyond 9%, or the broad-market-bear descriptor to flip inactive.
Nuclear Energy — URA
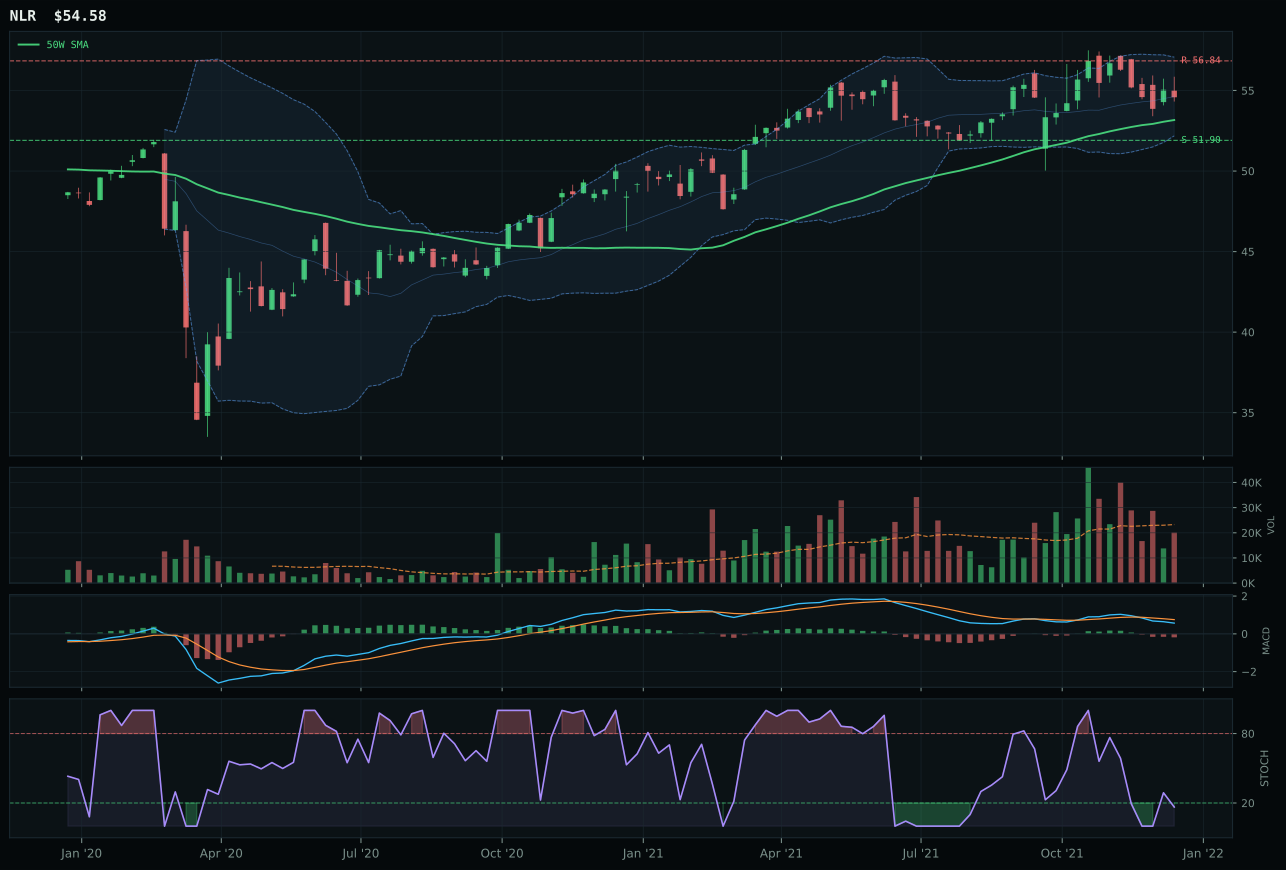
NLR has a compression near 50W profile with -4.1% 13-week relative strength versus SPY.
A failed hold above support would weaken the setup.
Tracked, but not top-2 eligible because: .
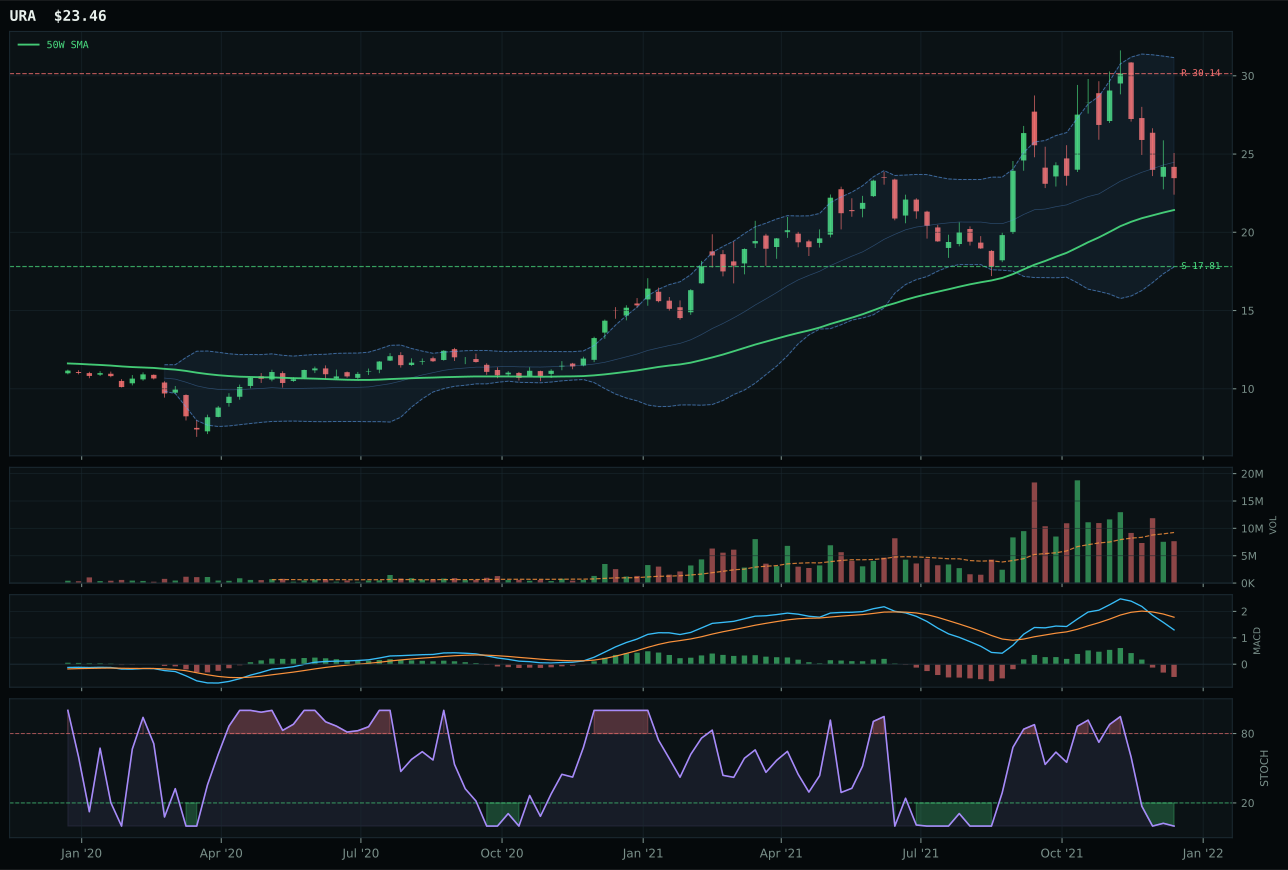
URA has a neutral structure profile with -12.4% 13-week relative strength versus SPY.
A failed hold above support would weaken the setup.
Actionable but governed by invalidation levels.
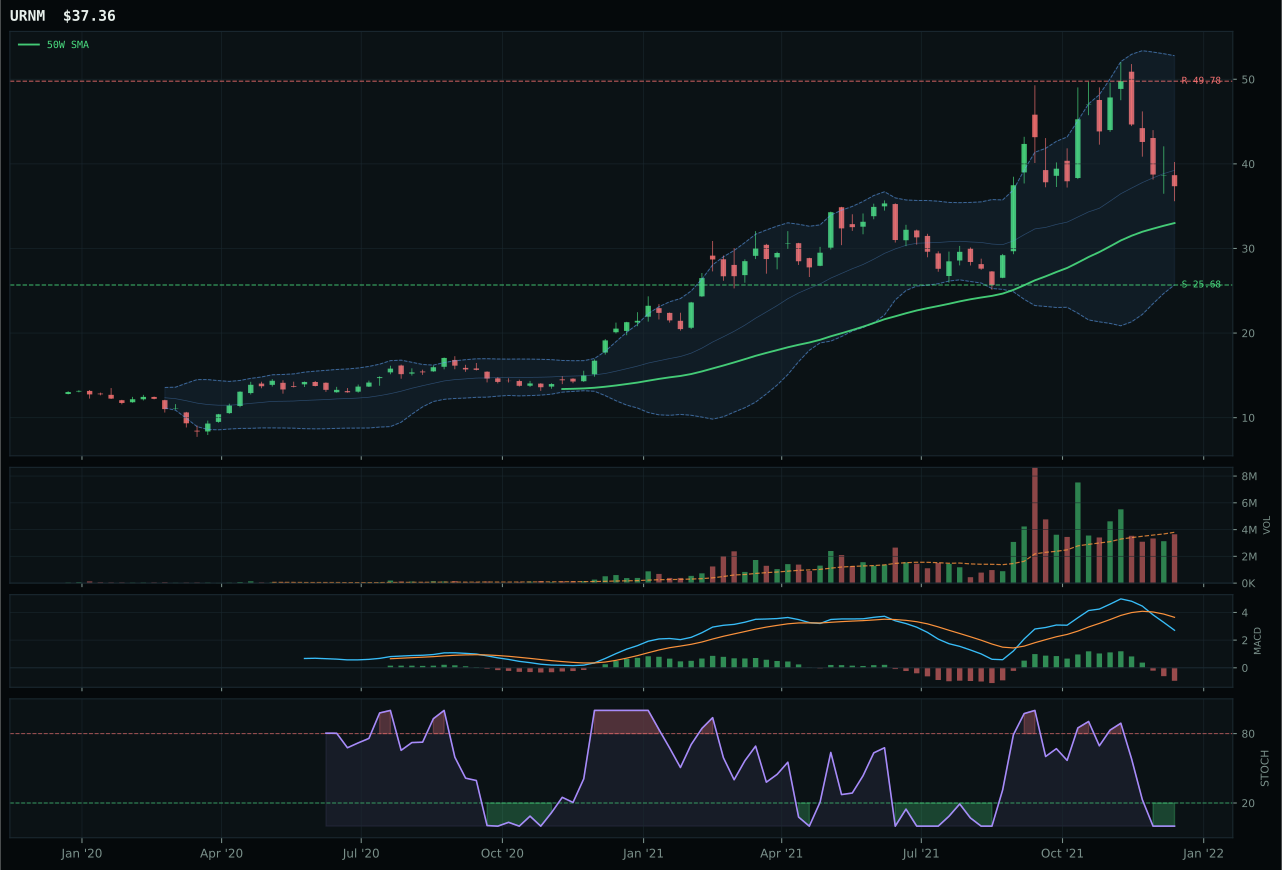
URNM has a neutral structure profile with -17.6% 13-week relative strength versus SPY.
A failed hold above support would weaken the setup.
Actionable but governed by invalidation levels.
URA wins Nuclear Energy with a 33.9 category score—a low absolute level—by edging out NLR in a close matchup where both setups are challenging. URA's edge is marginal: price is above both 50W and 200W with a 0.8% slope, structure is neutral (61.3), and timing is 77.0 on oversold stochastic at 0.00, which signals deep capitulation. The 13W return is –8.2% with –12.4% SPY underperformance and 0.0% category-relative strength, meaning uranium is down with the market and adding no outperformance; momentum confirmation is a flat 0.0/100. NLR actually has better structure (71.8), better timing (100.0 on compression near 50W), better momentum (44 vs 0), but the category reasoner weighted URA's oversold turn-up more heavily than NLR's rising mid-zone stochastic. The 1.4-point score gap reflects a coin-flip decision in a weak category where technicals are nearly uniformly negative.
Nuclear Energy earned 5% as tier-2 despite the 33.9 category score—the second-lowest in the portfolio—because macro fit of 69.0/100 supports the thesis even if technicals do not. Energy scarcity is active (+9), real-asset sponsorship (+7), and AI growth sponsorship (+5) provide some offset to credit stress (–5). URA's technical evidence is only 21.4/100, and the reasoner penalizes this harshly: trend 67, momentum confirmation 0.0, volume-price confirmation 30.5, persistence 31.1. The allocation reflects a macro bet on energy scarcity and AI power demand sustaining nuclear's long-term case despite near-term momentum collapse. NLR's superior technicals (45.0 technical evidence) and better setup did not overcome URA's fractional edge in the weighted proof order. To move to tier-1, Nuclear Energy would need URA or NLR to recover 13W momentum into positive territory, MACD to improve to bullish, and stochastic RSI to confirm with higher lows; none of these conditions exist this week. This is a max 5% conviction-bet allocation awaiting technical recovery.
Defense & Aerospace — ITA
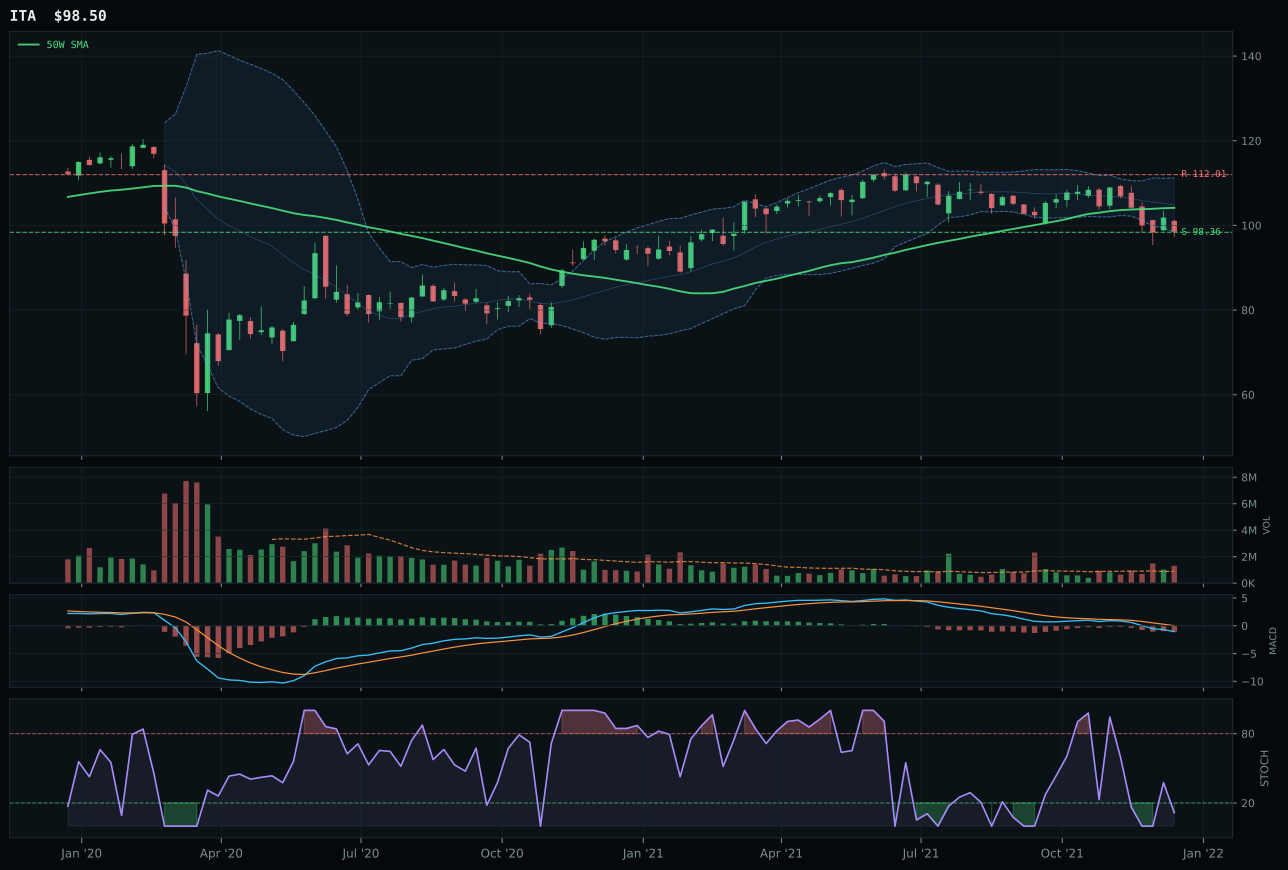
ITA has a pullback into support profile with -8.0% 13-week relative strength versus SPY.
A failed hold above support would weaken the setup.
Actionable but governed by invalidation levels.
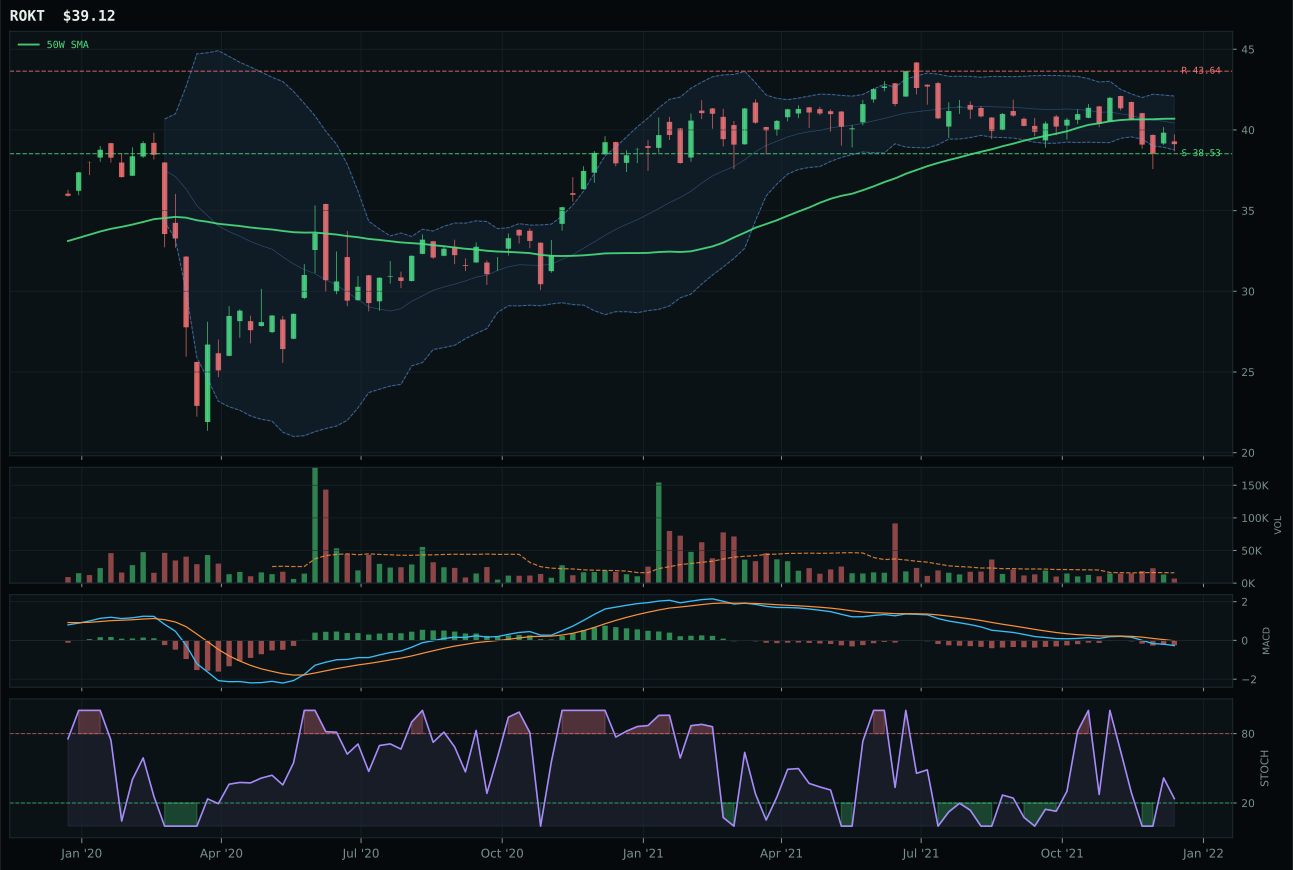
ROKT has a pullback into support profile with -6.1% 13-week relative strength versus SPY.
A failed hold above support would weaken the setup.
Tracked, but not top-2 eligible because: .
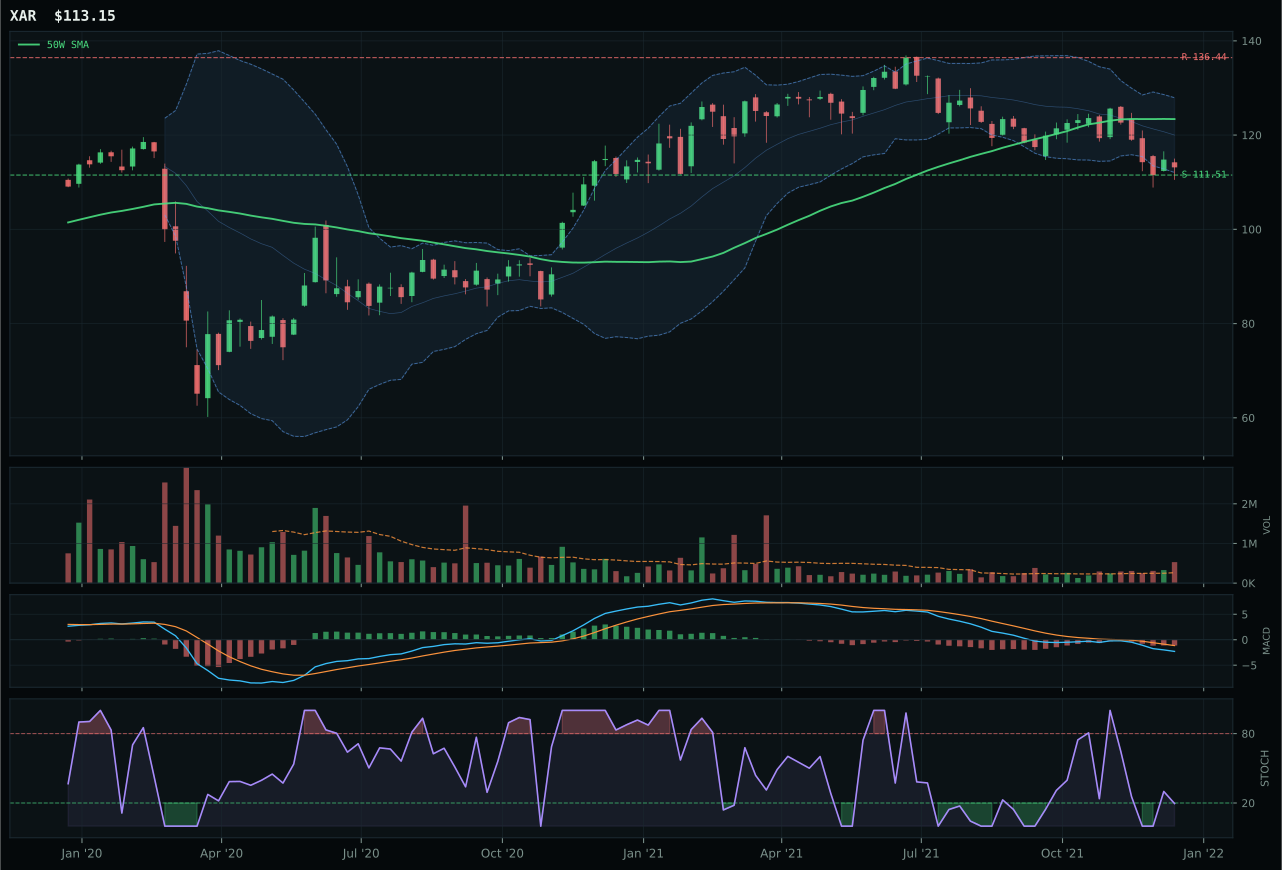
XAR has a pullback into support profile with -7.9% 13-week relative strength versus SPY.
A failed hold above support would weaken the setup.
Actionable but governed by invalidation levels.
ITA wins Defense & Aerospace with a 28.4 score by offering the rare setup of oversold turn-up timing on a pullback into support—a technical reset with defined risk. Price sits 5.4% below the 50W and is consolidating within 0.1% of the support level at 98.36, while stochastic RSI has turned up from oversold (0.12), signaling early-stage reversal potential. The 94.0 timing score and exceptional 98.0 risk/reward score reflect the asymmetry: only 0.1% downside to support but –12.1% upside to resistance, a punishing reward setup that nonetheless provides clarity. MACD remains bearish/weakening, and momentum metrics are weak (13W return –3.8%, RS vs SPY –8.0%), but the structure at 73.8/100 and above-average 1.46x volume participation kept ITA ahead of ROKT, which suffered from rising mid-zone stochastic (less convincing timing) and thin participation. This is a mean-reversion coil, not a trend confirmation.
Defense & Aerospace earned 5% as tier-2 despite a weak 28.4 category score, because the macro fit of 64.0/100 is strong—Transition/Mixed regime favors defensive assets, broad-market bear is active (+6), and dollar pressure adds another +3 points. The category's technical evidence is chronically weak at 7.7/100 (ITA's trend score is only 35.0, momentum confirmation is 18.0), yet macro support kept it in the portfolio. ROKT actually ranked higher in the 3/2/1 weighted proof order at 42.6 versus ITA's 23.9, an inversion driven by the category reasoner's filtering for portfolio quality and persistence; the allocator preferred ITA's cleaner pullback structure and oversold turn-up setup over ROKT's less-convincing mid-zone stochastic. To move to tier-1, the category needs trend recovery—price must reclaim the 50W with conviction, MACD must improve, and momentum confirmation must climb above 50/100; current weakness suggests defense is a hedge, not a conviction trade.
Technology — XLK
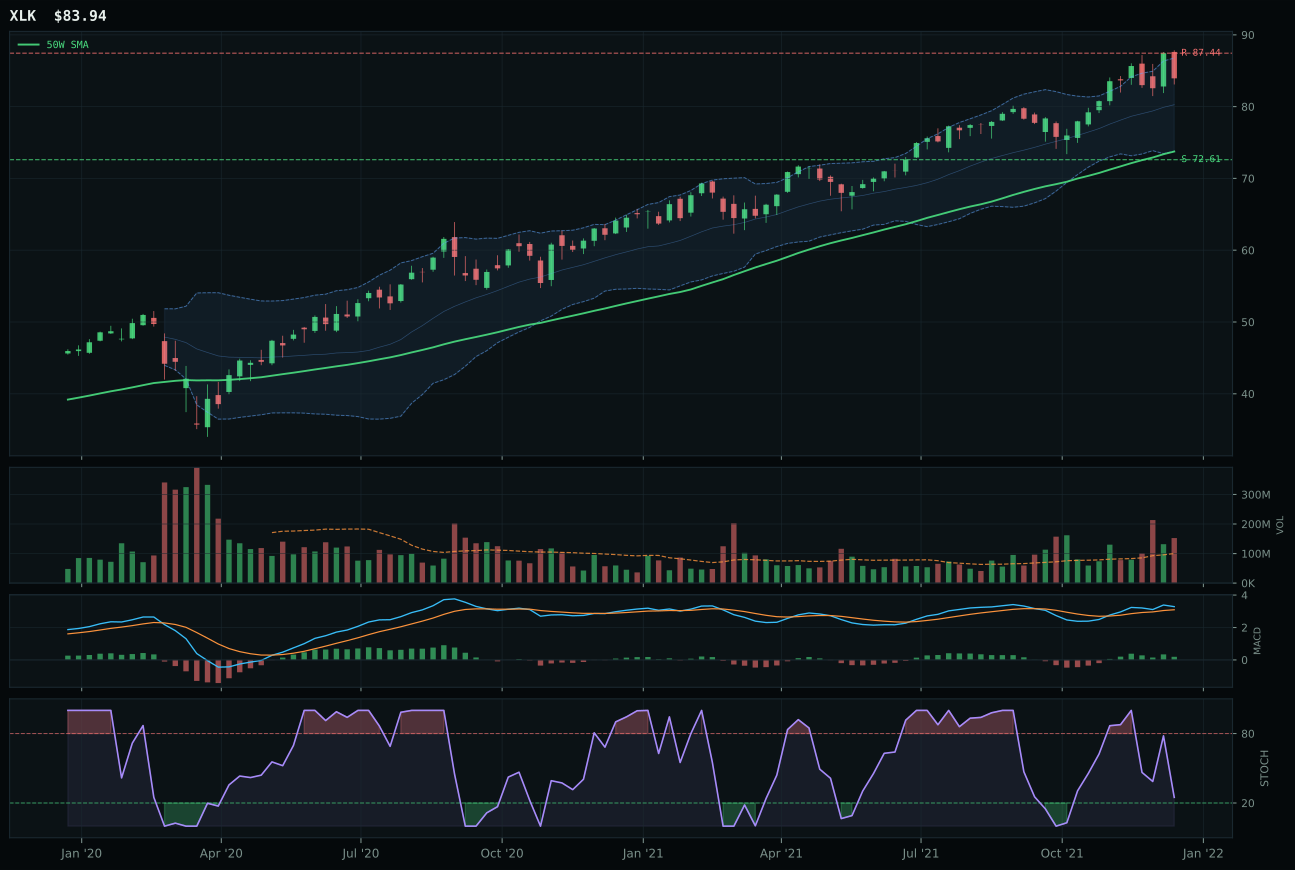
XLK has a neutral structure profile with 3.8% 13-week relative strength versus SPY.
A failed hold above support would weaken the setup.
Actionable but governed by invalidation levels.
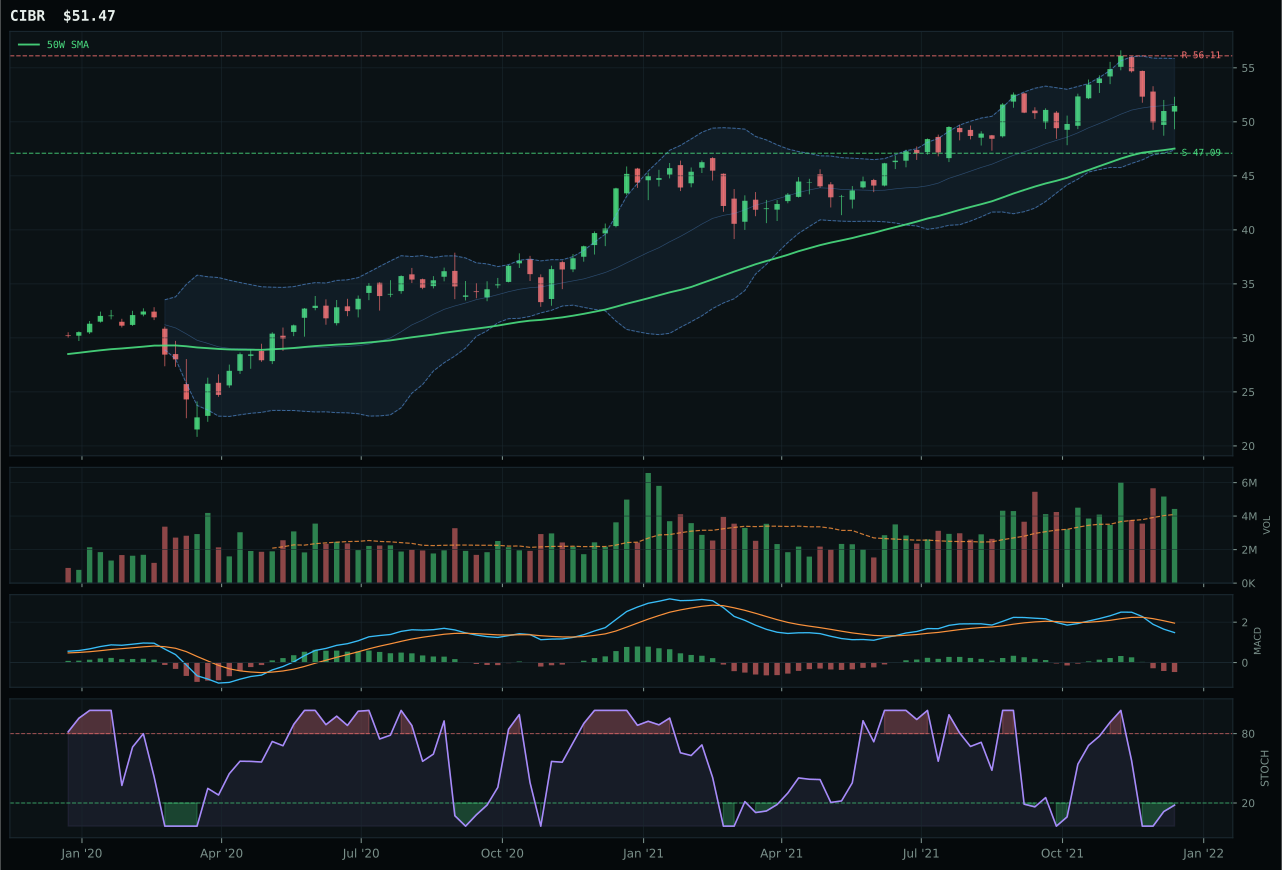
CIBR has a neutral structure profile with -2.9% 13-week relative strength versus SPY.
A failed hold above support would weaken the setup.
Actionable but governed by invalidation levels.
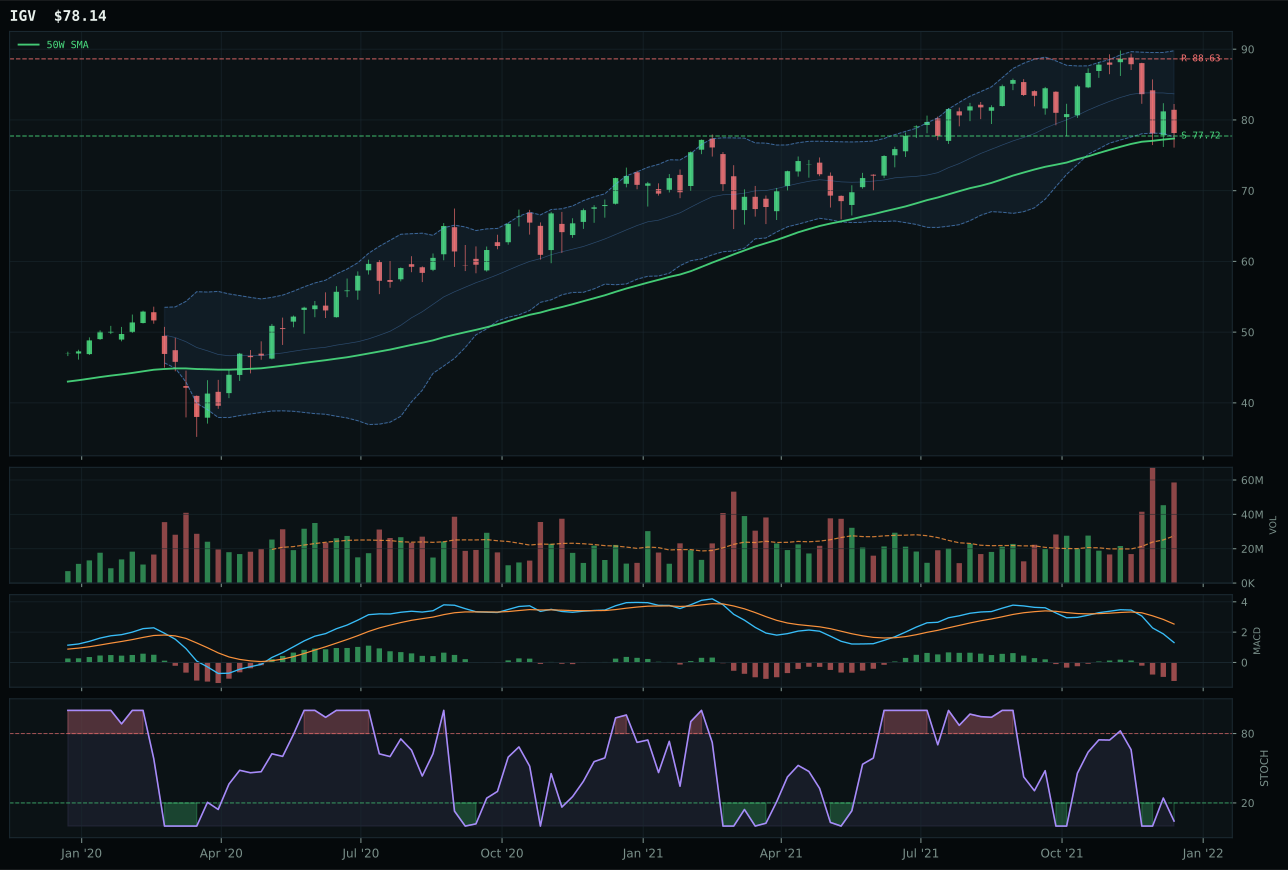
IGV has a pullback into support profile with -10.5% 13-week relative strength versus SPY.
A failed hold above support would weaken the setup.
Actionable but governed by invalidation levels.
XLK wins the category with a 28.0 score because it commands relative strength of 6.7% inside the three-ETF basket while maintaining 3.8% outperformance versus SPY—a meaningful gap that signals institutional accumulation rather than index-fund drift. The 13-week return of 8.0% anchors conviction in uptrend; price sits 13.8% above the 50-week moving average in the upper Fibonacci zone where new entrants pay full freight, but the 50-week slope remains steady at 0.5% and MACD, though flattening, stays bullish. CIBR stumbled because its MACD deteriorated to bearish/weakening while its category-relative strength flatlined at 0.0%, ceding leadership despite a better 26-week return. The setup is neutral structure with distribution pressure at 1.52x the 20-week volume average—a warning that every rally into resistance faces heavy seller participation, which explains why the risk/reward compressed to only 41.6/100 against 15.6% downside to support.
Technology earned 0% allocation this week, ranking 9th or 10th among the 10 categories and excluded entirely from the portfolio. The category-level macro fit scored just 40.0/100, crushed by active credit stress (–7 points) and dollar pressure (–5 points) that outweigh the modest AI growth sponsorship (+6). In a Transition/Mixed regime, technology's cyclical sensitivity and capital-intensity make it vulnerable when credit stress and broad-market bear signals are firing; the 62% weight on technical evidence cannot overcome a macro headwind this severe. XLK's neutral structure and flattening MACD offered no edge sharp enough to justify a tier-2 slot against higher-conviction category scores. A reversal would require MACD to recover to bullish-and-improving, relative strength to widen beyond 8%, and the macro descriptor for credit stress to flip inactive—conditions unlikely this week.
Emerging Markets — IEMG
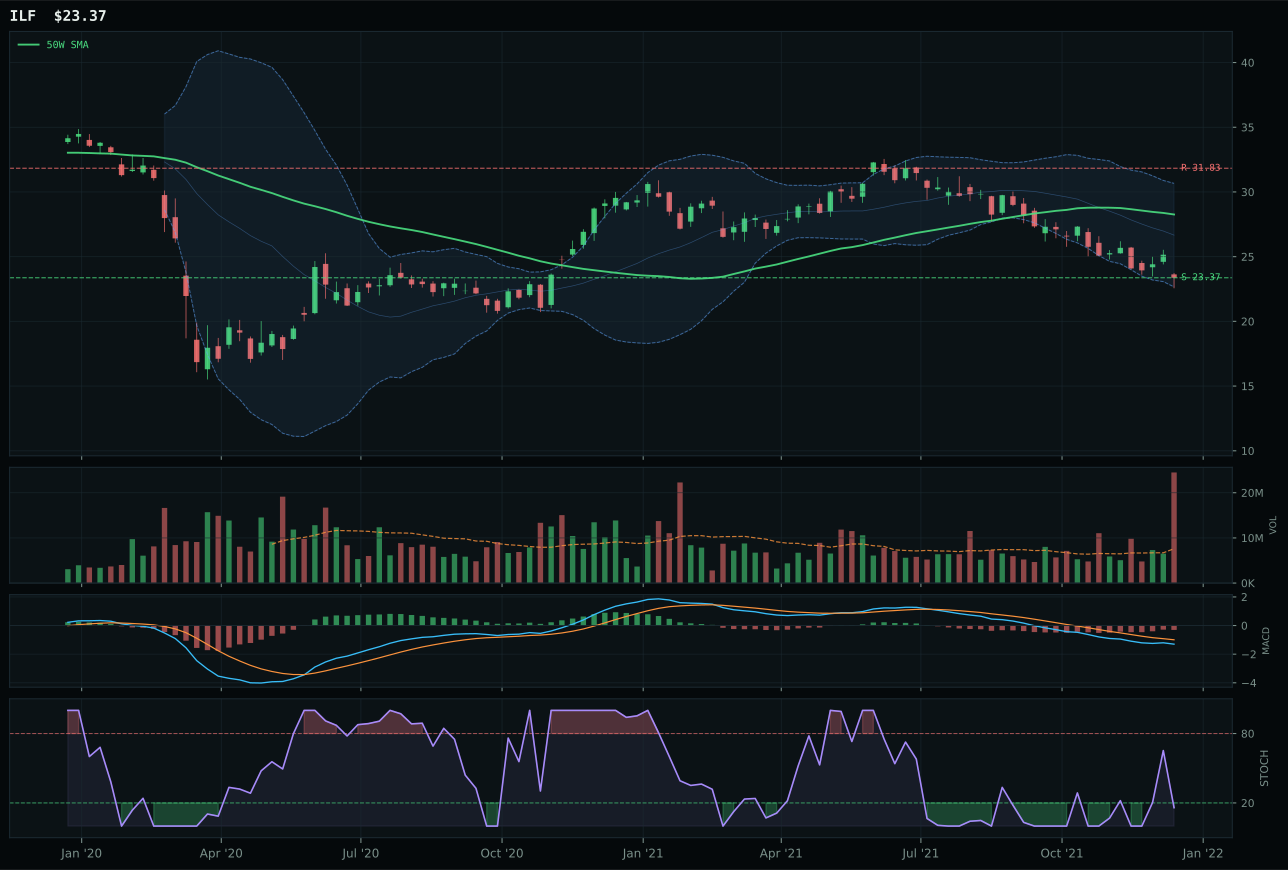
ILF has a pullback into support profile with -18.7% 13-week relative strength versus SPY.
Extension and support failure are the main tactical risks.
Tracked, but not top-2 eligible because: structurally broken.
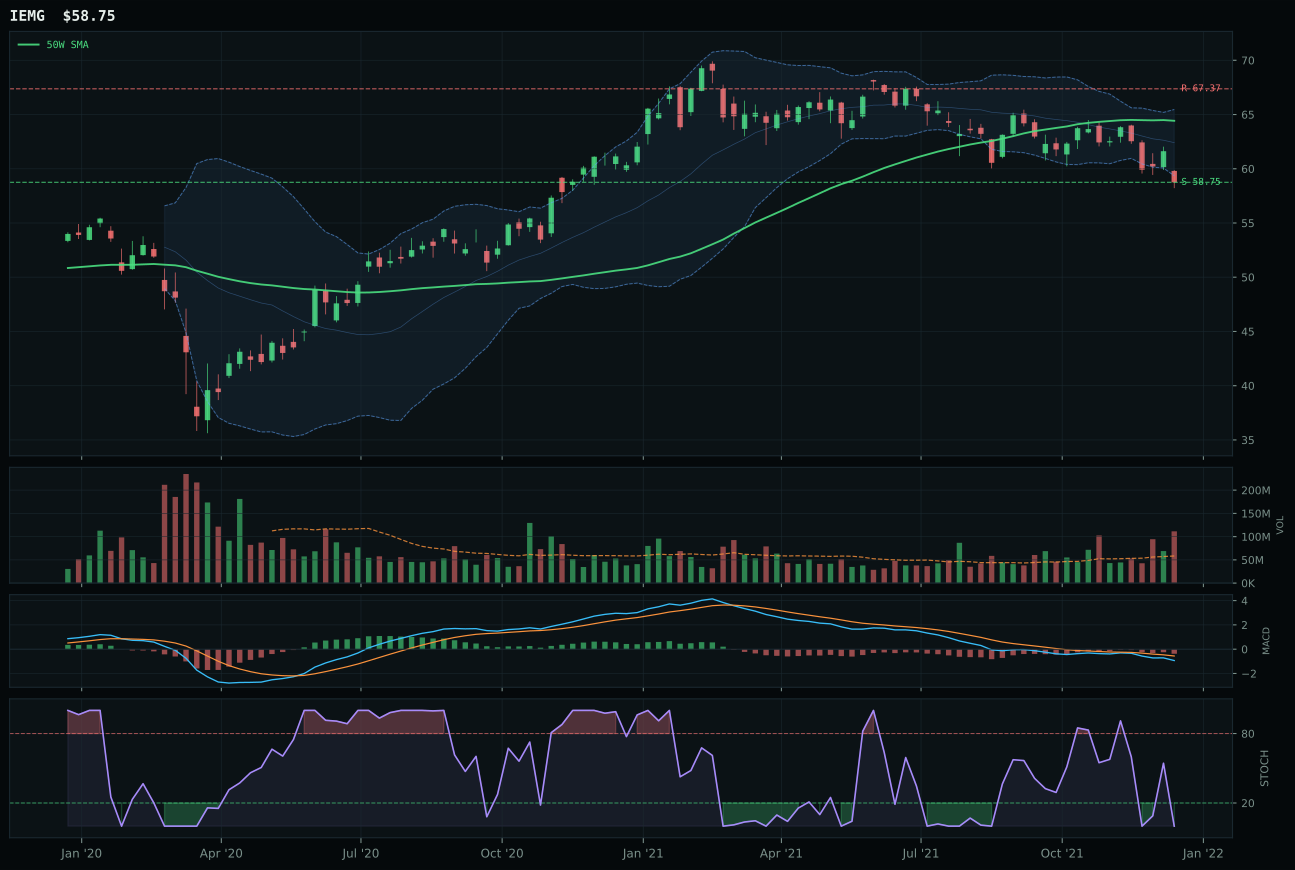
IEMG has a pullback into support profile with -10.9% 13-week relative strength versus SPY.
A failed hold above support would weaken the setup.
Actionable but governed by invalidation levels.
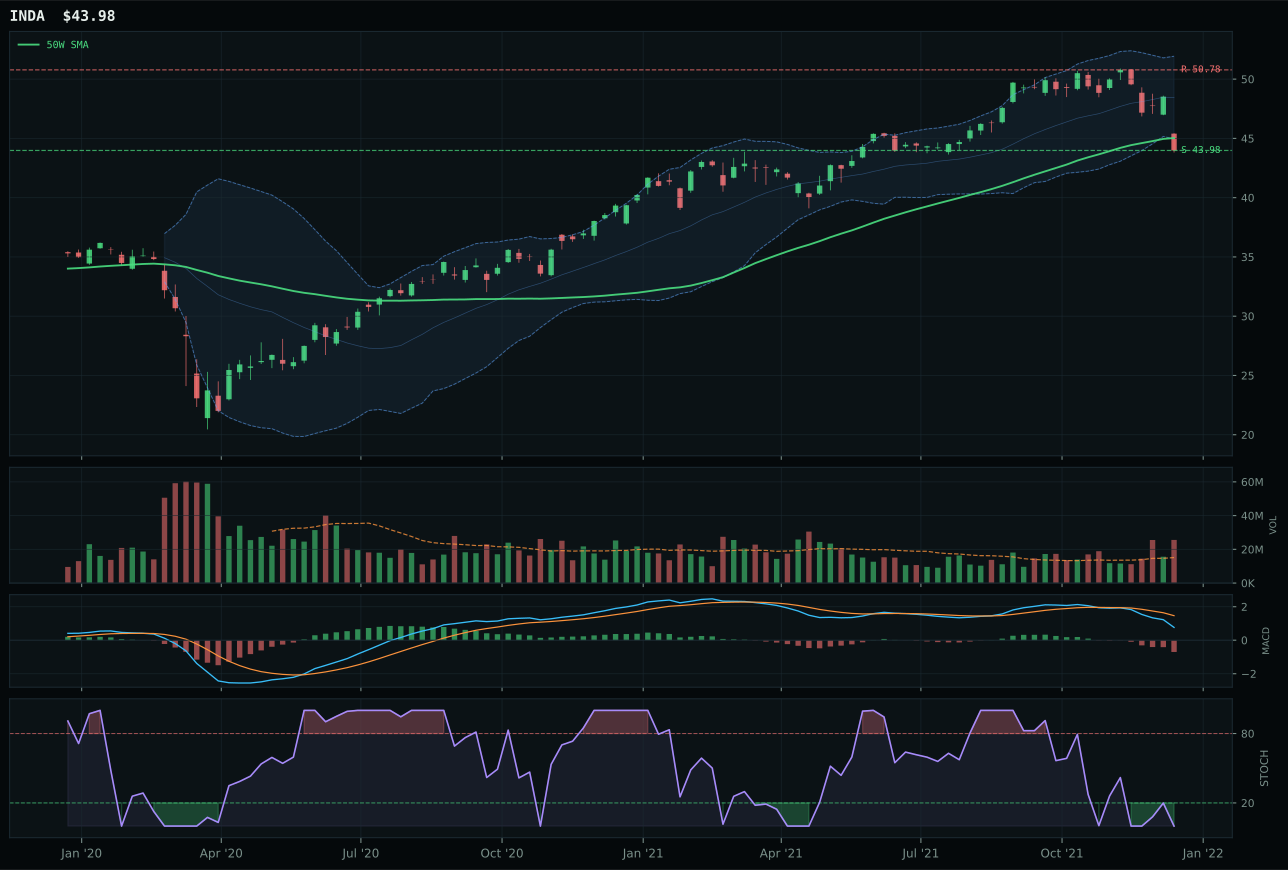
INDA has a pullback into support profile with -15.0% 13-week relative strength versus SPY.
A failed hold above support would weaken the setup.
Actionable but governed by invalidation levels.
IEMG nominally wins Emerging Markets, but with a category score of 0.0, this is a hollow victory and exclusion signal. IEMG's 13W return is –6.7% with –10.9% SPY underperformance, and volume at 1.91x the 20W shows distribution pressure—professional exit. Stochastic RSI is fully oversold at 0.00, MACD is bearish/weakening, and the chart sits near the 52W low/repair zone (Fib 0.786). Structure scores 69.6 from pullback-into-support at 58.75, which is textbook, but momentum confirmation is 0.0/100 and volume-price confirmation is only 9.9/100—the setup is structurally clean but accompanied by zero buying enthusiasm. ILF lost because its structure was broken (34.1) with an even deeper pullback and weaker technicals; its –18.7% SPY underperformance is catastrophic. The category reasoner's hard filter triggered: both top contenders failed confirmation tests, and neither qualified for portfolio allocation.
Emerging Markets received 0% allocation as a ranked 9th or 10th category, excluded entirely because the category score is 0.0/100. Macro fit is a dismal 17.0/100, crushed by dollar pressure (–14 points), credit stress (–10), and broad-market bear (–9 points). In a Transition/Mixed regime with DXY strength and credit stress firing, emerging markets face a structural headwind that no technical setup can overcome. IEMG's pullback-into-support is mechanically clean, but the 0.0 momentum confirmation and sub-10 volume-price persistence signal that professional capital has abandoned EM entirely; this is not a reset, it is a rout. To earn any allocation, Emerging Markets would need the dollar-pressure descriptor to flip to neutral or active-negative, credit stress to fade, and the broad-market-bear signal to reverse—a multi-week macro regime shift. Until then, EM is the portfolio's pariah, appropriately weighted at zero percent.