
2021-12-10
Informational purposes only. The content in this report, including allocations, analysis, and commentary, is provided solely for informational and educational purposes. It does not constitute financial advice, investment advice, trading advice, or any other type of advice. Past performance does not guarantee future results. Always conduct your own research and consult a qualified financial professional before making investment decisions.
Weekly Allocation
| Ticker | Category | Weight | Role |
|---|---|---|---|
| FSOL | 50% | Overlay | |
| XLE | Traditional Energy | 10% | Top-2 (10%) |
| XLU | Utilities & Infrastructure | 10% | Top-2 (10%) |
| MOO | Agriculture & Livestock | 5% | Tier-2 (5%) |
| PICK | Industrial Metals | 5% | Tier-2 (5%) |
| XLK | Technology | 5% | Tier-2 (5%) |
| GLD | Precious Metals | 5% | Tier-2 (5%) |
| SMH | AI | 5% | Tier-2 (5%) |
| ITA | Defense & Aerospace | 5% | Tier-2 (5%) |
Trade Instructions — Monday Open
Sell the tranche from 2021-11-12 (completing its 4-week hold). Buy the new tranche. Instructions show net portfolio changes — same-asset positions cancel, weight changes show the delta.
| Action | Ticker | Instruction |
|---|---|---|
| SELL | URNM | Sell 67% of URNM position (reduce 3.75% → 1.25%) |
| SELL | PAVE | Sell 33% of PAVE position (reduce 3.75% → 2.50%) |
| SELL | COPX | Sell 33% of COPX position (reduce 3.75% → 2.50%) |
| BUY | PICK | Buy PICK — 25.00% of freed cash (adds 1.25% to portfolio) |
| BUY | XLU | Buy XLU — 50.00% of freed cash (adds 2.50% to portfolio) |
| BUY | ITA | Buy ITA — 25.00% of freed cash (adds 1.25% to portfolio) |
Current Portfolio After Trade
Combined holdings across all 4 active tranches. Each tranche is 25% of the portfolio.
| Ticker | % of Portfolio | Weight Bar |
|---|---|---|
| FSOL | 50.00% | |
| XLE | 10.00% | |
| GLD | 6.25% | |
| XLK | 6.25% | |
| SMH | 5.00% | |
| MOO | 5.00% | |
| PICK | 3.75% | |
| XLU | 3.75% | |
| PAVE | 2.50% | |
| COPX | 2.50% | |
| URA | 2.50% | |
| URNM | 1.25% | |
| ITA | 1.25% |
Macro Regime — Transition / Mixed
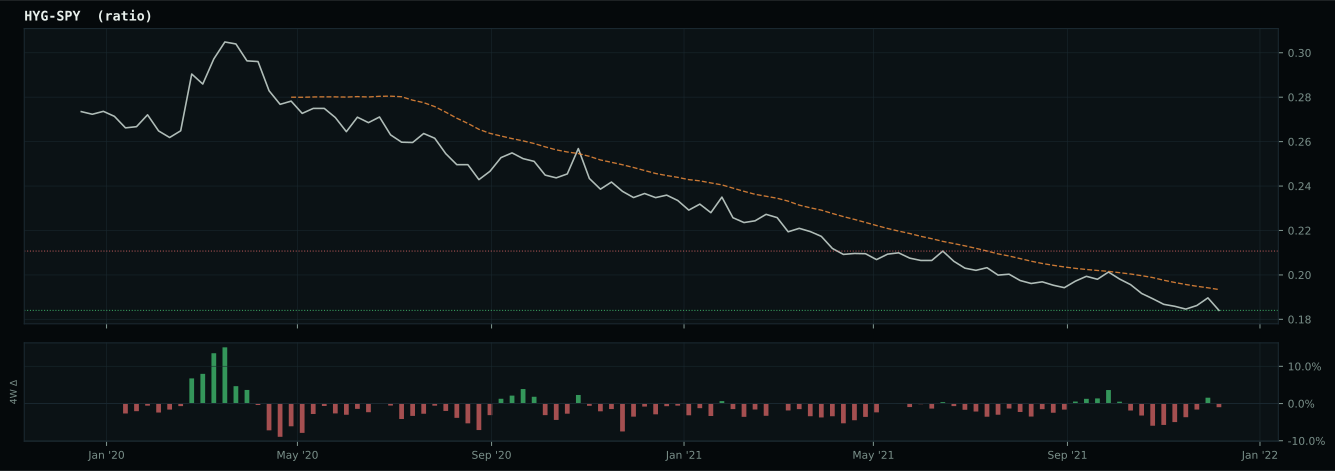
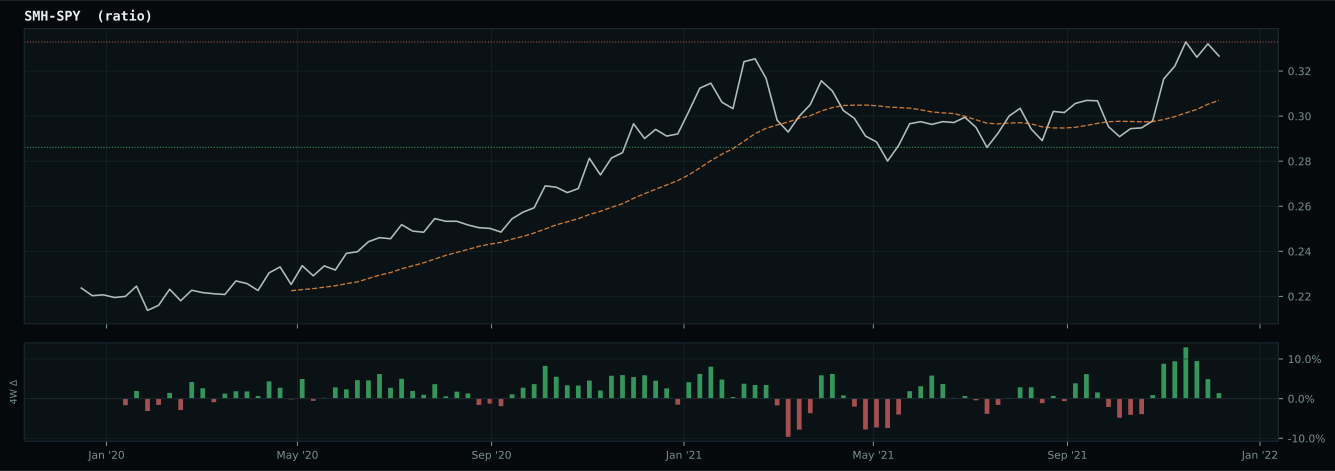
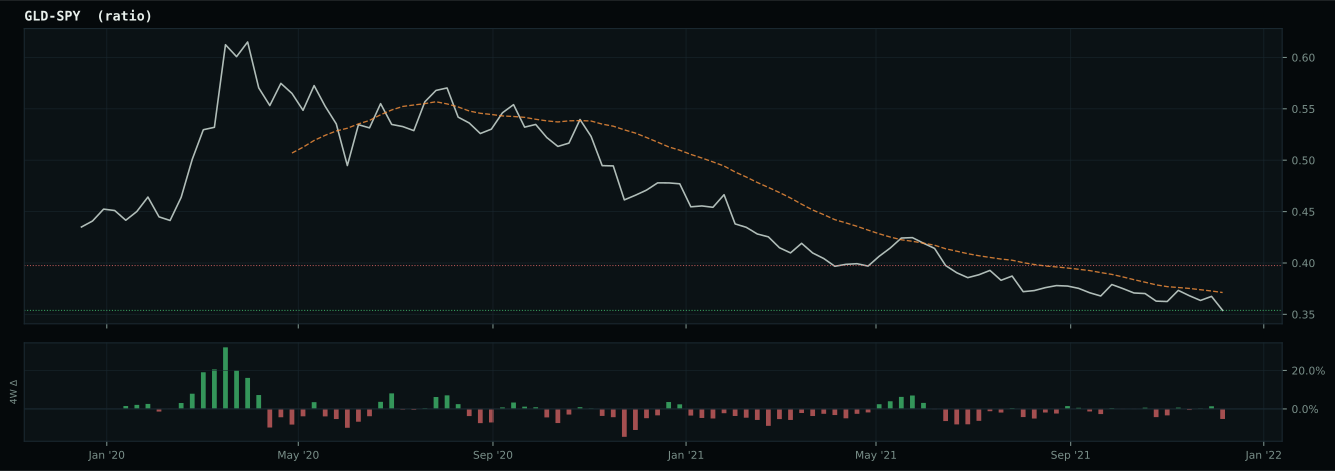
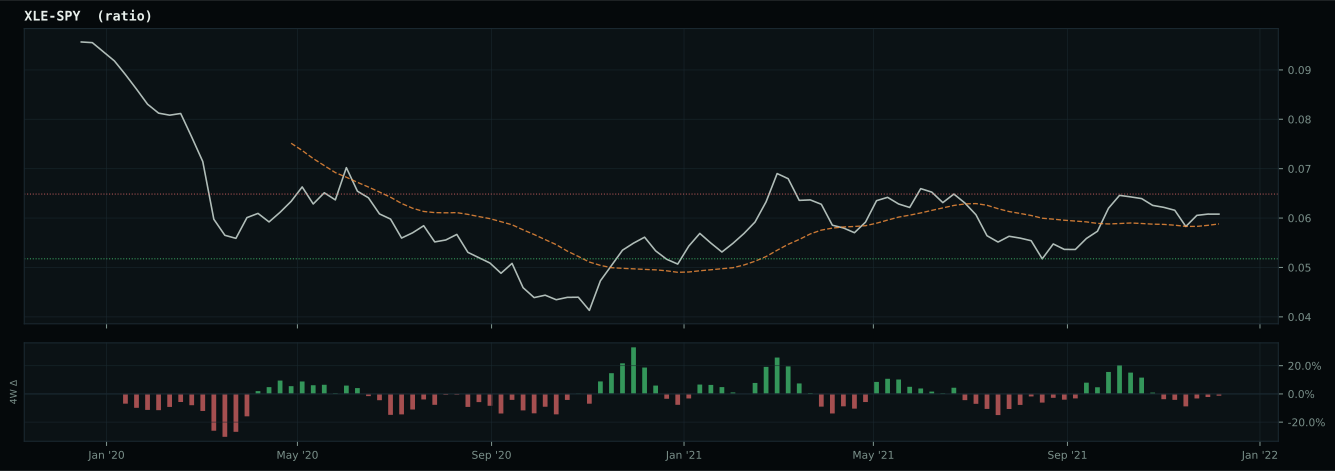
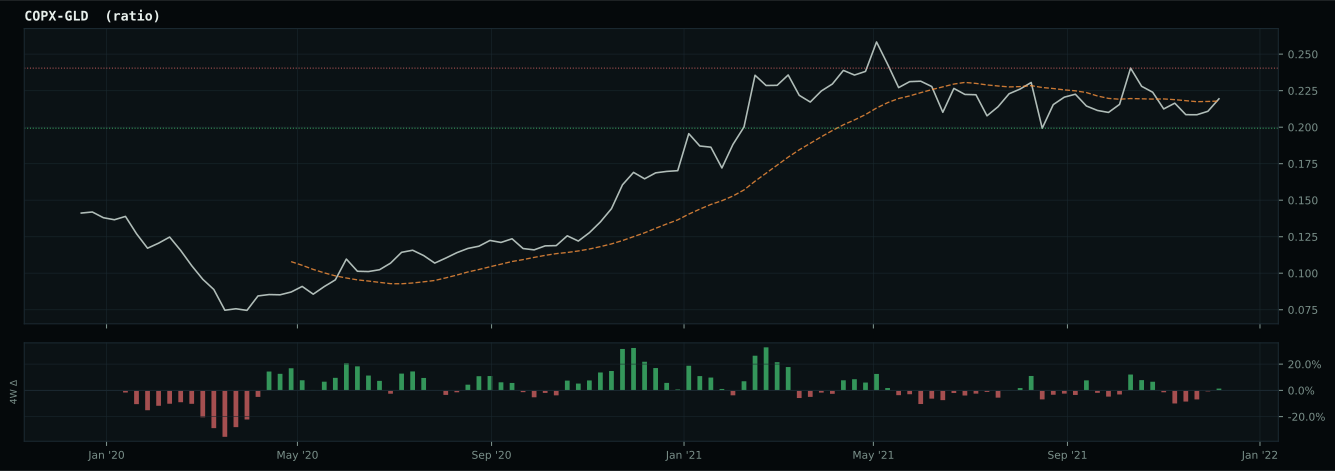
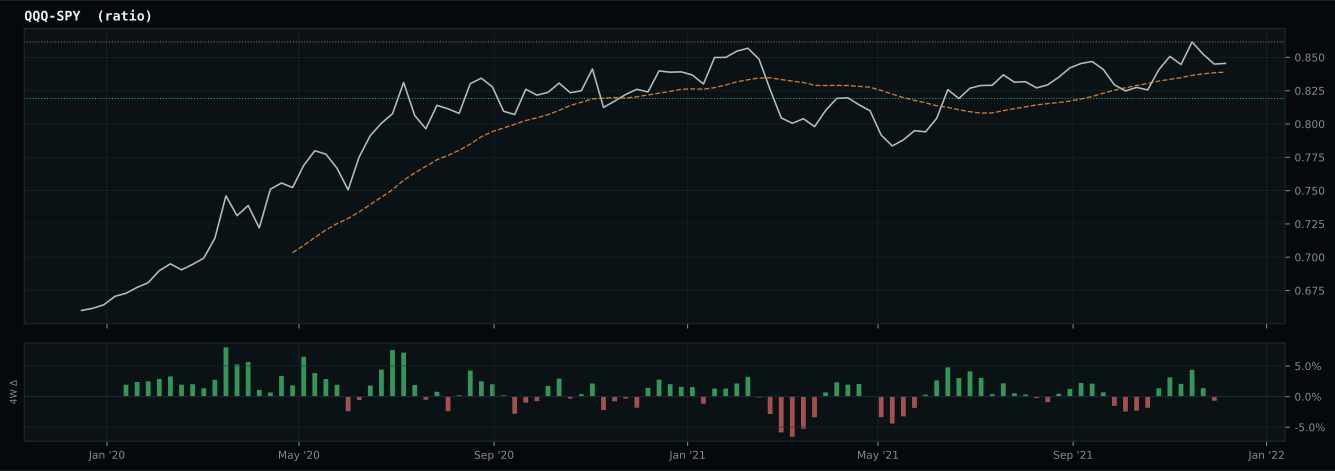
Macro Evidence Charts
Market-implied signals behind the macro regime scores. Each ratio compares two assets; the direction and slope of the ratio is what the macro engine reads.
Crypto Regime — AltSeason
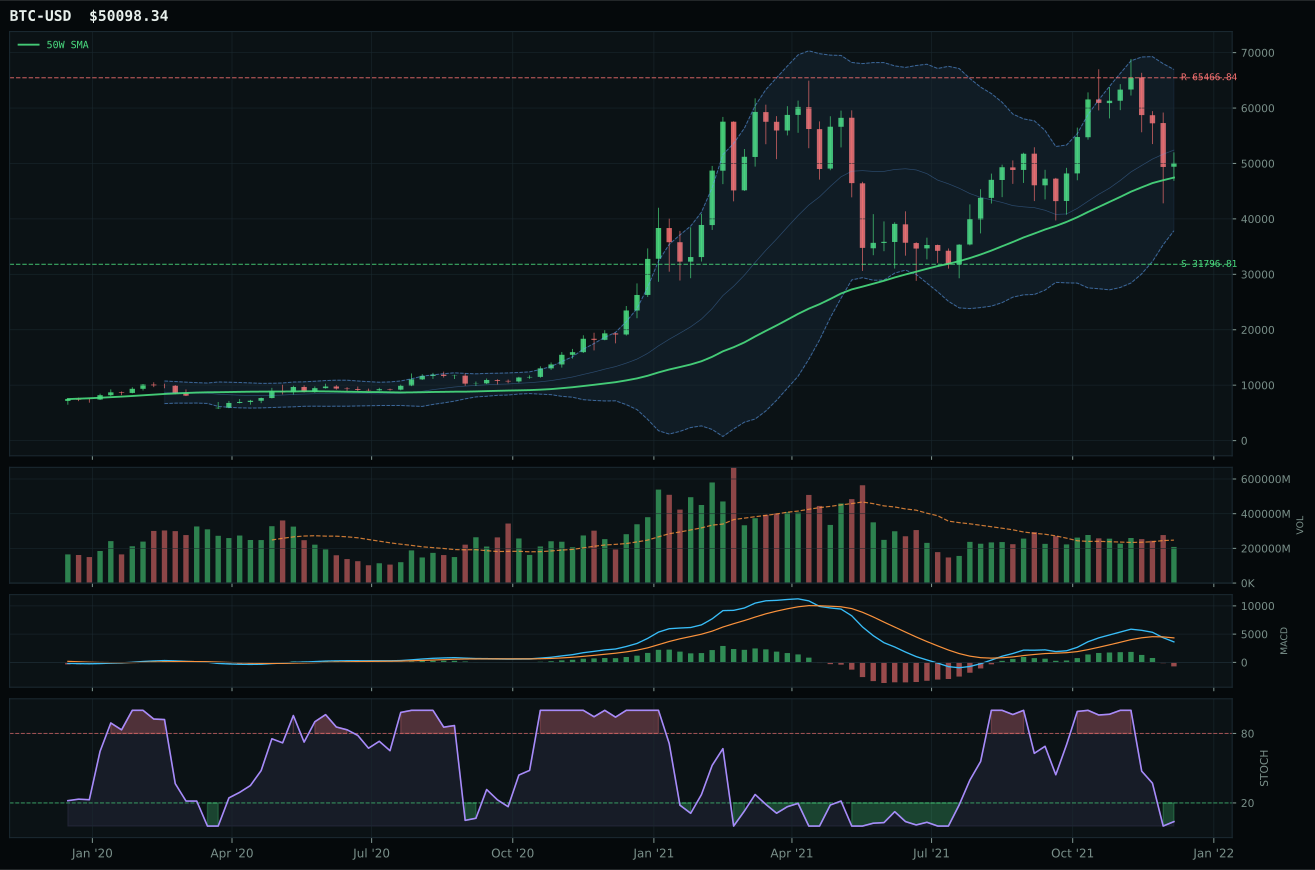
ValueBTC not armed: BTC has not made the first post-breakdown touch of the 200W buy zone after losing the 50W
TrendBTC confirmed: 2 consecutive closes above rising/flat 50W SMA
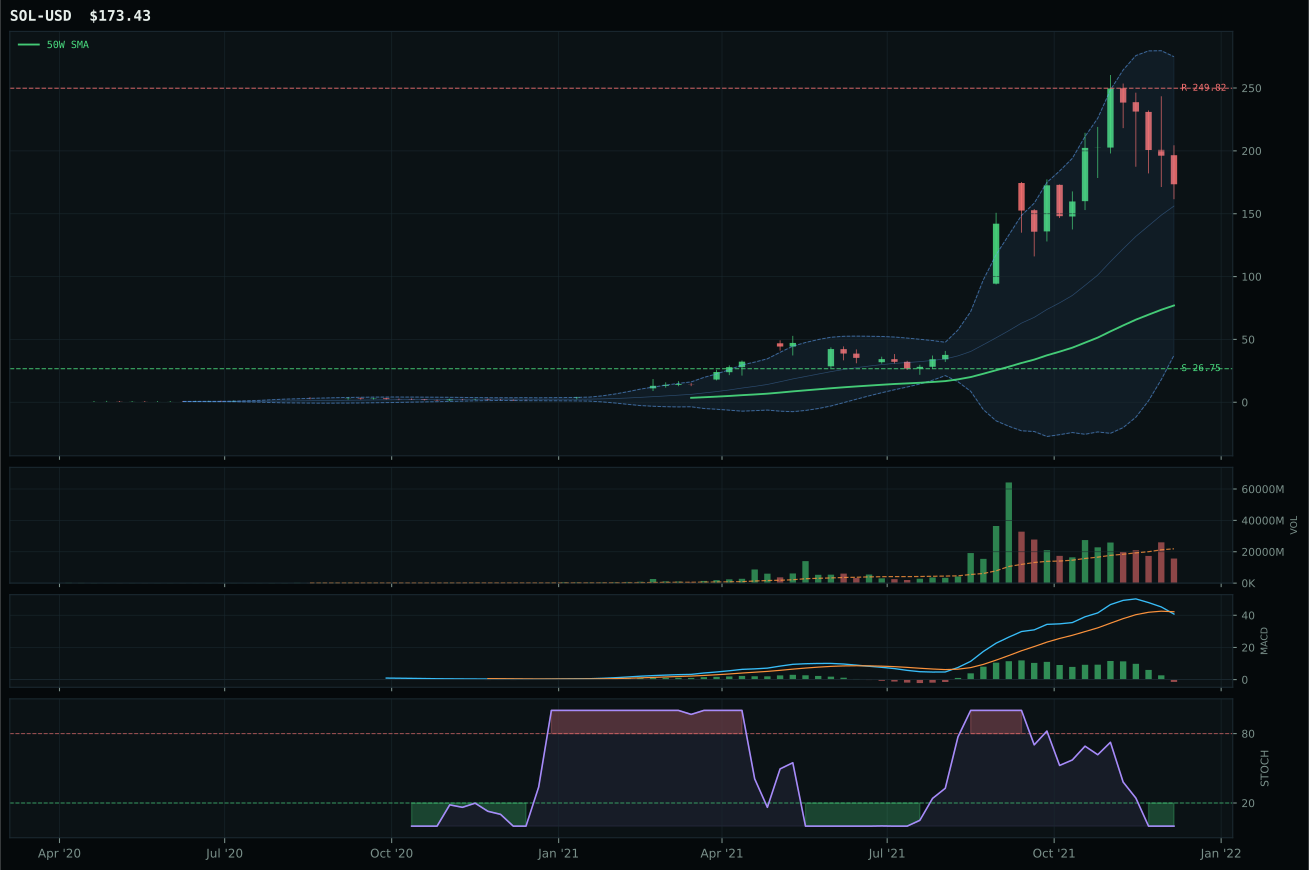
all available AltSeason conditions pass; missing optional confirmations skipped
Category Rankings
| Rank | Category | Winner | Score | Alloc | 4W Ret | Peers (4W) |
|---|---|---|---|---|---|---|
| 1 | Traditional Energy | XLE | 62.6 | 20% | +8.37% | XOP +4.1% · FCG +5.6% |
| 2 | Utilities & Infrastructure | XLU | 55.4 | 20% | +1.84% | PAVE -1.0% · IGF +3.9% |
| 3 | Agriculture & Livestock | MOO | 49.0 | 10% | -0.07% | VEGI +3.7% · WEAT -4.0% |
| 4 | Industrial Metals | PICK | 44.6 | 10% | +7.27% | COPX +2.3% · REMX -7.5% |
| 5 | Technology | XLK | 42.9 | 10% | -6.72% | IGV -12.3% · CIBR -4.3% |
| 6 | Precious Metals | GLD | 41.7 | 10% | +0.28% | GDX -2.2% · SLV -0.2% |
| 7 | AI | SMH | 39.1 | 10% | -5.06% | AIQ -6.9% · BOTZ -7.8% |
| 8 | Defense & Aerospace | ITA | 38.3 | 10% | +4.85% | ROKT +1.4% · XAR +3.2% |
| 9 | Nuclear Energy | URA | 32.6 | 0% | +0.08% | NLR +0.3% · URNM -0.1% |
| 10 | Emerging Markets | INDA | 6.5 | 0% | +4.12% | IEMG +0.1% · ILF -0.6% |
Traditional Energy — XLE
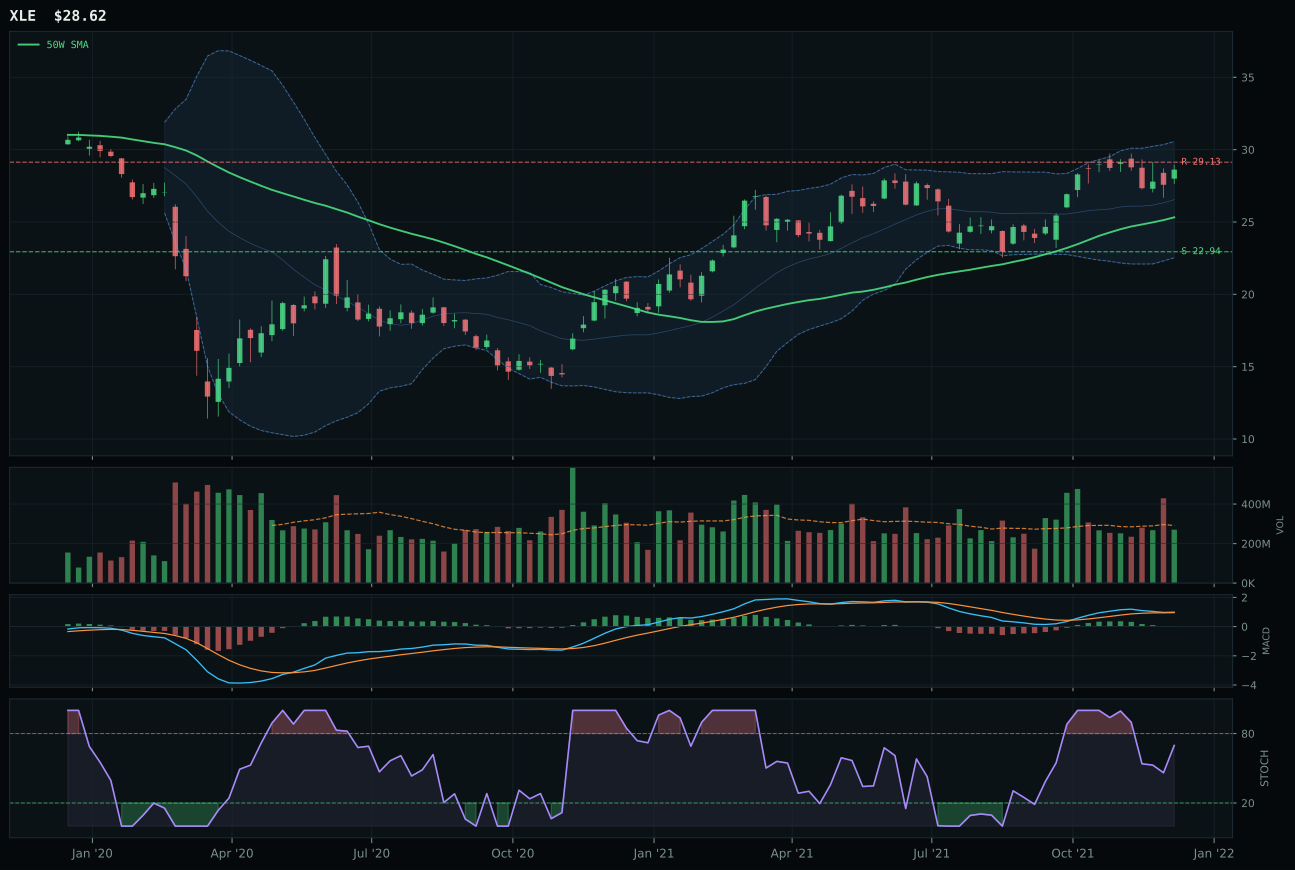
XLE has a neutral structure profile with 14.1% 13-week relative strength versus SPY.
A failed hold above support would weaken the setup.
Actionable but governed by invalidation levels.
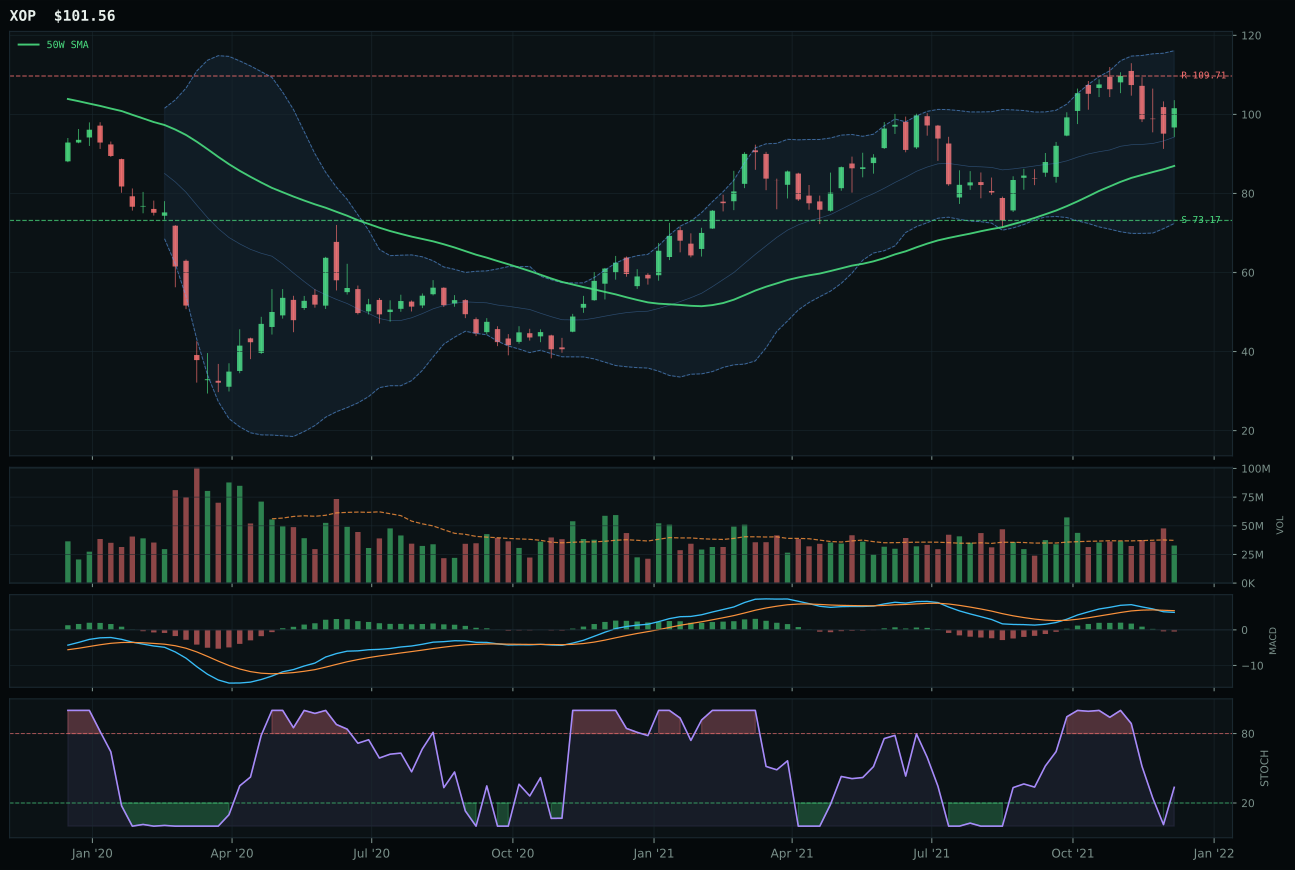
XOP has a vertical extension profile with 15.7% 13-week relative strength versus SPY.
A failed hold above support would weaken the setup.
Actionable but governed by invalidation levels.
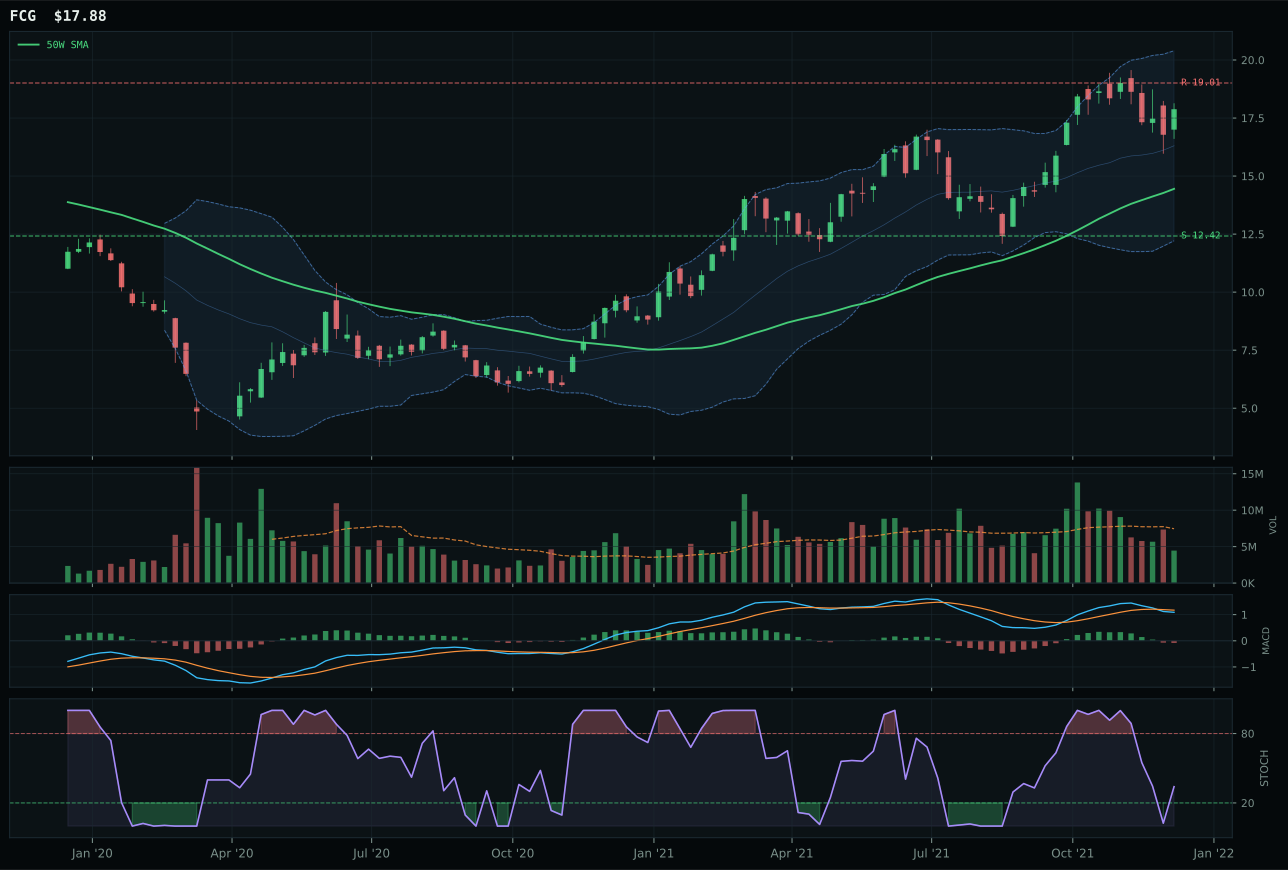
FCG has a vertical extension profile with 19.1% 13-week relative strength versus SPY.
A failed hold above support would weaken the setup.
Actionable but governed by invalidation levels.
XLE claims the top-2 overweight slot by dominating both technical evidence (79.5) and macro narrative fit (86.0) with a 17.8-point margin over XOP. The chart sits in neutral structure 13.0% above the 50-week moving average, but the magnitude of the nineteen-point-eight percent thirteen-week return and fourteen-point-one percent SPY-relative strength prove this is not extended speculation—this is systematic outperformance supported by real capital rotation into energy value. MACD is bullish but flattening while stochastic RSI rises mid-zone at 0.70, a combination that avoids the overheated extremes that kill rallies. XOP loses because it sits in vertical extension (19.6% above the 50W) with bearish/weakening MACD and falling stochastic RSI, placing every new buyer at maximum entry risk even though its raw thirteen-week return of 21.4% slightly exceeds XLE's. The gap reveals XLE's superior risk/reward: both enjoy energy scarcity tailwinds, but XLE's cleaner structure at 75.5 versus 69.8 and superior timing at 70.0 versus 48.0 prove the integrated major offers better durability than exploration beta.
Traditional Energy earns 10% top-2 overweight allocation as the portfolio's highest-conviction macro play, supported by a category score of 62.6 and uncompromising macro fit of 85.0. The alignment is exceptional: +16 energy scarcity, +10 inflation pressure, +9 supply shortage, and +7 real asset sponsorship create a structural tailwind that persists across multiple economic scenarios. In a mixed-regime transition, energy provides the rare combination of nominal growth (supply-constrained OPEC discipline and capex shortage), dividend yield (cash-flow strength from elevated prices), and inflation hedge characteristics. XLE's technical evidence of 79.5 confirms this is not a purely macro bet—the chart structure and participation genuinely support higher positioning. The 38.3 risk/reward score is the only hesitation: thirteen percent upside to resistance against twenty-four point seven percent downside creates asymmetric risk, yet that risk is acceptable given the macro tailwind strength. Ten percent represents maximum conviction within our allocation framework, and it should hold provided energy prices remain supported by supply discipline and geopolitical tension. If WTI breaks decisively below twenty dollars or OPEC loses discipline, this position would need to shrink.
Utilities & Infrastructure — XLU
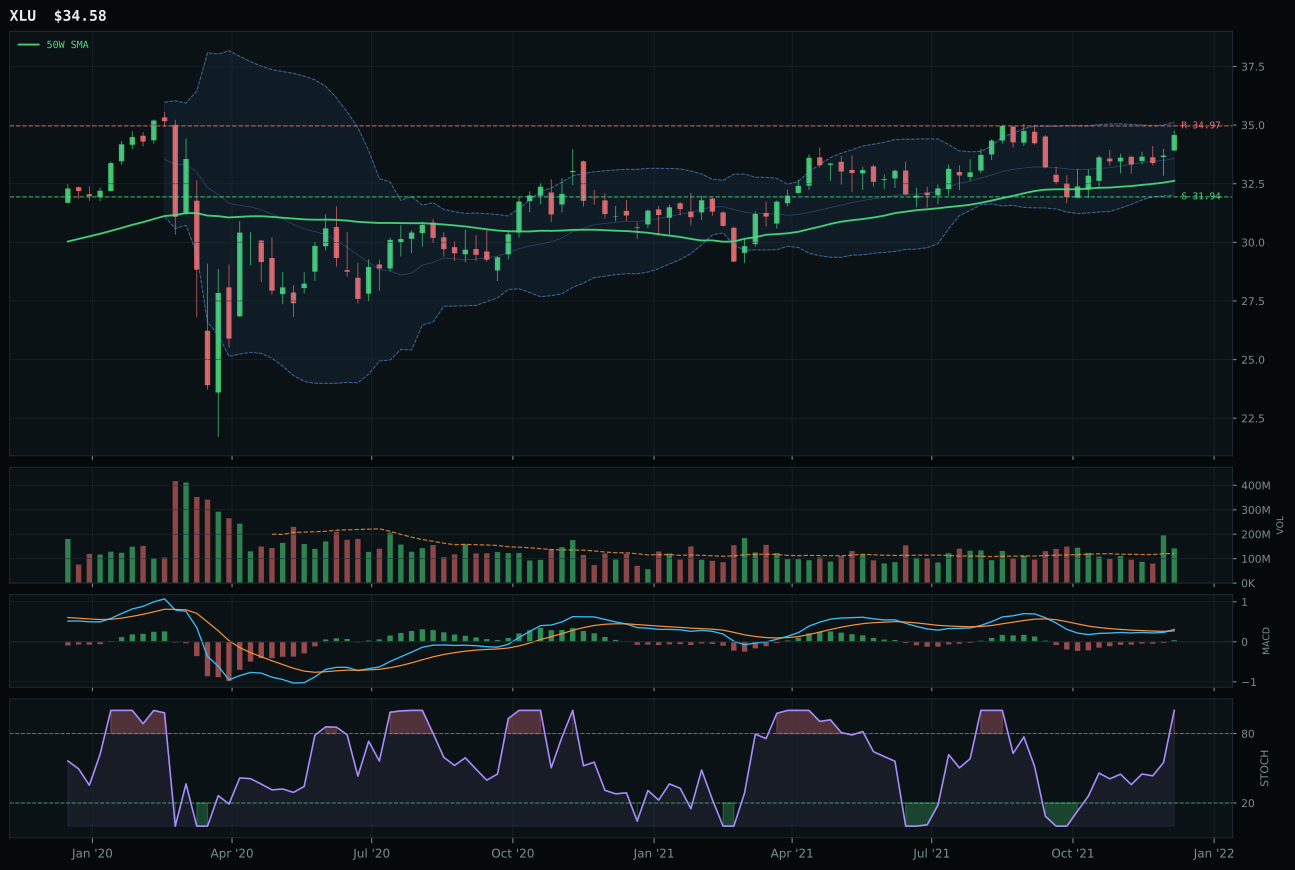
XLU has a neutral structure profile with -4.7% 13-week relative strength versus SPY.
A failed hold above support would weaken the setup.
Actionable but governed by invalidation levels.
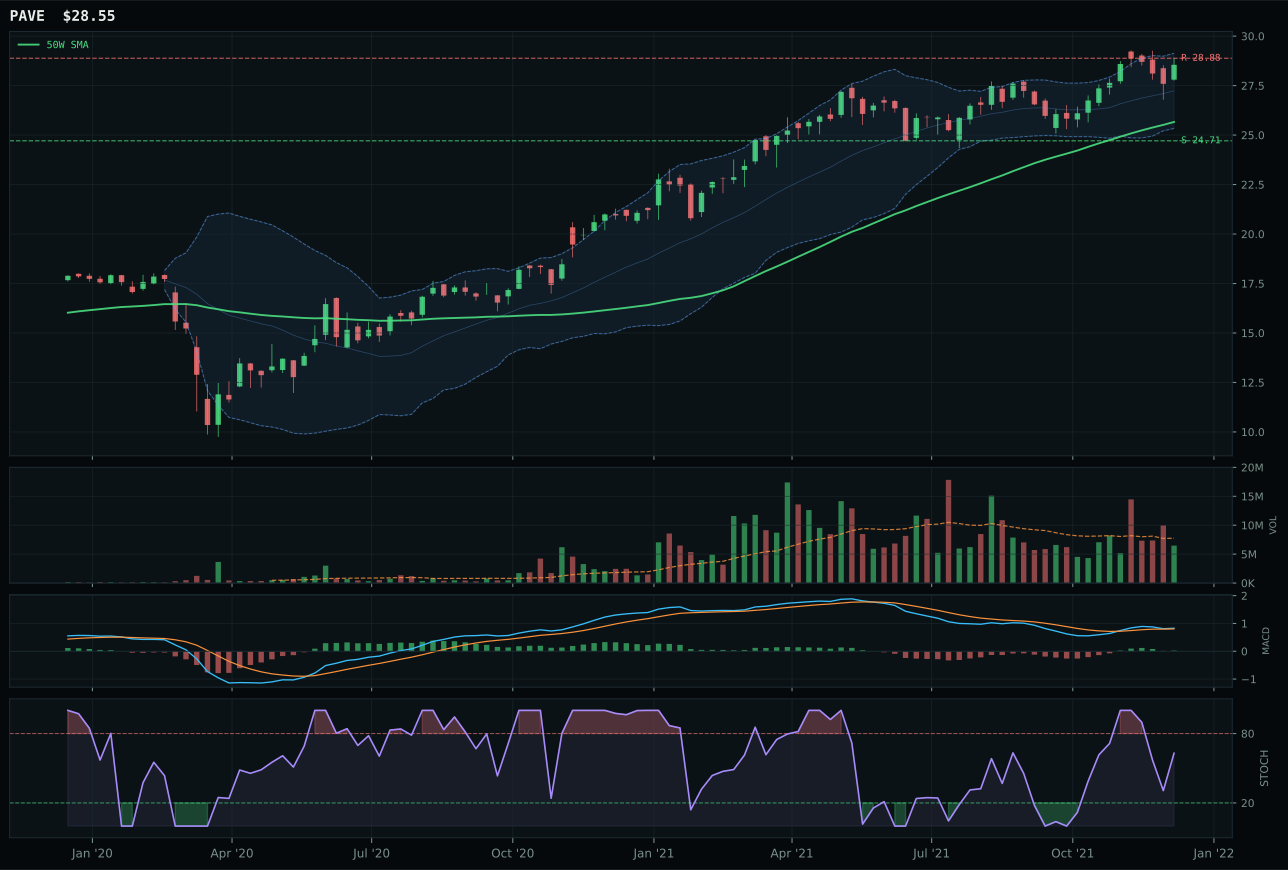
PAVE has a neutral structure profile with 1.9% 13-week relative strength versus SPY.
A failed hold above support would weaken the setup.
Actionable but governed by invalidation levels.
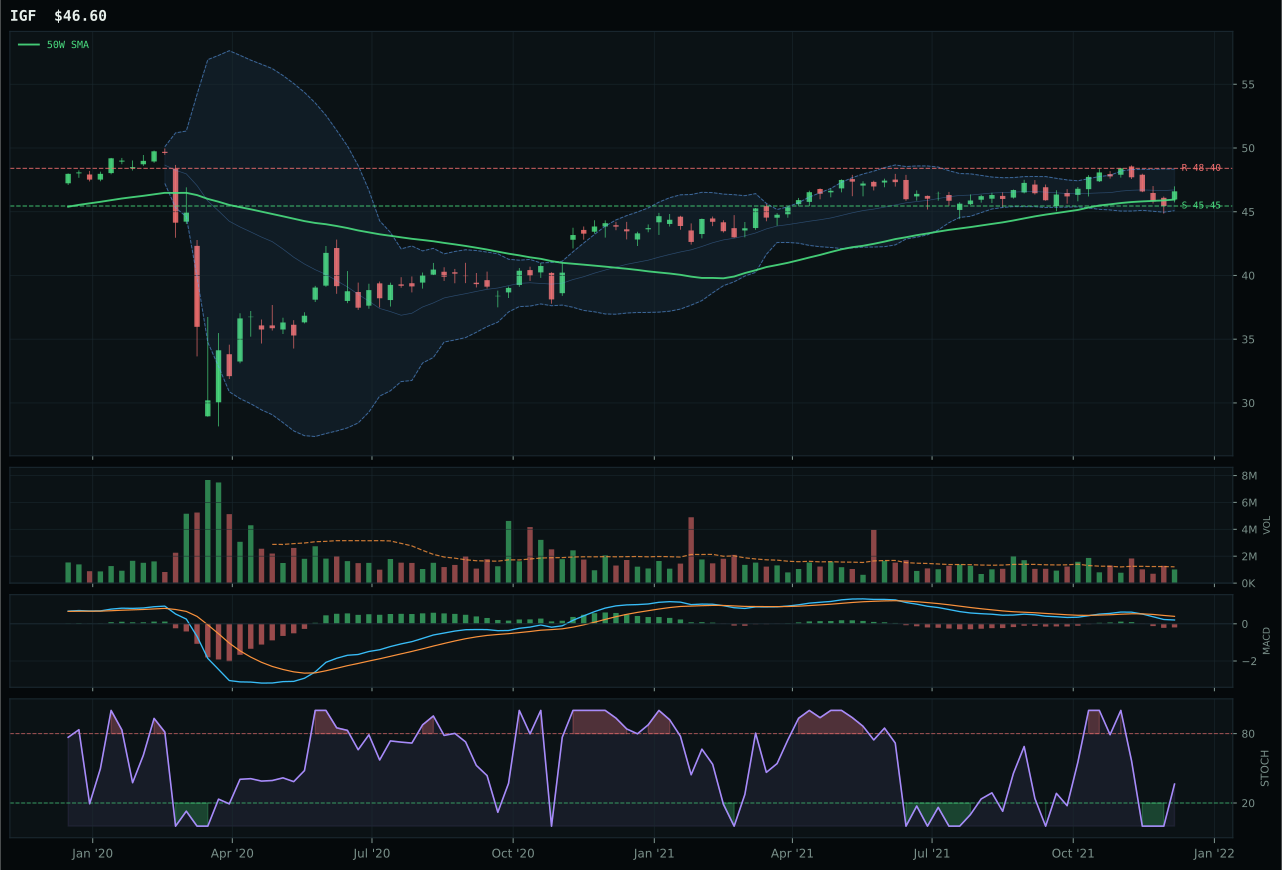
IGF has a pullback into support profile with -5.4% 13-week relative strength versus SPY.
A failed hold above support would weaken the setup.
Actionable but governed by invalidation levels.
XLU captures the second top-2 overweight allocation by combining superior trend strength (93.0) with genuine momentum confirmation despite narrow category-relative advantage. Price sits only 6.0% above the 50-week moving average—the shallowest extension in the category—while maintaining overbought stochastic RSI momentum at 1.00 and bullish/improving MACD, proving accumulation is active without creating extended entry risk. The thirteen-week return of positive one point zero percent and flat category-relative strength might seem weak, but in a defensive regime this represents persistent demand without speculation. XLU edges PAVE by just 0.8 points because XLU's timing score reaches 75.0 versus PAVE's 62.0, its volume confirmation sits above-average (1.18x) versus neutral, and its MACD is improving versus flattening. Both represent extended setups near 52-week highs, but XLU's superior configuration—closer to moving averages, better MACD trajectory, genuine volume participation—justifies allocation despite tight risk/reward of negative one-point-one percent upside.
Utilities & Infrastructure earns 10% top-2 overweight allocation as the portfolio's primary defensive positioning in a mixed-regime transition, supported by a 55.4 category score and 50.0 macro fit that balances inflation pressure headwinds (-6) against broad market bear tailwinds (+4) and regime neutrality (+4). The allocation reflects portfolio structure strategy more than technical conviction: XLU's 77.4 technical evidence is genuine, yet the 65.8 momentum confirmation and 67.0 volume-price confirmation scores indicate this is steady-state demand rather than accumulation breakout. Top-2 weighting makes sense precisely because the macro regime supports defensive rotation into yield-generating infrastructure, and utilities provide the safest available vehicle combining chart stability (93.0 trend score), reasonable yield, and positioning that benefits if credit stress widens. The position should remain at full weight provided the broad market bear descriptor remains active—if that reverses and risk appetite reasserts decisively, this position becomes vulnerable to underperformance and should trim toward tier-three weighting. Current 10 percent represents appropriate defensive positioning without overcommitment to a stagnation thesis, holding meaningful upside if recession fears intensify while accepting drag if growth accelerates.
Agriculture & Livestock — MOO
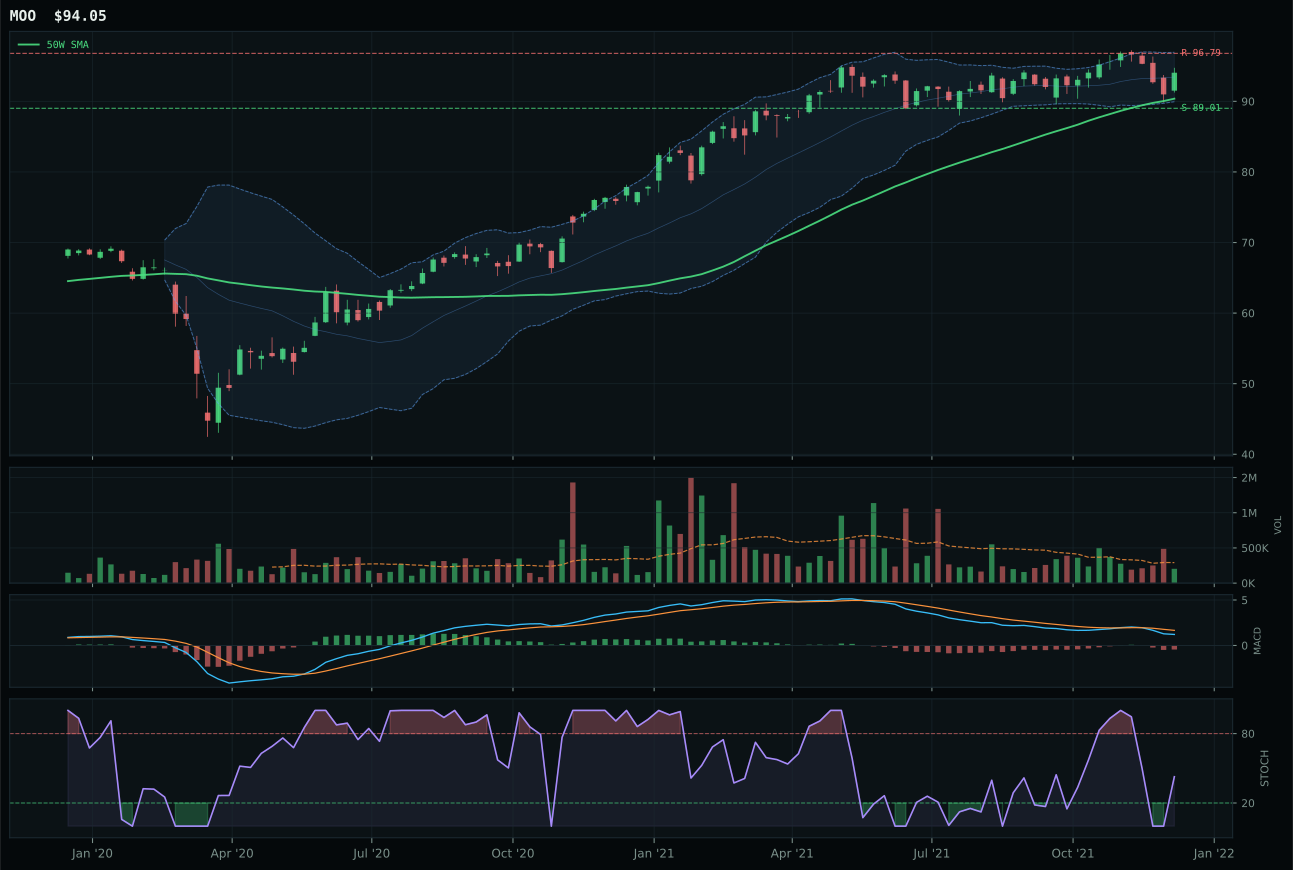
MOO has a neutral structure profile with -3.9% 13-week relative strength versus SPY.
A failed hold above support would weaken the setup.
Actionable but governed by invalidation levels.
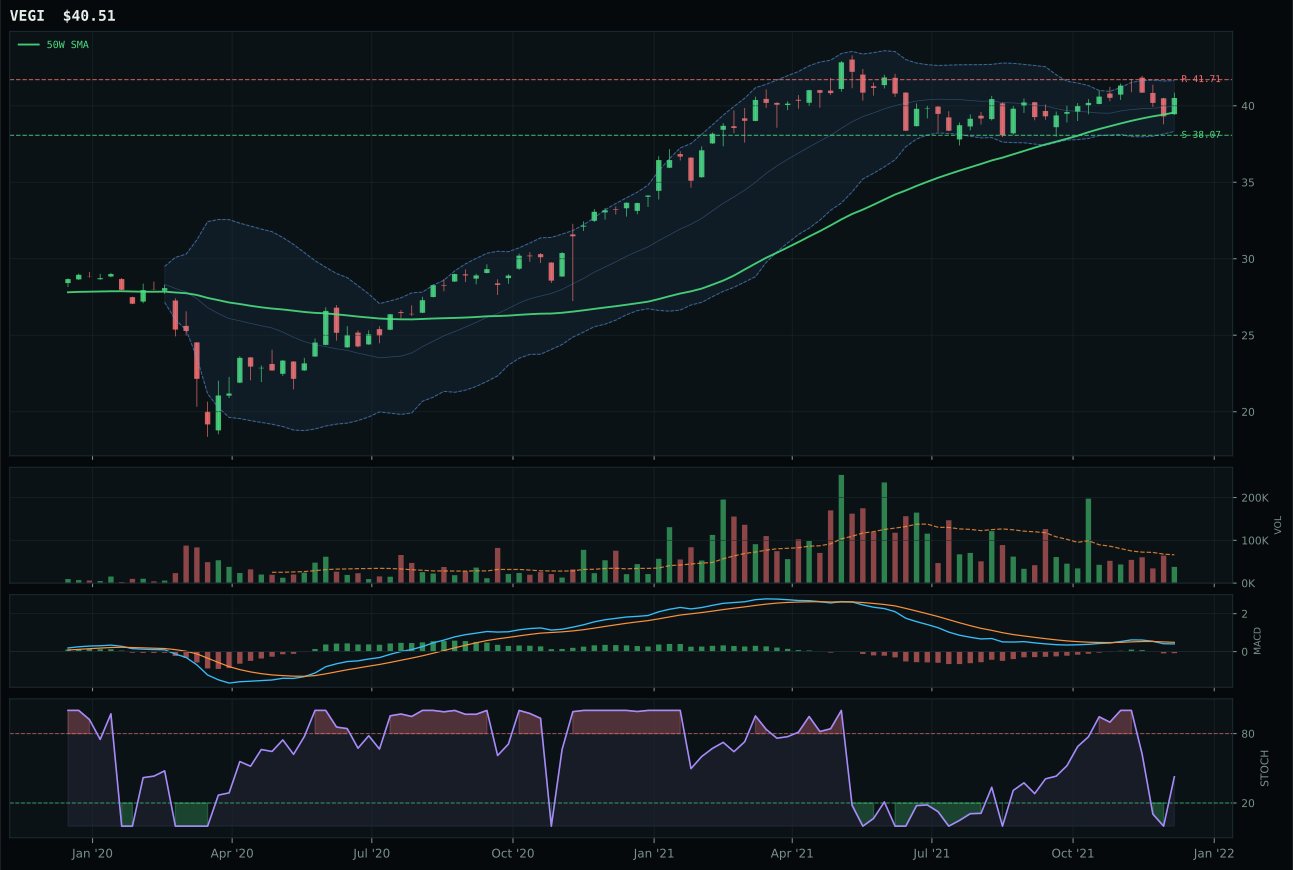
VEGI has a compression near 50W profile with -2.5% 13-week relative strength versus SPY.
A failed hold above support would weaken the setup.
Tracked, but not top-2 eligible because: .
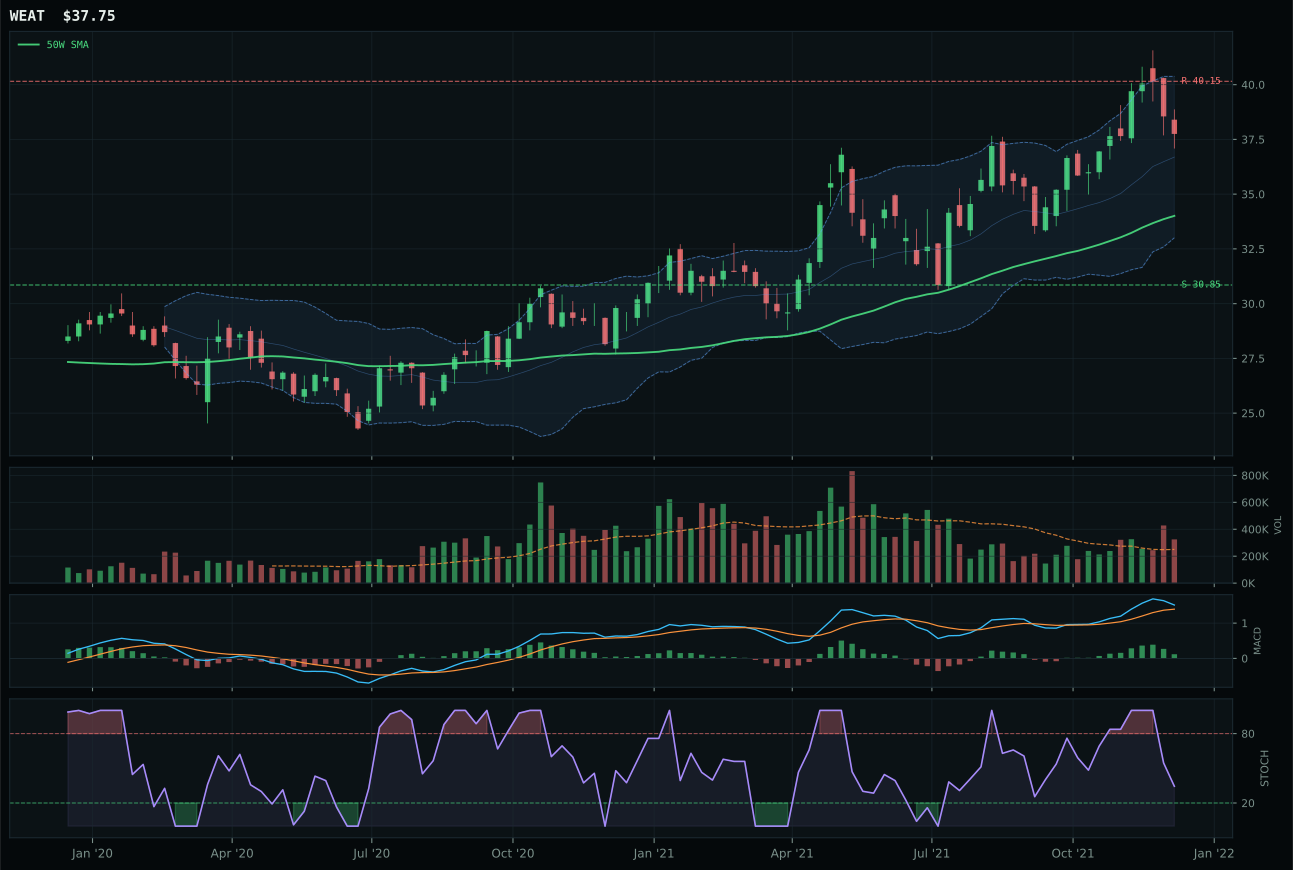
WEAT has a neutral structure profile with 6.8% 13-week relative strength versus SPY.
A failed hold above support would weaken the setup.
Tracked, but not top-2 eligible because: .
MOO wins with a 12.7-point margin over VEGI by claiming the best relative strength inside the basket despite being outperformed on absolute returns. The chart structure is neutral, neither extended nor compressed, forcing the decision onto supply-chain macro sponsorship and category-internal leadership: MOO's -1.4% category-relative strength beats VEGI's breakeven, and that thin edge combined with above-average timing score of 85.0 reflects MOO's better proximity to its 50-week moving average at 4.1% versus VEGI's compression setup. Both ETFs suffer from thin volume participation (0.70x) and bearish/weakening MACD conditions, revealing that agricultural fundamentals are supported by supply shortage and inflation narrative, not by momentum breadth. VEGI actually shows superior thirteen-week performance at 3.2% versus MOO's 1.8%, but VEGI's compression setup and weaker relative strength inside its category mean it comes to the winner's circle as runner-up in a category where neither name has earned conviction.
Agriculture & Livestock receives 5% allocation despite a 49.0 category score because the macro fit of 86.0 is exceptionally strong—among the highest category-level macro supports in the portfolio. The +13 supply shortage tailwind, +10 inflation pressure, and +8 real asset sponsorship create structural headwinds for short-only trades and provide real hedge value against ongoing price pressures. Yet the technical evidence of 34.6 for the winner reveals the tension: this category earns allocation not from momentum or technical setup conviction but from macro narrative and downside protection. Thirteen-week momentum confirmation at 19.0 and volume-price confirmation at 36.7 both indicate thin participation, suggesting this is a macro hold rather than an accumulation opportunity. The position justifies itself as a real-asset ballast in an inflationary macro regime where supply dislocations persist. If commodity breadth weakens, inflation expectations reset lower, or supply concerns ease materially, this category becomes vulnerable to a meaningful reallocation downward—it is currently a defensive allocation justified by macro thesis, not technical strength.
Industrial Metals — PICK
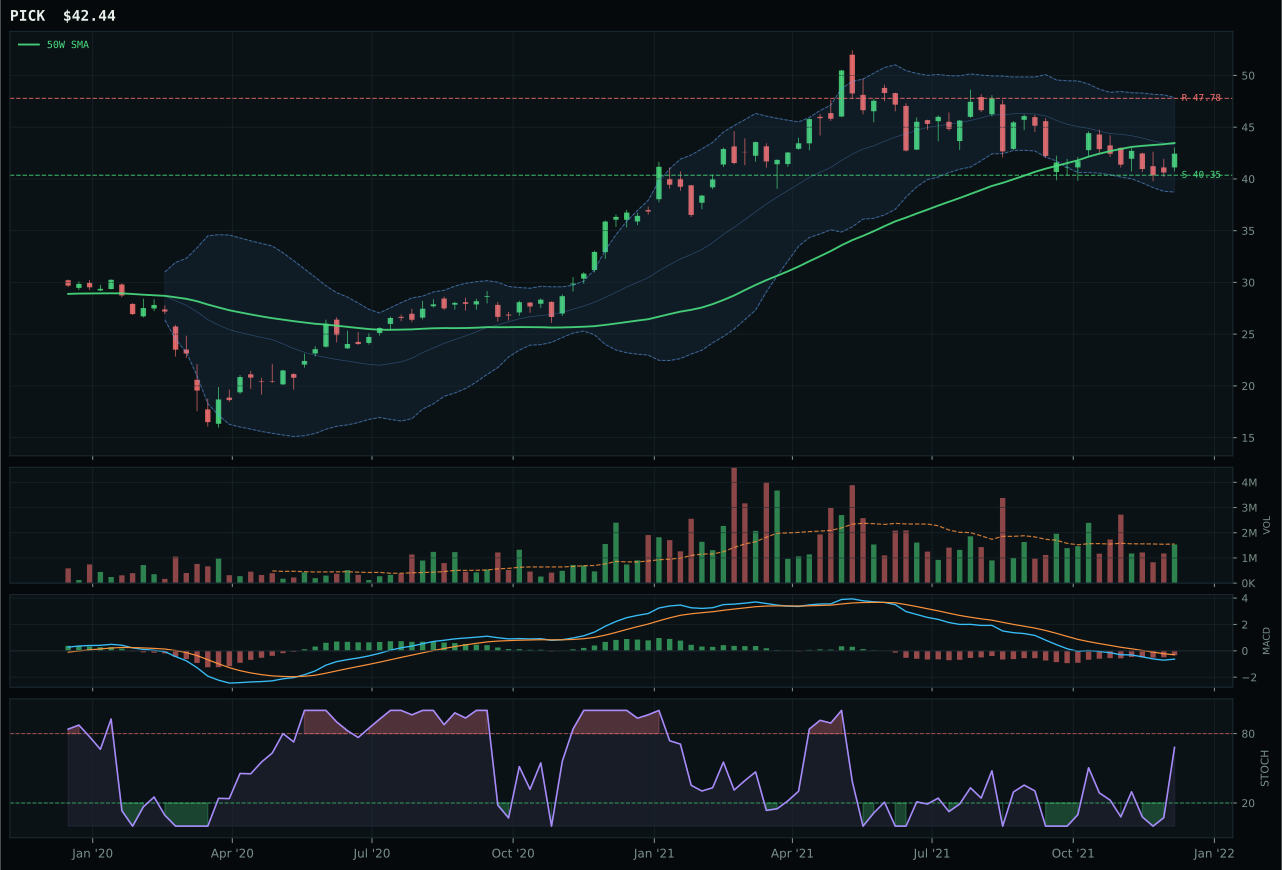
PICK has a compression near 50W profile with -11.7% 13-week relative strength versus SPY.
A failed hold above support would weaken the setup.
Actionable but governed by invalidation levels.
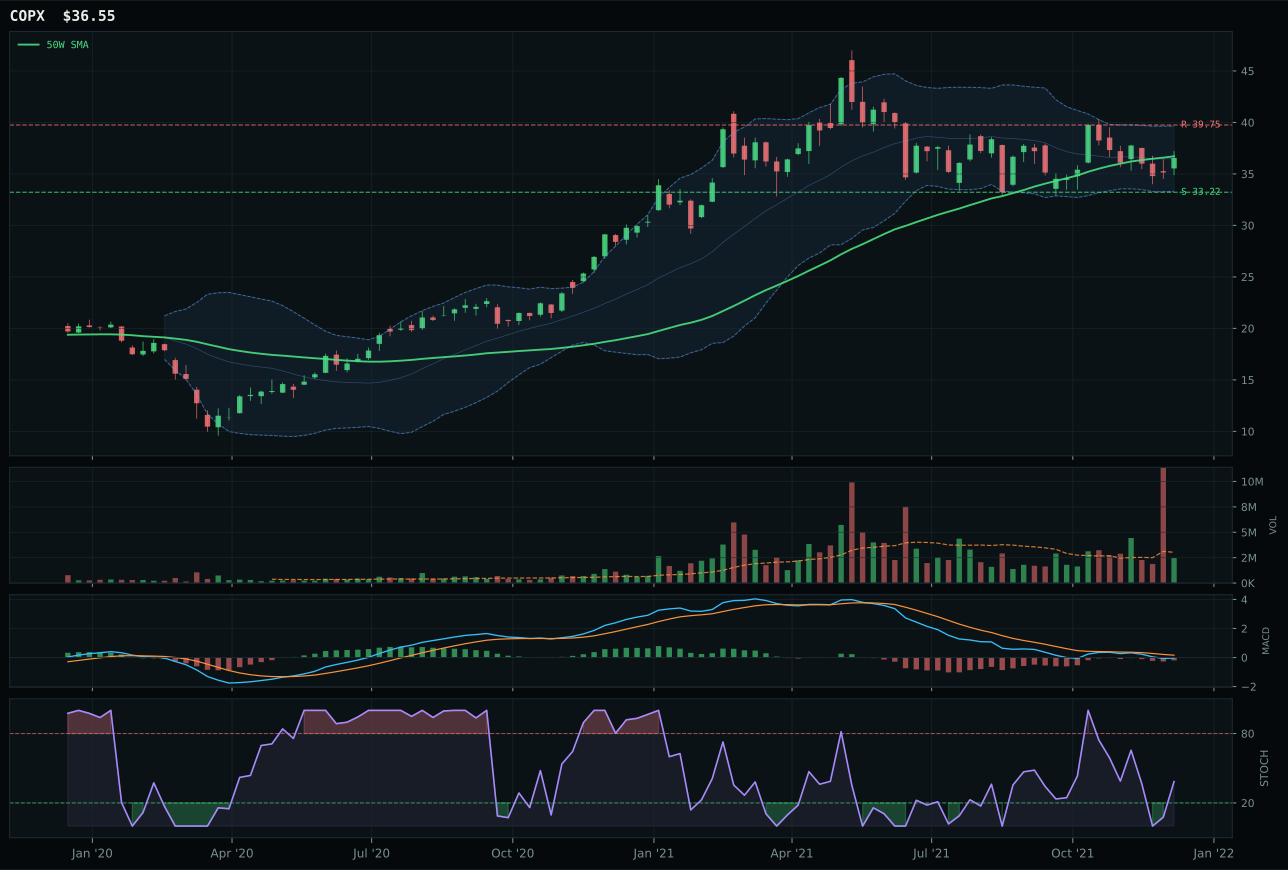
COPX has a compression near 50W profile with -7.5% 13-week relative strength versus SPY.
A failed hold above support would weaken the setup.
Actionable but governed by invalidation levels.
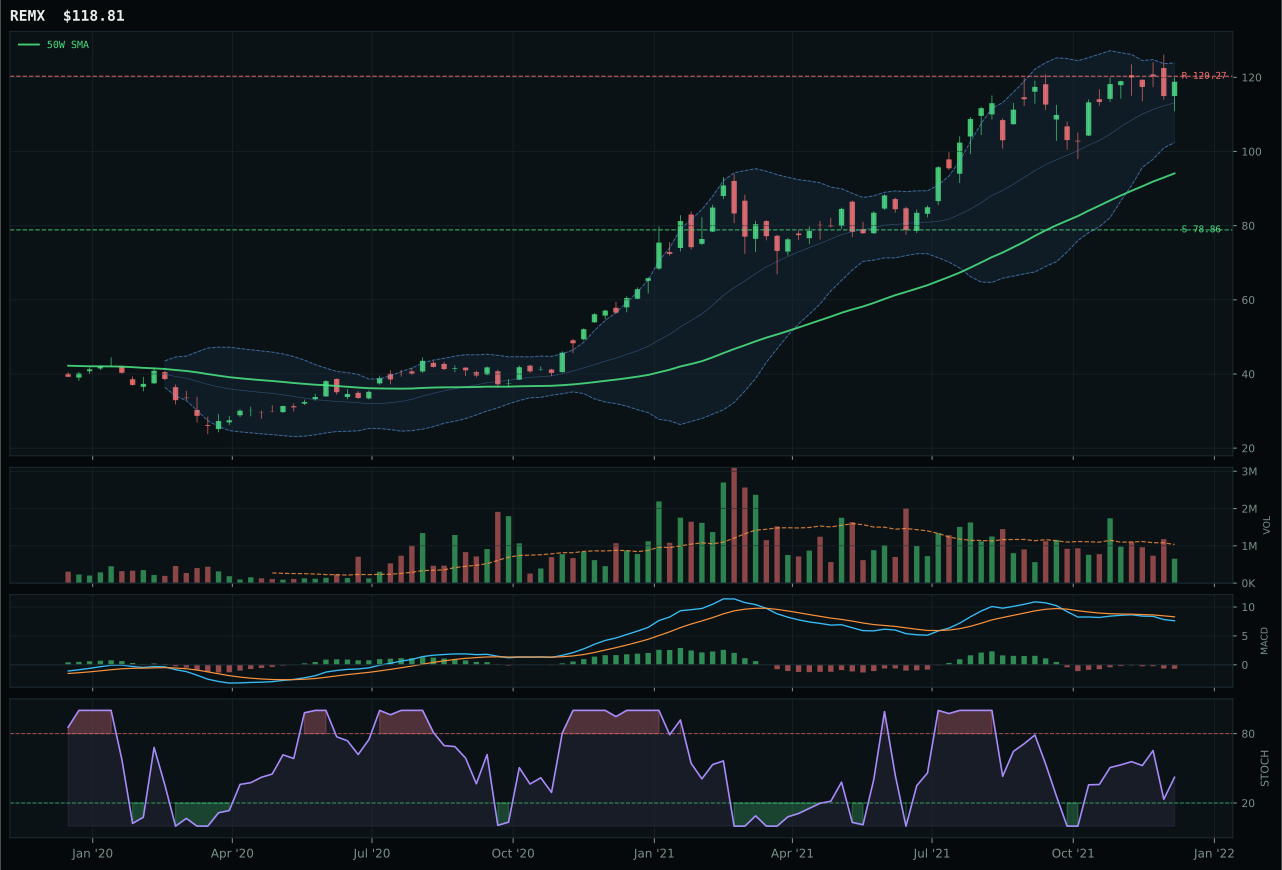
REMX has a vertical extension profile with -4.5% 13-week relative strength versus SPY.
A failed hold above support would weaken the setup.
Actionable but governed by invalidation levels.
PICK takes the category despite lagging COPX on absolute momentum, winning instead on risk/reward structure and MACD improvement signals. Both sit compressed near their 50-week moving averages in middle-retracement decision zones, but PICK's bullish-but-improving MACD and rising stochastic RSI at 0.68 suggest buyers may be defending the level, while COPX shows bearish/weakening MACD conditions that imply continued selling pressure. PICK's 91.8 risk/reward score versus COPX's 67.5 is the decisive factor: PICK offers only 5.2% downside to support against 11.2% upside to resistance, creating asymmetric risk geometry that favors allocation despite negative momentum. The thirteen-week return of -6.0% and -11.7% SPY-relative weakness confirm this is a deep reset, but the thin 0.99x volume and neutral participation suggest if buyers show up, the setup could expand quickly. COPX's weaker risk/reward reflects tighter support and wider resistance, meaning more downside risk if accumulation fails.
Industrial Metals receives 5% allocation on the back of a 44.6 category score supported by strong macro fit of 66.0, with powerful tailwinds from +14 metals scarcity, +10 commodity breadth positive, and +6 real asset sponsorship offsetting -7 credit stress and -7 dollar pressure headwinds. The 35.4 technical evidence for PICK reveals the true nature of this position: it is a macro call on supply constraints and industrial demand persistence, not a technical strength play. Momentum confirmation at 19.3 and volume-price confirmation at 31.4 both indicate this is resting accumulation at best, not conviction buying. The category earns its allocation slot because the macro regime supports real-asset pricing during inflationary transitions, and mining companies provide leveraged exposure to that thesis. However, the position remains at risk if the credit environment deteriorates sharply—a credit crunch would slash industrial demand forecasts and unwind the commodity breadth tailwind simultaneously. This allocation should remain in place as a real-asset position and a beneficiary of ongoing supply dislocations, but it is not a technical strength play and should be trimmed if PICK breaks below 40 support decisively.
Technology — XLK
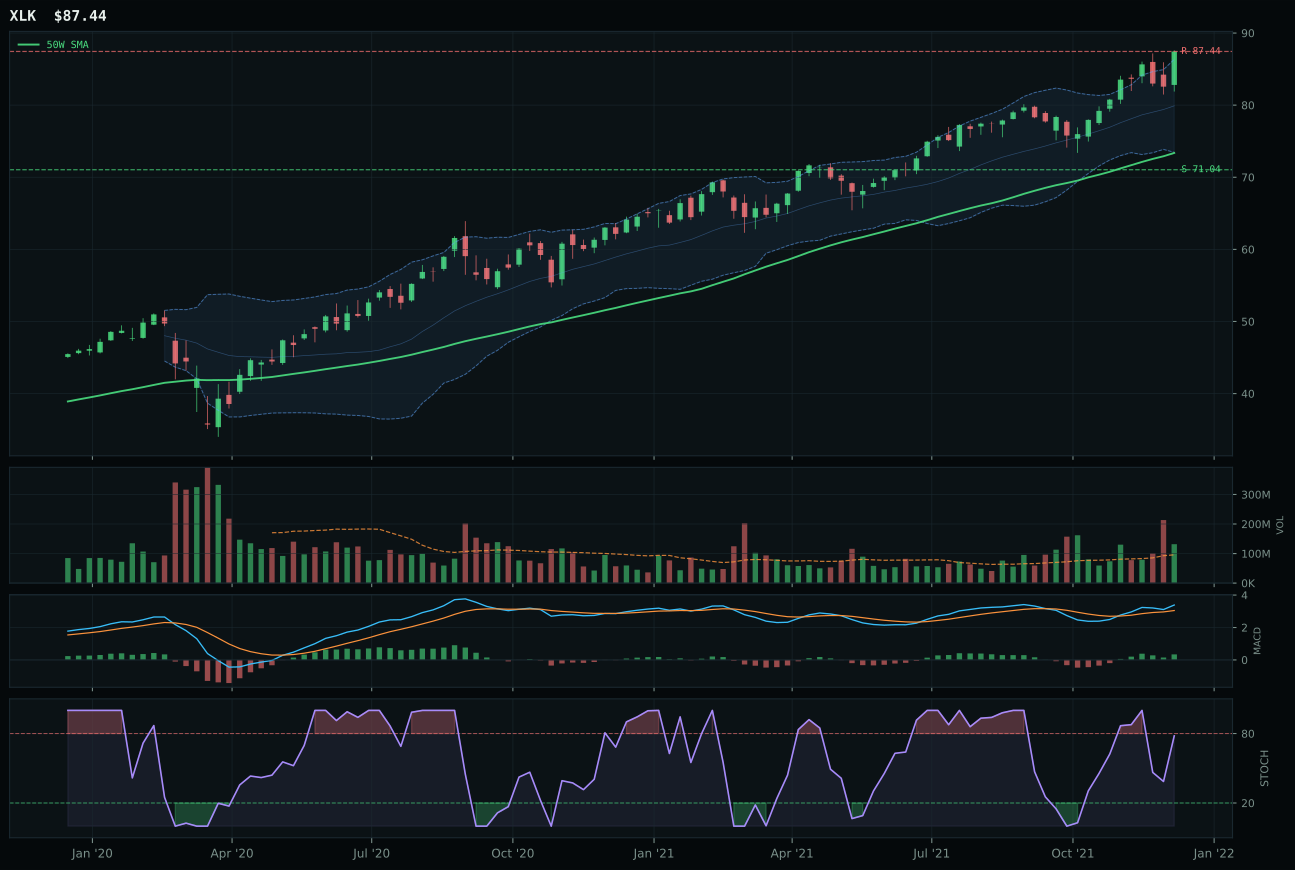
XLK has a vertical extension profile with 6.0% 13-week relative strength versus SPY.
A failed hold above support would weaken the setup.
Actionable but governed by invalidation levels.
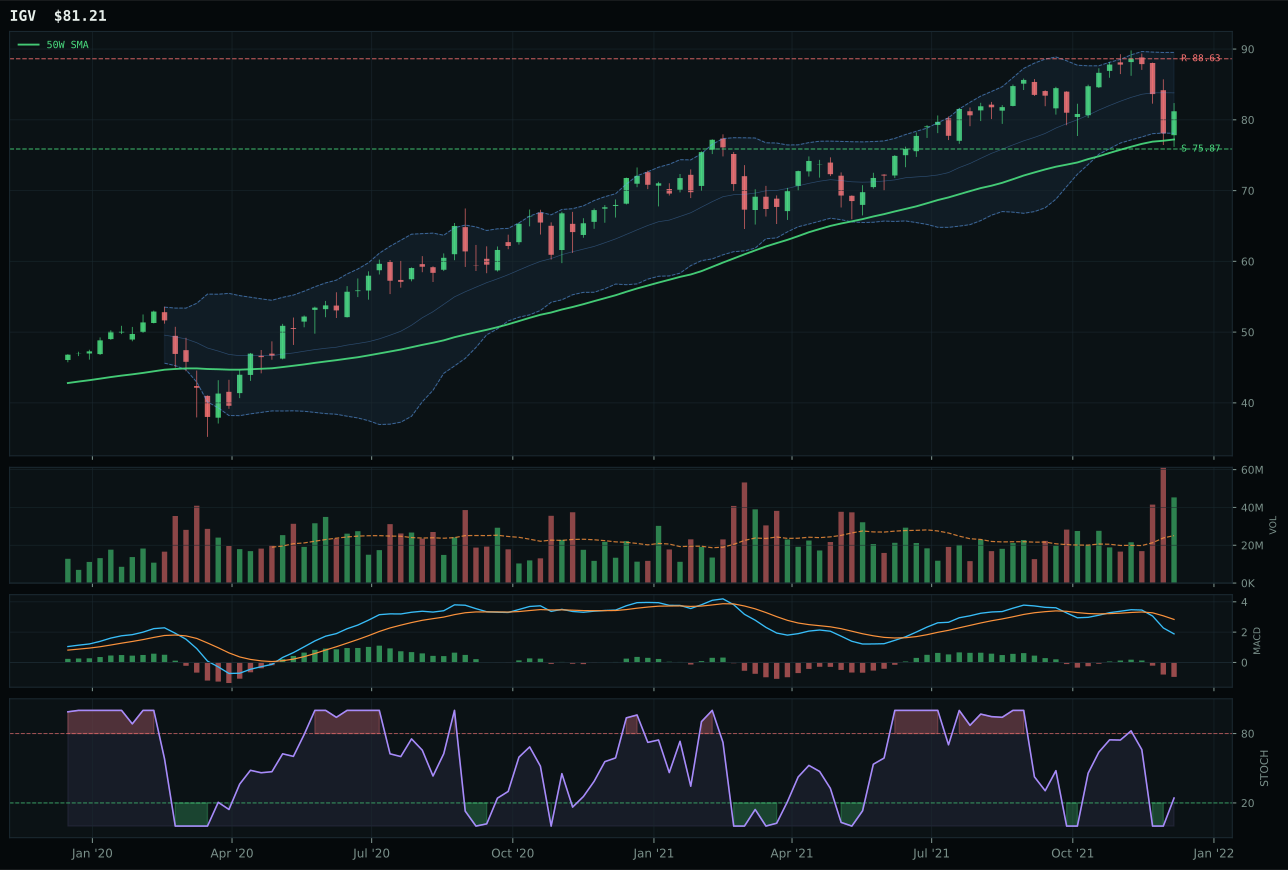
IGV has a neutral structure profile with -8.5% 13-week relative strength versus SPY.
A failed hold above support would weaken the setup.
Actionable but governed by invalidation levels.
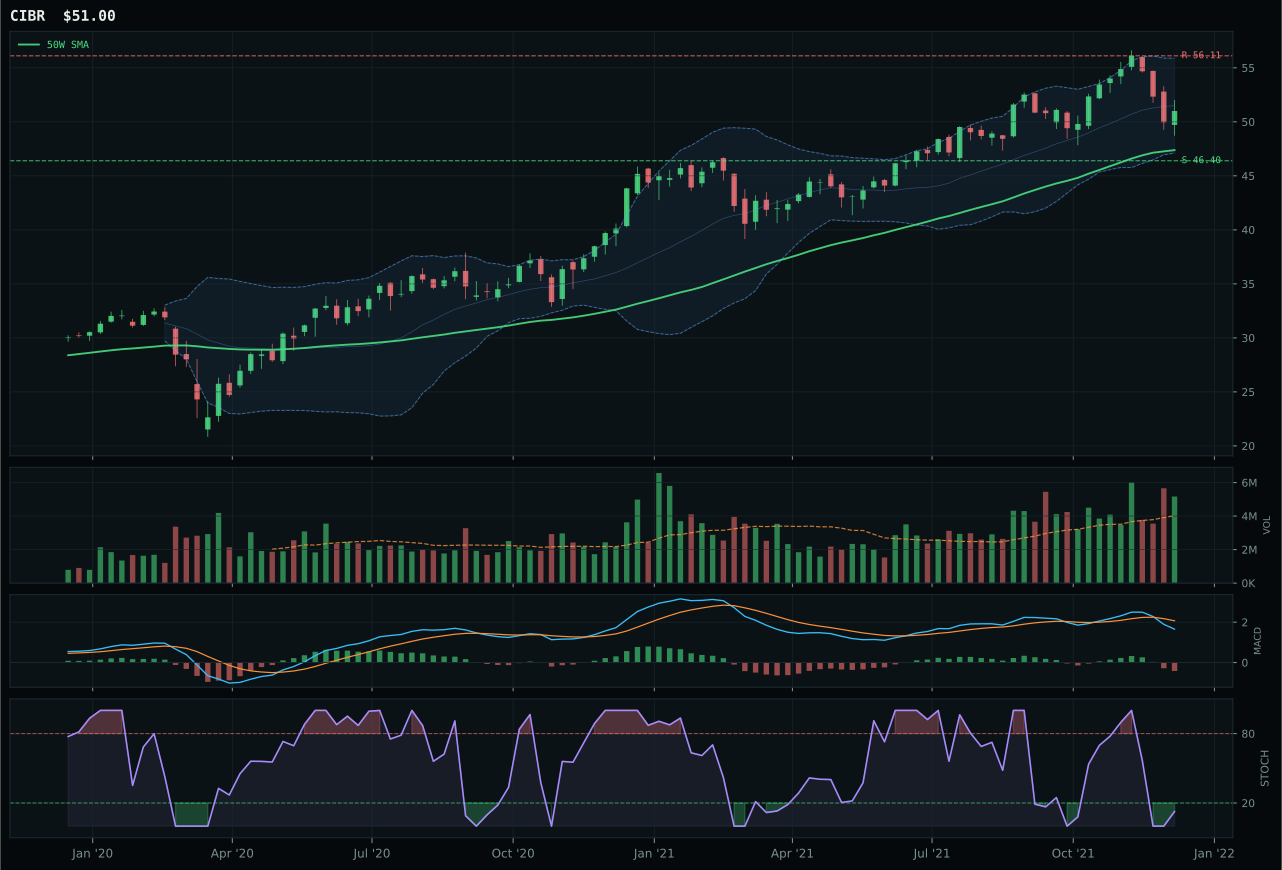
CIBR has a neutral structure profile with -5.4% 13-week relative strength versus SPY.
A failed hold above support would weaken the setup.
Actionable but governed by invalidation levels.
XLK secured the category win with a 12.6-point gap over IGV by combining uptrend confirmation with superior momentum sponsorship. Price sits 19.2% above the 50-week moving average, which normally signals entry risk, but the 11.7% thirteen-week return and 11.4% relative strength within the category basket prove accumulation is active rather than fading momentum. MACD is bullish and improving while stochastic RSI remains neutral, a healthy signal that new buyers are not capitulating into oversold extremes. IGV's loss stems from a MACD deterioration to bearish/weakening paired with a -3.1% category-relative strength deficit, revealing sector bifurcation between profitable core tech and duration-sensitive software names. The setup quality—vertical extension with 75.0 chart cleanliness—confirms this is a high-participation move driven by institutional confidence in broad profitable growth, not speculation.
Technology receives 5% allocation as a tier-2 category, reflecting its solid technical foundation but constrained macro fit in a mixed-regime environment. The 79.0 technical evidence score for XLK is genuinely strong, anchored in trend strength and volume confirmation, yet the category's overall 49.0 macro fit score caps its strategic weight. Credit stress and inflation pressure remain active headwinds offsetting the +9 tailwind from risk appetite strength and +6 from AI growth sponsorship. For technology to reclaim a higher allocation tier, the macro descriptors would need to shift: sustained credit relief, inflation rollover confirmation, or a sustained breakout above overhead resistance near 82 would re-establish a case for expansion. Until then, the 5% positioning holds technology as a quality holding without directional conviction, useful for diversification but not a growth engine in the current mixed macro state.
Precious Metals — GLD
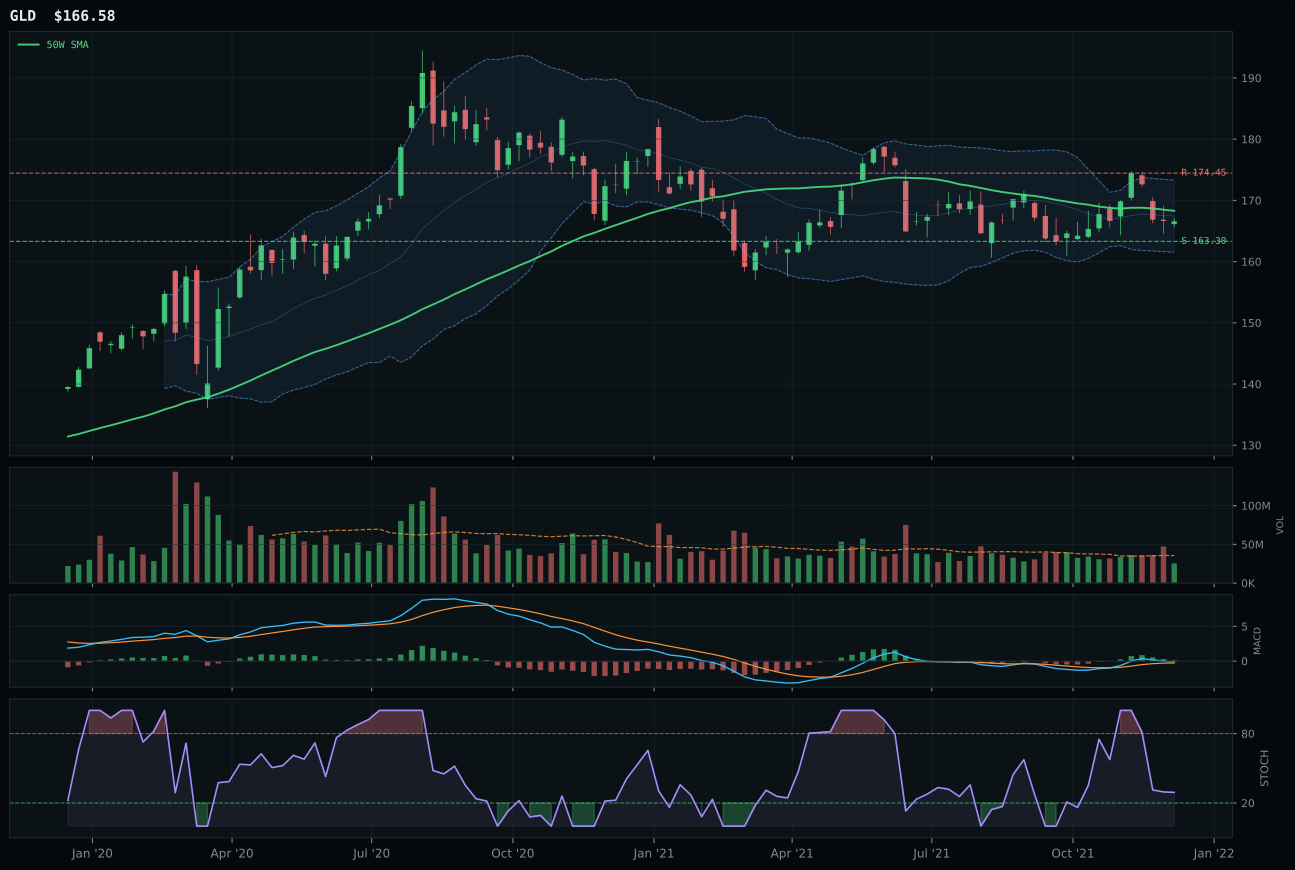
GLD has a pullback into support profile with -6.0% 13-week relative strength versus SPY.
A failed hold above support would weaken the setup.
Actionable but governed by invalidation levels.
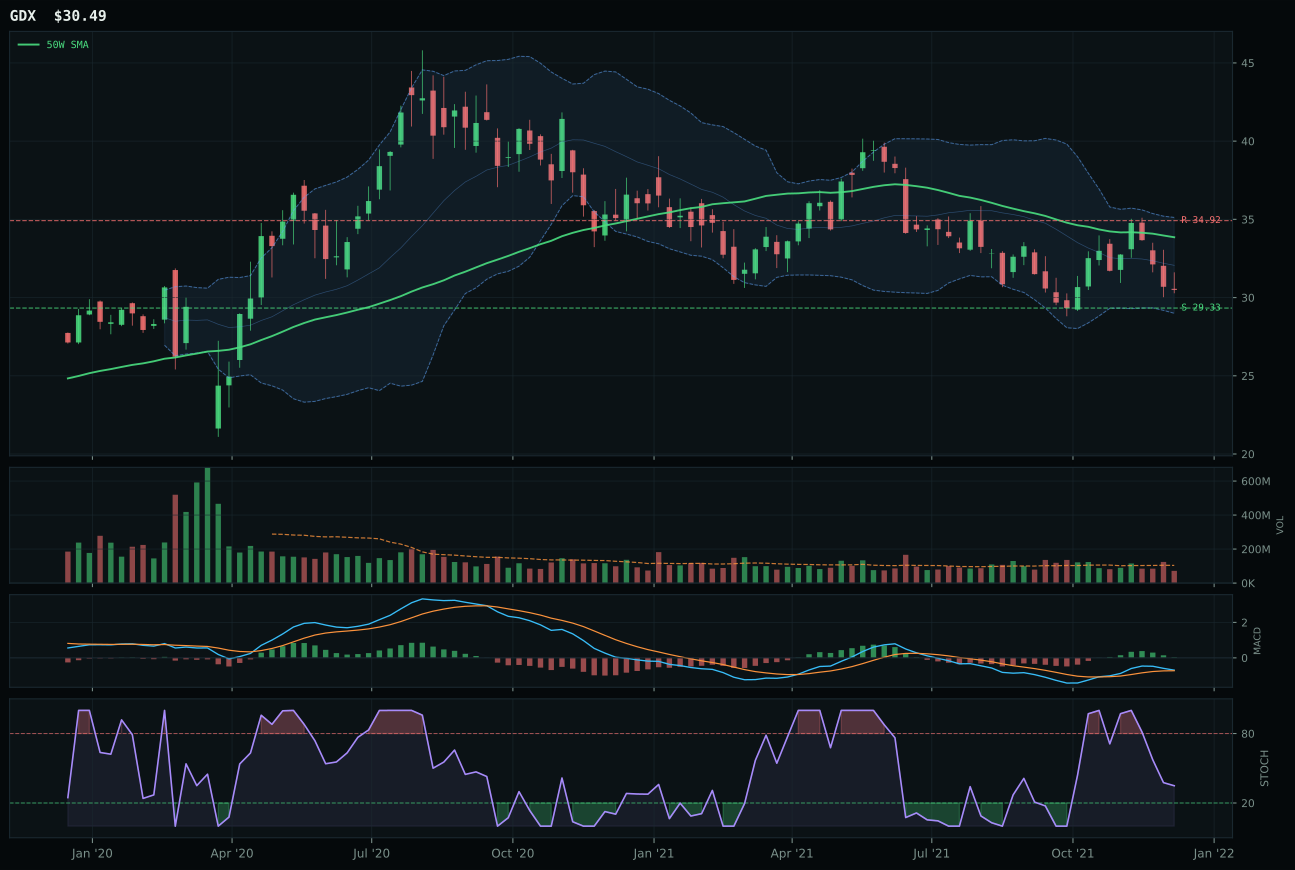
GDX has a pullback into support profile with -8.9% 13-week relative strength versus SPY.
A failed hold above support would weaken the setup.
Actionable but governed by invalidation levels.
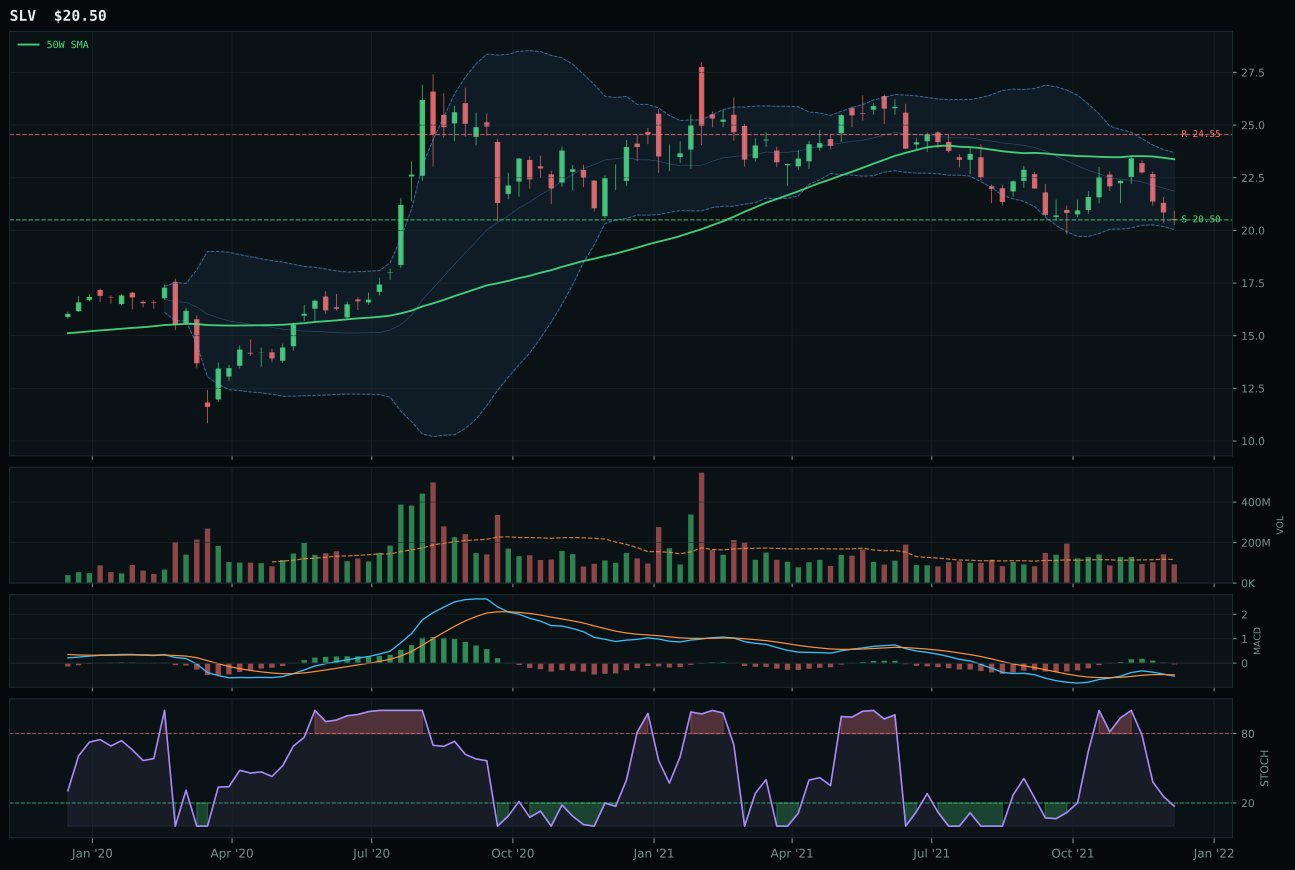
SLV has a pullback into support profile with -12.5% 13-week relative strength versus SPY.
A failed hold above support would weaken the setup.
Actionable but governed by invalidation levels.
GLD edges GDX by 9.8 points with a cleaner, better-timed pullback-into-support structure that offers superior risk/reward geometry. Gold pulled back just 1.0% below the 50-week moving average, placing it in the deep retracement value zone near Fib 0.618, while its MACD remains bullish but flattening—a combination that signals potential accumulation without the desperation of capitulation. GLD's timing score hits 100.0 because the setup is tight and defined: support at 163.30 is only 2.0% away, resistance at 174.45 is 4.5% away, creating favorable downside-to-upside asymmetry at 93.4 risk/reward. GDX loses on timing (80.0 versus 100.0) and on cleanliness (64.6 versus 68.9) because miners are further extended from their support zone and exhibit more volatile structure. Both suffer from thin volume (0.71x) and muted near-term momentum (-0.4% for gold, -3.2% for miners), indicating this is a monetary hedge in waiting, not a breakout play.
Precious Metals receives 5% allocation despite a 41.7 category score because it serves portfolio insurance in a mixed macro regime where dollar pressure is active (+3) yet offset by risk appetite strength (-4). The category macro fit of 49.0 reflects this tension: gold should perform well in a stress scenario, yet if risk appetite remains intact, it will likely trade sideways to down. Technical evidence of 56.5 for GLD is respectable but not compelling, and the 37.6 momentum confirmation score reveals minimal participation in this setup—it is a resting position, not an active accumulation. For precious metals to earn higher allocation, either credit conditions would need to deteriorate significantly, the dollar would need to weaken sustainably on real yields compression, or geopolitical risk would need to spike materially. Current positioning reflects portfolio insurance optionality: small enough not to drag on returns if risk appetite persists, yet present enough to provide ballast if sentiment shifts. This is a hedging allocation, not a conviction portfolio position, and it should shrink if gold breaks below 160 support convincingly.
AI — SMH
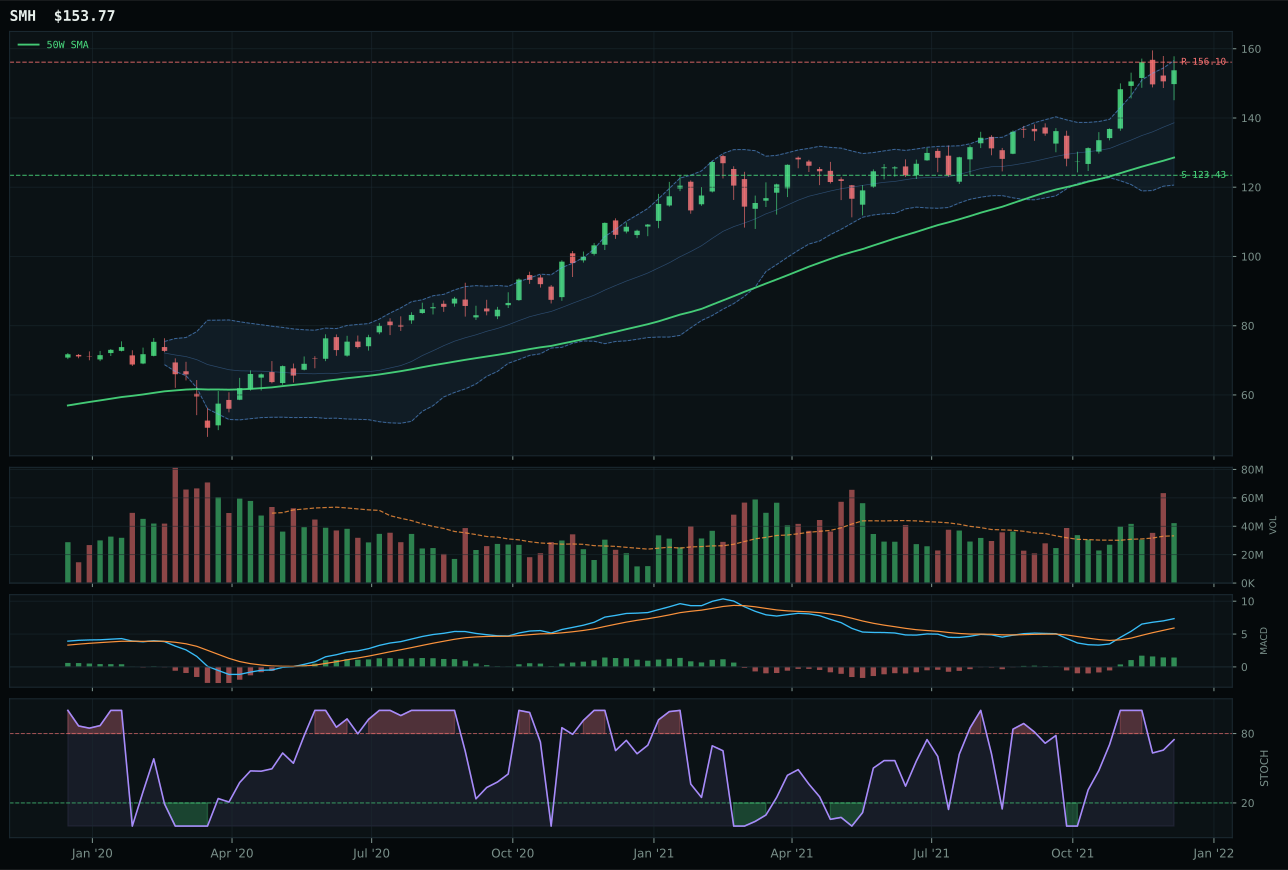
SMH has a vertical extension profile with 7.3% 13-week relative strength versus SPY.
A failed hold above support would weaken the setup.
Actionable but governed by invalidation levels.
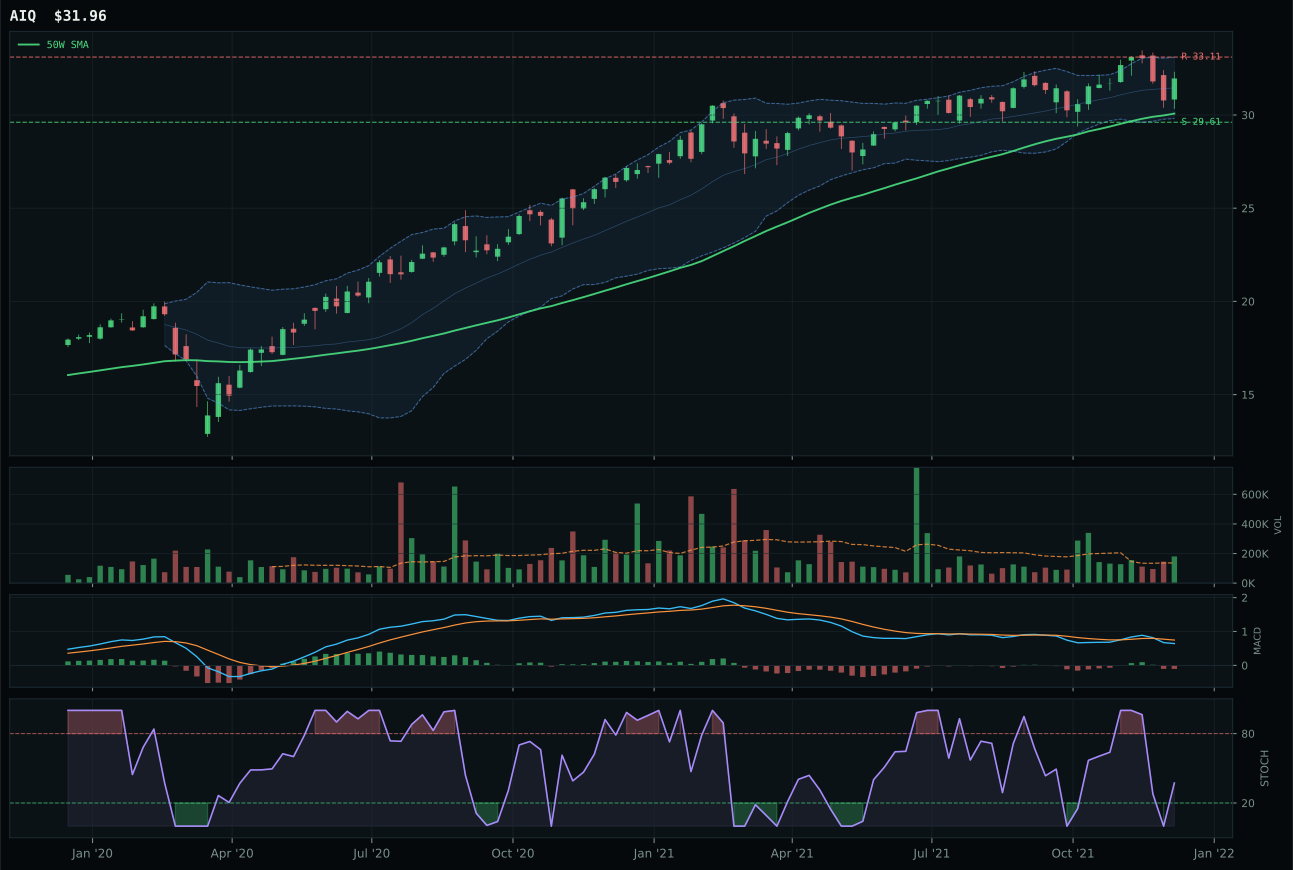
AIQ has a neutral structure profile with -4.5% 13-week relative strength versus SPY.
A failed hold above support would weaken the setup.
Tracked, but not top-2 eligible because: .
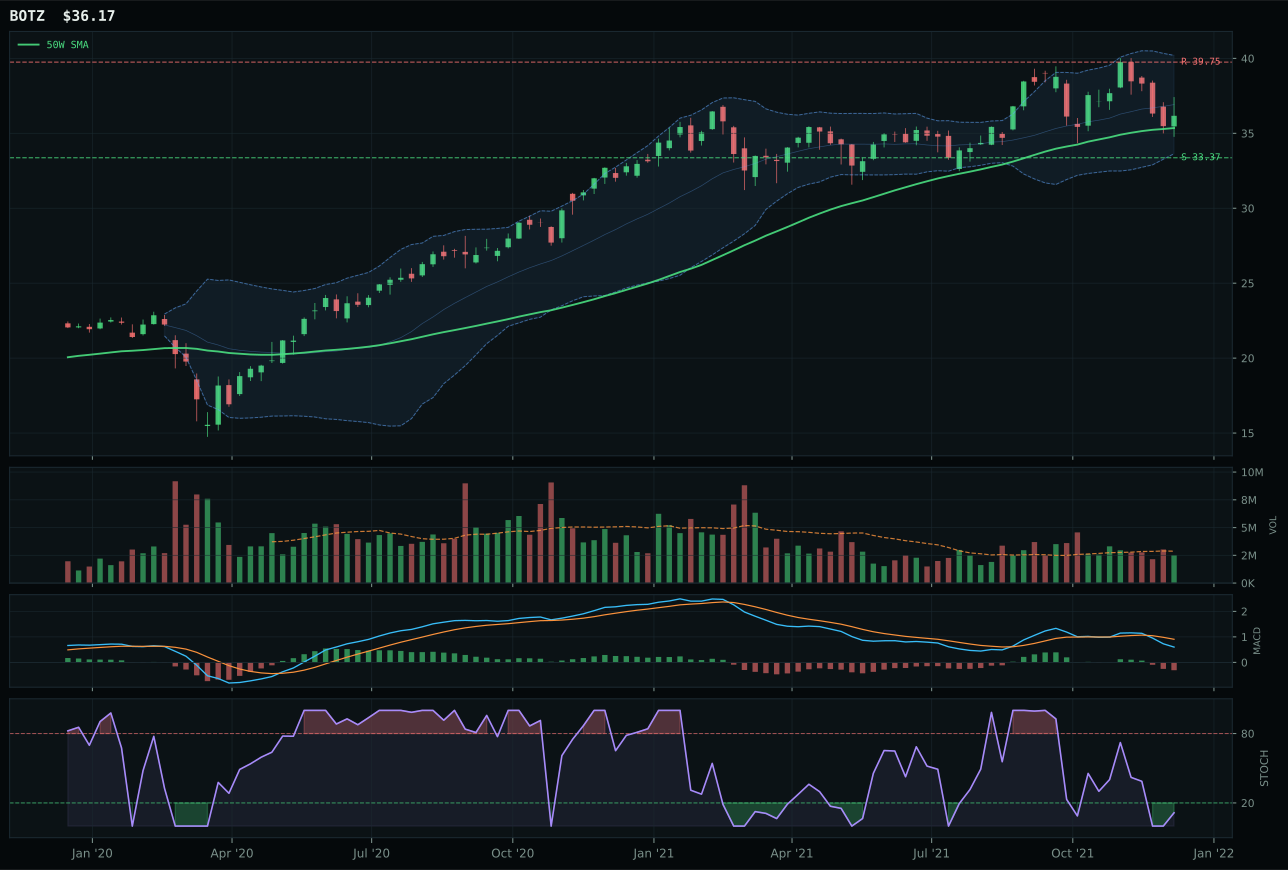
BOTZ has a compression near 50W profile with -11.6% 13-week relative strength versus SPY.
A failed hold above support would weaken the setup.
Actionable but governed by invalidation levels.
SMH dominated its category with an 38.1-point margin over AIQ by owning the trend, momentum, and macro narrative simultaneously. The semiconductor index sits 19.6% above the 50-week line with a 13.0% thirteen-week return and 7.3% SPY-relative strength, all confirmed by neutral compression and falling stochastic RSI that avoids the whipsaw risk of oversold rebounds. What separates SMH from AIQ is not just momentum but composition: semiconductor demand from AI training infrastructure and data centers creates structural supply shortage, while AI software names face the valuation and credit sensitivity IGV proved vulnerable to. MACD remains bullish and improving across the period, and above-average volume participation at 1.27x the 20-week average proves capital is rotating into compute, not just chasing sentiment. AIQ's negative 4W return and -4.5% SPY-relative strength paired with deteriorating MACD signal that broader AI application exposure has lost marginal buyer support.
AI receives 5% allocation despite a 39.1 category score that reflects genuine technical strength but insufficient macro conviction to elevate it into top-2 overweight status. SMH's 92.5 technical evidence score is legitimate, yet the category macro fit of 54.0 sits squarely neutral—strong enough to justify a position but weak enough to leave it subordinate to energy and utilities. The +14 tailwind from active AI growth sponsorship and +10 from risk appetite strength are offset by -8 from broad market bear positioning and -8 from credit stress concerns that particularly threaten leveraged semiconductor valuations. The setup works in SMH's favor now, but the current macro regime discourages portfolio concentration in growth momentum plays that could face margin pressure if credit conditions tighten or the AI capex narrative shifts to productivity questions rather than pure capacity build. Five percent acknowledges the strength without over-committing to a thesis that may face headwinds if corporate sentiment deteriorates.
Defense & Aerospace — ITA
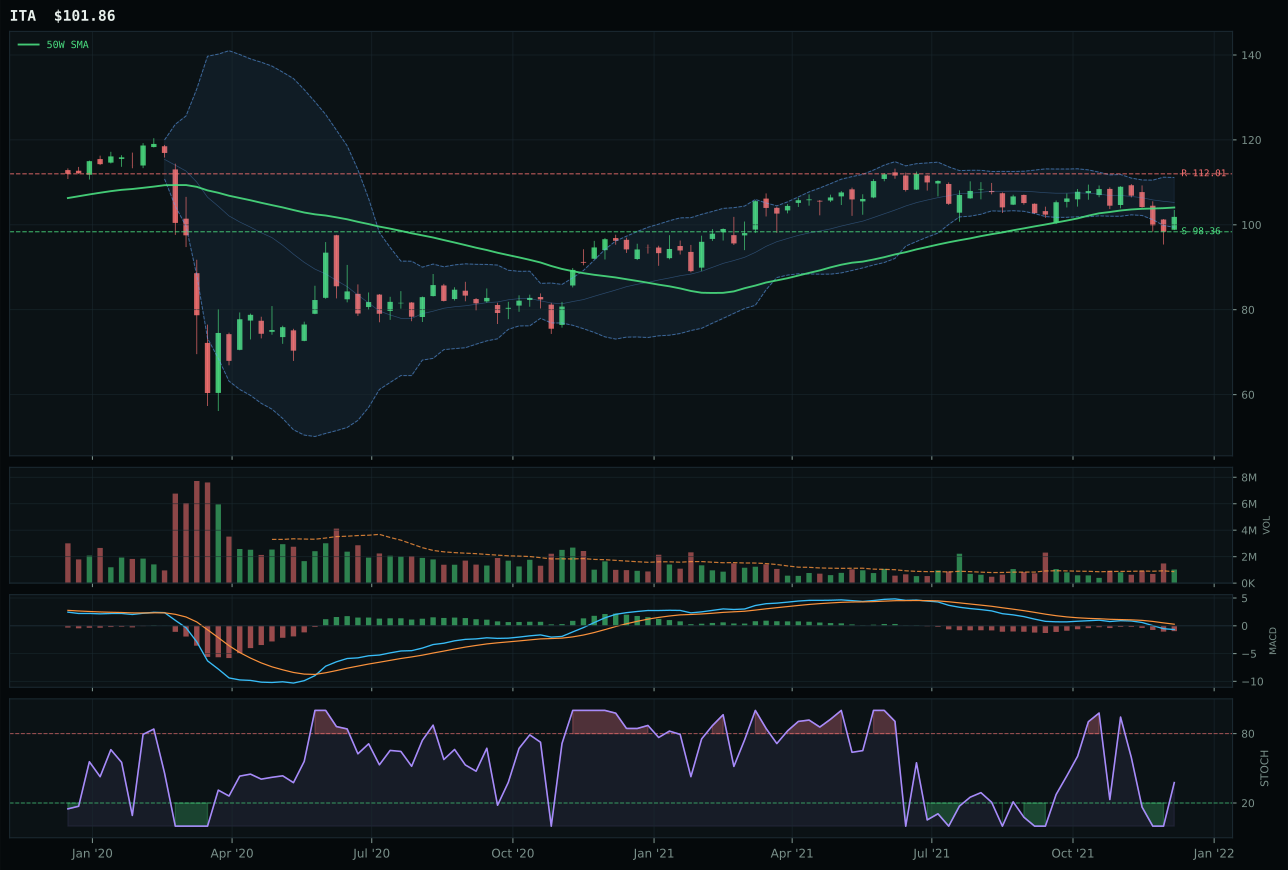
ITA has a pullback into support profile with -6.5% 13-week relative strength versus SPY.
A failed hold above support would weaken the setup.
Actionable but governed by invalidation levels.
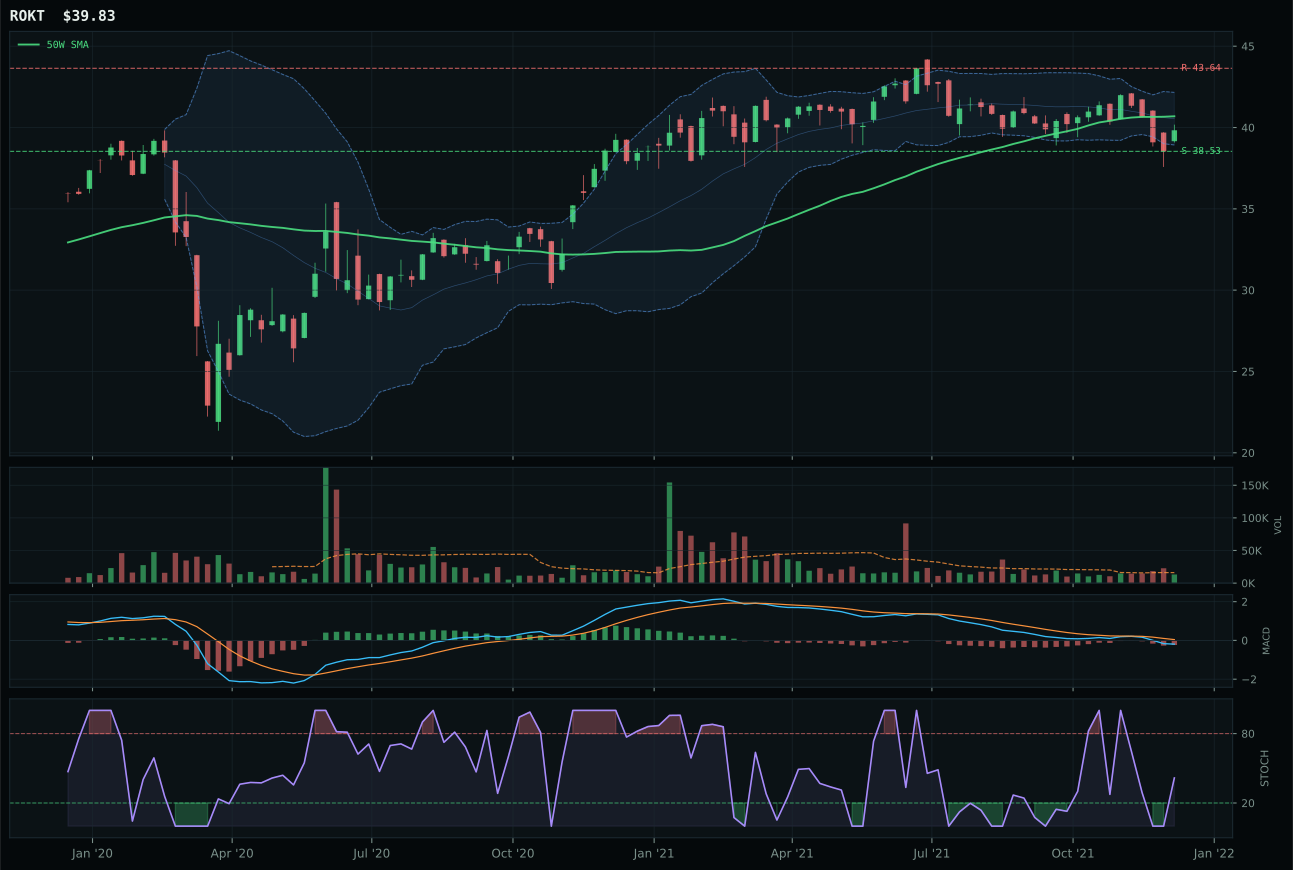
ROKT has a pullback into support profile with -6.7% 13-week relative strength versus SPY.
A failed hold above support would weaken the setup.
Tracked, but not top-2 eligible because: .
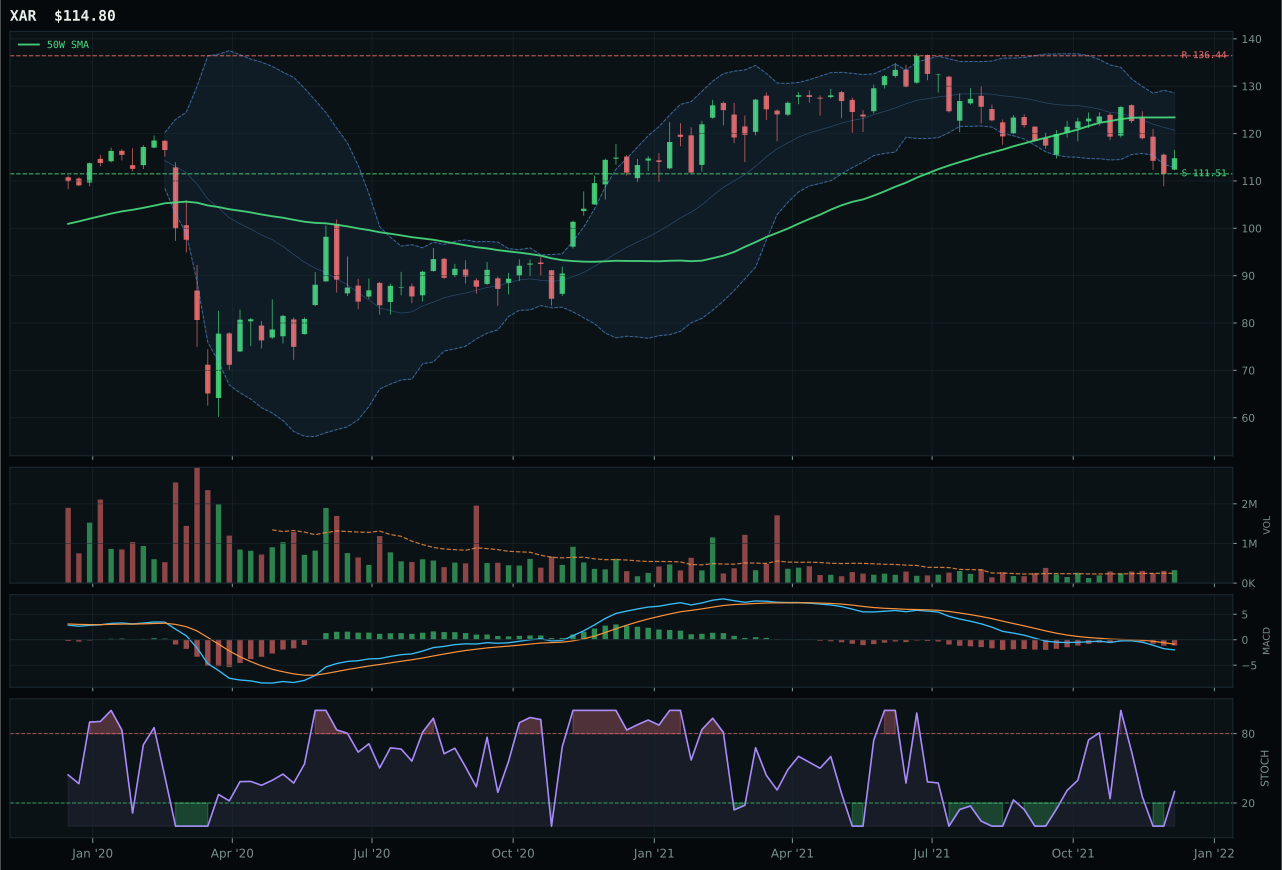
XAR has a pullback into support profile with -8.8% 13-week relative strength versus SPY.
A failed hold above support would weaken the setup.
Actionable but governed by invalidation levels.
ITA wins with a 28.7-point advantage over ROKT by owning the best-defined pullback-into-support setup available. Price pulled back to 2.1% below the 50-week moving average, placing it squarely at the middle retracement decision zone near Fib 0.500, while stochastic RSI is rising mid-zone at 0.38—the exact combination that signals potential accumulation rather than capitulation. The timing score of 100.0 reflects this defined risk structure: support at 98.36 and resistance at 112.01 give the position a 3.6% downside to invalidation and 9.1% upside if buyers step in. Despite a 0.2% relative strength advantage within the category, ITA's 19.9 momentum score reveals the category itself is lethargic, but above-average volume participation at 1.18x proves participants are willing to defend the level. ROKT loses ground because its neutral volume participation and weaker structure at 72.4 versus 76.7 suggest less conviction in the pullback as a dip-buying opportunity.
Defense & Aerospace earns 5% allocation as a tier-3 position, supported by a macro fit of 64.0 that benefits from broad market bear conditions and dollar pressure tailwinds offsetting credit headwinds. The category score of 38.2 sits below meaningful allocations because the fundamental setup is a reset, not a recovery: minus-0.9% thirteen-week returns and -6.5% SPY-relative weakness indicate this is a value holding, not a momentum position. Transition-regime positioning means defensive rotation is welcome, yet the lack of volume-price sponsorship (30.1 confirmation score) suggests participants are cautious rather than committed. For this category to earn meaningful allocation expansion, the macro descriptors would need to shift decisively toward war-premium expectations, geopolitical de-risking failure, or a sustained credit-stress episode that makes defense dividend cash flow attractive relative to growth earnings compression. Current positioning reflects defensive tilt without conviction—if credit stress worsens materially, this position could reclaim strategic weight.
Nuclear Energy — URA
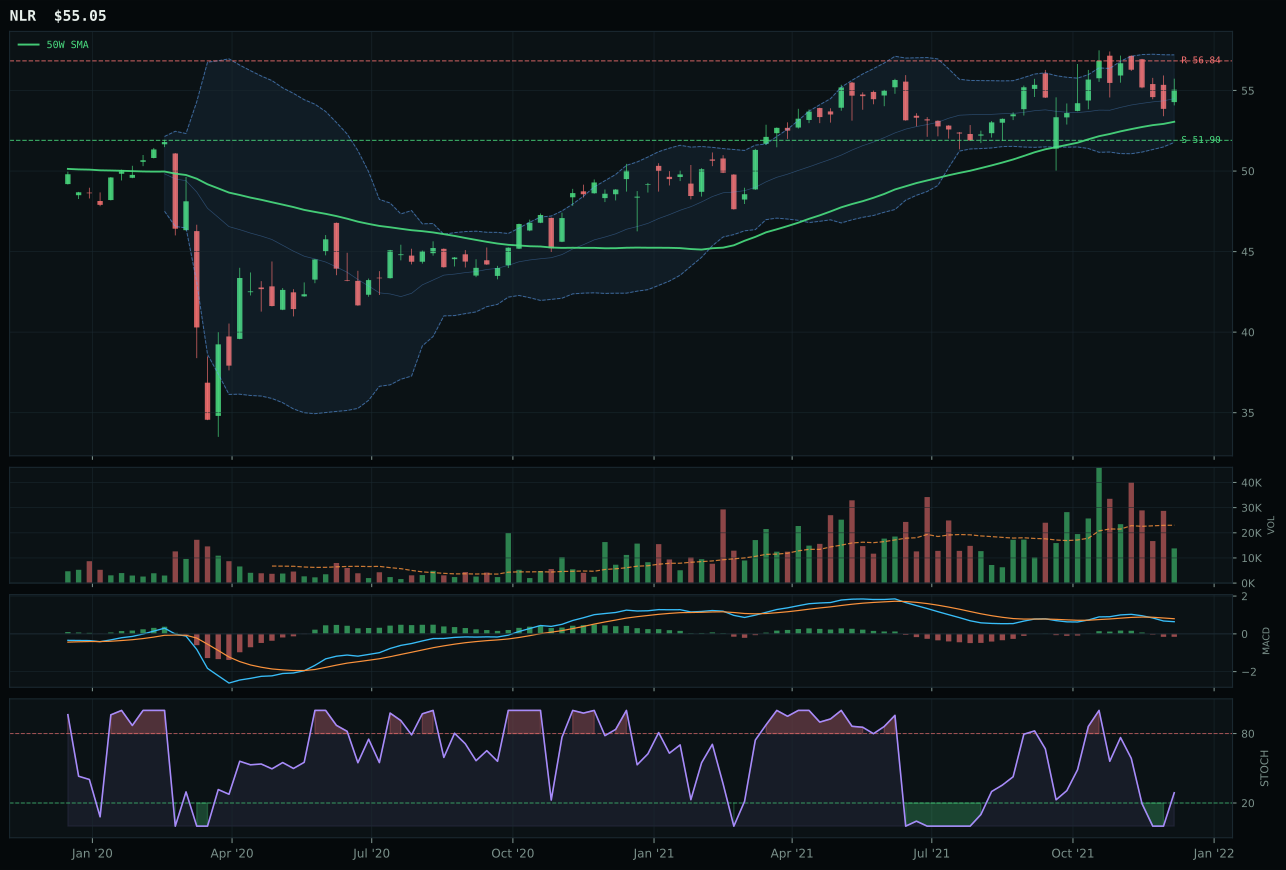
NLR has a neutral structure profile with -6.2% 13-week relative strength versus SPY.
A failed hold above support would weaken the setup.
Tracked, but not top-2 eligible because: .
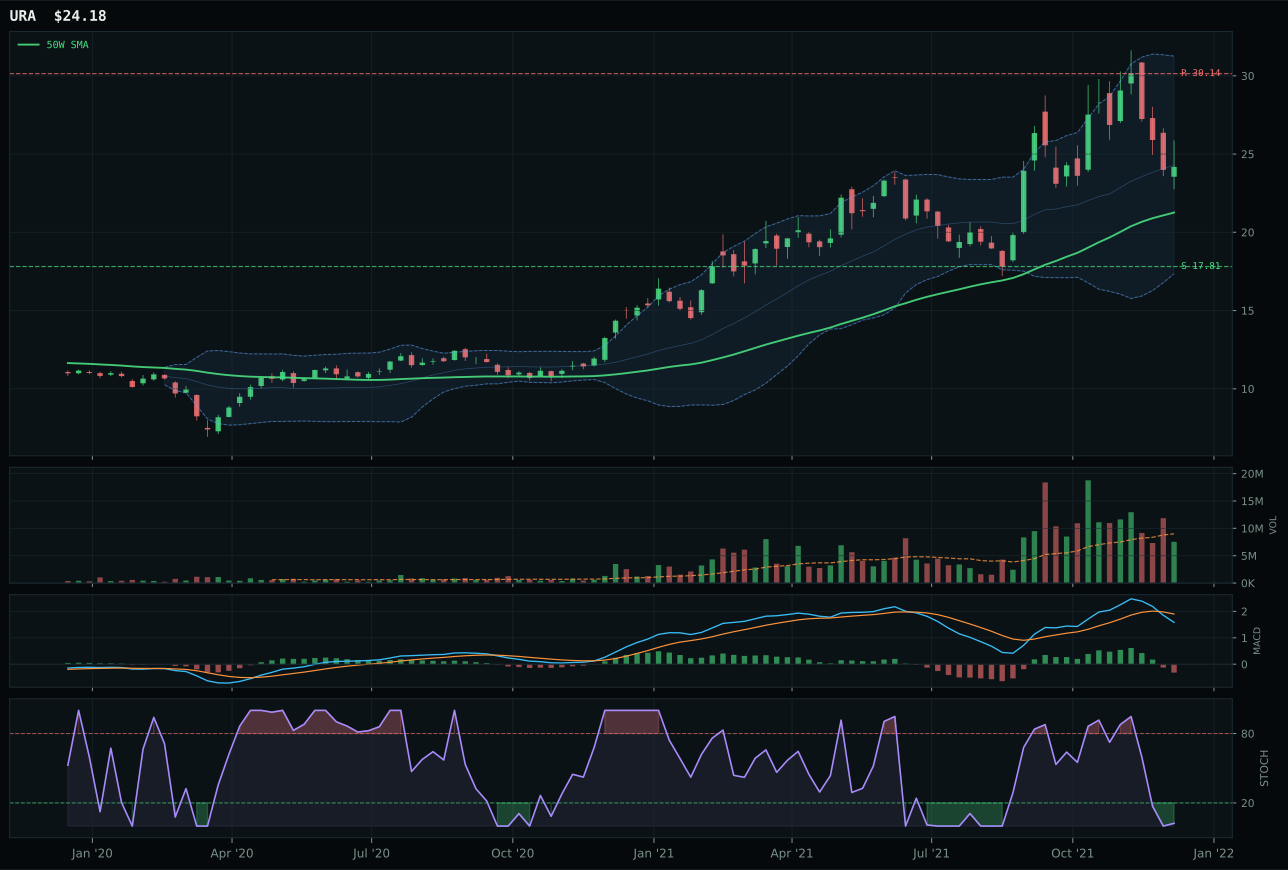
URA has a neutral structure profile with -13.9% 13-week relative strength versus SPY.
A failed hold above support would weaken the setup.
Actionable but governed by invalidation levels.
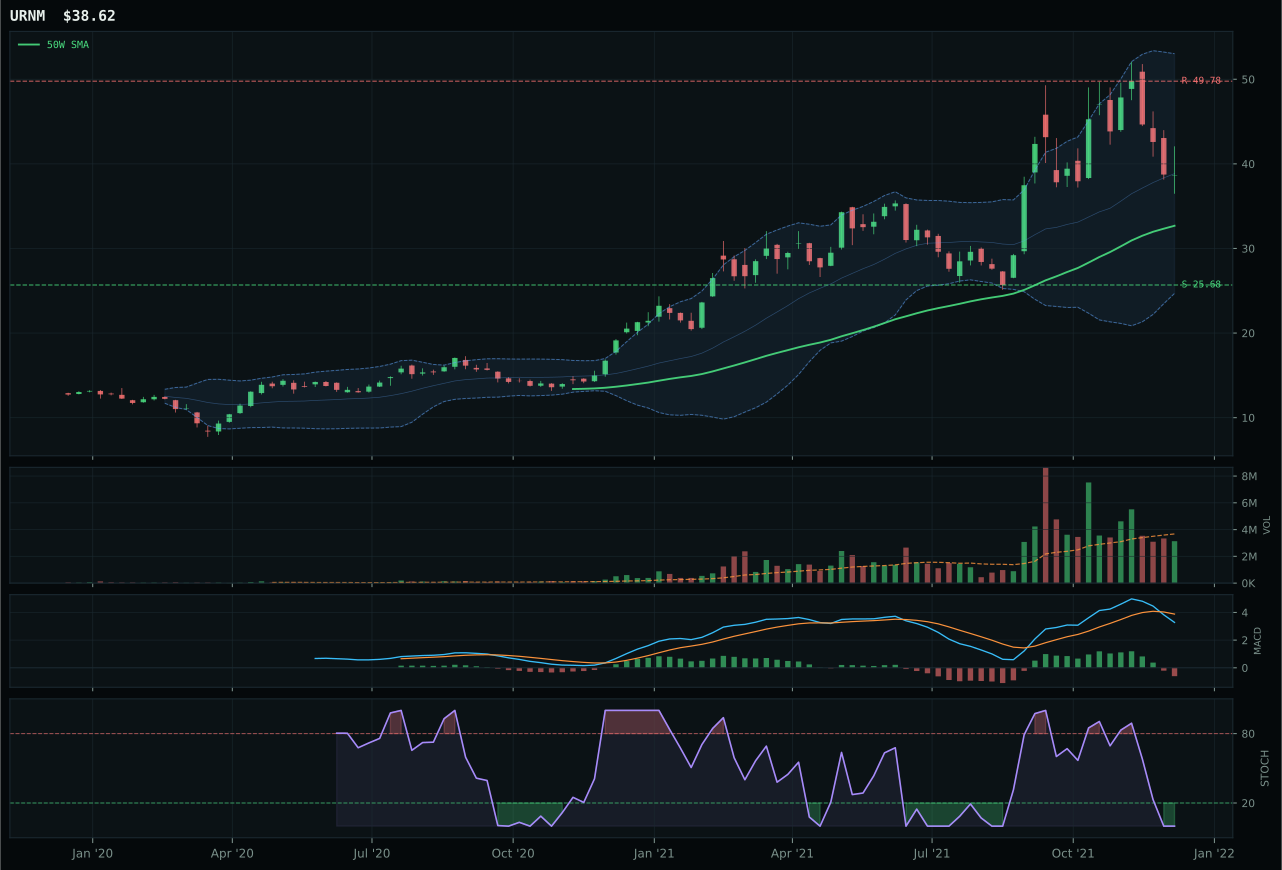
URNM has a vertical extension profile with -14.5% 13-week relative strength versus SPY.
A failed hold above support would weaken the setup.
Actionable but governed by invalidation levels.
URA edges NLR by eight points but still fails to meet allocation thresholds because both ETFs suffer from severe momentum compression and deteriorating MACD conditions. URA's thirteen-week return of negative eight-point-two percent and negative thirteen-point-nine percent SPY-relative weakness create a momentum confirmation score of just zero point zero—no participation, no accumulation, only distribution. Price sits 13.7% above the 50-week moving average with stochastic RSI oversold at 0.02, a combination that suggests capitulation has gone too far, yet volume remains neutral, preventing the rebound confirmation that would signal real accumulation. NLR shows slightly better thirteen-week performance at negative zero-point-five percent but loses on volume participation (thin versus neutral) and on stochastic RSI positioning, which sits rising mid-zone but from an oversold baseline. Both charts are structurally broken relative to the energy complex, revealing that nuclear exposure lags as capital rotates specifically to commodity energy and supply-constrained names rather than broader energy infrastructure.
Nuclear Energy receives zero percent allocation this week, ranking ninth or tenth among category options, because the category score of 32.6 fails to clear the threshold for even minimum positioning. The technical evidence is weak (19.9 for the winner), and the macro fit of 69.0, while superficially attractive with +9 energy scarcity support, cannot overcome the technical deterioration and lack of participation. Dollar pressure (-14 impact on the category macro fit), credit stress (-10), and broad market bear positioning (-9) all weigh heavily despite real energy scarcity arguments. URA's bearish/weakening MACD and oversold stochastic RSI suggest capitulation has priced in real risk, yet the zero momentum confirmation score reveals no bottom-fishing accumulation—this is pure capitulation without conviction from institutional buyers. For nuclear exposure to reclaim allocation, the technical setup would need to stabilize at current levels with stochastic RSI moving into mid-zone while volume participation increases to above-average levels. Until then, nuclear exposure is appropriately excluded in favor of traditional energy names that show both macro support and technical breadth.
Emerging Markets — INDA
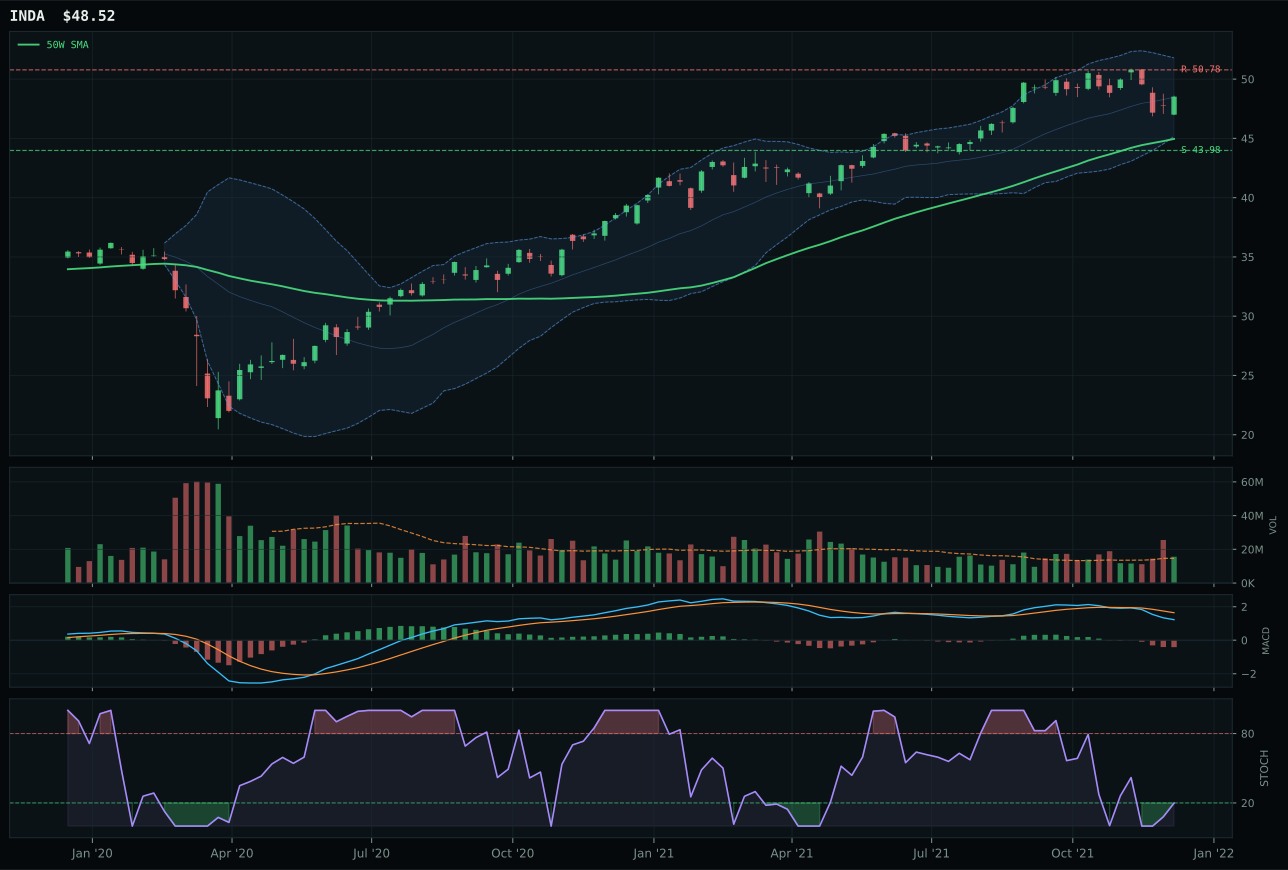
INDA has a neutral structure profile with -7.2% 13-week relative strength versus SPY.
A failed hold above support would weaken the setup.
Actionable but governed by invalidation levels.
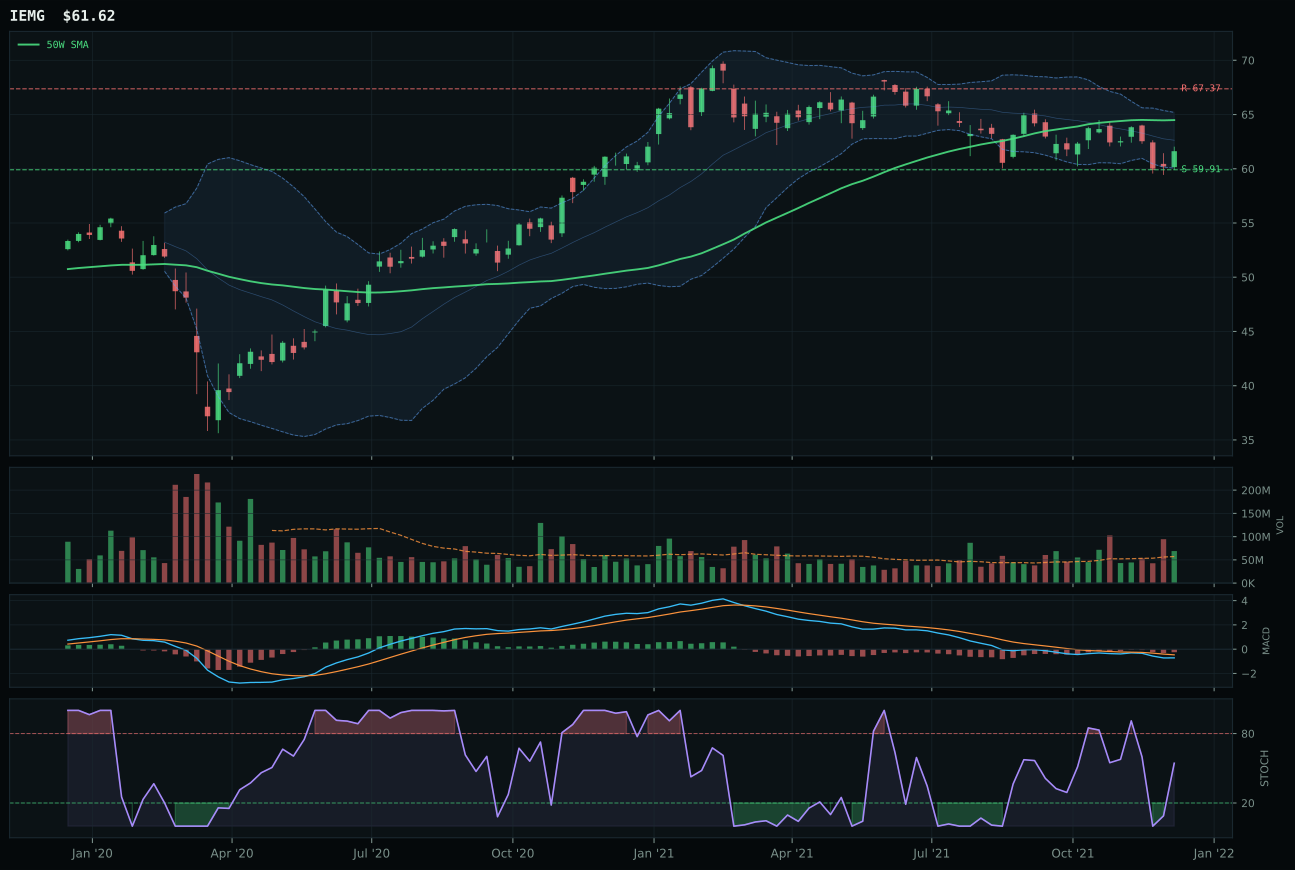
IEMG has a pullback into support profile with -9.7% 13-week relative strength versus SPY.
A failed hold above support would weaken the setup.
Actionable but governed by invalidation levels.
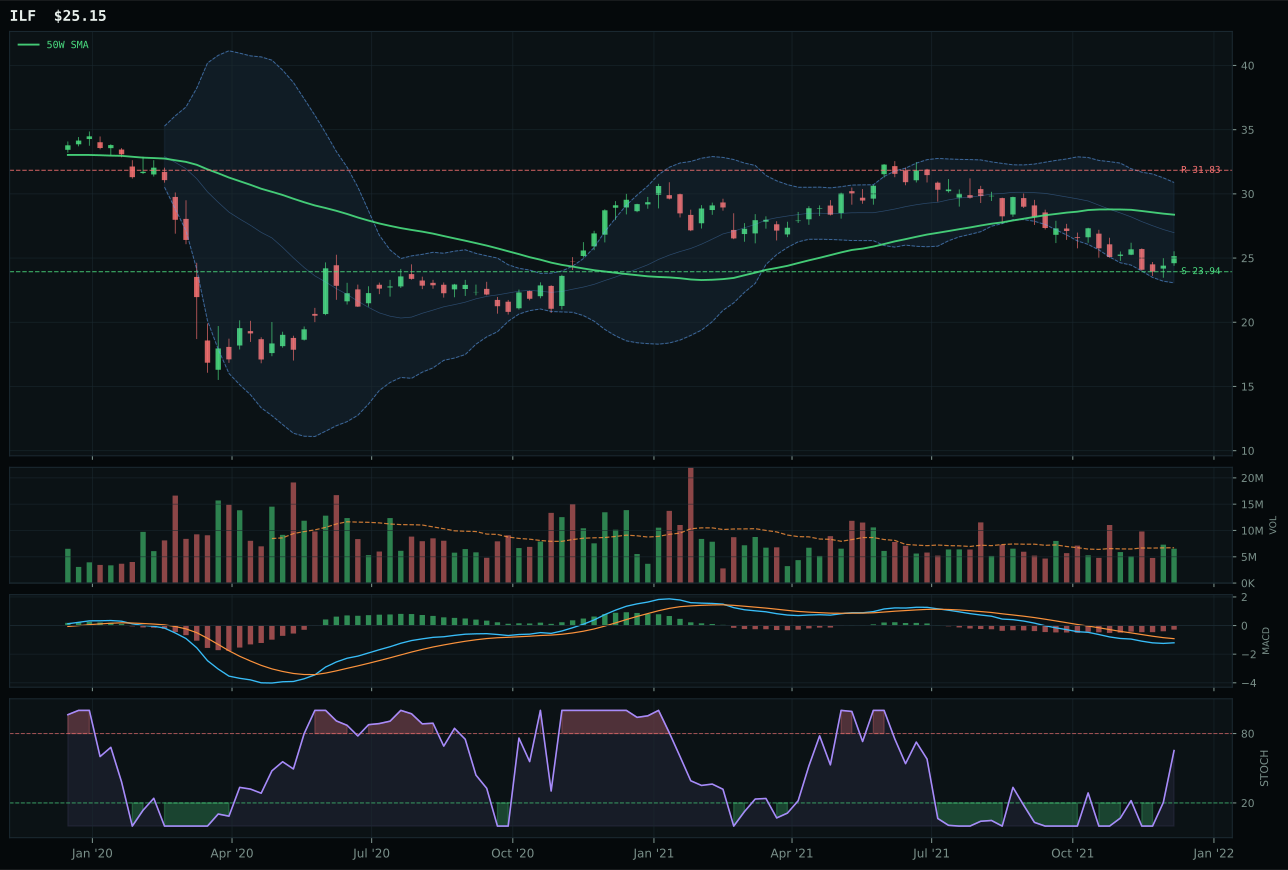
ILF has a neutral structure profile with -16.5% 13-week relative strength versus SPY.
Extension and support failure are the main tactical risks.
Tracked, but not top-2 eligible because: structurally broken.
INDA edges IEMG by six-point-one points to win a category whose absolute scores rank among the portfolio's lowest, surviving on a stochastic RSI that sits oversold turn-up at 0.20 versus IEMG's falling neutral positioning. Both charts rest near their 50-week moving averages in upper-retracement momentum zones with neutral volume and bearish/weakening MACD conditions, but INDA's stochastic RSI configuration offers potential mean-reversion conviction if institutional demand materializes. The thirteen-week return of negative one-point-six percent and category-relative strength of positive two-point-four percent barely exceed breakeven, yet both represent the best available within a category where all three names show serious momentum deterioration. IEMG suffers from deeper twelve-week underperformance at negative four point zero percent and nine-point-seven percent SPY-relative weakness paired with pullback-into-support structure that suggests potential for further decline if support breaks. This is a category of losers selecting a relative winner, not a conviction play.
Emerging Markets receives zero percent allocation this week, ranking ninth or tenth among categories, with a category score of just 6.5 and macro fit of 25.0 that reflects severe headwinds outweighing any potential opportunities. The portfolio's macro regime features -14 dollar pressure, -10 credit stress, and -9 broad market bear positioning—precisely the conditions that kill emerging market flows and create carry unwind pressure. INDA's technical evidence of 38.7 cannot overcome this macro damage, and momentum confirmation of 22.9 reveals minimal institutional participation that would signal real dip-buying conviction. The -7.2 percent SPY-relative weakness even in the winner demonstrates systemic underperformance likely to persist if dollar strength continues and credit concerns deepen. For emerging markets to reclaim allocation, at least two of the three major headwinds would need to reverse: dollar pressure would need to ease through Fed pivot, credit stress would need to improve visibly, or broad market bear positioning would need to shift toward risk appetite. Until that macro shift occurs, emerging markets remain appropriately excluded from allocation despite reasonable valuations—the technical damage is too severe and the macro regime too hostile to justify even minimum positioning, making room for stronger setups in energy, utilities, and commodities.