
2021-12-03
Informational purposes only. The content in this report, including allocations, analysis, and commentary, is provided solely for informational and educational purposes. It does not constitute financial advice, investment advice, trading advice, or any other type of advice. Past performance does not guarantee future results. Always conduct your own research and consult a qualified financial professional before making investment decisions.
Weekly Allocation
| Ticker | Category | Weight | Role |
|---|---|---|---|
| FSOL | 50% | Overlay | |
| XLE | Traditional Energy | 10% | Top-2 (10%) |
| PICK | Industrial Metals | 10% | Top-2 (10%) |
| XLU | Utilities & Infrastructure | 5% | Tier-2 (5%) |
| XLK | Technology | 5% | Tier-2 (5%) |
| SMH | AI | 5% | Tier-2 (5%) |
| GLD | Precious Metals | 5% | Tier-2 (5%) |
| URA | Nuclear Energy | 5% | Tier-2 (5%) |
| MOO | Agriculture & Livestock | 5% | Tier-2 (5%) |
Trade Instructions — Monday Open
Sell the tranche from 2021-11-05 (completing its 4-week hold). Buy the new tranche. Instructions show net portfolio changes — same-asset positions cancel, weight changes show the delta.
| Action | Ticker | Instruction |
|---|---|---|
| SELL | URNM | Sell 40% of URNM position (reduce 6.25% → 3.75%) |
| SELL | CIBR | Sell entire CIBR position (1.25% of portfolio) |
| SELL | PAVE | Sell 25% of PAVE position (reduce 5.00% → 3.75%) |
| SELL | REMX | Sell entire REMX position (1.25% of portfolio) |
| SELL | XAR | Sell entire XAR position (1.25% of portfolio) |
| BUY | XLK | Buy XLK — 16.67% of freed cash (adds 1.25% to portfolio) |
| BUY | MOO | Buy MOO — 16.67% of freed cash (adds 1.25% to portfolio) |
| BUY | URA | Buy URA — 16.67% of freed cash (adds 1.25% to portfolio) |
| BUY | PICK | Buy PICK — 33.33% of freed cash (adds 2.50% to portfolio) |
| BUY | XLU | Buy XLU — 16.67% of freed cash (adds 1.25% to portfolio) |
Current Portfolio After Trade
Combined holdings across all 4 active tranches. Each tranche is 25% of the portfolio.
| Ticker | % of Portfolio | Weight Bar |
|---|---|---|
| FSOL | 50.00% | |
| XLE | 10.00% | |
| GLD | 6.25% | |
| XLK | 6.25% | |
| SMH | 5.00% | |
| MOO | 5.00% | |
| PAVE | 3.75% | |
| COPX | 3.75% | |
| URNM | 3.75% | |
| URA | 2.50% | |
| PICK | 2.50% | |
| XLU | 1.25% |
Macro Regime — Risk-On Liquidity Expansion
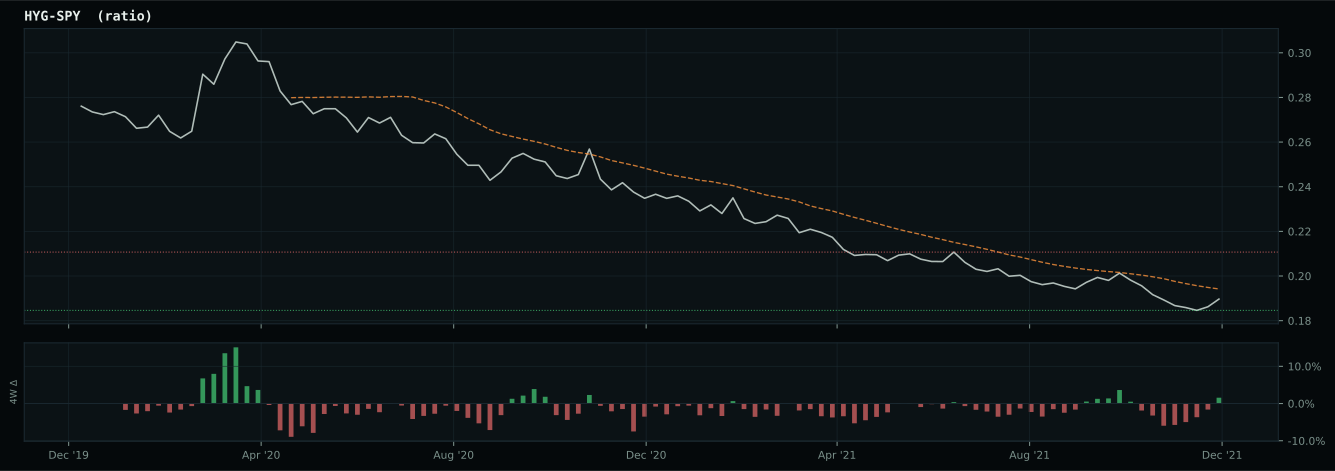
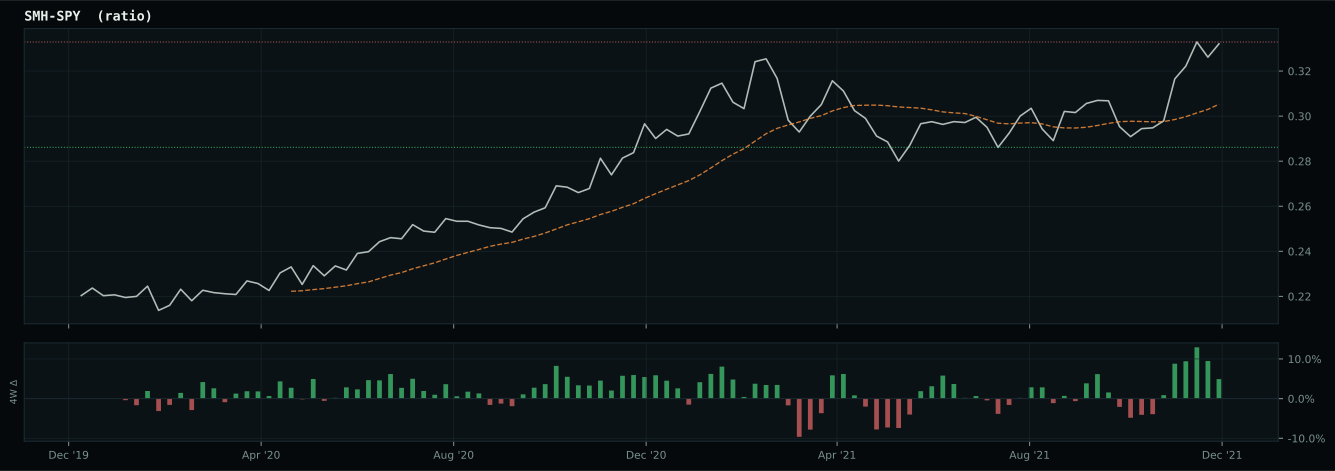
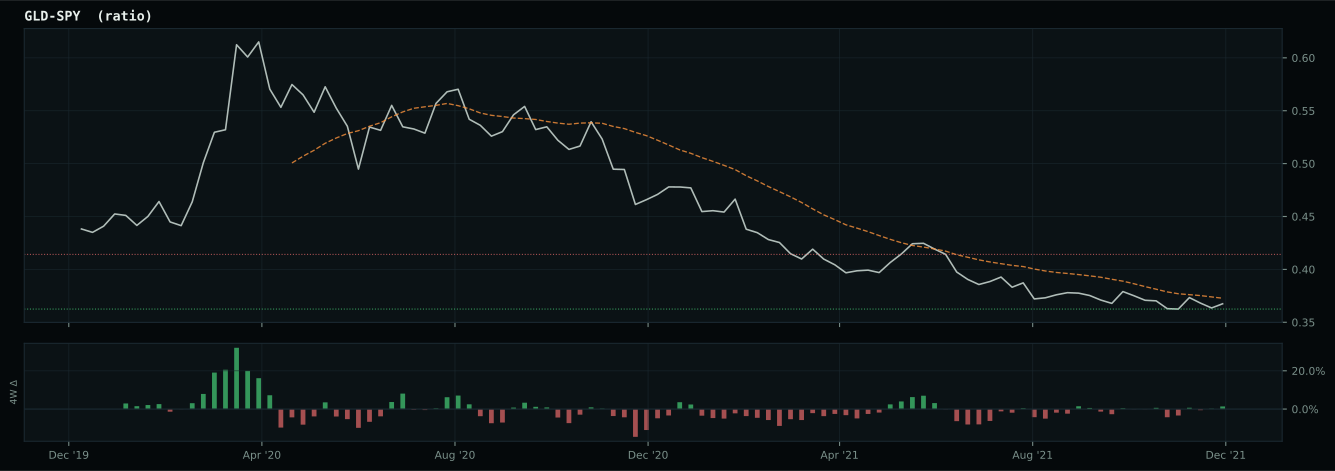
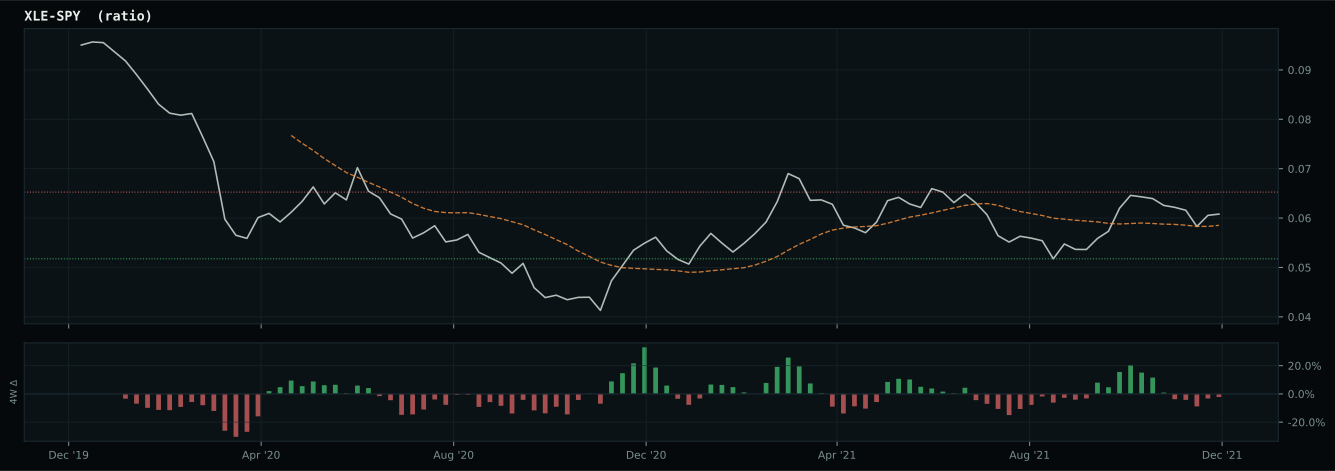
Macro Evidence Charts
Market-implied signals behind the macro regime scores. Each ratio compares two assets; the direction and slope of the ratio is what the macro engine reads.
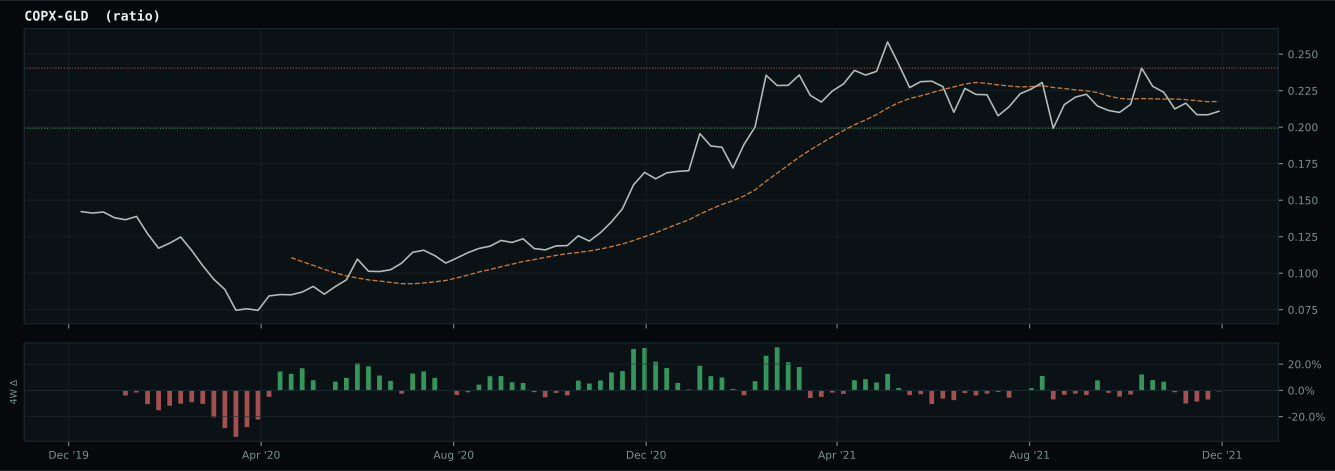
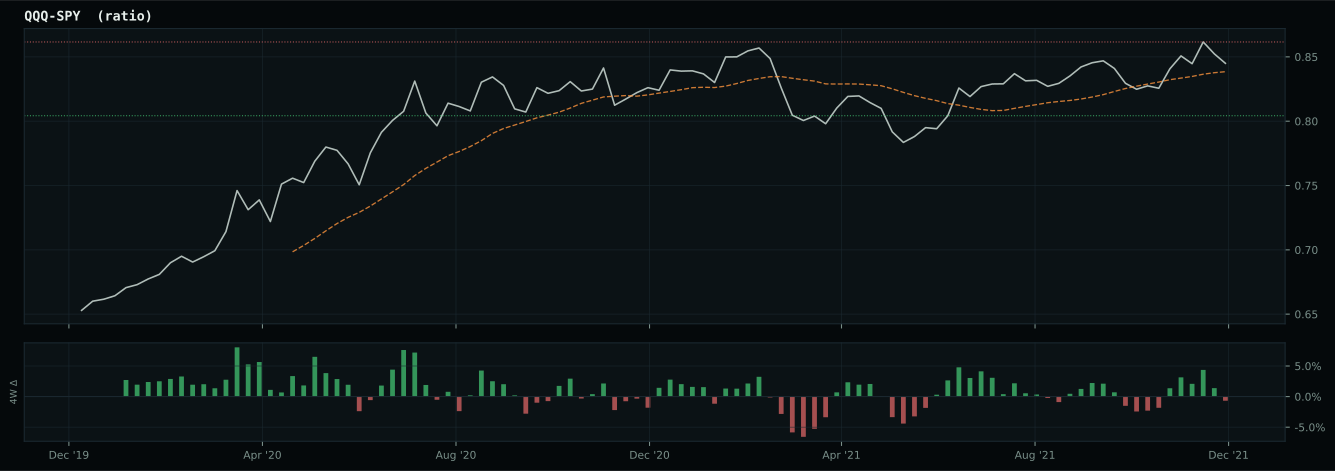
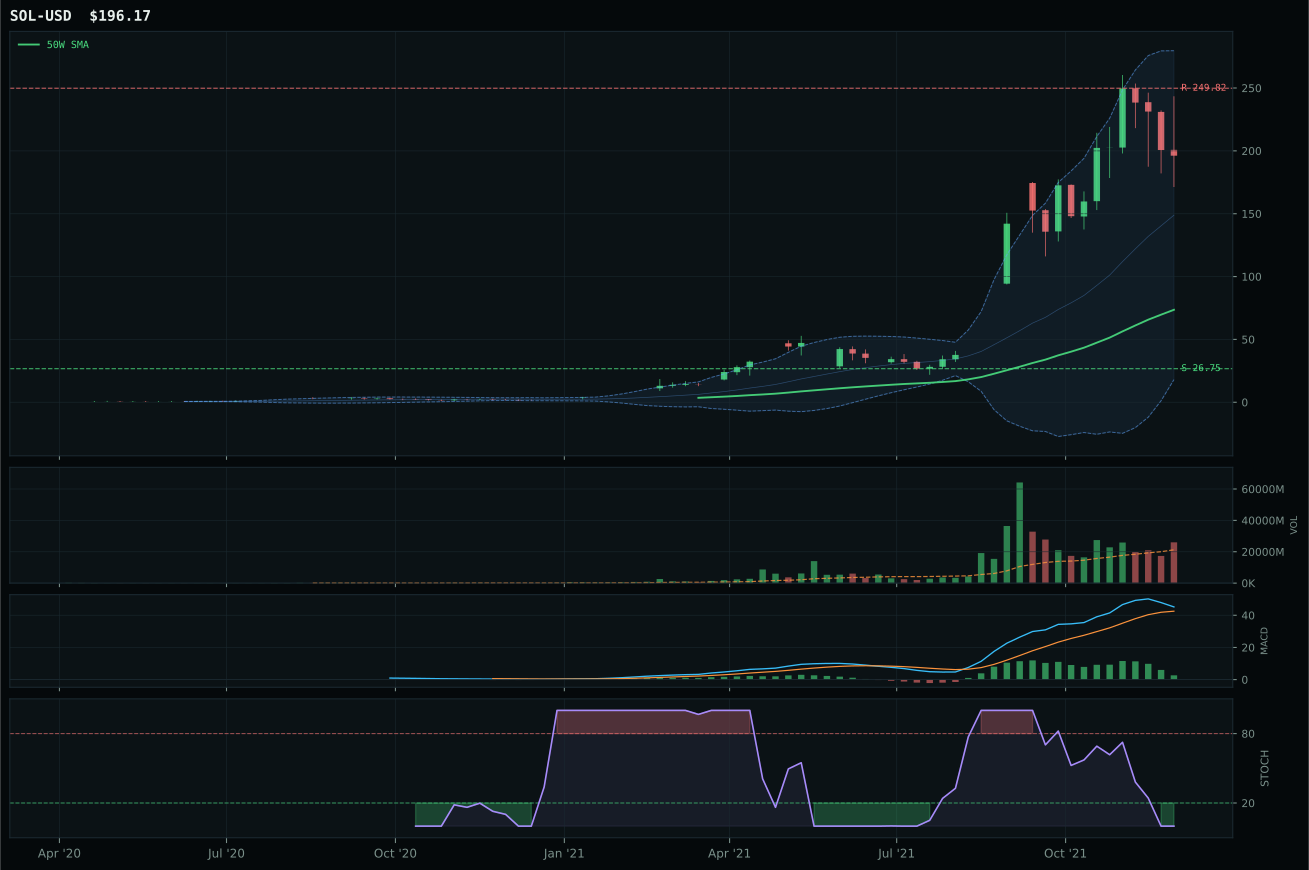
Crypto Regime — AltSeason
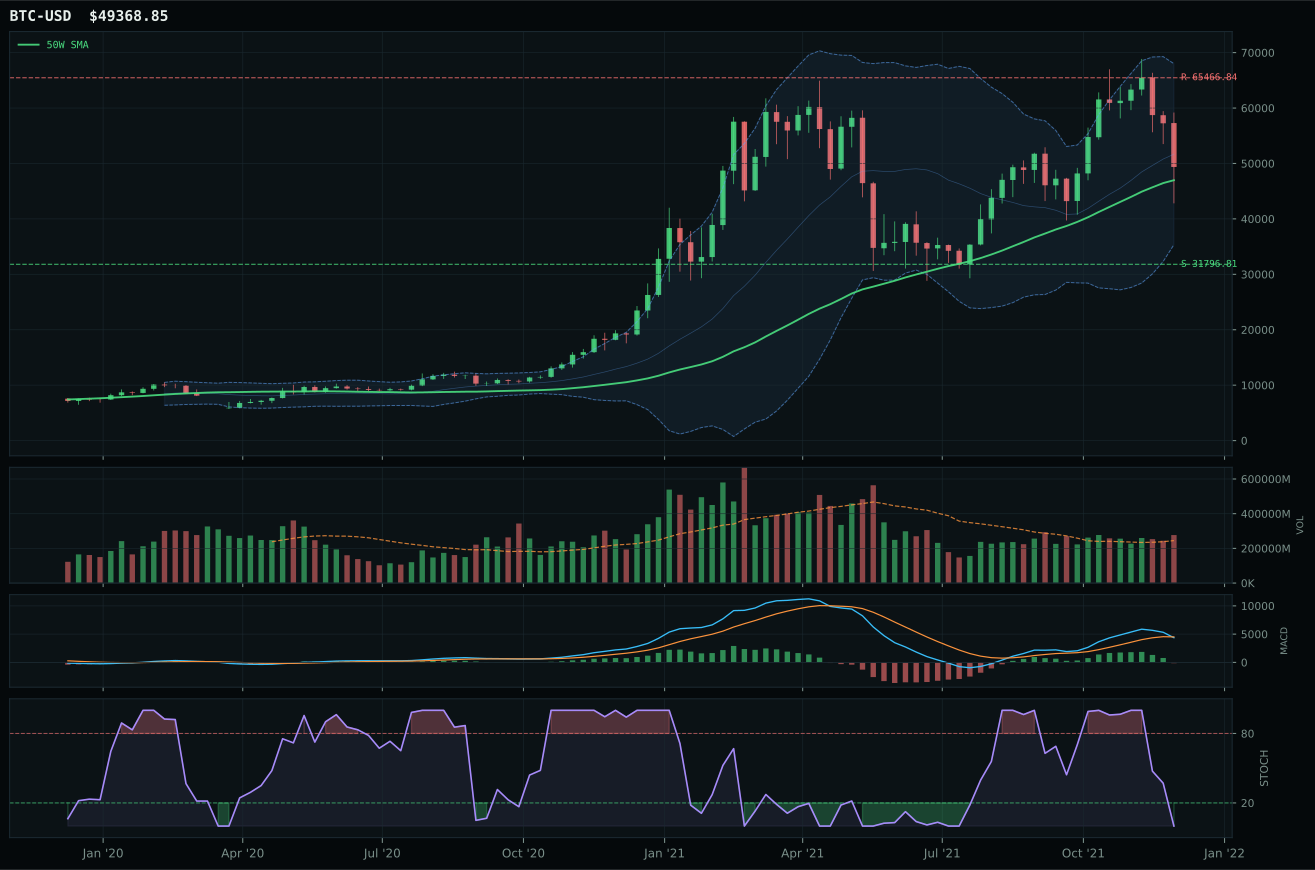
ValueBTC not armed: BTC has not made the first post-breakdown touch of the 200W buy zone after losing the 50W
TrendBTC confirmed: 2 consecutive closes above rising/flat 50W SMA
all available AltSeason conditions pass; missing optional confirmations skipped
Category Rankings
| Rank | Category | Winner | Score | Alloc | 4W Ret | Peers (4W) |
|---|---|---|---|---|---|---|
| 1 | Traditional Energy | XLE | 61.2 | 20% | -0.73% | FCG +1.2% · XOP -0.5% |
| 2 | Industrial Metals | PICK | 46.2 | 20% | +3.53% | COPX +4.1% · REMX -1.7% |
| 3 | Utilities & Infrastructure | XLU | 46.2 | 10% | +5.47% | PAVE +3.8% · IGF +4.0% |
| 4 | Technology | XLK | 45.8 | 10% | +5.13% | CIBR +6.4% · IGV +2.1% |
| 5 | AI | SMH | 45.6 | 10% | +3.92% | AIQ +3.3% · BOTZ +1.9% |
| 6 | Precious Metals | GLD | 45.0 | 10% | +1.64% | GDX +2.8% · SLV +2.4% |
| 7 | Nuclear Energy | URA | 39.6 | 10% | +0.64% | NLR +1.8% · URNM -1.7% |
| 8 | Agriculture & Livestock | MOO | 35.0 | 10% | +3.98% | WEAT -3.4% · VEGI +4.2% |
| 9 | Emerging Markets | INDA | 26.4 | 0% | -1.02% | IEMG -0.0% · ILF -5.3% |
| 10 | Defense & Aerospace | ITA | 20.5 | 0% | +4.05% | ROKT +2.3% · XAR +4.0% |
Traditional Energy — XLE
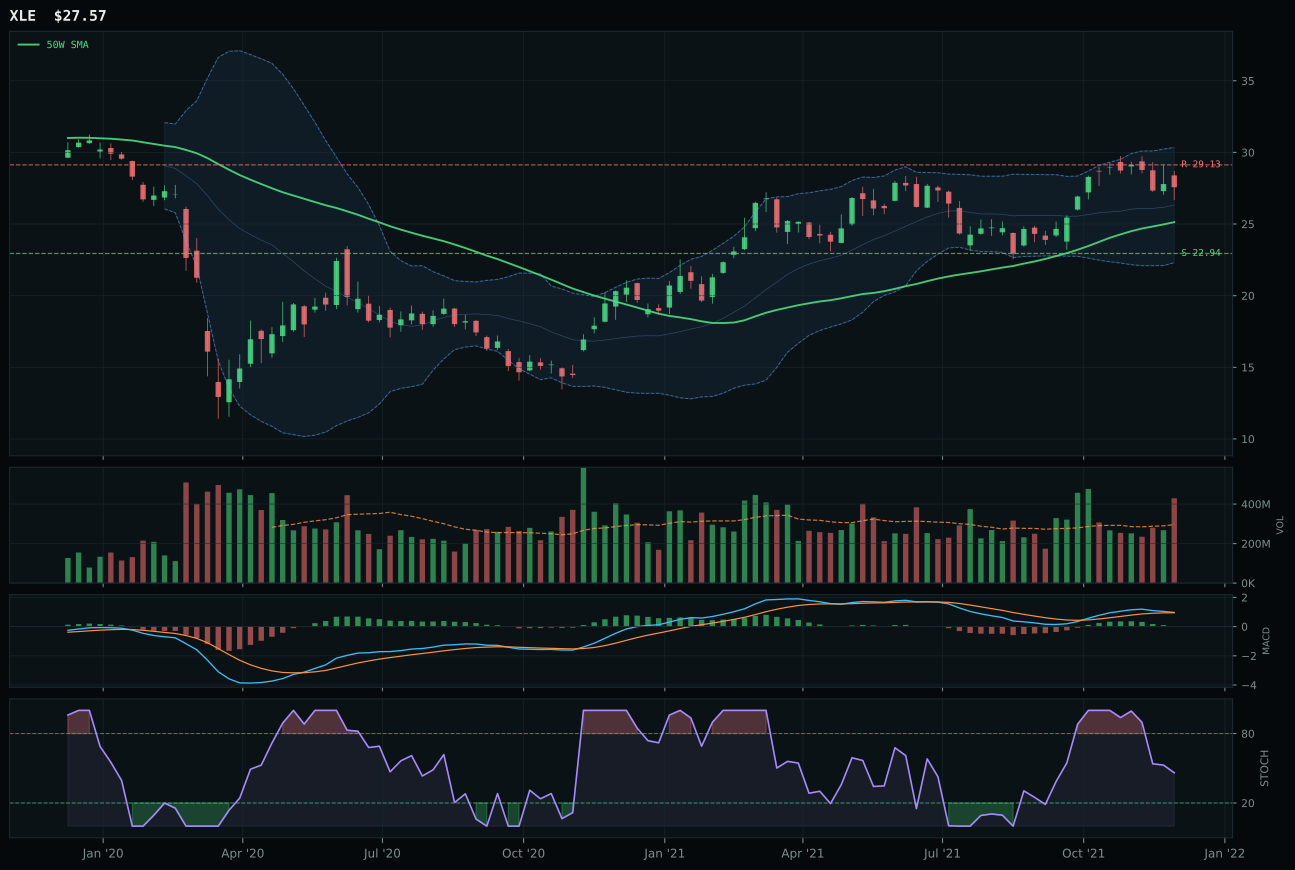
XLE has a neutral structure profile with 13.3% 13-week relative strength versus SPY.
A failed hold above support would weaken the setup.
Actionable but governed by invalidation levels.
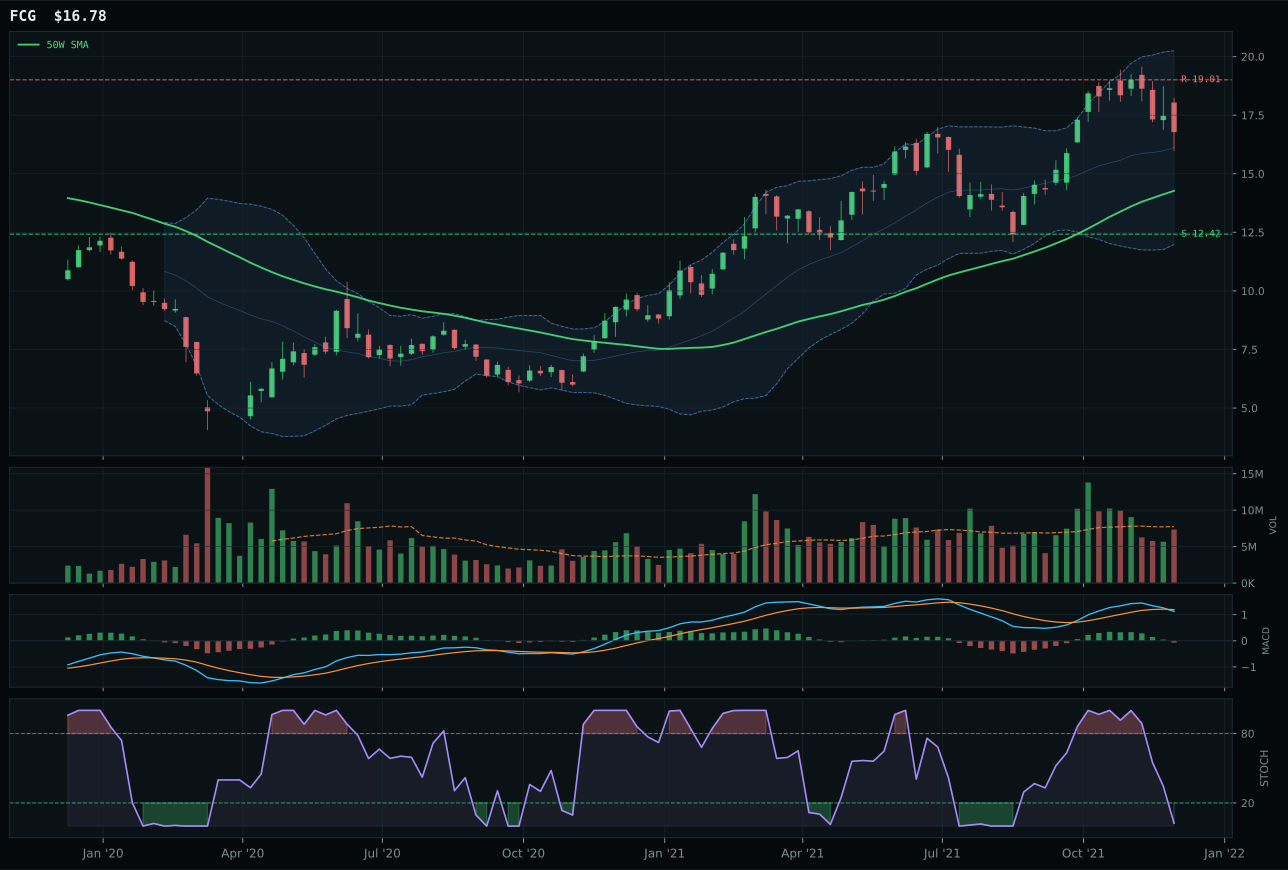
FCG has a vertical extension profile with 15.4% 13-week relative strength versus SPY.
A failed hold above support would weaken the setup.
Actionable but governed by invalidation levels.
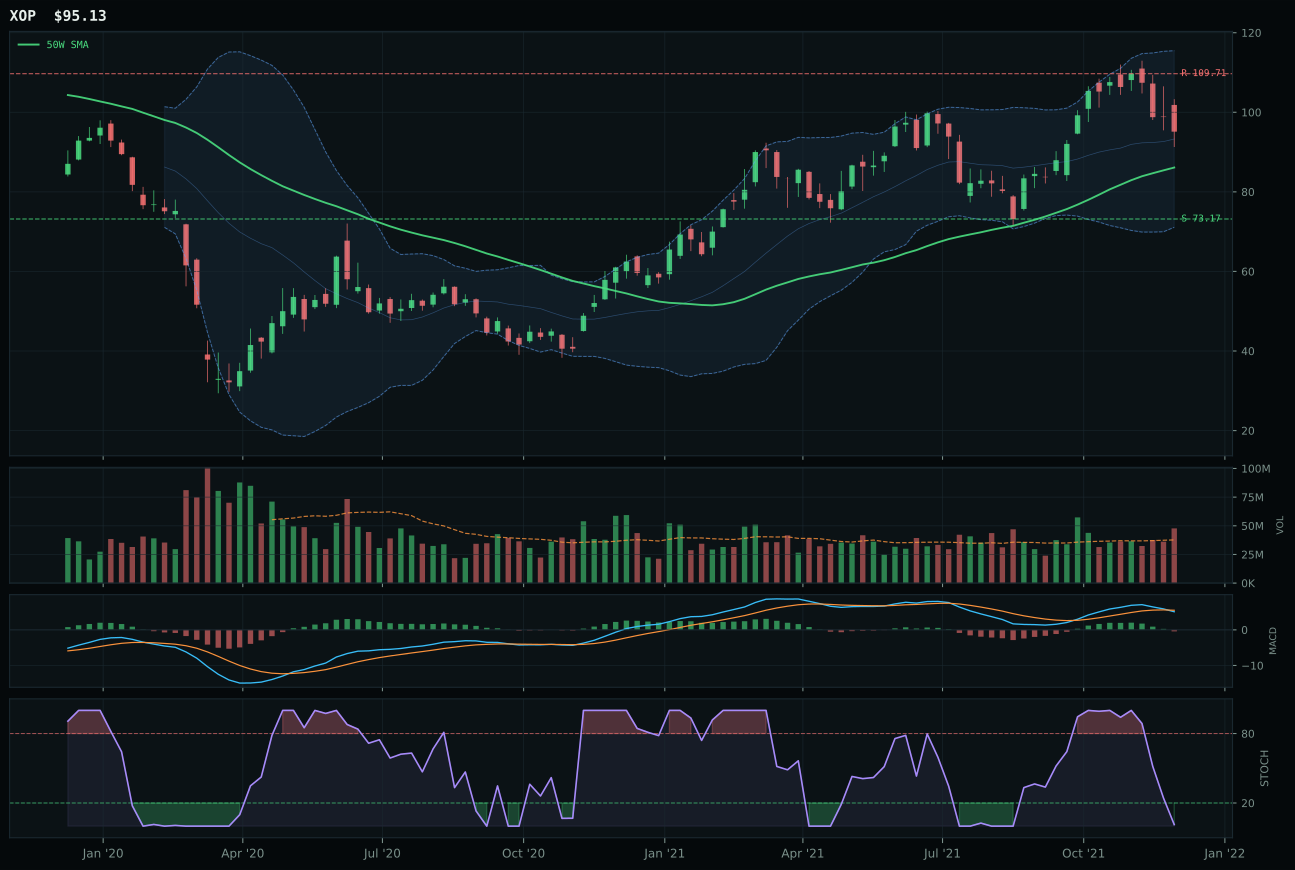
XOP has a neutral structure profile with 12.5% 13-week relative strength versus SPY.
A failed hold above support would weaken the setup.
Actionable but governed by invalidation levels.
XLE dominated the category with 75.4 in the reasoned proof order, earning the top-2 slot through a combination of strong SPY-relative momentum (+13.3% RS), clean neutral structure, and the exact macro alignment that defines this week's regime. Price is above the 50W at a moderate 9.7% extension with MACD bullish but flattening (not improving, but not weakening either) and stochastic RSI falling into neutral—this is a measured advance, not a panic rally. FCG lost on timing (48.0 vs 70.0), risk-reward (36.0 vs 49.8), and most critically on MACD deterioration (bearish/weakening versus bullish but flattening); FCG's vertical extension at 17.6% from the 50W also creates entry execution risk where XLE at 9.7% sits in the optimal entry zone. Volume at 1.45x participation confirms the move without distribution pressure, meaning new buyers are stepping in methodically.
Traditional Energy earned top-2 rank at 61.2 composite and 10% core allocation because energy scarcity (+16), inflation pressure (+10), supply shortage (+9), and real asset sponsorship (+7) form the single strongest macro narrative in the entire portfolio this week. Category-level macro fit is 85/100—the highest bar cleared among all ten categories—and XLE's technical evidence (71/100) is strong enough to confirm that capital is flowing toward the trade, not just rotating within a shrinking pool. The allocation reflects conviction that oil-price support is genuine and energy equity valuations are pricing in recession scenarios that have grown less likely in a liquidity expansion regime. XLE's combination of neutral chart setup and exceptional macro fit makes it portfolio core; the 10% slot reflects the category's rank alongside PICK as the two highest-conviction macro narratives available this week. This is not momentum chasing; it is capital allocation to the regime's most potent structural tailwind.
Industrial Metals — PICK
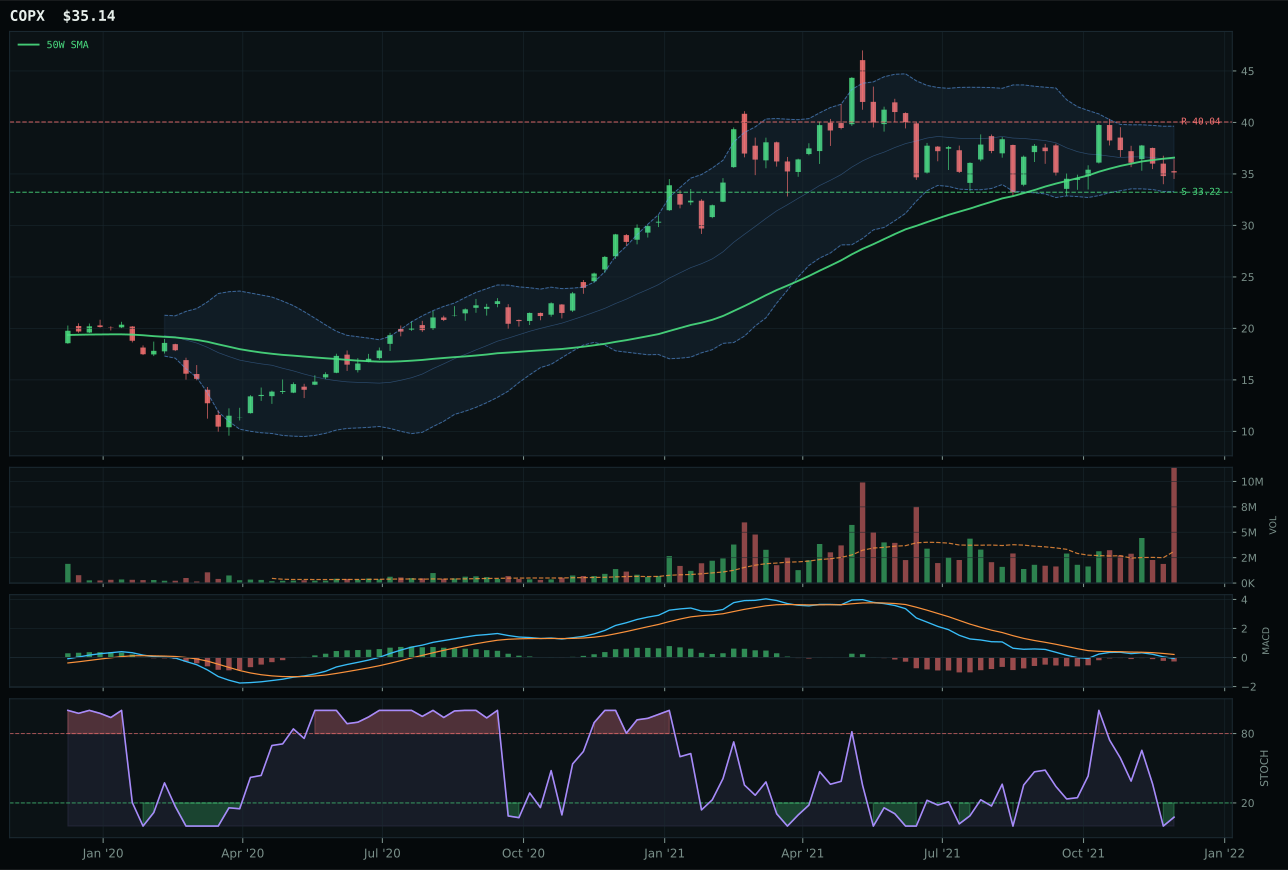
COPX has a neutral structure profile with -6.9% 13-week relative strength versus SPY.
A failed hold above support would weaken the setup.
Actionable but governed by invalidation levels.
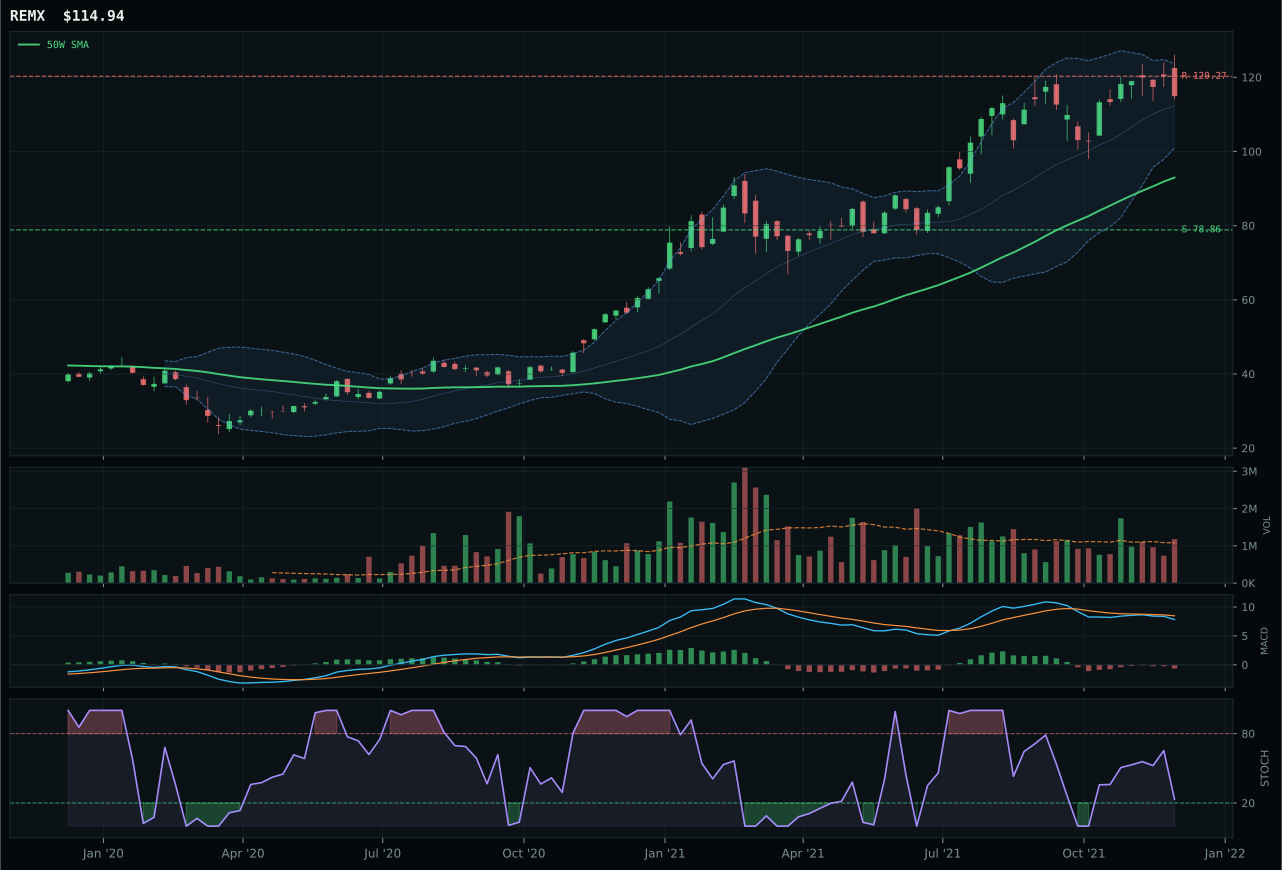
REMX has a vertical extension profile with 0.7% 13-week relative strength versus SPY.
A failed hold above support would weaken the setup.
Actionable but governed by invalidation levels.
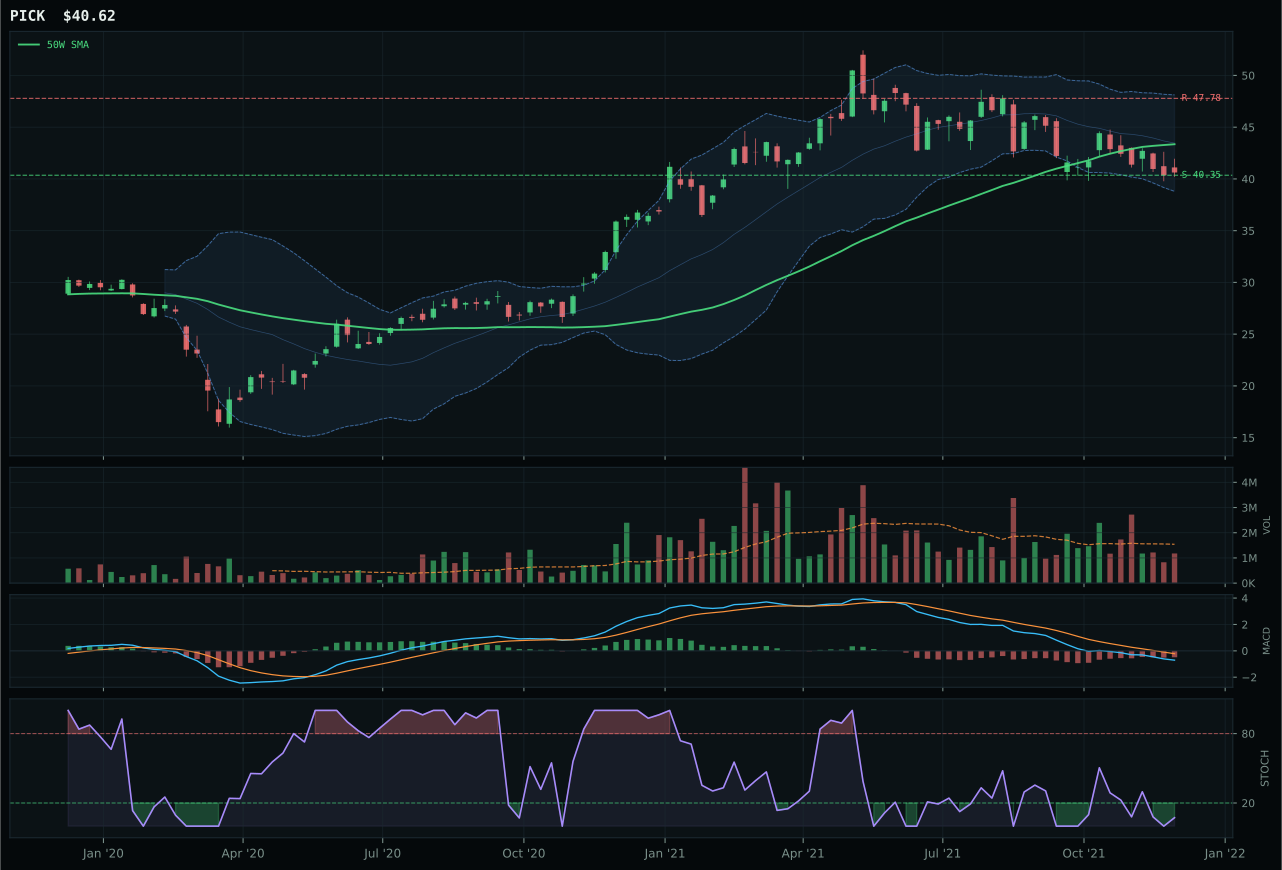
PICK has a pullback into support profile with -11.9% 13-week relative strength versus SPY.
A failed hold above support would weaken the setup.
Actionable but governed by invalidation levels.
PICK earned top-2 status by delivering the best risk-reward setup in its category despite carrying the weakest absolute momentum scores. Price is 6.3% below the 50W but still above the 200W, sitting in the deep retracement value zone at Fib 0.618 with stochastic RSI at extreme oversold (0.07) and MACD bearish but improving—that last phrase is the key difference from COPX, whose MACD is bearish and weakening. PICK offers 98.0 risk-reward (identical to COPX's 96.1) but wins on timing (92.0 vs likely lower for COPX's neutral structure setup) and the clean pullback-into-support geometry at 40.35 with 0.7% downside buffer and 15.0% upside to resistance. The category-relative strength lag (-5.0%) is a warning, but in deep value mean-reversion setups, that weakness often marks the inflection point where contrarian accumulation begins.
Industrial Metals earned top-2 rank at 46.2 composite, securing 10% core allocation alongside XLE because the macro descriptors (metals scarcity +14, commodity breadth positive +10, real asset sponsorship +6) align perfectly with the inflation-pressure and supply-shortage regime narrative. PICK's technical evidence scores only 28.3/100, meaning this is a macro conviction trade, not a chart-led momentum entry—exactly the thesis that deserves core portfolio weight when the macro setup is this strong. The category-level macro fit at 66/100 is robust enough to justify allocation despite real technical weakness and persistently negative momentum. The downside to support at 0.7% creates defined risk that portfolio managers can monitor and act upon without guessing; the upside to resistance at -15.0% reflects the starting point after a severe correction, making this precisely the type of deep value plus macro support situation that generates outsized returns. Industrial metals earn their 10% slot as a core convection on real-asset scarcity in an inflationary regime.
Utilities & Infrastructure — XLU
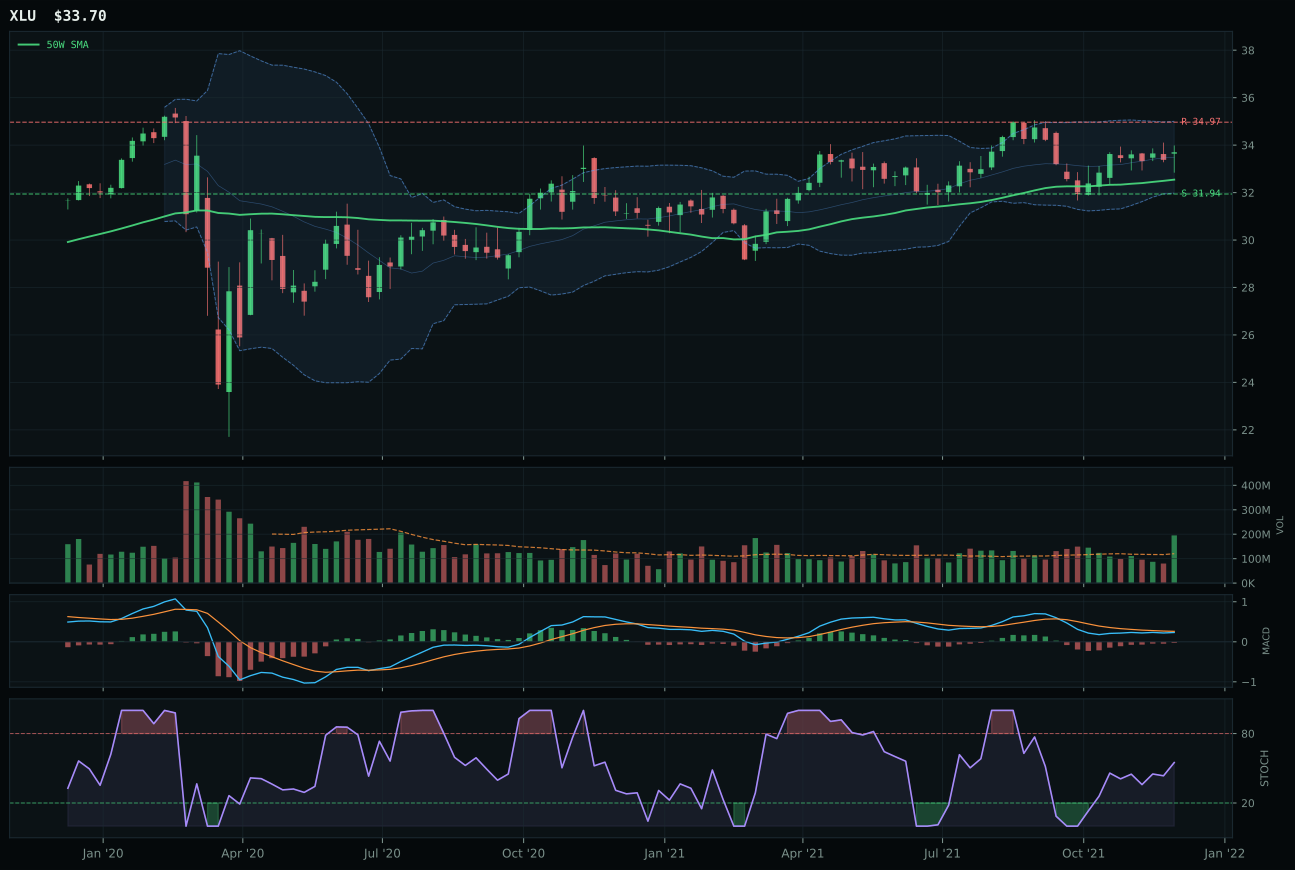
XLU has a neutral structure profile with -3.1% 13-week relative strength versus SPY.
A failed hold above support would weaken the setup.
Actionable but governed by invalidation levels.
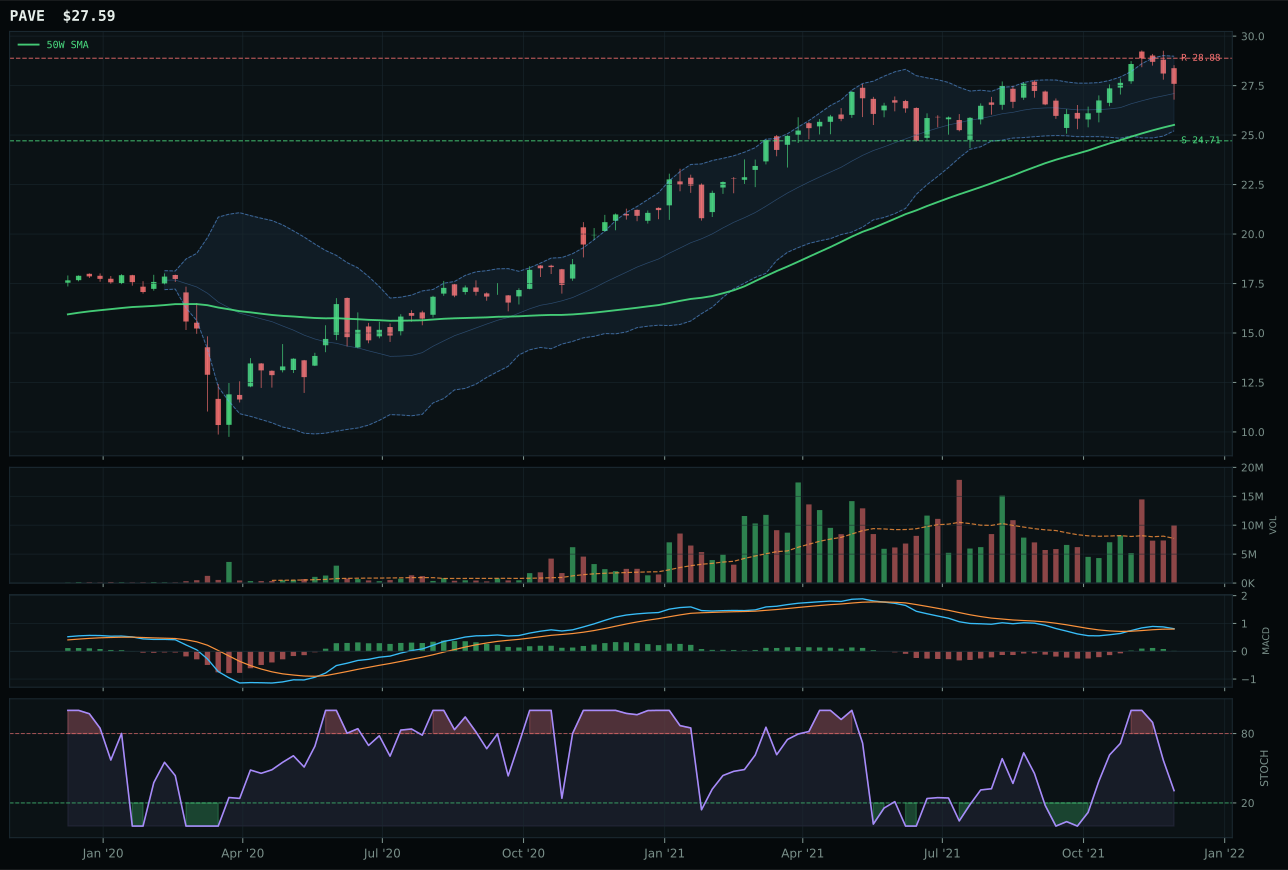
PAVE has a neutral structure profile with 1.2% 13-week relative strength versus SPY.
A failed hold above support would weaken the setup.
Actionable but governed by invalidation levels.
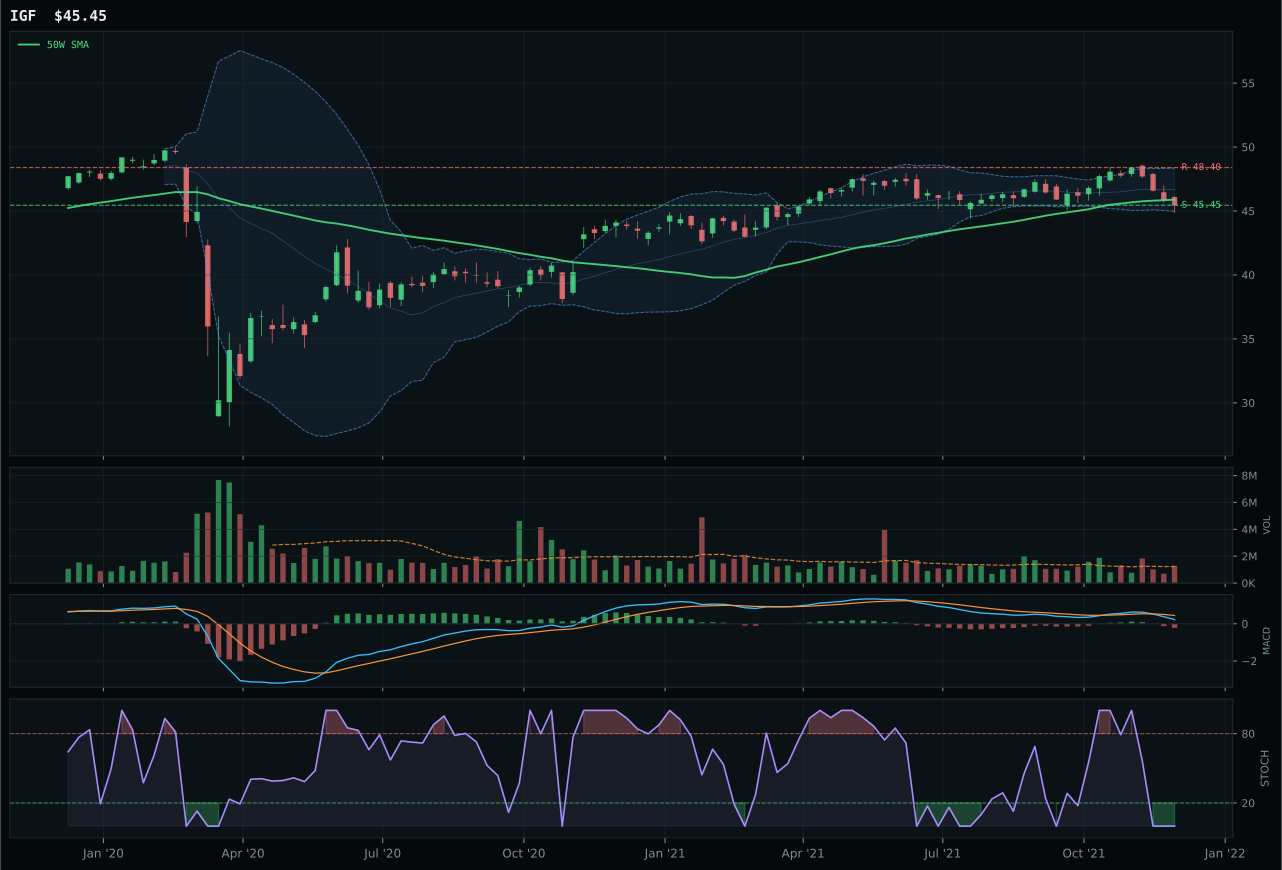
IGF has a pullback into support profile with -3.9% 13-week relative strength versus SPY.
A failed hold above support would weaken the setup.
Actionable but governed by invalidation levels.
XLU defeated PAVE in an extremely tight race (separated by just 1.2 points in the category score) by assembling a superior timing score (98.0 versus 70.0) that reflected proximity to the 50W at just 3.5% above current levels while maintaining clean support structure at 31.94. MACD is bearish but improving—not yet bullish—with stochastic RSI rising into the mid-zone at 0.55, a gentler momentum signature than PAVE's bullish but flattening MACD with falling stochastic RSI. XLU's risk-reward is modestly better (61.8 versus 51.9), but the real separation came from volume confirmation: XLU shows 1.62x accumulation/confirmation while PAVE exhibits above-average participation without accumulation intensity. Both are defensive positions; XLU simply has fresher technical positioning to initiate or add to the utility allocation.
Utilities & Infrastructure earned 5% allocation as a defensive real-asset trade despite ranking outside the top-two categories at 46.2 composite score. Category-level macro fit sits at 50/100, near the middle of the range, because the sector is being pulled in competing directions: inflation pressure (-6) and risk appetite positive (-2) work against utilities, while commodity breadth positive (+4) and liquidity expansion provide minor support. XLU's 88.4/100 trend score and 82.7/100 technical evidence are genuine, reflecting the strongest ETF-level fundamentals in this category, yet the macro environment is not tailwind-driven. The 5% allocation reflects portfolio need for defensive real-asset exposure in an extended equity market; utilities and infrastructure are counter-cyclical holdings that will become 10%+ positions if credit stress rises or equity volatility spikes. For now, XLU provides quality income and recession hedging at an attractive entry point without betting the portfolio that the macro cycle has fundamentally shifted.
Technology — XLK
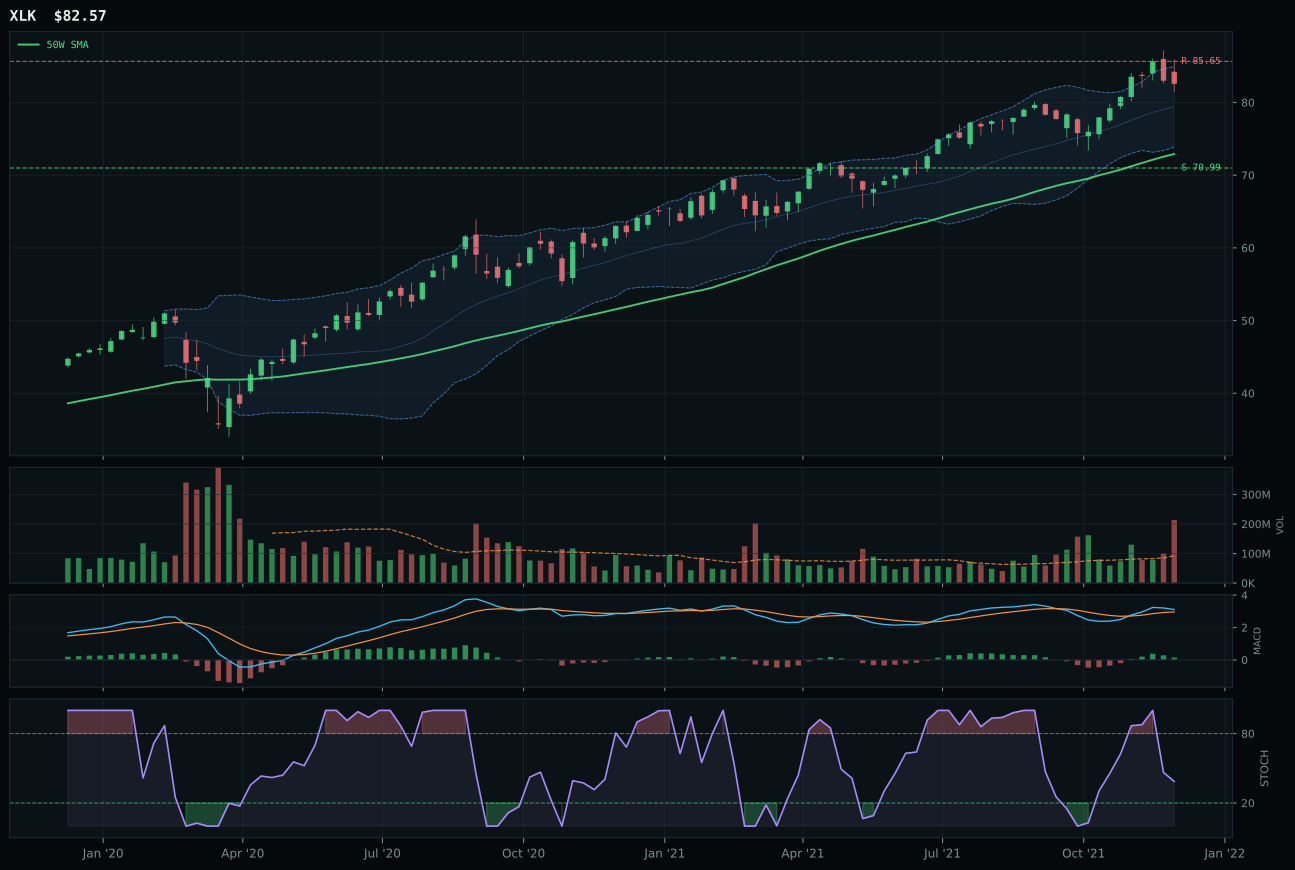
XLK has a neutral structure profile with 3.5% 13-week relative strength versus SPY.
A failed hold above support would weaken the setup.
Actionable but governed by invalidation levels.
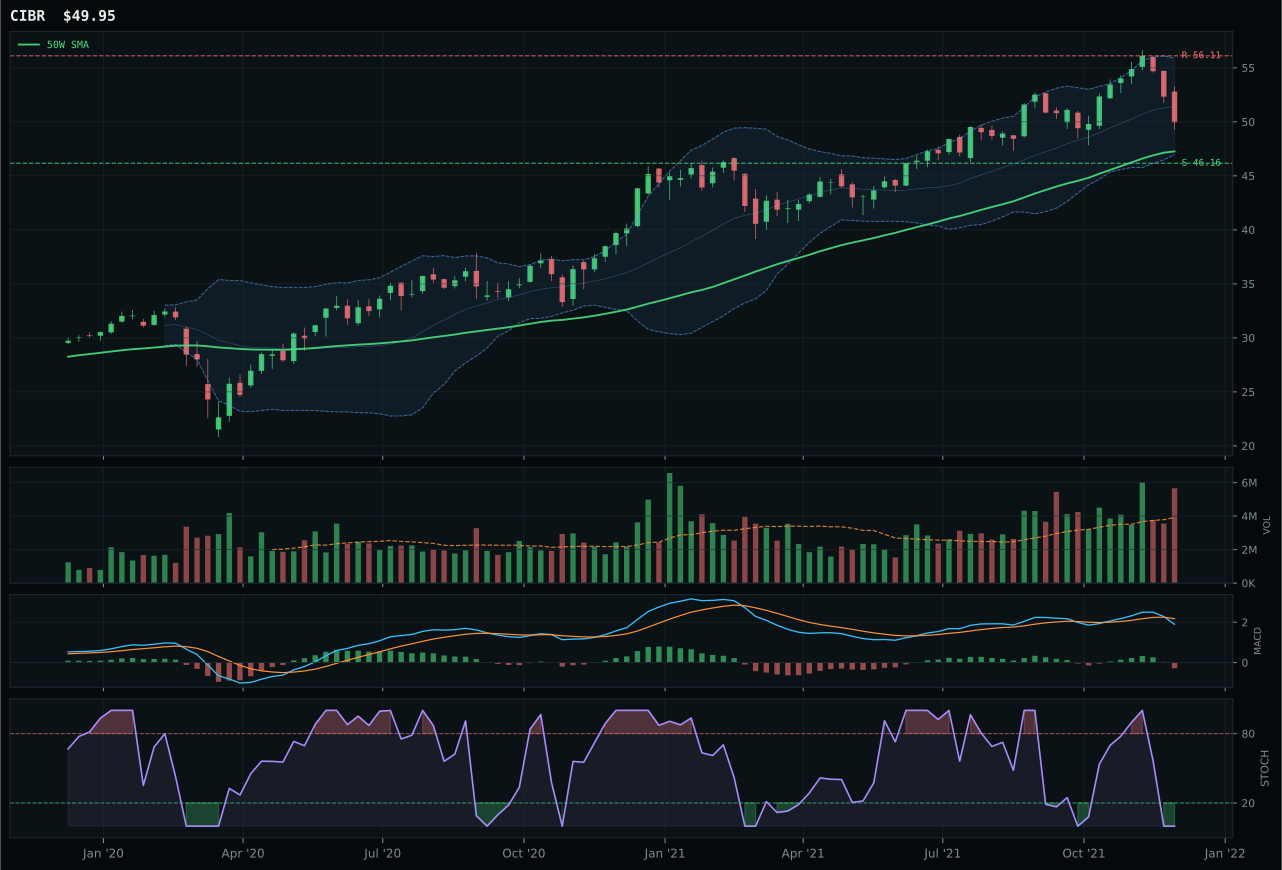
CIBR has a neutral structure profile with -5.0% 13-week relative strength versus SPY.
A failed hold above support would weaken the setup.
Actionable but governed by invalidation levels.
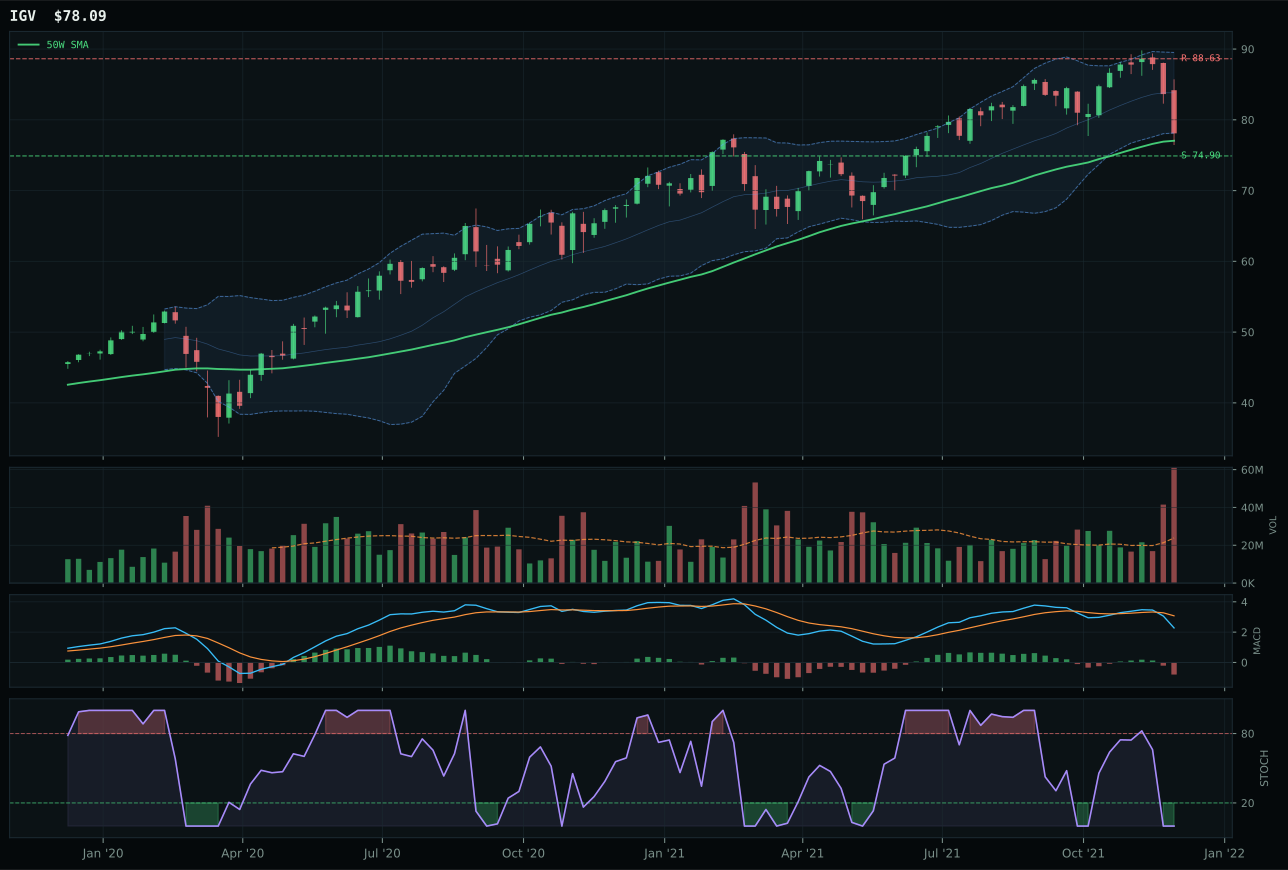
IGV has a pullback into support profile with -8.9% 13-week relative strength versus SPY.
A failed hold above support would weaken the setup.
Actionable but governed by invalidation levels.
XLK claimed the category by holding above both the 50-week and 200-week moving averages with a stable 0.5% slope, establishing clean trend structure that its peers lacked. The 8.5% relative strength advantage over the category median and 3.5% outperformance versus SPY tell you that institutional capital is rotating into broad profitable tech names rather than cybersecurity specialists. CIBR lost the decision on timing alone—its MACD was bearish and weakening while XLK's was bullish and improving, and that momentum divergence matters when volume is distributing at 2.30x the 20-day average. The chart sits 13.2% above the 50W with stochastic RSI falling into neutral territory, a textbook setup for a quiet accumulation phase where new buyers are neither panicked nor chasing extended moves.
Technology earned 5% allocation because it ranked outside the top two eligible categories this week, despite solid absolute technicals on its representative. The category's 45.8 composite score reflects a tension between strong trend structure (100/100 on price above both key moving averages) and weak momentum confirmation (57/100 on volume-price sponsorship), meaning XLK is climbing on its own merit rather than fresh institutional money. In the Risk-On Liquidity Expansion regime, Technology benefits from ai growth sponsorship (+6) and risk appetite tailwinds (+9), but those supports are softer than the real asset and energy scarcity signals dominating the top-two allocation. XLE and PICK both scored above 46 and represent more attractive asymmetry given their pullback-into-support setups with defined invalidation points; Technology's 5% slot preserves exposure to the broadest growth narrative without betting the portfolio that multiple compression has ended.
AI — SMH
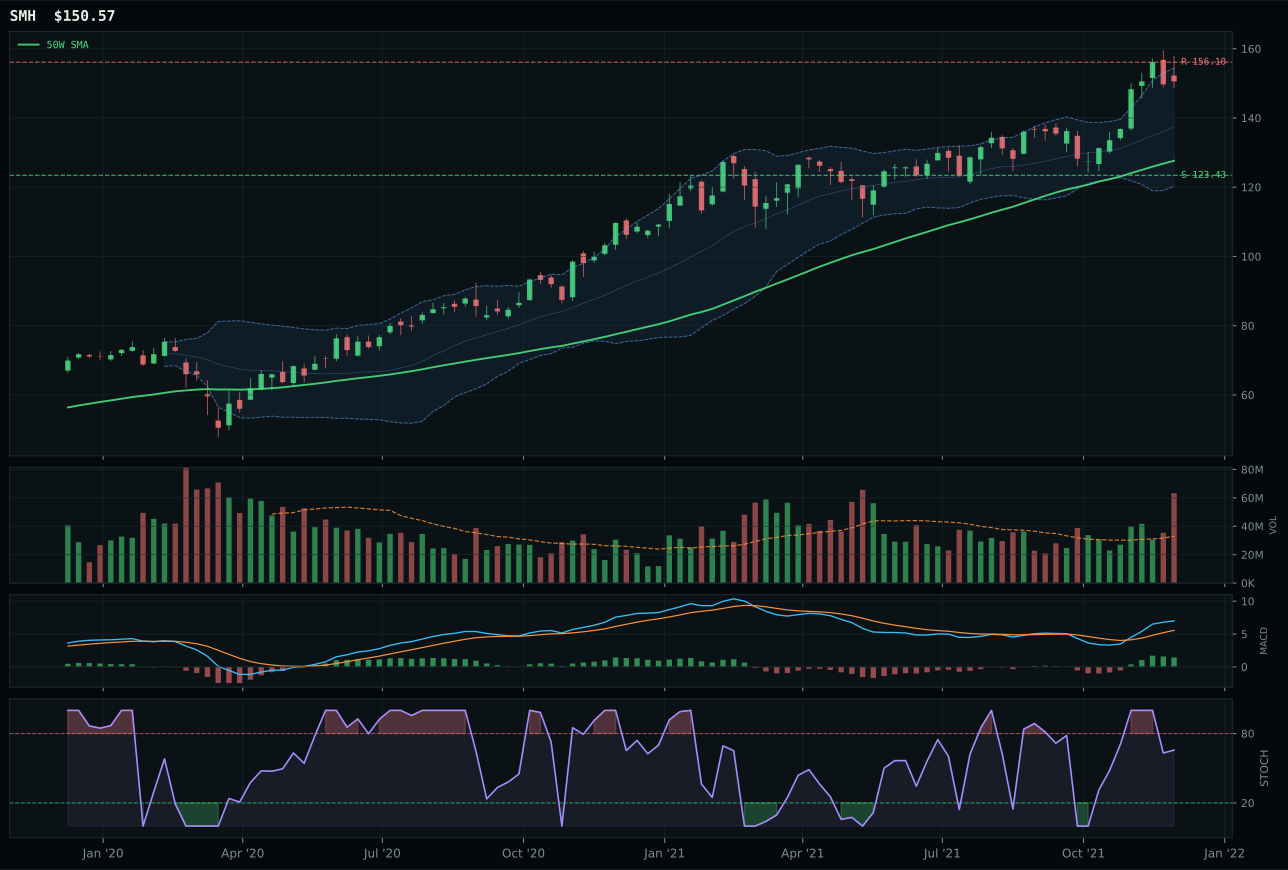
SMH has a vertical extension profile with 10.1% 13-week relative strength versus SPY.
A failed hold above support would weaken the setup.
Actionable but governed by invalidation levels.
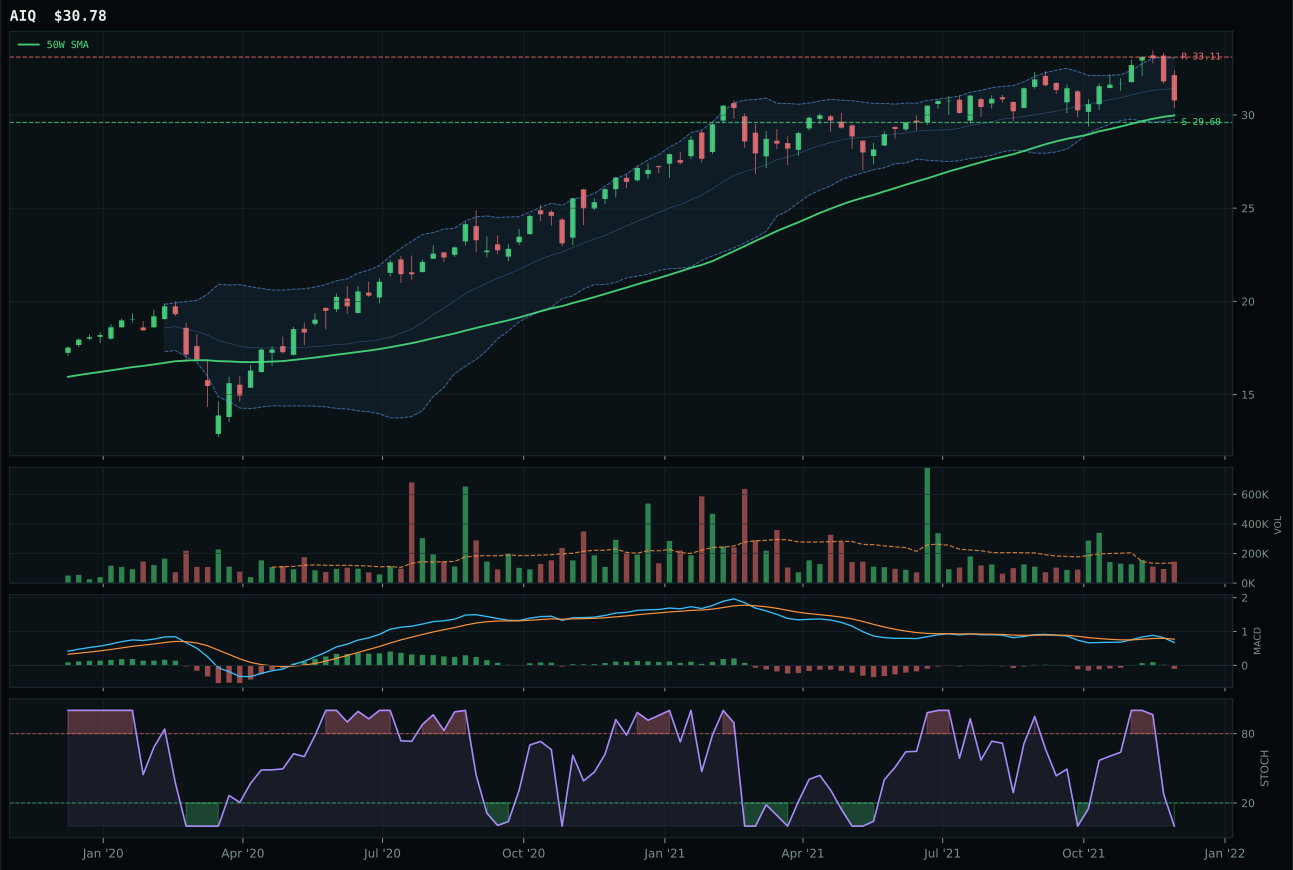
AIQ has a pullback into support profile with -3.6% 13-week relative strength versus SPY.
A failed hold above support would weaken the setup.
Tracked, but not top-2 eligible because: .
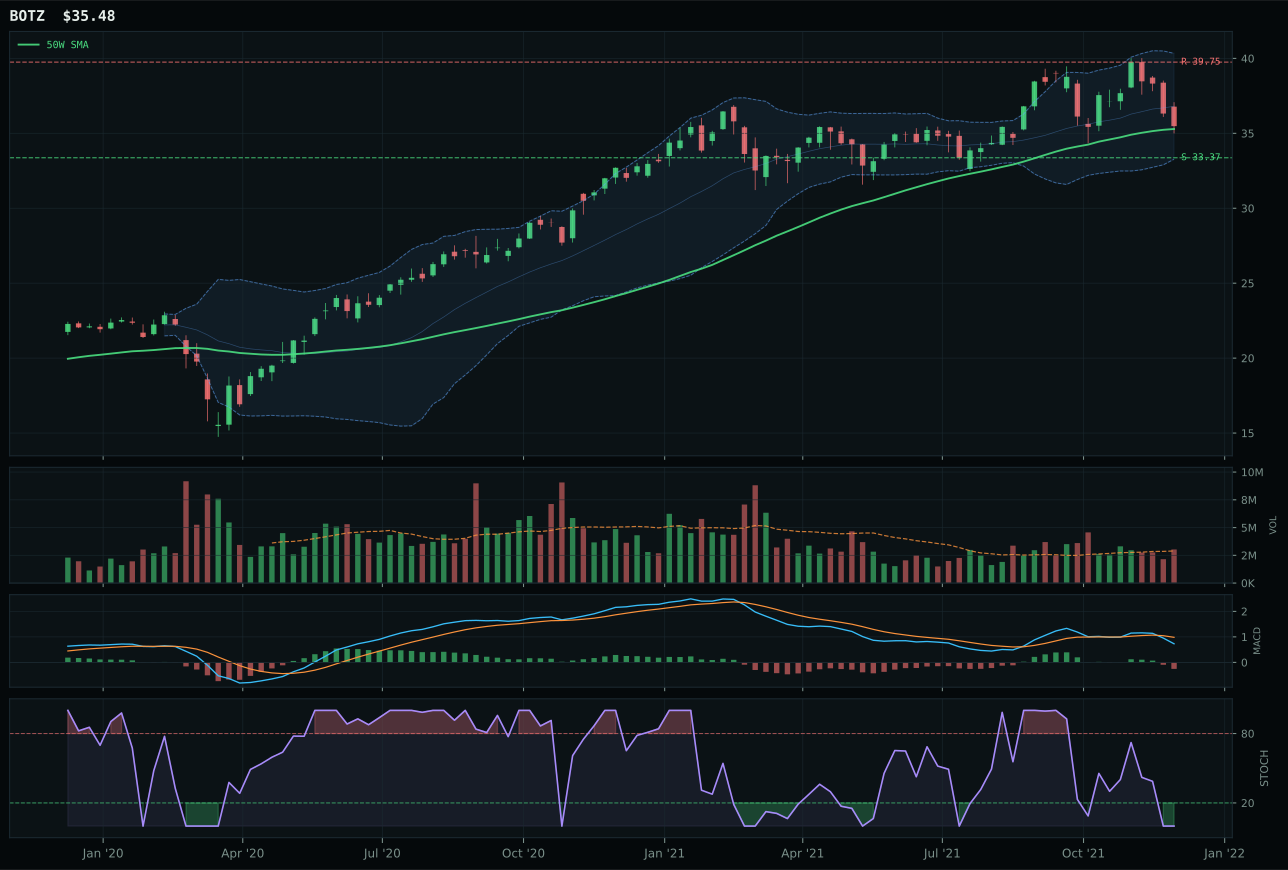
BOTZ has a compression near 50W profile with -7.8% 13-week relative strength versus SPY.
A failed hold above support would weaken the setup.
Actionable but governed by invalidation levels.
SMH demolished its peers with a 100.0 momentum score driven by a 13.7% category-relative strength and a 10.2% thirteen-week return that AIQ could not touch. Price is 18.0% above the 50W—genuinely extended—yet the setup still qualifies for allocation because volume is confirming at 1.92x the 20-day average and MACD is both bullish and improving, meaning the move is being actively accumulated rather than distributed into strength. AIQ's bearish, weakening MACD and oversold stochastic RSI sit directly opposite SMH's momentum profile; that divergence alone cost AIQ 30.2 points in the composite score. Semiconductor and AI compute leadership is so dominant right now that even an extended chart structure (vertical extension near Fib 0.236) commands 92.5 in the reasoned proof order, a level that simply eliminates the category median from serious contention.
AI earned 5% despite the strength of SMH because the category score of 45.6 ranked outside the top two eligible allocations this week. The tension here is that SMH shows excellent technical sponsorship and al growth descriptor support (+14), yet the category-level macro fit (76/100) gets eaten by risk-reward penalty: at -3.5% upside to resistance and 22.0% downside to support, the risk asymmetry has shifted against new entry. The AltSeason regime and risk-on liquidity expansion favor the category structurally, and the ai growth sponsorship descriptor is among the highest in the portfolio, but XLE and PICK both offered superior timing and risk-reward profiles by sitting in defined pullback-into-support zones with measurable invalidation levels. SMH will remain a core tactical holding—the chart is clean and momentum is genuine—but it does not merit more than 5% when cheaper entry points exist elsewhere.
Precious Metals — GLD
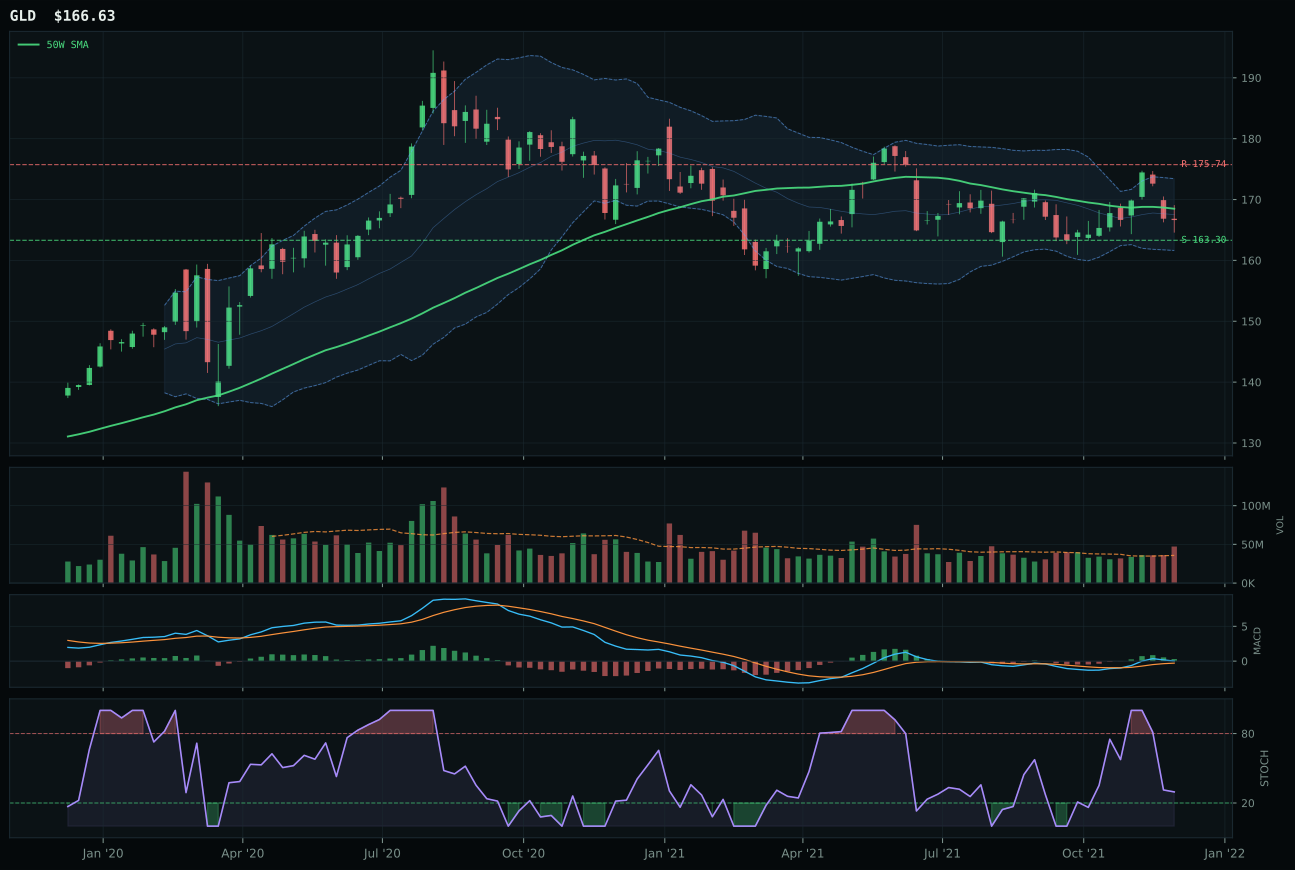
GLD has a pullback into support profile with -2.7% 13-week relative strength versus SPY.
A failed hold above support would weaken the setup.
Actionable but governed by invalidation levels.
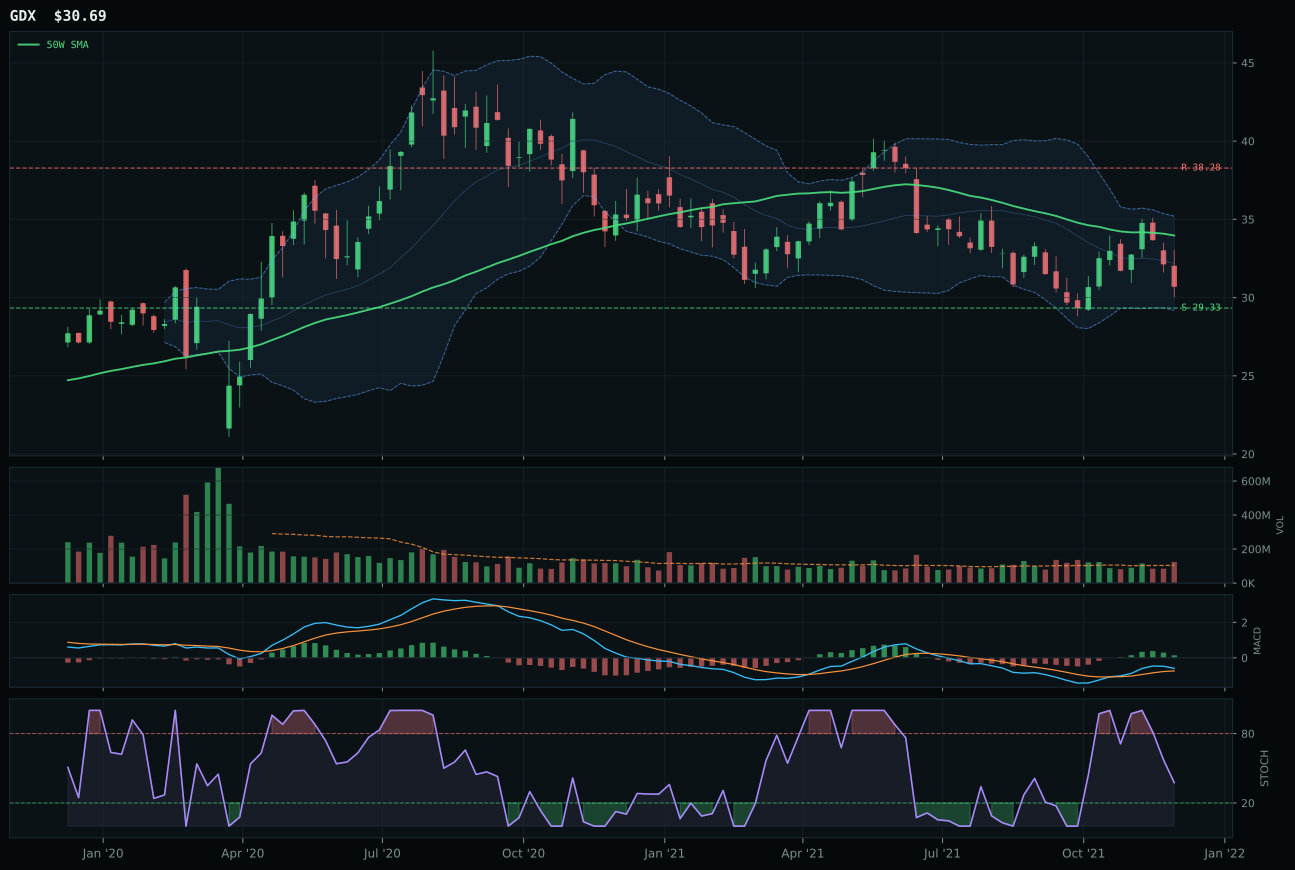
GDX has a pullback into support profile with -7.9% 13-week relative strength versus SPY.
A failed hold above support would weaken the setup.
Actionable but governed by invalidation levels.
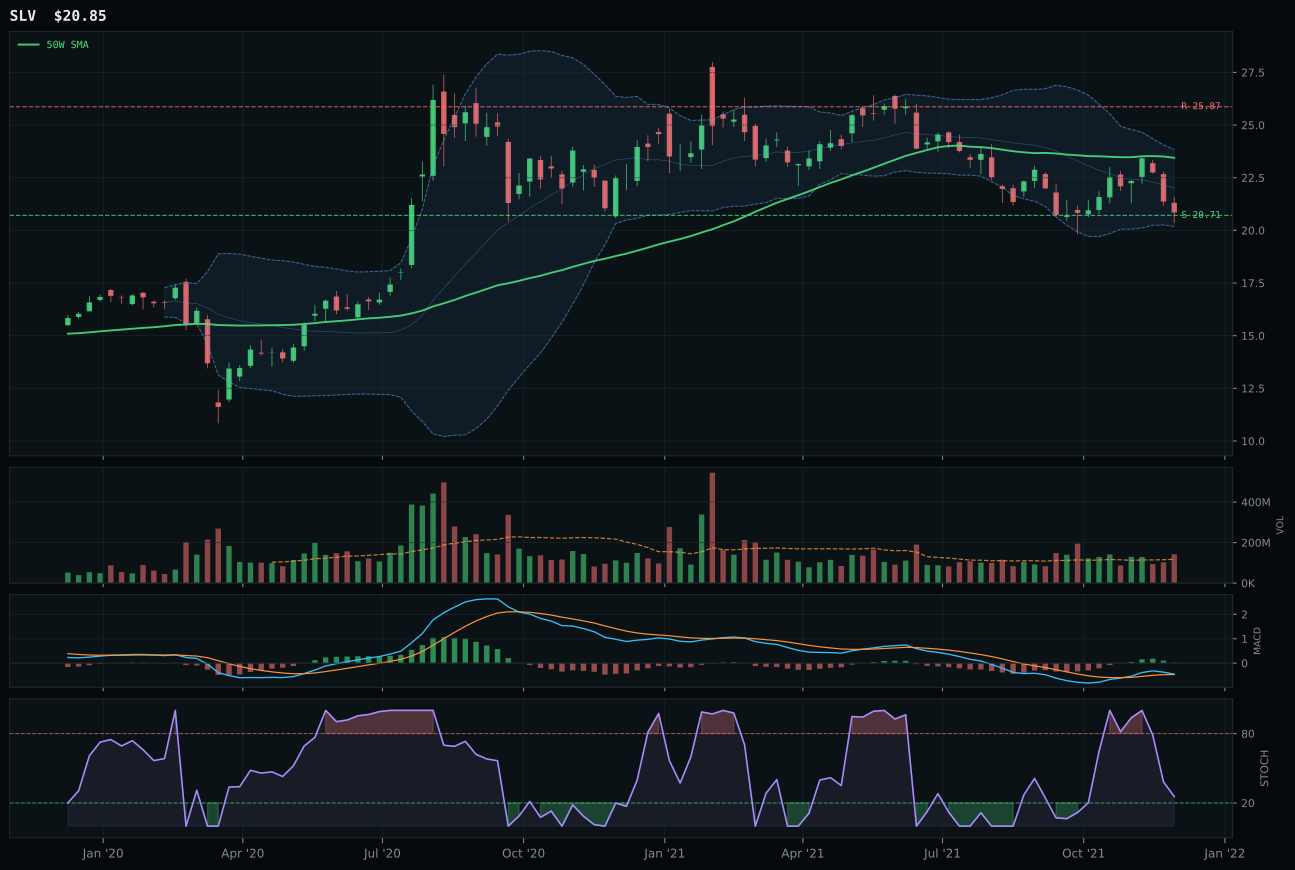
SLV has a pullback into support profile with -8.9% 13-week relative strength versus SPY.
A failed hold above support would weaken the setup.
Actionable but governed by invalidation levels.
GLD defeated GDX and SLV by assembling the cleanest timing score (100.0) in the category, a perfect reflection of price sitting just 1.1% below the 50W in the deep retracement zone near the 0.618 Fibonacci level. MACD is bullish and improving while stochastic RSI is falling into neutral, the exact momentum signature that marks a low-risk entry in a mean-reversion framework. GDX lost on multiple small edges: timing was weaker (80.0 vs 100.0), MACD was bullish but flattening rather than improving, category-relative strength was 0.0% versus GLD's 5.2%, and the Fib location was trapped near the 52-week low repair zone rather than the value-zone sweet spot. Volume at 1.32x the 20-day average is above-average participation but not accumulation, signaling that GLD is being bought without panic, exactly the conditions that define a successful defensive retracement entry.
Precious Metals earned 5% as a tactical monetary hedge despite the category scoring 45/100 and ranking outside the top two allocations. The positioning reflects a deliberate portfolio bet on the monetary hedge bid descriptor (+14), which is the highest-scoring individual macro signal for this category; the -4 impact from risk appetite positive (due to the risk-on regime) is real but does not overwhelm the structural demand for gold as policy-rate insurance. The Risk-On Liquidity Expansion regime technically hurts Precious Metals (-4), yet GLD's timing and risk-reward scores (100/100 and 98/100 respectively) suggest the market is quietly repricing gold lower as a defensive asset ahead of an inflection in risk appetite. The 5% allocation is exactly sized to reflect confidence in the mean-reversion setup without betting the portfolio that the rally phase has begun; if dollar pressure persists or credit stress rises, GLD's tight entry point becomes highly valuable.
Nuclear Energy — URA
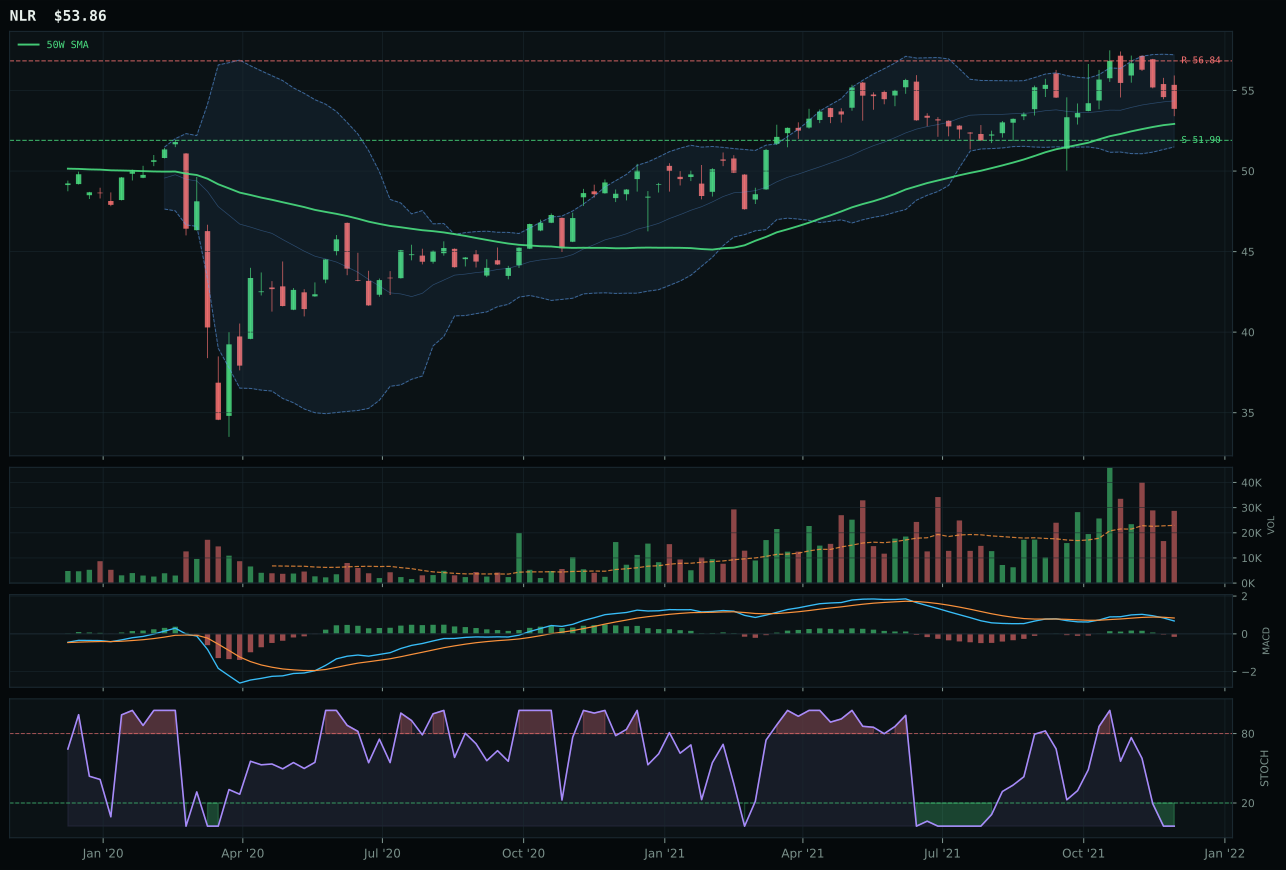
NLR has a pullback into support profile with -2.5% 13-week relative strength versus SPY.
A failed hold above support would weaken the setup.
Tracked, but not top-2 eligible because: .
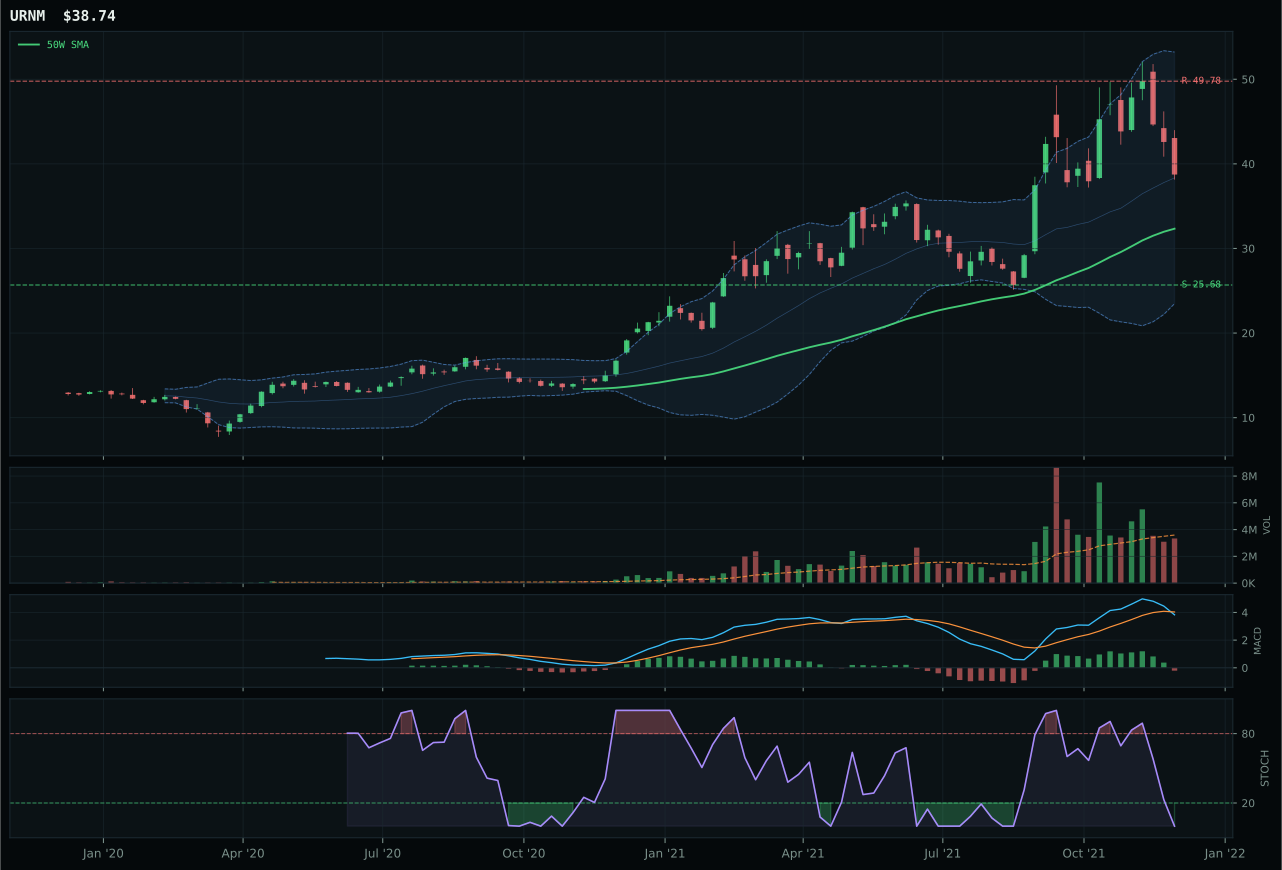
URNM has a vertical extension profile with 3.3% 13-week relative strength versus SPY.
A failed hold above support would weaken the setup.
Actionable but governed by invalidation levels.
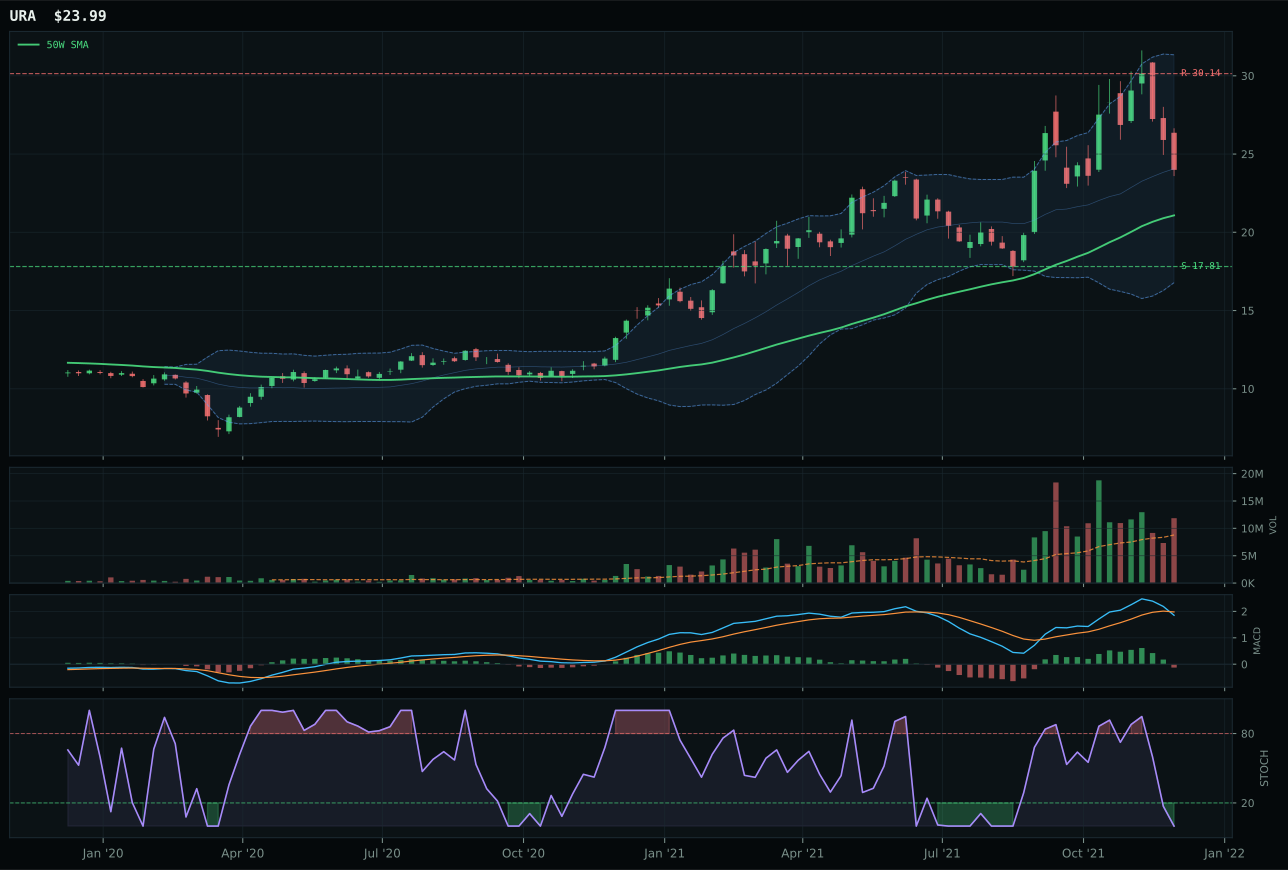
URA has a neutral structure profile with 0.2% 13-week relative strength versus SPY.
A failed hold above support would weaken the setup.
Actionable but governed by invalidation levels.
URA won the category by a narrow 7.7-point margin over NLR, the decision hinging entirely on category-relative strength where URA matched 0.0% while NLR was -2.7%—a razor-thin technical edge in a category where all three ETFs face weak momentum confirmation. URA's trend score of 82.3 reflects price above both moving averages with a strong 0.9% 50W slope, but the 13W return of just 0.3% and 4W return of -17.4% expose the lack of conviction beneath the uptrend structure. MACD is bearish/weakening and stochastic RSI is at extreme oversold (0.00), creating a setup that looks more like a bounce candidate than a directional position. Price sits 13.8% above the 50W in the middle retracement decision zone, which is neither compelling value nor extended strength—it is a holding pattern waiting for a macro catalyst.
Nuclear Energy earned 5% allocation as a tactical real-asset play on energy scarcity (+9) and real asset sponsorship (+7) despite a category score of only 39.6 and weak technical evidence (28.5/100). The allocation reflects the same macro conviction logic as Agriculture and Precious Metals: the portfolio needs diversified energy exposure across fossil fuels (XLE), uranium (URA), and other sources, and URA's neutral structure keeps the position scalable without overpaying for momentum. The category-level macro fit at 74/100 is respectable, driven by energy scarcity and real asset sponsorship, but URA's zero thirteen-week momentum and 0.3% thirteen-week return signal that uranium investors are not excited yet. This is a 5% waiting position, held in anticipation of a transition-narrative breakout rather than a current-regime strength trade; it will either lead to 10%+ allocation if the nuclear thesis gains traction, or become expendable if macro signals shift away from energy scarcity.
Agriculture & Livestock — MOO
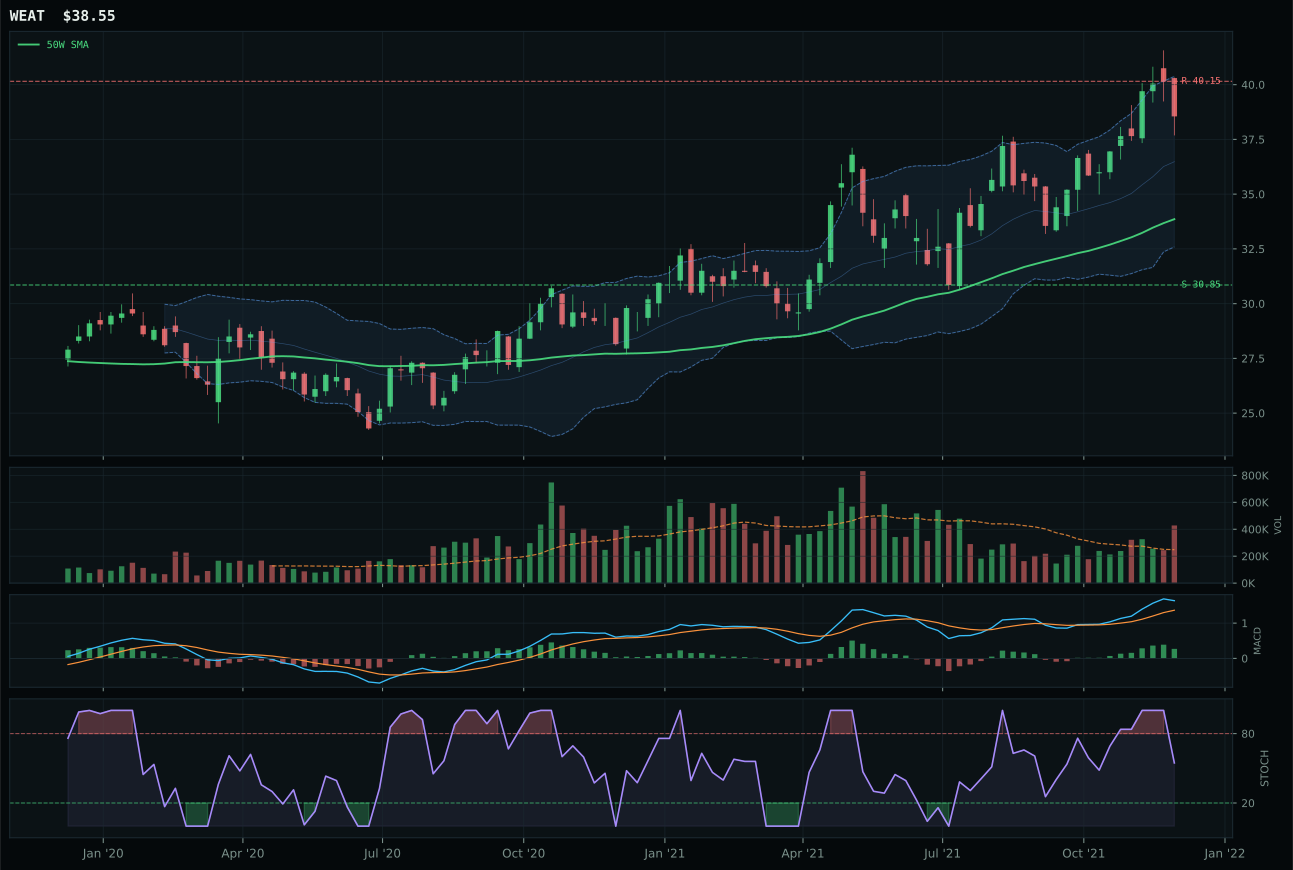
WEAT has a neutral structure profile with 9.0% 13-week relative strength versus SPY.
A failed hold above support would weaken the setup.
Tracked, but not top-2 eligible because: .
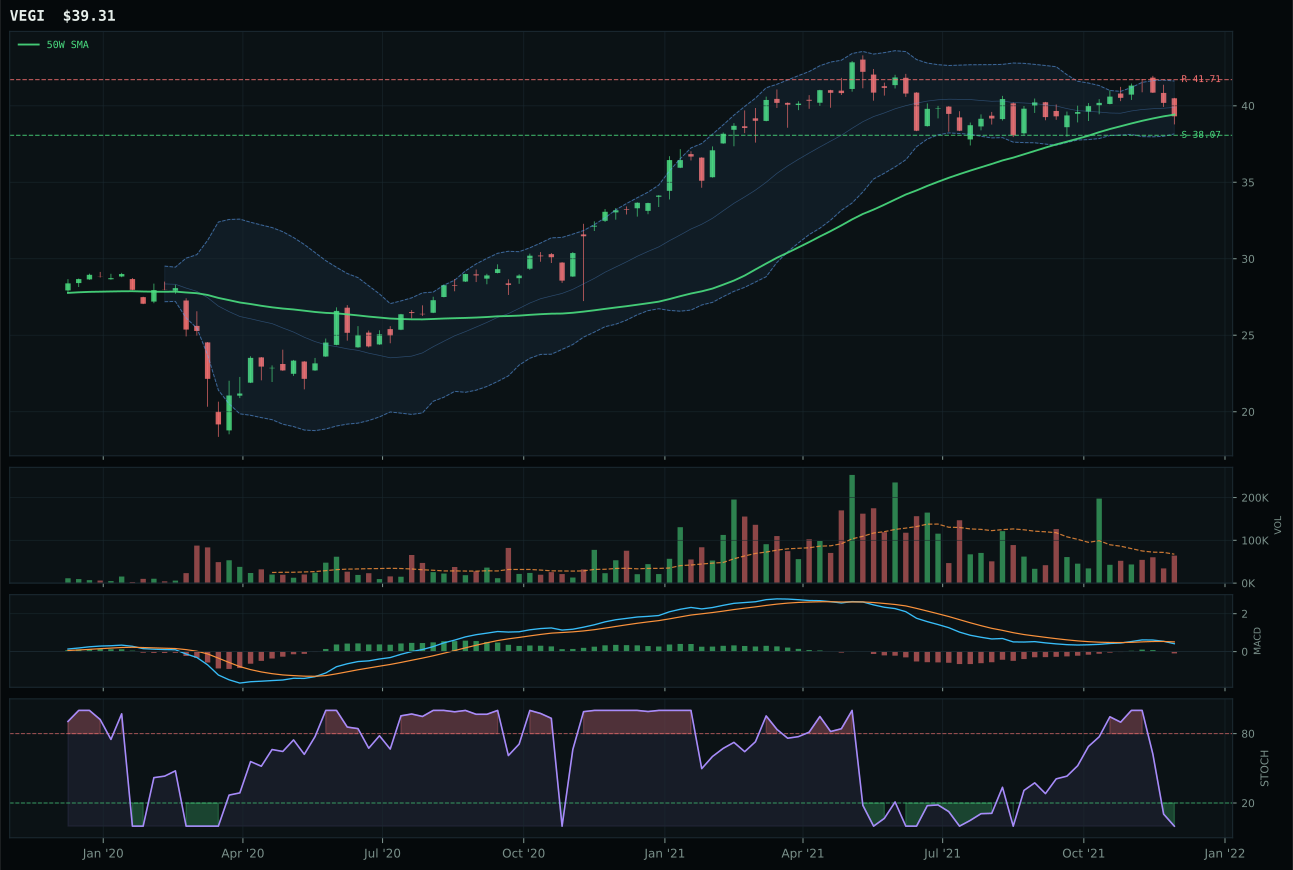
VEGI has a pullback into support profile with -2.3% 13-week relative strength versus SPY.
A failed hold above support would weaken the setup.
Tracked, but not top-2 eligible because: .
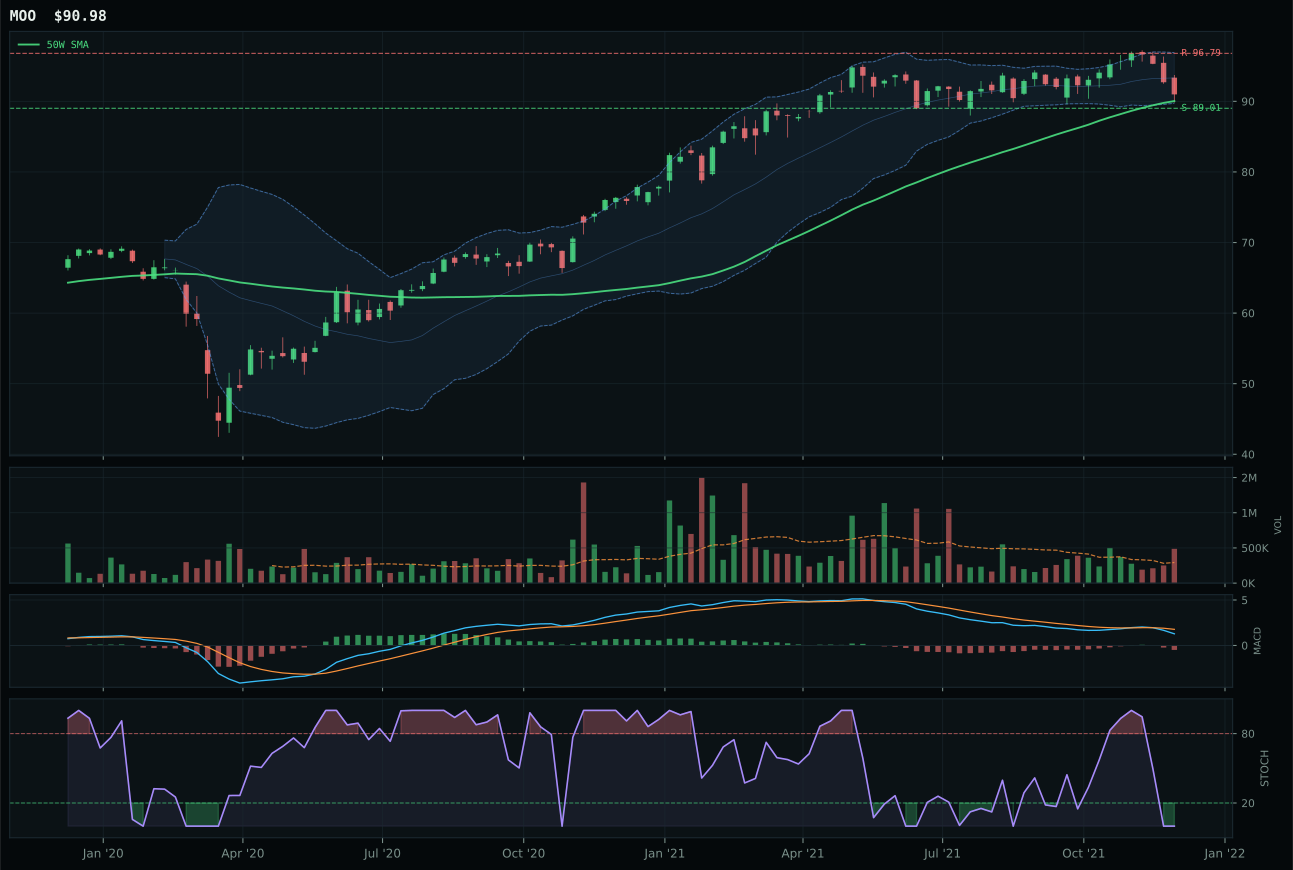
MOO has a pullback into support profile with -3.4% 13-week relative strength versus SPY.
A failed hold above support would weaken the setup.
Actionable but governed by invalidation levels.
MOO won an extremely tight race against WEAT (separated by just 0.6 points) because its timing score was dramatically superior at 95.0 versus WEAT's 75.0, reflecting proximity to the 50W that matters in mean-reversion setups. MOO sits just 1.0% from its 50W with stochastic RSI oversold and MACD bearish/weakening, creating a textbook pullback-into-support entry where risk is defined at 89.01 and upside targets 96.79 for a 2.2% downside buffer versus 6.0% upside. WEAT was technically more bullish—its 13W return was +9.1% and RS versus SPY was +9.0%—but that strength came from vertical extension 13.9% above the 50W, which shifts the risk-reward equation unfavorably when the category-level macro favors real assets and supply shortage signals are active. MOO's distribution-pressure volume and near-support positioning make it the lower-execution-risk play despite weaker absolute momentum.
Agriculture & Livestock earned 5% allocation as a tactical real-asset diversifier, not because it ranks among the top two categories this week but because the 35.0 score reflects strong macro support (86/100 category-level fit) that deserves a non-zero position. The supply shortage descriptor (+13) and inflation pressure (+10) are among the highest-weighted macro tailwinds in the portfolio, and commodity breadth positive (+5) confirms that the rotation into real assets is broad rather than name-specific. The technical weakness (MOO's 6.7/100 technical evidence) is the offsetting risk, meaning this is a macro conviction trade, not a chart-driven entry—exactly the type that belongs in a 5% satellite slot rather than concentrated core capital. The portfolio needs exposure to agricultural inflation protection as a hedge against continued real-asset scarcity, and MOO's tight setup at the 50-week provides the cleanest technical entry to express that conviction without overpaying for momentum.
Emerging Markets — INDA
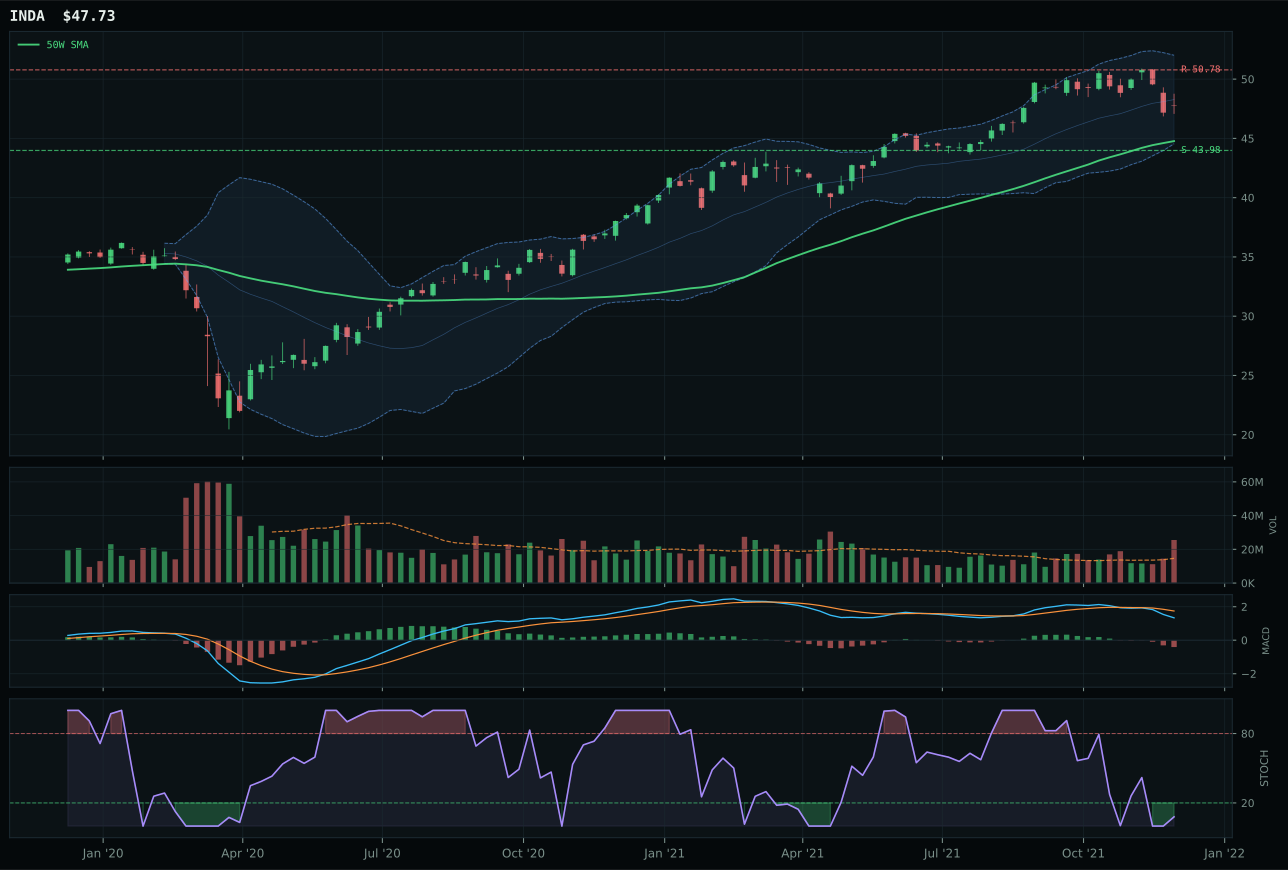
INDA has a neutral structure profile with -4.0% 13-week relative strength versus SPY.
A failed hold above support would weaken the setup.
Actionable but governed by invalidation levels.
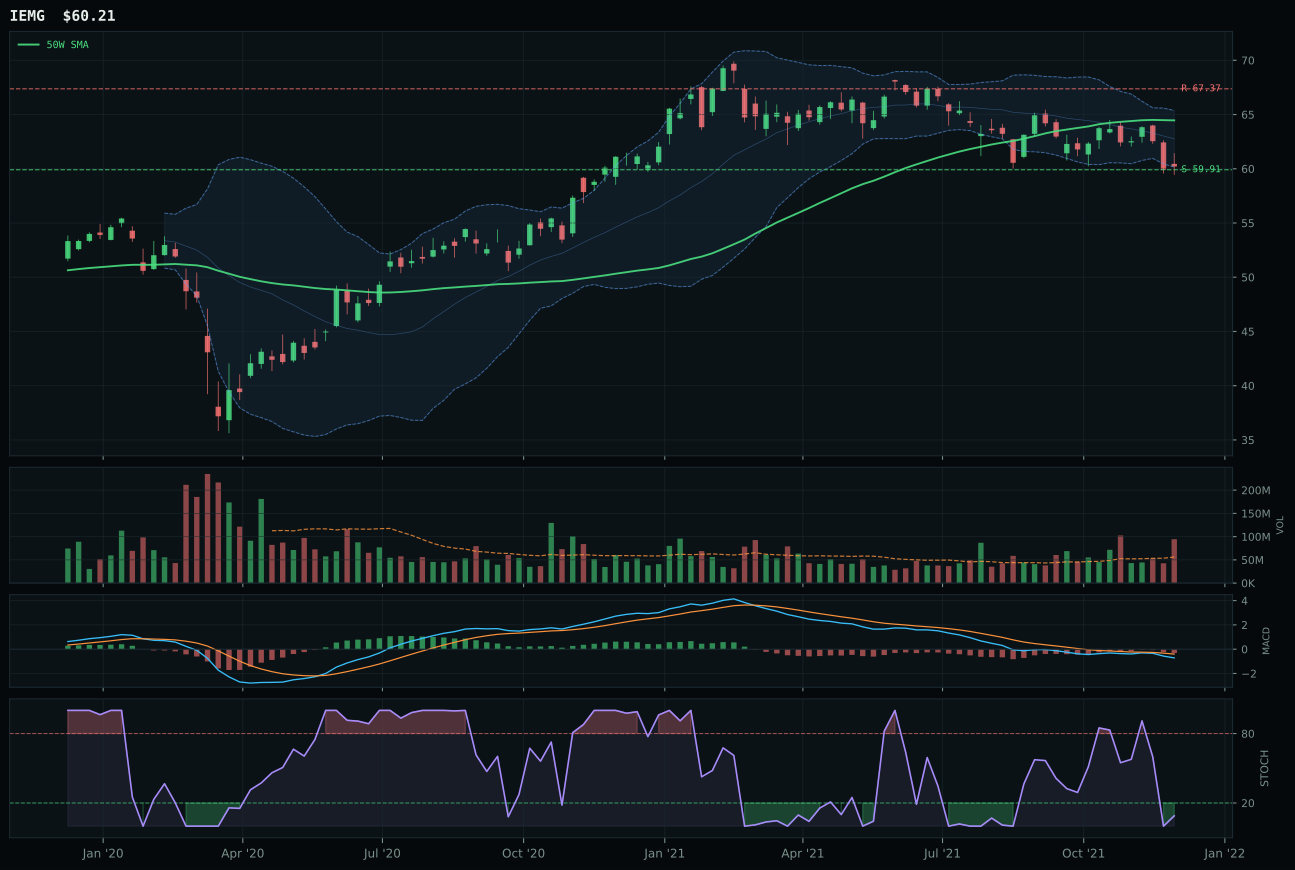
IEMG has a pullback into support profile with -7.3% 13-week relative strength versus SPY.
A failed hold above support would weaken the setup.
Actionable but governed by invalidation levels.
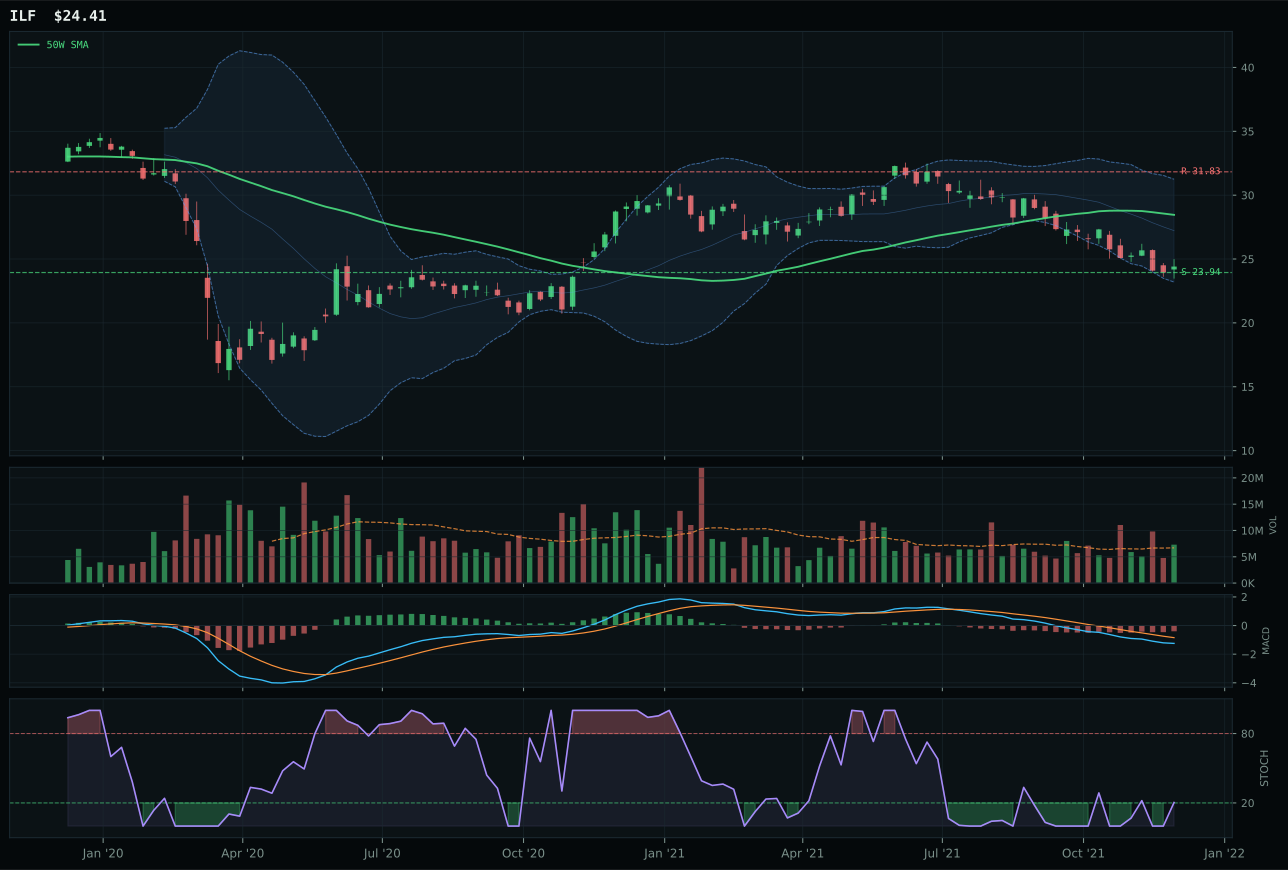
ILF has a pullback into support profile with -15.9% 13-week relative strength versus SPY.
Extension and support failure are the main tactical risks.
Tracked, but not top-2 eligible because: structurally broken.
INDA won the category with a 46.1 reasoned proof order, defeating IEMG (39.6) on category-relative strength (+3.3% versus 0.0%) and structure cleanliness (81.5 versus 76.5), despite both charts sharing the same bearish/weakening MACD and oversold stochastic RSI setup. INDA's neutral structure near the upper retracement/momentum zone at Fib 0.236 gave it a cleaner entry geometry than IEMG's pullback-into-support setup at the 52-week low repair zone. Volume confirmation (1.74x accumulation versus IEMG's also 1.74x) is equal, but INDA's 6.6% proximity to the 50W creates more tactical maneuverability than IEMG's deeper pullback. The 13W returns are both negative (-4.0% for INDA, -7.3% for IEMG), which tells you this is a regime-fighting category allocation rather than a momentum-driven one.
Emerging Markets earned zero allocation because the category scores 26.4 composite and ranks 9th or 10th, falling outside the eligible allocation range due to relentless headwinds from dollar pressure (-14) and credit stress (-10) that overwhelm the positive risk appetite (+8) and liquidity expansion (+8) signals. The macro regime is explicitly anti-EM this week; dollar strength is a structural trade that penalizes any currency-conversion denominated in the USD, and credit stress dynamics suggest investors are de-risking emerging markets in favor of developed-market safety. INDA's technical edge is real but insufficient to override the macro bias: a 46.1 reasoned ETF score out of a 26.4 category score reveals that the category itself is broken, and neither good chart work nor excellent India-specific narratives can salvage the allocation when the macro tide is running the wrong direction. Emerging markets will return to the portfolio once dollar weakness becomes the active descriptor and credit stress flips positive.
Defense & Aerospace — ITA
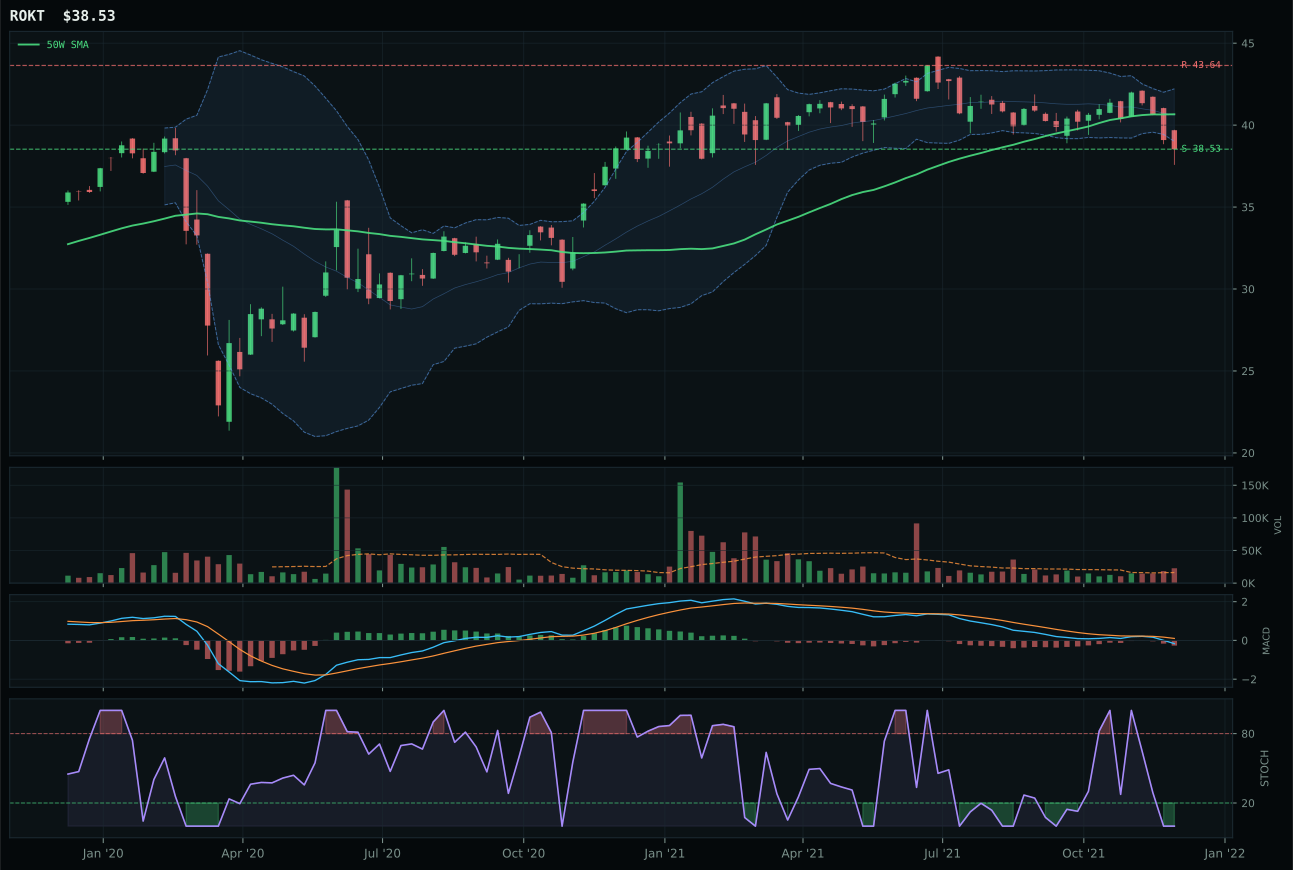
ROKT has a pullback into support profile with -5.8% 13-week relative strength versus SPY.
A failed hold above support would weaken the setup.
Tracked, but not top-2 eligible because: .
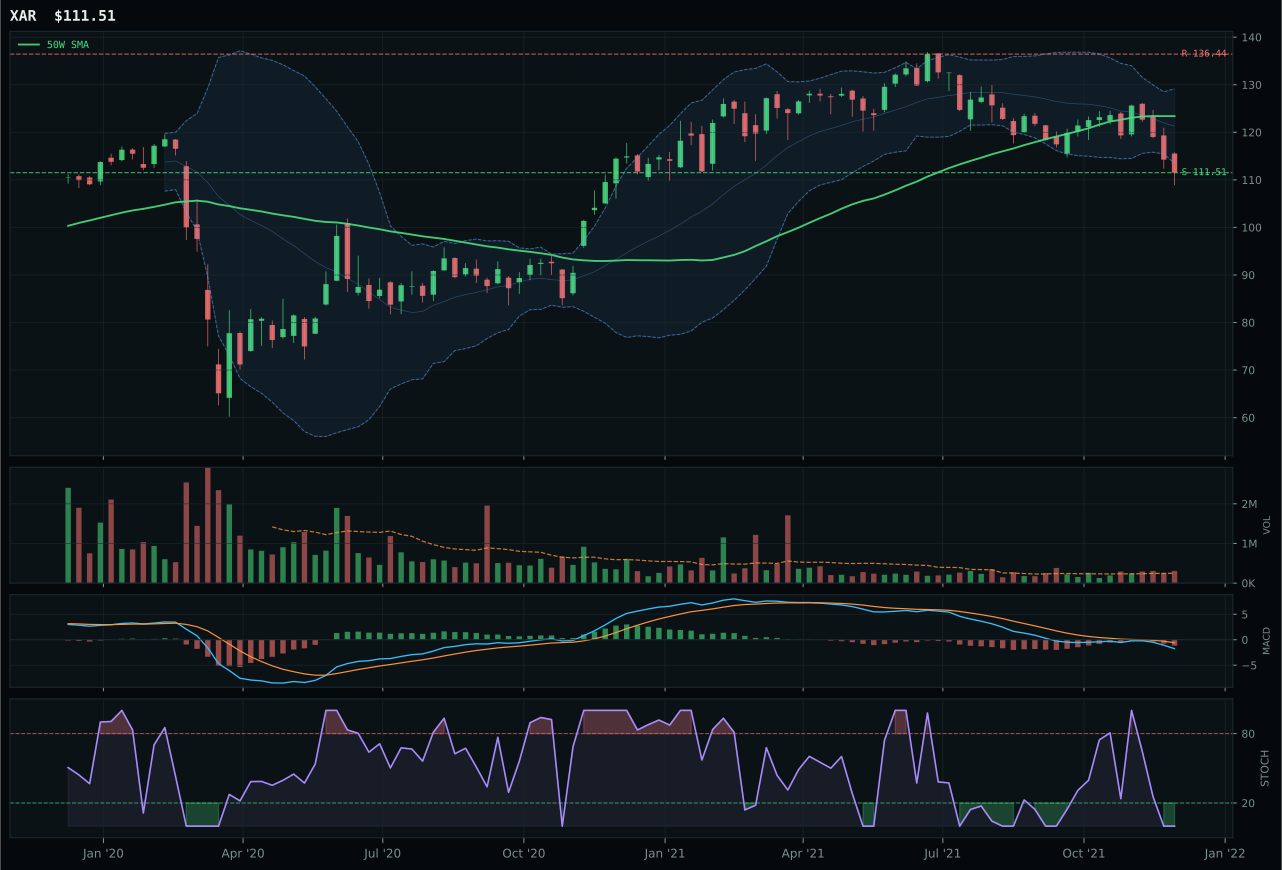
XAR has a pullback into support profile with -8.5% 13-week relative strength versus SPY.
A failed hold above support would weaken the setup.
Actionable but governed by invalidation levels.
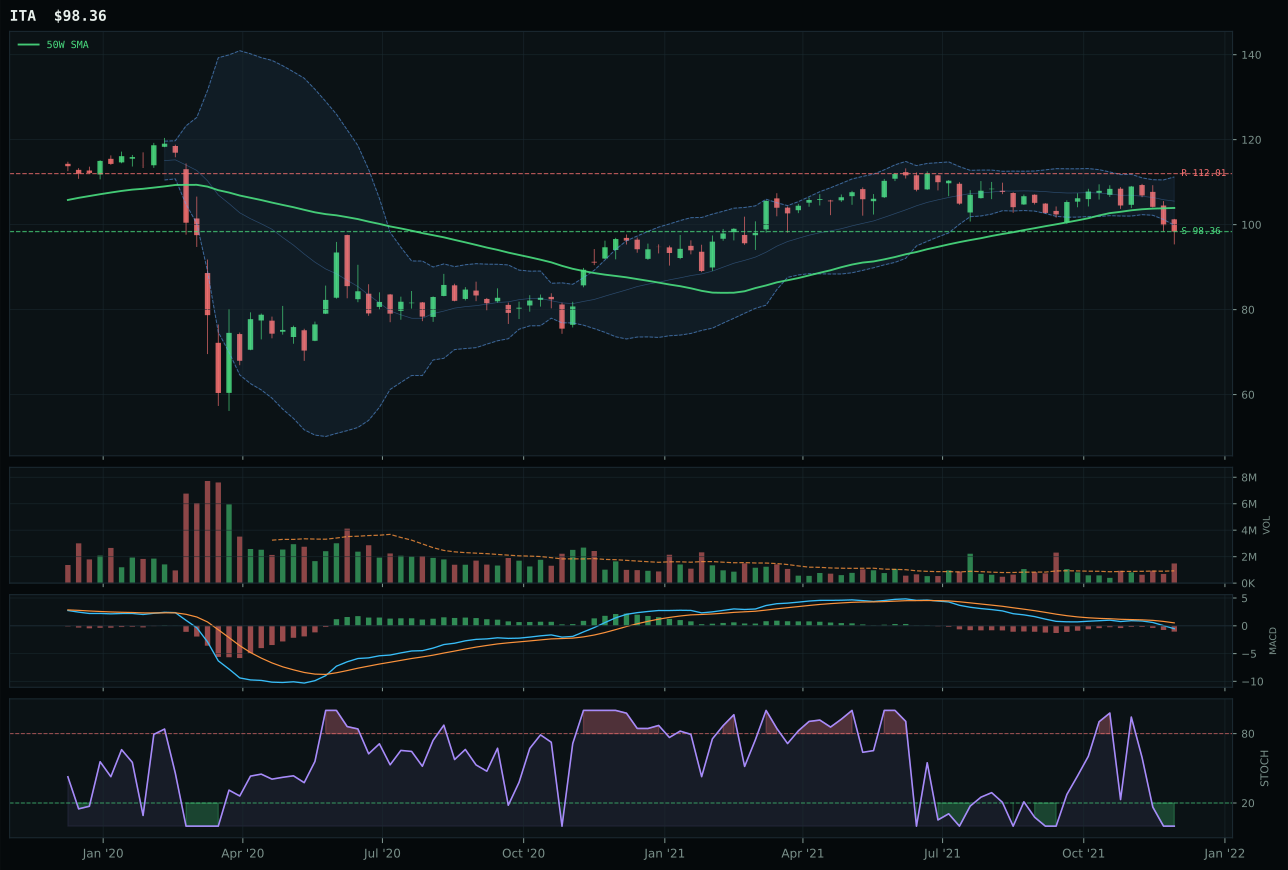
ITA has a pullback into support profile with -6.5% 13-week relative strength versus SPY.
A failed hold above support would weaken the setup.
Actionable but governed by invalidation levels.
ITA won the category not because it is strong, but because all three peers are weak and the allocator selected the one with the best defined support structure. Price sits near the 50W low at 98.36 with MACD bearish/weakening and stochastic RSI at extreme oversold (0.00), creating a clear invalidation zone just 0% below current levels and a defined bounce target near 112.01 resistance. ROKT lost despite fractionally better risk-reward (71.3 vs 72.4) because ITA's timing score was marginally superior—both charts are pullbacks into support, both show distribution-pressure volume, but ITA's Fib location in the 0.618 middle retracement zone carries more classical mean-reversion setup weight than ROKT's near 52-week low positioning. None of these setups are recommended; they are all selected by elimination in a category that faces headwind from broad market bear sentiment (-6 credit stress, +6 broad market bear) offsetting +3 dollar pressure.
Defense & Aerospace earned zero allocation because it ranks 9th or 10th among the ten categories at 20.5 composite, representing the portfolio's weakest category opportunity set this week. The macro backdrop works against this sector: while liquidity expansion and risk appetite positive are active, the broad market bear descriptor (+6) and credit stress (+2) are overpowering any tailwind from defense durability narratives. ITA's timing setup is mathematically sound, but the absence of volume-price confirmation (9.2/100) and zero momentum confirmation (0/100) mean this is a technical bounce candidate, not a capital allocation opportunity. The category-level macro fit at 64/100 confirms that Defense & Aerospace does not align with the current regime descriptors; it will become interesting only when the broad market bear signal flips or when geopolitical risk explicitly enters the macro checklist. Until then, it remains on the bench.