
2021-11-26
Informational purposes only. The content in this report, including allocations, analysis, and commentary, is provided solely for informational and educational purposes. It does not constitute financial advice, investment advice, trading advice, or any other type of advice. Past performance does not guarantee future results. Always conduct your own research and consult a qualified financial professional before making investment decisions.
Weekly Allocation
| Ticker | Category | Weight | Role |
|---|---|---|---|
| FSOL | 50% | Overlay | |
| XLE | Traditional Energy | 10% | Top-2 (10%) |
| XLK | Technology | 10% | Top-2 (10%) |
| URNM | Nuclear Energy | 5% | Tier-2 (5%) |
| PAVE | Utilities & Infrastructure | 5% | Tier-2 (5%) |
| GLD | Precious Metals | 5% | Tier-2 (5%) |
| MOO | Agriculture & Livestock | 5% | Tier-2 (5%) |
| COPX | Industrial Metals | 5% | Tier-2 (5%) |
| SMH | AI | 5% | Tier-2 (5%) |
Trade Instructions — Monday Open
Sell the tranche from 2021-10-29 (completing its 4-week hold). Buy the new tranche. Instructions show net portfolio changes — same-asset positions cancel, weight changes show the delta.
| Action | Ticker | Instruction |
|---|---|---|
| SELL | URNM | Sell 17% of URNM position (reduce 7.50% → 6.25%) |
| SELL | CIBR | Sell 50% of CIBR position (reduce 2.50% → 1.25%) |
| SELL | ITA | Sell entire ITA position (1.25% of portfolio) |
| BUY | SMH | Buy SMH — 33.33% of freed cash (adds 1.25% to portfolio) |
| BUY | XLK | Buy XLK — 66.67% of freed cash (adds 2.50% to portfolio) |
Current Portfolio After Trade
Combined holdings across all 4 active tranches. Each tranche is 25% of the portfolio.
| Ticker | % of Portfolio | Weight Bar |
|---|---|---|
| FSOL | 50.00% | |
| XLE | 10.00% | |
| URNM | 6.25% | |
| GLD | 6.25% | |
| PAVE | 5.00% | |
| SMH | 5.00% | |
| XLK | 5.00% | |
| COPX | 3.75% | |
| MOO | 3.75% | |
| CIBR | 1.25% | |
| REMX | 1.25% | |
| XAR | 1.25% | |
| URA | 1.25% |
Macro Regime — Transition / Mixed
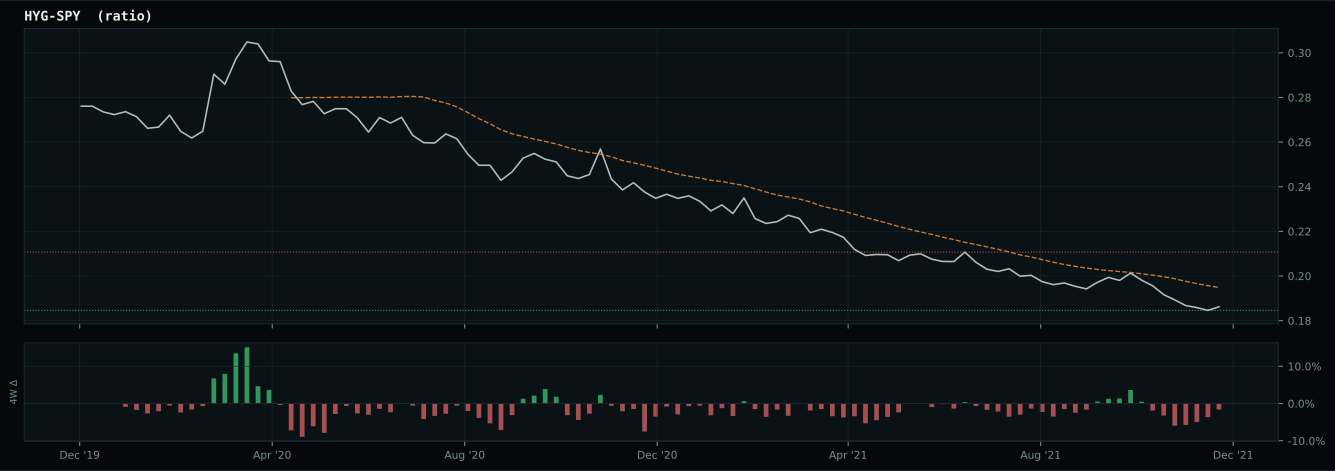
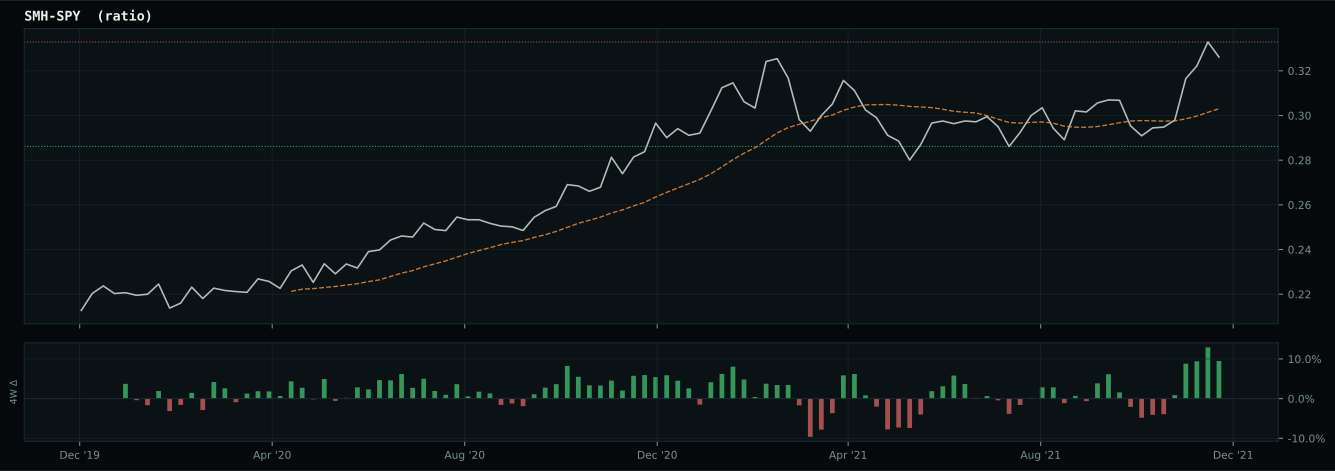
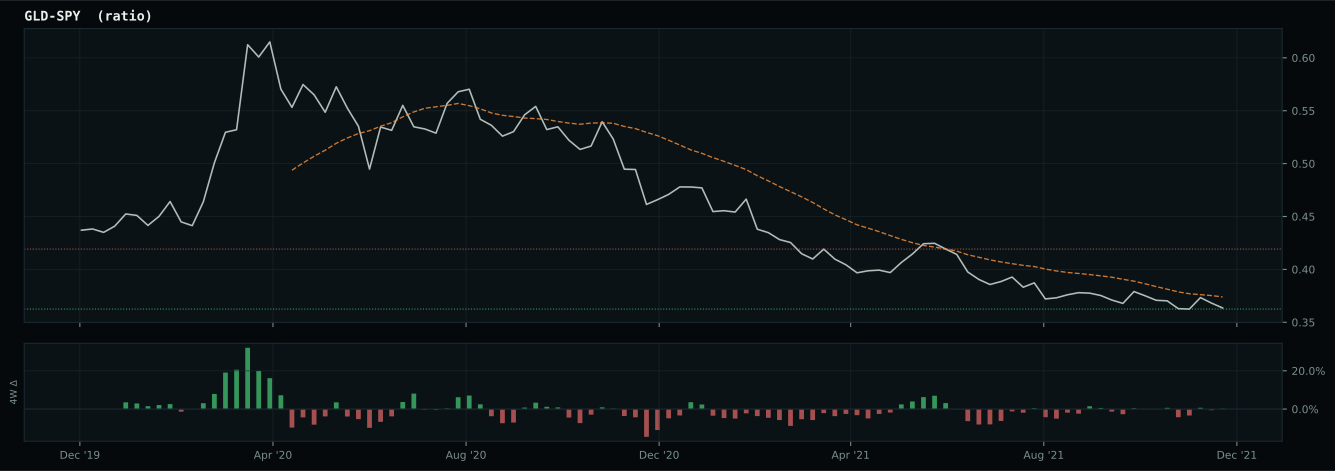
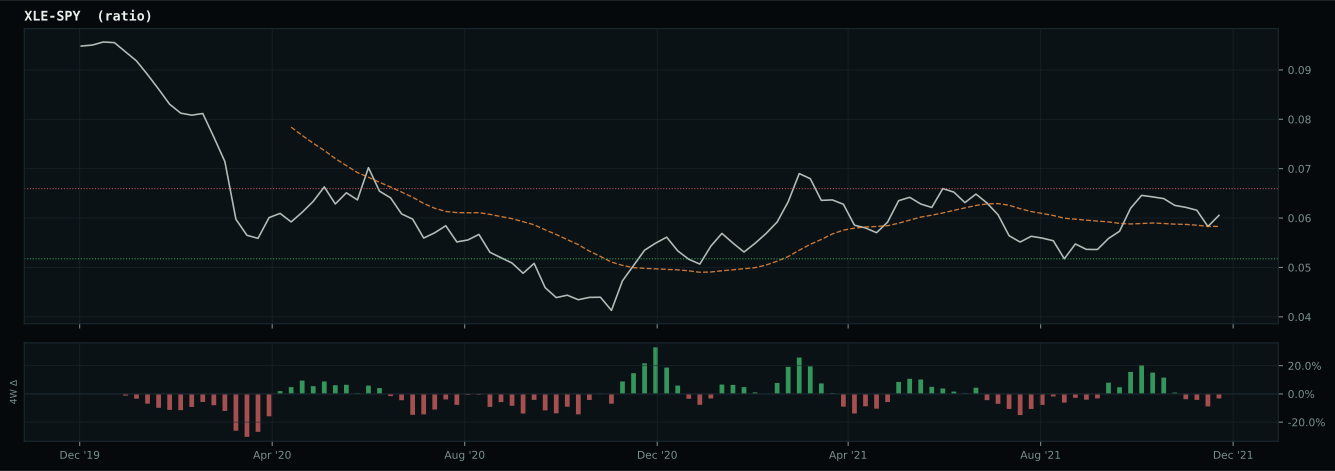
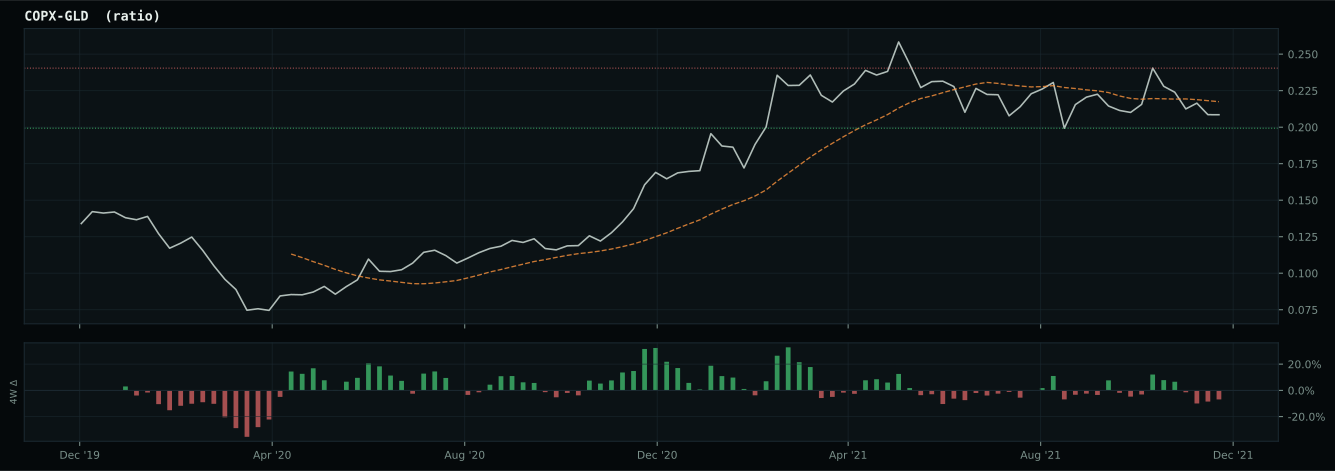
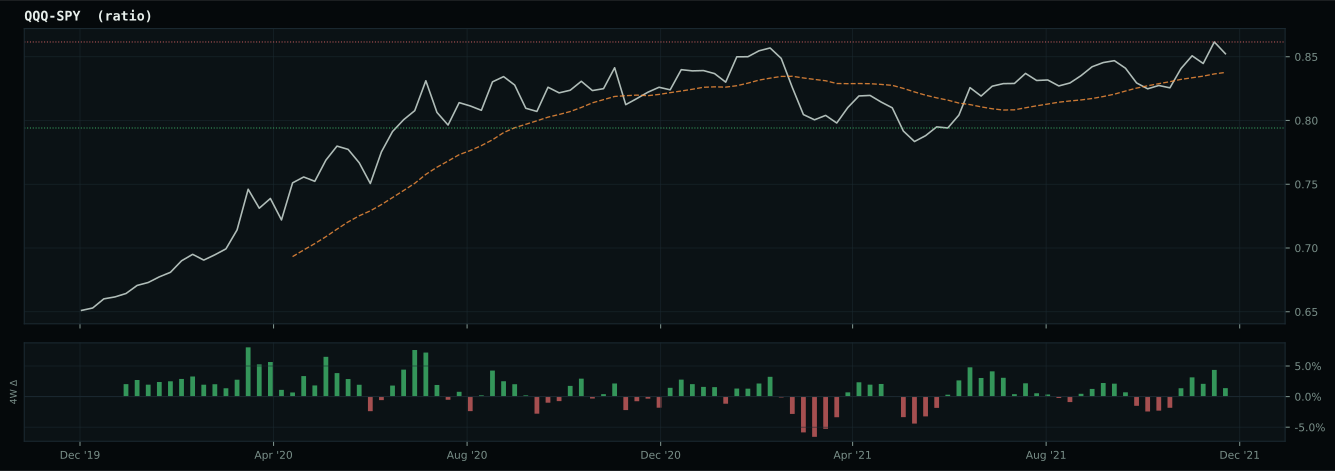
Macro Evidence Charts
Market-implied signals behind the macro regime scores. Each ratio compares two assets; the direction and slope of the ratio is what the macro engine reads.
Crypto Regime — AltSeason
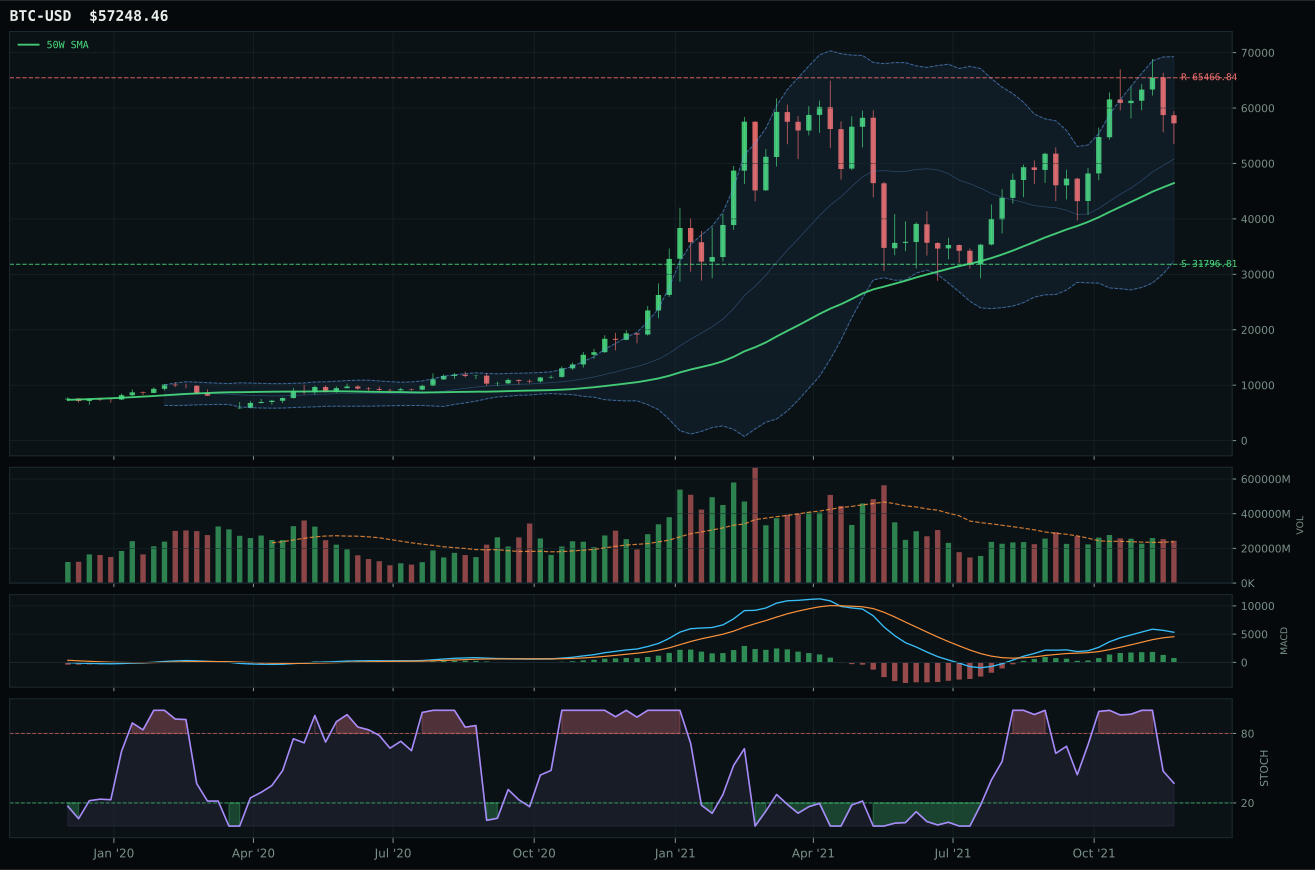
ValueBTC not armed: BTC has not made the first post-breakdown touch of the 200W buy zone after losing the 50W
TrendBTC confirmed: 2 consecutive closes above rising/flat 50W SMA
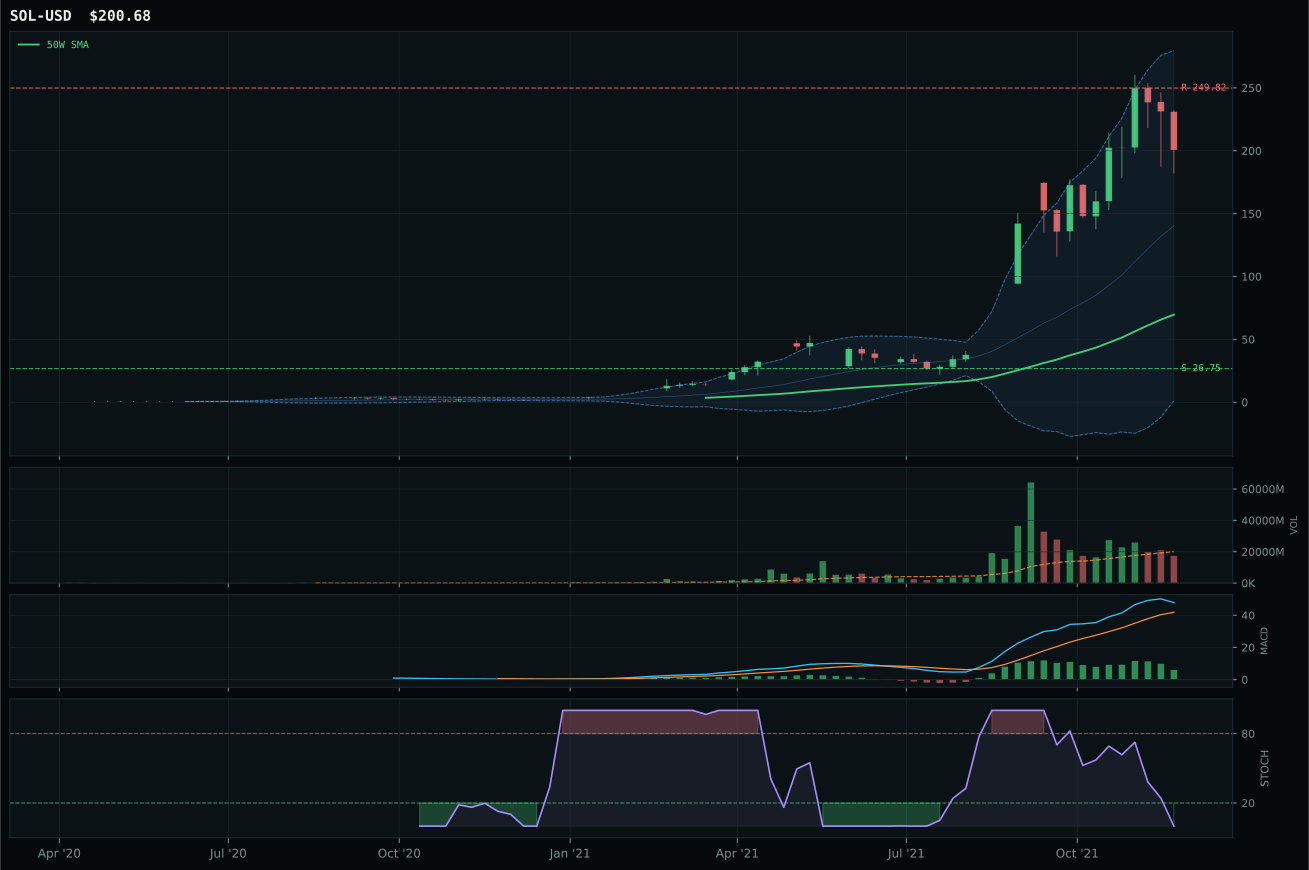
all available AltSeason conditions pass; missing optional confirmations skipped
Category Rankings
| Rank | Category | Winner | Score | Alloc | 4W Ret | Peers (4W) |
|---|---|---|---|---|---|---|
| 1 | Traditional Energy | XLE | 76.8 | 20% | -3.65% | FCG -6.0% · XOP -6.1% |
| 2 | Technology | XLK | 58.6 | 20% | +3.07% | CIBR -0.1% · IGV -4.6% |
| 3 | Nuclear Energy | URNM | 58.4 | 10% | -7.37% | URA -6.4% · NLR -1.4% |
| 4 | Utilities & Infrastructure | PAVE | 52.6 | 10% | +0.07% | XLU +3.7% · IGF +1.7% |
| 5 | Precious Metals | GLD | 51.1 | 10% | +1.27% | GDX -2.5% · SLV -0.6% |
| 6 | Agriculture & Livestock | MOO | 50.5 | 10% | +1.50% | WEAT -3.1% · VEGI +0.3% |
| 7 | Industrial Metals | COPX | 47.0 | 10% | +4.34% | REMX -11.7% · PICK +2.0% |
| 8 | AI | SMH | 42.2 | 10% | +1.58% | AIQ -0.8% · BOTZ -1.0% |
| 9 | Defense & Aerospace | XAR | 35.6 | 0% | +1.18% | ITA +0.7% · ROKT +0.5% |
| 10 | Emerging Markets | INDA | 9.0 | 0% | -5.61% | IEMG -1.5% · ILF -3.7% |
Traditional Energy — XLE
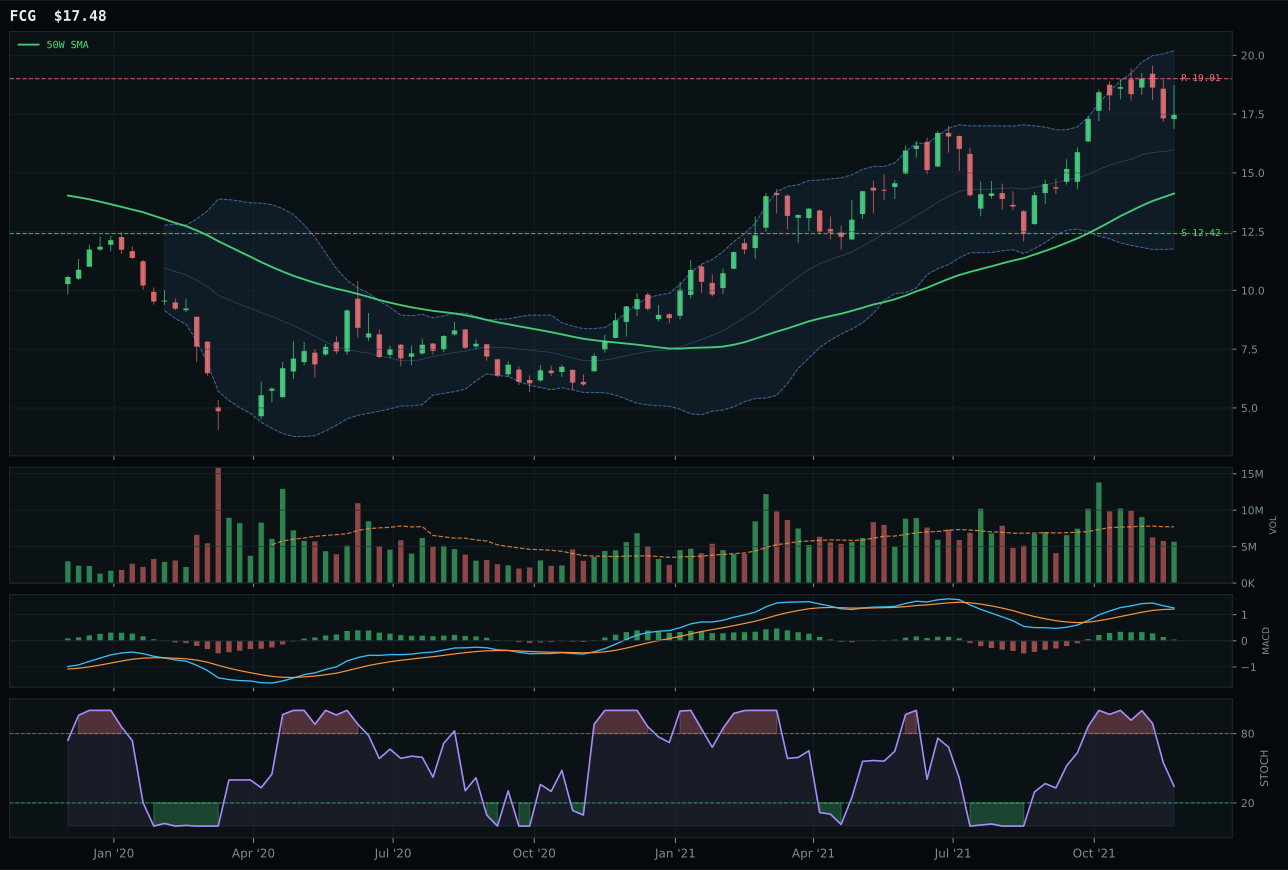
FCG has a vertical extension profile with 22.5% 13-week relative strength versus SPY.
A failed hold above support would weaken the setup.
Actionable but governed by invalidation levels.
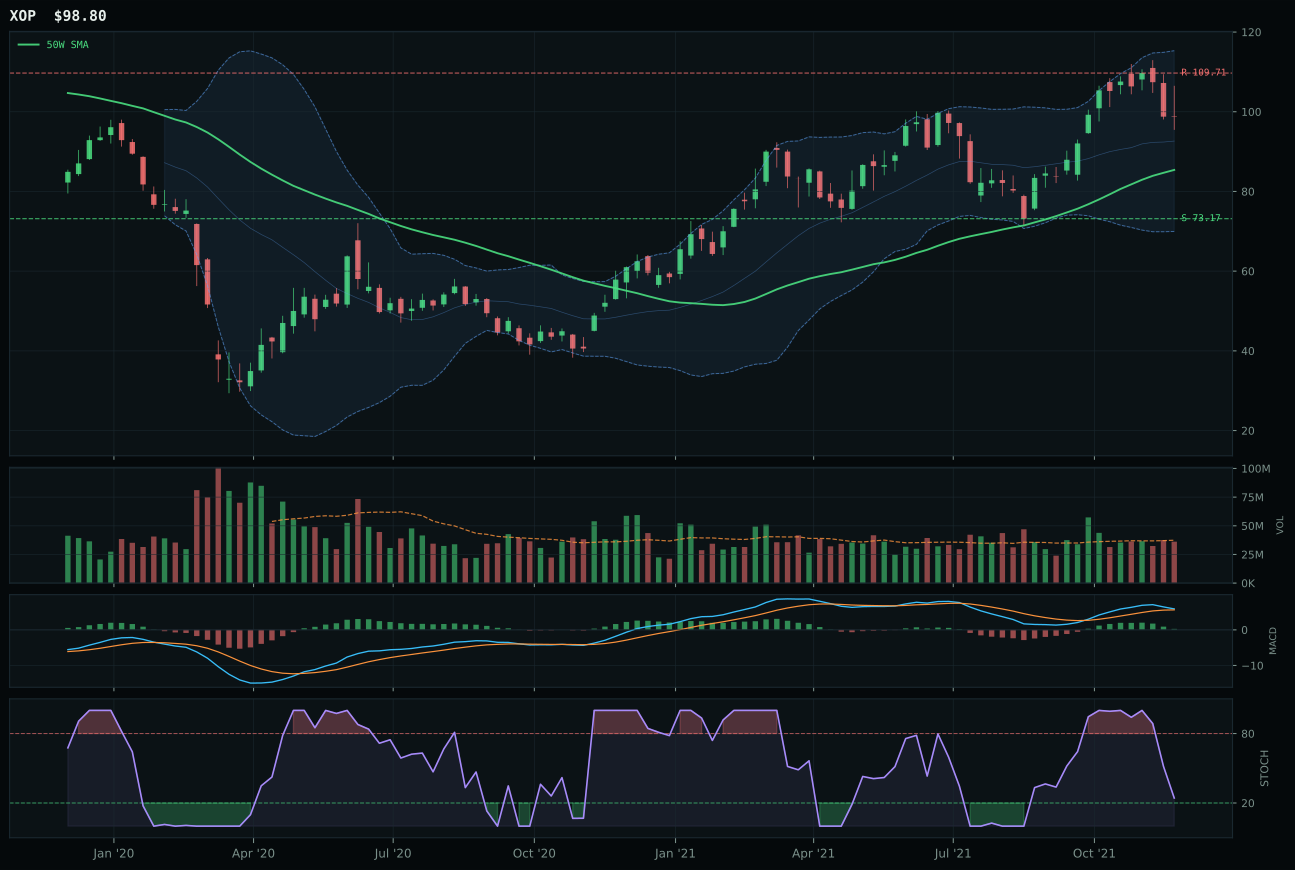
XOP has a vertical extension profile with 16.5% 13-week relative strength versus SPY.
A failed hold above support would weaken the setup.
Actionable but governed by invalidation levels.
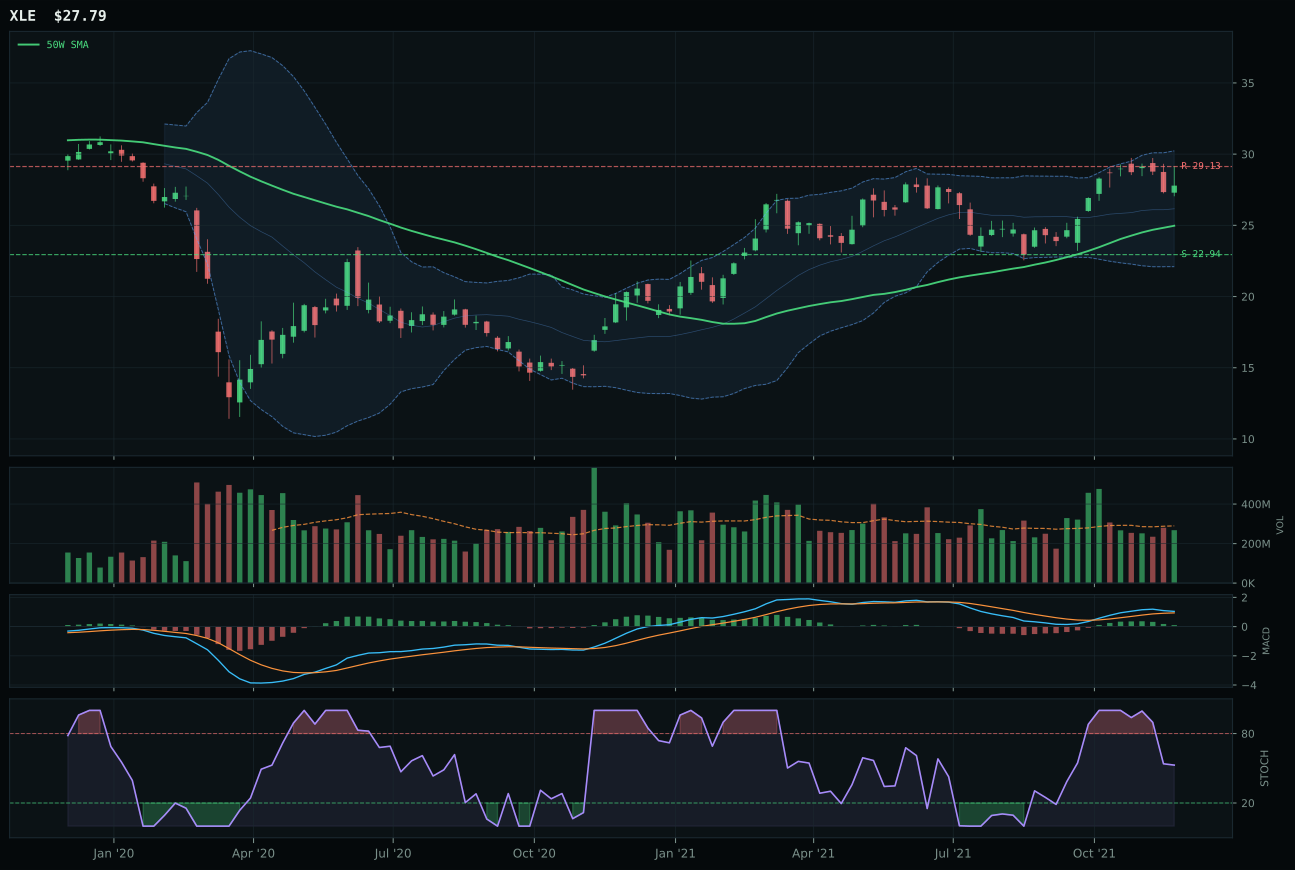
XLE has a neutral structure profile with 10.8% 13-week relative strength versus SPY.
A failed hold above support would weaken the setup.
Actionable but governed by invalidation levels.
XLE won Traditional Energy and earned top-2 weight by delivering the cleanest execution in a strong macro category. Price is above both 50-week and 200-week moving averages with neutral structure—not extended, not compressed, not signaling reversal—and the 10.8% outperformance versus SPY combined with 12.7% 13-week returns tells us that energy cash-flow narratives are genuinely accumulating. FCG lost to XLE despite stronger 13-week returns of 24.4% because timing is poor: FCG is extended 23.8% above the 50-week, and stochastic RSI is falling into neutral at the edge of overbought, meaning new buyers are entering a stretched setup. XLE's timing score of 70.0 versus FCG's 48.0 reflects the edge in entry mechanics. Volume confirmation for XLE is neutral (0.92x normal) versus FCG's thin participation (below 1.0x), and MACD is bullish but flattening for both, but XLE's structure supports the case that accumulation is happening at reasonable levels rather than desperate chasing.
Traditional Energy ranked first among categories at 76.8 and earned a top-2 slot at 10% allocation, justified by exceptional macro fit at 85% driven by energy-scarcity (+14), inflation-pressure (+10), and supply-shortage (+7) signals. Technical evidence scored 68.2%, solid without being exceptional, but the macro sponsorship created a portfolio imperative: real-asset protection in an inflation-pressure regime demands energy exposure. XLE's integrated-cash-flow thesis—capturing both commodity upside and refining margins—provided tactical robustness. Volume at 0.92x 20-day average meant institutional positioning remained measured, avoiding the overheated speculative reads that plague FCG and XOP. The 10% slot reflects category rank and macro conviction, positioned to benefit from sustained geopolitical supply disruption and demand-side inflation. This allocation remains intact until energy-scarcity or supply-shortage signals deactivate; if crude breaks below technical support or macro descriptors fade, rebalancing to 5% would occur immediately. For now, XLE anchors the real-asset sleeve of the portfolio.
Technology — XLK
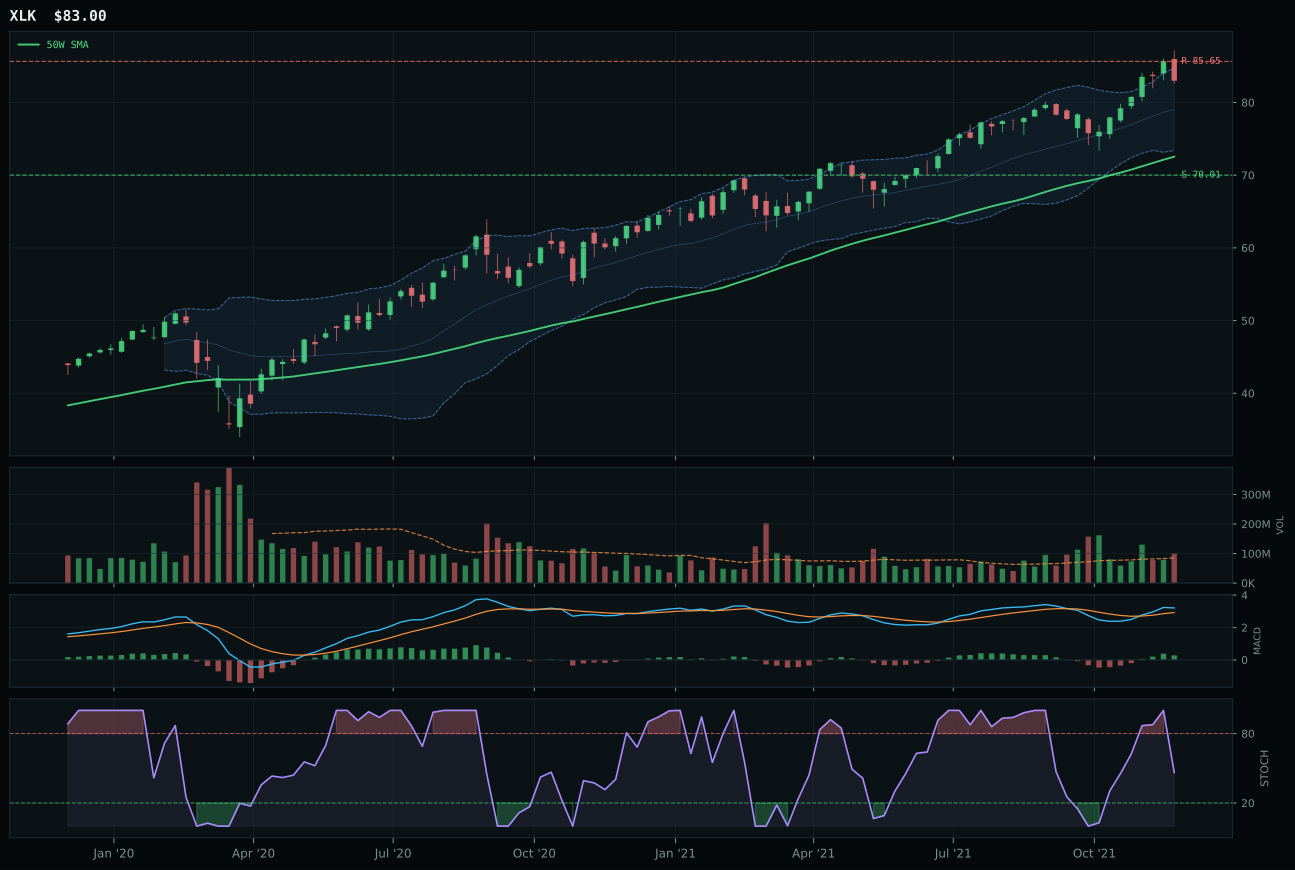
XLK has a neutral structure profile with 3.1% 13-week relative strength versus SPY.
A failed hold above support would weaken the setup.
Actionable but governed by invalidation levels.
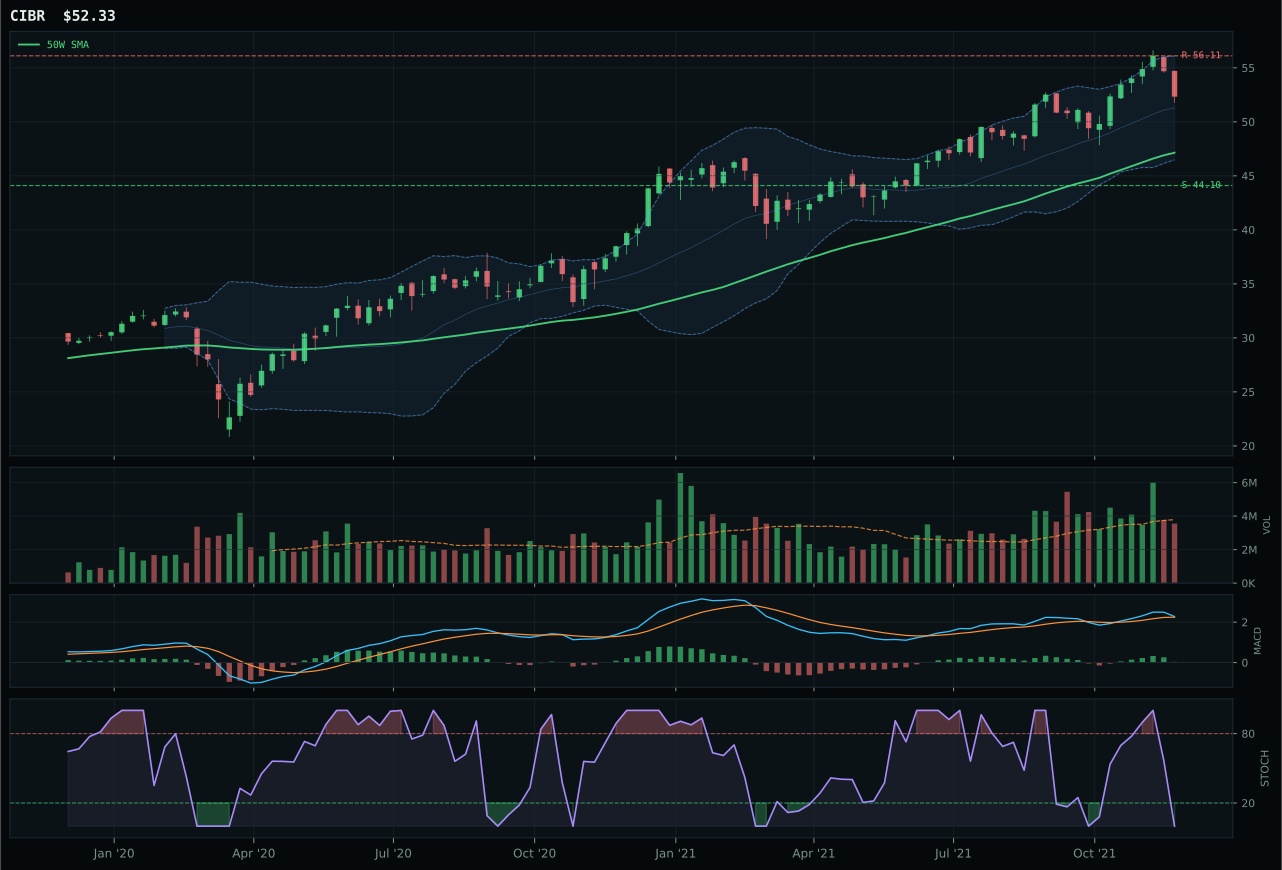
CIBR has a neutral structure profile with -0.5% 13-week relative strength versus SPY.
A failed hold above support would weaken the setup.
Actionable but governed by invalidation levels.
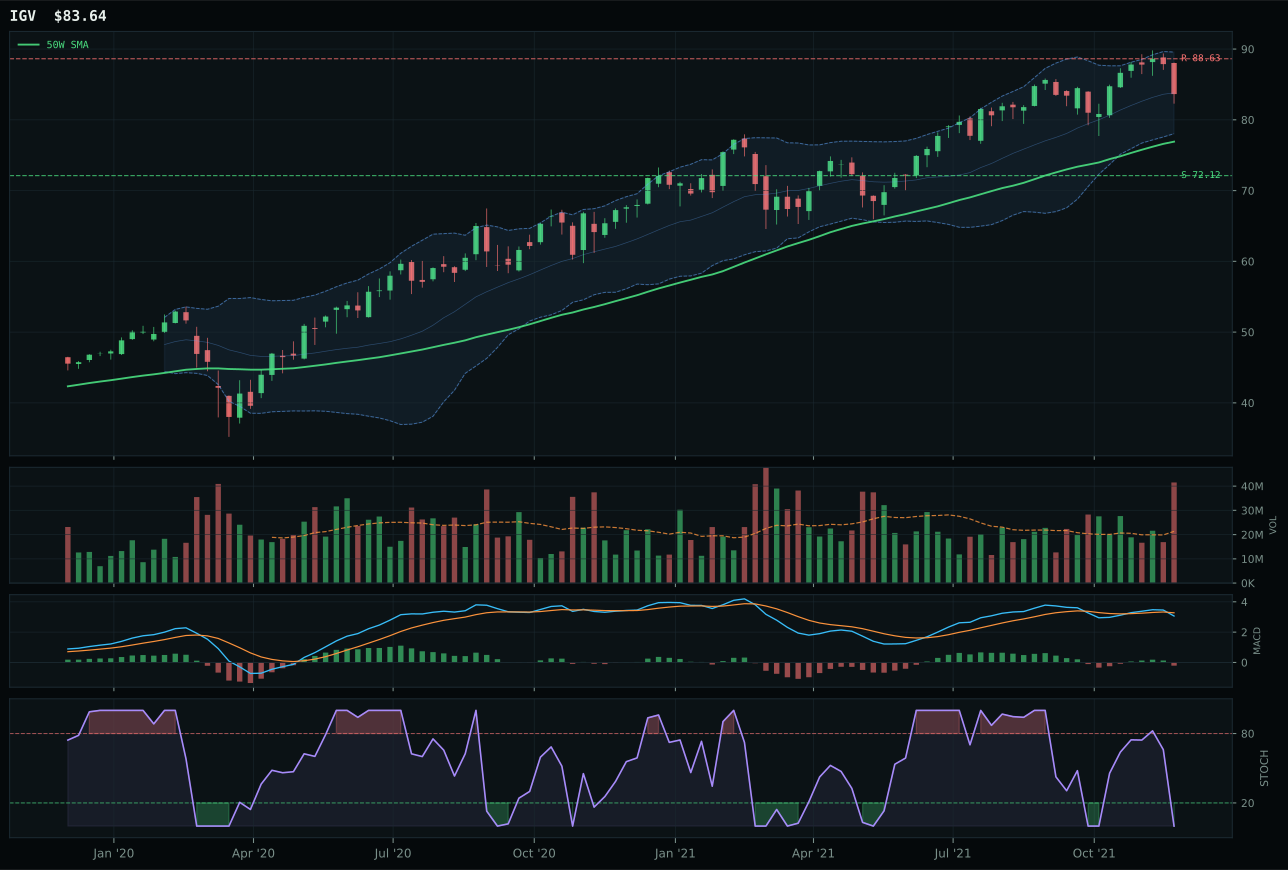
IGV has a neutral structure profile with -3.3% 13-week relative strength versus SPY.
A failed hold above support would weaken the setup.
Actionable but governed by invalidation levels.
XLK won Technology decisively by combining clean trend structure with genuine relative strength accumulation. Price sits above both the 50-week and 200-week moving averages with a 0.6% positive slope, and the 3.1% outperformance versus SPY signals that institutional buyers are choosing broad profitable tech over the index. CIBR lost ground on two fronts: its MACD is bullish but flattening—momentum confirmation is fading—while XLK's MACD remains bullish and improving, and CIBR's category-relative strength of 0.0% tells us cybersecurity is not benefiting from the same sponsorship as XLK's integrated tech leadership. Volume participation at 1.18x the 20-week average confirms accumulation rather than bounce; the setup is neutral structure near the 50-week moving average, not extended or stretched, which gives risk-reward geometry of 18.5% downside to support versus only 3.1% upside to resistance.
Technology's 10% allocation reflects a category performing credibly but outside the true leadership tier. At a 58.6 final score, it ranked third among eligible categories this week, which in a mixed macro regime means it captures meaningful opportunity without consuming the portfolio's highest-conviction capital. Liquidity expansion and positive risk appetite are both active, and XLK's broad profitability narrative fits that sponsorship, yet credit stress headwinds and inflation pressure combined to hold the macro fit at just 63%. The category earns its slot because entry timing remains clean and the technical evidence is strong enough (62% of the score), but XLE and XLK—the top two—deserve first priority. XLK would need to establish even firmer relative strength or see the macro backdrop shift decisively toward growth-without-inflation concerns to move into 20% territory.
Nuclear Energy — URNM
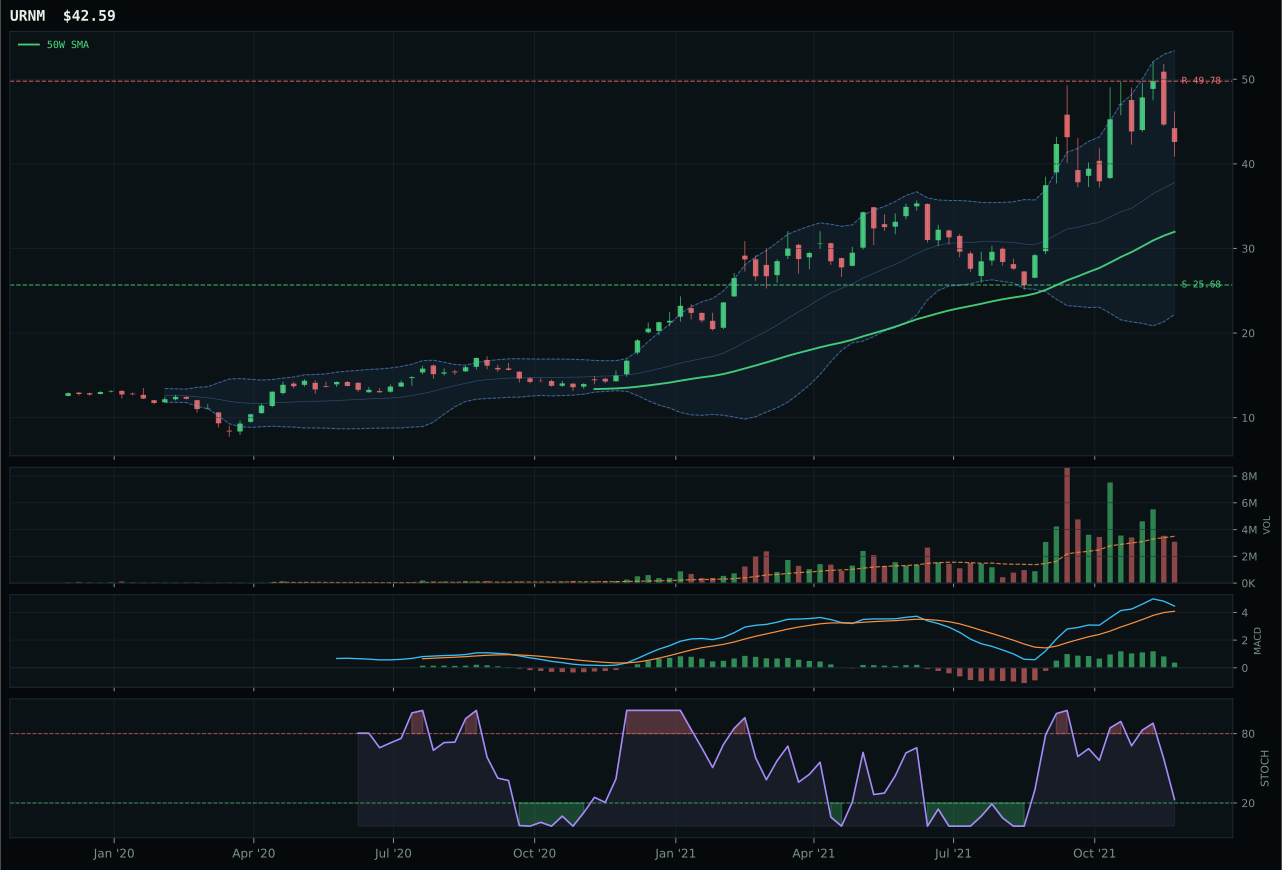
URNM has a vertical extension profile with 43.9% 13-week relative strength versus SPY.
A failed hold above support would weaken the setup.
Actionable but governed by invalidation levels.
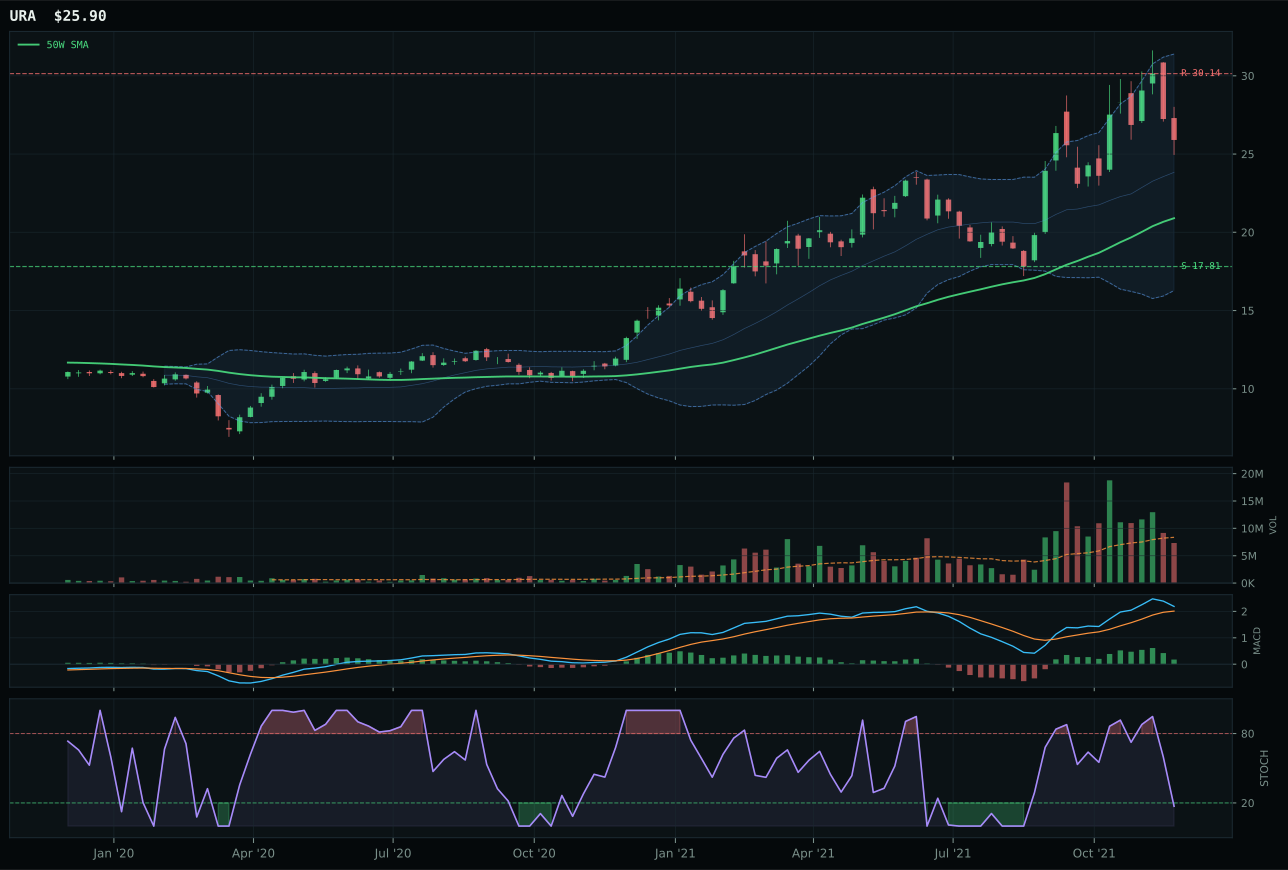
URA has a vertical extension profile with 28.7% 13-week relative strength versus SPY.
A failed hold above support would weaken the setup.
Actionable but governed by invalidation levels.
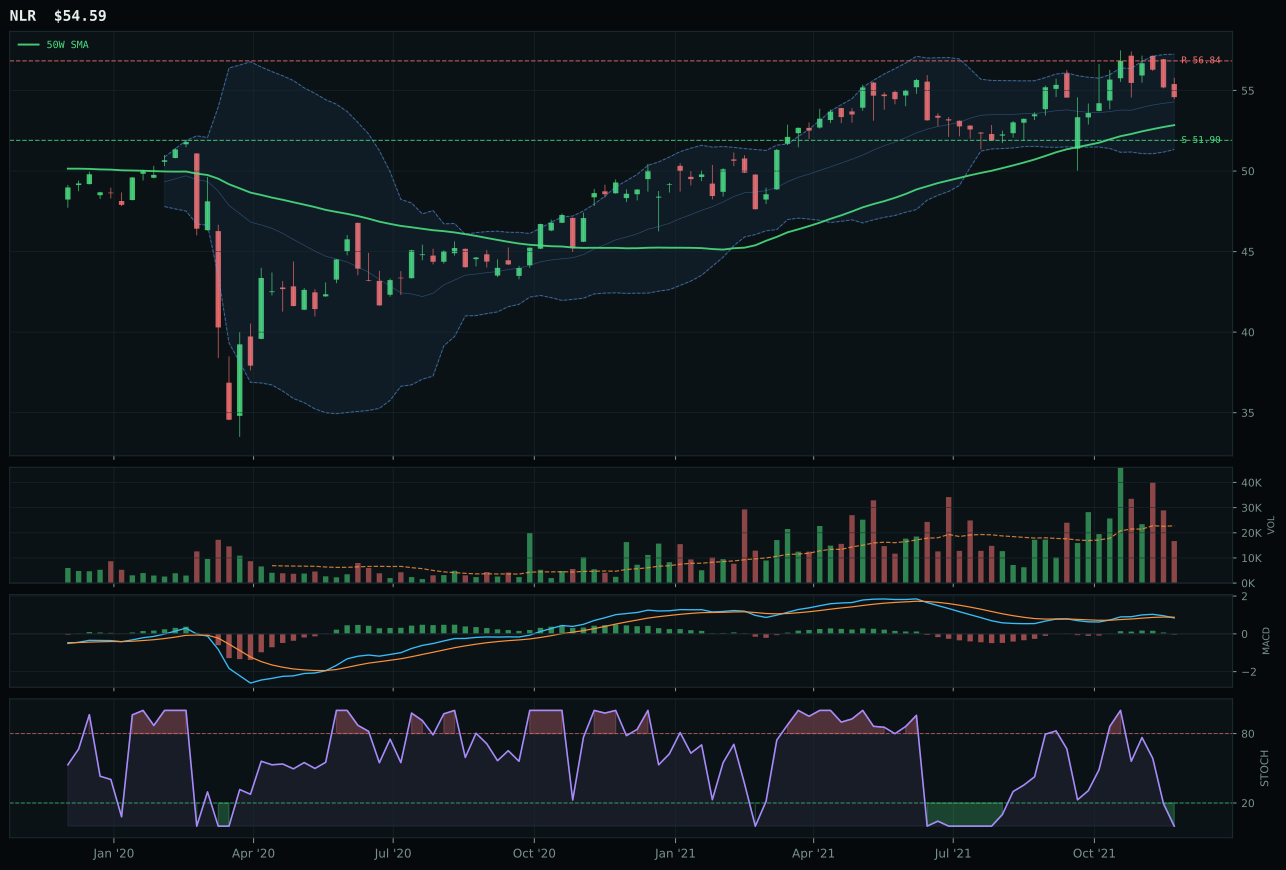
NLR has a neutral structure profile with 0.1% 13-week relative strength versus SPY.
A failed hold above support would weaken the setup.
Tracked, but not top-2 eligible because: .
URNM won Nuclear Energy despite being the more extended of the top two contenders because relative strength and momentum persistence are unambiguous: 43.9% outperformance versus SPY, 45.8% 13-week return, and 15.2% category-relative strength tell us that uranium-miner beta is receiving tactical flows that are not stopping. URA's momentum is equally strong at 28.7% versus SPY and 30.7% 13-week return, but URNM's category-relative strength of 15.2% versus URA's 0.0% means URNM is winning capital allocation within the basket. Both are extended at 33.2% and 28.7% above the 50-week respectively, and both trade in vertical structure with overbought stochastic RSI readings, so timing risk is symmetric. URNM's structure cleanliness at 58.3 versus URA's similar reading means the decision hinges on relative strength: buyers are choosing URNM's miner exposure over URA's broad uranium exposure, and that relative preference is the signal that breaks the tie.
Nuclear Energy took 5% at a 58.4 score and fifth-place rank, positioned in the category because macro fit reached 69% through energy-scarcity (+9), real-asset-sponsorship (+7), and AI-growth-sponsorship (+5) signals. Technical evidence scored only 63.4%, dragged down by poor risk-reward (34/100) and weak timing (48/100) stemming from URNM's 33.2% extension. This is an aggressive bet compressed into 5% precisely because entry timing is late and downside-to-support extends 65.8%. The allocation exists to capture uranium-supply scarcity within a real-asset regime without overweighting extension risk. URNM must hold support at 25.68 to remain viable; any penetration triggers 0% reallocation. The nuclear thesis—grid power, EV charging, AI data-center demands—remains intact, but it's subordinated to entry risk in this portfolio construction. If URNM consolidates and tightens its structure over 2–3 weeks, the 5% could expand to 10% as timing normalizes; currently, it's a token bet on a valid macro theme with poor entry geometry.
Utilities & Infrastructure — PAVE
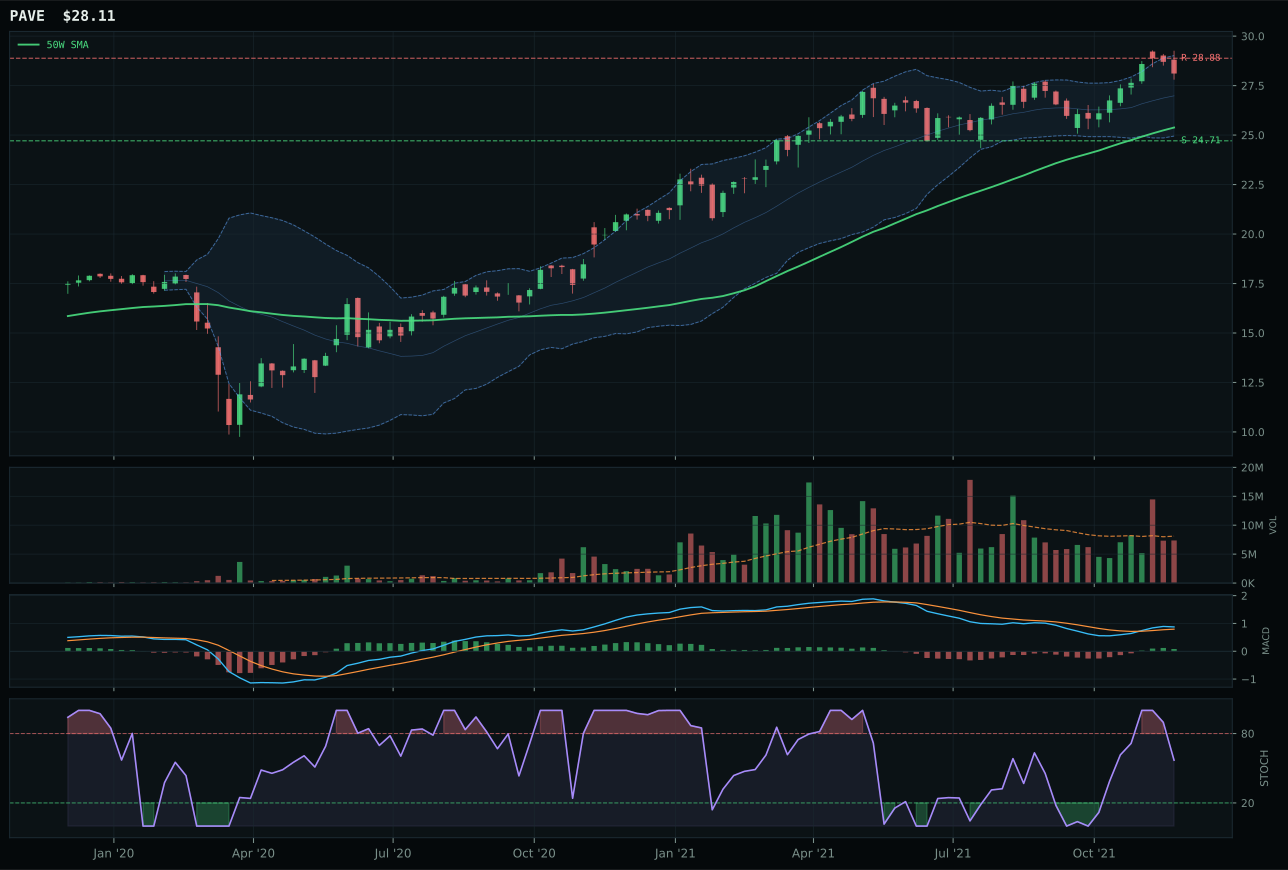
PAVE has a neutral structure profile with -0.1% 13-week relative strength versus SPY.
A failed hold above support would weaken the setup.
Actionable but governed by invalidation levels.
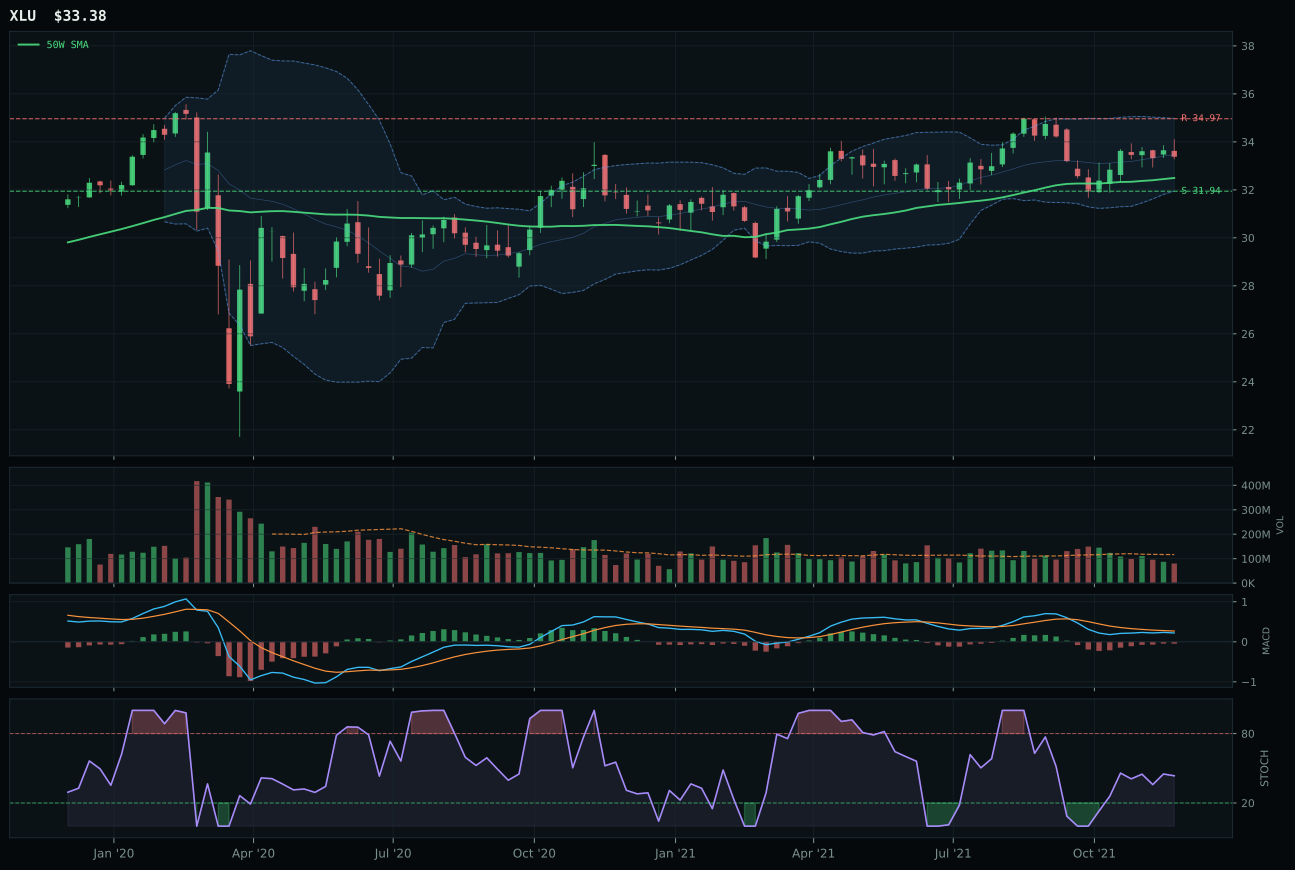
XLU has a pullback into support profile with -4.5% 13-week relative strength versus SPY.
A failed hold above support would weaken the setup.
Actionable but governed by invalidation levels.
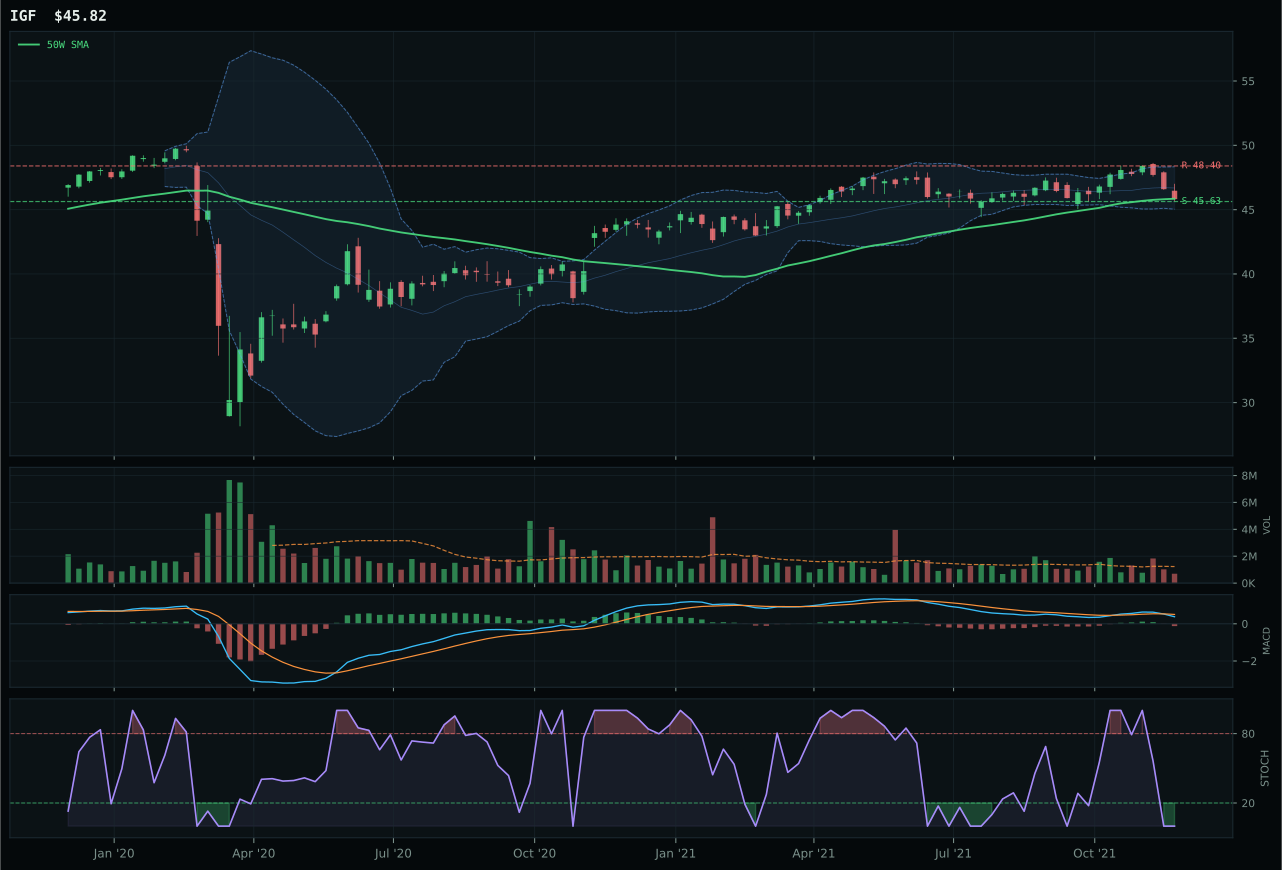
IGF has a pullback into support profile with -3.8% 13-week relative strength versus SPY.
A failed hold above support would weaken the setup.
Actionable but governed by invalidation levels.
PAVE won Utilities & Infrastructure decisively on structure quality and momentum, narrowly defeating XLU by just 1.0 points in the final category score but commanding on the technical case. PAVE is above both the 50-week and 200-week moving averages with a neutral structure that is neither extended nor compressed, and the MACD is bullish and improving with stochastic RSI falling into neutral—a much cleaner technical picture than XLU's pullback-into-support setup with bearish-but-improving MACD. PAVE's category-relative strength is 3.7% versus XLU's -0.7%, confirming that infrastructure capex narratives are preferred to regulated utility narratives. Volume confirmation for PAVE is neutral (0.91x normal) versus XLU's thin participation, and momentum confirmation is superior at 72.2 versus 36 for XLU. The 13-week returns are 1.8% for PAVE and -2.6% for XLU, a spread that tells us infrastructure is quietly accumulating while utilities are still deteriorating.
Utilities & Infrastructure earned 5% at a 52.6 score and seventh-place rank as a tactical hedge against inflation-pressure and broad-market-bear signals. Macro fit reached exactly 50%, perfectly balanced between supporting factors (commodity-breadth-positive, risk-appetite-positive) and headwinds (inflation-pressure, broad-market-bear). PAVE's 78.4% technical evidence score relied heavily on its perfect trend confirmation (99.9/100), but momentum contribution measured only 72.2/100 and risk-reward remained compressed at 48.5/100 due to minimal downside extension. This is a positioned bet on capex-driven infrastructure demand in an inflation-pressure environment, not a conviction growth play. The 5% slot captures regulated utility and infrastructure reflationary positioning without overweighting—if broad-market-bear deactivates or inflation-pressure signals fade, the allocation compresses to 0%. Conversely, if structural capex legislation accelerates through cycle, PAVE could expand toward 10%. Currently, it holds as portfolio insurance rather than alpha generation.
Precious Metals — GLD
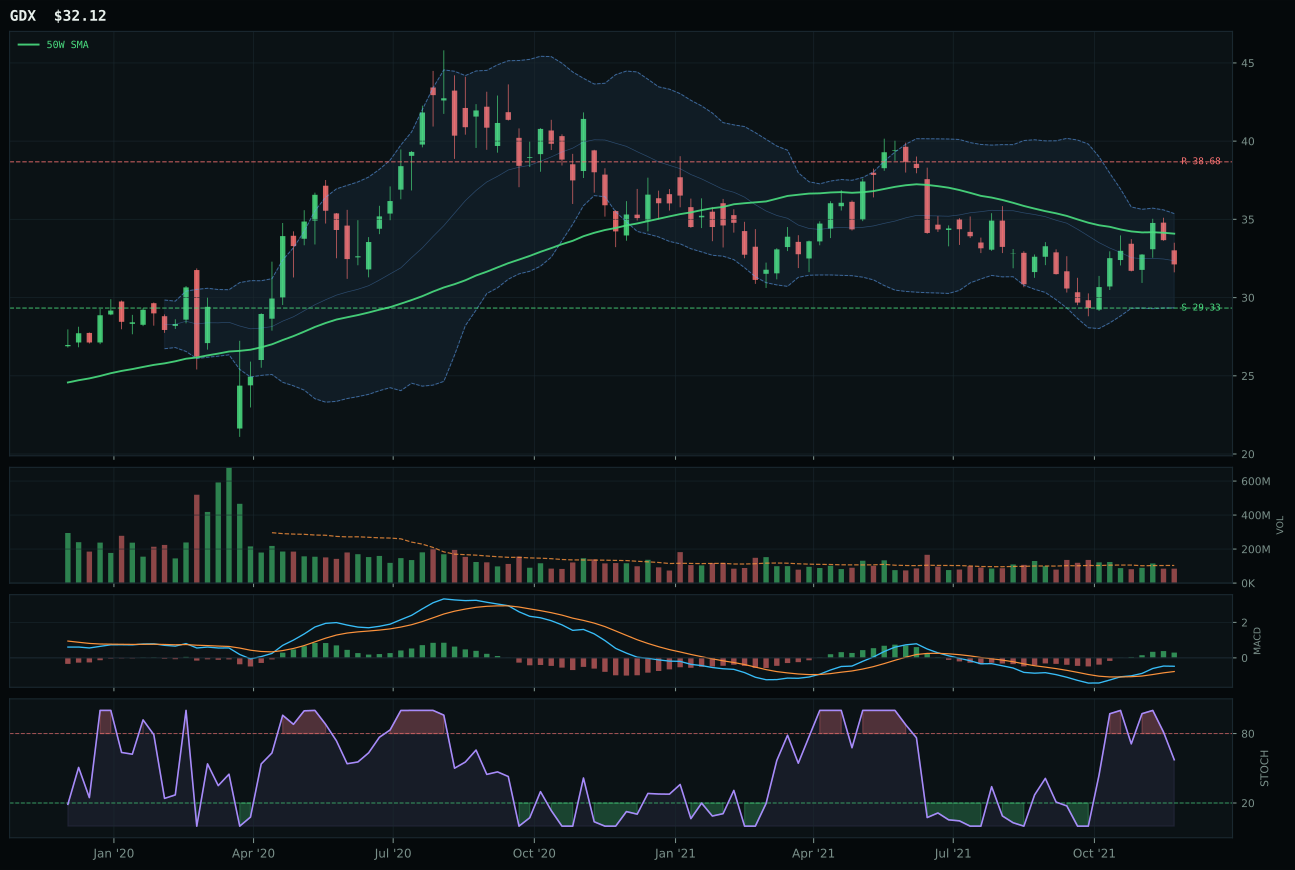
GDX has a neutral structure profile with -3.4% 13-week relative strength versus SPY.
A failed hold above support would weaken the setup.
Actionable but governed by invalidation levels.
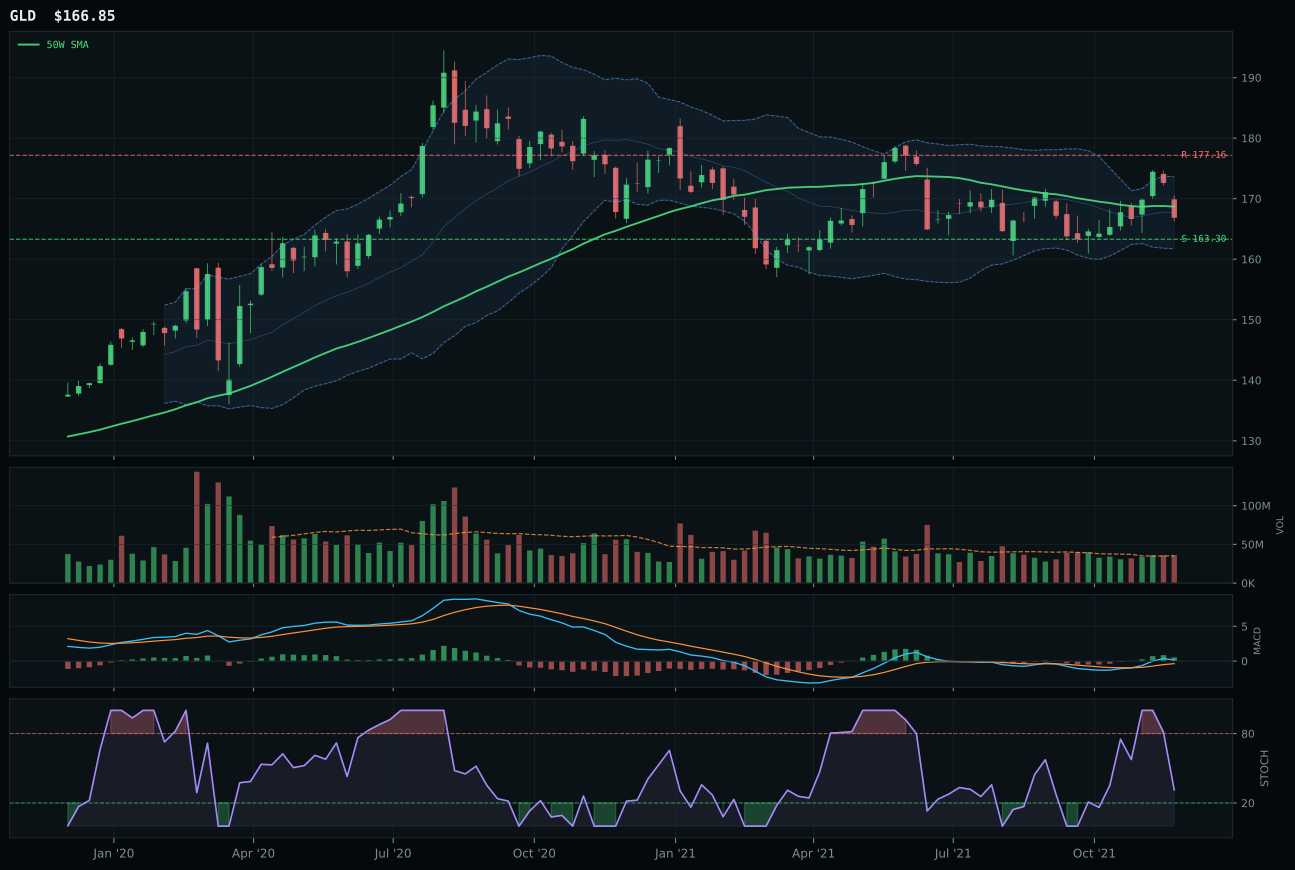
GLD has a pullback into support profile with -3.9% 13-week relative strength versus SPY.
A failed hold above support would weaken the setup.
Actionable but governed by invalidation levels.
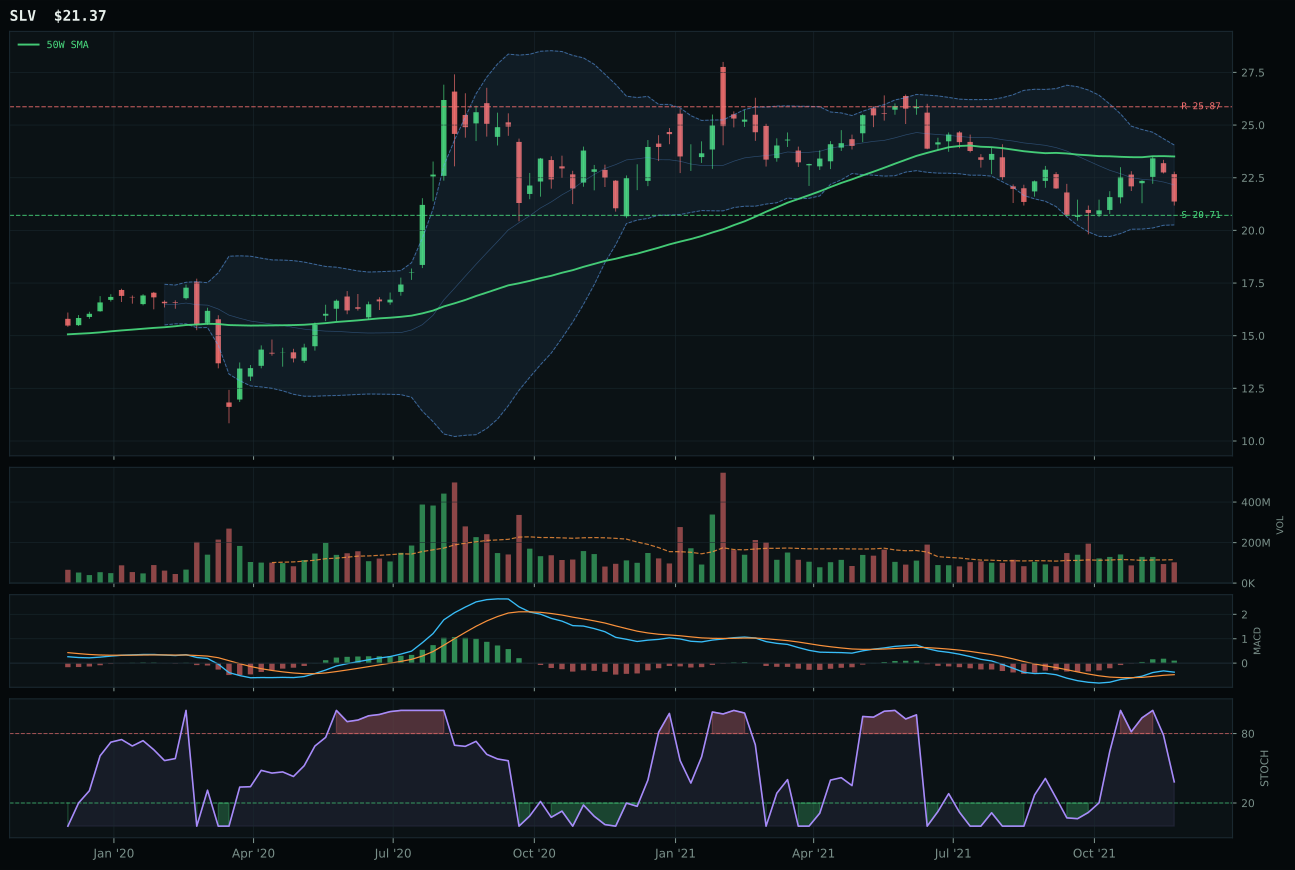
SLV has a pullback into support profile with -6.2% 13-week relative strength versus SPY.
A failed hold above support would weaken the setup.
Actionable but governed by invalidation levels.
GLD won Precious Metals by offering a superior risk/reward setup despite similar macro conditions to GDX. Both are below the 50-week moving average but above the 200-week, both have MACD bullish and improving, both are oversold on stochastic RSI—but GLD's timing score of 100.0 versus GDX's 82.0 reflects that GLD is sitting precisely at the pullback-into-support level, just -1.1% from the 50-week, while GDX is further away. GLD's risk/reward is 98.0 versus GDX's 85.1, meaning the upside-to-downside ratio is tighter and the invalidation point is more clearly defined. Structure cleanliness favors GLD at 70.7 versus 67.0, and the deep Fibonacci retracement at 0.618 for GLD versus deeper placement for GDX gives GLD a more defined bounce target. Volume is neutral for both, but GLD's cleaner structure means accumulation at the support level is more visible if it happens.
Precious Metals claims 5% despite a 51.1 score and sixth-place rank, allocated because macro fit delivered 48% and gold functions as a crisis-hedge asset in mixed regimes. The dollar-pressure signal is active (+2 points) but risk-appetite-positive is active with a larger negative weight (-4), creating a net hostile macro environment for metals. Technical evidence reached only 68.8%, pulled down by weak momentum (53.8/100) and neutral volume—no institutional accumulation story here. The portfolio holds GLD as insurance against credit-stress escalation or liquidity-expansion reversal; it's not a conviction bet. GLD's 98/100 risk-reward and tight support at 163.30 mean the downside is defined at 2.2%, making this a low-cost hedge against regime shifts. If credit stress deactivates or dollar strength extends, the 5% slot converts to 0% immediately. Conversely, if liquidity expansion shows cracks or broad market bear reactivates, GLD could expand to 10% as a genuine portfolio stabilizer.
Agriculture & Livestock — MOO
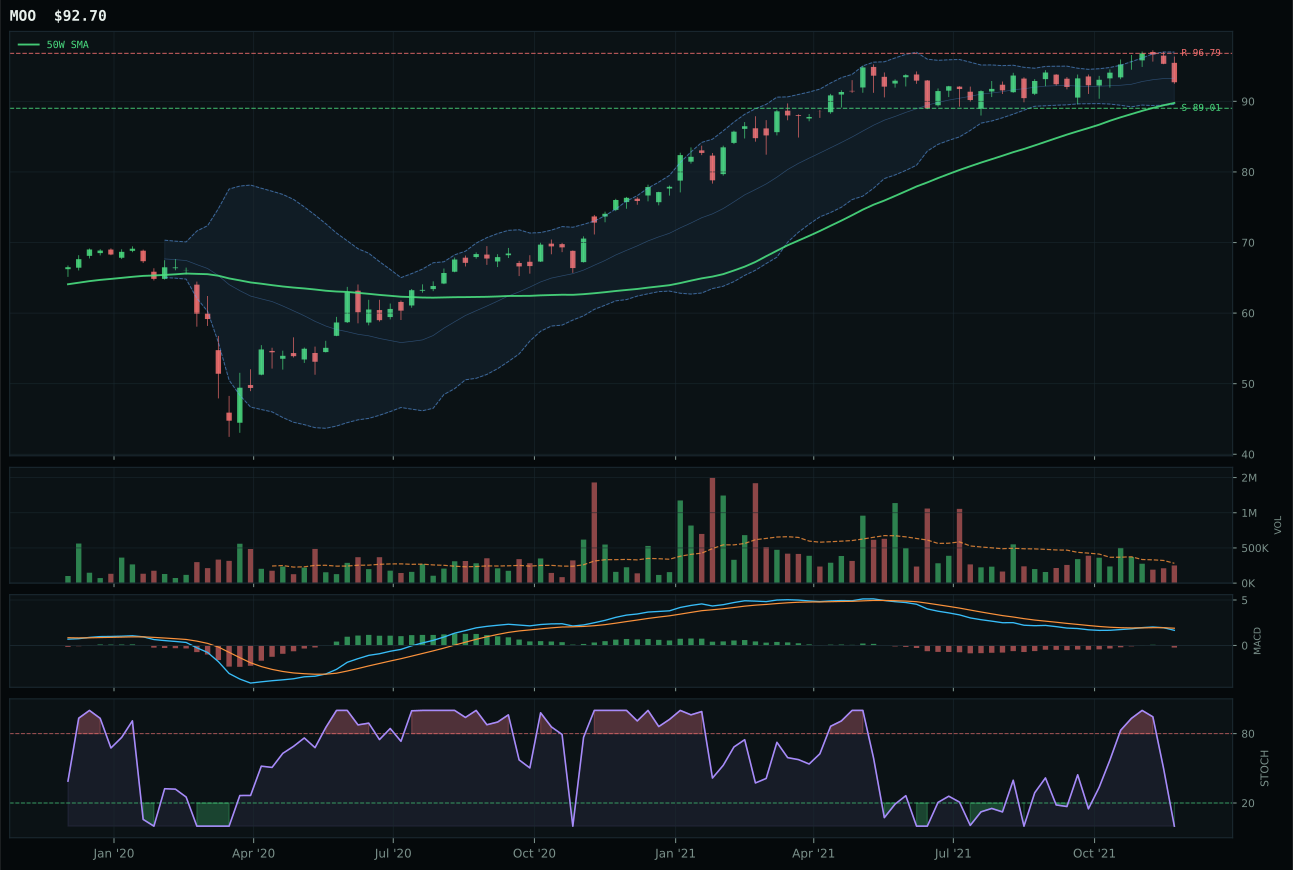
MOO has a pullback into support profile with -2.1% 13-week relative strength versus SPY.
A failed hold above support would weaken the setup.
Actionable but governed by invalidation levels.
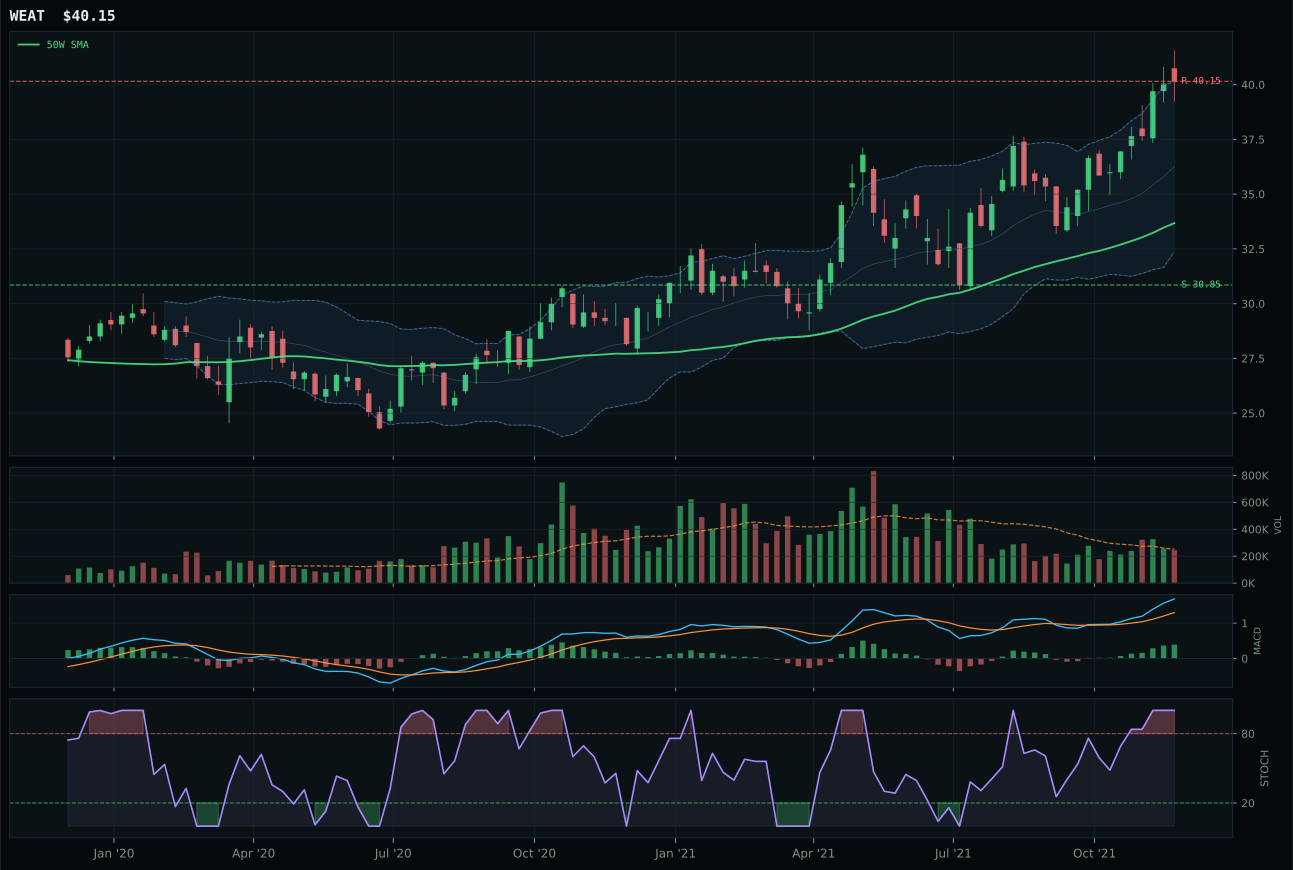
WEAT has a vertical extension profile with 10.8% 13-week relative strength versus SPY.
A failed hold above support would weaken the setup.
Tracked, but not top-2 eligible because: .
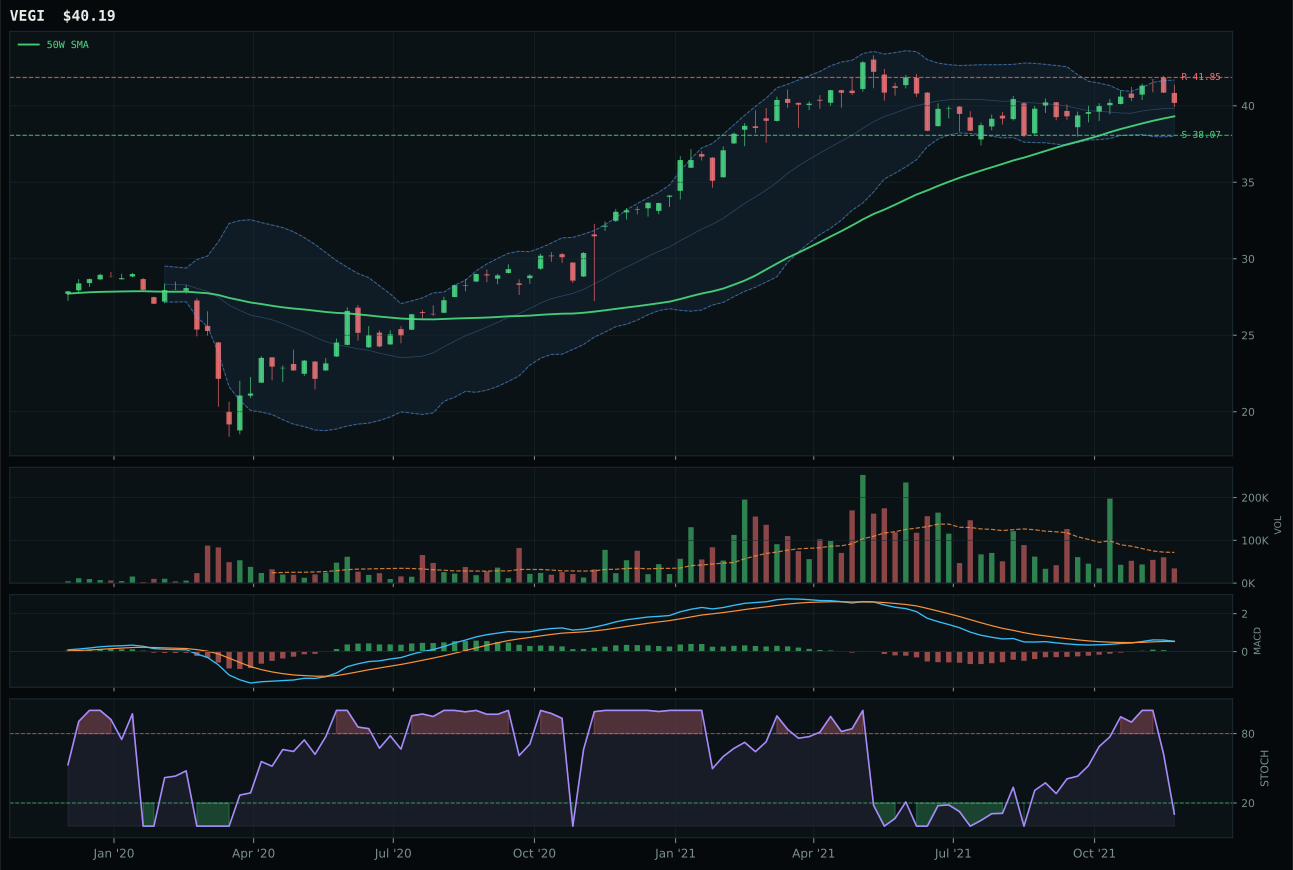
VEGI has a compression near 50W profile with -1.0% 13-week relative strength versus SPY.
A failed hold above support would weaken the setup.
Tracked, but not top-2 eligible because: .
MOO won Agriculture because the pullback-into-support setup is sharper and safer than WEAT's extended vertical move. MOO is only 3.3% above the 50-week moving average with support defined at 89.01, whereas WEAT is stretched 19.2% above its 50-week and sitting in overbought stochastic territory at the edge of a distribution risk. MOO's timing score of 95.0 reflects the mechanical edge: MACD is bearish/weakening, stochastic RSI is oversold at 0.00, and price is sitting in the upper Fibonacci retracement zone, all signals that a rest or pullback would be natural. WEAT's momentum is still strong at 13-week return of 12.8%, but that makes it late to the party, not early. Risk/reward for MOO is 63.4 (upside limited, downside protected), versus WEAT's 49.8 (upside potentially more generous but downside uncapped). The category-relative strength favors WEAT at 11.8%, but category-relative strength is a trailing indicator of momentum already captured, not a forward signal.
Agriculture earned 5% despite a 50.5 category score and seventh-place rank, selected because the macro fit was exceptional at 86%, driven by active supply-shortage (+13), inflation-pressure (+10), and real-asset-sponsorship (+8) signals. Technical evidence languished at 37.5/100 due to weak momentum and neutral volume, but macro superiority created a portfolio hedging case: commodity breadth remains positive, and farm inputs show genuine scarcity pressures unrelated to equities pricing. MOO's tight support at 89.01 with just 4.1% downside provided defined risk, making this a macro bet with tactical guardrails rather than a technical conviction. The 5% slot exists to capture inflation protection in a real-asset sponsorship regime; if inflation pressure deactivates or supply-shortage signals reverse, this allocation becomes indefensible. WEAT's vertical extension and overbought momentum would require a pullback of 12–15% before earning consideration here, confirming that entry timing trumps recent performance in this category.
Industrial Metals — COPX
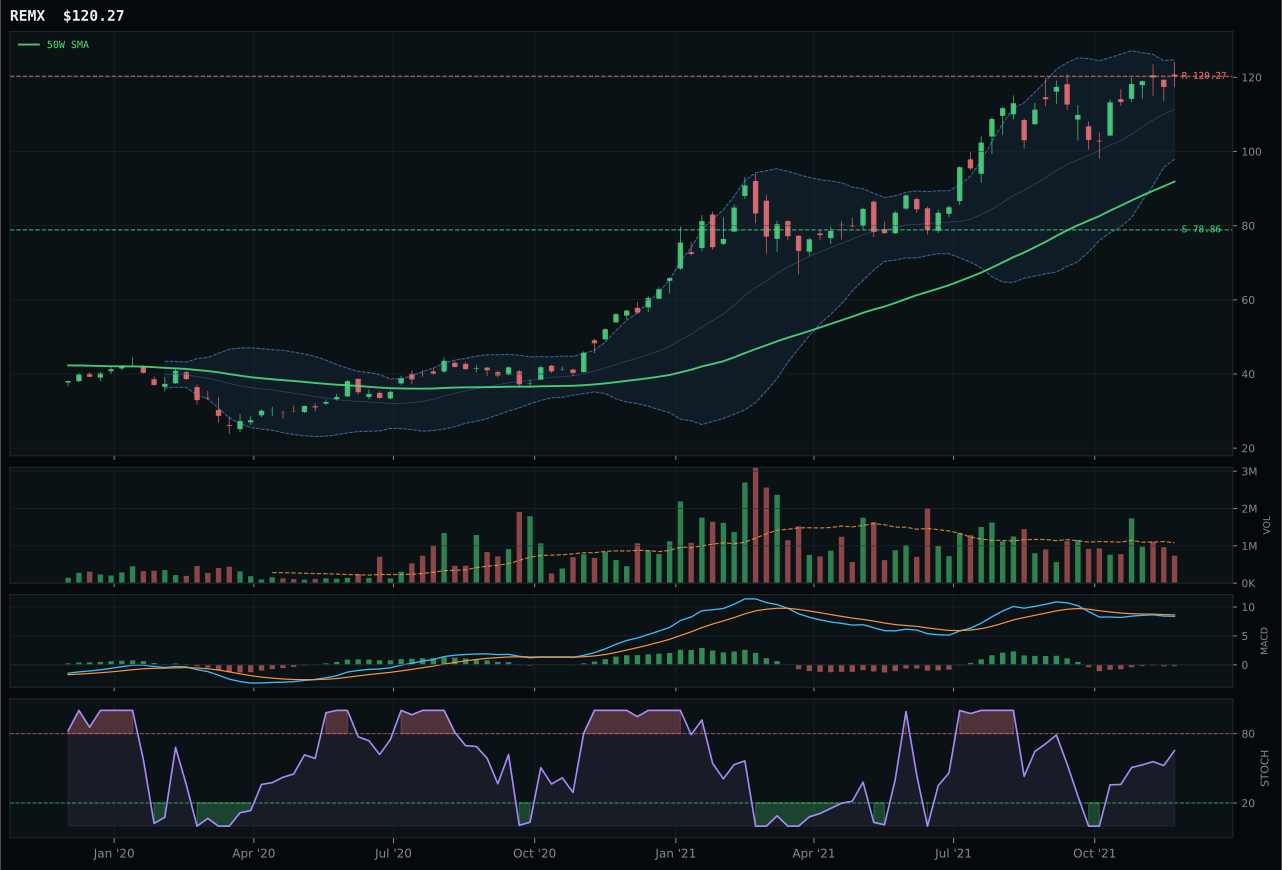
REMX has a vertical extension profile with 6.2% 13-week relative strength versus SPY.
A failed hold above support would weaken the setup.
Actionable but governed by invalidation levels.
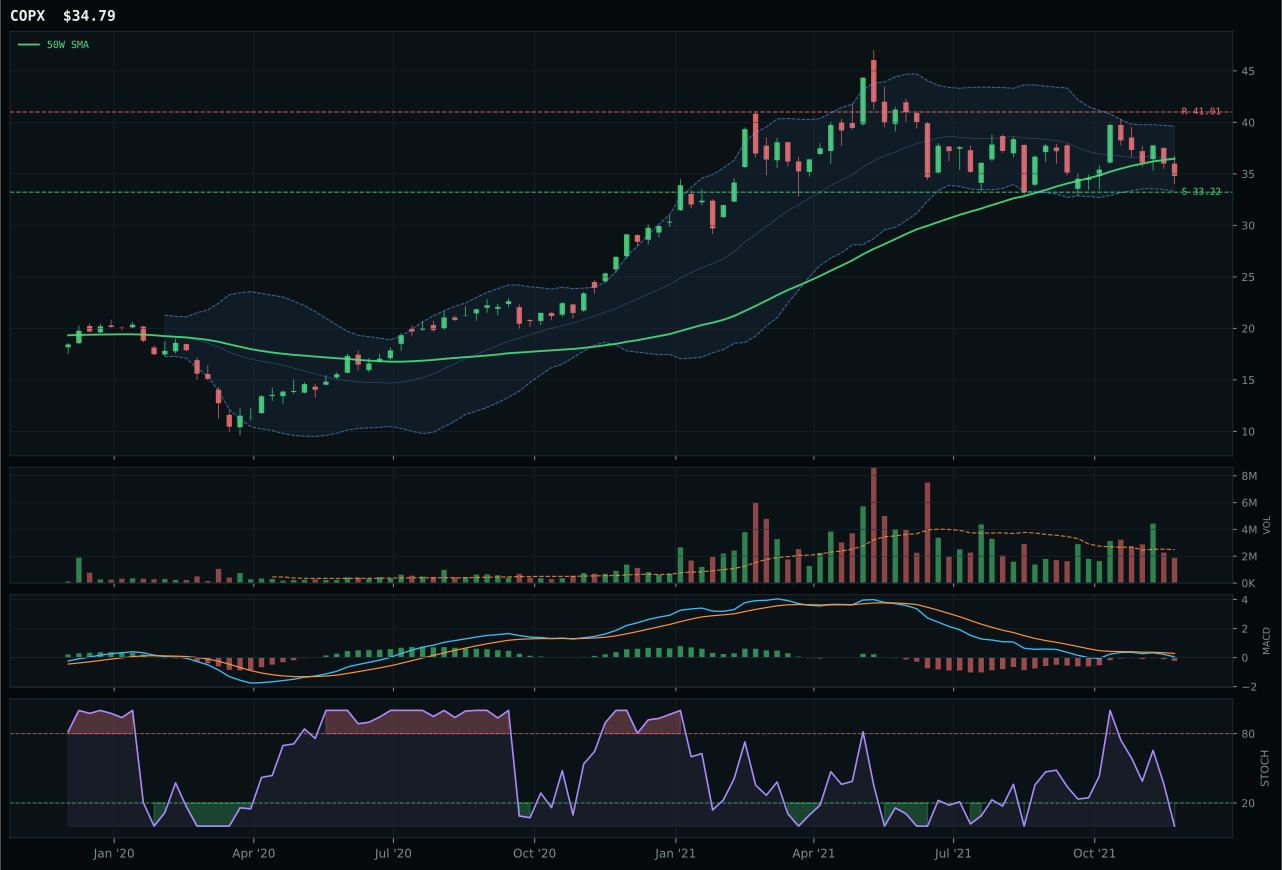
COPX has a pullback into support profile with -7.1% 13-week relative strength versus SPY.
A failed hold above support would weaken the setup.
Actionable but governed by invalidation levels.
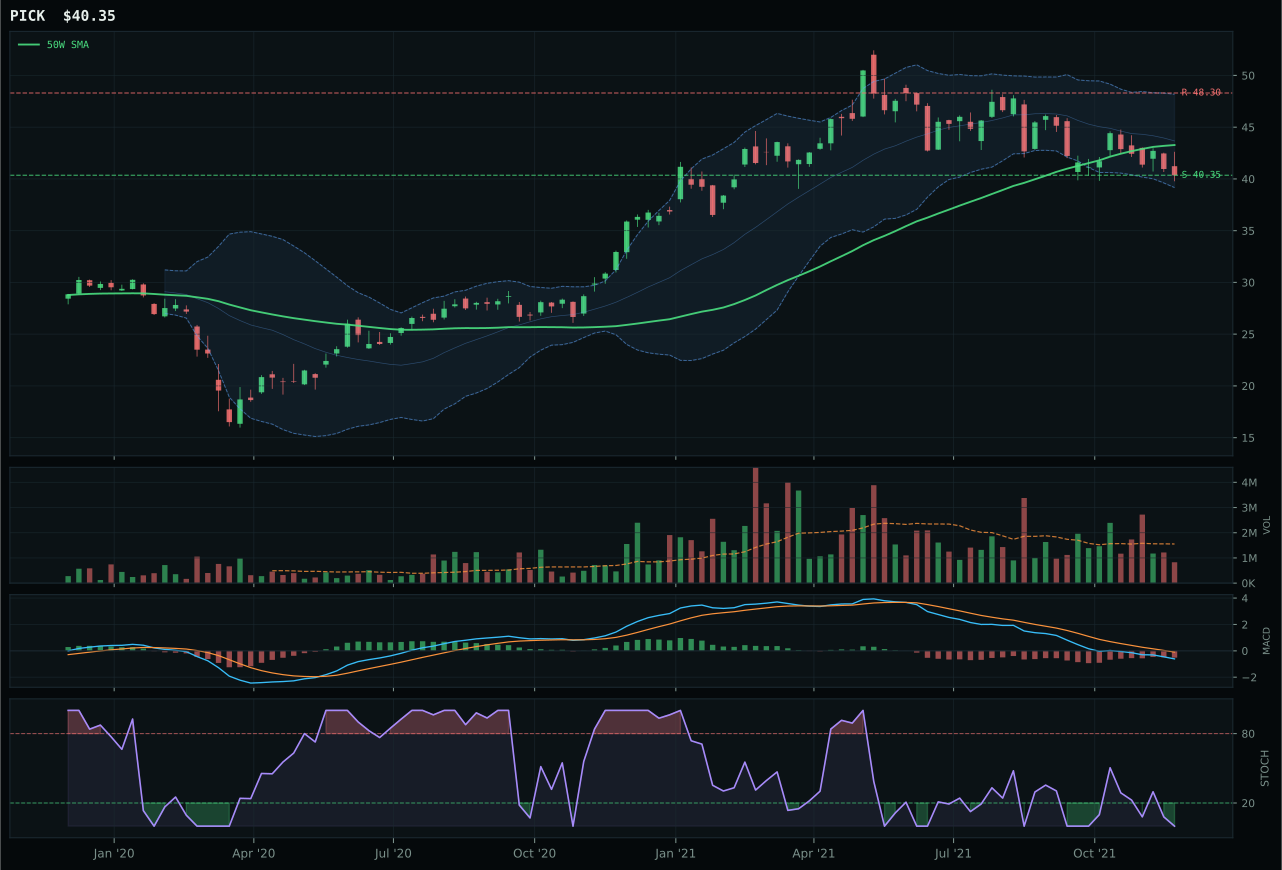
PICK has a pullback into support profile with -13.2% 13-week relative strength versus SPY.
A failed hold above support would weaken the setup.
Actionable but governed by invalidation levels.
COPX won Industrial Metals on technical merit despite its weak momentum reading of 7.2/100, because the risk/reward structure is objectively superior to REMX's stretched setup. COPX is -4.6% from the 50-week moving average, sitting at support level 33.22 with Fibonacci 0.618 nearby, meaning the downside buffer is well-defined at 4.7% and the upside potential, while limited, is not being punished by overextension. REMX, by contrast, is extended 30.9% above the 50-week in vertical structure, overbought on momentum at 88, and sitting in thin volume with stochastic RSI rising into mid-zone—a setup that signals the move is tiring. COPX's timing score of 100.0 versus REMX's 53.0 reflects that pullback-into-support offers better entry mechanics than vertical extension. Volume confirmation favors COPX (neutral at 75% of normal) over REMX (thin participation), and MACD is deteriorating for both, but COPX's bearish/weakening confirmation is less dangerous at a support level than REMX's bearish-but-improving confirmation during an extension.
Industrial Metals received 5% at a 47.0 score and eighth-place rank because macro fit at 66% carried significant weight: metals scarcity (+14), commodity breadth positive (+10), and real-asset sponsorship (+6) created legitimate hedging logic. Technical evidence bottomed at 34.5/100 for the winning representative, the lowest among all category winners this week, yet the portfolio required exposure to commodity-complex dislocations. COPX's perfect timing and 98/100 risk-reward offset weak momentum because the setup offered defined invalidation. Dollar pressure and credit stress both trim 7 points each from macro fit, rendering this a contested category where conviction remains low. The 5% allocation persists because scarcity signals remain active and the industrial-demand thesis—EV supply chains, grid infrastructure—retains credibility. This slot would convert to 0% if metals-scarcity descriptor deactivates or COPX breaks support at 33.22 without recovery; it would expand to 10% only if technical evidence can improve through accumulation pressure and macro fit stays robust. Currently, it's a positioned hedge rather than a growth bet.
AI — SMH
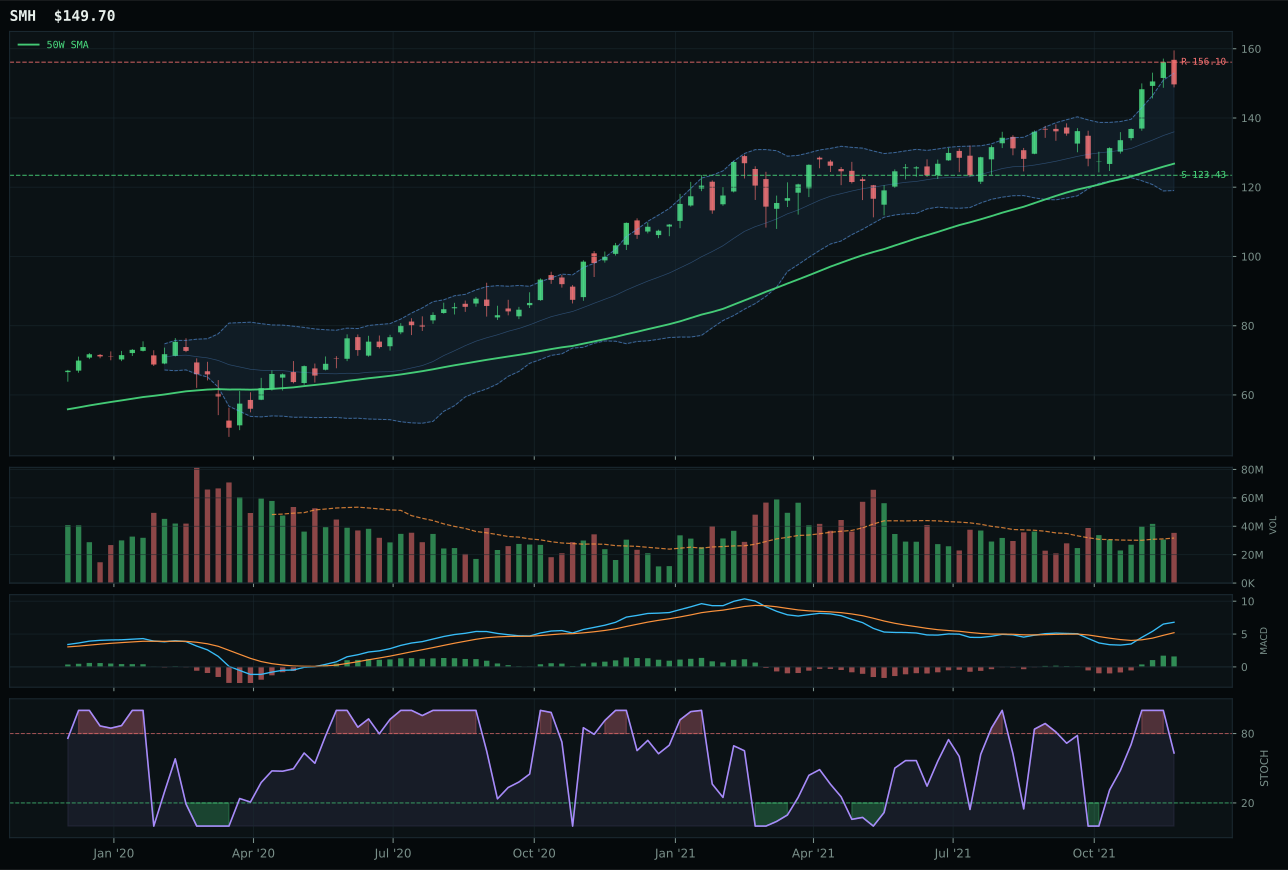
SMH has a vertical extension profile with 8.1% 13-week relative strength versus SPY.
A failed hold above support would weaken the setup.
Actionable but governed by invalidation levels.
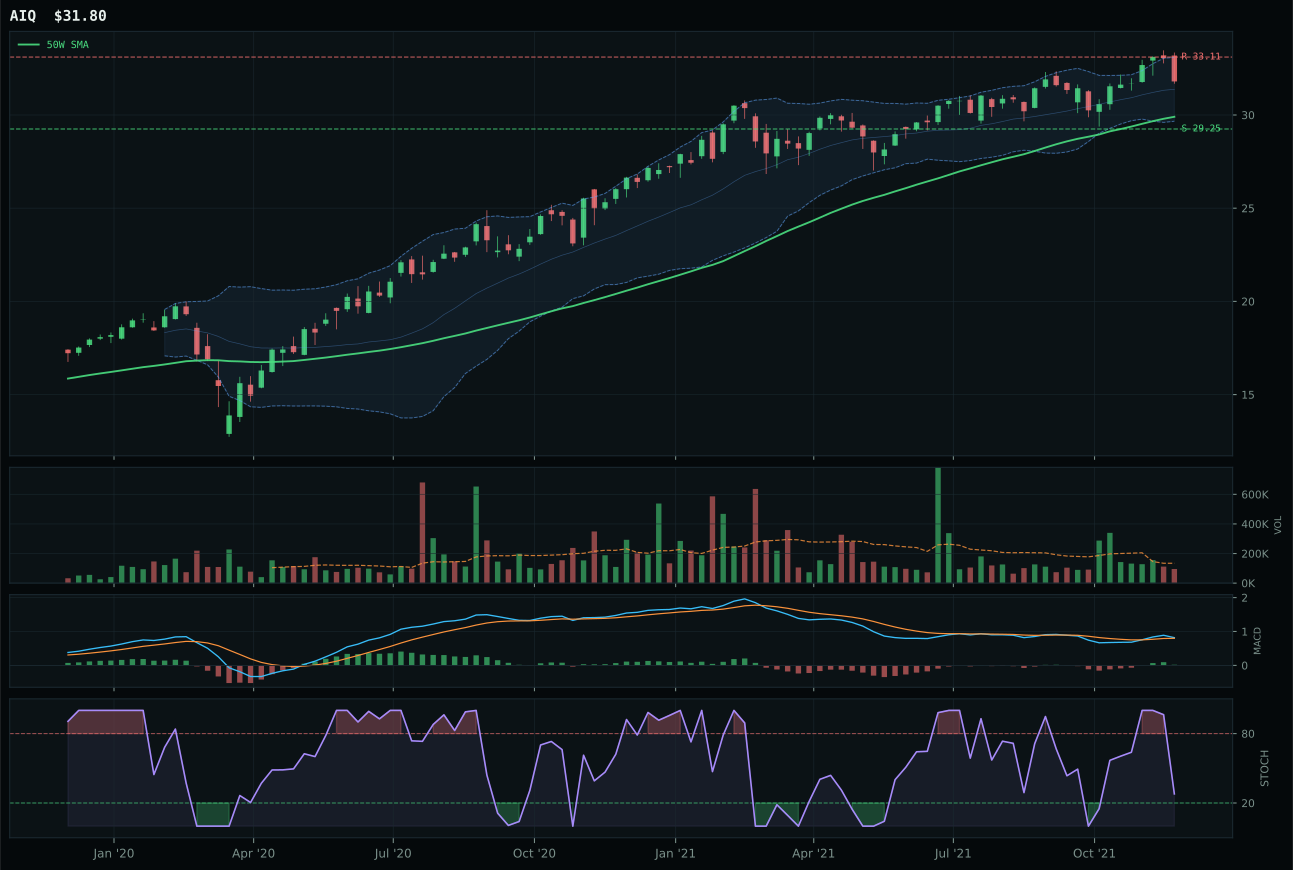
AIQ has a neutral structure profile with -0.8% 13-week relative strength versus SPY.
A failed hold above support would weaken the setup.
Tracked, but not top-2 eligible because: .
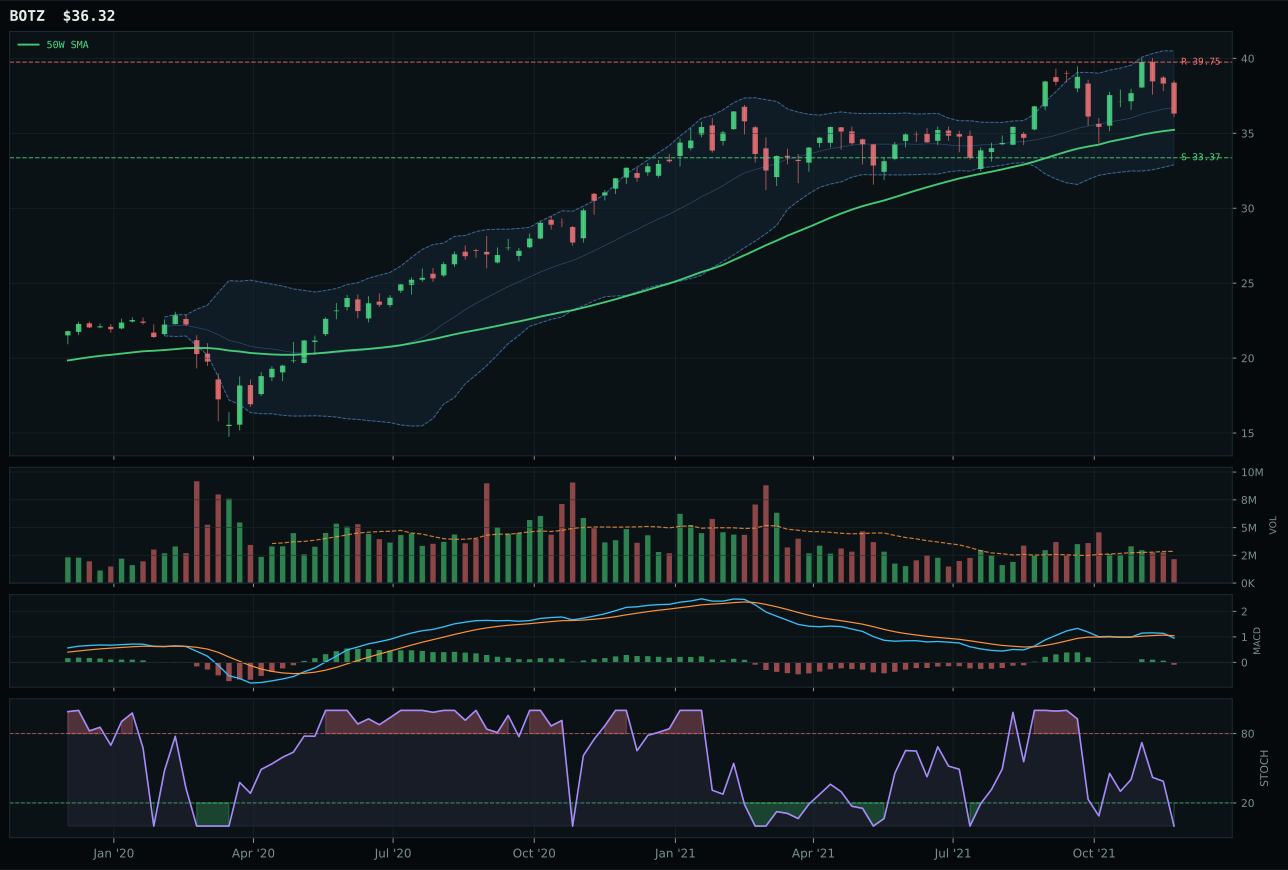
BOTZ has a neutral structure profile with -3.2% 13-week relative strength versus SPY.
A failed hold above support would weaken the setup.
Actionable but governed by invalidation levels.
SMH won AI because semiconductor strength is both real and persistent, with 10.1% 13-week returns and 8.9% category-relative strength confirming that compute infrastructure is being accumulated even as the board is extended 18.1% above the 50-week moving average. AIQ lost decisively because it trades on ai software breadth, which is not converting to actual flows—the 13-week return is 1.2%, the 50-week slope is barely positive, and volume participation is thin, meaning buyers of AIQ are thin on the ground. SMH's MACD is bullish and improving with stochastic RSI falling into neutral territory at 0.63, a setup that signals momentum without overextension; the structure is vertical but still disciplined. The 8.1% outperformance versus SPY, combined with above-average volume participation, tells us that professional capital is rotating into the hardware layer rather than the software hype layer.
AI earned 5% despite a category score of only 42.2, ranking it seventh overall—a position that normally earns zero allocation, but this week's construction demanded exposure to the AI growth sponsorship signal even if the category's technical evidence was fragile. The macro fit hit 64% (driven by +14 for AI growth), but technical evidence collapsed to just 62% once the reasoner penalized SMH's extended 33.2% stretch above the 50W and weak risk-reward. The portfolio currently carries ALT-season risk appetite, and refusing all exposure to AI compute when broad market bear is active would create hedging gaps if sentiment swings. SMH's 45.8% 13-week return demonstrates the alpha generation, but entry risk remains material. The 5% slot holds as a positioned bet rather than a high-conviction entry; if SMH closes below support at 123.43 or category macro fit erodes further, this allocation moves to zero immediately.
Defense & Aerospace — XAR
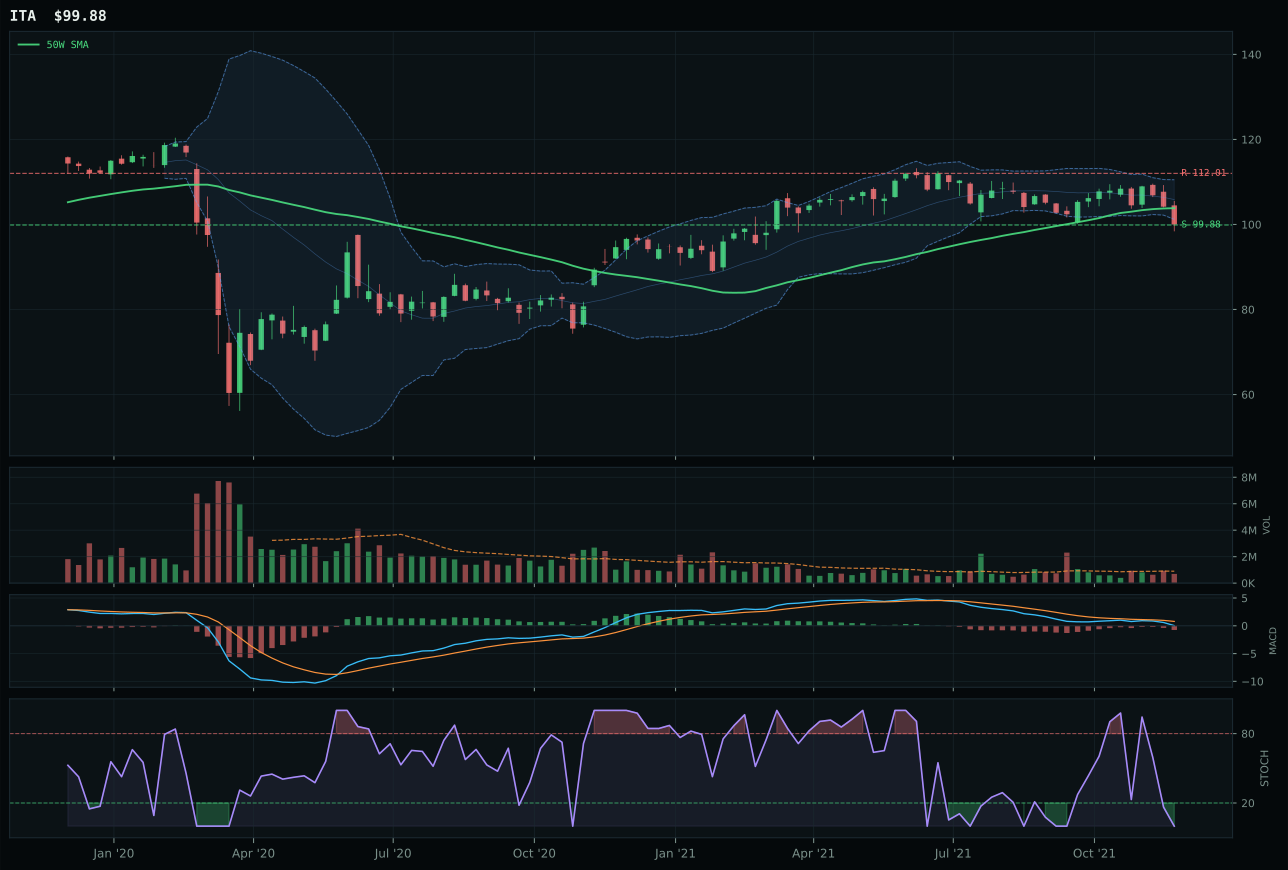
ITA has a pullback into support profile with -8.3% 13-week relative strength versus SPY.
A failed hold above support would weaken the setup.
Actionable but governed by invalidation levels.
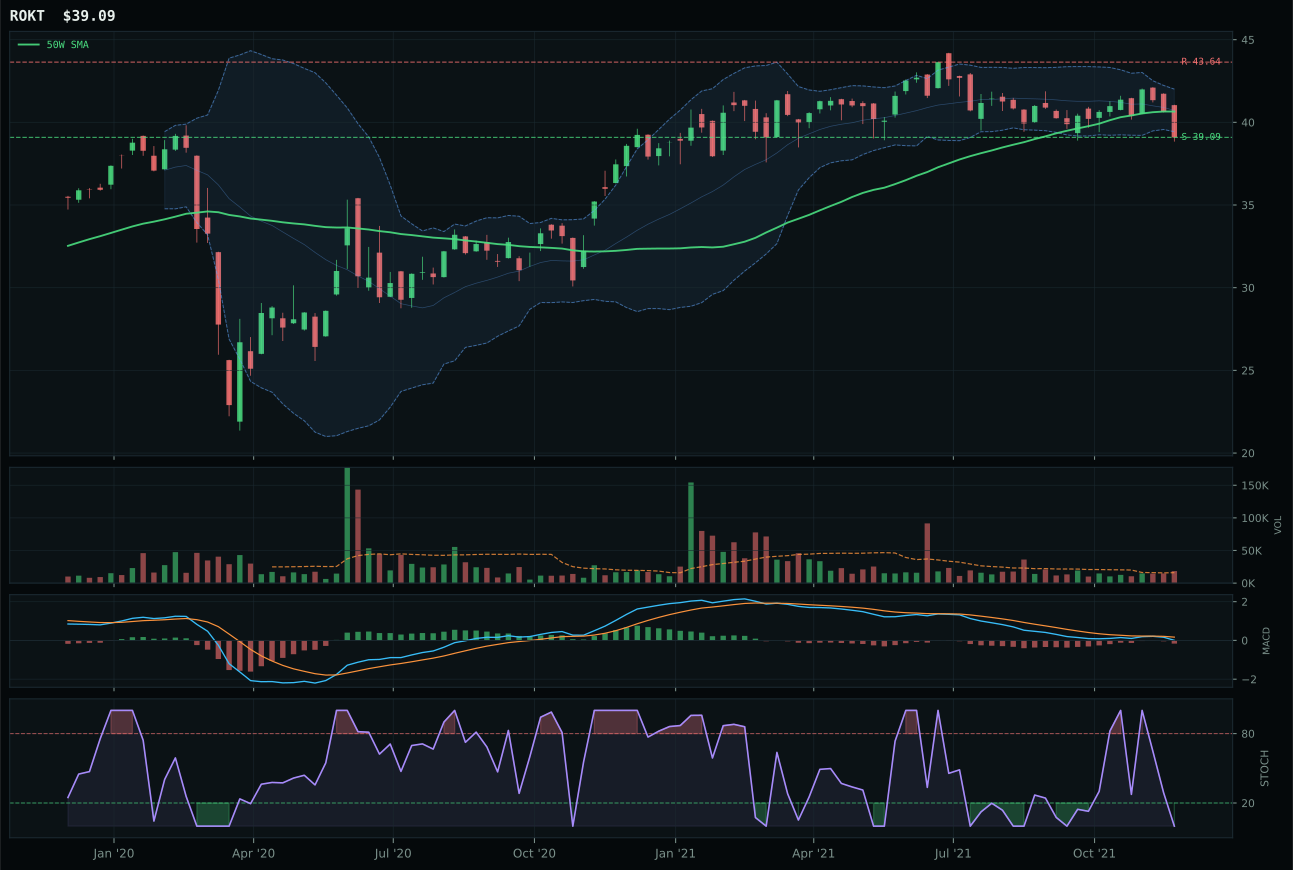
ROKT has a pullback into support profile with -6.6% 13-week relative strength versus SPY.
A failed hold above support would weaken the setup.
Tracked, but not top-2 eligible because: .
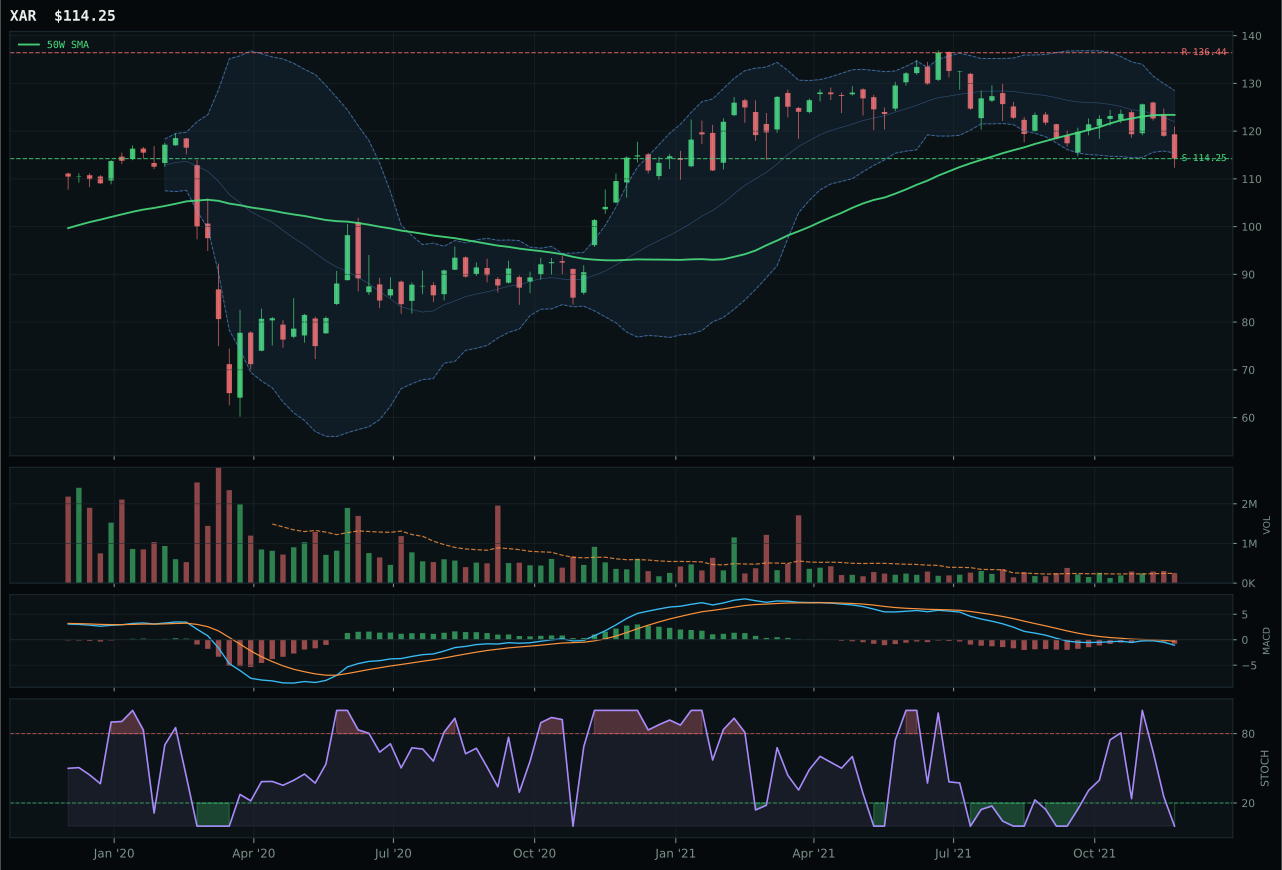
XAR has a pullback into support profile with -9.3% 13-week relative strength versus SPY.
A failed hold above support would weaken the setup.
Actionable but governed by invalidation levels.
XAR won Defense because the setup is cleaner than ITA on the pullback-into-support mechanics: both are below the 50-week moving average with oversold stochastic RSI readings, but XAR's risk/reward math is vastly superior at 89.6 versus ITA's 77.4. XAR is -7.4% from the 50-week and sitting 0.0% downside to support at 114.25, meaning the invalidation point is precisely defined and the bet is entirely on whether that level holds. ITA is further from support at -6.4% from the 50-week, giving buyers less margin of safety. Both names are deteriorating on MACD and momentum, with 13-week returns deeply negative, but XAR's timing score of 87.0 reflects that the oversold stochastic RSI and deep Fibonacci retracement create the technical conditions for a value retest if the sector rotates. Volume at neutral participation across both names suggests accumulation is not yet visible, which is why neither trades with conviction.
Defense & Aerospace receives 0% allocation and ranks outside the portfolio entirely this week. The category's final score of 35.6 placed it ninth, barely above Emerging Markets' catastrophic 9.0, driven by a technical evidence base of only 5.2/100 for the winning representative and weak macro fit at 64%. Broad market bear sentiment penalizes defensive names when liquidity conditions tighten, and XAR's -7.4% 13-week return paired with neutral volume created no compelling reason to override that macro backdrop. The setup offered value-zone timing (87/100) and 89.6 risk-reward, the classic characteristics of a mean-reversion trap—attractive only if catalysts exist to revalue the sector. No category-specific macro descriptor supported defense leadership; the general macro state remained mixed, offering no structural tailwind. For this category to earn reallocation, either the broad market bear descriptor would need to deactivate, the technical setup would need to show genuine accumulation pressure, or a geopolitical shock would need to activate real defense demand. None of those conditions obtained.
Emerging Markets — INDA
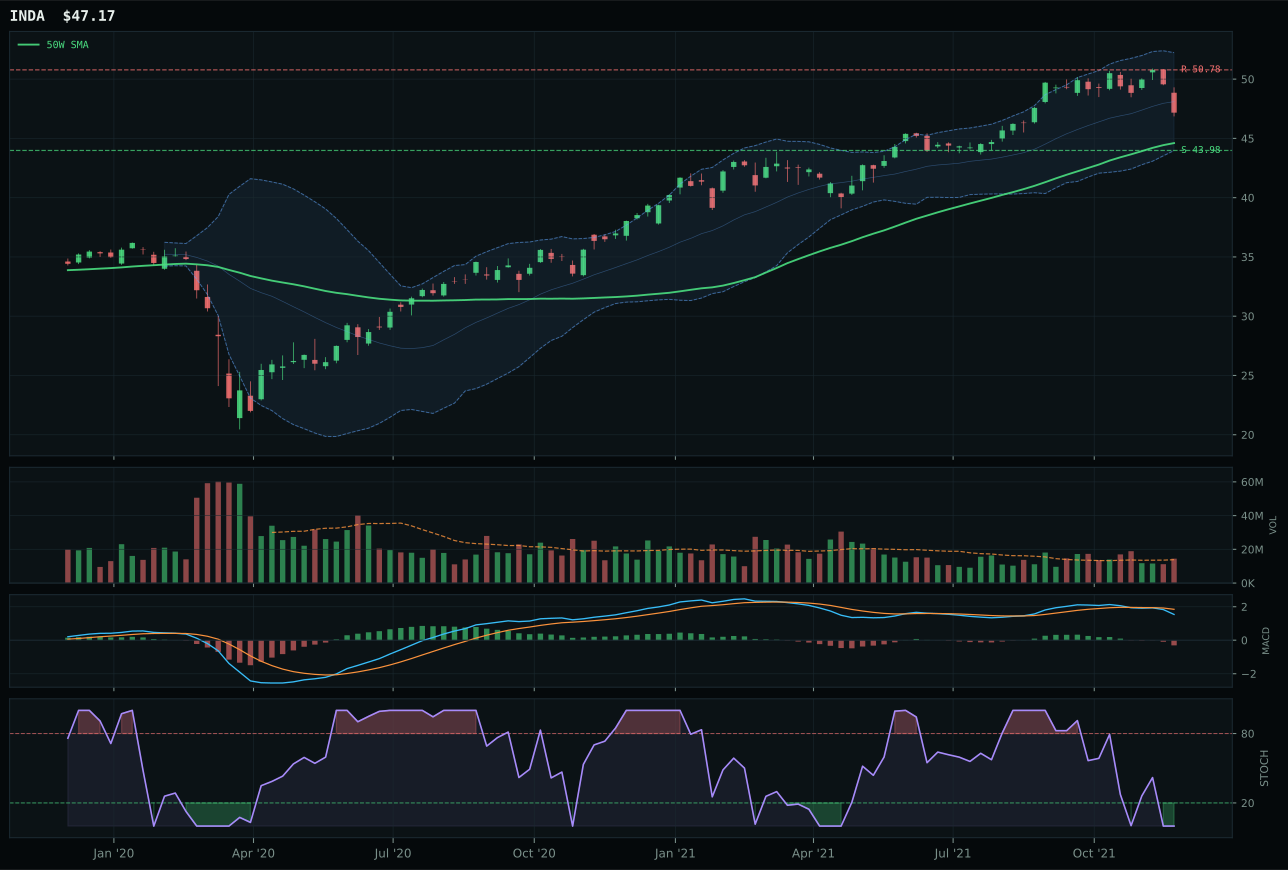
INDA has a neutral structure profile with -2.8% 13-week relative strength versus SPY.
A failed hold above support would weaken the setup.
Actionable but governed by invalidation levels.
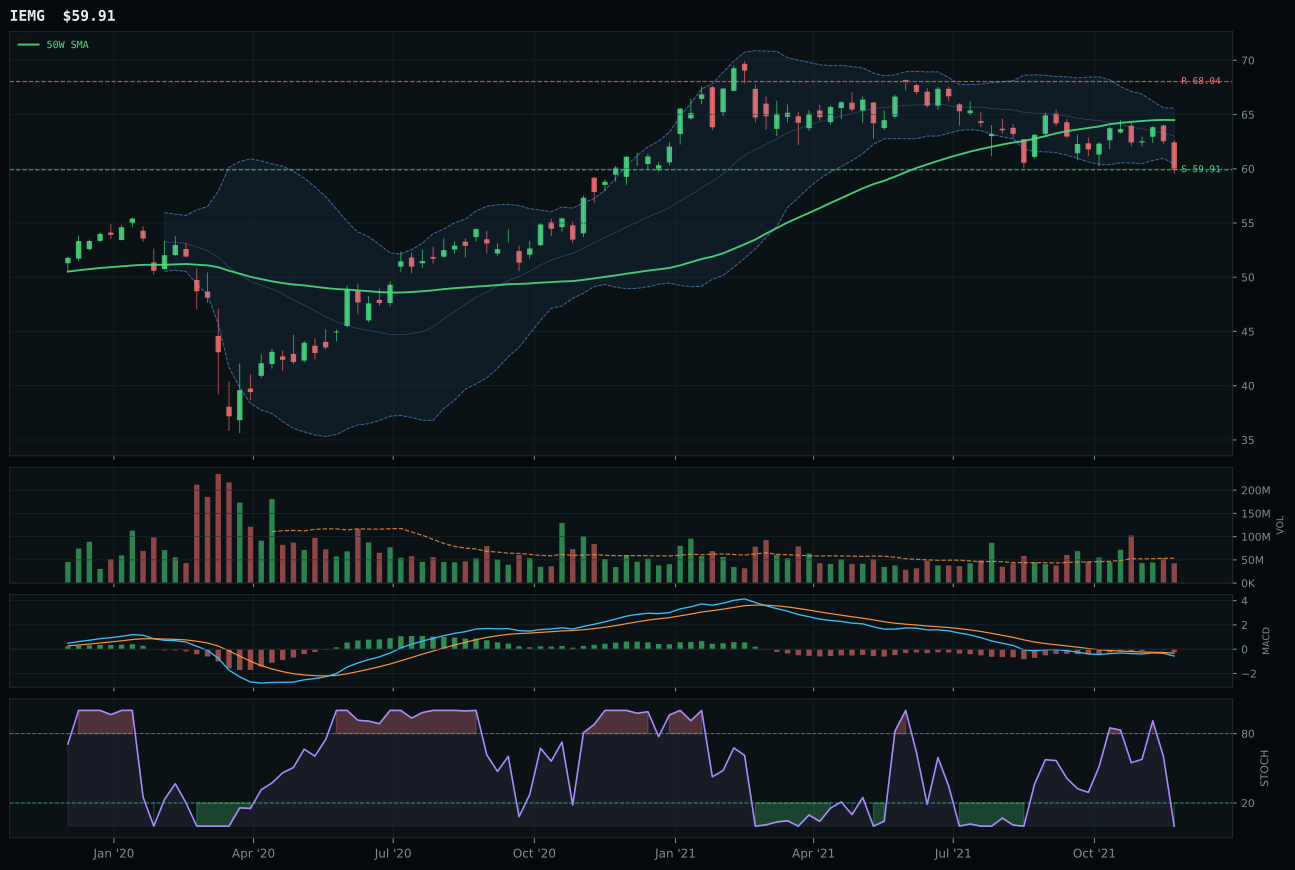
IEMG has a pullback into support profile with -7.0% 13-week relative strength versus SPY.
A failed hold above support would weaken the setup.
Actionable but governed by invalidation levels.
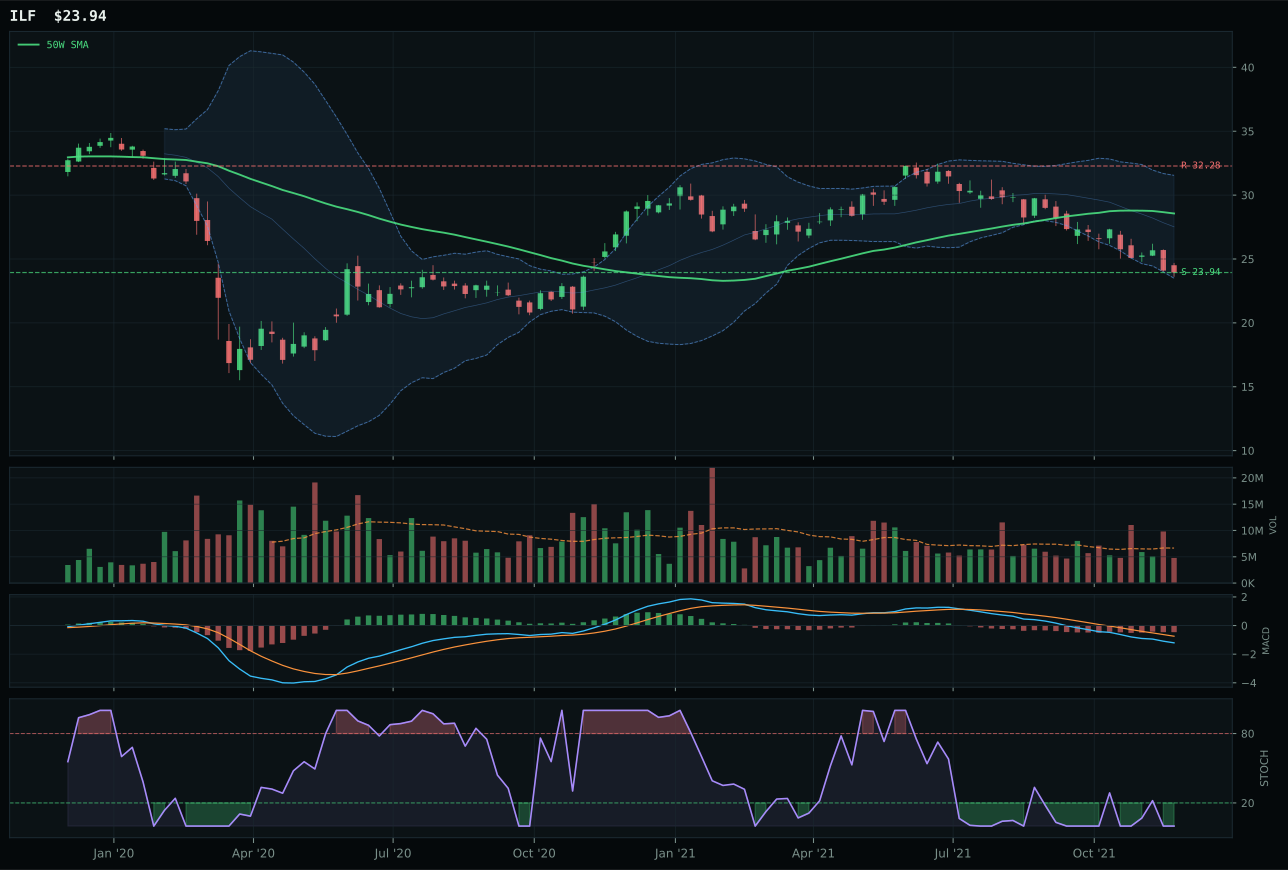
ILF has a pullback into support profile with -21.5% 13-week relative strength versus SPY.
Extension and support failure are the main tactical risks.
Tracked, but not top-2 eligible because: structurally broken.
INDA won Emerging Markets primarily on relative strength within a weak category basket, not on technical strength. Structure cleanliness of 72.7 for INDA versus 67.5 for IEMG is marginal, and both names have MACD bearish/weakening with stochastic RSI oversold, signaling that near-term momentum is absent. The deciding factor is category-relative strength: INDA at 4.3% versus IEMG at 0.0% tells us that India quality-growth is at least receiving some accumulation flows while broad emerging-market beta is not. INDA's 13-week return is -0.8%, barely negative, whereas IEMG's is -5.1%, confirming that the Indian market is holding up better. Both are trading above the 50-week moving average with neutral structure, but neither is offering momentum confirmation: momentum scores are 31 and 12 respectively, and volume is neutral for INDA versus neutral for IEMG. This is a category where no one wants to be, and INDA wins because it is the least unwanted.
Emerging Markets received 0% allocation and ranks tenth in category priority—the most penalized exposure in the portfolio this week. The 9.0 final score resulted from catastrophic macro fit (33%) driven by active dollar-pressure (-14), credit-stress (-10), and broad-market-bear (-9) headwinds offsetting liquidity-expansion (+8) and risk-appetite-positive (+8) benefits. Technical evidence scored only 42.8%, reflecting INDA's weak momentum (30.8/100) and neutral volume. Dollar strength actively crushes emerging-market returns, and credit-stress signals reduce risk appetite for peripheral equities regardless of technical setups. Portfolio construction currently demands that EM exposure remains zero until either dollar-pressure deactivates or broad-market-bear reverses; neither appears imminent in the transition regime. INDA would need to break above the 50.78 resistance and establish above-50W persistence with volume confirmation before reconsidering; absent that structural improvement paired with macro relief, 0% allocation is appropriate.