
2021-11-19
Informational purposes only. The content in this report, including allocations, analysis, and commentary, is provided solely for informational and educational purposes. It does not constitute financial advice, investment advice, trading advice, or any other type of advice. Past performance does not guarantee future results. Always conduct your own research and consult a qualified financial professional before making investment decisions.
Weekly Allocation
| Ticker | Category | Weight | Role |
|---|---|---|---|
| FSOL | 50% | Overlay | |
| XLE | Traditional Energy | 10% | Top-2 (10%) |
| GLD | Precious Metals | 10% | Top-2 (10%) |
| URA | Nuclear Energy | 5% | Tier-2 (5%) |
| XLK | Technology | 5% | Tier-2 (5%) |
| SMH | AI | 5% | Tier-2 (5%) |
| MOO | Agriculture & Livestock | 5% | Tier-2 (5%) |
| PAVE | Utilities & Infrastructure | 5% | Tier-2 (5%) |
| COPX | Industrial Metals | 5% | Tier-2 (5%) |
Trade Instructions — Monday Open
Sell the tranche from 2021-10-22 (completing its 4-week hold). Buy the new tranche. Instructions show net portfolio changes — same-asset positions cancel, weight changes show the delta.
| Action | Ticker | Instruction |
|---|---|---|
| SELL | URNM | Sell 25% of URNM position (reduce 10.00% → 7.50%) |
| SELL | INDA | Sell entire INDA position (1.25% of portfolio) |
| SELL | CIBR | Sell 33% of CIBR position (reduce 3.75% → 2.50%) |
| SELL | SLV | Sell entire SLV position (1.25% of portfolio) |
| BUY | GLD | Buy GLD — 40.00% of freed cash (adds 2.50% to portfolio) |
| BUY | SMH | Buy SMH — 20.00% of freed cash (adds 1.25% to portfolio) |
| BUY | XLK | Buy XLK — 20.00% of freed cash (adds 1.25% to portfolio) |
| BUY | URA | Buy URA — 20.00% of freed cash (adds 1.25% to portfolio) |
Current Portfolio After Trade
Combined holdings across all 4 active tranches. Each tranche is 25% of the portfolio.
| Ticker | % of Portfolio | Weight Bar |
|---|---|---|
| FSOL | 50.00% | |
| XLE | 10.00% | |
| URNM | 7.50% | |
| GLD | 6.25% | |
| PAVE | 5.00% | |
| COPX | 3.75% | |
| MOO | 3.75% | |
| SMH | 3.75% | |
| CIBR | 2.50% | |
| XLK | 2.50% | |
| ITA | 1.25% | |
| REMX | 1.25% | |
| XAR | 1.25% | |
| URA | 1.25% |
Macro Regime — Transition / Mixed
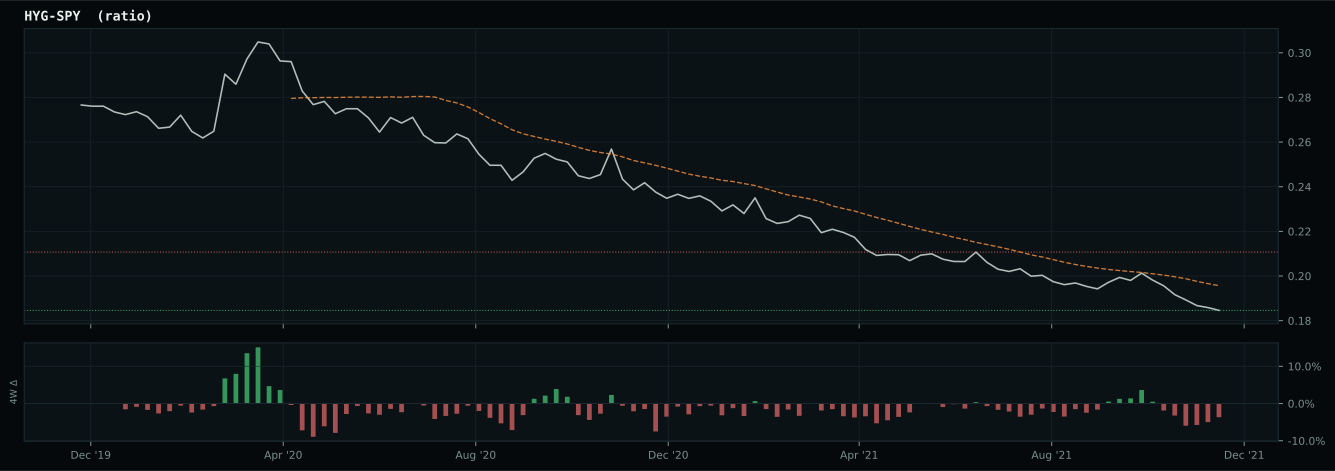
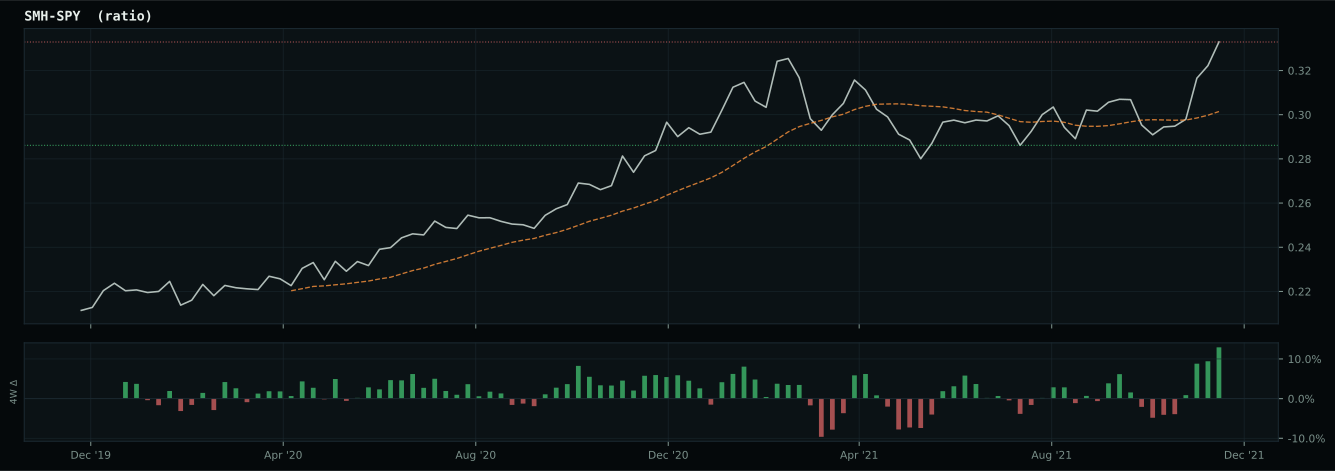
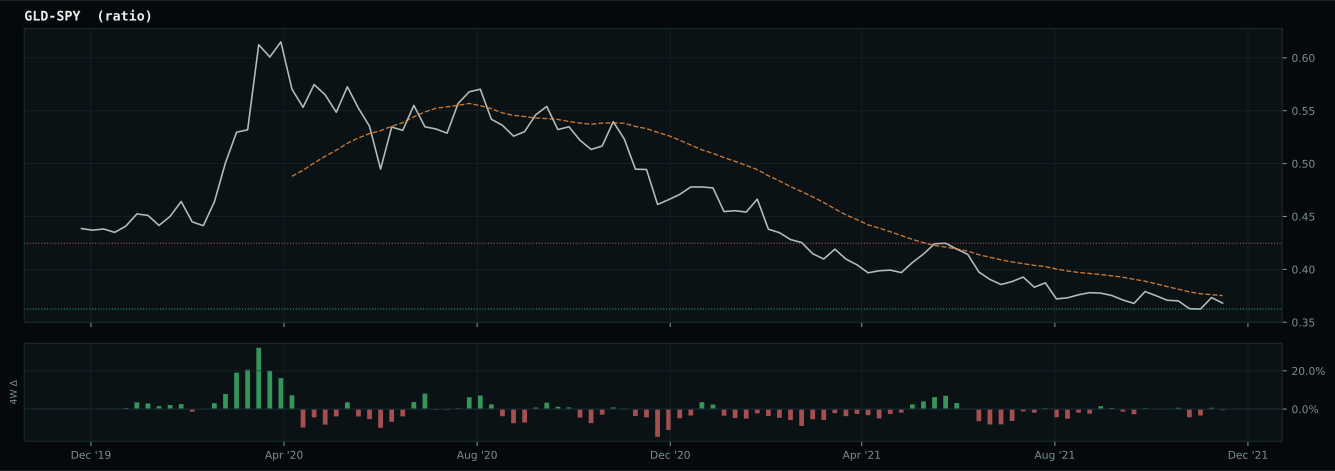
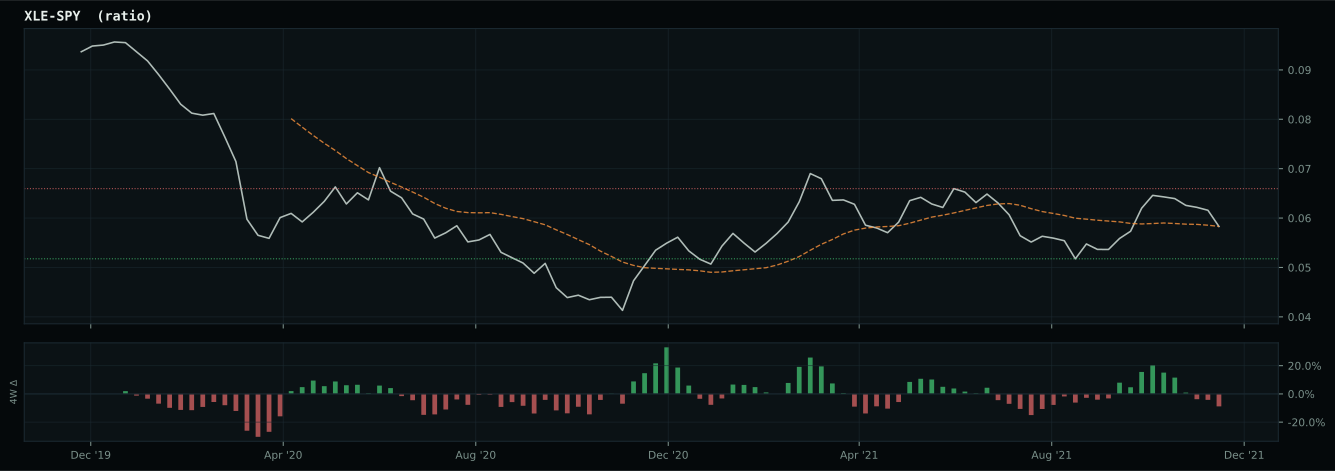
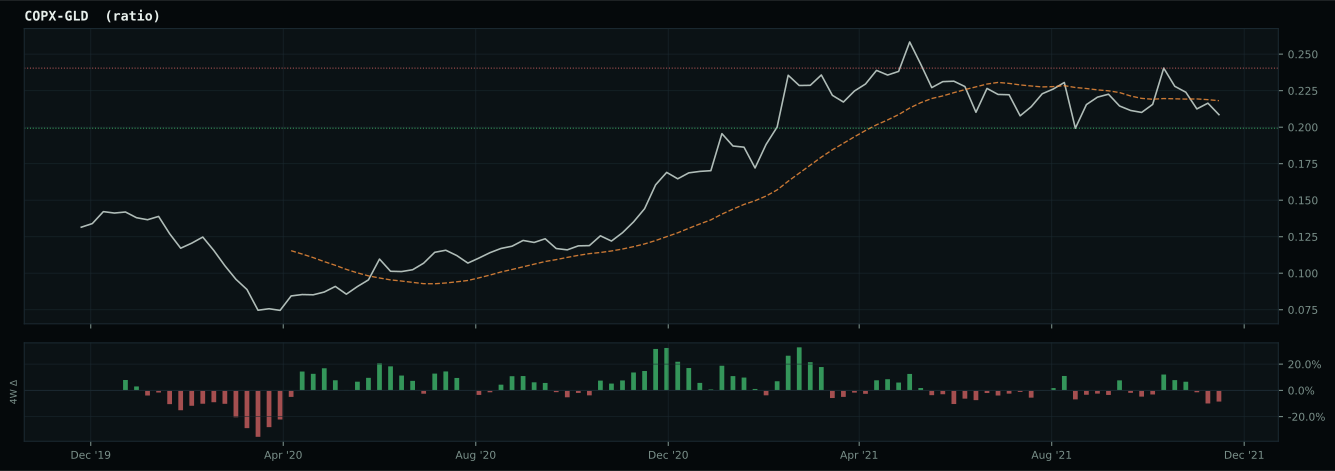
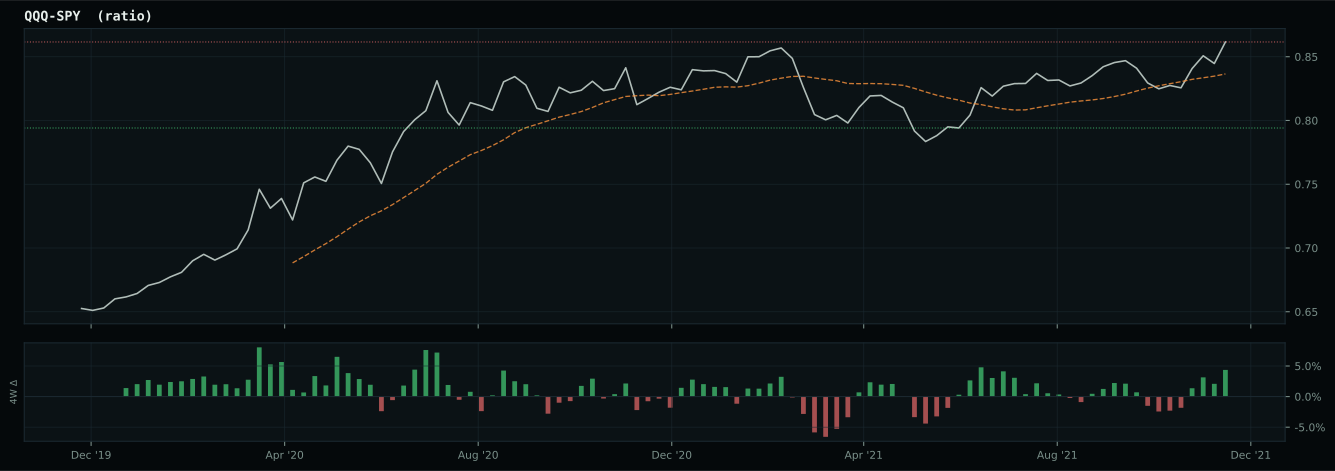
Macro Evidence Charts
Market-implied signals behind the macro regime scores. Each ratio compares two assets; the direction and slope of the ratio is what the macro engine reads.
Crypto Regime — AltSeason
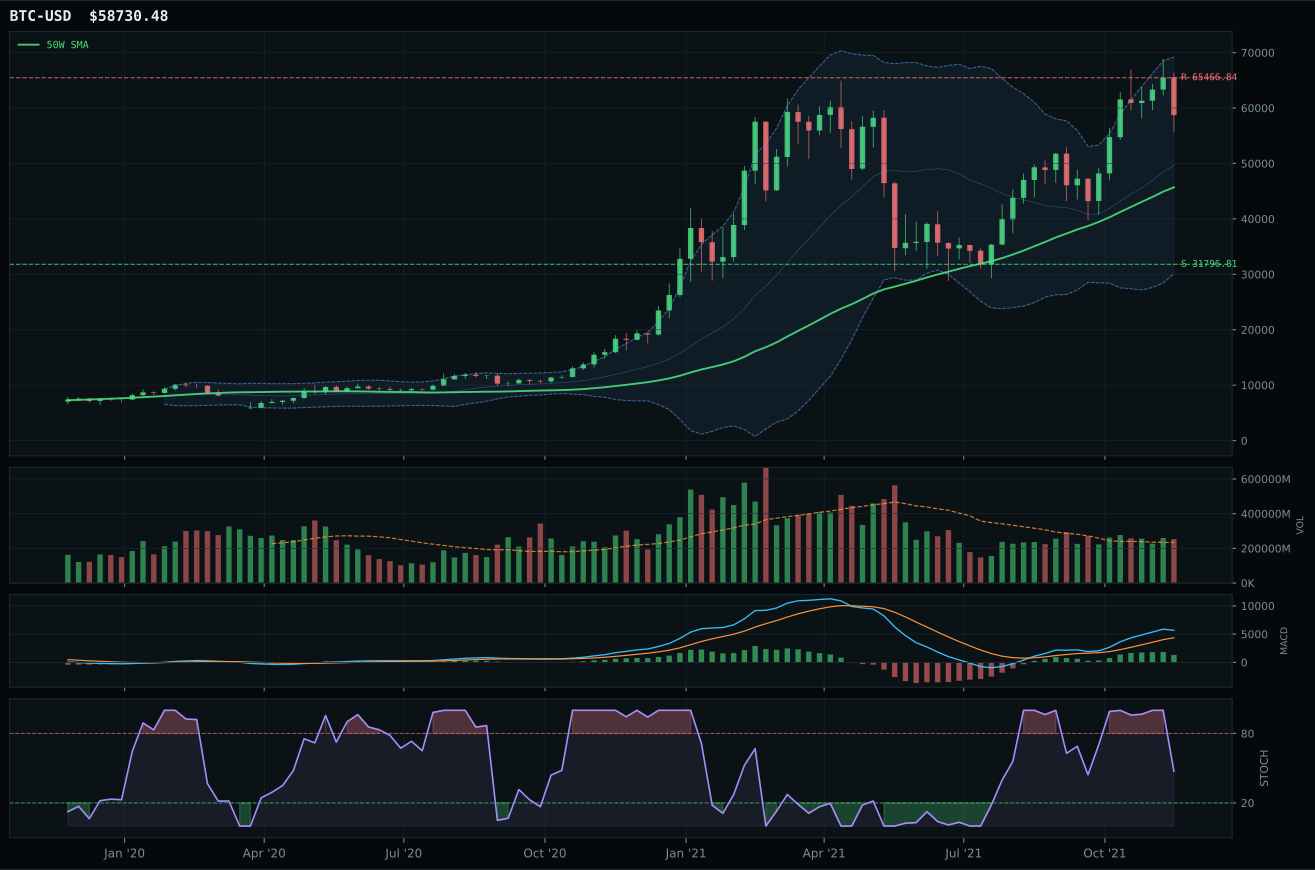
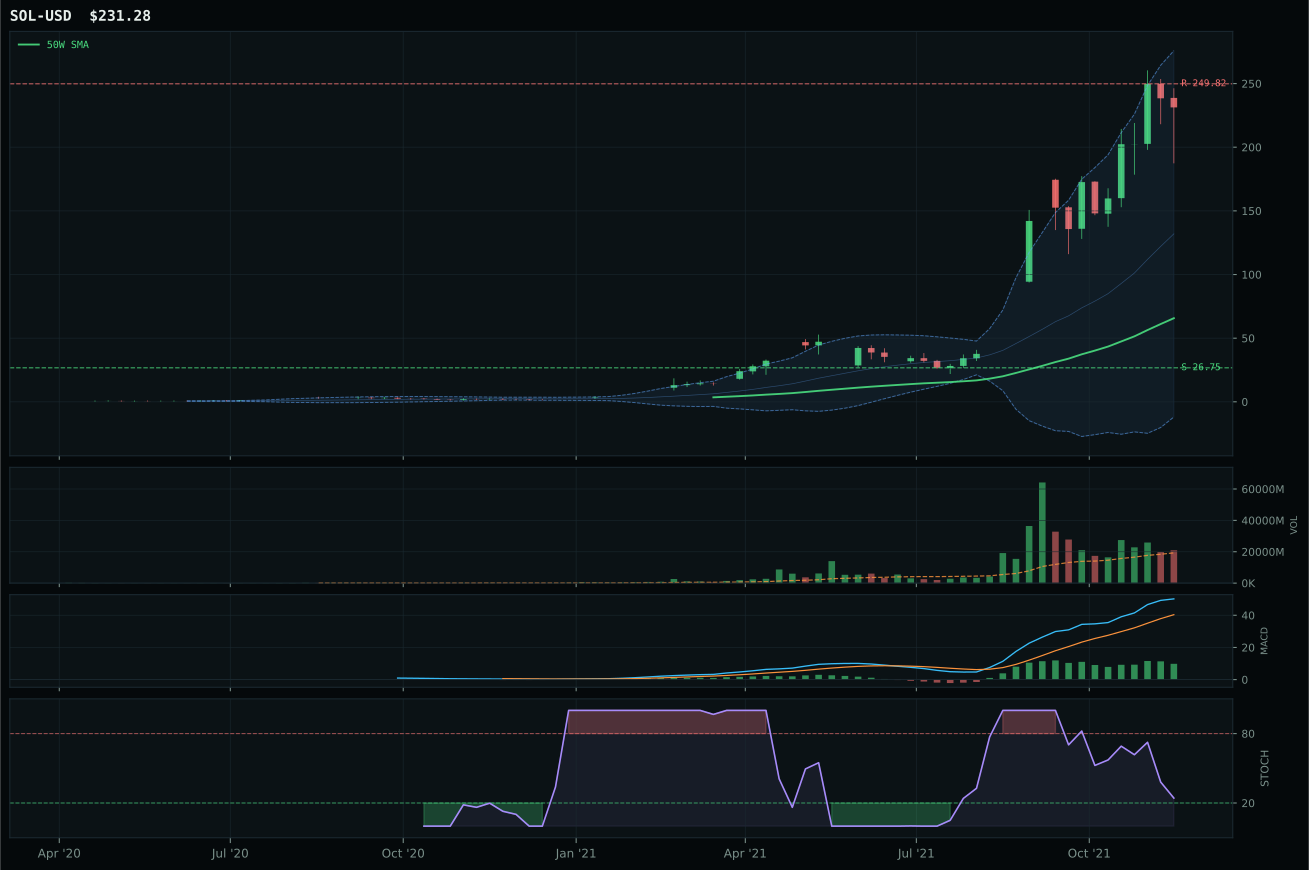
ValueBTC not armed: BTC has not made the first post-breakdown touch of the 200W buy zone after losing the 50W
TrendBTC confirmed: 2 consecutive closes above rising/flat 50W SMA
all available AltSeason conditions pass; missing optional confirmations skipped
Category Rankings
| Rank | Category | Winner | Score | Alloc | 4W Ret | Peers (4W) |
|---|---|---|---|---|---|---|
| 1 | Traditional Energy | XLE | 77.1 | 20% | -4.32% | XOP -9.2% · FCG -7.4% |
| 2 | Precious Metals | GLD | 60.5 | 20% | -1.19% | GDX -7.5% · SLV -9.1% |
| 3 | Nuclear Energy | URA | 60.4 | 10% | -16.30% | URNM -18.1% · NLR -4.2% |
| 4 | Technology | XLK | 60.3 | 10% | -4.06% | CIBR -7.1% · IGV -12.8% |
| 5 | AI | SMH | 58.6 | 10% | -7.55% | BOTZ -10.1% · AIQ -8.1% |
| 6 | Agriculture & Livestock | MOO | 52.1 | 10% | -4.61% | WEAT -9.9% · VEGI -4.2% |
| 7 | Utilities & Infrastructure | PAVE | 51.8 | 10% | -4.86% | XLU +2.3% · IGF -2.0% |
| 8 | Industrial Metals | COPX | 51.0 | 10% | -2.06% | REMX -13.1% · PICK -1.7% |
| 9 | Defense & Aerospace | XAR | 43.2 | 0% | -6.96% | ITA -7.1% · ROKT -5.1% |
| 10 | Emerging Markets | INDA | 11.5 | 0% | -11.16% | IEMG -7.1% · ILF -6.4% |
Traditional Energy — XLE
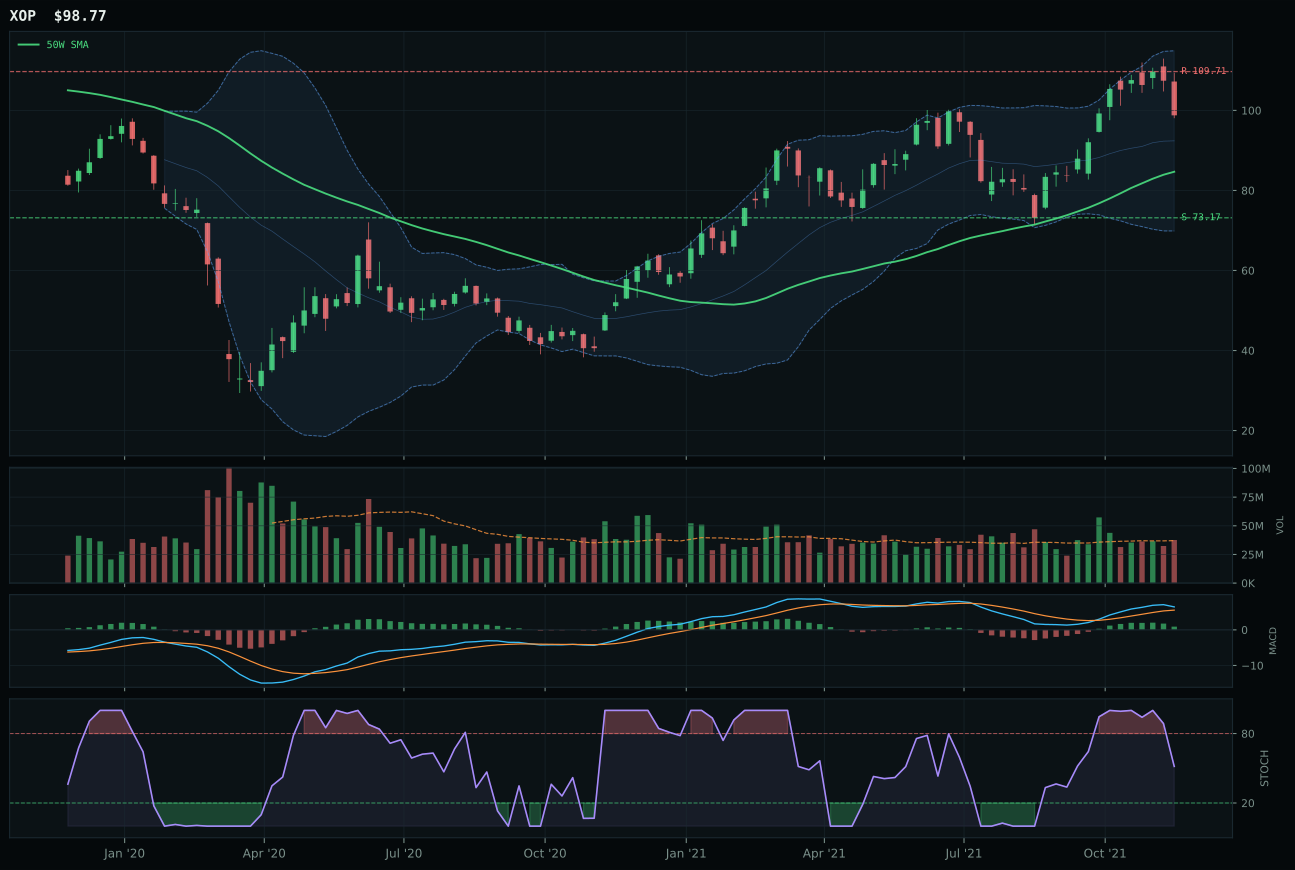
XOP has a vertical extension profile with 29.2% 13-week relative strength versus SPY.
A failed hold above support would weaken the setup.
Actionable but governed by invalidation levels.
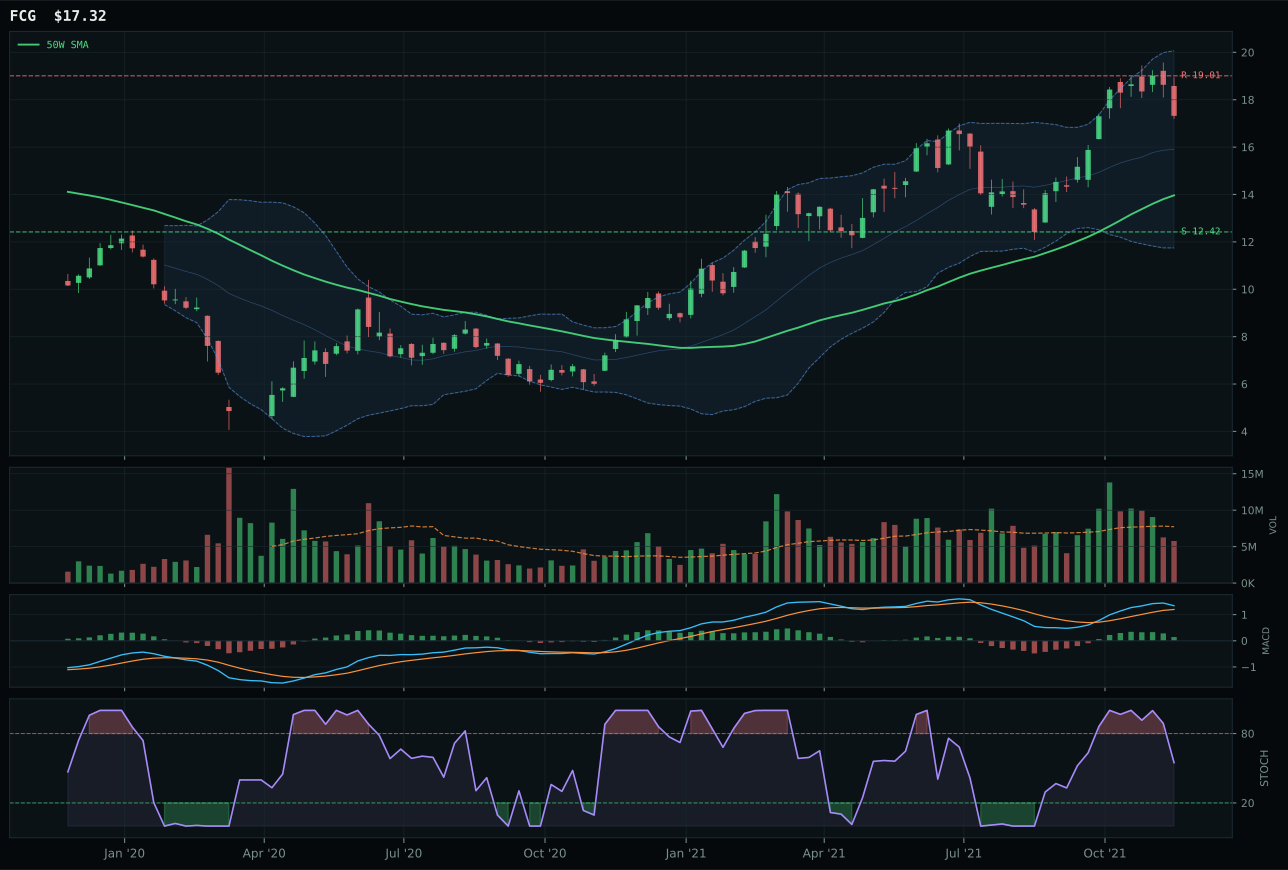
FCG has a vertical extension profile with 33.7% 13-week relative strength versus SPY.
A failed hold above support would weaken the setup.
Actionable but governed by invalidation levels.
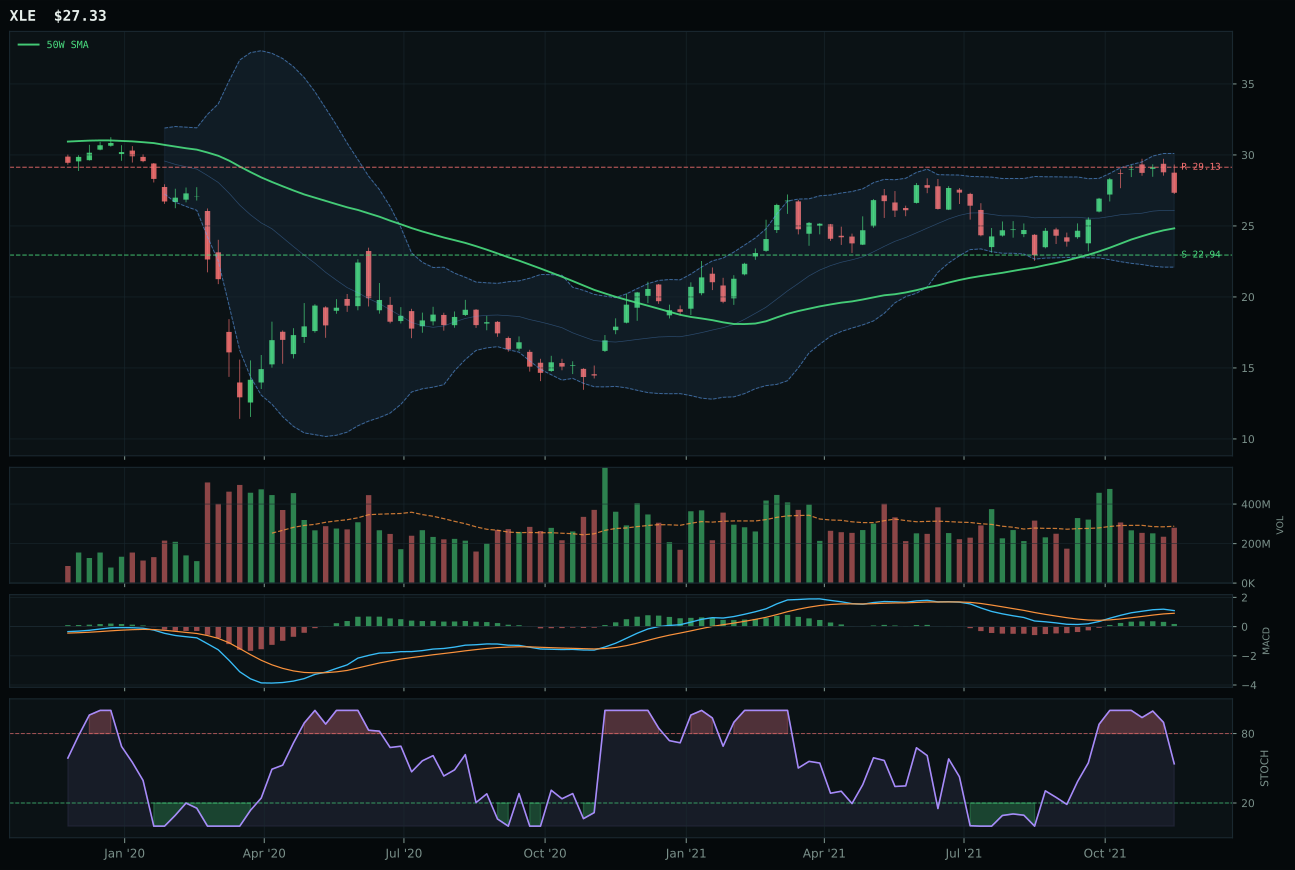
XLE has a neutral structure profile with 13.4% 13-week relative strength versus SPY.
A failed hold above support would weaken the setup.
Actionable but governed by invalidation levels.
XLE captures top-2 allocation despite sitting below the 200W moving average—a positioning that would normally disqualify a candidate, but here it signals maximum entry value. Price sits 10.1% above the 50W at the upper retracement zone (Fib 0.236 at 26.98) with neutral volume and MACD bullish but flattening, meaning the 13W momentum of 19.1% and 13.4% SPY relative strength have been accumulated without panicked volume spikes or exhaustion signals. The trend score of 86 reflects price above the 50W with a healthy 0.6% slope, and the neutral structure means buyers are not overextended—every new buyer does not represent late panic. XOP, the runner-up, owns extraordinary momentum (35.0% thirteen-week, 29.2% RS/SPY) but carries entry cost: extended 16.6% above its 50W in a vertical structure with stochastic RSI rolling over, XOP is the "hot" trade while XLE is the disciplined allocation. The timing score gap (70 versus 48) reflects XLE's optimal distance from its moving average and superior structure cleanliness (72.8 vs. 70.1).
Traditional Energy earned 10% allocation as the second top-2 category, justified by a 77.1 composite score and a dominant 85.0% macro fit—the strongest category-level macro alignment in the portfolio this week. Energy scarcity is active (+16), inflation pressure is active (+10), supply shortage is active (+9), and real asset sponsorship is active (+7); these four descriptors create a genuine structural tailwind independent of near-term sentiment. XLE's 13W return of 19.1% proves the theme is working, and its position below the 200W (unusual for a top-2 holding) actually enhances the allocation logic: this is a category that has lifted above its 50W on strong macro fundamentals but has not yet recovered to prior trends, meaning there is genuine room for multiple expansion if the energy scarcity narrative persists. The 10% slot recognizes that Traditional Energy and Precious Metals (also 10%) form the portfolio's defensive real-asset core, hedging against both inflation and credit stress in a transition-mixed regime.
Precious Metals — GLD
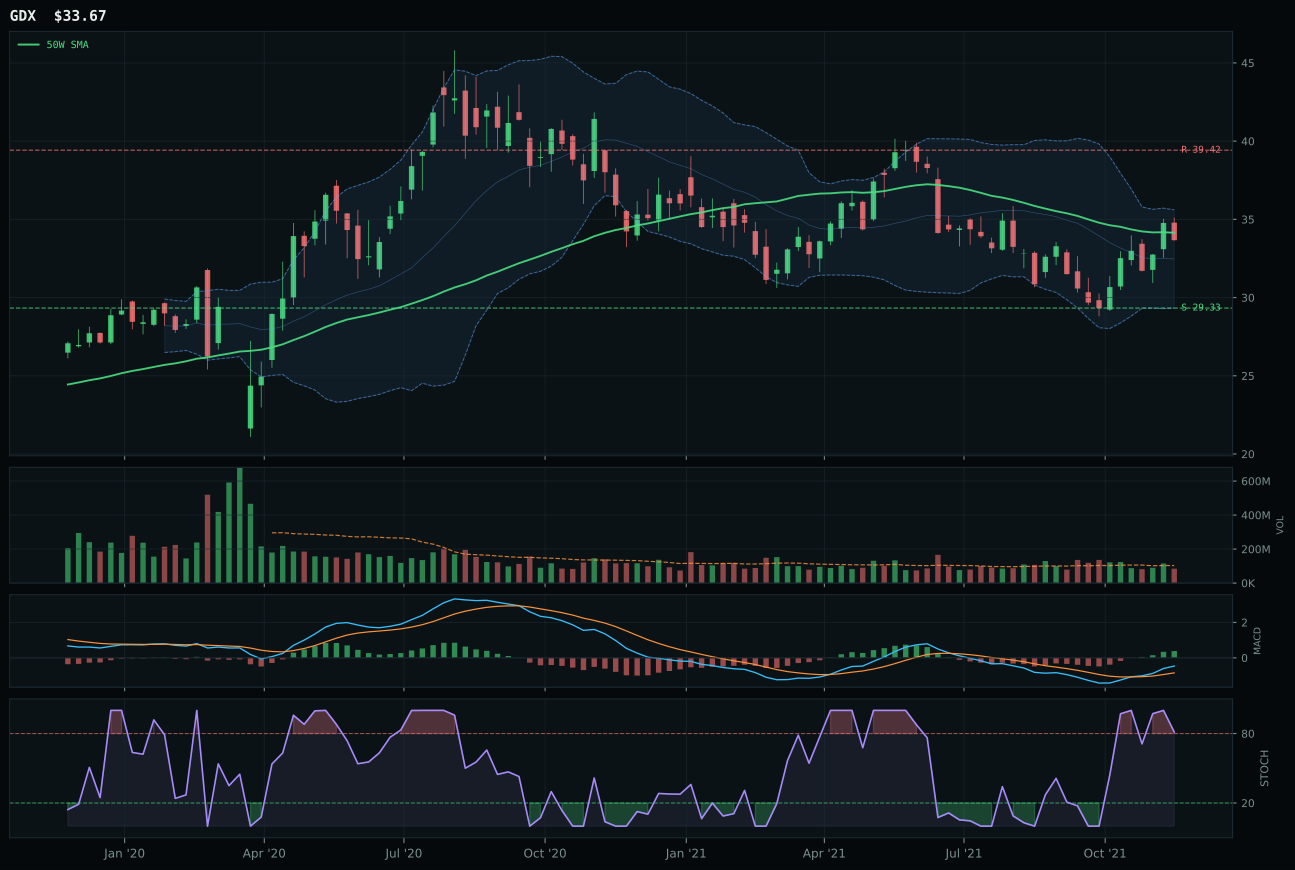
GDX has a compression near 50W profile with 3.4% 13-week relative strength versus SPY.
A failed hold above support would weaken the setup.
Actionable but governed by invalidation levels.
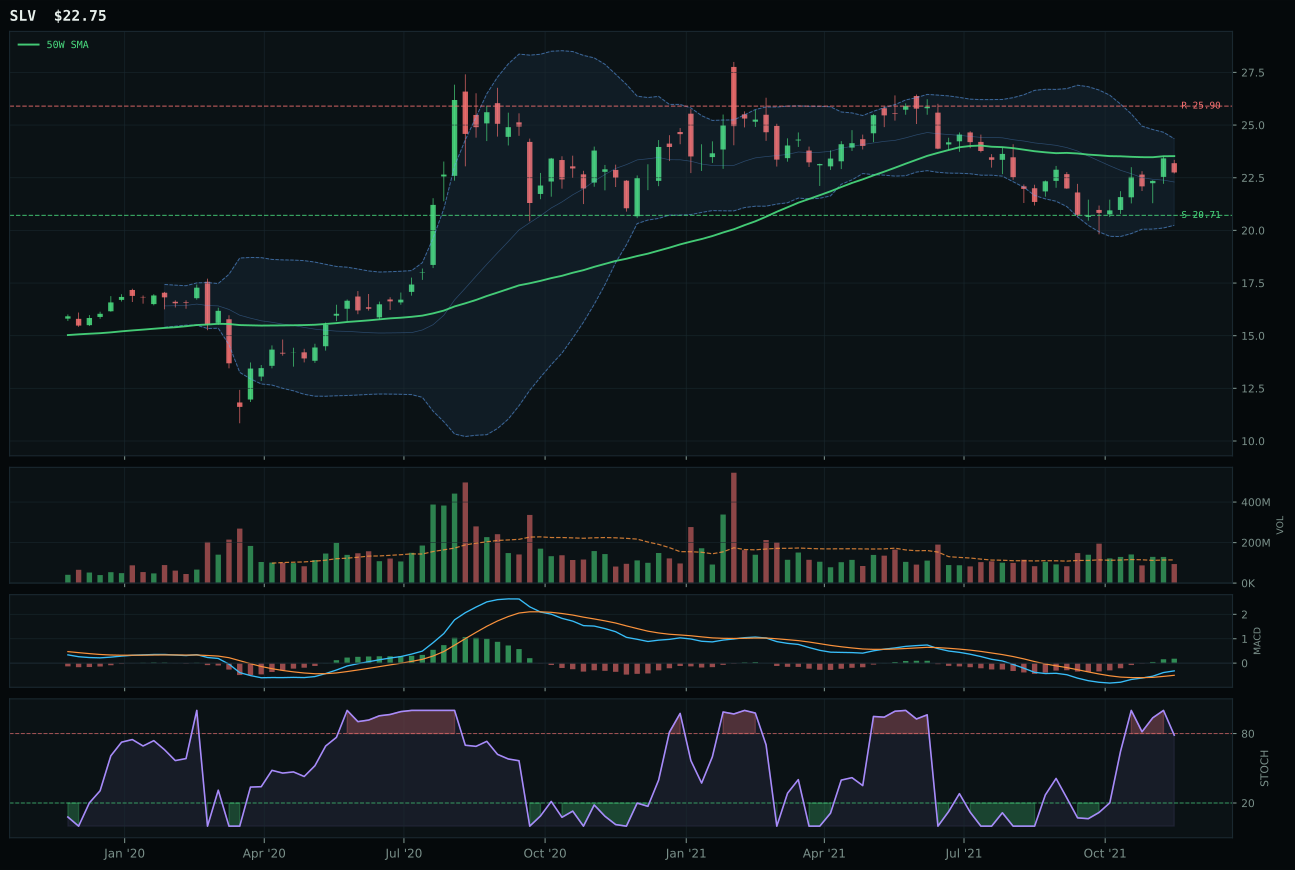
SLV has a neutral structure profile with 0.8% 13-week relative strength versus SPY.
A failed hold above support would weaken the setup.
Actionable but governed by invalidation levels.
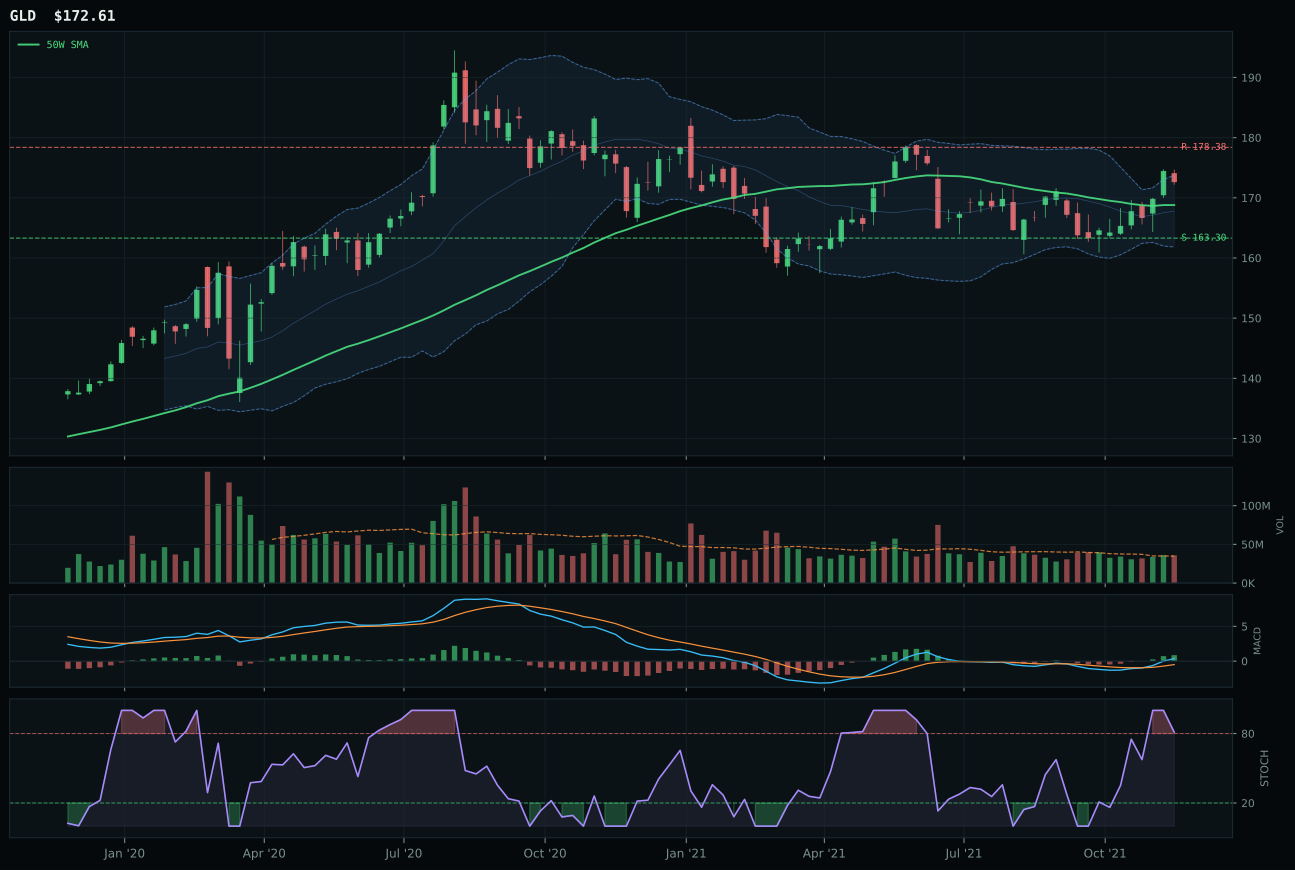
GLD has a compression near 50W profile with -2.2% 13-week relative strength versus SPY.
A failed hold above support would weaken the setup.
Actionable but governed by invalidation levels.
GLD earns top-2 status by offering a rare combination of clean price action and optimal timing for a defensive allocation. Price compresses tightly just 2.3% above the 50W, with MACD bullish and improving and stochastic RSI overbought at 0.81, signaling that the setup is coiled and ready for expansion if support holds. The 96.7-point trend score reflects price stability above both the 50W and 200W with a flat 0.0% slope—not a dynamic rip higher, but a controlled consolidation near key resistance at 178.38. GLD's category-relative strength of -3.0% versus the median signals it is not the flashiest trade (GDX leads with higher momentum at 84), but that conservatism is precisely why it wins for portfolio allocation: the move is less exhausted, volume is neutral at 1.03x the 20W average, and the risk-reward sits at 63.2 points—superior to the extended plays. GDX, the runner-up, owns stronger technical momentum (9.1% thirteen-week return, 3.4% RS/SPY) but its structure is less clean (69.7 versus 73.5), and it carries more execution risk as a leveraged miner exposure.
Precious Metals earned 10% allocation as one of only two top-2 categories, placing it in the portfolio's core defensive sleeve. The category's 60.5 composite score and 49.0% macro fit align with a transition-mixed regime where dollar pressure (+3 active) and risk appetite volatility create demand for monetary hedges; GLD's clean compression setup near the 50W offers an ideal entry for that hedging demand. The +2 boost from dollar pressure and the balanced risk-reward profile (5.7% downside to 163.30 support, -3.2% upside to 178.38 resistance) make GLD a natural anchor for a 10% defensive position without over-weighting into a stretched technical setup. The 3.5% thirteen-week return is modest but reflects gold's role as volatility insurance rather than performance driver; the allocation thesis is that in a mixed macro regime, holding 10% of a precious metals proxy that is neither extended nor deeply depressed creates optionality if either credit stress or broad market weakness accelerates.
Nuclear Energy — URA
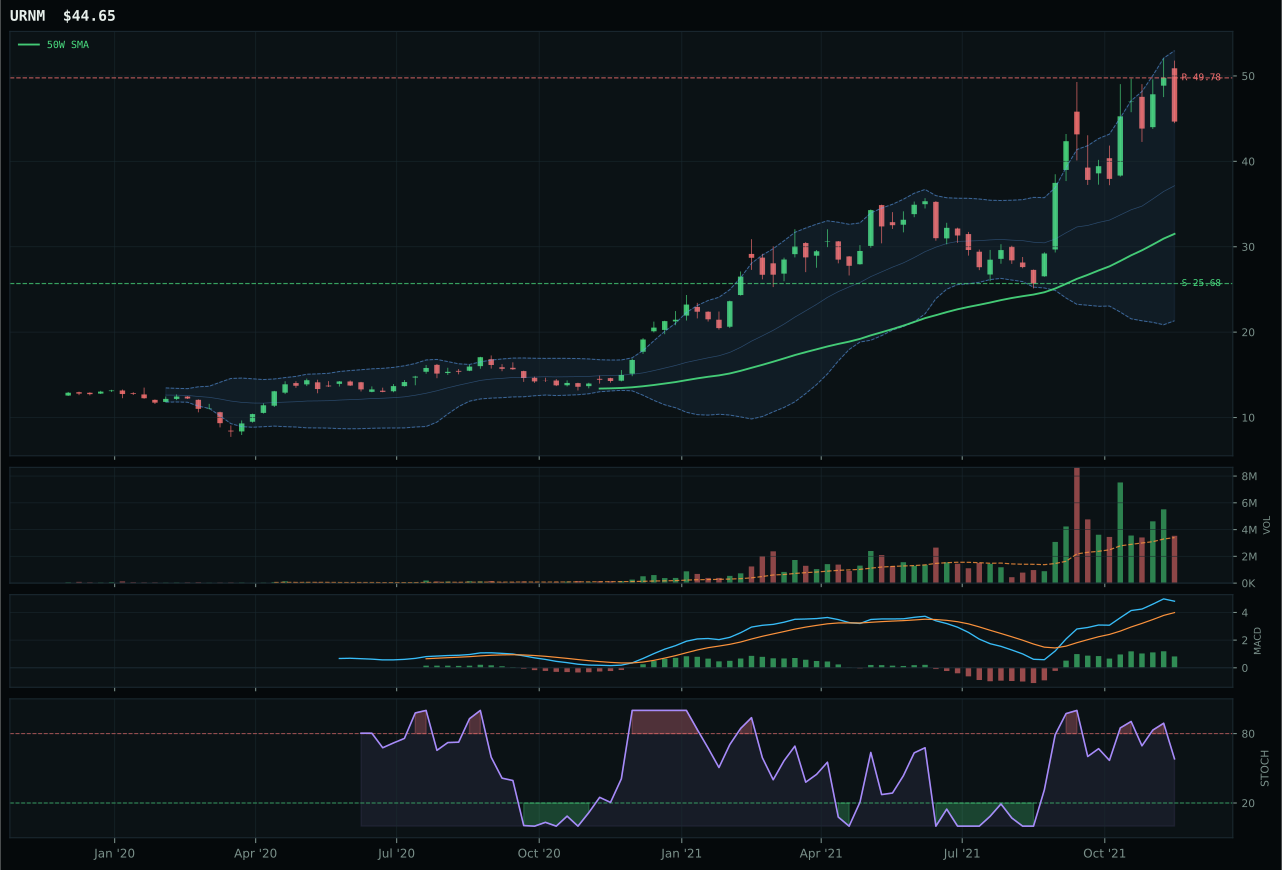
URNM has a vertical extension profile with 68.1% 13-week relative strength versus SPY.
A failed hold above support would weaken the setup.
Actionable but governed by invalidation levels.
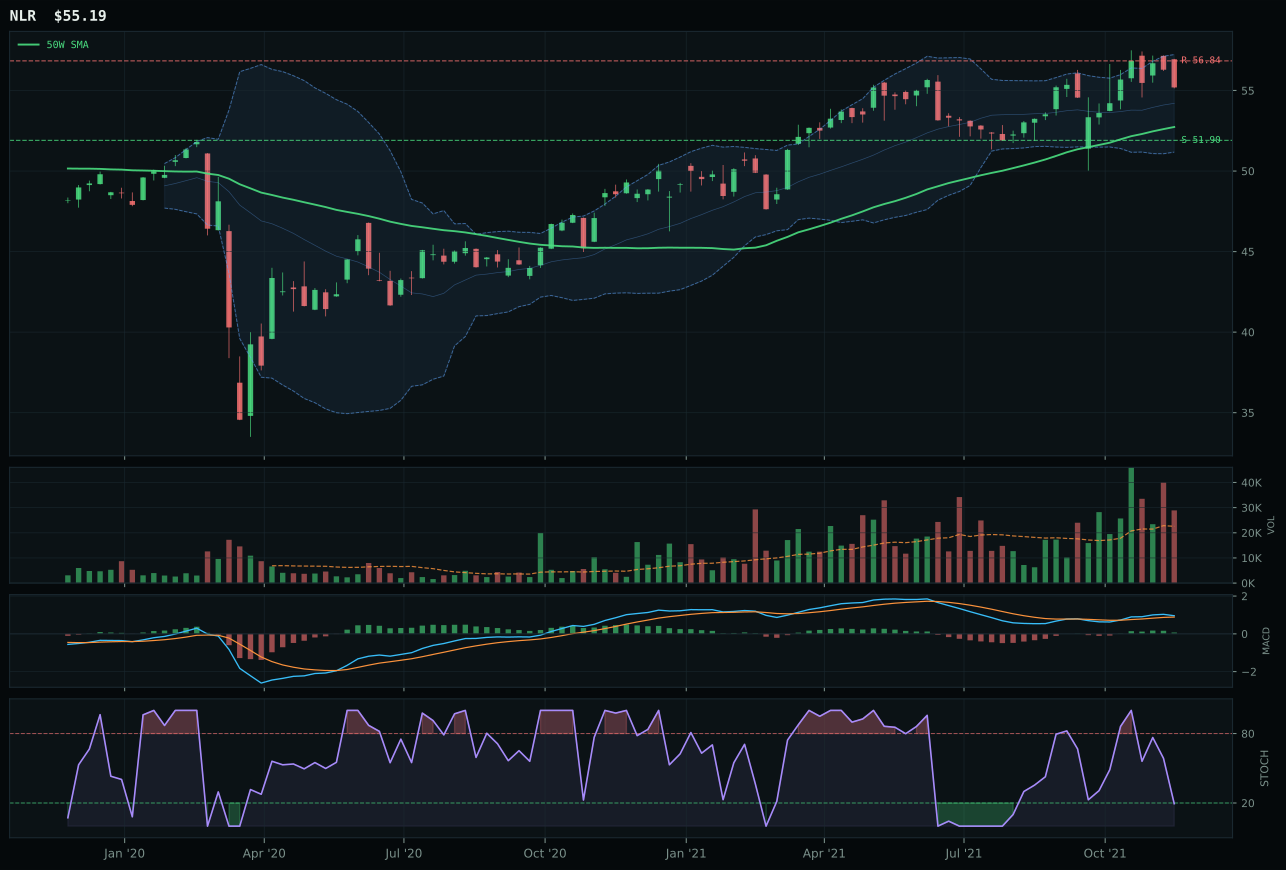
NLR has a neutral structure profile with -2.1% 13-week relative strength versus SPY.
A failed hold above support would weaken the setup.
Tracked, but not top-2 eligible because: .
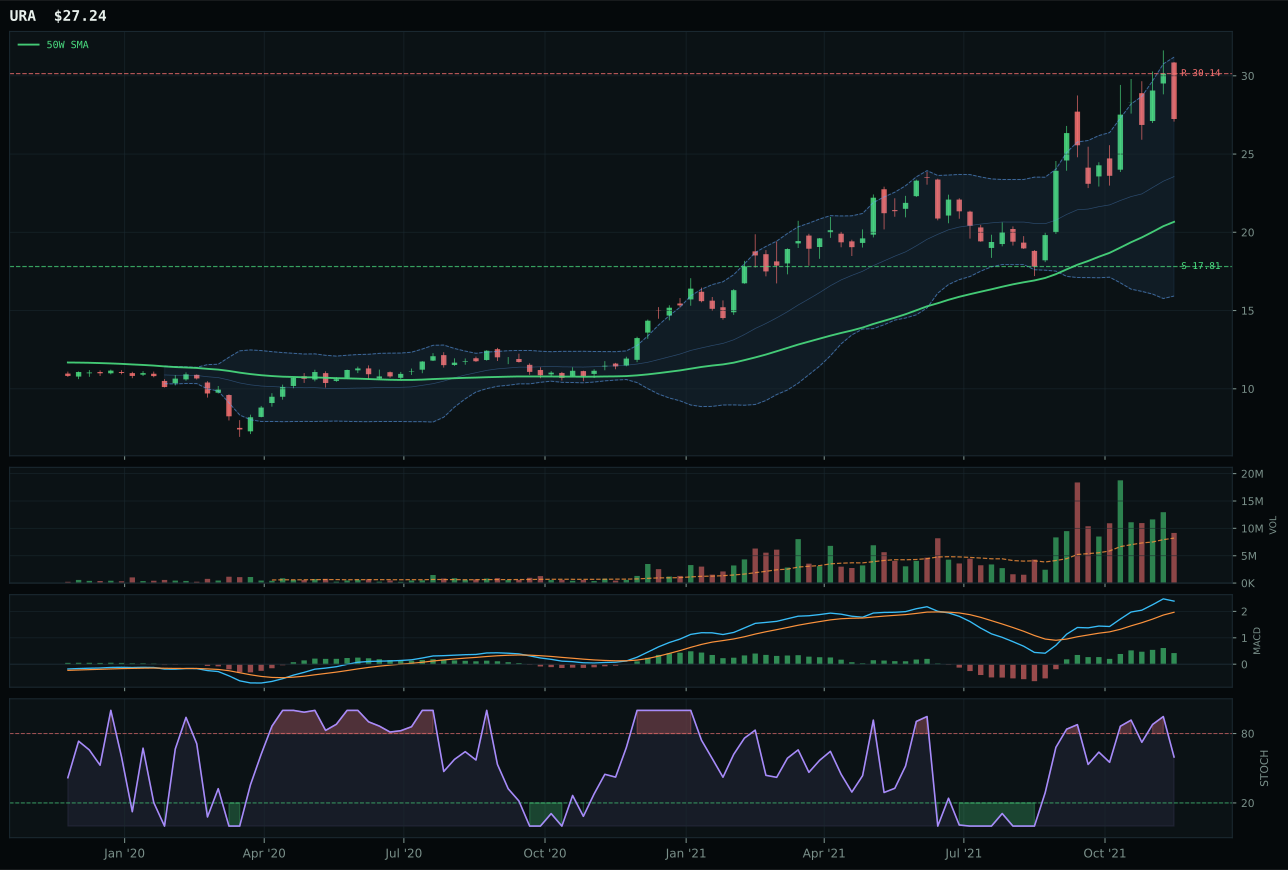
URA has a vertical extension profile with 47.2% 13-week relative strength versus SPY.
A failed hold above support would weaken the setup.
Actionable but governed by invalidation levels.
URA dominates Nuclear Energy with a 100-point trend score and 100-point momentum confirmation, signaling alignment between price structure (above both 50W and 200W) and institutional accumulation (47.2% RS/SPY, 52.9% thirteen-week return). The extension at 31.8% above the 50W is steep, but the above-average volume at 1.11x the 20W average proves buyers are defending the move, and the persistence score of 92.1 ranks among the highest in the portfolio—meaning this is not a thin, momentum-chasing rally but rather continuous accumulation from diverse market participants. The stochastic RSI falling/neutral at 0.60 despite overbought price signals institutional discipline rather than retail mania; MACD is bullish but flattening, consistent with a mature but still-intact uptrend. URNM, the runner-up, owns even higher momentum (73.9% thirteen-week, 68.1% RS/SPY) but sits extended 41.7% above its 50W with worse risk-reward (32.5 vs. 33.3)—a meaningfully more expensive entry for a leveraged-miner expression of the same theme.
Nuclear Energy received 5% allocation as a tier-2 category with a 60.4 composite score and 69.0% macro fit. The macro alignment is solid—energy scarcity (+9), real asset sponsorship (+7), and AI growth sponsorship (+5 for data-center power demand) all support the thesis. However, URA's 31.8% extension above the 50W and a weak 48.0-point timing score (heavy penalty for distance from the 50W) prevent this from being a top-2 slot: in a mixed macro regime, paying this much for extended momentum carries execution risk if risk appetite suddenly reverses. The 5% position respects the strong technical momentum and macro tailwind while capping exposure to entry risk. For Nuclear to earn 5% allocation, URA would need to consolidate and build support 10–15% above the 50W, allowing buyers to re-accumulate without an 30%+ extension penalty; alternatively, a fresh descriptive catalyst (e.g., large-cap tech announcing nuclear-powered data centers) could upgrade macro fit substantially.
Technology — XLK
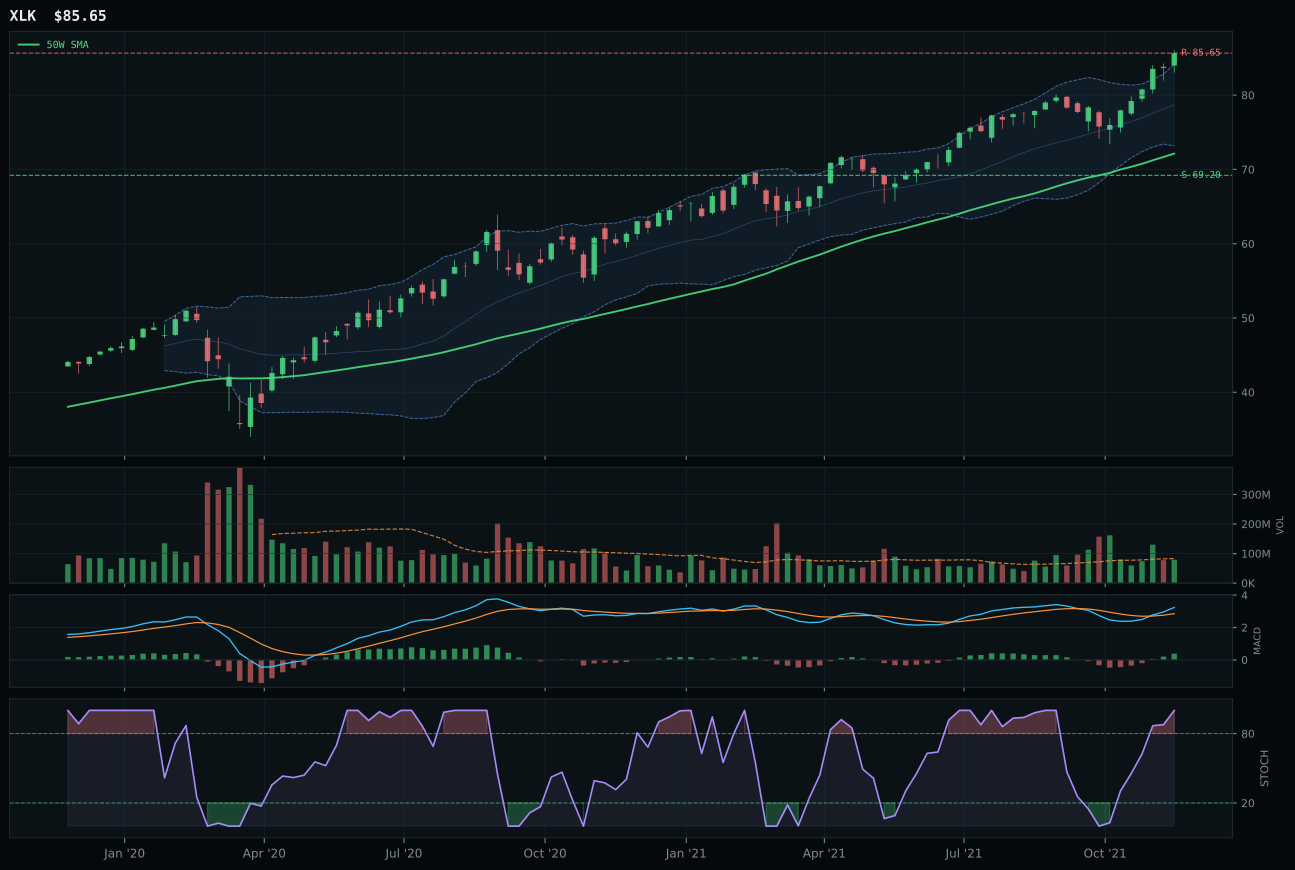
XLK has a vertical extension profile with 4.2% 13-week relative strength versus SPY.
A failed hold above support would weaken the setup.
Actionable but governed by invalidation levels.
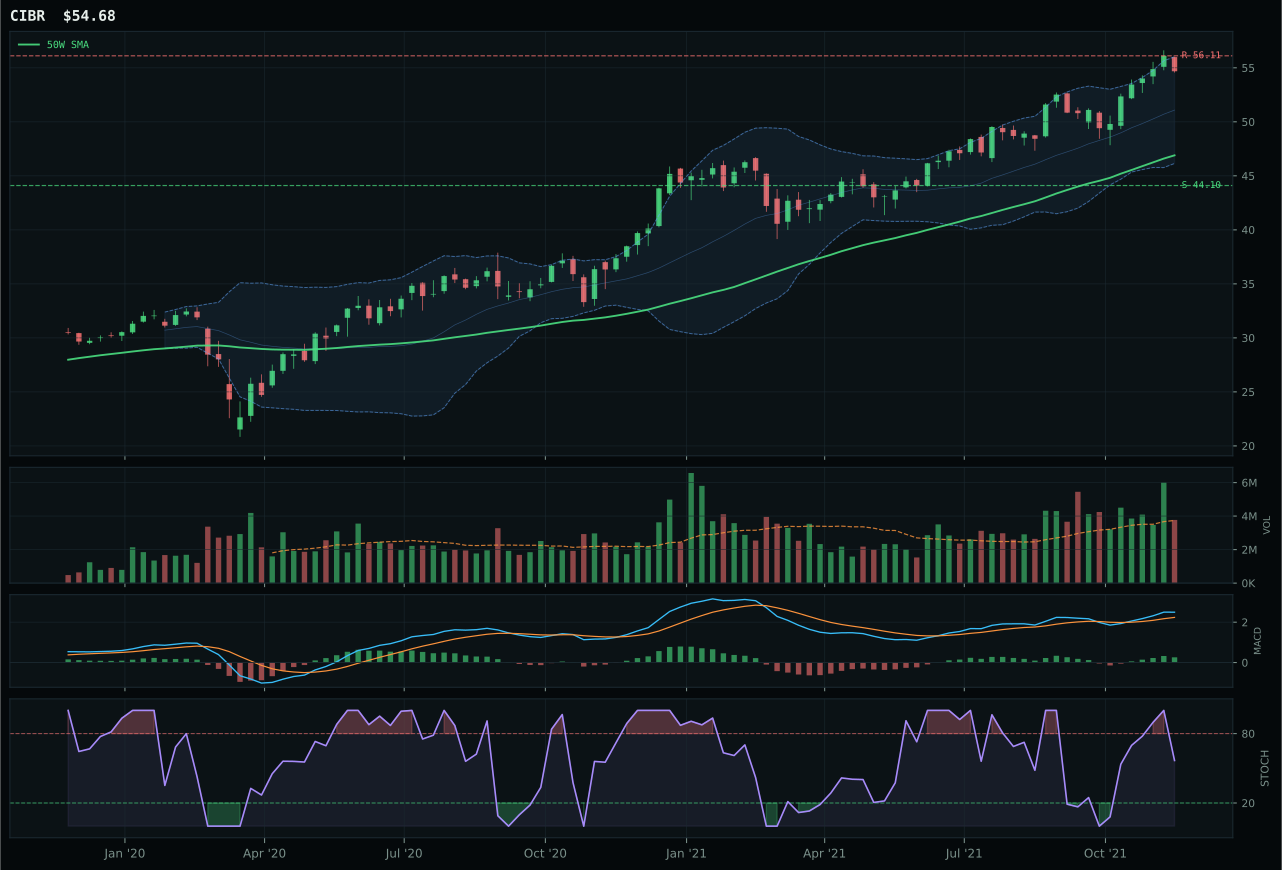
CIBR has a vertical extension profile with 7.1% 13-week relative strength versus SPY.
A failed hold above support would weaken the setup.
Actionable but governed by invalidation levels.
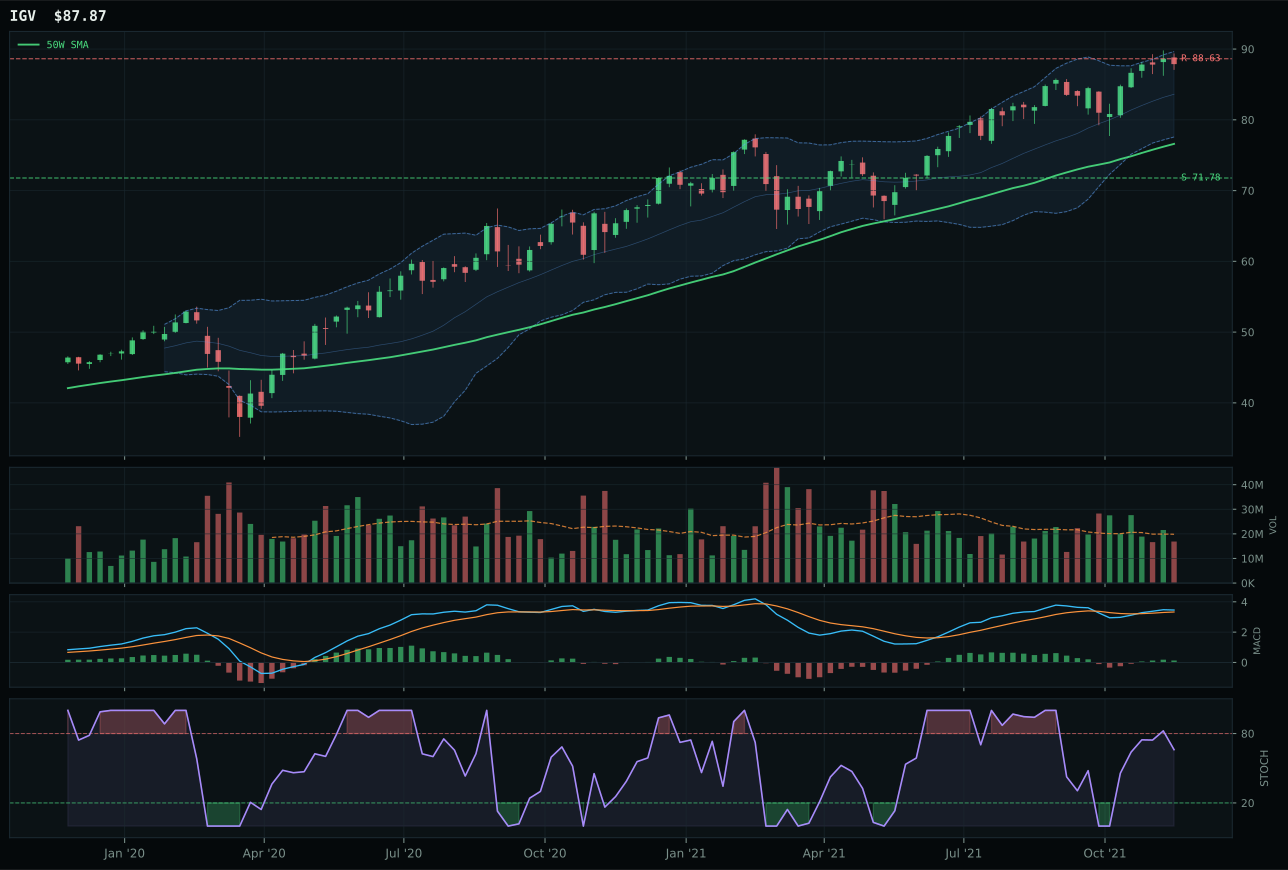
IGV has a neutral structure profile with 1.7% 13-week relative strength versus SPY.
A failed hold above support would weaken the setup.
Actionable but governed by invalidation levels.
XLK wins the category by maintaining price above both the 50-week and 200-week moving averages with a steady 0.6% upslope, signaling intact intermediate uptrend even as the chart sits extended 18.8% above the 50W. The 13-week return of 10.0% paired with a 4.2% relative strength advantage over SPY demonstrates steady accumulation rather than late-stage retail chase—volume sits neutral at 0.95x the 20-week average, confirming the move is not being rejected. CIBR, the runner-up, lost ground on two technical fronts: its risk-reward profile was measurably weaker at 39 versus XLK's 43, and its structure score lagged at 77 versus 80, reflecting a less clean compression pattern. The stochastic RSI divergence matters too—XLK sits at overbought momentum (1.00) while CIBR has begun rolling over to falling/neutral territory (0.50), signaling XLK still has institutional sponsorship pushing into resistance at 85.65 while CIBR's buyers are beginning to step aside.
Technology earned 5% allocation as a tier-2 holding despite a respectable 60.3 composite score, because two higher-ranked categories (XLE and GLD, both at 10%) captured superior risk-adjusted setups in the current transition-mixed macro regime. The category's 49.0% macro fit score reflects genuine headwinds: credit stress and dollar pressure are both active, offsetting the +9 boost from positive risk appetite and the +6 from AI growth sponsorship. XLK's entry risk cannot be ignored—at 18.8% above the 50W in a mixed regime, every percentage gain from here requires new money willing to chase an extended leader. For Technology to earn a top-2 slot next week, either the macro descriptor profile would need to shift sharply (credit stress reversing, dollar pressure easing) or the technical setup would need to reset closer to the 50W, offering a cleaner risk-reward profile for new capital allocation.
AI — SMH
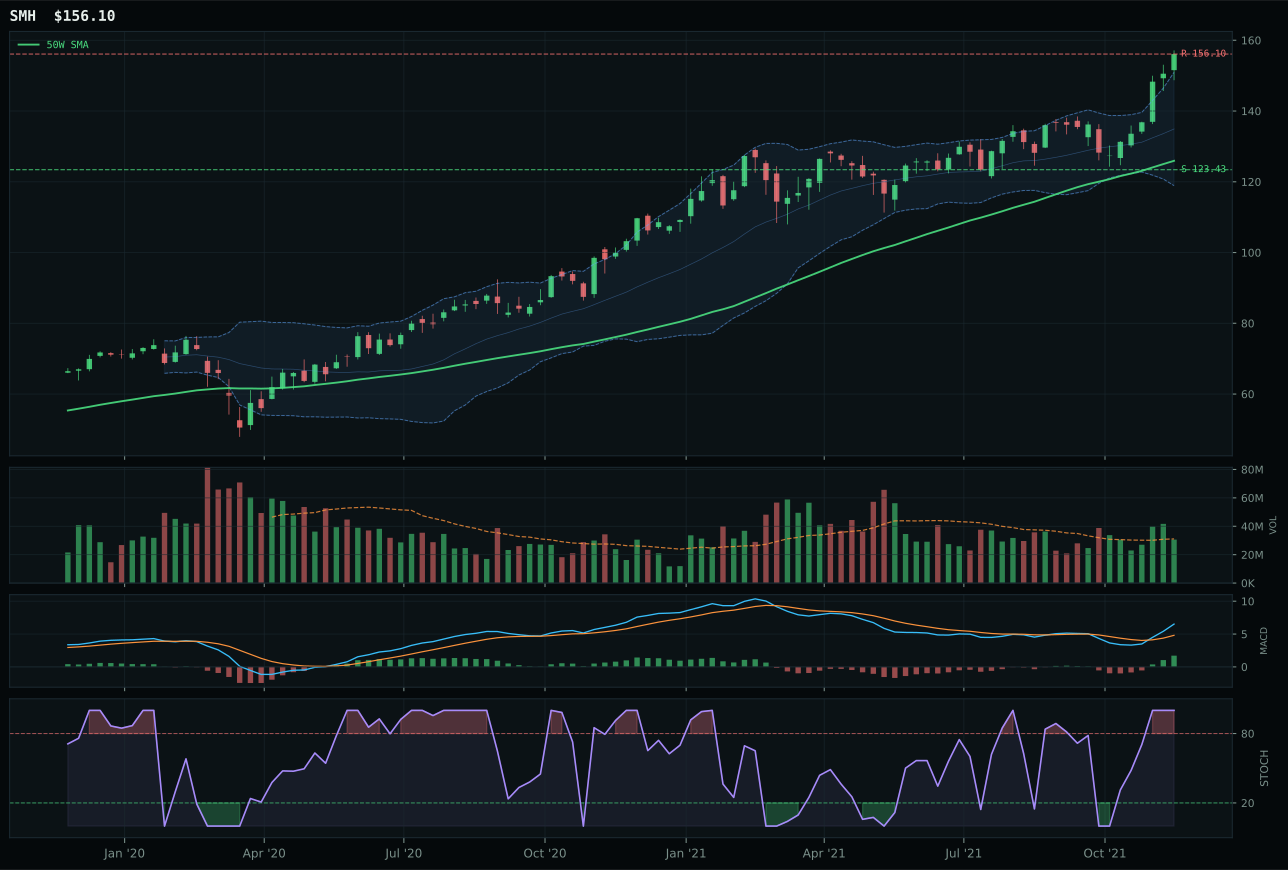
SMH has a vertical extension profile with 16.0% 13-week relative strength versus SPY.
A failed hold above support would weaken the setup.
Actionable but governed by invalidation levels.
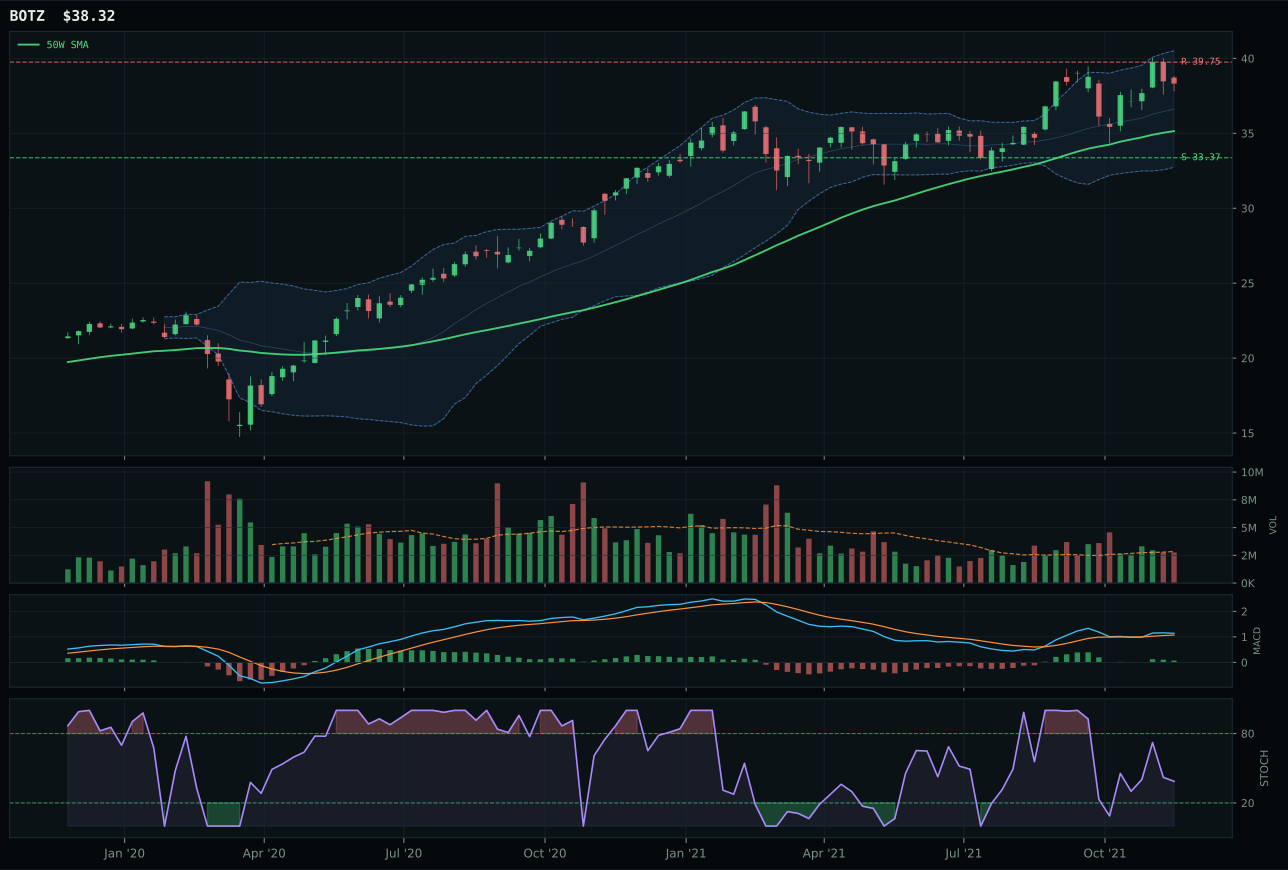
BOTZ has a neutral structure profile with 4.7% 13-week relative strength versus SPY.
A failed hold above support would weaken the setup.
Actionable but governed by invalidation levels.
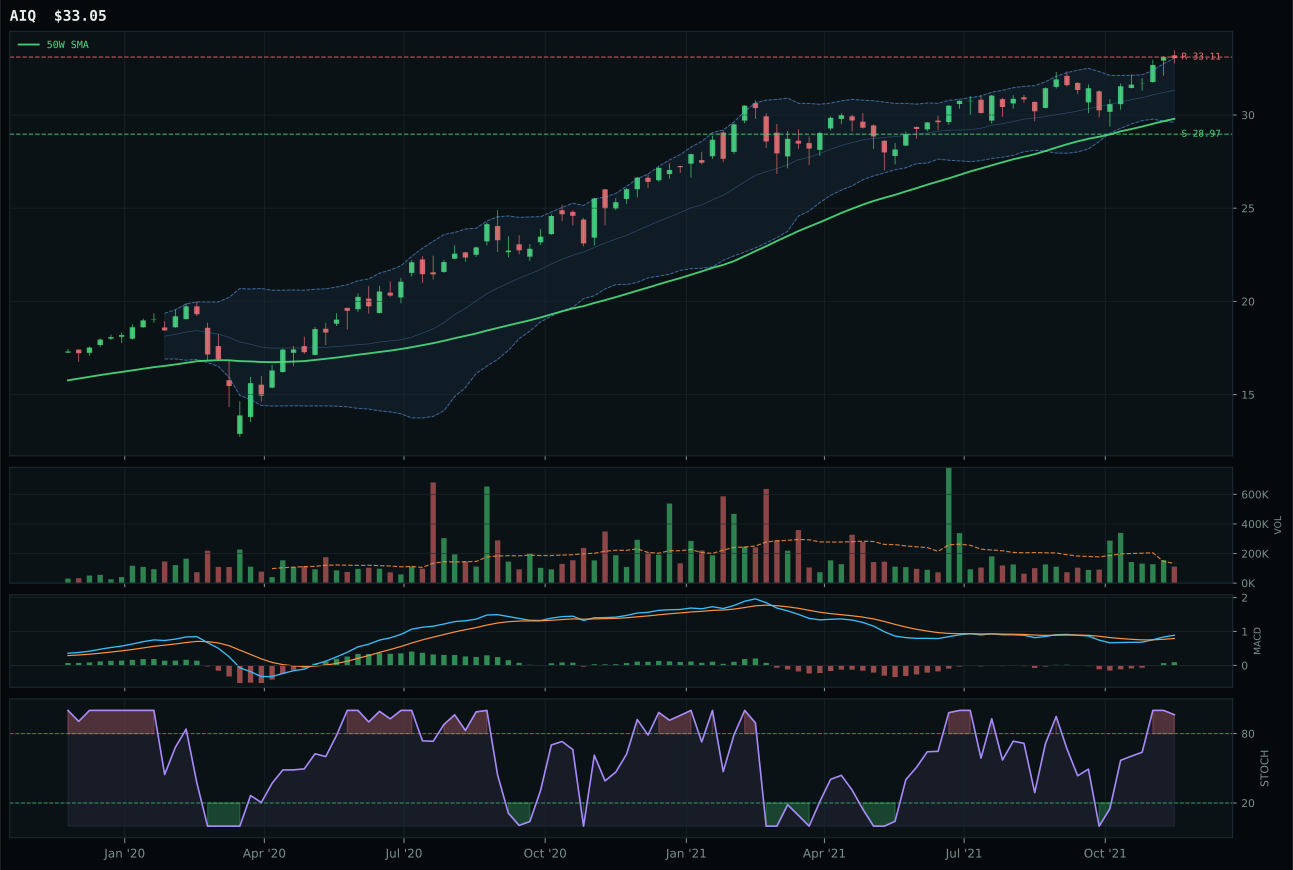
AIQ has a neutral structure profile with 3.7% 13-week relative strength versus SPY.
A failed hold above support would weaken the setup.
Tracked, but not top-2 eligible because: .
SMH dominates the AI category with a trend score of 100 and momentum confirmation matching at 100—a rare unanimous technical verdict. The semiconductor ETF's 21.8% thirteen-week return coupled with a category-relative strength edge of 11.3% over the median signals SMH is the clear leader within its own three-ETF basket, not merely riding a broad market wave. Extended 24.0% above the 50W with overbought stochastic RSI (1.00) and MACD bullish-improving, SMH is priced for perfection, yet its above-average volume confirmation (77.9) and persistence score (82.2) prove buyers keep stepping in to defend strength rather than panic-selling into resistance. BOTZ, the runner-up, suffered from a cleaner but less aggressive technical pattern: neutral structure versus SMH's vertical extension, zero category-relative strength versus SMH's 11.3%, and a less decisive momentum picture with stochastic RSI already falling/neutral instead of overbought. The 9.2-point score gap reflects a clear separation in sponsorship intensity.
AI received 5% allocation as a tier-2 category despite a 58.6 composite score and strong macro tailwinds (+14 for AI growth sponsorship, +10 for risk appetite positive). The exclusion from top-2 hinges on entry risk and timing: SMH and URA both sit deeply extended (24–31% above their 50W), while the portfolio's transition-mixed regime creates ambiguity around whether broad risk appetite will sustain these momentum leaders. A 64-point macro fit score for the category overall supports the holding, but the portfolio's 50% overlay into crypto (which halves every sleeve) means the actual capital deployed is only 2.5% to a leader priced for near-perfect execution. If SMH pulls back to a 10–15% extension above the 50W and MACD shows fresh bullish divergence from that setup, AI could earn 5% allocation in a risk-on environment; until then, tier-2 positioning respects the technical strength while protecting against overpaying for continued extension.
Agriculture & Livestock — MOO
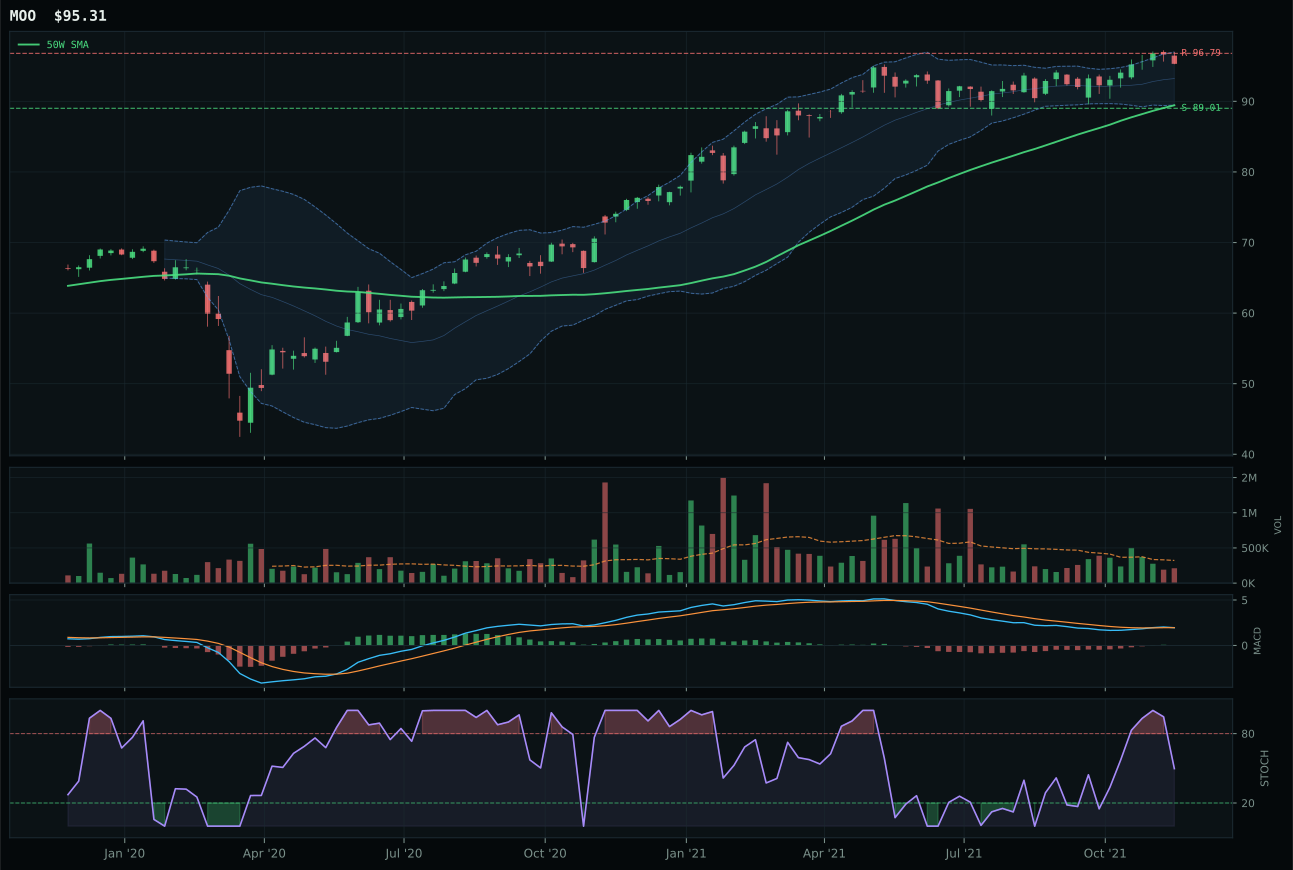
MOO has a neutral structure profile with -0.4% 13-week relative strength versus SPY.
A failed hold above support would weaken the setup.
Actionable but governed by invalidation levels.
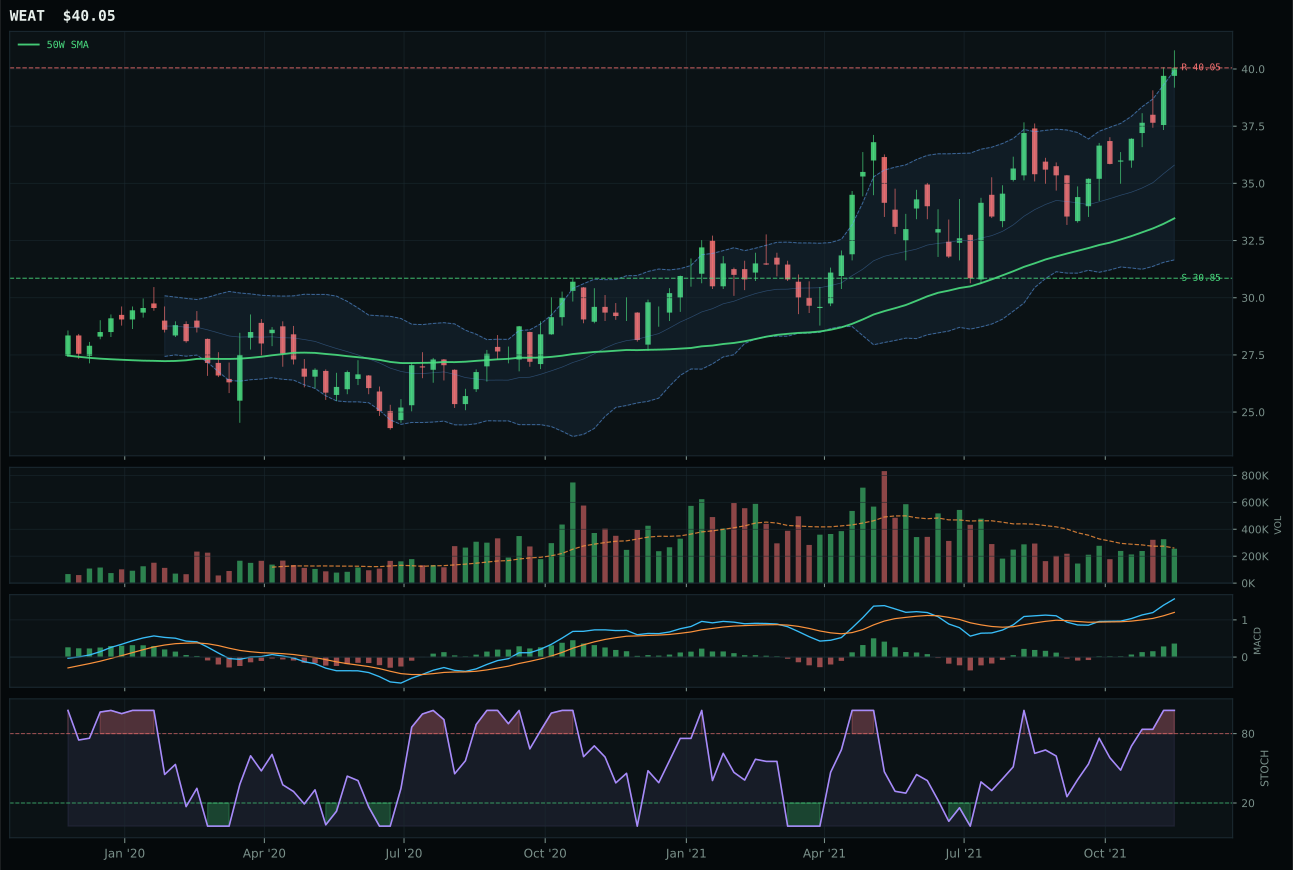
WEAT has a vertical extension profile with 7.4% 13-week relative strength versus SPY.
A failed hold above support would weaken the setup.
Tracked, but not top-2 eligible because: .
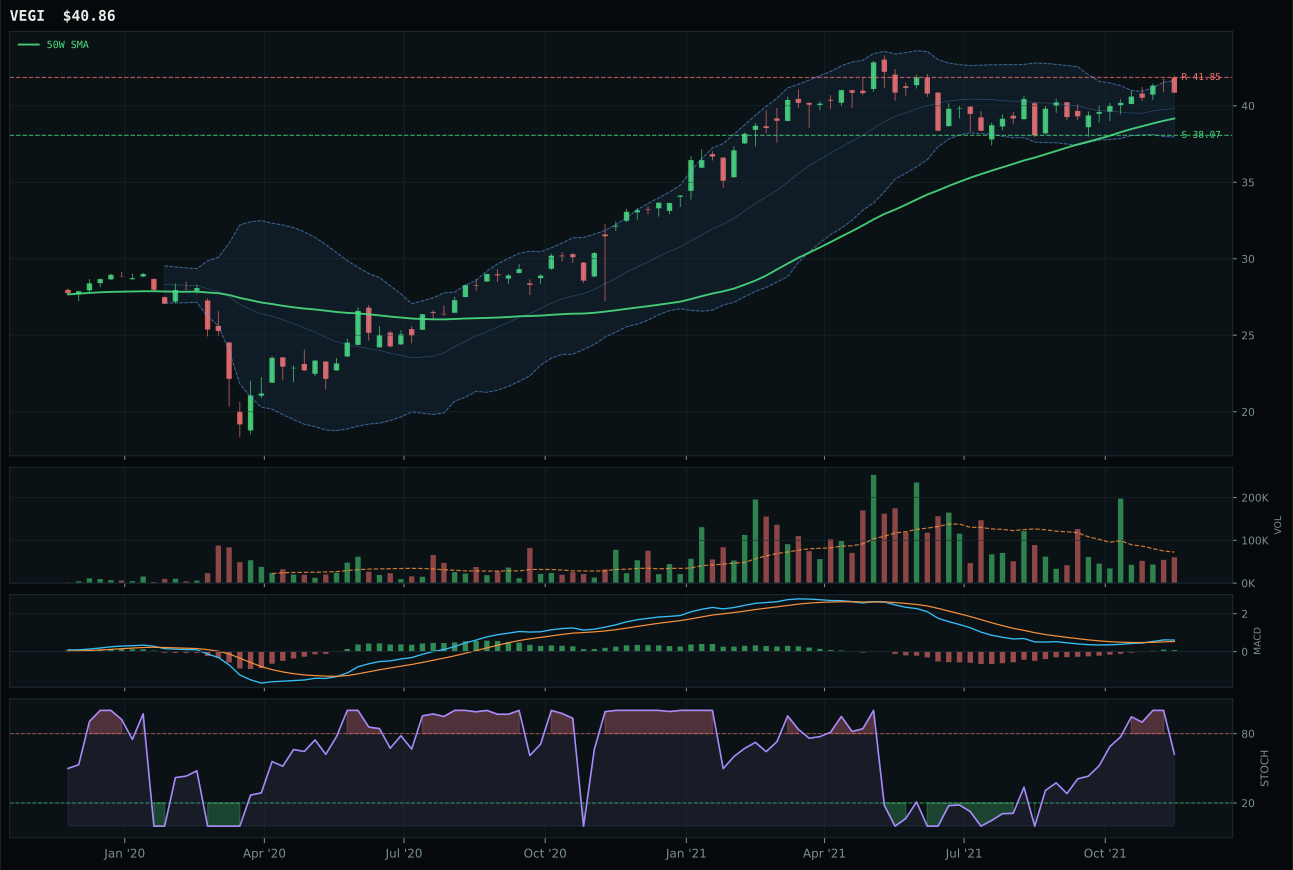
VEGI has a neutral structure profile with 1.6% 13-week relative strength versus SPY.
A failed hold above support would weaken the setup.
Tracked, but not top-2 eligible because: .
MOO captures the Agriculture category despite modest momentum returns (5.4% thirteen-week) by offering a cleaner technical structure than its competitors. Price sits 6.6% above the 50W in a neutral setup, meaning the entry is not extended and the allocator is not chasing a vertical rally; instead, MOO's 92.4-point trend score reflects solid higher-lows support near 89.01. The MACD is bearish but improving and stochastic RSI at 0.50 (falling/neutral) signals a setup that has room to decompress upward if inflation and supply-shortage themes persist. WEAT, the runner-up, owns far superior 13W momentum at 13.1% and a 7.4% SPY-relative advantage, but it is priced too far extended—19.7% above the 50W with overbought stochastic RSI (1.00) and vertical extension structure. That 18.3-point score gap between MOO and WEAT reflects the allocator's penalty for entry timing: buying WEAT here means chasing a move that has already run hard, whereas MOO offers the same macro theme (supply shortage +8, inflation pressure +7) at a measurably safer entry.
Agriculture earned 5% allocation as a tier-2 category, supported by a strong 86.0% macro fit score driven by active supply shortage (+13), inflation pressure (+10), and real asset sponsorship (+8). The 52.1 composite score places Agriculture below the top-2 thresholds, but the macro alignment is genuinely compelling—these descriptors are among the stickiest in the current environment, and commodities breadth is positive. MOO's thin volume at 0.65x the 20W average is a legitimate constraint on rapid scaling, but for a 5% position, it is manageable. The category would earn 5% allocation if MOO could consolidate above the 50W with fresh MACD bullish divergence, or if WEAT's extension corrected back to a 10–12% premium above the 50W while maintaining uptrend integrity. Until then, the tier-2 slot honors the macro narrative while respecting that entry risk across the category is asymmetric: MOO is buyable, WEAT is overextended, and the margin of safety does not yet justify aggressive overweight.
Utilities & Infrastructure — PAVE
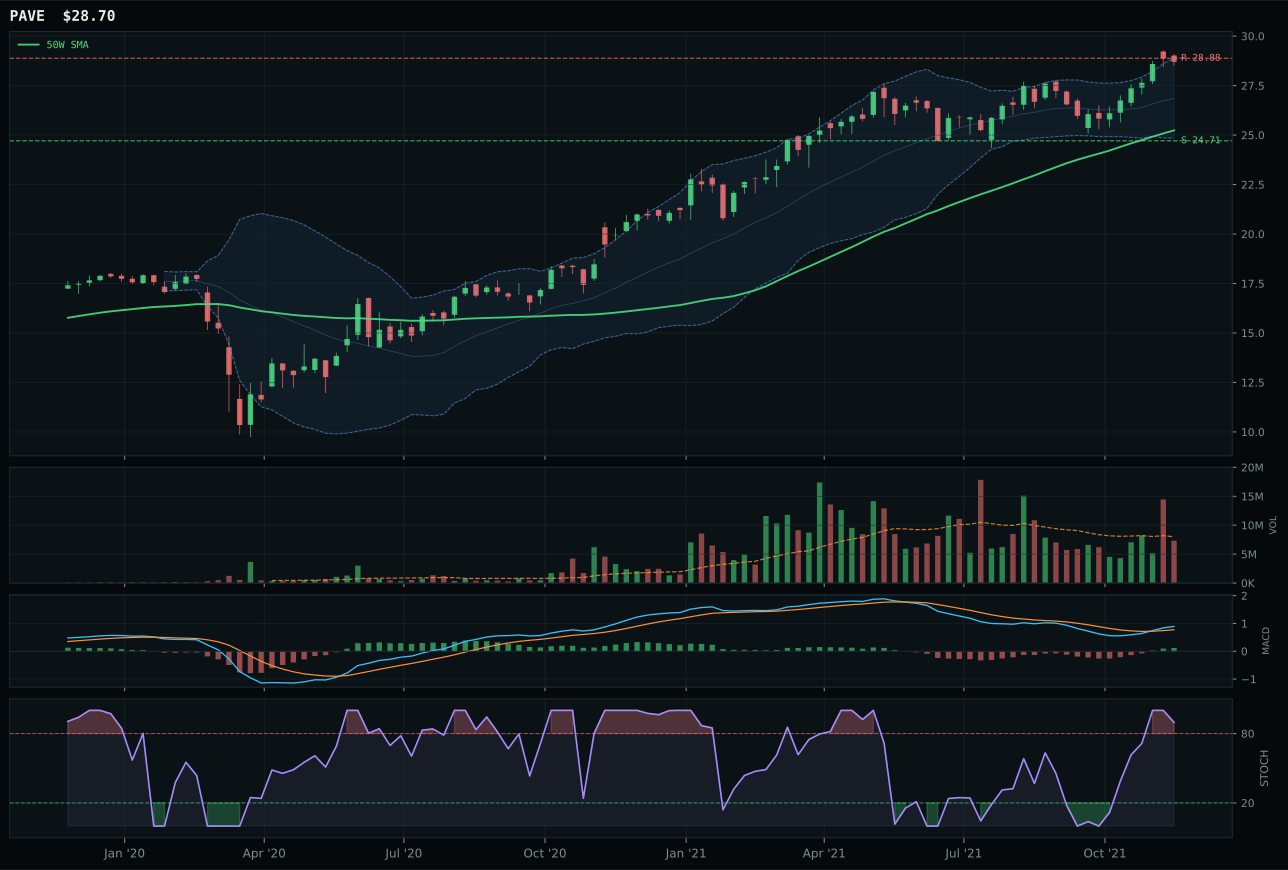
PAVE has a neutral structure profile with 1.8% 13-week relative strength versus SPY.
A failed hold above support would weaken the setup.
Actionable but governed by invalidation levels.
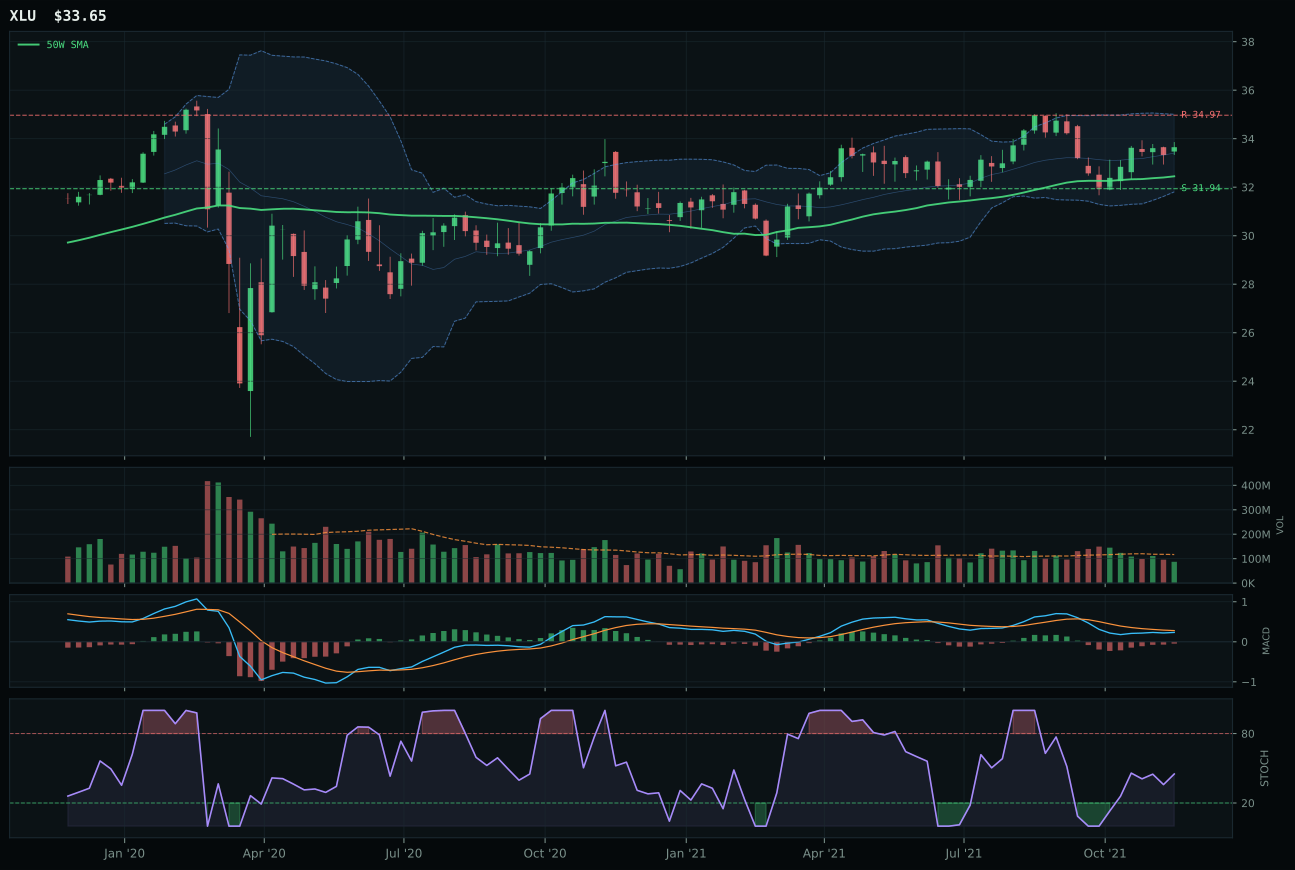
XLU has a neutral structure profile with -9.5% 13-week relative strength versus SPY.
A failed hold above support would weaken the setup.
Actionable but governed by invalidation levels.
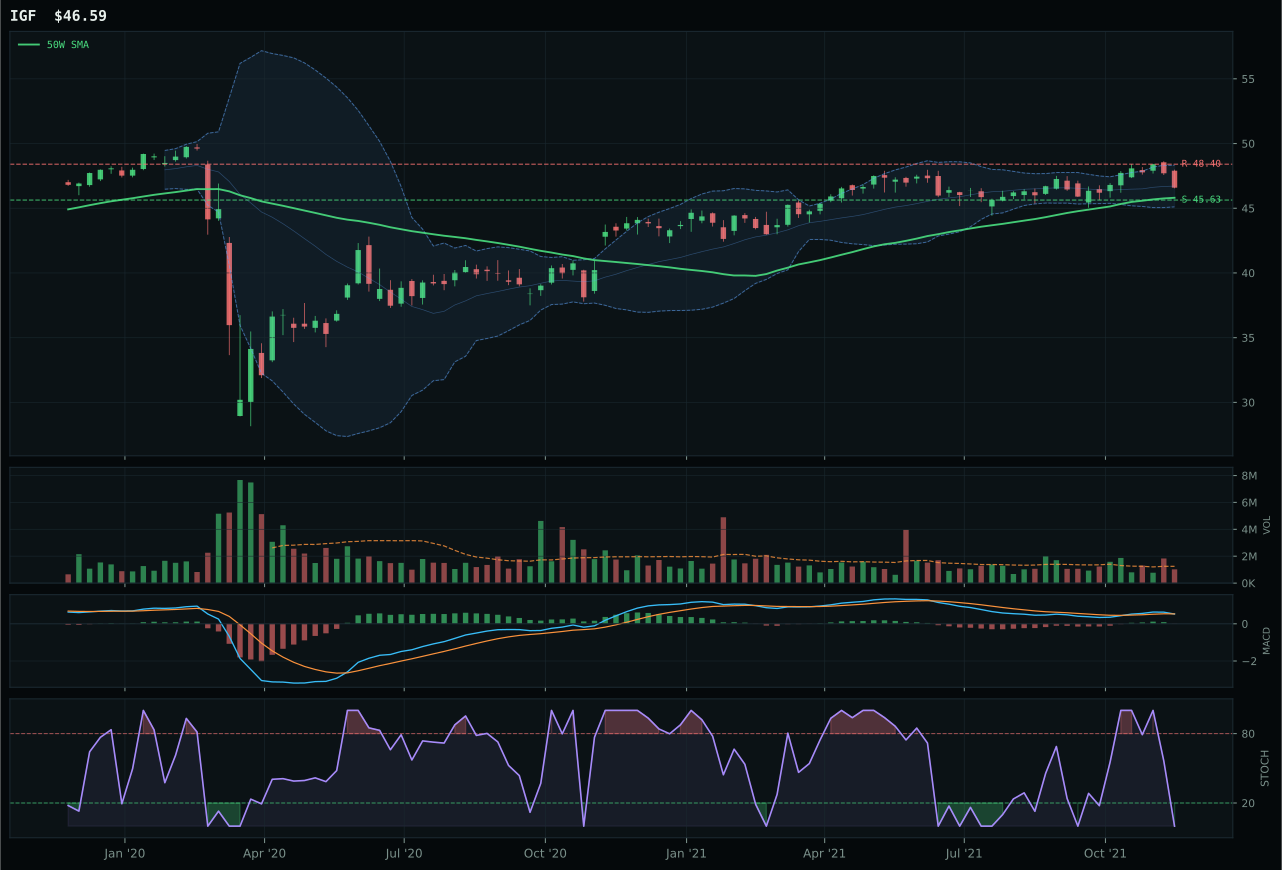
IGF has a pullback into support profile with -4.5% 13-week relative strength versus SPY.
A failed hold above support would weaken the setup.
Actionable but governed by invalidation levels.
PAVE wins Utilities & Infrastructure by combining the highest trend score in its category (100, from price above both moving averages with a steady 0.6% upslope) with a strong momentum confirmation of 90.1 and the cleanest structure at 74.8 points. The 13W return of 7.6% paired with 6.3% category-relative strength advantage signals PAVE is the clear leader within its three-ETF basket, not merely riding passive flows. Extended 13.7% above the 50W with overbought stochastic RSI (0.90), PAVE's setup has timing risk, but the neutral volume at 0.92x the 20W average and improving MACD confirm that the move is being accumulated by disciplined buyers rather than panicked shorts covering. XLU, the runner-up, owns a defensive regulatory utility story with a 98-point timing score (closer to the 50W) but suffers from deteriorating MACD (bearish but improving, not bullish), thin volume confirmation, and a -5.0% category-relative strength that shows it is lagging its peers. The 10-point score gap reflects PAVE's superior momentum and structural cleanliness.
Utilities & Infrastructure earned 5% allocation as a tier-2 category with a 51.8 composite score and 50.0% macro fit. The macro environment is mixed: the transition-mixed regime itself provides a small +4 boost, and commodity breadth positive is active (+4), but inflation pressure is active at -6 (headwind for bond-heavy utility stocks). PAVE's infrastructure beta positioning differentiates it from the traditional utility/regulatory defense story; the bullish and improving MACD combined with 6.3% category-relative strength suggests PAVE is capturing real economic demand (capex cycle, post-pandemic spending) rather than just floating on negative real yields. The allocation respects PAVE's clean technical setup and its potential to benefit from infrastructure momentum, but the modest 50% macro fit score prevents top-2 placement. For Utilities to earn 10%, either inflation pressure would need to ease significantly (removing the -6 headwind) or risk appetite would need to collapse decisively, making the defensive characteristics of the category far more valuable. Until one of those regimes shifts, 5% allocation to PAVE captures the best-technical candidate without over-committing to a category that macro currently views as neutral-to-negative.
Industrial Metals — COPX
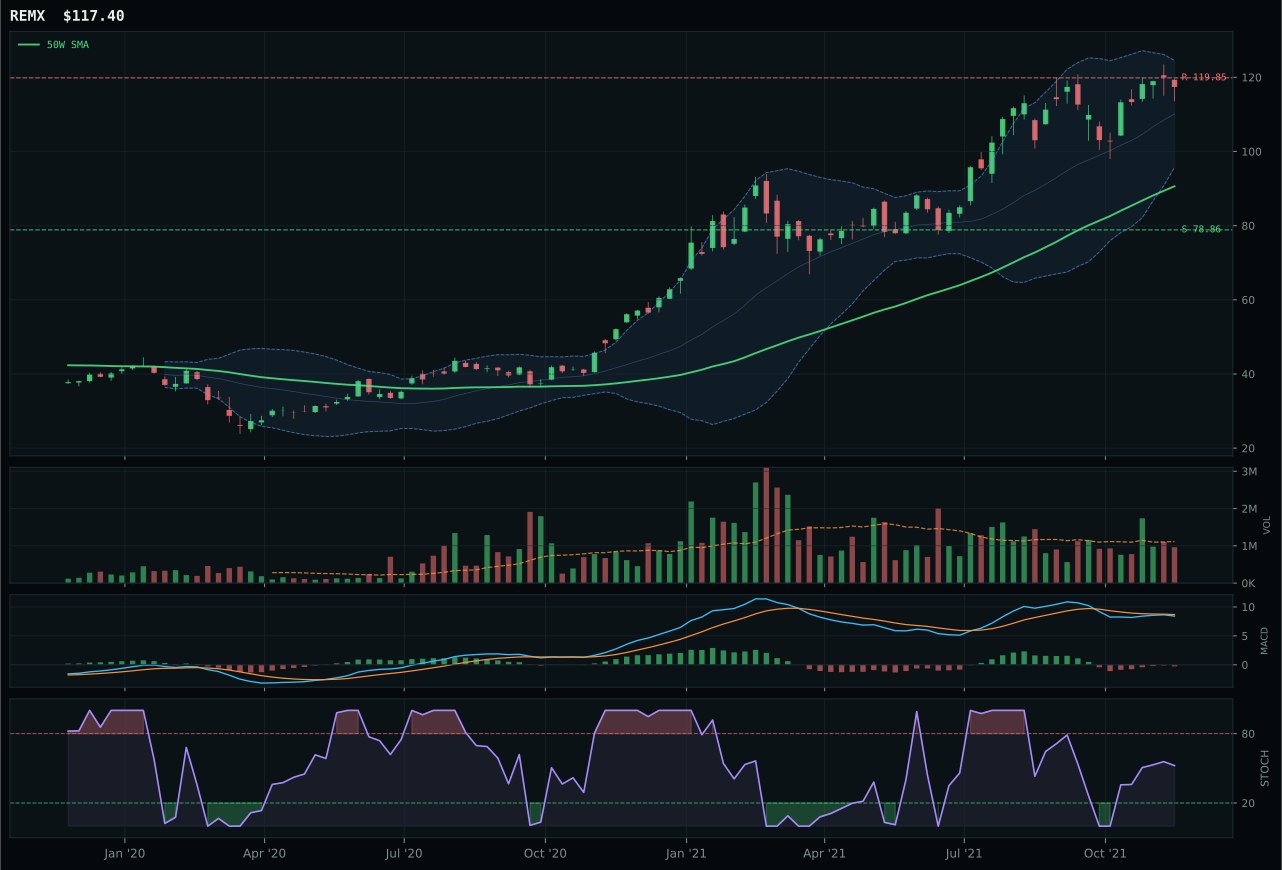
REMX has a vertical extension profile with 8.2% 13-week relative strength versus SPY.
A failed hold above support would weaken the setup.
Actionable but governed by invalidation levels.
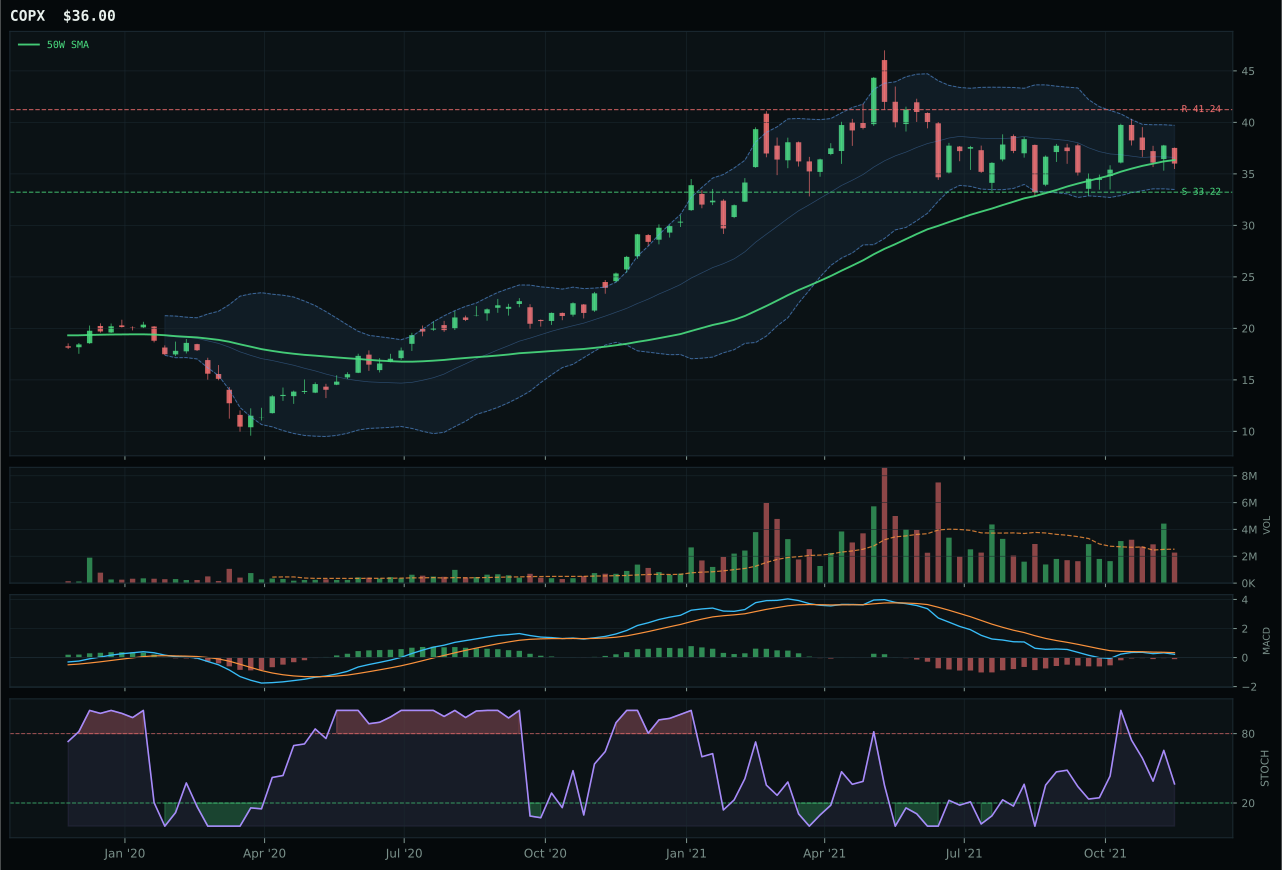
COPX has a compression near 50W profile with 2.6% 13-week relative strength versus SPY.
A failed hold above support would weaken the setup.
Actionable but governed by invalidation levels.
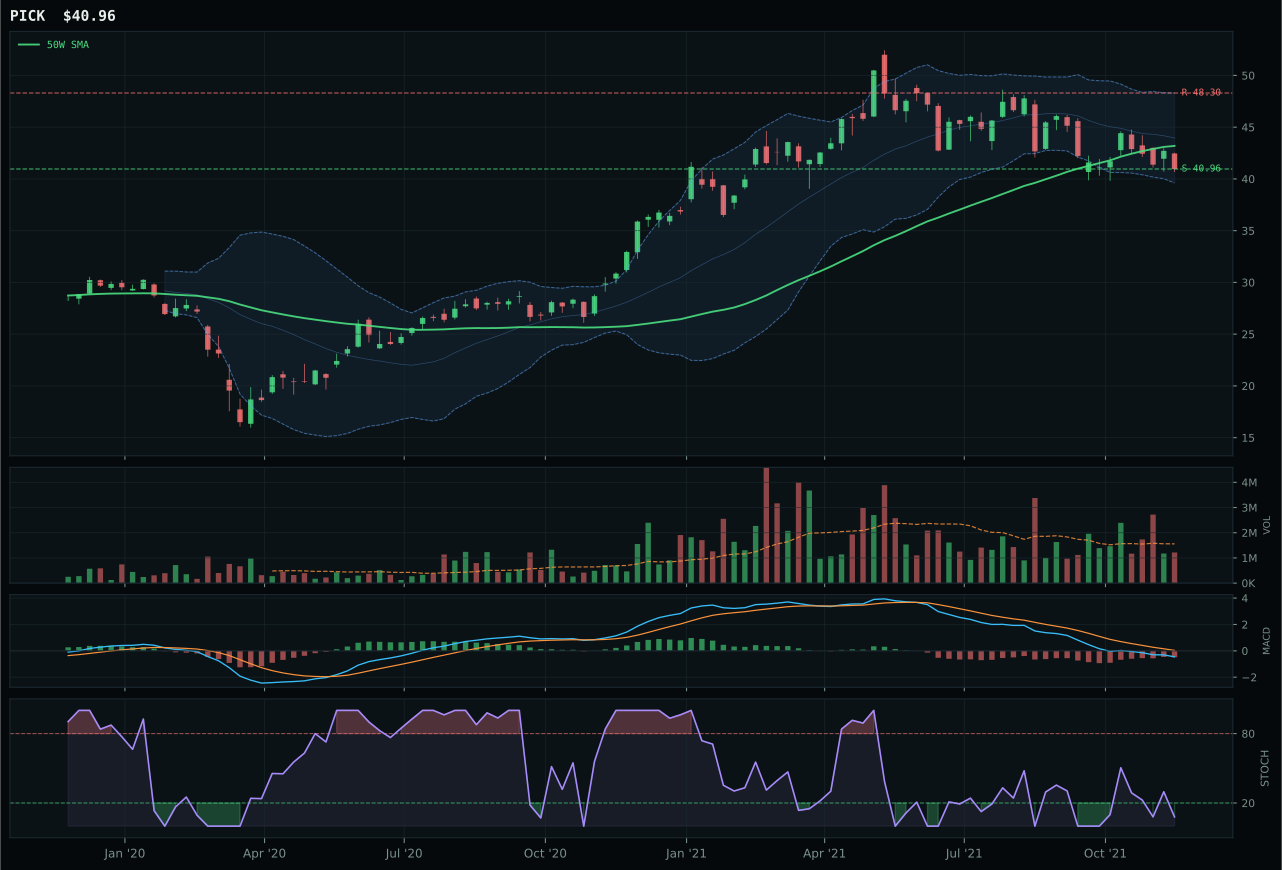
PICK has a pullback into support profile with -9.7% 13-week relative strength versus SPY.
A failed hold above support would weaken the setup.
Actionable but governed by invalidation levels.
COPX claims the Industrial Metals category despite a pullback 1.0% below the 50W, winning on the strength of its timing score—a perfect 100 points from distance to the 50W, MACD bearish/weakening but price at the decision zone, and stochastic RSI falling/neutral at 0.37. The chart's compression near the 50W with defined support at 33.22 and resistance at 41.24 offers a mean-reversion candidate where an upside breakout from the 36.20 decision zone would signal renewed accumulation with limited downside risk of only 8.4%. COPX's 2.6% relative strength advantage over SPY and neutral volume at 0.90x the 20W average confirm that the reset is orderly, not panicked. REMX, the runner-up, owns far superior momentum (13.9% thirteen-week, 8.2% RS/SPY) but violates the entry-risk principle: extended 29.6% above its 50W in a vertical structure with stochastic RSI rising mid-zone, REMX is priced for continued strength rather than offering a clean pullback to accumulate. The 2.0-point score gap reflects COPX's timing advantage (100 vs. 53) and superior risk-reward (80.3 vs. 37.8).
Industrial Metals received 5% allocation as a tier-2 holding, supported by a category-level macro fit of 66.0% driven by active metals scarcity (+14), commodity breadth positive (+10), and real asset sponsorship (+6). The 51.0 composite score sits below top-2 thresholds, constrained by COPX's weak momentum confirmation (37.4 points) reflecting a mixed 4W return (-5.9%) against bullish 13W return (8.4%). In a transition-mixed regime, this interior weakness is material: the pullback may extend further before buyers defend 33.22 support. However, the macro thesis is intact—metals scarcity is a structural theme, and COPX's setup offers defined risk for mean-reversion positioning. The category would graduate to 10% if COPX broke above 38.00 on improving volume and fresh MACD bullish divergence, or if the dollar began to weaken materially, removing the headwind that currently suppresses copper industrial demand. Until that confirmation arrives, tier-2 allocation respects the macro tailwind while protecting against buying too early into a potentially deeper consolidation.
Defense & Aerospace — XAR
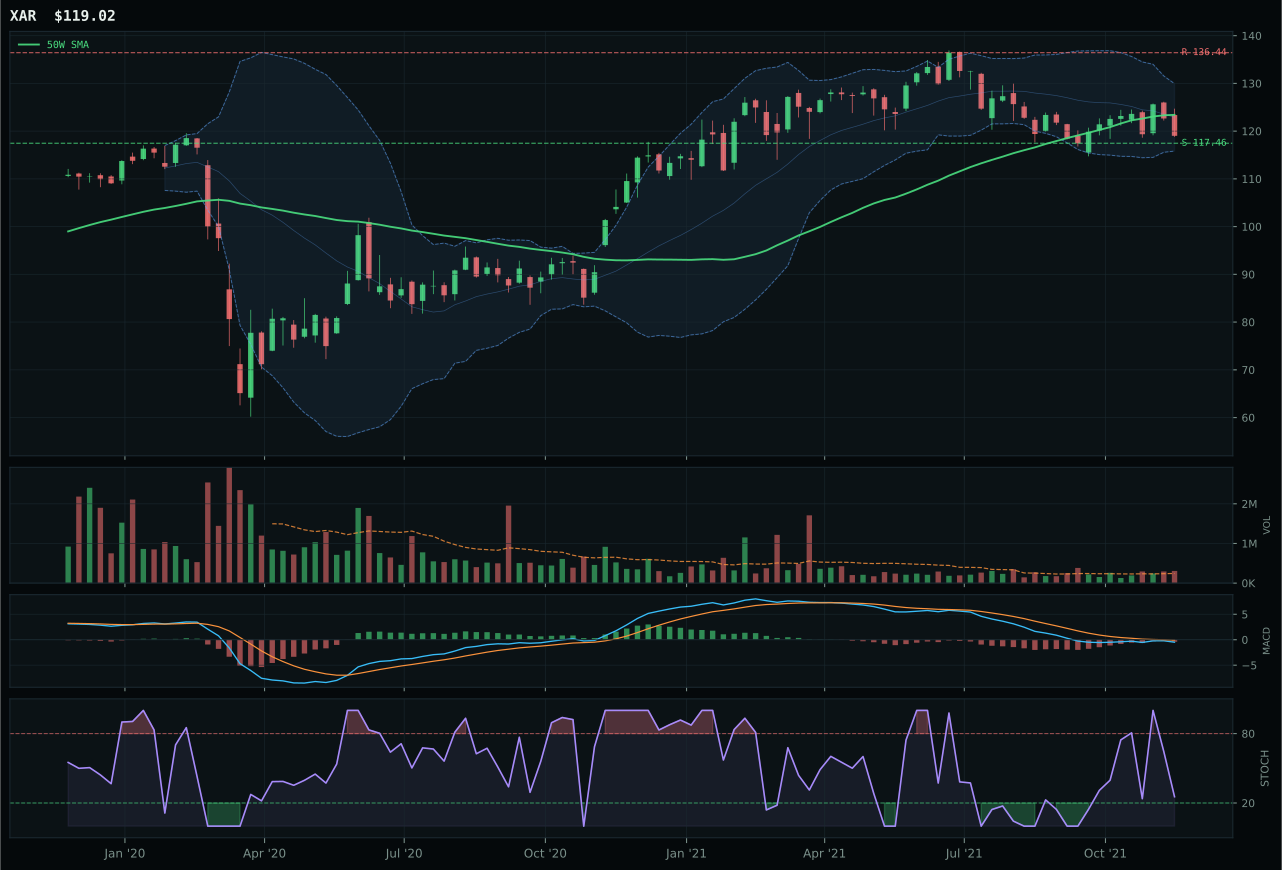
XAR has a pullback into support profile with -6.1% 13-week relative strength versus SPY.
A failed hold above support would weaken the setup.
Actionable but governed by invalidation levels.
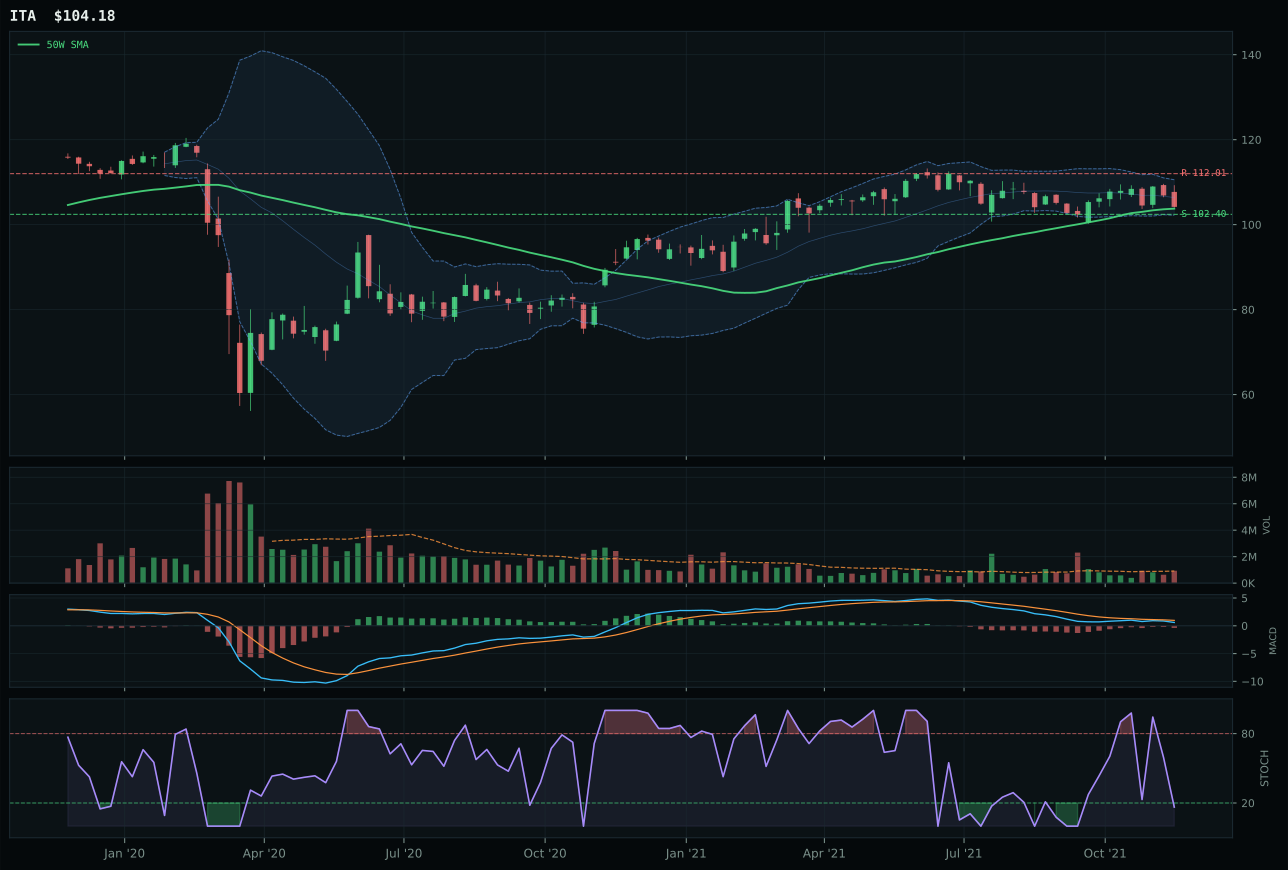
ITA has a pullback into support profile with -5.7% 13-week relative strength versus SPY.
A failed hold above support would weaken the setup.
Actionable but governed by invalidation levels.
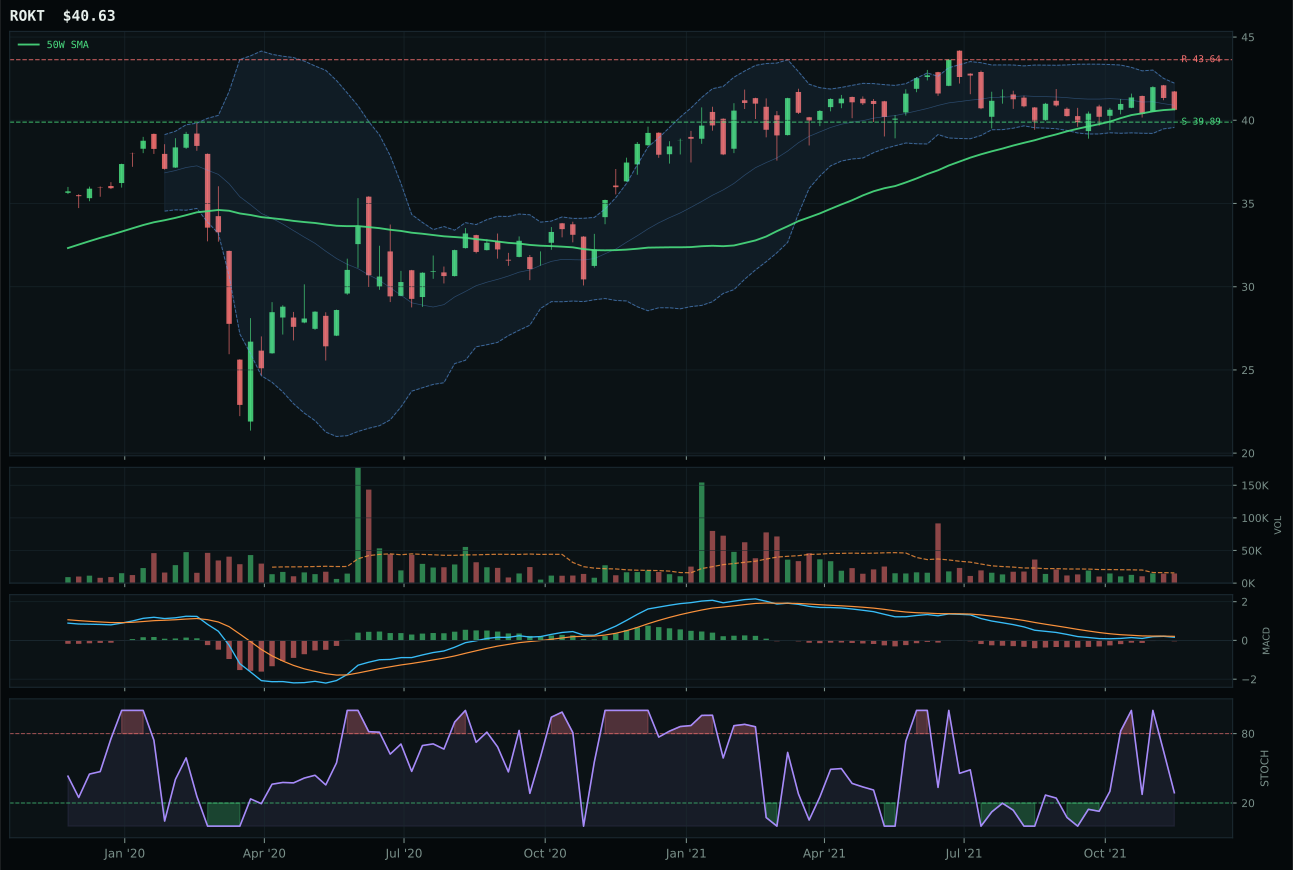
ROKT has a pullback into support profile with -4.0% 13-week relative strength versus SPY.
A failed hold above support would weaken the setup.
Tracked, but not top-2 eligible because: .
XAR wins a struggling category by offering the only credible mean-reversion setup available: price sits 3.6% below the 50W but above the 200W, with a perfect 100-point timing score from rising stochastic RSI (0.25) and MACD bearish but improving. The risk-reward skew is remarkable—82 points downside to support at 117.46 versus only 1.3% downside risk, meaning the allocator's invalidation zone is both small and well-defined. Above-average volume participation at 1.26x the 20W average confirms that selling is organized and not panicked; this is a controlled reset, not a capitulation. ITA, the runner-up, owns superior momentum credentials (0.1% thirteen-week return versus XAR's -0.3%) but fails the entry-point test: stochastic RSI sits oversold at 0.00 and MACD is deteriorating rather than improving, suggesting the pullback has further to run before buyers should accumulate. XAR's pullback into support structure beat ITA's timing score by 5 points and offered better risk-reward (98 versus 90).
Defense & Aerospace earned 0% allocation this week, ranking outside the portfolio entirely as a bottom-tier category with a 43.2 composite score. The category's technical setup is weak—all three candidates (ITA, XAR, ROKT) sit below their 50W moving averages with deteriorating momentum, and the macro environment provides minimal support: broad market bear is active (+6) and dollar pressure is active (+3), but these are offset by a mere +3 from the transition-mixed regime itself. With only 64% macro fit and a reasoned ETF proof order showing the top candidate (ITA at 47.4) barely exceeding the threshold for meaningful allocation, there is no case for deploying capital here when categories like XLE (77.1), GLD (60.5), and even Technology (60.3) offer superior risk-adjusted entry points. For Defense & Aerospace to re-enter the allocation, either the category would need to break above its 50W on improving volume and MACD, or macro descriptors would need to reverse sharply—credit stress easing, dollar strength reversing, or an actual geopolitical shock that suddenly propels risk appetite into hard assets.
Emerging Markets — INDA
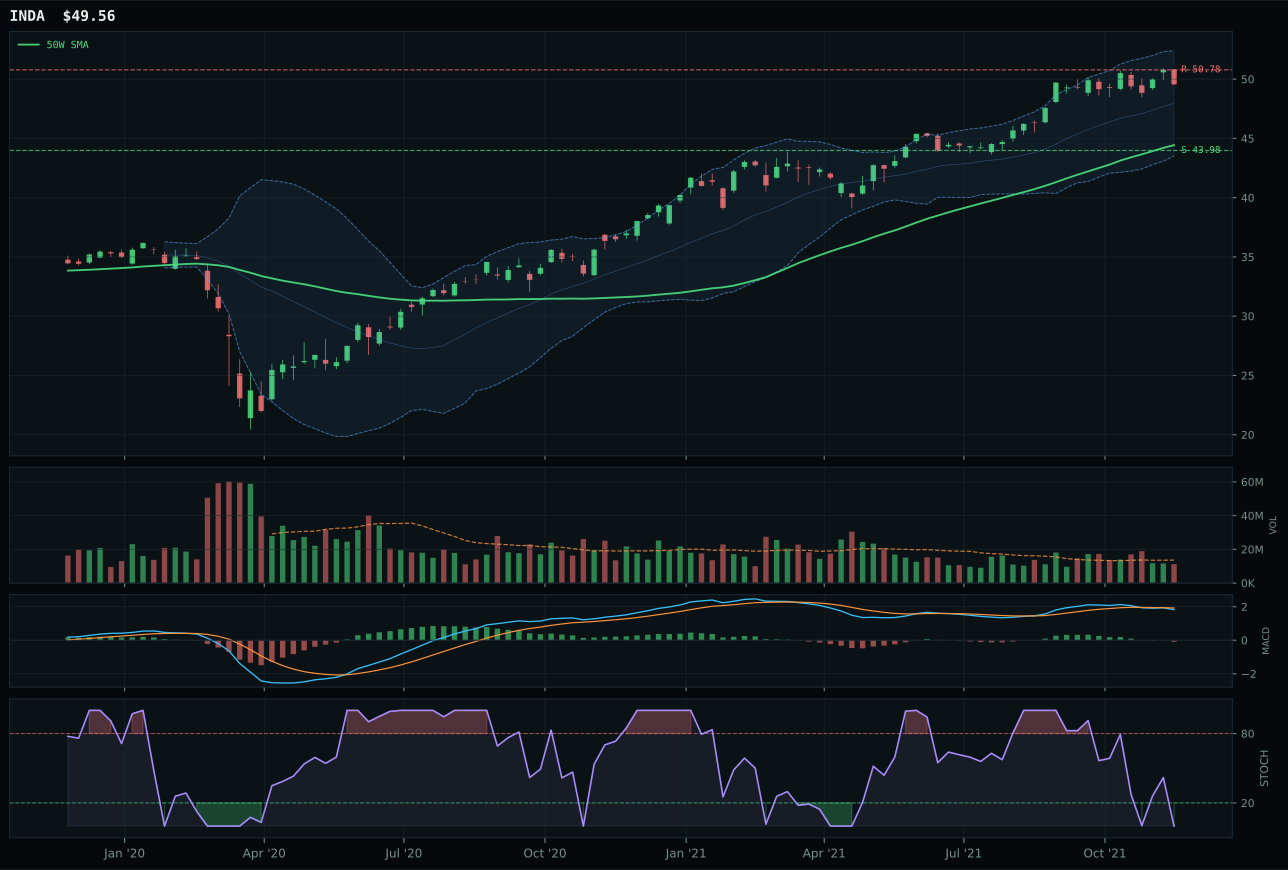
INDA has a neutral structure profile with 1.3% 13-week relative strength versus SPY.
A failed hold above support would weaken the setup.
Actionable but governed by invalidation levels.
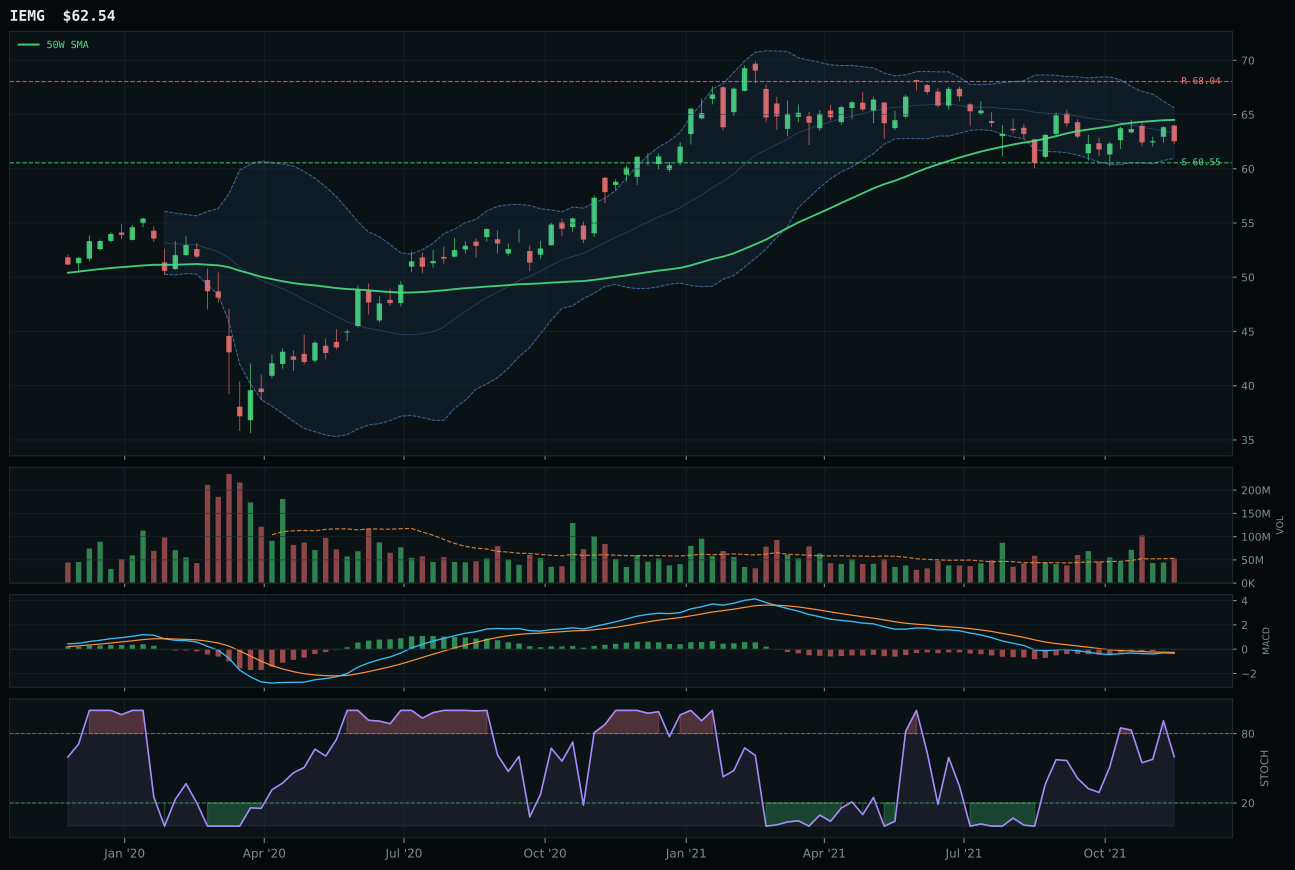
IEMG has a pullback into support profile with -2.5% 13-week relative strength versus SPY.
A failed hold above support would weaken the setup.
Actionable but governed by invalidation levels.
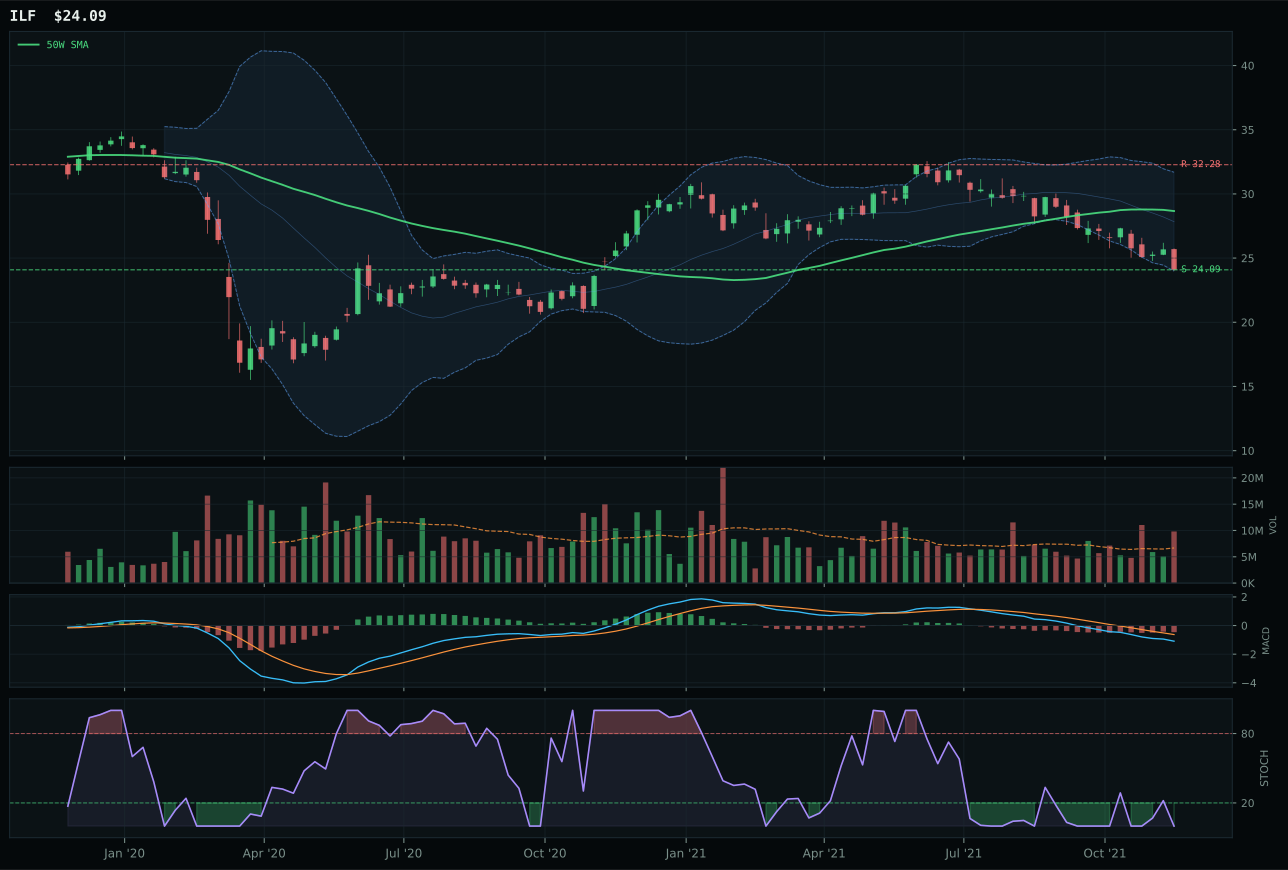
ILF has a pullback into support profile with -20.5% 13-week relative strength versus SPY.
Extension and support failure are the main tactical risks.
Tracked, but not top-2 eligible because: structurally broken.
INDA wins Emerging Markets, but the category itself earned zero allocation because the composite 11.5 score reflects devastating macro headwinds that no technical excellence can overcome. INDA's 84-point trend score and above-average 7.1% thirteen-week return look healthy, and the neutral structure at 11.5% above the 50W avoids extreme extension. However, the momentum confirmation drops to 50.9 (weak for a category winner), reflecting an MACD that is bearish/weakening and stochastic RSI at the oversold extreme (0.00)—signals of reversal risk. IEMG, the runner-up, owns a cleaner pullback-into-support setup with superior risk-reward (97 vs. 40.4) and rising stochastic RSI (mid-zone), but it loses the category because its structure is less clean (70.2 vs. 75.7) and its category-relative strength at 0.0% trails INDA's 3.8%. The score gap of -15.9 points is enormous, reflecting a category in free-fall.
Emerging Markets earned zero allocation despite INDA's technical leadership, because the category-level macro fit of only 25.0% makes it a bottom-tier exclusion. Dollar pressure is active at -14 points (one of the portfolio's strongest headwinds), credit stress is active at -10, and broad market bear is active at -9—a triple burden that overwhelms the modest +8 from risk appetite positive. The 11.5 composite score places Emerging Markets 9th or 10th among the ten categories, well below the allocation threshold. For Emerging Markets to re-enter even at 5%, the macro environment would need to shift dramatically: dollar pressure would need to ease (DXY rolling over), credit stress would need to reverse (credit spreads tightening), or broad risk appetite would need to turn decisively positive (not just "positive" but +12 or higher). Until that macro reset occurs, the category is simply too headwind-heavy to justify deploying capital away from stronger alternatives like XLE, GLD, and even tier-2 names like URA and MOO.